Radiation Monitoring System - MicroStep-MIS
20
Radiation Monitoring System Real-time Radiation Data, Early Warning and Dispersion Modelling Solutions for the real world
-
Upload
khangminh22 -
Category
Documents
-
view
1 -
download
0
Transcript of Radiation Monitoring System - MicroStep-MIS

Radiation Monitoring System
Real-time Radiation Data, Early Warning
and Dispersion Modelling
Solutions for the real world

MicroStep-MIS, www.microstep-mis.com © 2017, All specifications are subject to change without prior notice.2
Radiation Monitoring System
• Radiation Probes, Aerosol and Iodine Monitors, Monitoring Networks, α/β Emitters detection systems, γ-Spectrometric Systems, Air Samplers
• Real-time dose rates • Natural and man-made radioactivity concentrations in the air• Data collection, analysis and presentation• Real-time displays and early warning• Dispersion Modelling of accidental releases• Interactive Web Access for multiple users• IMS4 Maps - Displaying of geospatial data
Why measure radiation?Ionizing radiation is a common name for all subatomic particles (e.g. alpha, beta particles, gamma and X-rays, protons, neutrons, heavier nuclei,…) produced in nuclear reactions or by spontaneous nuclear decay, those energy is sufficient to strip away electrons from atoms in the process of direct or indirect ionization.
The biological effect of ionizing radiation and the response of human body depends on amount of absorbed radiation, on time during which the radiation has been absorbed, on type of radiation and on type and amount of tissue in which the radiation has been absorbed.
Nuclear fu
el cycle
Chernobyl
Occupatio
nal exposu
re
Atmosp
heric nucle
ar tests
Ingestion
Cosmic
radiation
External te
rrestr
ial radiatio
n
Medical
Inhalation (m
ainly radon)
41.55 %
19.79 %
15.83 %
12.86 %9.56 %
0.16 %0.16 %
0.07 %0.01 %
All contributions to the average annual dose according to the UNSCEAR report of 2008
The human body is able to tolerate certain small amounts of radiation thanks to the natural repair process of cells in different tissues. With the increase of absorbed dose of ionizing radiation, the probability of harmful effects occurrence, which can lead to DNA damage and cells mutation, arises. Very high absorbed doses cause different diseases like skin erythema, infertility, blood forming deficiency, radiation sickness or even death.
The origin of ionizing radiation is natural or artificial (man-made). Even without human activities, we are exposed by ionizing radiation which value can vary widely.
FEATURES:

MicroStep-MIS, www.microstep-mis.com © 2017, All specifications are subject to change without prior notice.3
Radiation Monitoring System
Radiation Monitoring System provides appropriate turn-key solutions for measurement, data acquisition, processing, reporting and analysis of radiation and radioactivity concentration data as well as radionuclides dispersion and contamination simulations for hydrometeorological institutes, nuclear regulatory authorities, civil defense, radiation protection authorities or researchers.
Radiation Monitoring System solutions can be used within national networks to monitor a potential danger from radioactive plume dispersion from unknown or unpredictable source as well as in the vicinity of Nuclear Power Plants or different facilities participating in the nuclear fuel cycle.
Different sensors and detection systems can be used: from radiation probes giving the basic information about the actual dose rate and early warning to fully automatic aerosol monitors providing a real-time analysis of natural and man-made α/β emitters or γ emitters concentrations in the air. Data collection system allows to acquire data from numerous locations to the central acquisition system.
Radiation Module provides the interpretation of collected data, reports, real-time display in graphical interface and statistics on historical data to help decision makers evaluate the situation and plan their actions.
The Radiation Dispersion Model is designed to simulate the accidental release of radionuclides and its propagation through the atmosphere, estimation of activity concentrations in different air layers and surface contamination due to radioactive fallout.
Measured variables and monitored values• Dose rate of ambient gamma radiation (nSv/h)• Artificial β concentration in the air (Bq/m3, DAC)• Artificial α concentration in the air (Bq/m3, DAC)• Radon concentration in the air (Bq/m3)• Thoron concentration in the air (Bq/m3)• Radionuclides activity concentration in the
air based on γ-spectrometry (Bq/m3)• Radionuclides activity concentration in water based on
γ-spectrometry (Bq/l)• Activity concentration of 131I and/or others iodine
isotopes in the air (Bq/m3)
Radiation Dispersion Module outputs• Tracking of radionuclides trajectory under changing
weather conditions• Activity concentrations in near surface air layers (kBq/m3)• Surface contamination due to radioactive fallout (kBq/m2)• Activity concentrations in upper air layers (kBq/m3)

MicroStep-MIS, www.microstep-mis.com © 2017, All specifications are subject to change without prior notice.4
IMS - Radiation Monitoring
IMS - Radiation Monitoring is an individual or extending part of Integrated Meteorological System (IMS) software package providing radiation monitoring, data acquisition and presentation.
Integrated within IMS, the Radiation Monitoring Module is an easy to use and cost-effective solution for building the complex network of manned or automatic meteorological and radiation monitoring stations.
Integrated Meteorological System, MicroStep-MIS open monitoring system, suitable for building of national radiological and meteorological networks, and meteorological stations for commercial use.
MeasurementInterfaces to:
• Various Gamma dose rate probes, Spectrometric detectors, Data-loggers
• Automatic Monitor of Radioactive Aerosols, Automatic Monitor of Gaseous Radioactive Iodine
• Water Gamma Spectrometric Monitor
• Automatic Meteorological Stations
• Supporting numerous radiological data formats including ANSI N42.42 and Eurdep
• Supporting numerous meteorological data formats such as SYNOP, METAR, TEMP and BUOY
• Quality control and verification of measured data
• Remote control of radiological monitors and devices
Real-time data presentationThe real-time radiological and meteorological data are displayed on map based screens. The IMS4 Maps produces the data in KML, GML, Shapefile, GeoRSS, GeoJSON, PDF, JPEG, GIF, PNG, SVG and more formats on output.IMS4 Maps come with the integrated web client for previewing data layers, thanks to compliance with the OGC standards any OGC web service enabled client software can access the IMS4 Maps server.
• Displaying of current measured data with selectable radiological, meteorological and station operation variablesReal-time screens
• Providing radiological alarms with 2 threshold levels configurable remotely on respective device and station
• Providing of overall State of Health information of respective stations and monitors
IMS - Radiation Monitoring main menu
IMS - Current data map (simplified alert/alarm mode ) hypothetical location
IMS – current radiological data (station detailed view)
IMS- current meteorological data (station detailed view)

MicroStep-MIS, www.microstep-mis.com © 2017, All specifications are subject to change without prior notice.5
filter, pressure difference in the sampling head, etc.
• State of Health data such as measurement status, failure, errors
Automatic Monitor of Gaseous Radioactive Iodine (AMGRI)
• Concentration of gasous 131I
• Gamma activity of gasous 131I absorbed by the cartridge
• Operational data such as air flow through the current cartridge, volume of sampled air, number of the current cartridge, pressure difference in the sampling head, etc.
• State of Health data such as measurement status, failure, errors
Water Gamma Spectrometric Monitor (WGSM)
• Concentration of 10 pre-selected man-made gamma-ray emitting radioisotopes e.g.: 134Cs, 136Cs, 137Cs, 60Co, 141Ce, 143Ce, 132Te, …
• State of Health data such as measurement status, failure, errors
Current Spectra
• Alpha/beta spectrum from Automatic Monitor of Radioactive Aerosols
• Gamma spectrum from Automatic Monitor of Radioactive Aerosols
• Gamma spectrum from Automatic Monitor of Gaseous Radioactive Iodine
• Gamma spectrum from Water Gamma Spectrometric Monitor
Data archiving and data exportSelect application
End user application for retrieving data from the database. Maximally flexible export from the database to user-defined tables is possible with user-friendly IMS “Select” tool. When selecting the data, user can set element(s), variable(s), region(s), station(s), observation terms or time periods as a retrieval criteria. User then selects the form of output - all raw data, aggregated data (minima, maxima, means, sums, counts, standard deviations), or a long year statistics over selected month. The resulting data is in the form of a graph or a table. The table could be saved as a spreadsheet or a text file (comma separated values, space separated values,…). The output files are directly usable by standard mathematical/statistical software products or data mining tools.
• Displaying of operational alerts in case of a monitor malfunctioning and wrong conditions
• Clear alert/alarm cause description
• Overlay, switch on/off, reordering of the layers
• Setting layer transparency
• Applying custom filtering and styles to layers for enhanced visualization
• Zoom in/zoom out, pan, rotate functionality
• Measuring of distances and areas
• Browsing the model data through model runs, forecast times, vertical coordinates
• Smart tooltips showing the actual values, trends or additional information
• Time dimension animation over multiple layers simultaneously
• Measurement of distances, areas etc. with option to select the specific unit
Detailed Station Display:All the current data measured at the selected station are presented in summary and visual forms. The data are divided into different groups according to their origin.
The first or second threshold exceeding values of radiological variables and erroneous state of health of respective monitor are highlighted with possibility to trigger an external beacon alarm.
A typical current data layout is the following:
Meteorological data
• Wind speed & wind direction, wind gust
• Air temperature
• Air relative humidity
• Atmospheric pressure
• Precipitation
• Solar radiation
Automatic Monitor of Radioactive Aerosols (AMRA)
• Concentration of 10 pre-selected man-made gamma-ray emitting radioisotopes e.g.: 134Cs, 136Cs, 137Cs, 60Co, 141Ce, 143Ce, 132Te, …
• Concetration of radon and thoron
• Concentration of artiphiacial alpha particles emitting radioisotopes
• Overall beta particles emitting radioisotopes
• Alpha, beta and gamma activity of respective radioisotopes deposed on the current aerosol filter
• Operational data such as air flow through the current filter, volume of sampled air, number of the current

MicroStep-MIS, www.microstep-mis.com © 2017, All specifications are subject to change without prior notice.6
Reports application
The Reports application provides an easy to use interface for generating tabular and graphical reports(daily, monthly, annual,…). Reports are generated directly in printable form (.pdf ) or as Excel worksheets.
• Predefined reports in text form and graphs
• Meteorological, radiological data and other data
• Statistics on historical data (means, extremes, counts, weighted averages, uncertainities,…)
• Visual interpretation, customized graphs
• Radiological alert and alarms
• Frequencies of element occurrence below/above the specified thresholds
• Characteristics of distribution (measures of central tendency mean, mode, median, fractiles (percentiles), vector mean; measures of dispersion, coefficient of variation,…)
• Counts of missing data
• Data distribution within GTS(1) network
• ANSI N42.42(2)
• EURDEP(3)
Spectra Browser applicationThe raw data from Radioactive Aerosol, Iodine and Water Monitors are stored in database. The Spectra Browser tool allows to browse through the spectra files in the user selected time period, station number and spectra type depending on the detector. Spectra can be previewed on the screen and downloaded to the client PC for the further spectrometric analysis.
The ANSI N42.42 data format used by this application provides the user with all necessary information within the spectrum xml file such as:
• Station identification (Name, GPS coordinates)
• Monitor type and model
• Type of the spectrum and type of the detector
• Energy calibration coefficients
• Measurement identifications (ID number, start date and time, Real and Live time duration of spectrum gathering,…)
• Sampling conditions (average air flow, sampled air volume, sampling time,..)
• Preliminary spectrum analysis results (nuclide name, activity of the filter/cartridge, concentration and concentration error, confidence level, counts in ROIs,…)
1 Global Telecommunication System of the World Meteorological Organization(2) American National Standard Data Format for Radiation Detectors Used for Homeland Security (3) European Union Radiation Data Exchange Platform
The spectra available within the application gathered with (not limited to):
• Automatic Monitor of Radioactive Aerosols – gamma-ray spectrum (NaI(Tl), SrI2(Eu), HPGe,…)
• Automatic Monitor of Radioactive Aerosols – alpha/beta spectrum (Silicon detector)
• Automatic Monitor of Gaseous Radioactive Iodine – gamma-ray spectrum ((NaI(Tl), SrI2(Eu),…)
• Water Spectrometric Monitor – gamma-ray spectrum ((NaI(Tl), SrI2(Eu),…)
IMS - Select: Tabular export from database
IMS - Select: Plot generated from database
IMS Select: Pre-defined report generated from database

MicroStep-MIS, www.microstep-mis.com © 2017, All specifications are subject to change without prior notice.7
Remote Station configurationThe Station Configuration allows to remotely change the measurement parameters of a selected monitor/device on the respective station. The detailed measurement status is available in real-time. The Station Configuration module allows to set station´s parameters like data request period, sampling time, air flow volume, concentration 1st and 2nd level alarm thresholds of various radioisotopes, start/stop the measurement, etc.
IMS: Spectra Browser
IMS remote station configuration
MicroStep-MIS, www.microstep-mis.com © 2017, All specifications are subject to change without prior notice.8
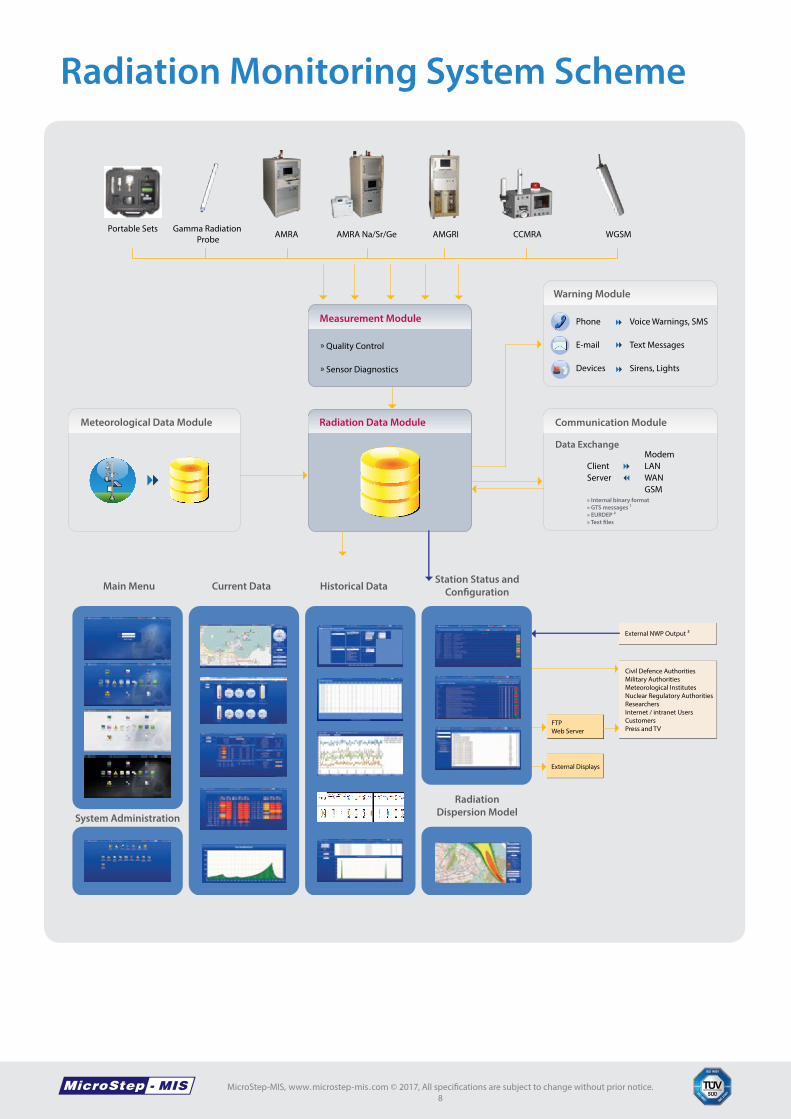
Radiation Monitoring System Scheme
Gamma Radiation Probe
Portable Sets
Radiation Data Module
Warning Module
Phone
Devices
Voice Warnings, SMS
Text Messages
Sirens, Lights
Communication Module
Data Exchange
ClientServer
ModemLANWANGSM
Measurement Module
AMRA AMRA Na/Sr/Ge AMGRI CCMRA WGSM
» Internal binary format» GTS messages 1» EURDEP 2» Text �les
Civil Defence AuthoritiesMilitary AuthoritiesMeteorological InstitutesNuclear Regulatory AuthoritiesResearchersInternet / intranet UsersCustomersPress and TV
External NWP Output 3
Meteorological Data Module
» Quality Control
» Sensor Diagnostics
FTPWeb Server
External Displays
Radiation Monitoring System Scheme
Station Status andCon�guration
RadiationDispersion ModelSystem Administration
Historical DataCurrent DataMain Menu

MicroStep-MIS, www.microstep-mis.com © 2017, All specifications are subject to change without prior notice.9
Devices and Monitoring Systems
The radiation probe, model RPSG-05, developed and manufactured by MicroStep-MIS, measures gamma radiation dose rate.
RPSG-05 probe contains two GM tubes with energy-compensation filter, covering measurement of dose rates from 10 nSv/h up to 10 Sv/h. This wide measuring range enables indications of minor changes in the ambient natural radioactivity level as well as measuring of extremely high rate.
Detector Two Geiger-Muller with energy compensating filter
Measuring range 10 nSv/h to 10 Sv/h
Energy range 50 keV to 1.5 MeV (6.6 MeV)
Temperature range −40 °C to +60 °C
Operation With Data logger or PC
Dimensions Ø 50 x 600 mm
Weight 2.5 kg
Output RS232, RS485
Power supply 9 to 33 V DC
Communication Ethernet, USB, SDI-12
Housing classification IP67 (water and dust proof )
Gamma Radiation Probe RPSG-05
AMRA /Na/Sr/Ge (Automatic Monitor of Radioactive Aerosols)
Automatic Monitor of Radioactive Aerosols with on-line spectrometric analysis, automatic filter changer and optional electrically cooled HPGe detector assembly (third party product).
AMRA Na/Sr/Ge performs the continuous monitoring of the Alpha, Beta and Gamma rays emmiting radioactive aerosols collected on a circular filter from air using spectrometric techniques. On-line measurements with programmable cycle (with 120 sec refresh as default) are continuously performed during sampling.On line alpha/beta spectrum analysis is performed in regular adjustable time steps in order to detect the activity sampled on the filter and calculate the associated concentration in air due to total, long lived (artificial) and short lived (natural) alpha and beta emitters.Alpha/Beta detection is carried out using a solid state detector (placed top-wise) connected to a charge preamplifier and a monitoring procesor including an input amplifier/shaper and a fast MCA section configurable 1k or 2k channels.
For on-line Gamma spectrometric analysis AMRA Na/Sr/Ge can be equipped with a standard/medium/high
resolution shielded Gamma detector assembly, made of scintillation NaI(Tl) or SrI2(Eu) or semuconductor HPGe detector coupled to a high performances MCA. This detector is located in the lower part of the measuringhead, under the filter. MCA can be set from 1k up to 16k channels
For on-line Gamma spectrometric analysis AMRA Na/Sr/Ge can be equipped with a standard/medium/highresolution shielded Gamma detector assembly, made of scintillation NaI(Tl) or SrI2(Eu) or semuconductor HPGe detector coupled to a high performances MCA. This detector is located in the lower part of the measuringhead, under the filter. MCA can be set from 1k up to 16k channels
The HPGe detector uses fully electrical cooling technique (Stirling) which makes the whole detector assembly very compact, eliminating the need for any cooling fluids and/or compressor system.The filters are cellulose homogeneous polymer with a collecting efficiency over 99% for a typical operating flow rate of for 3.5 – 4.5 m3/h
Radiation Probe RPSG-05 with datalogger in a connection box

MicroStep-MIS, www.microstep-mis.com © 2017, All specifications are subject to change without prior notice.10
Main operational functions:
• Filter control (including Δp) and filters changing• Flow-rate control and measurement• Live spectrum acquisition• On-line Spectra analysis and readout• Gamma background management• Evaluation of the activities on the filter and
concentrations/exposures in air• System parameters set-up• Control of the signals due to alert and alarm thresholds
exceeded and to failures• Alarm management• Built in test procedures• Analogue and digital outputs• Data communication
Detected radiation Alpha > 2.7 MeV, Beta > 60 keV, Gamma 30keV to 3MeV
On-line detectors for Alpha/Beta
Ruggedized ion implanted silicon detector 600 mm2
On-line detectors for Gamma
Scintillation detector NaI(Tl), resolution ≤ 7% @ 137Cs
Scintillation detector SrI2(Eu), resolution ≤ 3% @ 137Cs
Semiconductor detector HPGe, resolution ≤ 0.2% @ 60Cs (1.33 MeV) – with Stirling-type cooling
Auxiliary detector Active real-time gamma background compensation and monitoring (to ≈ 100 mSv/h)
Alpha/Beta/Gamma alarms
Programmable thresholds for alert and alarm over full range
Filters Circular Ø 47 mm cellulose homogeneous polymer (track Ø 38 mm)
Collection efficiency (4 m3/h) > 99 % (particles ≥ 0.3 μm), automatic change
Autonomy 45 filters (3 months standard continuous operation)
Pump Rotating, oil free, 18 m3/h - free air
Flow-rate range normal operation up to 6 m3/h, programmable
Flow-rate control measurement ± 2 % (typ.) - regulation ± 2 % (typ.)

MicroStep-MIS, www.microstep-mis.com © 2017, All specifications are subject to change without prior notice.11
Automatic Monitor of Gaseous Radioactive Iodine with automatic cartridge changer and on-line spectrometric analysis (third party product).
The instrument is contained in a very compact enclosure for wall, cart or desk mounting and is suitable for stand alone as well as for remote and/or network operation.
The AMGRI Automatic Monitor of Gaseous Radioactive Iodine includes a sensitive measuring channel for 131I gamma activity concentration, a local processing unit, a sampling system including pump and automatic cartridge changer. All is housed in a standard 19” rack cabinet.
Eventual particulates are collected by an input pre-filter, to avoid contamination of the iodine cartridge. The molecular, gaseous iodine is measured in real-time by means of the gamma spectrometry method with a NaI(Tl) or SrI2(Eu) scintillation detector.
The cartridge is automatically replaced by means of a dedicated mechanical changer allowing the use of up to 14
cartridges in automatic operation. Measuring times are programmable by the local processing unit.
Using a MCA device for the spectrometric measurement allows using well defined Regions of Interests (ROIs) for the evaluation of the relevant peak of I-131.
The ROIs can be properly set by the operator.
All measurements are qualified with a diagnostic indicating the current status of the system and measured values against set thresholds takeing into account the statistical fluctuations.
Main operational functions:
• Cartridge control (including Δp) and cartridges changing
• Flow-rate control and measurement
• Live spectrum acquisition
• On-line Spectra analysis and readout
• Pb-214 peak automatic compensation
• Evaluation of Iodine concentration in air
• System parameters set-up
• Control of the signals due to alert and alarm thresholds exceeded and to failures
• Alarm management
• Built in test procedures
• Digital outputs
• Data communication
AMGRI (Automatic Monitor of Gaseous Radioactive Iodine)

MicroStep-MIS, www.microstep-mis.com © 2017, All specifications are subject to change without prior notice.12
CCMRA is a Compact Continuous Monitor of Radioactive Aerosols (third party product) dedicated to sample and mea- sure the radioactive contamination in air, due to alpha and beta emitters, and provide in addition gamma dose rate measurements.
The instrument is contained in a very compact enclosure for wall, cart or desk mounting and is suitable for stand alone as well as for remote and/or network operation.CCMRA can be used in a Quick Deployment Unit configuration installed on a skid for easy transport and operability.
Main operational functions:
• Flow-rate, pressure drop through the filter and temperature measurement
• Flow thresholds management • On-line alpha/beta spectrum acquisition and readout • Gamma background measurement/compensation • 5-ROI processing and readout • Evaluation of artificial concentrations in air (and
exposures) • Evaluation of total collected activities - System
parameters set-up • Management of alert/alarm thresholds and trips • Management/detection of failures • Test and calibration operation • Data output and readout • Data storage and communication
It may be used as a mobile or fixed stand alone equipment as well as a peripheral station in a complex monitoring network, also coupled to dose-rate and/or iodine monitoring units. The standard configuration is in a wheeled integrated rack cabinet.
Detected radiation alpha ≥ 2.7 MeV and beta ≥ 80 keV
Detector ruggedised Si 600 mm2
Analysis unit RTS MAB-03 Monitoring processor 256-1024 MCA
Gamma bckg detector
energy compensated GM (<0.05 μSv/h to >50 mSv/h)
Measuring range
• natural emitters (Rn & Tn)
• α artificial emitters
• β artificial emitters
10-1 to 103 Bq/m3 (expandable)
10-2 to 105 Bq/m3 (expandable)
10-1 to 105 Bq/m3 (expandable)
Pump oil less, rotary vane, with 7, 14 or 18 m3/h of free air displacement rate
Serial interface 4x RS232 or RS485, 2x USB 2.0,
LAN interface RJ-45 100/10 BASE-T Fast Ethernet
CCMRA (Compact Continuous Monitor of Radioactive Aerosols)

MicroStep-MIS, www.microstep-mis.com © 2017, All specifications are subject to change without prior notice.13
Water Gamma Spectrometric Monitor (third party product) for automated monitoring of concentration of gamma-emitting radionuclides in water bodies. It consists of Scintillation detector assembly made of NaI(Tl) or SrI2(Eu) scintillation detector, HV power supply, Preamplifier and MCA with automatic spectra stabilization
Operational functions:
• Spectra measurement and storage• Automatic identification of 10 radioisotopes• Calculation of activity, volumetric activity• Count rate measurement in regions of interest (ROI);
Detector Scintillation detector NaI(Tl), resolution ≤ 7% @ 137Cs
Scintillation detector SrI2(Eu), resolution ≤ 3% @ 137Cs
Measurement range 0.5 to 5∙108 Bq/l
Detection limit < 0.5 Bq/l
(for 137Cs, 1h counting time)
MCA 1024 to 2048 channels
Stabilisation and automatic calibration
Embedded light pulser
Communication Ethernet LAN, RS-485,
RF/Wireless, GSM, GPRS/UMTS
Typical configuration of a station within the ambient radiation monitoring network consists of several monitoring units housed in a shelter:
• Automatic Monitor of Radioactive Aerosols AMRA Na/Sr/Ge
• Automatic Monitor of Gaseous Radioactive Iodine AMGRI
• Gamma Dose Rate Probe RPSG-05• Water Gamma Spectrometric Monitor• Meterological Sub-station
The station shelter design allows a continuous automatic monitoring under various environmental conditions. The respective monitoring devices can be accessed remotelly by the Station Configuration Module within the IMS – Radiation Monitoring software. Beside the real-time measured data, the State of Health of the station is available to the remote user.
Ambient Radiation Monitoring Station
WGSM (Water Gamma Spectrometric Monitor)

MicroStep-MIS, www.microstep-mis.com © 2017, All specifications are subject to change without prior notice.14
Colour White,
Other colors upon request.
Ingress Protection IP 65 (IEC 60529)
Standard ISO 1496-1
Door • One door (W1030 x H2100 mm)
• Door Lock will be keyed alike and be able to be opened from inside when locked without a key.
• An Abloy lock or equivalent to be provided with 2 keys for added security.
Auxiliary Equipment
UPS 30min. autonomy (without air conditioning power on)
Air Conditioning Air conditioning system is made of two identical AC Split
Lighting system Standard and emergency lighting system in accordance to interna-tional standards
Lightning protection • High voltage surges and light-ning protection devices
• Electrical grounding system in accordance to international standards
Air Conditioning
Retractable Ladder & 3-Step Ladder
Manual & Automatic emergency switch-off power when internal temperature above a set threshold.
Telescopic 10m mast for the Meteorological Substation sensors
The monitored parameters can be set as alarm triggers and warn the remote user by issuing of operational alarm:
• Temperature and humidity inside shelter
• Smoke alarm
• Power supply status
• UPS status
• Main and back door status
• Other parameters possible by request

MicroStep-MIS, www.microstep-mis.com © 2017, All specifications are subject to change without prior notice.15
Radiation Dispersion Modelling is a crisis management tool to predict the propagation of short time or continuous radioactive release through the atmosphere under changing meteorological conditions.
The simulations include the wet and dry deposition as well as radioactive decay and physico-chemicals characteristics of different radioactive nuclides. It is designed from regular daily forecasting purposes, to emergency crisis regime.
Radiation Dispersion Modelling uses a visualization tool for exploring and analyzing of radiation pollution data, related meteorological and trajectories analysis. All model outputs are displayed in graphical and understandable way.
The activity concentration charts, plume evolution and deposition charts are among standard outputs and the visualized model outputs can be saved in graphical data formats. The easy-to-use graphical user interface of navigates users through scene and image selection, displaying and animation.
Model Web Interface can publish operational model run results in regular intervals on Intranet / Internet making them accessible by standard web browser.
An appropriate Dispersion Model type and configuration is selected based on the customer needs and preferences. Steady plume and Non-steady Gaussian puff models are used to simulate the short-range and middle-range propagation of radioactive release through the atmosphere, while Lagrangian dispersion models are used for long-range transport simulations.
Model Data Inputs• Land topography, Surface characteristics, Terrain
elevations, Land-use• Weather data from standard global or locally provided
numerical prediction model • Weather data from local automatic and/or manned
weather stations (surface, upper air, over-water)• Release scenario configuration (pre-defined scenario,
default scenario with source term assimilation or user defined)
Radiation Dispersion Modelling
Propagation of radioactive nuclides from a hypothetical source through the atmosphere. The range of accident is Level 7: Major Accident, according to International Nuclear and Radiological Event Scale (INES). Up to now, only two accidents like this happened in the world: Chernobyl (1986) and Fukushima-Daichi (2011) nuclear power plant accident.
Propagation of radionuclides through the atmosphere
Activity of the earth's surface due to dry deposition of 137Cs

MicroStep-MIS, www.microstep-mis.com © 2017, All specifications are subject to change without prior notice.16
Scientific Publication
Simulated Processes• Meteorological pre-processing• Propagation of aerosol particles and/or gasses through
the atmosphere• Dry and Wet Deposition• Overwater and coastal fumigation effects• Building downwash• Radioactive decay • Source term assimilations
Model Outputs
• Plumes displayed as contour graph geo-refferenced layer on map-based screens (near ground concetrations, upper atmospheric layers, dry and wet deposition)
• Selectable model type, radiological variable, radionuclude, model run date and time
• Activity concentrations (Bq/m3), Surface contamination (Bq/m2), Upper air concentrations (Bq/m3)
• Tabular and text exports • Modeled values of concentration and depositions in
discrete receptors• Default radionuclides typical for nuclear reactors
accidents: 241Am, 143Ce, 60Co, 134Cs, 137Cs, 131I, 132Te, 133Xe, 85Kr, etc.
• Calculation of cloudshine, groundshine and inhalation dose rates.
Features:• Dispersion of significant radionuclides from the
source: 134Cs, 137Cs, 131I, 131I2, 90Sr, 85Kr, 133Xe (further extension possible)
• 2D interpretation of 3D data of particles dispersion
• Tracking of selected radionuclide dispersion
• Colour diferentiation used to figure the altitude achieved
• Mapping of surface contamination using a contour graph (in units of kBq/m2) due to wet and dry deposition of radionuclides
• Mapping of radioactivity of air in near surface layers (in units of kBq/m3)
• Mapping of radioactivity of air in upper atmospheric layers (in units of kBq/m3)
• Activity concentration in given receptors
The MicroStep-MIS Radiation Dispersion Modelling tool was used in case study of Fukushima Dai-ichi Nuclear Power Plant accident on March 11th 2011, caused by an extensive earthquake followed by a tsunami with height of 15 meters. This accident was rated 7 on the INES scale due to high radioactive releases to the environment.
Radiation Dispersion Modelling was used to simulate the forward and backward atmospheric dispersion of 137Cs over America and Europe. Nevertheless the radionuclide concentrations in the atmosphere have been negligible when compared with Chernobyl levels, they were detected by laboratories specialized for low-level radioactivity detection almost all over the world or by CTBTO stations.
The Radiation Dispersion Model was applied for the prediction of radioactive particle transport to Europe. The vertical velocity, particle dissipation and turbulence during the particle transport were considered. A single release of 1 PBq of 137Cs, which occurred on March 12th, 2011 from the damaged Fukushima nuclear reactors, was assumed. The initial plume height, as a result of initial vertical velocity and buoyancy was kept at 2000 − 3000 m. The meteorological data and simulated trajectories revealed that the arrival times of particles released on different days were not the same.
The jet stream affected the transport of emitted particles at upper atmospheric levels as the particles were transported at different altitudes. The simulated trajectories using the

MicroStep-MIS, www.microstep-mis.com © 2017, All specifications are subject to change without prior notice.17
Lagrangian dispersion model show that the first signal from the Fukushima accident could be detected in Europe on 19th March, 2011 (Island). The color range in the figures should be interpreted as follows: shades of red indicate particles from the bottom up to 3 km, black to dark blue color indicates the middle layer up to 6 km, and light blue represents an upper layer.
Most downloaded article for 2013After publishing, this article became the most downloaded item during the whole year 2013, as marked by the leading full-text scientific database ScienceDirect. Scientific journal by Springer marked the article as the third most downloaded article of Applied Radiation and Isotopes for the period of October – December 2013.
Other scientific publications:Povinec Pavel P., Bartok Juraj, Bartoková Ivana, Gera Martin, Ješkovský Miroslav, Kováčik Andrej, Mietelski J. W., Pham Mai Khanh, Plastino Wolfango, Sýkora Ivan:
Modelling Saharan dust impact on recent 137Cs variations in the atmosphere of the South-Central Europe.
New Challenges with New Analytical Technologies : ENVIRA 2015 Thessaloniki : Aristotle University, 2016 S. 47-50
Ješkovský Miroslav, Kováčik Andrej, Slávik O., Lištjak M., Sýkora Ivan, Povinec Pavel P.:
Study of aerosol 137Cs activities around nuclear power plants in Slovakia.
New Challenges with New Analytical Technologies : ENVIRA 2015 Thessaloniki : Aristotle University, 2016 S. 44-46
Kováčik Andrej, Bartoková Ivana, Omelka Jozef, Melicherová Terézia:
Radiation environmental real-time monitoring and dispersion modeling.
36th Days of Radiation Protection : Book of Abstracts Bratislava : Slovak Medical University, 2014. . - S. 108
Povinec Pavel P., Sýkora Ivan, Holý Karol, Gera, Martin, Kováčik Andrej, Bresťáková Lívia.
Aerosol radioactivity record in Bratislava/Slovakia following the Fukushima accident - A comparison with global fallout and the Chernobyl accident.
Journal of Environmental Radioactivity Vol. 114, Spec. Issue SI (2012), s. 81-88
Dispersion of Fukushima radionuclides in the global atmosphere and the ocean Applied Radiation and Isotopes, Volume 81, November 2013Pages 383-392, ISSN 0969-8043 http://dx.doi.org/10.1016/j.apradiso.2013.03.058

MicroStep-MIS, www.microstep-mis.com © 2017, All specifications are subject to change without prior notice.18
References: Radiation and Emission Monitoring, Air Quality
2016 • Arc Detector, Thales, France
• 10 Arc Detectors, Eurpoean Synchrotron Radiation Facility, France (in progress)
• 3 Arc Detectors for ESS, Sweden (in progress)
2015 • 75 Arc Detectors for LHC, Cern, Switzerland
• 5 AWS and C2 Software for Radiation Monitoring Network, Singapore
• 6 Authomatic Radiation Monitoring Stations and UDCS central Data Collection System, Center for Ecotoxicological Research, Montenegro
• Arc Detector, Eurpoean Synchrotron Radiation Facility, France
• 4 Arc Detector sensors and 2 recorders, Ferrite MicroWave Technologies LLC, USA
• 50 Arc Detectors, CERN, Switzerland (in progress)
2013 • 10 Automatic Radiation Monitoring Stations and Radiation Dispersion Model, NCMS7, U.A.E.
• 2 Radiation Probes, Slovak Hydrometeorological Institute, Slovak Republic
2010 • 2 special Automatic Weather Stations with extended measurement of dust and solar radiation, Public Authority of Electricity and Water, Oman
2008 • 2 Radiation Probes supplied with Automatic Meteorological Stations, Serbia
2007 • Upgrade of 23 regional radiation stations, Civil Defense, Slovak Republic
• 3 Radiation Stations, UDCS central Data Collection System, Notification System, SHMU1, Slovak Republic
• Mobile Radiation Station for crisis management, participation on the EU-project U2010

MicroStep-MIS, www.microstep-mis.com © 2017, All specifications are subject to change without prior notice.19
2006 • 5 Automatic Radiation Monitoring and 2 Meteorological Stations, UDCS Data Collection System, CLDB Climatological Database, Kyrgyzstan
2005 • 13 Radiation Probes, Civil Defense, Slovak Republic
• RadMon system upgrade (modem/asynchronous lines to Internet/Intranet), 52 stations, Civil Defense, Slovak Republic
• Migration to EURDEP2 format, SHMU1, Slovak Republic
2003 - 2004 • National radiation monitoring network of 13 stations, PME2, Saudi Arabia
• Central Radiation Database, PME2, Saudi Arabia
• Central Radiation Database, SHMU1, Slovak Republic
2000 - 2002 • National gamma radiation monitoring network of 52 stations, Civil Defense, Slovak Republic
1999 • Emission Monitoring System, Wastpro Nuclear power plant Jaslovské Bohunice, Slovak Republic
• Emission Monitoring System, Compressor station, SPP Ivanka pri Nitre, Slovak Republic
1998 • Real-time gamma radiation information system interconnected with EURDEP system of European Union, SHMU1
Slovak Republic
• Software for electromagnetic information panels, APEL s.r.o., Czech Republic / Poland
1995 • Gamma radiation monitoring network, SHMU1, Slovak Republic

© MicroStep-MIS | Cavojskeho 1, 84104 Bratislava 4, Slovak Republicwww.microstep-mis.com