An Automated DICOM Database Capable of Arbitrary Data Mining (Including Radiation Dose Indicators)...
11
An Automated DICOM Database Capable of Arbitrary Data Mining (Including Radiation Dose Indicators) for Quality Monitoring Shanshan Wang, 1 William Pavlicek, 2 Catherine C. Roberts, 2 Steve G. Langer, 3 Muhong Zhang, 1 Mengqi Hu, 1 Richard L. Morin, 4 Beth A. Schueler, 3 Clinton V. Wellnitz, 2 and Teresa Wu 1 The U.S. National Press has brought to full public discussion concerns regarding the use of medical radiation, specifically x-ray computed tomography (CT), in diagnosis. A need exists for developing methods whereby assurance is given that all diagnostic medical radiation use is properly prescribed, and all patients’ radiation exposure is monitored. The “DICOM Index Tracker©” (DIT) transparently captures desired digital imaging and communications in medicine (DICOM) tags from CT, nuclear imaging equipment, and other DICOM devices across an enterprise. Its initial use is recording, monitoring, and providing automatic alerts to medical professionals of excursions beyond internally deter- mined trigger action levels of radiation. A flexible knowledge base, aware of equipment in use, enables automatic alerts to system administrators of newly identified equipment models or software versions so that DIT can be adapted to the new equipment or software. A dosimetry module accepts mammography breast organ dose, skin air kerma values from XA modalities, exposure indices from computed radiogra- phy, etc. upon receipt. The American Association of Physicists in Medicine recommended a methodology for effective dose calculations which are performed with CT units having DICOM structured dose reports. Web inter- face reporting is provided for accessing the database in real-time. DIT is DICOM-compliant and, thus, is stand- ardized for international comparisons. Automatic alerts currently in use include: email, cell phone text message, and internal pager text messaging. This system extends the utility of DICOM for standardizing the capturing and computing of radiation dose as well as other quality measures. KEY WORDS: Data extraction, medical informatics applications, radiation dose, database management systems, knowledge base BACKGROUND Q uality assurance (QA) monitoring of ioniz- ing radiation use with certain diagnostic and procedural imaging is required by state regula- tory bodies and by The Joint Commission in the US. 1 Of the eight U.S. National Quality Measures Clearinghouse 2,3 (federal) metrics spe- cific to Radiology, two deal with radiation exposure: reduction of computed tomography (CT) dose and documentation of x-ray fluoro- scopy duration. Since these requirements are enterprise-wide, radiologists, cardiologists, vascu- lar surgeons, urologists, GI physicians, and other permitted users of x-ray and nuclear equipment are required to be monitored to satisfy the national goals. Recently, public discussion in the U.S national news has expressed concerns regarding the use of CT, including its expanding use, and instances of erythema that have occurred following certain CT examinations. 4–6 These concerns drive medical facilities to provide enhanced monitoring of radiation use. 7,8 While picture archiving and communication systems (PACS) can provide some 1 From the School of Computing, Informatics and Decision Systems Engineering, Arizona State University, 699 S. Mills Ave.( Tempe, AZ 85287, USA. 2 From the Department of Radiology, Mayo Clinic Arizona, 13400 East Shea Blvd( Scottsdale, AZ 85258, USA. 3 From the Department of Radiology, Mayo Clinic Rochester, 200 First St. SW Rochester, MN 55905, USA. 4 From the Department of Radiology, Mayo Clinic Florida, 4500 San Pablo Road( Jacksonville, FL 32224, USA. Correspondence to: Teresa Wu, School of Computing, Informatics and Decision Systems Engineering, Arizona State University, 699 S. Mills Ave.( Tempe, AZ 85287, USA; e-mail: [email protected] Copyright * 2010 by Society for Imaging Informatics in Medicine Online publication 8 September 2010 doi: 10.1007/s10278-010-9329-y Journal of Digital Imaging, Vol 24, No 2 (April), 2011: pp 223Y233 223
-
Upload
independent -
Category
Documents
-
view
0 -
download
0
Transcript of An Automated DICOM Database Capable of Arbitrary Data Mining (Including Radiation Dose Indicators)...

An Automated DICOM Database Capable of Arbitrary Data Mining(Including Radiation Dose Indicators) for Quality Monitoring
Shanshan Wang,1 William Pavlicek,2 Catherine C. Roberts,2 Steve G. Langer,3 Muhong Zhang,1
Mengqi Hu,1 Richard L. Morin,4 Beth A. Schueler,3 Clinton V. Wellnitz,2 and Teresa Wu1
The U.S. National Press has brought to full publicdiscussion concerns regarding the use of medicalradiation, specifically x-ray computed tomography (CT),in diagnosis. A need exists for developing methodswhereby assurance is given that all diagnostic medicalradiation use is properly prescribed, and all patients’radiation exposure is monitored. The “DICOM IndexTracker©” (DIT) transparently captures desired digitalimaging and communications in medicine (DICOM) tagsfrom CT, nuclear imaging equipment, and other DICOMdevices across an enterprise. Its initial use is recording,monitoring, and providing automatic alerts to medicalprofessionals of excursions beyond internally deter-mined trigger action levels of radiation. A flexibleknowledge base, aware of equipment in use, enablesautomatic alerts to system administrators of newlyidentified equipment models or software versions sothat DIT can be adapted to the new equipment orsoftware. A dosimetry module accepts mammographybreast organ dose, skin air kerma values from XAmodalities, exposure indices from computed radiogra-phy, etc. upon receipt. The American Association ofPhysicists in Medicine recommended a methodology foreffective dose calculations which are performed with CTunits having DICOM structured dose reports. Web inter-face reporting is provided for accessing the database inreal-time. DIT is DICOM-compliant and, thus, is stand-ardized for international comparisons. Automatic alertscurrently in use include: email, cell phone text message,and internal pager text messaging. This system extendsthe utility of DICOM for standardizing the capturing andcomputing of radiation dose as well as other qualitymeasures.
KEY WORDS: Data extraction, medical informaticsapplications, radiation dose, database managementsystems, knowledge base
BACKGROUND
Q uality assurance (QA) monitoring of ioniz-ing radiation use with certain diagnostic and
procedural imaging is required by state regula-tory bodies and by The Joint Commission inthe US.1 Of the eight U.S. National QualityMeasures Clearinghouse2,3 (federal) metrics spe-cific to Radiology, two deal with radiationexposure: reduction of computed tomography(CT) dose and documentation of x-ray fluoro-scopy duration. Since these requirements areenterprise-wide, radiologists, cardiologists, vascu-lar surgeons, urologists, GI physicians, and otherpermitted users of x-ray and nuclear equipment arerequired to be monitored to satisfy the nationalgoals. Recently, public discussion in the U.Snational news has expressed concerns regardingthe use of CT, including its expanding use, andinstances of erythema that have occurred followingcertain CT examinations.4–6 These concerns drivemedical facilities to provide enhanced monitoringof radiation use.7,8 While picture archiving andcommunication systems (PACS) can provide some
1From the School of Computing, Informatics and DecisionSystems Engineering, Arizona State University, 699 S. MillsAve.( Tempe, AZ 85287, USA.
2From the Department of Radiology, Mayo Clinic Arizona,13400 East Shea Blvd( Scottsdale, AZ 85258, USA.
3From the Department of Radiology, Mayo Clinic Rochester,200 First St. SW Rochester, MN 55905, USA.
4From the Department of Radiology, Mayo Clinic Florida,4500 San Pablo Road( Jacksonville, FL 32224, USA.
Correspondence to: Teresa Wu, School of Computing,Informatics and Decision Systems Engineering, Arizona StateUniversity, 699 S. Mills Ave.( Tempe, AZ 85287, USA; e-mail:[email protected]
Copyright * 2010 by Society for Imaging Informatics inMedicine
Online publication 8 September 2010doi: 10.1007/s10278-010-9329-y
Journal of Digital Imaging, Vol 24, No 2 (April), 2011: pp 223Y233 223

insights from archived examinations, they sufferfrom several drawbacks:
1. PACS are typically department-level devices,and do not offer insight into a patient’sexposure across multiple departments or sites.9
2. Commercial PACS, for performance reasons,generally do not permit performing a query on alive production system.
3. Radiation dose relevant digital imaging andcommunications in medicine (DICOM) tag valuescan be missing, inconsistent, or inappropriate.
At this time, records of fluoroscopy radiationuse are commonly hand-recorded into paper log-books typically at the operator’s control console,or are manually retrieved from PACS. However,fetching the whole exam to determine the relevantinformation (e.g., dose and exam duration time) isobviously uneconomic, as is the common approachof manually reviewing a large number of exams togenerate user- or protocol-specific radiation qualityreports. A standardized toolkit is needed toautomatically capture and integrate radiation doserecords in a timely fashion.One precursor of such standardization is the
integration of Structured Reporting (DICOM WG—08,10) standards to exchange structured data duringimage acquistion or post-examination so that radia-tion dose indicators or dose-related information isavailable in PACS.11 Two tools currently availableare CT dose SR and X-ray angiography (XA) SR.10
CT dose SR develops a record of patient episode ofradiation that includes the radiation-dose-relatedparameters. Summary reports can be sent to PACSand included in a patient’s health record. However,no known tools currently exist for centralizing thedocumented administration of ionizing radiationepisodes of care into a form suitable for routine useby quality assurance monitoring staff. In thisresearch, DICOM Index Tracker© (DIT) is designedto serve as a patient-centric, integrated DICOMinformation repository (including radiation doseindex history) combined with continual monitoringand reporting tools.
METHODS
DIT is designed and implemented to be fullyintegrated into a DICOM-compliant infrastructurewith the ability to capture and maintain longitudi-
nal patient-specific exam indices of interest for alldiagnostic and procedural uses of imaging modal-ities. This information system consists of sixmodules: a DICOM receiver accepting and parsingimaging files sent from equipment or PACS, aknowledge base (i.e., modalities, manufacturers,model, and software versions of known equip-ment) with mappings of the standard and propri-etary DICOM tags of interest, a patient episodetracking database, dosimetry analyzer tools, aconfigurable web reporter, and an automatedalert/messaging mechanism (e.g., unknown scan-ners, high radiation exposure, etc.). The systemarchitecture of DIT, including the compositemodules and the connection with other software,are shown in Figure 1. The implementation andevaluation of each component is summarized asfollows.
DICOM Receiver and Parser In DIT, the modulecalled ‘DICOM Receiver and Parser’ receivesimages from DICOM-compliant devices/systems,extracts the tag information, and stores them into aDIT database. The Receiver takes advantage of theDICOM transport protocol12—the de facto standardin medical imaging transfer fully supported by themajority of device manufacturers and PACSvendors. DIT is able to receive and process medicalimages from various locations, modalities, andequipment. Following the receipt of images, theDICOM header information is parsed andtransformed to XML format and then desposited tothe tables in DIT database. DIT does not store imagedata (it can accept the DICOM Secondary Capture)to enhance performance and reduce storage needs.
Knowledge Base DICOM tags commonly differ bymodality, vendor, and software version even for the
Fig 1. The architecture of DIT.
224 WANG ET AL.

same vendor and modality. The continuouslyevolving DICOM standard often results in a givenvendored product version being behind the newerDICOM committee standards. Nonetheless, even thebase standard provides extensive information aboutthe patient, the exact medical examination protocols,and the imaging modality acquisition settings. EveryDICOM-compliant image file contains modality-/exam-specific attributes including: patient age,gender, examination ordered, protocol, and seriesdescriptors, location of equipment, equipmentsoftware version, etc. Radiation dose-specificinformation varies by modality, but includes: kVp,mA and/or mAs, field of view, exposure index, airkerma at the patient entrance reference point (PERP),breast organ dose, body part, and with some nuclearequipment, the administered radioactivity (Bq). Inthe case of mammography, mean glandular organdose is provided. Other important information mightbe in an image file (DICOMSecondary Capture). Anexample of this is the Exam Protocol screenshot, amethod commonly used with CT to record the CTdose index (CTDIvol) and dose length product(DLP) for individual series and total examination.
Because of the variation in supplied DICOM tagsfrom different scanners, the Knowledge Basearchitecture design (Fig. 2) is included. Its schemaidentifies known scanners (defined as those havingtheir hardware and software specifications, as well asthe standard and proprietary dose-related tags presentwith this equipment) as being fully known by thedatabase. The tag mappings drive the properalgorithm selection for calculating a doseapproximation. Specifically, each known scanner(termed Known_scanners) belongs to one group ofspecific tags (termed Grp_specific_tags). InKnown_scanners, the Grp_ID defines the group ofproprietary data elements that will be harvested(chosen once, during a new equipment installation
or with a new software version) from the DICOMheader (in addition to the standard elements e.g.,image UID, accession). The mapping from Grp_IDto dose-related information is defined inGrp_specific_tags. The advantage of such schemadesign is that it provides the system extensibility. Forexample, when a new scanner is added, or for anexisting scanner, an update of software version, onerecord is added to known_scanners, and its list ofdose-related tags are determined and appended intoGrp_specific_tags. Importantly, this extension doesnot interfere with the processing of existing images,and it does not require any modification ofprogramming with new images. Overall, the cost ofadding an unknown scanner software version to DITis minimal.
Since the Knowledge Base serves as thefoundation of the DIT system, its comprehensiveand accurate content is essential for a successfulimplementation. The list of vendor modality specifictags was initially created as a team effort: radiologyspecialists from each modality, DICOM engineeringstaff, quality assurance staff, and system developer.The task ensures that the collected tags will satisfy allthe facets of technical and expected QA needs e.g.,dose calculation and quality monitoring withinsystem technical constraints.
DIT Database The database is designed to store allharvested tags while avoiding redundancy andmaintaining a balanced storage to optimize dataaccess efficiency. The resultant schema contains fiveparts: patient information, exam information (e.g.,protocol), series information, image information, andvendor modality-specific-related information (e.g.,dose). When images are sent from varied imagingdevices into the DIT, the DICOM header isextracted; the data elements are parsed out andpopulated into the database. The specified elementsare placed in database tables appropriate to the levelof the information.
In Figure 3, the table Patient has one recordfor each patient with information such aspatient_local_ID, gender, and DOB. The tableExam contains the basic information pertinent toeach exam common with each modality. Thisincludes exam information (exam description,referring doctor, and radiologist), exam time,location, etc. The table Series stores theinformation related to series, such as series_UIDand Series Description; and the table Images keepsFig 2. The database schema of Knowledge Base.
AN AUTOMATED DICOM DATABASE CAPABLE OF ARBITRARY DATA MINING 225
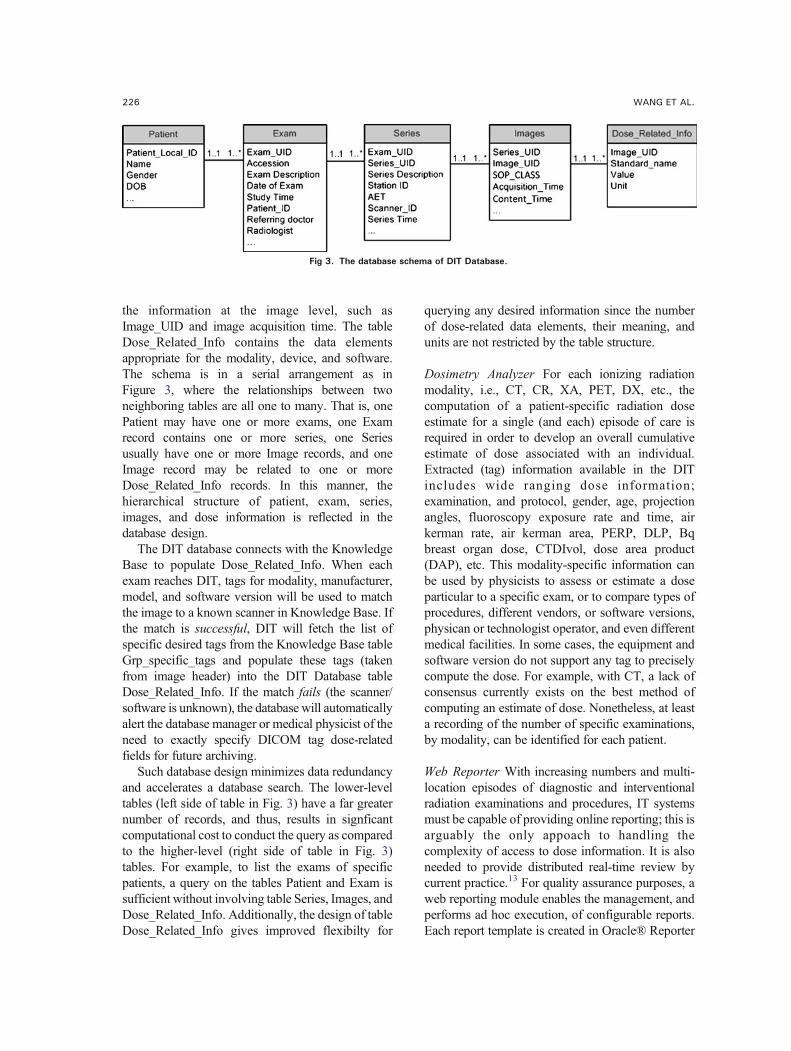
the information at the image level, such asImage_UID and image acquisition time. The tableDose_Related_Info contains the data elementsappropriate for the modality, device, and software.The schema is in a serial arrangement as inFigure 3, where the relationships between twoneighboring tables are all one to many. That is, onePatient may have one or more exams, one Examrecord contains one or more series, one Seriesusually have one or more Image records, and oneImage record may be related to one or moreDose_Related_Info records. In this manner, thehierarchical structure of patient, exam, series,images, and dose information is reflected in thedatabase design.
The DIT database connects with the KnowledgeBase to populate Dose_Related_Info. When eachexam reaches DIT, tags for modality, manufacturer,model, and software version will be used to matchthe image to a known scanner in Knowledge Base. Ifthe match is successful, DIT will fetch the list ofspecific desired tags from the Knowledge Base tableGrp_specific_tags and populate these tags (takenfrom image header) into the DIT Database tableDose_Related_Info. If the match fails (the scanner/software is unknown), the database will automaticallyalert the database manager or medical physicist of theneed to exactly specify DICOM tag dose-relatedfields for future archiving.
Such database design minimizes data redundancyand accelerates a database search. The lower-leveltables (left side of table in Fig. 3) have a far greaternumber of records, and thus, results in signficantcomputational cost to conduct the query as comparedto the higher-level (right side of table in Fig. 3)tables. For example, to list the exams of specificpatients, a query on the tables Patient and Exam issufficient without involving table Series, Images, andDose_Related_Info. Additionally, the design of tableDose_Related_Info gives improved flexibilty for
querying any desired information since the numberof dose-related data elements, their meaning, andunits are not restricted by the table structure.
Dosimetry Analyzer For each ionizing radiationmodality, i.e., CT, CR, XA, PET, DX, etc., thecomputation of a patient-specific radiation doseestimate for a single (and each) episode of care isrequired in order to develop an overall cumulativeestimate of dose associated with an individual.Extracted (tag) information available in the DITincludes wide ranging dose information;examination, and protocol, gender, age, projectionangles, fluoroscopy exposure rate and time, airkerman rate, air kerman area, PERP, DLP, Bqbreast organ dose, CTDIvol, dose area product(DAP), etc. This modality-specific information canbe used by physicists to assess or estimate a doseparticular to a specific exam, or to compare types ofprocedures, different vendors, or software versions,physican or technologist operator, and even differentmedical facilities. In some cases, the equipment andsoftware version do not support any tag to preciselycompute the dose. For example, with CT, a lack ofconsensus currently exists on the best method ofcomputing an estimate of dose. Nonetheless, at leasta recording of the number of specific examinations,by modality, can be identified for each patient.
Web Reporter With increasing numbers and multi-location episodes of diagnostic and interventionalradiation examinations and procedures, IT systemsmust be capable of providing online reporting; this isarguably the only appoach to handling thecomplexity of access to dose information. It is alsoneeded to provide distributed real-time review bycurrent practice.13 For quality assurance purposes, aweb reporting module enables the management, andperforms ad hoc execution, of configurable reports.Each report template is created in Oracle® Reporter
Fig 3. The database schema of DIT Database.
226 WANG ET AL.

(Oracle®, Redwood Shores, CA) to run on an OracleReport® server. The report profile can be selected inASP.NET web pages; users set their configurationand generate reports online. As the focus of thisproject is quality assurance, in which the content isvaried but not fully defined, the tool is intentionallygeneral in design, providing flexibility to otherdatabase-based web reporting applications.
This tool can be modified to provide reports onmany of the DICOM tag values that may be offuture interest. Alternatively, the results of a searchalso create a listing of the data requested which isrendered in a data table. A mammography searchmight include radiation dose, breast thickness, andthe filter type (either chosen by the technologist orautomatically selected by the equipment). A Savebutton creates an Excel file that is available forcreation of any desired graph format using i.e.,Chart Wizard (the user-friendly Excel function togenerate charts).14 A box to insert legal disclaimersregarding the appropriate use of privileged QAinformation is included.
Alert Mechanism This highly important instantmessage alert system enables the time bynotification of user-defined critical events. By settingdifferent levels of urgency, the designated QA staffare alerted to preconditioned events in near real-time.DIT alerts are generated automatically during user-configurable time period monitoring (i.e., every hour,or at midnight). When the service level reaches somewarning threshold or Triggers, an alert is sent.
At this time, alerts are sent via internal email,designated cell phone text messaging, and internalpager text messages. All messaging are organizedby a distribution list, and multiple staff receivespecific messages. Alerts are also needed tomaintain the robustness and accuracy of thesystem; any newly arriving images received byan unknown scanner generate an email message tosupport staff for a review of the data record and foran update on the Knowledge Base with theappropriate DICOM tags.
RESULTS
Knowledge Base The system consisting of all theabove six modules was developed at Mayo ClinicArizona (MCA) starting in January, 2009. Testingand development of DIT has continued since August
2009. DIT (v1.0) was introduced into clinical use inSeptember, 2009. The initial test database containedapproximately 650 exams (~70,000 image headers)purposely chosen from different vendors andmodalities to expand the Knowledge Base toapproximately 25 different devices at MCA.Currently, additional devices are being added fromMayo Clinic Florida and Mayo Clinic Rochester.These include CT, MRI, US, interventionalradiology, computed radiography, DR, cardiaccatheterization, nuclear PET, and mammography.Ongoing testing and validation enables the system toimprove and be accepted for use in clinical service atMCA. The MCA volume expected for 2010 are250 K examinations having ~1 M image headers;however, historical archive of examinations is beingconsidered.
Web Reports QA staff are provided with ad hocaccess to protocol and device specific as well aspopulation-wide and patient-specific radiationexposures indices. Figure 4 shows the current webuser interface for creating ad hoc reports. The userselects from the drop down menu for one of the eightavailable reports—DAP Report, CT mSv report,Exam Duration Time Report, Table UtilizationReport, Inter-Exam Time Report, AppointmentInterval Time Report, and/or Inter-Series TimeReport. Each report is designed to address a qualityassurance concern and is provided with configurationoptions. For example, the DAP Report contains thepopulation-wide statistics of DAP for IR examsduring a certain period.15 If DAP report is selected,the user is allowed to further input
� Dates: start date and end date of the reporttime scope
� Action Level I: the Level I DAP threshold.The exams with DAP beyond this level willtrigger the control Action I. For example, anup-to-date report of exams can be reviewed inthe quarterly QA committee meeting.
� Action Level II: the Level II DAP threshold. Theexams with DAP beyond this level will triggerthe control Action II or, if wished, an Alert
� Period (day, week, month, quarter): thefrequency by which the statistics should besummarized.
A request with these chosen configurationparameters is sent to the web server when the
AN AUTOMATED DICOM DATABASE CAPABLE OF ARBITRARY DATA MINING 227

user clicks the GenerateReport button. The webserver will execute the request on an OracleReport® server which is responsible for query-ing the database, composing the report, andreturning the result to the user. The report willdisplay in an ASP.NET web page, and the usercan easily save it as a pdf file on the local drive(Fig. 5).
Reports provide full details and, to faciliate theinterpretation of data, summarize statistics, charts,and diagrams. For example, the DAP Report liststhe related exams and shows the histogram ofDAP distribution by period. Figure 5 is the lastpage of a DAP Report, summarizing the weeklyDAP statistics from 01 January 2009 to 31December 2009. The week is plotted only if data
Fig 4. Web based user interface for report selection. In this case, dose area product (DAP) is selected.
228 WANG ET AL.
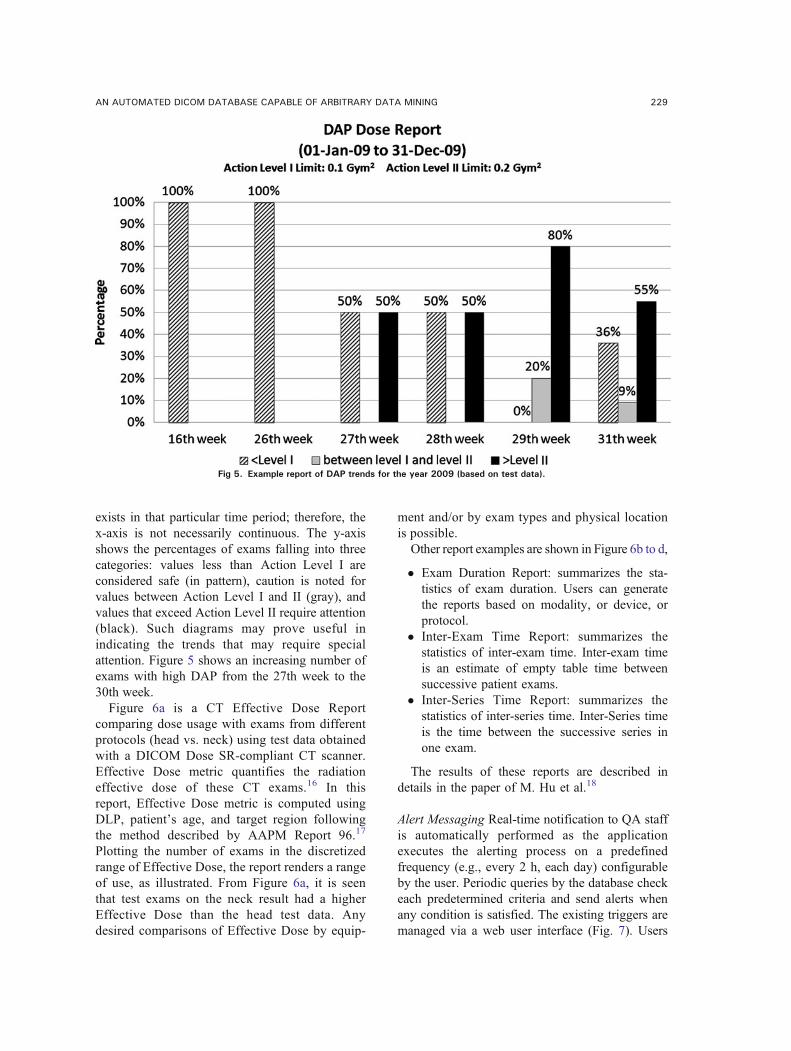
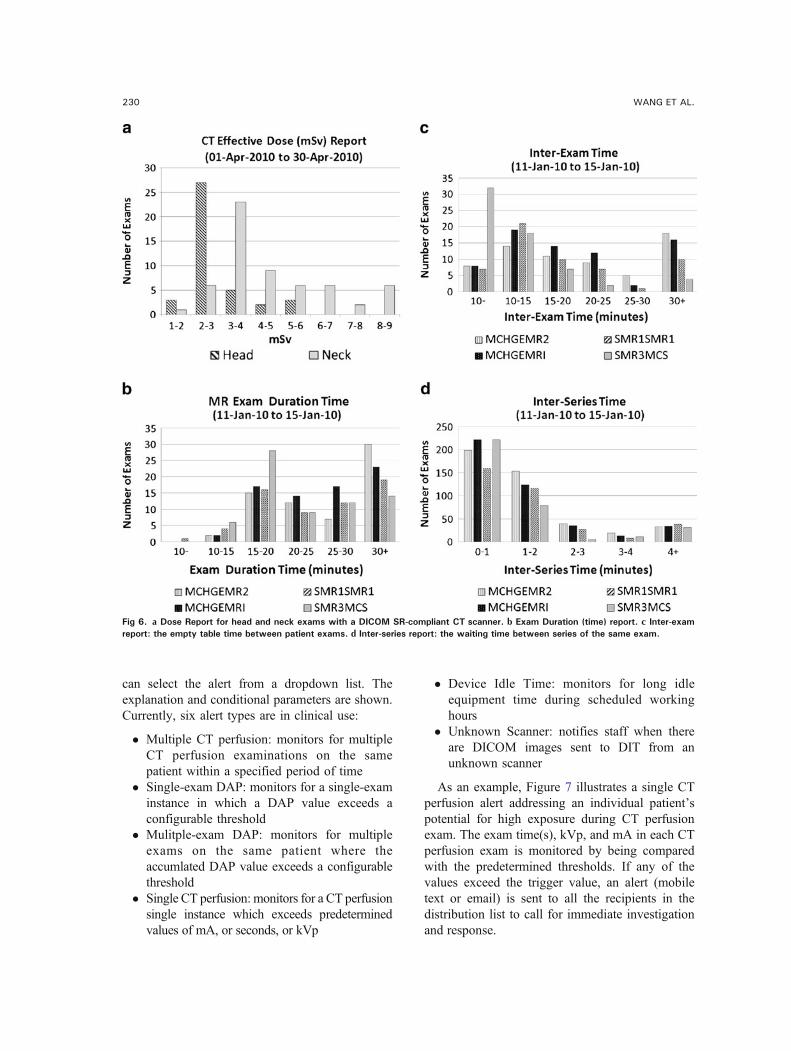
exists in that particular time period; therefore, thex-axis is not necessarily continuous. The y-axisshows the percentages of exams falling into threecategories: values less than Action Level I areconsidered safe (in pattern), caution is noted forvalues between Action Level I and II (gray), andvalues that exceed Action Level II require attention(black). Such diagrams may prove useful inindicating the trends that may require specialattention. Figure 5 shows an increasing number ofexams with high DAP from the 27th week to the30th week.Figure 6a is a CT Effective Dose Report
comparing dose usage with exams from differentprotocols (head vs. neck) using test data obtainedwith a DICOM Dose SR-compliant CT scanner.Effective Dose metric quantifies the radiationeffective dose of these CT exams.16 In thisreport, Effective Dose metric is computed usingDLP, patient’s age, and target region followingthe method described by AAPM Report 96.17
Plotting the number of exams in the discretizedrange of Effective Dose, the report renders a rangeof use, as illustrated. From Figure 6a, it is seenthat test exams on the neck result had a higherEffective Dose than the head test data. Anydesired comparisons of Effective Dose by equip-
ment and/or by exam types and physical locationis possible.Other report examples are shown in Figure 6b to d,
� Exam Duration Report: summarizes the sta-tistics of exam duration. Users can generatethe reports based on modality, or device, orprotocol.
� Inter-Exam Time Report: summarizes thestatistics of inter-exam time. Inter-exam timeis an estimate of empty table time betweensuccessive patient exams.
� Inter-Series Time Report: summarizes thestatistics of inter-series time. Inter-Series timeis the time between the successive series inone exam.
The results of these reports are described indetails in the paper of M. Hu et al.18
Alert Messaging Real-time notification to QA staffis automatically performed as the applicationexecutes the alerting process on a predefinedfrequency (e.g., every 2 h, each day) configurableby the user. Periodic queries by the database checkeach predetermined criteria and send alerts whenany condition is satisfied. The existing triggers aremanaged via a web user interface (Fig. 7). Users
Fig 5. Example report of DAP trends for the year 2009 (based on test data).
AN AUTOMATED DICOM DATABASE CAPABLE OF ARBITRARY DATA MINING 229
can select the alert from a dropdown list. Theexplanation and conditional parameters are shown.Currently, six alert types are in clinical use:
� Multiple CT perfusion: monitors for multipleCT perfusion examinations on the samepatient within a specified period of time
� Single-exam DAP: monitors for a single-examinstance in which a DAP value exceeds aconfigurable threshold
� Mulitple-exam DAP: monitors for multipleexams on the same patient where theaccumlated DAP value exceeds a configurablethreshold
� Single CT perfusion: monitors for a CT perfusionsingle instance which exceeds predeterminedvalues of mA, or seconds, or kVp
� Device Idle Time: monitors for long idleequipment time during scheduled workinghours
� Unknown Scanner: notifies staff when thereare DICOM images sent to DIT from anunknown scanner
As an example, Figure 7 illustrates a single CTperfusion alert addressing an individual patient’spotential for high exposure during CT perfusionexam. The exam time(s), kVp, and mA in each CTperfusion exam is monitored by being comparedwith the predetermined thresholds. If any of thevalues exceed the trigger value, an alert (mobiletext or email) is sent to all the recipients in thedistribution list to call for immediate investigationand response.
Fig 6. a Dose Report for head and neck exams with a DICOM SR-compliant CT scanner. b Exam Duration (time) report. c Inter-examreport: the empty table time between patient exams. d Inter-series report: the waiting time between series of the same exam.
230 WANG ET AL.

Each trigger has parameters for configuration. Inthe case of Multiple-exam DAP alerts, the followingcan be set:
� The vTimeLimit (in seconds) is the upperlimit of the procedure duration time
� The vKVPLimit (in kV) is the upper limit ofkVp level adopted in the procedure
� The vExposureLimit (in mAs) is the upperlimit of exposure in the procedure
� The vKeyword is the indicator of CT perfu-sion procedures that is contained in the Series
Fig 7. The web page to configure the alerts in the event of a patient experiencing excessive procedure time/kVp/exposure in CTperfusion.
AN AUTOMATED DICOM DATABASE CAPABLE OF ARBITRARY DATA MINING 231

Description tag (0008,103E) in DICOMheader
� The recipients of the email alerts� The title of the email� The contents of the email. In addition to plain
text, the user can customize the email withdynamic information items, e.g., {patient_ID},{Accession}, and {date of exam} so that theemail recipient will be supplied with enoughinformation to do further investigation. Forinstance, given the {Accession}=123456, thetemplate ‘Exam {Accession} has …’ results inan email content ‘Exam 123456 has ….’
Alert messages contain addressable destina-tions (email box, cell phone text address, andinternal pager text mailbox). In this manner,individualized alerting is permitted, includingfull national coverage. For internal paging, alertsare sent to Arizona, Florida, and Minnesota froma central database.As one of the testings, email, and internal pager
alerts for 27 most recently performed CT perfusionexaminations notified the QA staff of the exact x-ray acquisition employed. This automatic real-timereview of all Perfusion Exams provided a valida-tion of the dose employed as recently recommen-ded by the FDA.
DISCUSSION
In 2006, the European SENTINEL project19
carried out an evaluation of the practice of compu-terized patient records. The importance of recordingand analyzing DICOM header information for theaudit of radiation dose is echoed in the paper of Vanoet al..20 As they pointed out, automatic dose analysiswould improve the clinical practice. As also noted,important differences exist among x-ray systemsregarding the content and format of dosmetricinformation. The enormous variability of equip-ment-specific data, coupled with the evolving andvaried software versions in actual use, createschallenges in assembling a universal (multiplelocation, modality, and device) view of patient-specific or population-wide longitudinal examparameters (such as radiation exposure or dose).The wide availability of DICOM-compliant
enterprise archives9,21 in the US has enabled the
development of a centralized system to managecertain device-specific QA information obtainedwith medical images. By parsing the DICOMimage headers and storing the messages to adatabase, Prieto et al. automated the detection ofexam retakes.22 However, the usage of such asystem is limited if vendor equipment-specific data(including custom “shadow” tags) are not consid-ered. The difficulties of handling cross-institutional,multi-modality data are reflected in the work ofLaprise et al.,23 where a process involving differentroles was defined (Clinical Research Associate,documentation coordinators) to review, classify,and store the exams. However, this process requiresconsiderable human intervention. With DIT, theDICOM images are sent directly from the modalityto both the DIT and the PACS, automating the dataimporting process. The Knowledge Base enables theautomatic storage/retrieval of the various informa-tion for different modalities and across softwareversions.It is believed that DIT is the first implementa-
tion that provides a vertically integrated DICOM-compliant solution through information collectionto intelligent data analysis/reporting/alerting in aclinical quality assurance context. The system isempowered by a number of IT techniques, includ-ing Oracle® database, Oracle Report®, ASP.NET,JavaScript, web, and email server, and it appliesthe domain knowledge of radiology specialists indose prescription, estimates, and compliance met-rics. DIT provides multiple options to generatepatient-centric or population-wide dose reports andalerts. The data pool forms the foundation ofevidence-based quality assurance practices and isready for use in other applications.The future development of DIT will bring
tangible and intangible benefits to the practice ofpatient care and quality assurance. For example,we are currently conducting two pilot studies: theuse of DIT for peak skin dose calculation andlocalization, and imaging devices efficiency.These will be reported separately.14,18,24 Dosereports for an individual patient may be custom-ized to include the radiation history from allmodalities and locations employing DICOM. Thisgoal requires initializing a web call for the MasterPatient Index to gather the patient global ID acrossmultiple sites, to be accomplished upon the receiptof access approval from the respective institu-tional departments. Since DIT provides different
232 WANG ET AL.

data than other patient health information system,integrating DIT with existing Radiology InformationSystem and Healthcare Information System systemswill extend the benefits of all systems and will beexplored in the future. Other future developmentswill include the use of business intelligence tech-niques (forecasting, risk–benefit analysis, optimiza-tion, and data mining) which have been successfullyapplied in other industries (manufacturing andfinance service) for web reporting.
CONCLUSION
Requirements and recommendations from theJoint Commission, FDA, and national, regional,and individual healthcare providers in the USregarding radiation exposure can be addressedusing DIT. The contributions of this work aretwofold: providing an enterprise system solutionfor automated dose calculation in a multi-location,multi-modality, and multi-device environment, andforming a basis for evidence-based quality assur-ance and intelligent analysis regarding radiationdose estimates. Continuing advances with dosim-etry analysis are predicated on greater availabilityof the DICOM Dose SR.
REFERENCES
1. The Joint Commission: The Joint Commission SentinelEvent Policy and Procedures, Oakbrook Terrace, IL, 2007
2. Agency for Healthcare Research and Quality, Available athttp://www.ahrq.gov/. Accessed 03 January, 2010
3. National Quality Measures Clearinghouse. Available athttp://www.guideline.gov/browse/xrefnqmc.aspx. Accessed 03January, 2010
4. FDA News Release. ‘FDA makes interim recommenda-tions to address concerns of excess radiation exposure duringCT Perfusion’, Dec 7, 2009. Available at http://www.fda.gov/NewsEvents/Newsroom/PressAnnouncements/2009/ucm193190.htm. Accessed 18 January, 2010
5. Opreanu RC, Kepros JP: Radiation doses associated withcardiac computed tomography angiography. JAMA 301(22):2324–2325, 2009
6. Brenner DJ, Hall EJ: Computed tomography: an increasingsource of radiation exposure. N Engl J Med 357:2277–2284, 2007
7. Amis Jr, ES, Butler PF, Applegate KE, Birnbaum SB,Brateman LF, Hevezi JM, Mettler FA, Morin RL, Pentecost MJ,Smith GG, Strauss KJ, Zeman RK: American College ofRadiology white paper on radiation dose in medicine. J. AmColl Radiol 4:272–284, 2007
8. Center for Devices and Radiological Health, U.S. Foodand Drug Administration, White Paper: Initiative to ReduceUnnecessary Radiation Exposure from Medical Imaging, 2010.
http://www.fda.gov/downloads/Radiation-EmittingProducts/RadiationSafety/RadiationDoseReduction/UCM200087.pdf9. Langer S: Issues Surrounding PACS Archiving to External.
Third-Party DICOMArchives. J Digit Imaging 22(1):48–52, 200910. DICOM Structured Report WG-08 and WG-15 Supple-
ment 94, WG-21 CT Dose SR11. Reiner BI: The challenges, opportunities, and imperative
of structured reporting in medical imaging. J Digit Imaging 22(6):1–7, 200912. DICOM Standards, available at ftp://medical.nema.org/
medical/dicom/2009/, Accessed 23 July, 201013. Prevedello LM, Sodickson AD, Andriole KP, Khorasani
R: IT tools will be critical in helping reduce radiation exposurefrom medical imaging. J Am Coll Radiol. 6:125–126, 200914. Peter MB, Schueler B, Pavlicek W, Langer S, Wang SS,
Hu MQ, Wu T: Quality assurance and radiation dose monitor-ing for digital mammography using the dose index tracker,2010. Annual Meeting of the Society for Imaging Informatics inMedicine (SIIM), Minneapolis, Minnesota, June 3–6, 201015. Yakoumakis E, Tsalafoutas IA, Nikolaou D, Nazos I,
Koulentianos E, ProukakisC:Differences in effective dose estimationfrom dose-area product and entrance surface dose measurements inintravenous urography. Br J Radiol 74:727–34, 200116. Einstein AJ, Henzlova MJ, Rajagopalan S: Estimating
risk of cancer associated with radiation exposure from 64-slicecomputed tomography cornoary angiography. JAMA 298:317–323, 200717. The Diagnostic Imaging Council CT Committee: The
measurement, reporting, and management of radiation dose inCT, Report No. 96, AAPM, 200818. Hu M, Pavlicek W, Liu P, Zhang M, Langer S, Wang S,
Place V, Miranda R, Wu T: “Efficiency Metrics for ImagingDevice Productivity”, revised and resubmitted to RadioGraphicsat 07/16/201019. WORKPACKAGE4 -Efficacy and safety in high individual
dose examination, the European SENTINEL(Safety and Efficacyfor New Techniques and Imaging using New Equipment to SupportEuropean Legislation) project, http://www.dimond3.org/20. Vano E, Padovani R, Neofotistou V, Tsapaki V, Kottou
S, Ten JI, Fernandez JM, Faulkner K: Improving patient dosemanagement using DICOM header information. The EuropeanSENTINEL experience. Proceedings of the International Spe-cial Topic Conference on Information Technology in Biomedi-cine. Available at http://medlab.cs.uoi.gr/itab2006/proceedings/Medical%20Imaging/149.pdf, Accessed 22 January 201021. Langer S, Charboneau N, French T: DCMTB: A virtual
appliance DICOM toolbox. J Digit Imaging. http://www.springerlink.com/content/34l2635303wg57l5, 200922. Prieto C, Vano E, Ten JI, Fernandez JM, Iniguez AI,
Arevalo N, Litcheva A, Crespo E, Floriano A, Martinez D:Image retake analysis in digital radiography using DICOMheader information. J Digit Imaging 22(4):393–399, 200923. Laprise NK, Hanusik R, FitzGerald TJ, Rosen N, White
KS: Developing a multi-institutional PACS archive and design-ing processes to manage the shift from a film to a digital-basedarchive. J Digit Imaging 22(1):15–24, 200924. Khodadadegan Y, Zhang M, Pavlicek W, Paden RG,
Chong B, Schueler BA, Fetterly KA, Langer SG, Wu T:Automatic monitoring of localized skin dose with fluoroscopicand interventional procedures. revised and resubmitted to JDigit Imaging at 7/9/2010
AN AUTOMATED DICOM DATABASE CAPABLE OF ARBITRARY DATA MINING 233