Racial and economic segregation in Curitiba
15
Environmental and socio-economic transformaons in developing areas as the effect of globalizaon Mirosław Wójtowicz, Anna Winiarczyk-Raźniak (eds.) Wydawnictwo Naukowe UP Kraków 2014, pp. 34–48 Mirosław Wójtowicz Pedagogical University of Cracow Racial and economic segregaon in Curiba Abstract: The main purpose of this paper is to discuss the effects of racial and economic transformation on the social and spatial structure of the second-tier Brazilian city Curitiba. In the last two decades of the twentieth century and in the first decade of the twenty first century, new factors and determinants exerted decisive influence on the evolution of Brazilian cities. A fundamental change in the model of economic development took place during this period. Import-substitution industrialization (ISI), present since the 1930s, was replaced by neoliberal policies of “open markets”. On the one hand, globalization has been argued to contribute to social polarization, unemployment and informal employment, poverty, and insecurity, which later acted as a catalyst for the development of gated communities and strong fragmentation of urban space. On the other hand, recent studies and statistics on the social and economic development of Curitiba revealed that the city’s planning policy and marketing and promotional campaigns were successful, resulting in industrial development and unprecedented population increase. Population of the city of Curitiba has grown almost threefold from 609,000 in 1970 to 1,751,900 in 2010. The racial composition of Curitiba’s population has also changed over the last few decades. According to census data, the number of black and mixed-race residents was 138,200 in 1980 (13.5% of the city’s population) and increased by almost 250% to 344,100 by 2010 (19.6% of the city’s population). The paper focuses on determining the degree of racial and economic segregation and the analysis of the social and spatial structure of the city of Curitiba, using data from the latest population censuses. The research was based on household income, which was used to identify five income groups. The index of dissimilarity was then used to measure the degree of segregation for each group. Racial segregation was measured using the index of segregation and the index of dissimilarity for the largest racial minorities in Curitiba: whites (brancos), blacks (pretos), mixed-race (pardos), Asians (amarelos). The spatial concentration of income and racial groups was measured using a modified location quotient. The above data were used along with other demographic and social statistics to provide a comprehensive picture of Curitiba’s racial, economic, and spatial issues. Key words: Brazil, Curitiba, economic segregation, racial groups, racial segregation, dissimilarity index 1. Introducon Curitiba is the capital and largest city in the state of Parana in southern Brazil. The city was founded in 1693, on a plateau 945 meters above sea level, between the ri- vers Atuba and Belem. It is separated from the Atlantic Ocean by a distance of 70 km and the Serra do Mar mountain range. The city began to flourish economically and gain population in 1854, when it became the capital of Parana. Today Curitiba is not
Transcript of Racial and economic segregation in Curitiba

Environmental and socio-economic transformations in developing areas as the effect of globalization
Mirosław Wójtowicz, Anna Winiarczyk-Raźniak (eds.) Wydawnictwo Naukowe UP
Kraków 2014, pp. 34–48
Mirosław WójtowiczPedagogical University of Cracow
Racial and economic segregation in Curitiba
Abstract: The main purpose of this paper is to discuss the effects of racial and economic transformation on the social and spatial structure of the second-tier Brazilian city Curitiba. In the last two decades of the twentieth century and in the first decade of the twenty first century, new factors and determinants exerted decisive influence on the evolution of Brazilian cities. A fundamental change in the model of economic development took place during this period. Import-substitution industrialization (ISI), present since the 1930s, was replaced by neoliberal policies of “open markets”. On the one hand, globalization has been argued to contribute to social polarization, unemployment and informal employment, poverty, and insecurity, which later acted as a catalyst for the development of gated communities and strong fragmentation of urban space. On the other hand, recent studies and statistics on the social and economic development of Curitiba revealed that the city’s planning policy and marketing and promotional campaigns were successful, resulting in industrial development and unprecedented population increase. Population of the city of Curitiba has grown almost threefold from 609,000 in 1970 to 1,751,900 in 2010. The racial composition of Curitiba’s population has also changed over the last few decades. According to census data, the number of black and mixed-race residents was 138,200 in 1980 (13.5% of the city’s population) and increased by almost 250% to 344,100 by 2010 (19.6% of the city’s population). The paper focuses on determining the degree of racial and economic segregation and the analysis of the social and spatial structure of the city of Curitiba, using data from the latest population censuses. The research was based on household income, which was used to identify five income groups. The index of dissimilarity was then used to measure the degree of segregation for each group. Racial segregation was measured using the index of segregation and the index of dissimilarity for the largest racial minorities in Curitiba: whites (brancos), blacks (pretos), mixed-race (pardos), Asians (amarelos). The spatial concentration of income and racial groups was measured using a modified location quotient. The above data were used along with other demographic and social statistics to provide a comprehensive picture of Curitiba’s racial, economic, and spatial issues.
Key words: Brazil, Curitiba, economic segregation, racial groups, racial segregation, dissimilarity index
1. IntroductionCuritiba is the capital and largest city in the state of Parana in southern Brazil. The city was founded in 1693, on a plateau 945 meters above sea level, between the ri-vers Atuba and Belem. It is separated from the Atlantic Ocean by a distance of 70 km and the Serra do Mar mountain range. The city began to flourish economically and gain population in 1854, when it became the capital of Parana. Today Curitiba is not
Racial and economic segregation in Curitiba [35]
only the most important urban center in Parana but in southern Brazil in general. The city experienced an average rate of growth between the 1850s and the 1940s including several cycles of accelerated growth associated with exports of locally produced goods such as lumber, beef, coffee, and yerba mate. Growth accelerated significantly following World War II thanks to the local food processing industry. Other types of processing industries helped accelerate economic growth in the de-cades to come, and the city’s population increased accordingly (Macedo, 2004; Ra-binovitch, Hoehn, 1995; Irazabal, 2005).
The purpose of the paper is to analyze changes in racial composition of Curitiba against the background of population growth and geographic expansion, as well as to assess the degree of racial and economic segregation in the city. The paper will also show geographic differences in social and racial terms based on recent census data. Furthermore, it will show how the city’s racial geography has changed in recent decades. The study area is the city of Curitiba divided into 75 districts. Racial segregation in the city is assessed in detail using 2010 census data for 2,369 census tracts. The paper analyzes the city of Curitiba in the period between 1872 and 2010 – between the first and the most recent population census in Brazil.
The research focused on changes in the degree of racial segregation in Curitiba based on census data from 2000 and 2010. Only one dimension of segregation was evaluated – evenness of distribution – out of five dimensions listed by Massey and Denton (1988). Two indicators are used to evaluate evenness of distribution: (1) index of dissimilarity, (2) index of segregation. Economic segregation at the household level was also analyzed using the index of dissimilarity. Five main income categories were identified (Massey, Eggers, 1990). A modified location quotient (LQ)* was used to represent the spatial concentration of selected racial groups and income groups. A coefficient of correlation was used to test for codependence between the spatial concentration of income extremes and the concentration of white and black populations.
2. Population growth in CuritibaCuritiba became a regional center of economic and population growth back in
1854, when it became the capital of the state of Parana. However, its early growth was slow due to its peripheral location as compared to the major metropolitan centers of the time. Several waves of European immigrants arrived in Parana in the second half
* Location quotient LQ calculated according to the following formula:
'
'
YXyxLQ
k
iik=
where: kxi – number of persons/households in a given group k in a spatial unit i; yi’ – total number of persons/households in a spatial unit i minus persons/households in group k; kX – number of persons/households in group k in the entire city; Y’ – total number of persons/households in the entire city minus the number of persons/households in group k in the entire city (Węcławowicz, 2003).
[36] Mirosław Wójtowicz
of the 19th century. The immigrants were looking for a good climate and good land to farm. Immigrants from Italy, Poland, Ukraine, and Holland were primarily looking for good farmland and good ranching areas. Immigrants from Austria, Germany, and France came to trade and start a variety of industries. According to the Brazilian Census of 1872, Curitiba had about 12,600 residents. Population growth accelerated in the years that followed, partly because of the new railway line to the port city of Parangua (1885). Curitiba absorbed several waves of immigrants by the end of the 19th century – about 28,000 immigrants between 1890 and 1896 and another 27,000 immigrants between 1907 and 1914. The population of Curitiba more than tripled in the first half of the 20th century from about 50,000 to 180,000 residents (Irazabal, 2005; Macedo, 2013).
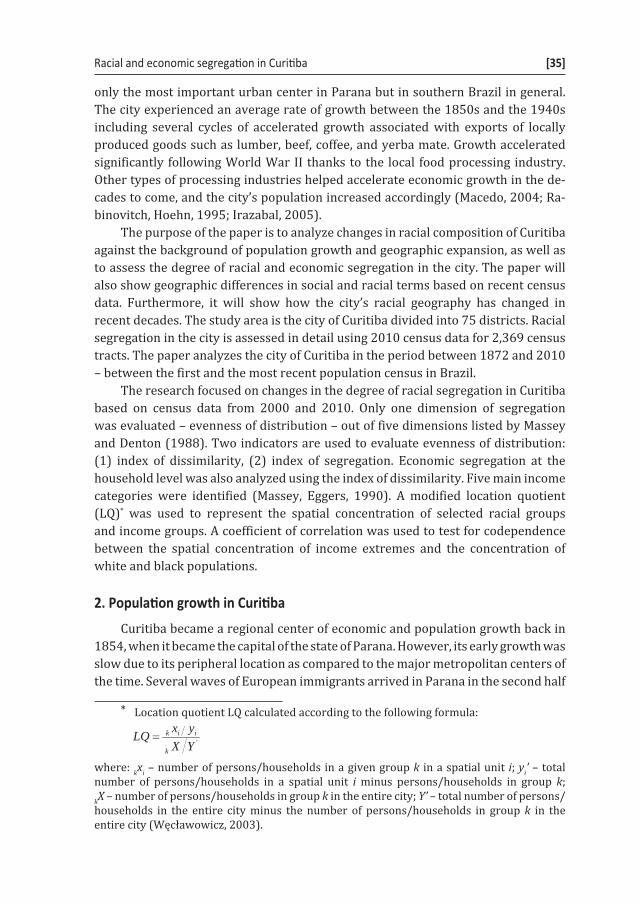
The city’s rate of population growth increased significantly in the second half of the 20th century resulting in almost a nine-fold increase in population from 180,600 in 1950 to 1,587,000 in the year 2000. Curitiba’s population in 2010 stood at 1,751,900. The fastest rate of growth was recorded in the 1950s when the city’s population doubled. The city’s rate of population growth in the 1960s and 1970s was close to 70% (Fig. 1).
Fig. 1. Population growth in Curitiba in the period 1853–2010
Source: prepared by the author on the basis of data from: Censo Demográfico 2000 and 2010
Curitiba’s rate of population growth in the 1950s was 7% per year, on the same level as one for the state of Parana, which suggests that growth was quite even and there was no major population redistribution between the city and its surrounding areas. The city’s rate of population growth in the 1960s and 1970s decreased to an average of 5.2% per year, which was a lot more than for the state of Parana in the
Racial and economic segregation in Curitiba [37]
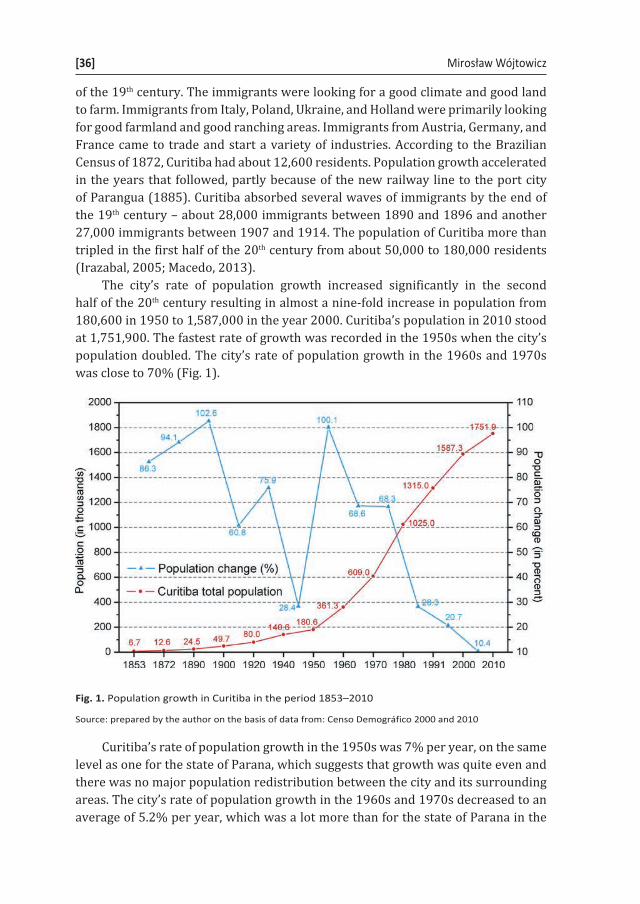
1970s (1% or less per year) (Fig. 2). This indicates that Curitiba’s population growth since the 1960s has been augmented by increasing migration from rural areas, small towns, and other parts of Brazil (Rabinovitch, Leitman, 1993; Rabinovitch, Hoehn, 1995). The large disparity in the rate of population growth between Curitiba and the state of Parana continued until the 1990s; with Curitiba gaining an average of 2.1% per year and Parana gaining an average of 1.4% per year.
However, the population growth rate for the city gradually began to resemble one for the state in the period between 2000 and 2010. By 2010, the city’s growth rate stood at 0.99% per year and the state’s growth rate stood at 0.89% per year. This was largely the result of Curitiba being spatially “filled to capacity” and an onset of suburban development. The rate of suburban population growth was noted at 1.87% per year in the period between 2000 and 2010 (Fig. 2). According to the 2010 Census, the city had close to 1.8 million residents, which made it 7th largest city in Brazil. Its metropolitan area had a population of more than 3.1 million which was 29.8% of the 10.4 million residents of the state of Parana (Macedo 2013).
Fig. 2. Population growth rate according to parts of the Curitiba Metropolitan Region, Parana state, and Brazil in general, 1872–2010
Source: prepared by the author on the basis of data from: Censo Demográfico 2000 and 2010
Curitiba’s rapid population growth produced expansive urbanization. The city of 434.67 square kilometers had a population density of 324 residents per square kilometer in the early 1940s, which increased to 4,030 residents per square kilometer in 2010. In the early years of the city’s population boom in the period between 1940 and 1966, new residential communities emerged around the city center, as well as

[38] Mirosław Wójtowicz
south and southeast of the city center along major roads (Fig. 3). The city’s growth reflected the spatial management plan created for Curitiba in 1966 by a Brazilian architect – Jorge Wilheim. The plan altered the previously concentric arrangement of the city’s main arteries and introduced northeast to southwest avenues that cut across the city. The new avenues were to serve as lines of new spatial development fashioned in a more linear manner (Rabinovitch, 1992; 1996; Smith, Raemaekers, 1998; Macedo, 2013).
Fig. 3. Administrative districts and urban development in Curitiba
Source: prepared by the author on the basis of data from: Curitiba em dados, 2013

Racial and economic segregation in Curitiba [39]
The last two decades of the 20th century saw another major building boom that filled in any gaps in the urban fabric around the old city center. Areas between urbanized wedges running along major roads leading out of the city were also filled in with new residential neighborhoods. The city’s most recent spatial growth concentrated in its southern, western, and eastern peripheries. These areas are the last free areas in the city itself. Many of the recently developed areas threaten the natural environment due to the risk of deforestation. Another threat related to the building boom is its encroachment on areas close to valleys surrounding reservoirs of drinking water. Therefore, it may be argued that Curitiba is running out of physical space for further urban growth (Fig. 3). Suburban development seems to be the imminent outcome of the current space shortage in the city. One basic indicator of suburbanization is population growth in outlying areas. In the Curitiba Metropolitan Area, outlying areas are gaining population at almost twice the rate of the city itself; data for the period 2000–2010 (Fig. 2).
3. Changes in racial compositionAccording to the Census of 1872, Curitiba’s residents of African origin made
up 35.56% of the city’s population, with 10% being classified as black (Tab. 1). The racial composition of the city was the product of its peripheral location, as compared to main avenues of colonization, and its relatively short tenure as the capital of the newly established state of Parana. Key events that affected the rate of population growth and its racial composition were the abolition of slavery in 1888 and the military coup that brought down the Brazilian empire and helped create the modern Brazilian republic in 1889. These events helped trigger mass European immigration, which affected mostly southern Brazil.
Brazil’s rate of immigration was only 12,000 people per year in the period between 1850 and 1875. This rate more than doubled, to 28,000 people per year, in the period between 1876 and 1886. The influx of white Europeans changed the racial balance in Brazil significantly. In 1872, Brazil’s population of 10.2 million included 2.9 million whites, 2 million blacks, and 4.3 million mixed-race residents, sometimes called mulattoes. However, by 1890, Brazil’s racial composition included 6.3 million whites, 2.1 million blacks, and 6 million mixed-race residents (Malinowski, 2013: 59–63). While the “whitening” of Brazilian society occurred nationwide, it was most noticeable in its southern states, which were affected by significant European immigration. This pattern can also be observed in Curitiba where the percentage of black and mixed-race residents decreased to 17.1% by 1890 and 5.75% by 1950 (Tab. 1).
The “whitening” of Curitiba took a turn in the opposite direction after World War II, as regional migration within Brazil became more pronounced. Brazilians of African origin began to migrate from the backward and overpopulated Northeast to the more advanced South. Migrants came to Curitiba in search of work in industry and the service sector. The industrialization of Curitiba is strongly linked with the influx of black and mixed-race Brazilians. The number of Brazilians of African origin

[40] Mirosław Wójtowicz
increased from 10,400 in 1950 to 138,200 in 1980 (13.5% of the city’s population) (Moraes, Souza, 1999). By 2010, residents of African origin accounted for 19.6% of Curitiba’s population (Tab. 1).
Table 1. Racial composition of Curitiba’s population in the years 1872–2010
RaceYear White Black Mixed-
-race Asian Caboclos Indigenous None indicated Total
1872 7,894(61.44)
1,197(9.32)
3,371(26.24) – 386
(3.00) – – 12,848(100.00)
1890 19,027(77.49)
997(4.06)
3,194(13.01) – 1,335
(5.44) – – 24,553(100.00)
1940 130,456(92.75)
3,128(2.22)
6,779(4.82)
210(0.15) – – 83
(0.06)140,656(100.00)
1950 169,031(93.87)
3,340(1.85)
7,016(3.90)
680(0.38) – – – 180,067
(100.00)
1980 874,298(85.30)
18,267(1.78)
119,972(11.70)
8,509(0.83) – – 4,034
(0.39)1,024,980(100.00)
1991 1,102,704(83.85)
20,454(1.56)
177,366(13.49)
12,947(0.98) – 706
(0.05)868(0.07)
1,315,035(100.00)
2000 1,339,299(84.38)
39,352(2.48)
179,476(11.31)
16,968(1.07) – 5,107
(0.32)7,114(0.45)
1,587,316(100.00)
2010 1,381,938(78.88)
49,978(2.85)
294,127(16.79)
23,138(1.32) – 2,693
(0.15)33(0.00)
1,751,907(100.00)
Source: prepared by the author on the basis of data from: Moraes, Souza (1999: 11), Censo Demográfico 2000 and 2010
The second half of the 20th century was also characterized by a rising number of people composing Asian minority. Most Asians in Curitiba are the descendants of Japanese immigrants coming to Brazil in the first half of the 20th century. More than 248,000 Asian immigrants came to Brazil between 1890 and 1969, and most of them settled in the industrial South and Southeast (Merrick, Graham, 1979, 91). The first Asian immigrants in Curitiba were noted in the Census of 1940 and their number was only 210. By 2010, the number of Asian Brazilians in Curitiba was more than 23,000 (1.3% of the city’s population) (Tab. 1). Most members of the Asian community in Curitiba tend to form cohesive groups and this is borne out by relatively high segregation index values (Tab. 2).
4. Changes in the degree of racial segregationCuritiba’s relatively large black and mixed-race communities are not
characterized by significant spatial segregation. In fact, spatial segregation in both types of communities declined in the period between 2000 and 2010. The index of segregation for the black community declined from 18.20 in 2000 to 15.84 in 2010, while the index of segregation for the mixed-race community declined from 19.39 in 2000 to 18.66 in 2010. The index of segregation for all persons of African origin
Racial and economic segregation in Curitiba [41]
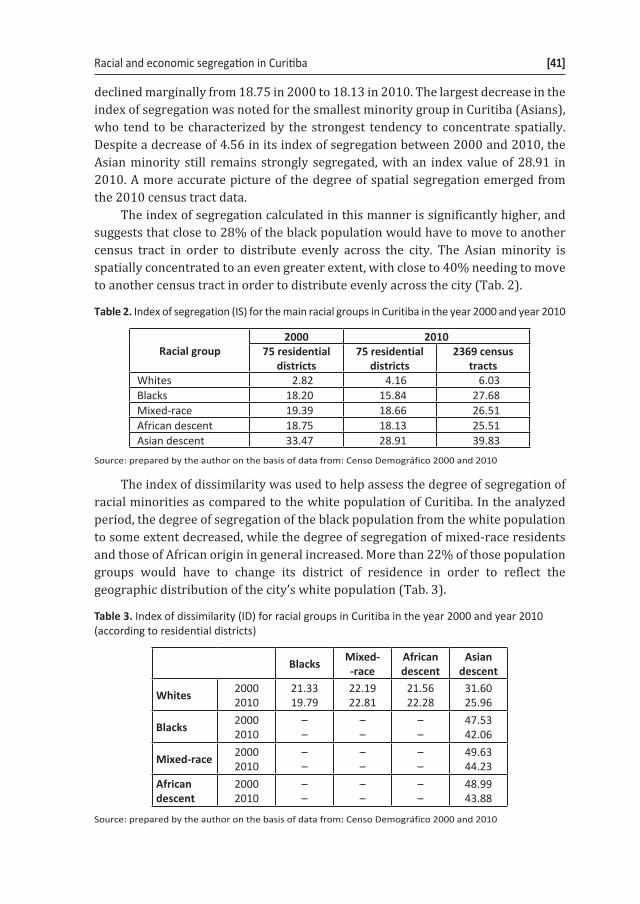
declined marginally from 18.75 in 2000 to 18.13 in 2010. The largest decrease in the index of segregation was noted for the smallest minority group in Curitiba (Asians), who tend to be characterized by the strongest tendency to concentrate spatially. Despite a decrease of 4.56 in its index of segregation between 2000 and 2010, the Asian minority still remains strongly segregated, with an index value of 28.91 in 2010. A more accurate picture of the degree of spatial segregation emerged from the 2010 census tract data.
The index of segregation calculated in this manner is significantly higher, and suggests that close to 28% of the black population would have to move to another census tract in order to distribute evenly across the city. The Asian minority is spatially concentrated to an even greater extent, with close to 40% needing to move to another census tract in order to distribute evenly across the city (Tab. 2).
Table 2. Index of segregation (IS) for the main racial groups in Curitiba in the year 2000 and year 2010
Racial group2000 2010
75 residential districts
75 residential districts
2369 census tracts
Whites 2.82 4.16 6.03Blacks 18.20 15.84 27.68Mixed-race 19.39 18.66 26.51African descent 18.75 18.13 25.51Asian descent 33.47 28.91 39.83
Source: prepared by the author on the basis of data from: Censo Demográfico 2000 and 2010
The index of dissimilarity was used to help assess the degree of segregation of racial minorities as compared to the white population of Curitiba. In the analyzed period, the degree of segregation of the black population from the white population to some extent decreased, while the degree of segregation of mixed-race residents and those of African origin in general increased. More than 22% of those population groups would have to change its district of residence in order to reflect the geographic distribution of the city’s white population (Tab. 3).
Table 3. Index of dissimilarity (ID) for racial groups in Curitiba in the year 2000 and year 2010 (according to residential districts)
Blacks Mixed--race
African descent
Asian descent
Whites 20002010
21.3319.79
22.1922.81
21.5622.28
31.6025.96
Blacks 20002010
––
––
––
47.5342.06
Mixed-race 20002010
––
––
––
49.6344.23
African descent
20002010
––
––
––
48.9943.88
Source: prepared by the author on the basis of data from: Censo Demográfico 2000 and 2010

[42] Mirosław Wójtowicz
The index of dissimilarity decreased significantly for the city’s Asian minority between 2000 and 2010, which suggests that racial segregation is decreasing in respect to this specific community. Nevertheless, close to 26% of the Asian community in Curitiba would have to change its district of residence in order to mirror the geographic distribution of the city’s white population. An even larger disproportion was observed in respect to the distribution of Asian residents and black and mixed-race residents. The spatial disparity between the Asian community and the black and mixed-race community was close to 49% in the year 2000. This means that almost half of the members of one of these communities would have to change their district of residence in order to reflect the other community’s geographic distribution in the city. While the index of dissimilarity for these two communities decreased to 43.9% by 2010, it is still the largest index value for all of the city’s racial groups, and it is also high in an absolute sense (Tab. 3).
The index of dissimilarity is significantly higher when it is analyzed based on Curitiba’s census tracts. In 2010 the degree of segregation for the white and black populations was 32.25, and for the white and mixed-race populations it was 32.47 (Tab. 4). The above calculations show that close to one third of each of the two minorities would have to change their census tract of residence in order to reflect the geographic distribution of the white majority. The values calculated for 2010 are still much lower than those calculated for 1980, when the index of dissimilarity for the white and black populations was 47.7, and that for the white and mixed-race populations was 41.7 in the Curitiba Metropolitan Area (Telles, 1992, 191).
Table 4. Index of dissimilarity (ID) for racial groups in Curitiba in the year 2010 (according to census tracts)
Blacks Mixed-race African descent
Asian descent
Whites 32.25 32.47 31.51 37.46Blacks – 22.58 – 55.60Mixed-race – – – 57.40African descent – – – 56.73
Source: prepared by the author on the basis of data from: Censo Demográfico 2010
5. Differences in the degree of economic segregationThe degree of economic segregation in Curitiba was evaluated using data from
the 2010 census on average monthly income per capita. Five income groups were identified. The largest group is made of poor households earning less than one minimum wage salary per capita* (31% of households). The second group consists of lower middle class households or more than 29% of all households in Curitiba.
* In 2010 the minimum wage salary in Brazil was 510 reals, which is the equivalent of 293.77 USD at an exchange rate of 1 USD = 1.736 BRL (January 12, 2010).

Racial and economic segregation in Curitiba [43]
In this case, monthly income per capita is the equivalent of 1 to 2 minimum wage salaries. Middle class households account for more than 26% of all households in Curitiba. In this case, monthly income per capita is the equivalent of 2 to 5 minimum wage salaries. Next, Curitiba’s upper class households earn between 5 and 10 minimum wage salaries per capita per month. Finally, wealthy households account for only 4% of all households in Curitiba and earn more than 10 minimum wage salaries per capita per month (Tab. 5).
Table 5. Index of segregation (IS) by income groups in Curitiba in 2010
Income categories Average monthly income per family member
Number of households
% of allhouseholds
Index of segregation
Poor familiesNo income 15,207
30.8 19.20Income of less than 1 minimum wage salary 161,893
Lower middle class families
Income between 1 and 2minimum wage salaries 167,813 29.2 12.28
Middle class families
Income between 2 and 5minimum wage salaries 150,233 26.1 14.14
Upper middle class families
Income between 5 and 10 minimum wage salaries 57,115 9.9 39.22
Wealthy familiesIncome above 10 mini-mum wage salaries 23,261 4.0 54.15
Source: prepared by the author on the basis of data from: Censo Demográfico 2010
Values of the index of segregation calculated for Curitiba indicate that spatial segregation in the city increases with the level of income. Wealthy households exhibit the greatest degree of spatial concentration, as more than 54% would have to move to a different district in order to attain even spatial distribution in the city. Upper middle class households are characterized by less spatial concentration, as close to 40% would have to move in order to attain even spatial distribution in the city. The lowest degree of spatial concentration was exhibited by lower middle class households, with an index of segregation of 12.3, which is the percentage of lower middle class households that would have to move in order to attain even spatial distribution in the city. Finally, lower class households were characterized by a greater degree of spatial segregation (19.2%), which suggests that low income or lack of income forces lower class households to live in designated areas often called districts of poverty (Tab. 5).
The greatest tendency to segregate spatially was noted for wealthy households as compared to poor households – close to 72% would have to move to a different district in order to attain even spatial distribution in the city. The degree of spatial segregation was somewhat lower for wealthy households as compared to lower middle class households, with an index of dissimilarity at more than 66. The degree of spatial segregation for upper middle class households is lower – still more

[44] Mirosław Wójtowicz
than half would have to move to a different district in order to attain even spatial distribution as compared to lower class and lower middle class households (Tab. 6).
Table 6. Index of dissimilarity for different income groups in Curitiba: 2010 (according to residen-tial districts)
Lower middle class
Middle class
Upper middle class
Wealthy families
Poor families 10.54 33.05 57.47 71.71
Lower middle class – 24.56 51.38 66.14
Middle class – – 28.03 44.96
Upper middle class – – – 19.23
Source: prepared by the author on the basis of data from: Censo Demográfico 2010
6. Spatial differences based on race and economic statusValues of the index of dissimilarity for the analyzed groups of households
indicate that wealthy households are the most likely to segregate themselves from other types of households. The most segregated households are wealthy and upper middle class households that occupy central parts of Curitiba. The highest values of the location quotient for wealthy households were noted for the districts of Batel (8.67) and Bigorrilho (6.24). Both districts are located southwest of central Curitiba. The districts of Cabral (5.75) and Juveve (5.63) were next, and both are located north of central Curitiba (Fig. 4).
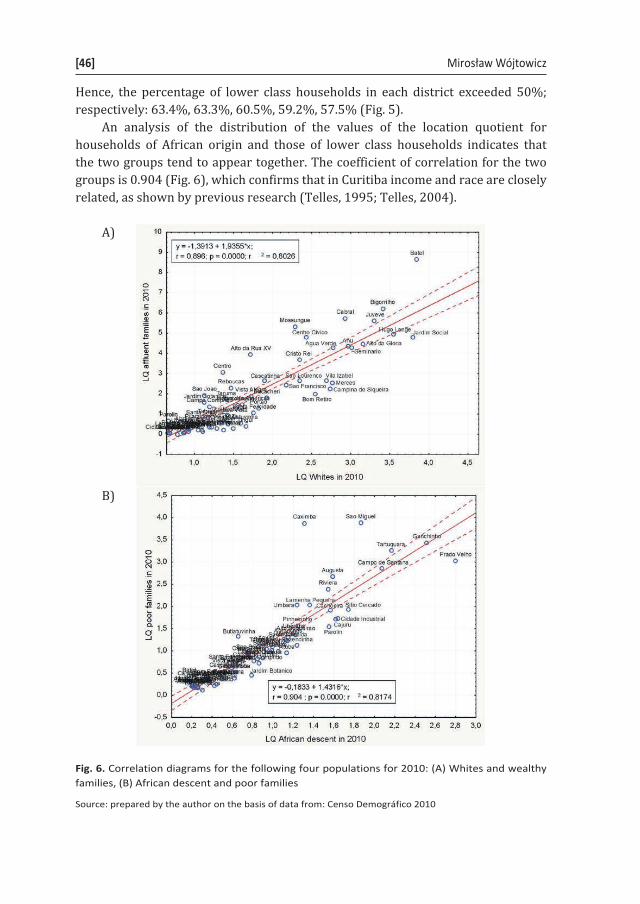
Spatial distribution of the city’s white population follows a similar pattern. White residents form the majority in districts located north, northeast, and southwest of the city center. The highest location quotient values for the white population were noted in the northeastern districts of Jardim Social (3.79), Hugo Lange (3.54), and Juveve (3.30), and in the southwestern districts of Batel (3.84) and Bigorrilho (3.41). This suggests that there is a relationship between the location of the white population and the wealthy population (Fig. 4). The coefficient of correlation based on location quotient values for the two populations of interest is 0.896, which confirms the above-suggested trend (Fig. 6).
An opposite pattern has been observed for residents of African descent, who are generally concentrated in peripheral districts along the northern, western, and southern fringes of the city. In 2010, the highest location quotient for this group was noted in the following southern districts: Ganchinho (2.51), Tartuquara (2.16), Campo de Santana (2.07). However, the highest location quotient for residents of African descent was noted in the southern district of Prado Velho (2.79) (Fig. 5).

Racial and economic segregation in Curitiba [45]
Fig. 4. Location quotient for white population and affluent families in 2010
Source: prepared by the author on the basis of data from: Censo Demográfico 2010
Fig. 5. Location quotient for the population of African descent and poor families in 2010
Source: prepared by the author on the basis of data from: Censo Demográfico 2010
A similar spatial pattern has been observed for the location quotient for the lower class, which accounts for almost 31% of the population of Curitiba. Lower class households are defined as those with less than one minimum wage salary per capita per month. The following districts noted high location quotient values: São Miguel 3.90, Caximba 3.89, Ganchinho 3.45, Tartuquara 3.26, Prado Velho 3.04.
[46] Mirosław Wójtowicz
Hence, the percentage of lower class households in each district exceeded 50%; respectively: 63.4%, 63.3%, 60.5%, 59.2%, 57.5% (Fig. 5).
An analysis of the distribution of the values of the location quotient for households of African origin and those of lower class households indicates that the two groups tend to appear together. The coefficient of correlation for the two groups is 0.904 (Fig. 6), which confirms that in Curitiba income and race are closely related, as shown by previous research (Telles, 1995; Telles, 2004).
A)
B)
Fig. 6. Correlation diagrams for the following four populations for 2010: (A) Whites and wealthy families, (B) African descent and poor families
Source: prepared by the author on the basis of data from: Censo Demográfico 2010

Racial and economic segregation in Curitiba [47]
7. SummaryChanges in the racial composition of Curitiba are associated with national
demographic and economic cycles in Brazil. This has been the case for the last two centuries. The first wave of rapid population growth in the second half of the 19th century was largely linked to Curitiba’s ascent as the capital of the state of Parana. During that period, the population of the city doubled. Population growth fueled economic development, which also attracted new immigrants, primarily Europeans. The large influx of European immigrants helped “whiten” the population of the city. As a result, by the 1950s, the city’s white population accounted for almost 94% of its total population.
The second major population boom in Curitiba, which occurred between 1950 and 1980, shaped the city’s current racial composition. The boom was associated with a policy of industrial growth based on the substitution of imports, as well as the modernization and mechanization of agriculture. Industrialization in Curitiba served as a pull factor that triggered mass immigration from rural Parana and other states. On the other hand, the pertinent push factor in this case was the mechanization of agriculture, which forced small farmers and farm workers to seek jobs in cities. A large percentage of this group consisted of workers of African origin, which led to a rise in their significance in the context of the racial composition of cities. Curitiba’s postwar population growth was also associated with a gradual increase in the percentage of residents of African origin; almost 20% by 2010.
Curitiba became more racially diverse due to the influx of migrants from north-ern Brazil in the period between 1950 and 2010. However, this did not trigger signif-icant racial segregation, although residents of African and Asian origin did become to some extent segregated from the majority – the white population. Recent cen-sus data indicate that in Curitiba, racial segregation is being gradually reduced. On the other hand, income remains a significant segregating factor in the city. Wealthy households tend to choose spatial segregation and concentration in central districts.
Research has also shown that districts with a majority of white population also tend to be the most affluent districts in Curitiba. By contrast, peripheral districts tend to be poor and inhabited by residents of African origin. In summary, it may be argued that modern Curitiba is characterized by moderate racial segregation with a decreasing tendency in recent decades. On the other hand, economic segregation is quite strong and is closely linked with racial segregation, as areas inhabited by the poorest people also tend to be areas inhabited by residents of African origin. Finally, central districts of the city tend to be white and wealthy.
ReferencesCenso Demográfico 2000. (2013). Instituto Brasileiro de Geografia e Estatística – IBGE, Rio de
Janeiro. Retrieved from http://downloads.ibge.gov.br/downloads_estatisticas.htm.
Censo Demográfico 2010. (2013). Instituto Brasileiro de Geografia e Estatística – IBGE, Rio de Janeiro. Retrieved from http://downloads.ibge.gov.br/downloads_estatisticas.htm.

[48] Mirosław Wójtowicz
Curitiba em dados. (2013). Instituto de Pesquisa e Planejamento Urbano de Curitiba –IPPUC, Curitiba. Retrieved from http://curitibaemdados.ippuc.org.br/Curitiba_em_dados_Pesquisa.htm.
Irazabal, C. (2005). City Making and Urban Governance in the Americas: Curitiba and Portland. Ashgate Publishing Limited, Aldershot.
Macedo, J. (2004). Curitiba, city profile. Cities, 21(6), 537–549.Macedo, J. (2013). Planning a Sustainable City: The Making of Curitiba, Brazil. Journal of Plan-
ning History, 00, 1–20. doi: 10.1177/1538513213482093.Malinowski, M. (2013). Brazylia: Republika. Dzieje Brazylii w latach 1889–2010. Warszawa:
Biblioteka Iberyjska, Instytut Studiów Iberyjskich i Iberoamerykańskich UW, Muzeum Historii Polskiego Ruchu Ludowego.
Massey, D.S., Denton, N.A. (1987). Trends in the residential segregation of Blacks, Hispanics, and Asians: 1970–1980. American Sociological Review, 52(6), 802–825.
Massey, D.S., Denton, N.A. (1988). The Dimensions of Residential Segregation. Social Forces, 67(2), 281–315.
Massey, D.S., Eggers, M.L. (1990). The Ecology of Inequality: Minorities and Concentration of Poverty, 1970–1980. American Journal of Sociology, 95(5), 1153–1188.
Merrick, T.W., Graham, D.H. (1979). Population and Economic Development in Brazil 1800 to the Present. Baltimore–London: Johns Hopkins University Press.
Moraes, P.R.B. de, Souza, M.G. de (1999). Invisibilidade, preconceito e violência racial em Curitiba. Revista de Sociologia e Política, 13, 7–16.
Rabinovitch, J. (1992). Curitiba: towards sustainable urban development. Environment and Urbanization, 4(2), 62–73.
Rabinovitch, J. (1996). Innovative land use and public transport policy. Land Use Policy, 13(1), 51–67.
Rabinovitch, J., Leitman, J. (1993). Environmental Innovation and Management in Curitiba, Brazil. United Nations Development Programme/World Bank/HABITAT, Urban Man-agement Programme, Working Paper Series No.1, New York.
Rabinovitch, J., Hoehn, J. (1995). A Sustainable Urban Transportation System: the „Surface Metro” in Curitiba, Brazil. Madison: EPAT/MUCIA Research&Training, University of Wisconsin.
Smith, H., Raemaekers, J. (1998). Land use pattern and transport in Cutitiba. Land Use Policy, 15(3), 233–251.
Telles, E. E. (1992). Residential segregation by skin color in Brazil. American Sociological Re-view, 57(2), 186–197.
Telles, E.E. (1995). Race, Class and Space in Brazilian Cities. International Journal of Urban and Regional Research, 19, 395–406.
Telles, E.E. (2004). Race in another America: the significance of skin color in Brazil. Princeton: Princeton University Press.
Węcławowicz, G. (2003). Geografia społeczna miast. Zróżnicowanie społeczno-przestrzenne. Warszawa: PWN.