QUARTERLY UPDATE - Nedbank CIB Equity Research Portal
49
Please click here to view our Nedbank CIB disclaimer Adding optimism We adjust our growth expectations higher for 2021 and believe inflation is more likely to surprise on the downside rather than the upside. While fiscal challenges remain, the external tailwinds and the domestic rebound continues to provide a positive cyclical backdrop for local asset prices in general. While we remain neutral on the currency, we believe bonds provide value on a tactical basis. We also moved more equity sectors to Overweight from either Neutral or Underweight last quarter. Sector views and allocation: Overweight – Platinum group metals (unchanged from last quarter), telecommunications (unchanged), listed property (unchanged), media (unchanged) and apparel (from Underweight) Neutral – Food retail (unchanged) Underweight – Gold mining (unchanged) GDP growth – On the growth front, we expect GDP growth of 3.8% y/y in 2021 and 2.3% y/y in 2022. Monetary policy – We expect inflation of 3.9% in 2021 and 4.4% in 2022. We expect an unchanged repo rate this year. FX – We continue to hold a neutral view on the rand within the broad 15.00-16.00 range against the USD and are buyers of USD below 15.00. Fixed income – Both nominal bonds and ILBs provide value on a tactical basis, but elevated country risk premia limit upside over the medium term. We continue to favour short-dated ILBs relative to nominals – this upside is limited up to the 4y point. Thereafter, nominal bonds look more attractive given the higher real return. Telecoms and media – MTN’s FY20 results were a watershed moment, and in equal measure, revitalised and de-risked its investment case. Stickiness to data consumption will likely keep Vodacom SA data revenue in double-digit growth territory. Telkom’s 3Q update was characterised by meaningful FCF and net debt upgrades. We are very constructive on NPN/PRX going into CY 2021. We maintain our Overweight stance for the telecommunications sector. In media, we keep an Overweight rating on Naspers and move Prosus NA to Overweight. PGM equities – higher for longer: We remain bullish on the prospects for the PGM market. We expect the equities to rerate further, which could see more equity upside, even if there is a pullback in the basket price. Our top picks are NHM, IMP, RBP and SSW. Listed property – valuations and collection rates holding up: The property sector has returned +19.6% (vs +14.8% JSE All Share Index) since we upgraded to Overweight in December. We continue to see pockets of value within our coverage universe despite the recent rerating and operational headwinds facing the sector. We remain Overweight this sector. Our top picks are RES, NRP, FFA, EMI, VKE, MSP and RDF. Gold equities – running out of steam: We maintain our view that the gold equities will underperform the gold price, as company free cash flow and dividends could fall short of investor expectations over the next year. While we maintain an Underweight on the sector, our top picks within the sector are SSW and GFI. Retail equities – maintaining our positive view from a listed perspective: The agility, cash preservation, debt reduction and investment in value-creating strategies by listed SA retailers have supported our more positive view on the sector in recent months. Our top picks in food are SHP, SPP and WHL, while in apparel, our picks are MRP, PPH and TFG. ANALYST DETAILS Walter De Wet [email protected] +27726356268 Reezwana Sumad [email protected] +27112941753 Jones Gondo [email protected] +27115354050 Arnold Van Graan [email protected] +27112959361 Avinash Kalkapersad [email protected] +27115374181 Nthulleng Mphahlele [email protected] +27112947032 Preshendran Odayar [email protected] +27115374181 Neels Heyneke [email protected] +27115354041 Ridwaan Loonat [email protected] +27112943221 Saad Chothia [email protected] +27115374190 Ziyad Joosub [email protected] +27115374181 QUARTERLY UPDATE 2Q 2021 6 APRIL 2021
-
Upload
khangminh22 -
Category
Documents
-
view
3 -
download
0
Transcript of QUARTERLY UPDATE - Nedbank CIB Equity Research Portal
Please click here to view our Nedbank CIB disclaimer
Adding optimism
We adjust our growth expectations higher for 2021 and believe inflation is more likely to surprise on the downside rather than the upside. While fiscal challenges remain, the external tailwinds and the domestic rebound continues to provide a positive cyclical backdrop for local asset prices in general. While we remain neutral on the currency, we believe bonds provide value on a tactical basis. We also moved more equity sectors to Overweight from either Neutral or Underweight last quarter.
Sector views and allocation:
Overweight – Platinum group metals (unchanged from last quarter), telecommunications (unchanged), listed property (unchanged), media (unchanged) and apparel (from Underweight)
Neutral – Food retail (unchanged)
Underweight – Gold mining (unchanged)
GDP growth – On the growth front, we expect GDP growth of 3.8% y/y in 2021 and 2.3% y/y in 2022.
Monetary policy – We expect inflation of 3.9% in 2021 and 4.4% in 2022. We expect an unchanged repo rate this year.
FX – We continue to hold a neutral view on the rand within the broad 15.00-16.00 range against the USD and are buyers of USD below 15.00.
Fixed income – Both nominal bonds and ILBs provide value on a tactical basis, but elevated country risk premia limit upside over the medium term. We continue to favour short-dated ILBs relative to nominals – this upside is limited up to the 4y point. Thereafter, nominal bonds look more attractive given the higher real return.
Telecoms and media – MTN’s FY20 results were a watershed moment, and in equal measure, revitalised and de-risked its investment case. Stickiness to data consumption will likely keep Vodacom SA data revenue in double-digit growth territory. Telkom’s 3Q update was characterised by meaningful FCF and net debt upgrades. We are very constructive on NPN/PRX going into CY 2021. We maintain our Overweight stance for the telecommunications sector. In media, we keep an Overweight rating on Naspers and move Prosus NA to Overweight.
PGM equities – higher for longer: We remain bullish on the prospects for the PGM market. We expect the equities to rerate further, which could see more equity upside, even if there is a pullback in the basket price. Our top picks are NHM, IMP, RBP and SSW.
Listed property – valuations and collection rates holding up: The property sector has returned +19.6% (vs +14.8% JSE All Share Index) since we upgraded to Overweight in December. We continue to see pockets of value within our coverage universe despite the recent rerating and operational headwinds facing the sector. We remain Overweight this sector. Our top picks are RES, NRP, FFA, EMI, VKE, MSP and RDF.
Gold equities – running out of steam: We maintain our view that the gold equities will underperform the gold price, as company free cash flow and dividends could fall short of investor expectations over the next year. While we maintain an Underweight on the sector, our top picks within the sector are SSW and GFI.
Retail equities – maintaining our positive view from a listed perspective: The agility, cash preservation, debt reduction and investment in value-creating strategies by listed SA retailers have supported our more positive view on the sector in recent months. Our top picks in food are SHP, SPP and WHL, while in apparel, our picks are MRP, PPH and TFG.
ANALYST DETAILS
Walter De Wet
+27726356268
Reezwana Sumad
+27112941753
Jones Gondo
+27115354050
Arnold Van Graan
+27112959361
Avinash Kalkapersad
+27115374181
Nthulleng Mphahlele
+27112947032
Preshendran Odayar
+27115374181
Neels Heyneke
+27115354041
Ridwaan Loonat
+27112943221
Saad Chothia
+27115374190
Ziyad Joosub
+27115374181
QUARTERLY UPDATE 2Q 2021 2
6 APRIL 2021
QUARTERLY UPDATE
6 APRIL 2021 PAGE 2
Contents
Core macroeconomic views ........................................................................................ 3
Asset allocation and sector picks ................................................................................ 4
Sector views and sector performance ..................................................................... 4
Preference picks and selective bias within sectors ................................................. 4
Global Outlook: no structural shift higher in inflation just yet....................................... 5
Domestic growth – costs rising at slower pace ........................................................... 7
Costs of restrictions still rising but at a slower pace .................................................... 8
Monetary policy – we look for a delayed but muted hiking cycle ............................... 10
The SARB has been tolerant of negative real rates in the past ............................. 10
Fiscal policy bears some fruit, but we await the harvest ........................................... 12
Credit conditions are firmly negative, but borrowing window accommodative .......... 15
FX: Some strength, less predictable ......................................................................... 17
Fixed Income: country risk premia prevent outright bullishness................................ 19
SA Retail – Maintaining our positive view from a listed perspective ......................... 21
Share price performances and valuation ............................................................... 22
SA Property: Valuations and collection rates holding up .......................................... 24
PGMs – Higher for Longer ........................................................................................ 27
Tight market underpins high basket price.............................................................. 27
Supply-demand balances ...................................................................................... 27
Supply ................................................................................................................... 28
Demand................................................................................................................. 28
PGM equity outlook ............................................................................................... 29
Gold - Running out of steam ..................................................................................... 31
Long hard run, unlikely to be repeated .................................................................. 31
Gold price outlook ................................................................................................. 31
Equities vs gold price ............................................................................................ 33
Valuations and fair values ..................................................................................... 33
Comp tables .......................................................................................................... 35
Telecommunications & Media ................................................................................... 36
MTN Group .......................................................................................................... 36
Vodacom Group .................................................................................................... 38
Telkom SA SOC .................................................................................................... 39
Naspers and Prosus .............................................................................................. 41
Selected forecasts .................................................................................................... 44
Contact details .......................................................................................................... 45
Disclaimer ................................................................................................................. 45
6 APRIL 2021 PAGE 3
QUARTERLY UPDATE
Core macroeconomic views
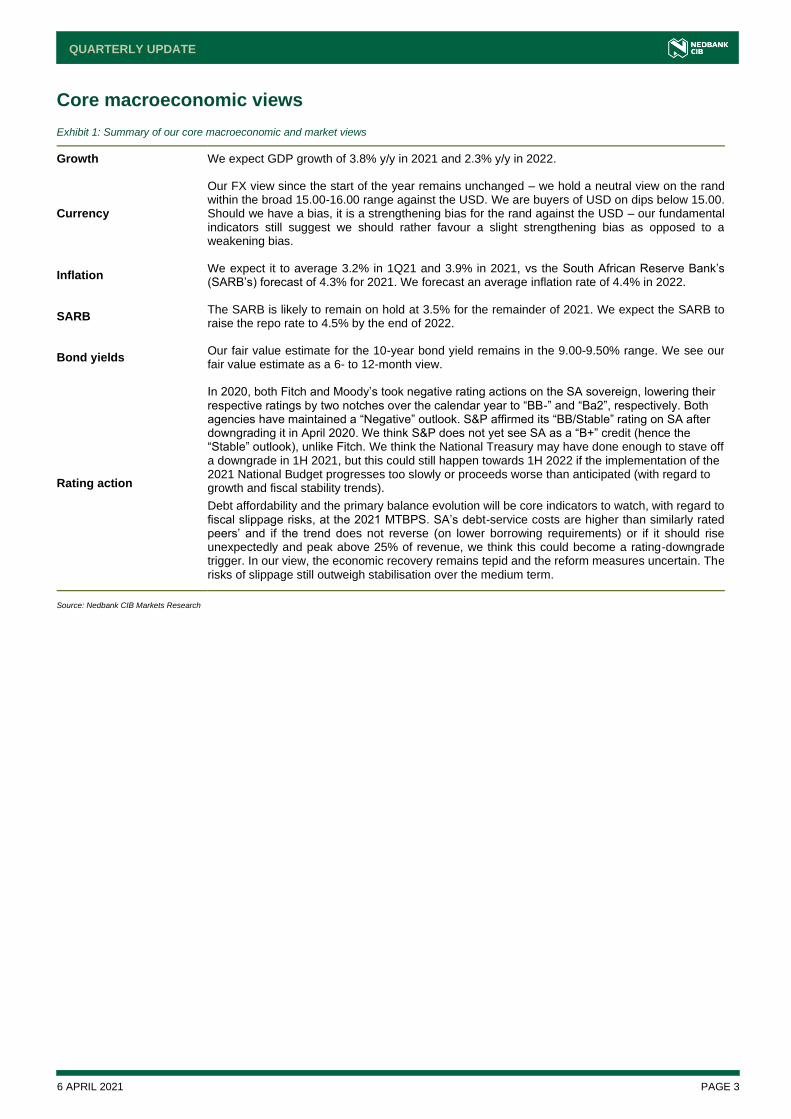
Exhibit 1: Summary of our core macroeconomic and market views
Growth We expect GDP growth of 3.8% y/y in 2021 and 2.3% y/y in 2022.
Currency
Our FX view since the start of the year remains unchanged – we hold a neutral view on the rand within the broad 15.00-16.00 range against the USD. We are buyers of USD on dips below 15.00. Should we have a bias, it is a strengthening bias for the rand against the USD – our fundamental indicators still suggest we should rather favour a slight strengthening bias as opposed to a weakening bias.
Inflation We expect it to average 3.2% in 1Q21 and 3.9% in 2021, vs the South African Reserve Bank’s (SARB’s) forecast of 4.3% for 2021. We forecast an average inflation rate of 4.4% in 2022.
SARB The SARB is likely to remain on hold at 3.5% for the remainder of 2021. We expect the SARB to raise the repo rate to 4.5% by the end of 2022.
Bond yields Our fair value estimate for the 10-year bond yield remains in the 9.00-9.50% range. We see our fair value estimate as a 6- to 12-month view.
Rating action
In 2020, both Fitch and Moody’s took negative rating actions on the SA sovereign, lowering their respective ratings by two notches over the calendar year to “BB-” and “Ba2”, respectively. Both agencies have maintained a “Negative” outlook. S&P affirmed its “BB/Stable” rating on SA after downgrading it in April 2020. We think S&P does not yet see SA as a “B+” credit (hence the “Stable” outlook), unlike Fitch. We think the National Treasury may have done enough to stave off a downgrade in 1H 2021, but this could still happen towards 1H 2022 if the implementation of the 2021 National Budget progresses too slowly or proceeds worse than anticipated (with regard to growth and fiscal stability trends). Debt affordability and the primary balance evolution will be core indicators to watch, with regard to fiscal slippage risks, at the 2021 MTBPS. SA’s debt-service costs are higher than similarly rated peers’ and if the trend does not reverse (on lower borrowing requirements) or if it should rise unexpectedly and peak above 25% of revenue, we think this could become a rating-downgrade trigger. In our view, the economic recovery remains tepid and the reform measures uncertain. The risks of slippage still outweigh stabilisation over the medium term.
Source: Nedbank CIB Markets Research
6 APRIL 2021 PAGE 4
QUARTERLY UPDATE
Asset allocation and sector picks
Sector views and sector performance
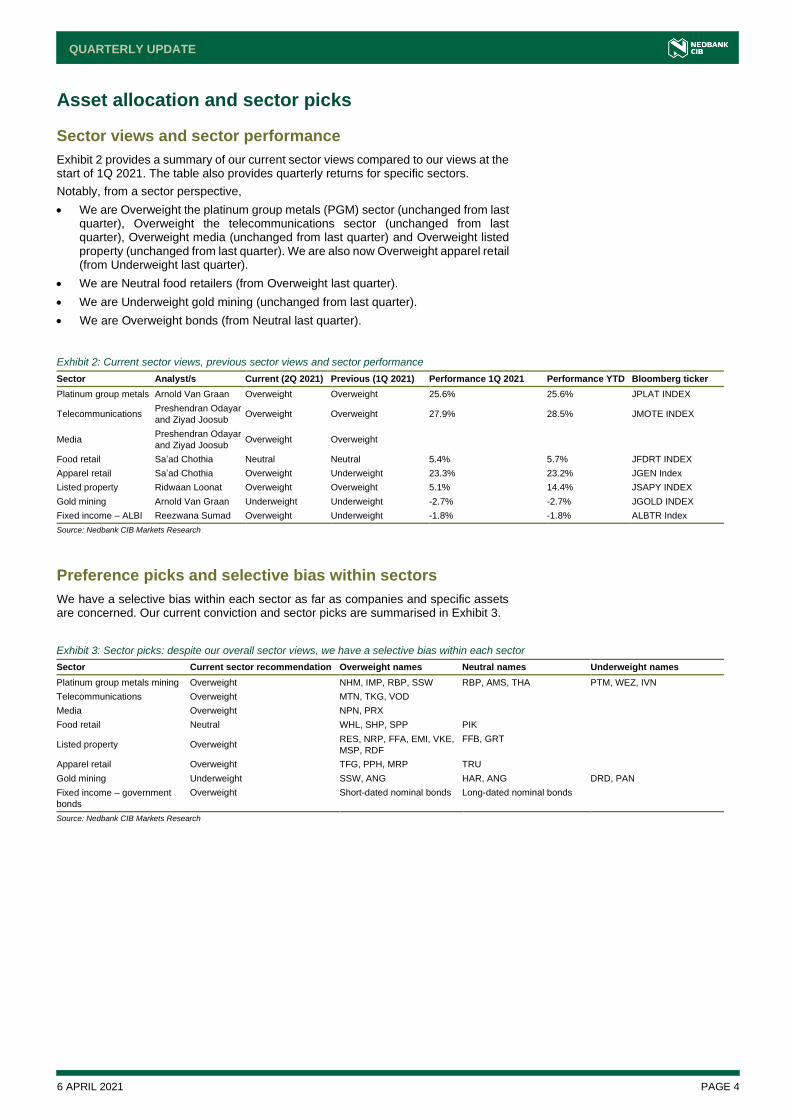
Exhibit 2 provides a summary of our current sector views compared to our views at the start of 1Q 2021. The table also provides quarterly returns for specific sectors.
Notably, from a sector perspective,
• We are Overweight the platinum group metals (PGM) sector (unchanged from last quarter), Overweight the telecommunications sector (unchanged from last quarter), Overweight media (unchanged from last quarter) and Overweight listed property (unchanged from last quarter). We are also now Overweight apparel retail (from Underweight last quarter).
• We are Neutral food retailers (from Overweight last quarter).
• We are Underweight gold mining (unchanged from last quarter).
• We are Overweight bonds (from Neutral last quarter).
Exhibit 2: Current sector views, previous sector views and sector performance
Sector Analyst/s Current (2Q 2021) Previous (1Q 2021) Performance 1Q 2021 Performance YTD Bloomberg ticker
Platinum group metals Arnold Van Graan Overweight Overweight 25.6% 25.6% JPLAT INDEX
Telecommunications Preshendran Odayar
and Ziyad Joosub Overweight Overweight 27.9% 28.5% JMOTE INDEX
Media Preshendran Odayar
and Ziyad Joosub Overweight Overweight
Food retail Sa’ad Chothia Neutral Neutral 5.4% 5.7% JFDRT INDEX
Apparel retail Sa’ad Chothia Overweight Underweight 23.3% 23.2% JGEN Index
Listed property Ridwaan Loonat Overweight Overweight 5.1% 14.4% JSAPY INDEX
Gold mining Arnold Van Graan Underweight Underweight -2.7% -2.7% JGOLD INDEX
Fixed income – ALBI Reezwana Sumad Overweight Underweight -1.8% -1.8% ALBTR Index
Source: Nedbank CIB Markets Research
Preference picks and selective bias within sectors
We have a selective bias within each sector as far as companies and specific assets are concerned. Our current conviction and sector picks are summarised in Exhibit 3.
Exhibit 3: Sector picks: despite our overall sector views, we have a selective bias within each sector
Sector Current sector recommendation Overweight names Neutral names Underweight names
Platinum group metals mining Overweight NHM, IMP, RBP, SSW RBP, AMS, THA PTM, WEZ, IVN
Telecommunications Overweight MTN, TKG, VOD
Media Overweight NPN, PRX
Food retail Neutral WHL, SHP, SPP PIK
Listed property Overweight RES, NRP, FFA, EMI, VKE,
MSP, RDF
FFB, GRT
Apparel retail Overweight TFG, PPH, MRP TRU
Gold mining Underweight SSW, ANG HAR, ANG DRD, PAN
Fixed income – government
bonds
Overweight Short-dated nominal bonds Long-dated nominal bonds
Source: Nedbank CIB Markets Research

6 APRIL 2021 PAGE 5
QUARTERLY UPDATE
Global outlook: no structural shift higher in inflation just yet
Since the 2008 GFC, monetary policy has changed dramatically. Prior to the GFC, central banks would tighten financial conditions at the first sign of consumer inflation; now it is official policy that the Fed will allow inflation to move above its target levels and target “average inflation”. The reason for this policy is, obviously, to make sure that deflationary “expectations” do not get a chance to become part of the social mood. The Fed has been buying inflation-linked bonds just to make sure the breakeven rate rises.
The market expects higher inflation over the next quarter because of base effects from the very low inflation numbers last year as the world went into lockdown. The more challenging question is not whether inflation will rise during 2Q21 but whether this higher inflation and nominal growth can be sustained beyond the second quarter.
We have been concerned about deflation over the past decade, and we do not believe it is time quite yet to change our view. The important word is “yet”, as we believe the foundation for the next inflationary cycle is being laid. The challenge is to try to figure out the route from the disinflationary forces that have been intact over the past 20 years to the much-anticipated inflation.
Lower highs since 2006
Since 2006, every high in inflation was lower both in the US and the EU, notwithstanding major expansion in the monetary base (Exhibit 4). It is now well known that all these QEs fuelled asset prices, as they compressed the bond term premium, but, unfortunately, this excess liquidity never made it into the real economy. The market expected inflation during QE1-QE3 after the GFC, after the G-20 bailout in early 2016 and then, obviously, with the latest monetary and fiscal stimulus. As 2Q21 unfolds, we would get more evidence as to whether this time would be different and excess liquidity will make it into the real economy.
There are differences between the stimulus packages from the bailouts in 2009-11 and again in 2016. The “helicopter money” in the form of COVID-19-related cheques and loan guarantee schemes did lead to an expansion in broad money, which is far more likely to create inflation that the expansion in the monetary base.
Diminishing return on debt likely to curb growth
But we remain sceptical whether the inflationary outlook will remain sustainable. Every time the QE sugar rush lost its effect over the past decade, the deflationary forces and the lack of growth returned. The single biggest reason for that, in our opinion, is the diminishing return of the extra debt added to the system, and this growing debt burden is now a major drag on economic growth.
The paradox of thrift adds to disinflation
The second reason why we believe economic growth and the inflation outlook will remain subdued comes from the “paradox of thrift”. If every entity in the economy saves, the economy will contract and disposable income will fall, making it very difficult to save yourself from this over-indebted situation. Hence, the government must become the major “dis-saver” in the economy, but this would lead to a crowding-out effect, and government spending has a very low multiplier. It is very clear from the flow
Neels Heyneke
We have been concerned about deflation over the past decade, and we do not believe it is time quite yet to change our view. The important word is “yet”, as we believe the foundation for the next inflationary cycle is being laid.
Exhibit 4: US 10y breakeven rate, inflation and EU Inflation
Source: Nedbank CIB Markets Research, Reuters, Bloomberg
6 APRIL 2021 PAGE 6
QUARTERLY UPDATE
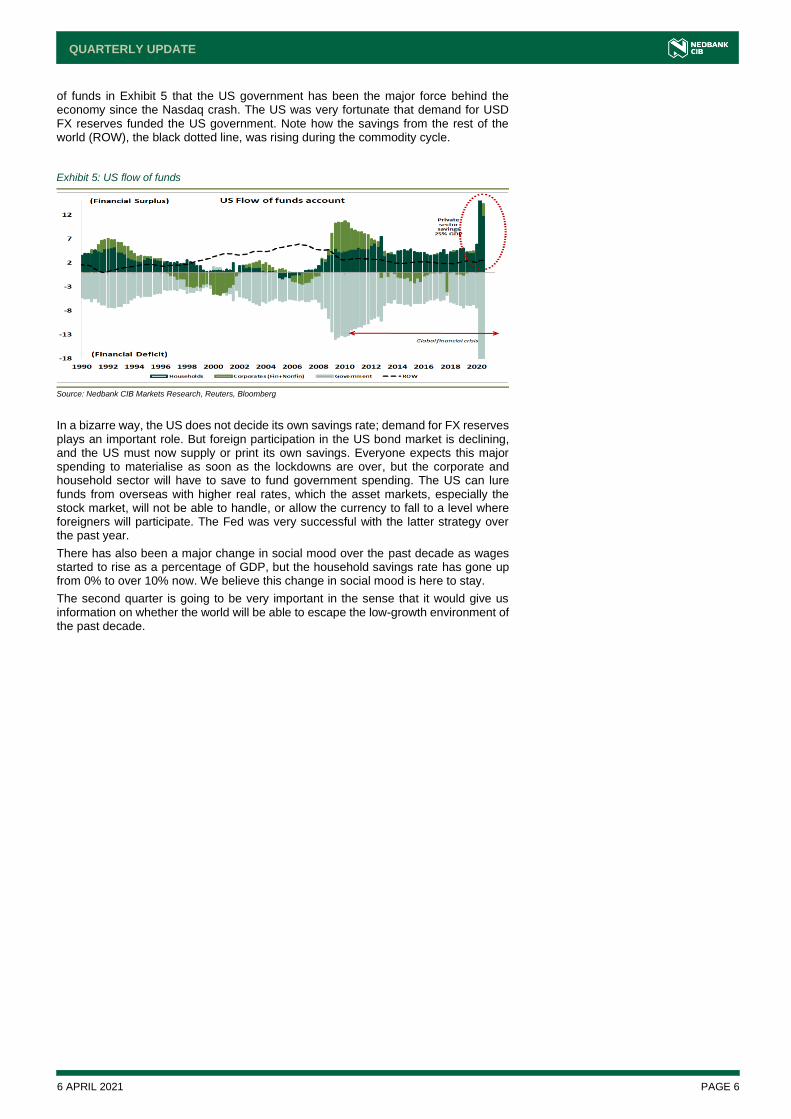
of funds in Exhibit 5 that the US government has been the major force behind the economy since the Nasdaq crash. The US was very fortunate that demand for USD FX reserves funded the US government. Note how the savings from the rest of the world (ROW), the black dotted line, was rising during the commodity cycle.
In a bizarre way, the US does not decide its own savings rate; demand for FX reserves plays an important role. But foreign participation in the US bond market is declining, and the US must now supply or print its own savings. Everyone expects this major spending to materialise as soon as the lockdowns are over, but the corporate and household sector will have to save to fund government spending. The US can lure funds from overseas with higher real rates, which the asset markets, especially the stock market, will not be able to handle, or allow the currency to fall to a level where foreigners will participate. The Fed was very successful with the latter strategy over the past year.
There has also been a major change in social mood over the past decade as wages started to rise as a percentage of GDP, but the household savings rate has gone up from 0% to over 10% now. We believe this change in social mood is here to stay.
The second quarter is going to be very important in the sense that it would give us information on whether the world will be able to escape the low-growth environment of the past decade.
Exhibit 5: US flow of funds
Source: Nedbank CIB Markets Research, Reuters, Bloomberg
6 APRIL 2021 PAGE 7
QUARTERLY UPDATE
Domestic growth – costs rising at a slower pace
We expect growth of 3.8% y/y in 2021, up from our previous expectation of 2.5% y/y
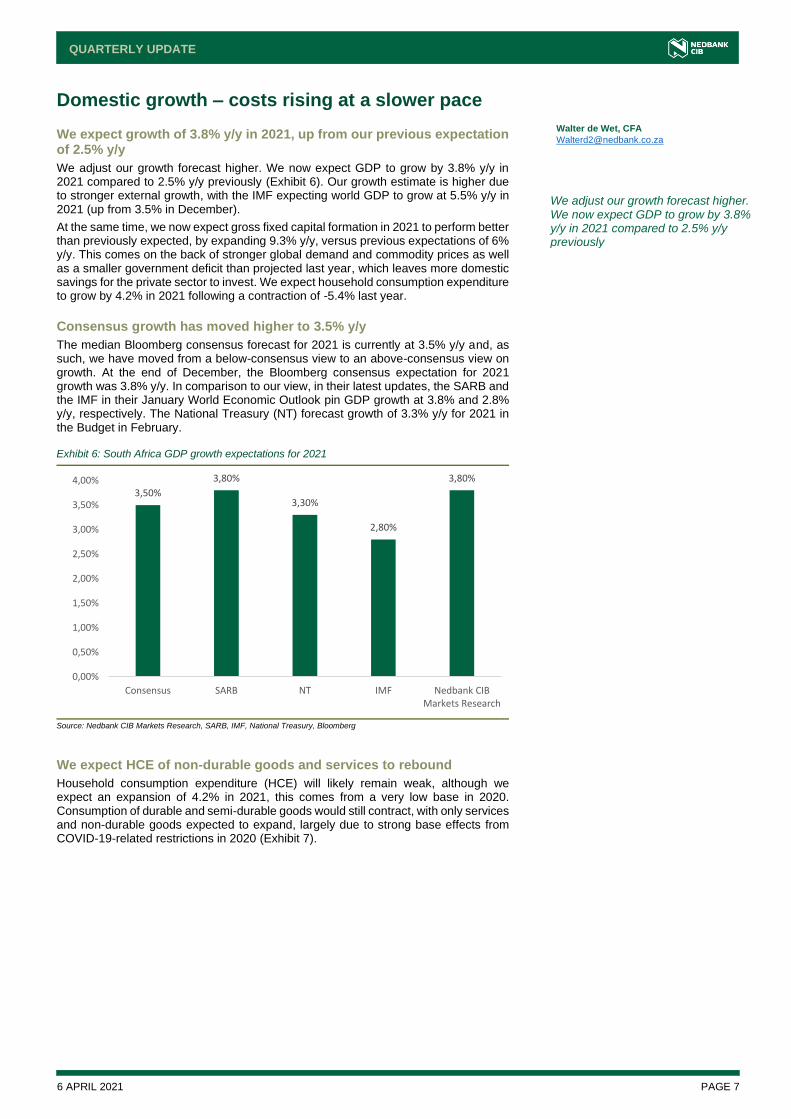
We adjust our growth forecast higher. We now expect GDP to grow by 3.8% y/y in 2021 compared to 2.5% y/y previously (Exhibit 6). Our growth estimate is higher due to stronger external growth, with the IMF expecting world GDP to grow at 5.5% y/y in 2021 (up from 3.5% in December).
At the same time, we now expect gross fixed capital formation in 2021 to perform better than previously expected, by expanding 9.3% y/y, versus previous expectations of 6% y/y. This comes on the back of stronger global demand and commodity prices as well as a smaller government deficit than projected last year, which leaves more domestic savings for the private sector to invest. We expect household consumption expenditure to grow by 4.2% in 2021 following a contraction of -5.4% last year.
Consensus growth has moved higher to 3.5% y/y
The median Bloomberg consensus forecast for 2021 is currently at 3.5% y/y and, as such, we have moved from a below-consensus view to an above-consensus view on growth. At the end of December, the Bloomberg consensus expectation for 2021 growth was 3.8% y/y. In comparison to our view, in their latest updates, the SARB and the IMF in their January World Economic Outlook pin GDP growth at 3.8% and 2.8% y/y, respectively. The National Treasury (NT) forecast growth of 3.3% y/y for 2021 in the Budget in February.
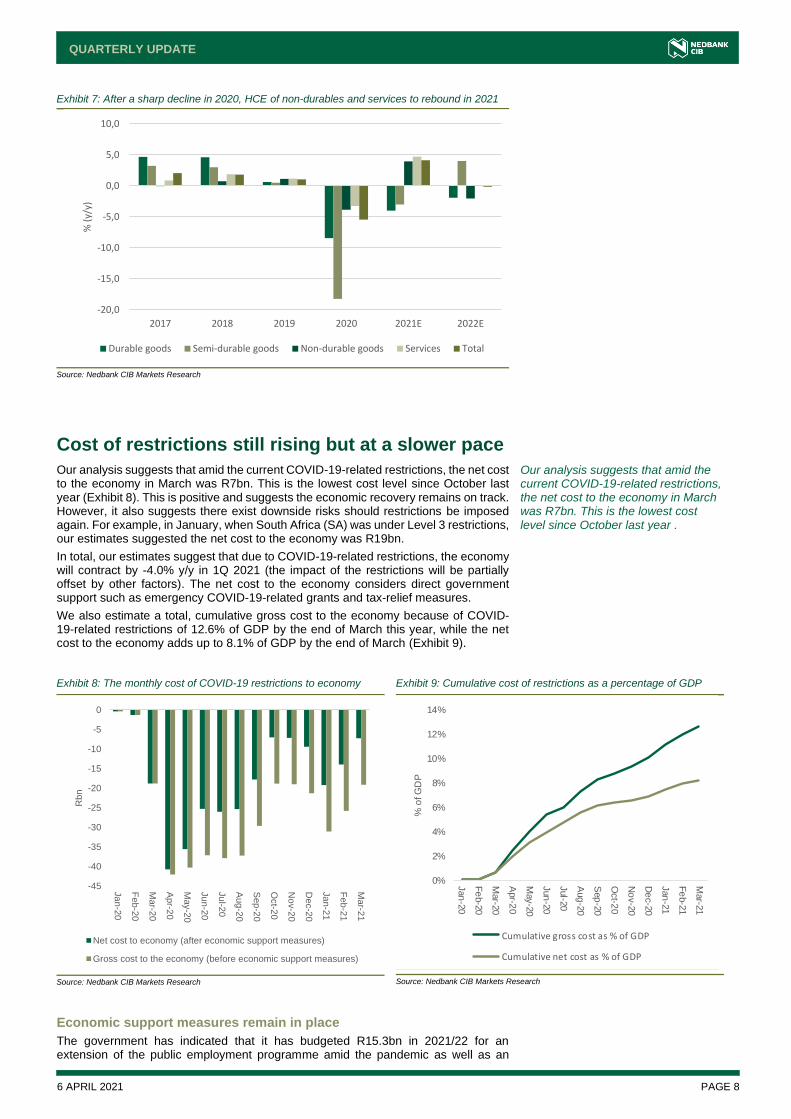
We expect HCE of non-durable goods and services to rebound
Household consumption expenditure (HCE) will likely remain weak, although we expect an expansion of 4.2% in 2021, this comes from a very low base in 2020. Consumption of durable and semi-durable goods would still contract, with only services and non-durable goods expected to expand, largely due to strong base effects from COVID-19-related restrictions in 2020 (Exhibit 7).
We adjust our growth forecast higher. We now expect GDP to grow by 3.8% y/y in 2021 compared to 2.5% y/y previously
Exhibit 6: South Africa GDP growth expectations for 2021
Source: Nedbank CIB Markets Research, SARB, IMF, National Treasury, Bloomberg
3,50%
3,80%
3,30%
2,80%
3,80%
0,00%
0,50%
1,00%
1,50%
2,00%
2,50%
3,00%
3,50%
4,00%
Consensus SARB NT IMF Nedbank CIBMarkets Research
Walter de Wet, CFA
6 APRIL 2021 PAGE 8
QUARTERLY UPDATE
Cost of restrictions still rising but at a slower pace
Our analysis suggests that amid the current COVID-19-related restrictions, the net cost to the economy in March was R7bn. This is the lowest cost level since October last year (Exhibit 8). This is positive and suggests the economic recovery remains on track. However, it also suggests there exist downside risks should restrictions be imposed again. For example, in January, when South Africa (SA) was under Level 3 restrictions, our estimates suggested the net cost to the economy was R19bn.
In total, our estimates suggest that due to COVID-19-related restrictions, the economy will contract by -4.0% y/y in 1Q 2021 (the impact of the restrictions will be partially offset by other factors). The net cost to the economy considers direct government support such as emergency COVID-19-related grants and tax-relief measures.
We also estimate a total, cumulative gross cost to the economy because of COVID-19-related restrictions of 12.6% of GDP by the end of March this year, while the net cost to the economy adds up to 8.1% of GDP by the end of March (Exhibit 9).
Economic support measures remain in place
The government has indicated that it has budgeted R15.3bn in 2021/22 for an extension of the public employment programme amid the pandemic as well as an
Exhibit 7: After a sharp decline in 2020, HCE of non-durables and services to rebound in 2021
Source: Nedbank CIB Markets Research
Our analysis suggests that amid the current COVID-19-related restrictions, the net cost to the economy in March was R7bn. This is the lowest cost level since October last year .
Exhibit 8: The monthly cost of COVID-19 restrictions to economy
Source: Nedbank CIB Markets Research
Exhibit 9: Cumulative cost of restrictions as a percentage of GDP
Source: Nedbank CIB Markets Research
-20,0
-15,0
-10,0
-5,0
0,0
5,0
10,0
2017 2018 2019 2020 2021E 2022E
% (
y/y)
Durable goods Semi-durable goods Non-durable goods Services Total
-45
-40
-35
-30
-25
-20
-15
-10
-5
0
Ja
n-2
0
Feb
-20
Mar-2
0
Apr-2
0
May-2
0
Ju
n-2
0
Ju
l-20
Aug
-20
Sep
-20
Oct-2
0
No
v-2
0
De
c-2
0
Ja
n-2
1
Feb
-21
Mar-2
1
Rbn
Net cost to economy (after economic support measures)
Gross cost to the economy (before economic support measures)
0%
2%
4%
6%
8%
10%
12%
14%
Jan
-20
Fe
b-2
0
Mar-2
0
Apr-2
0
May-2
0
Jun
-20
Jul-2
0
Aug
-20
Sep
-20
Oct-2
0
No
v-2
0
De
c-2
0
Jan
-21
Fe
b-2
1
Mar-2
1
% o
f G
DP
Cumulative gross cost as % of GDP
Cumulative net cost as % of GDP
6 APRIL 2021 PAGE 9
QUARTERLY UPDATE
extension of the COVID-19-related emergency grants. The NT has also indicated that the UIF is likely to pay out an additional R73.6bn this fiscal year via the TERF programme. As a result, we do not expect the majority of economic support measures to end in April but rather remain in place for most of the 2021/22 fiscal year. However, should the economic support measures be reduced downside risk to growth will emerge.
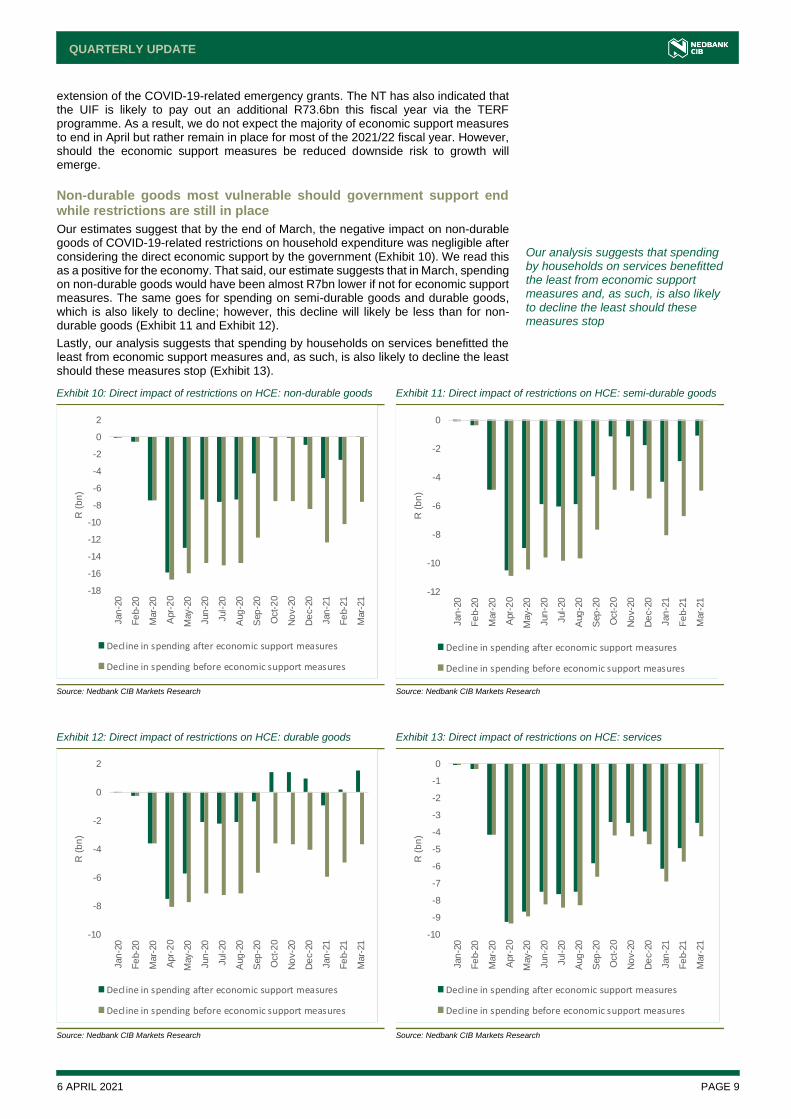
Non-durable goods most vulnerable should government support end while restrictions are still in place
Our estimates suggest that by the end of March, the negative impact on non-durable goods of COVID-19-related restrictions on household expenditure was negligible after considering the direct economic support by the government (Exhibit 10). We read this as a positive for the economy. That said, our estimate suggests that in March, spending on non-durable goods would have been almost R7bn lower if not for economic support measures. The same goes for spending on semi-durable goods and durable goods, which is also likely to decline; however, this decline will likely be less than for non-durable goods (Exhibit 11 and Exhibit 12).
Lastly, our analysis suggests that spending by households on services benefitted the least from economic support measures and, as such, is also likely to decline the least should these measures stop (Exhibit 13).
Our analysis suggests that spending by households on services benefitted the least from economic support measures and, as such, is also likely to decline the least should these measures stop
Exhibit 10: Direct impact of restrictions on HCE: non-durable goods
Source: Nedbank CIB Markets Research
Exhibit 11: Direct impact of restrictions on HCE: semi-durable goods
Source: Nedbank CIB Markets Research
Exhibit 12: Direct impact of restrictions on HCE: durable goods
Source: Nedbank CIB Markets Research
Exhibit 13: Direct impact of restrictions on HCE: services
Source: Nedbank CIB Markets Research
-18
-16
-14
-12
-10
-8
-6
-4
-2
0
2
Jan
-20
Fe
b-2
0
Mar-
20
Apr-
20
May-2
0
Jun
-20
Jul-
20
Aug
-20
Sep
-20
Oct-
20
No
v-2
0
De
c-2
0
Jan
-21
Fe
b-2
1
Mar-
21
R (
bn
)
Decline in spending after economic support measures
Decline in spending before economic support measures
-12
-10
-8
-6
-4
-2
0
Jan
-20
Fe
b-2
0
Mar-
20
Apr-
20
May-2
0
Jun
-20
Jul-
20
Aug
-20
Sep
-20
Oct-
20
No
v-2
0
De
c-2
0
Jan
-21
Fe
b-2
1
Mar-
21
R (
bn
)
Decline in spending after economic support measures
Decline in spending before economic support measures
-10
-8
-6
-4
-2
0
2
Jan
-20
Fe
b-2
0
Mar-
20
Apr-
20
May-2
0
Jun
-20
Jul-
20
Aug
-20
Sep
-20
Oct-
20
No
v-2
0
De
c-2
0
Jan
-21
Fe
b-2
1
Mar-
21
R (
bn
)
Decline in spending after economic support measures
Decline in spending before economic support measures
-10
-9
-8
-7
-6
-5
-4
-3
-2
-1
0
Jan
-20
Fe
b-2
0
Mar-
20
Apr-
20
May-2
0
Jun
-20
Jul-
20
Aug
-20
Sep
-20
Oct-
20
No
v-2
0
De
c-2
0
Jan
-21
Fe
b-2
1
Mar-
21
R (
bn
)
Decline in spending after economic support measures
Decline in spending before economic support measures

6 APRIL 2021 PAGE 10
QUARTERLY UPDATE
Monetary policy – we look for a delayed but muted hiking cycle
The SARB MPC turned decidedly hawkish in January 2021, and maintained this tone in March 2021, while keeping the repo rate flat at 3.50%. For the first time in almost a year, the MPC voted unanimously in March – we believe this signals a key shift in the MPC’s rhetoric and the end of the easing cycle. The lower inflation forecast for 2022-23 and fewer rate hikes (for 2021) signalled in the SARB’s QPM prevented a more hawkish stance by the SARB. The fact that the SARB now sees annual average inflation at or below its 4.5% target until 2023 could allow it to delay the hiking cycle into 2022, given the risks to the growth outlook over the medium term.
SARB maintains hawkish tone, but QPM hike profile marginally lower for 2021
The SARB MPC maintained its hawkish tone, and this was substantiated by a better economic outlook (and a smaller output gap), a faster global economic recovery and a general improvement in financial market conditions. However, it remains cognisant of the impact that the country’s electricity supply constraints will have on growth, along with weak public and private investment levels. New waves of COVID-19 infections and the uncertain nature of SA’s vaccination rollout programme pose additional risks to the growth outlook. The SARB’s inflation forecast was reduced for 2022 and 2023, which resulted in the QPM pushing out its forecast for hikes to the repo rate (albeit fractionally). The QPM now signals two hikes of 25bps each in 2021 (previously 2.44 hikes of 25bps each), but 3.8 and 4.5 hikes of the same magnitude for 2022 and 2023 (previously 3.4 and 3.9), respectively. In sum, the QPM reflects 10.3 hikes of 25bps each over the forecast period (compared to 9.72 in January).
In the absence of a sustained CPI breach above 4.5%, the SARB would be loath to begin normalising interest rates prematurely, as this risk undoing the relief it has provided to the economy, which would ultimately hurt growth further.
Exhibit 14: Real policy rates across the world
Source: Bloomberg, Nedbank CIB Markets Research
The SARB has been tolerant of negative real rates in the past The current real repo rate is 0.6%, while the expected repo rate for 2021 is -0.4% (based on our CPI forecast of 3.9%). SA has one of the highest real policy rates in the world (see Exhibit above), while it maintains its top spot with the highest real yield (10y) in the world. Monetary policy, therefore, remains supportive of the currency and inflation expectations, in our view. In 2008, despite the real repo rate declining to -1.69%, the SARB maintained its commitment to ease policy rates in order to safeguard economic growth after the crisis. From 2012 to 2013, the real repo rate averaged -0.56%, while the nominal repo rate remained broadly flat during this period
4,6
3,4
2,41,71,7
0,60,50,40,20,20,20,20,10,0
-0,2-0,3-0,3-0,5-0,5-0,6-0,6-0,6-0,8-0,8-0,9-1,0-1,0-1,2-1,2-1,2-1,3-1,4-1,5-1,8-1,8
-2,3-2,4-2,5-2,7-2,7-3,3
-5
-3
-1
1
3
5
7
Ch
ina
Tu
rke
y
Ind
on
es
ia
Th
ail
an
d
Mala
ys
ia
So
uth
Afr
ica
Ja
pa
n
Ire
lan
d
Mex
ico
Icela
nd
Ho
ng
Ko
ng
Co
lom
bia
Isra
el
Sp
ain
Taiw
an
Sw
itze
rla
nd
UK
Belg
ium
Po
rtu
ga
l
Fra
nc
e
Italy
Sin
ga
po
re
Au
str
ali
a
Can
ad
a
Fin
lan
d
Den
ma
rk
Ind
ia
New
Ze
ala
nd
Ru
ss
ia
Au
str
ia
Ge
rman
y
Sw
ed
en
US
Neth
erl
an
ds
Czec
h
Po
lan
d
Ch
ile
Bra
zil
Hu
ng
ary
Ph
ilip
pin
e
No
rwa
y
'Spot' real policy rate: nominal interest rate less inflation (current)
Reezwana Sumad
The QPM now signals two hikes of 25bps each in 2021 (previously 2.44 hikes of 25bps each), but 3.8 and 4.5 hikes of the same magnitude for 2022 and 2023 (previously 3.4 and 3.9), respectively.
6 APRIL 2021 PAGE 11
QUARTERLY UPDATE
as a result of heightened uncertainty as to when the Fed would begin hiking interest rates. The uncertain nature of the current pandemic warrants a similar response, in our view, until we are more certain about SA’s economic recovery. While several EM peers have begun to hike interest rates in 2021 (Brazil, Turkey, Russia, etc.), they do so out of necessity because inflation has risen well above their inflation targets. Barring a surprise and a sustained increase in inflation to 5%, we believe the SARB will keep the repo rate flat at 3.50% in 2021 and begin a gradual hiking cycle in 2022.
We expect inflation of 3.9% in 2021 and 4.5% in 2022
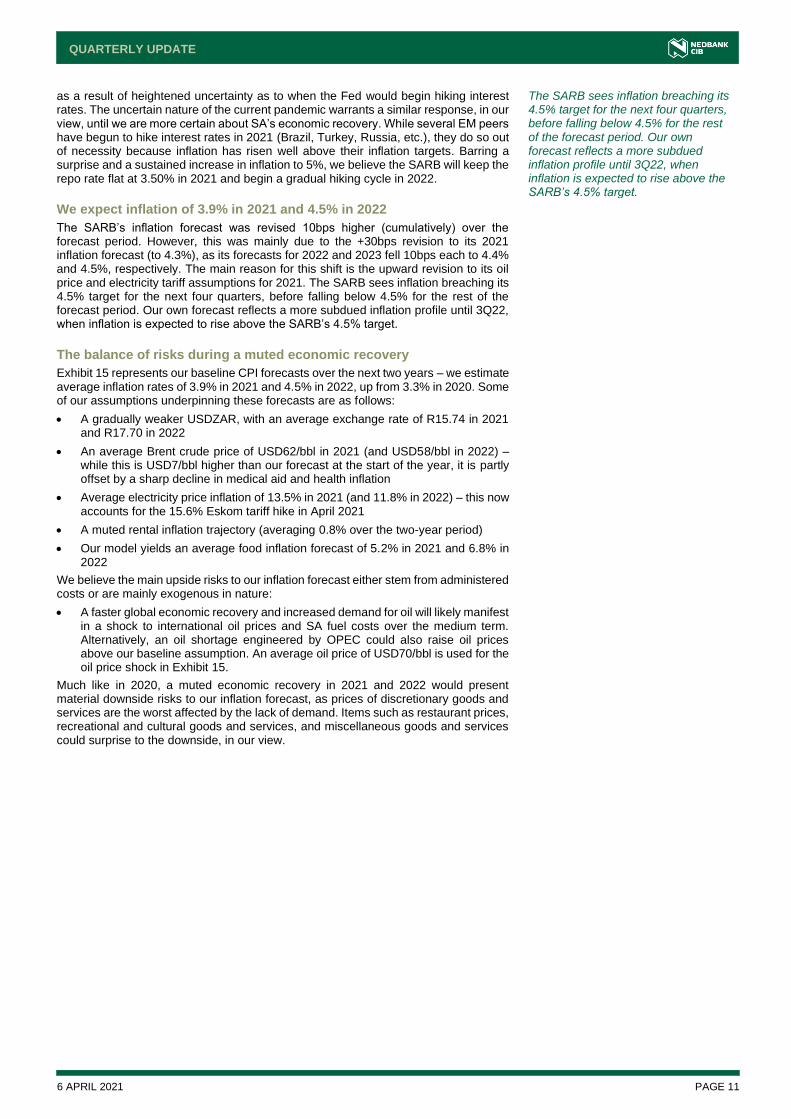
The SARB’s inflation forecast was revised 10bps higher (cumulatively) over the forecast period. However, this was mainly due to the +30bps revision to its 2021 inflation forecast (to 4.3%), as its forecasts for 2022 and 2023 fell 10bps each to 4.4% and 4.5%, respectively. The main reason for this shift is the upward revision to its oil price and electricity tariff assumptions for 2021. The SARB sees inflation breaching its 4.5% target for the next four quarters, before falling below 4.5% for the rest of the forecast period. Our own forecast reflects a more subdued inflation profile until 3Q22, when inflation is expected to rise above the SARB’s 4.5% target.
The balance of risks during a muted economic recovery
Exhibit 15 represents our baseline CPI forecasts over the next two years – we estimate average inflation rates of 3.9% in 2021 and 4.5% in 2022, up from 3.3% in 2020. Some of our assumptions underpinning these forecasts are as follows:
• A gradually weaker USDZAR, with an average exchange rate of R15.74 in 2021 and R17.70 in 2022
• An average Brent crude price of USD62/bbl in 2021 (and USD58/bbl in 2022) –while this is USD7/bbl higher than our forecast at the start of the year, it is partly offset by a sharp decline in medical aid and health inflation
• Average electricity price inflation of 13.5% in 2021 (and 11.8% in 2022) – this now accounts for the 15.6% Eskom tariff hike in April 2021
• A muted rental inflation trajectory (averaging 0.8% over the two-year period)
• Our model yields an average food inflation forecast of 5.2% in 2021 and 6.8% in 2022
We believe the main upside risks to our inflation forecast either stem from administered costs or are mainly exogenous in nature:
• A faster global economic recovery and increased demand for oil will likely manifest in a shock to international oil prices and SA fuel costs over the medium term. Alternatively, an oil shortage engineered by OPEC could also raise oil prices above our baseline assumption. An average oil price of USD70/bbl is used for the oil price shock in Exhibit 15.
Much like in 2020, a muted economic recovery in 2021 and 2022 would present material downside risks to our inflation forecast, as prices of discretionary goods and services are the worst affected by the lack of demand. Items such as restaurant prices, recreational and cultural goods and services, and miscellaneous goods and services could surprise to the downside, in our view.
The SARB sees inflation breaching its 4.5% target for the next four quarters, before falling below 4.5% for the rest of the forecast period. Our own forecast reflects a more subdued inflation profile until 3Q22, when inflation is expected to rise above the SARB’s 4.5% target.
6 APRIL 2021 PAGE 12
QUARTERLY UPDATE
Exhibit 15: Baseline CPI forecast and key upside and downside shocks
Source: Nedbank CIB Markets Research
3,203,01
4,19
3,86
4,574,46
4,18
4,684,57
2,00
2,50
3,00
3,50
4,00
4,50
5,00
5,50
4Q20a 1Q21f 2Q21f 3Q21f 4Q21f 1Q22f 2Q22f 3Q22f 4Q22f
Nedbank CIB baseline Oil_shock Discretionary_shock
6 APRIL 2021 PAGE 13
QUARTERLY UPDATE
Fiscal policy bears some fruit, but we await the harvest
Debt sustainability and financing the budget
• A combination of better global growth, local consumption and wage growth, and higher tax receipts from the mining sector boosts main budget revenue from 2020 to 2024 by R297bn compared to the 2020 MTBPS, along with real GDP growth. This, combined with new research detailing the negative impact of tax increases in a weak economy, prompted the government to cancel the implementation of its previously announced tax increases over the next four years.
• The government makes better spending decisions – consolidated expenditure has been revised lower by a cumulative R34bn until 2023/24: a material reduction to expenditure comes from the wage bill (-R144bn over the MTEF) and identifying and cutting out unnecessary government-funded programmes (-R163bn reduction over the MTEF). The fiscal framework reduces growth in the wage bill and the share of spending on wages, while sustaining real spending increases on capital payments, specifically for buildings and other fixed structures.
– The main budget deficit as a percentage of GDP is now projected at 6.5% for 2023/24 (vs 7.3% in the MTBPS). The deficit for 2021/22 is expected at 9% compared to 10.1% previously, while the 2022/23 forecast is 7.4% relative to the MTBPS estimate of 8.7%.
– While we forecast a primary budget deficit of 0.4% of GDP by 2023/24, implementation risk in the budget to achieve this outcome remains high.
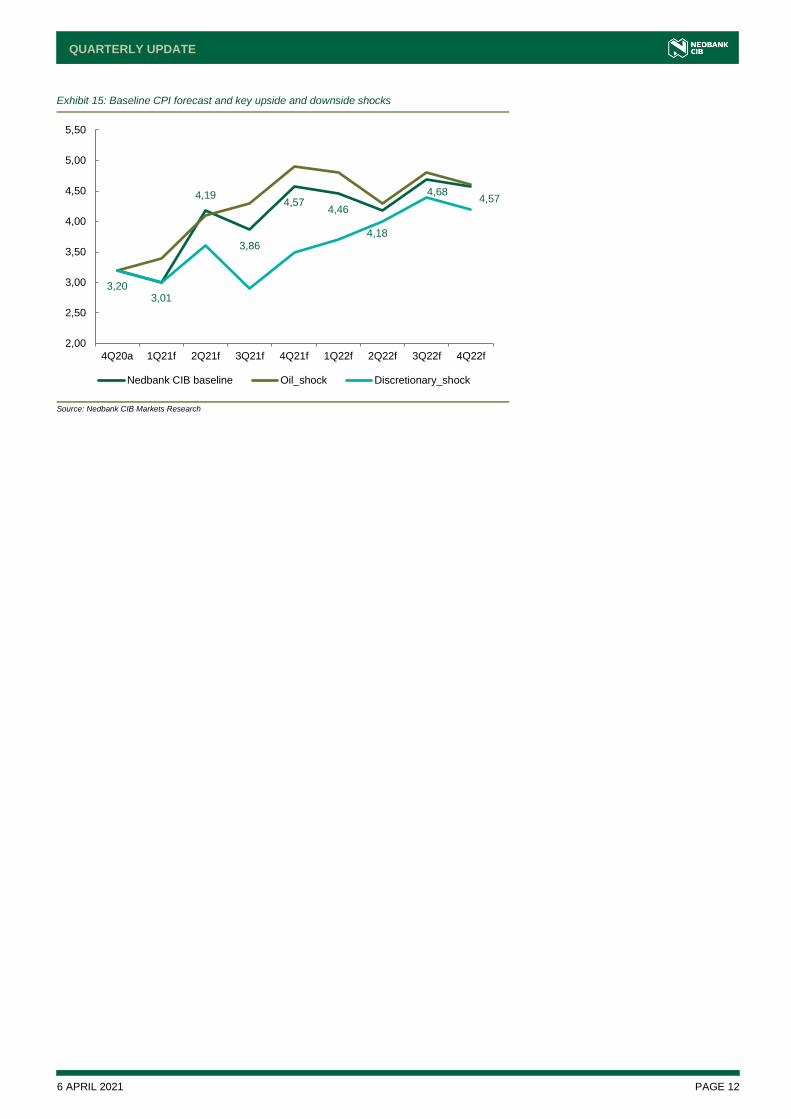
– The newly announced pace of weekly bond issuance (of R6bn/week) will be sufficient to finance a budget deficit of R506bn in 2021/22, which is R23bn higher than what is actually needed to fund the deficit (of R483bn in the 2021 Budget). However, if the NT is unable to rein in expenditure as promised, the financing requirement would eventually rise.
Exhibit 16: SA’s total debt repayments: capital plus interest
Source: Bloomberg, Nedbank CIB Markets Research
Implementation risks remain high
While efforts to curb the budget deficit have not gone unnoticed, we remain concerned about the implementation risks inherent in the baseline expenditure reduction, as well as about whether the wage bill cuts will eventually materialise, given legal contestation expected by trade unions. Tax relief for individuals is still a concession that the government had made to limit the damage to real GDP growth, in our view. Overall, if the government is able to implement and achieve the desired spending cuts over the MTEF, it would signal a significant shift in fiscal policy towards a more prudent fiscal stance that may appease rating agencies and the markets in the near term. We await the implementation of these projected spending cuts, but there is a high risk of disappointment given the history of how public-sector wage negotiations have panned out in the past, when unions were granted CPI-related increases. If, on the other hand,
246
296
447
231
333
580
182
257227
451
248
306
255
110
275
193
266
162
71
195160
52 52
226
37
138
56
333
51
112
-
100
200
300
400
500
600
2021
2022
2023
2024
2025
2026
2027
2028
2029
2030
2031
2032
2033
2034
2035
2036
2037
2038
2039
2040
2041
2042
2043
2044
2045
2046
2047
2048
2049
2050
Rb
n
SA's annual debt repayments
Nominals ILBs SOAF Total
Reezwana Sumad
While efforts to curb the budget deficit have not gone unnoticed, we remain concerned about the implementation risks inherent in the baseline expenditure reduction, as well as about whether the wage bill cuts will eventually materialise, given legal contestation expected by trade unions.

6 APRIL 2021 PAGE 14
QUARTERLY UPDATE
the government falls short of delivering a leaner expenditure profile over the MTEF, this threatens to derail debt projections, and raise the budget deficit over the MTEF. SA can ill afford such a development, particularly as the debt burden is unsustainably high already (Exhibit 17).
Exhibit 17: Debt-to-GDP ratio at risk of disappointing
Source: National Treasury, Nedbank CIB Markets Research
Exhibit 18: The government’s financing requirement (current = updated to include issuance reduction)
Rbn
2019/20a
Final
2020/21a
2021 Budget
2021/22e
2020 Budget 2021 Budget Current NCIB
Nominal bonds: 273.7 445.9 290.2 326.8 345.6 351.2
Issuance for the FYTD/year 204.4 230.4 233.9
Total non-comps 69.3 115.2 117.0
ILBs: 43.1 72.6 47.2 53.2 57.6 57.2
Total long-term market loans 316.8 518.5 337.4 380.0 403.2 408.4
Short-term loans and T-bills 36.1 97.1 48.0 9.0 9.0 9.0
Foreign loans 76.1 107.1 44.8 46.3 46.3 46.3
Extra issuance carried forward
Cash -1.8 -52.4 -0.3 112.6 112.6 112.6
TOTAL FINANCING
REQUIREMENT 427.3 670.3 429.9 547.9 571.1 576.3
(Less) redemptions -70.7 -66.9 -63.5 -65.3 -65.3 -65.3
Main budget deficit 356.6 603.4 366.4 482.6 505.8 511.0
FYTD = Fiscal year to date Source: National Treasury, Nedbank CIB Markets Research
45
50
55
60
65
70
75
80
85
90
95
%
Gross debt to GDP forecasts - evolution (% of GDP)
2017 Budget 2017 MTBPS 2018 Budget 2018 MTBPS
2019 Budget 2019 MTBPS 2020 Budget 2020 MTBPS
2021 Budget Nedbank CIB Actual
6 APRIL 2021 PAGE 15
QUARTERLY UPDATE
Credit conditions are firmly negative, but borrowing window is accommodative
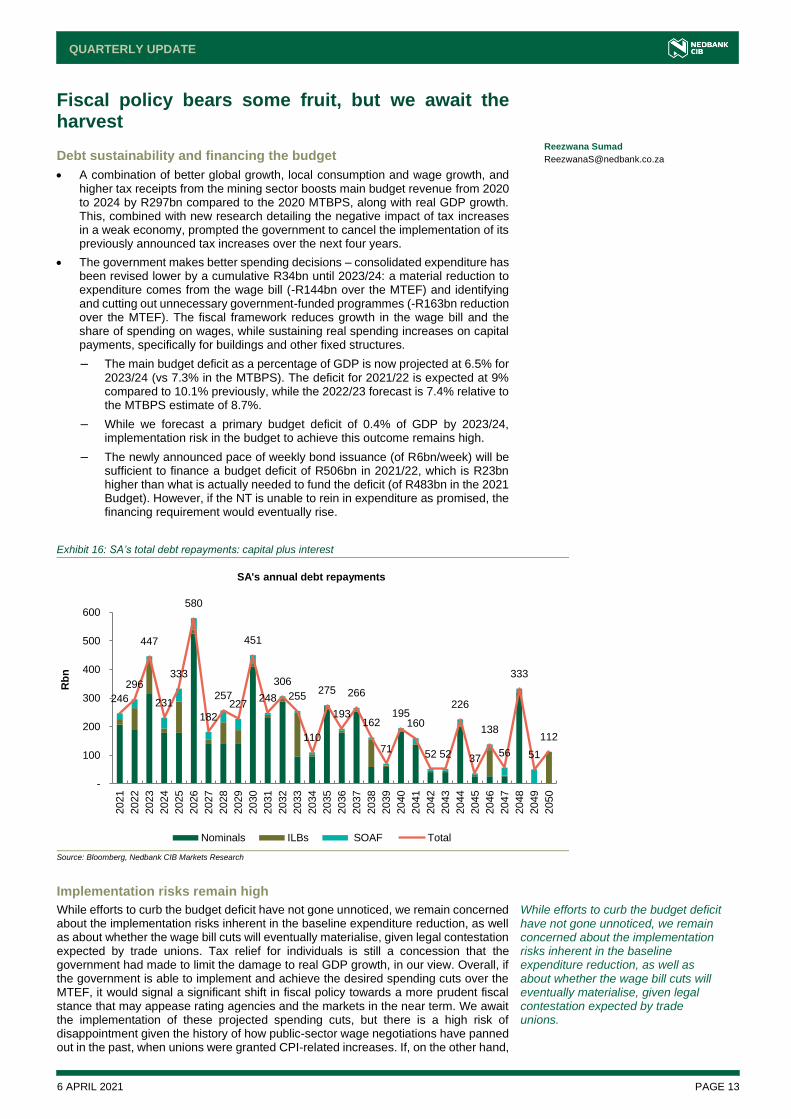
Rating agencies are set to review SA in May 2021 – we expect no rating changes
Exhibit 19: SA sovereign rating history (hard-currency ratings)
Source: Fitch, Moody's, S&P, Nedbank CIB Markets Research
SA’s credit conditions are largely defined by the sovereign’s credit standing, which has been on a five-notch downward trajectory since September 2012 from peak rating levels (BBB+, A3, BBB+ from Fitch, Moody’s and S&P, respectively).
In 2020, both Fitch and Moody’s took negative rating actions on the SA sovereign, lowering their respective ratings by two notches over the calendar year to “BB-” and “Ba2”, respectively. Both agencies have maintained a “Negative” outlook. S&P affirmed its “BB/Stable” rating on SA after downgrading it in April 2020. We think S&P does not yet see SA as a “B+” credit (hence the “Stable” outlook), unlike Fitch. We think the NT may have done enough to stave off a downgrade in 1H21, but this could still happen towards the end of this fiscal year if the implementation of the 2021 National Budget progresses too slowly or proceeds worse than anticipated (regarding growth and fiscal stability trends).
Debt affordability and the primary balance evolution will be core indicators to watch at the 2021 MTBPS. SA’s debt-service costs are higher than similarly rated peers’ and if the trend does not reverse (on lower borrowing requirements) or if it should unexpectedly peak above 25% of revenue, we think this could become a rating-downgrade trigger. The economic recovery remains tepid and the reform measures uncertain. The risks of slippage still outweigh stabilisation over the medium term.
From an ESG perspective, Moody’s is especially flagging heightened social risks in SA, which could weigh materially on its credit quality in the near term. This is in context of SA’s exceedingly high levels of poverty and wide income inequality. An uneven post-pandemic recovery could marginalise economically vulnerable groups even further, giving rise to social tensions and policy pressures on the government that the fiscus can ill afford to sustain.
A temporary pause in fiscal pressure and policy rate action – an issuance window opens up for corporate bond issuers
We think the combination of improved economic growth forecasts (relative to what was published at the 2020 MTBPS), the material reduction in the sovereign’s nominal and inflation-linked bond issuances and the still-low repo rate all provide a conducive backdrop for top-quality corporate credit names to test the market and refinance outstanding bonds. These conditions also favour floating-rate notes, which will compensate investors should a hiking cycle ensue over the medium run or funding rates tick up.
Overall, we see a normalisation in asset swap spreads over the next three to six months towards pre-pandemic levels, which should make the corporate bond credit
Jones Gondo
Nthulleng Mphahlele
SA’s credit conditions are largely defined by the sovereign’s credit standing, which has been on a five-notch downward trajectory since September 2012
Debt affordability and the primary balance evolution will be core indicators to watch at the 2021 MTBPS
From an ESG perspective, Moody’s is especially flagging heightened social risks in SA, which could weigh materially on its credit quality in the near term
Overall, we see a normalisation in asset swap spreads over the next three to six months towards pre-pandemic levels, which should make the corporate bond credit spreads (<5yr tenor) more appealing relative-value plays for credit investors
6 APRIL 2021 PAGE 16
QUARTERLY UPDATE
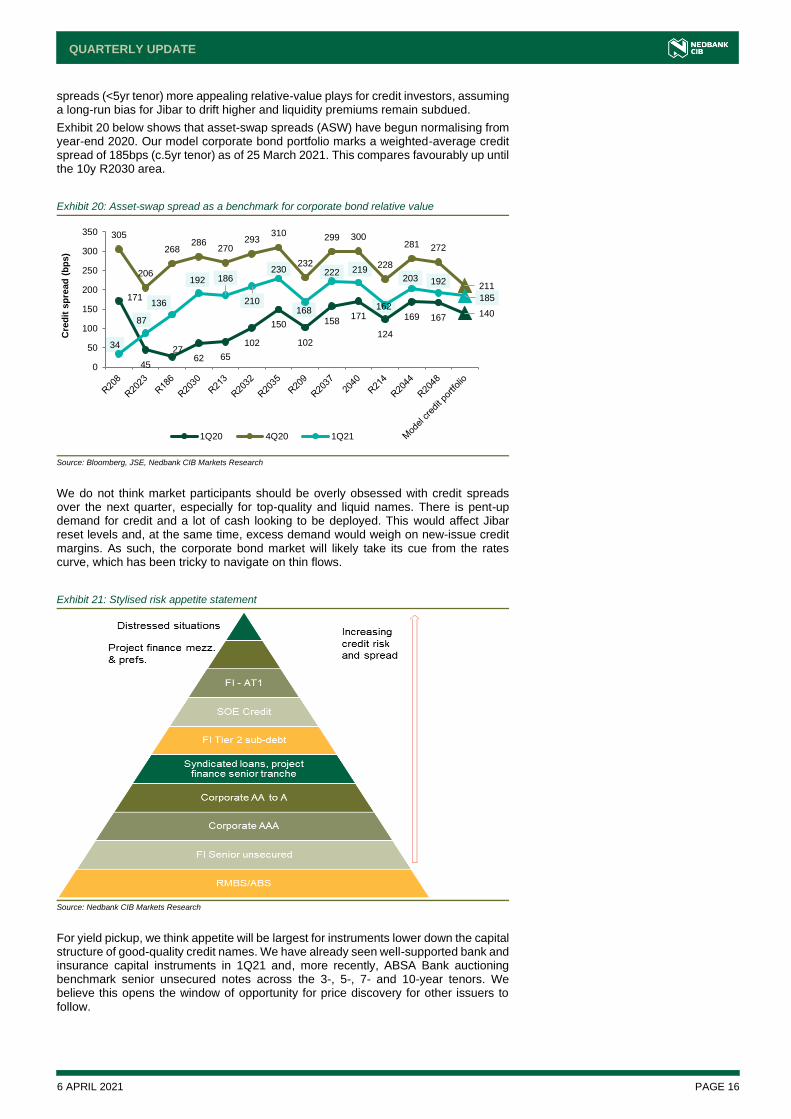
spreads (<5yr tenor) more appealing relative-value plays for credit investors, assuming a long-run bias for Jibar to drift higher and liquidity premiums remain subdued.
Exhibit 20 below shows that asset-swap spreads (ASW) have begun normalising from year-end 2020. Our model corporate bond portfolio marks a weighted-average credit spread of 185bps (c.5yr tenor) as of 25 March 2021. This compares favourably up until the 10y R2030 area.
Exhibit 20: Asset-swap spread as a benchmark for corporate bond relative value
Source: Bloomberg, JSE, Nedbank CIB Markets Research
We do not think market participants should be overly obsessed with credit spreads over the next quarter, especially for top-quality and liquid names. There is pent-up demand for credit and a lot of cash looking to be deployed. This would affect Jibar reset levels and, at the same time, excess demand would weigh on new-issue credit margins. As such, the corporate bond market will likely take its cue from the rates curve, which has been tricky to navigate on thin flows.
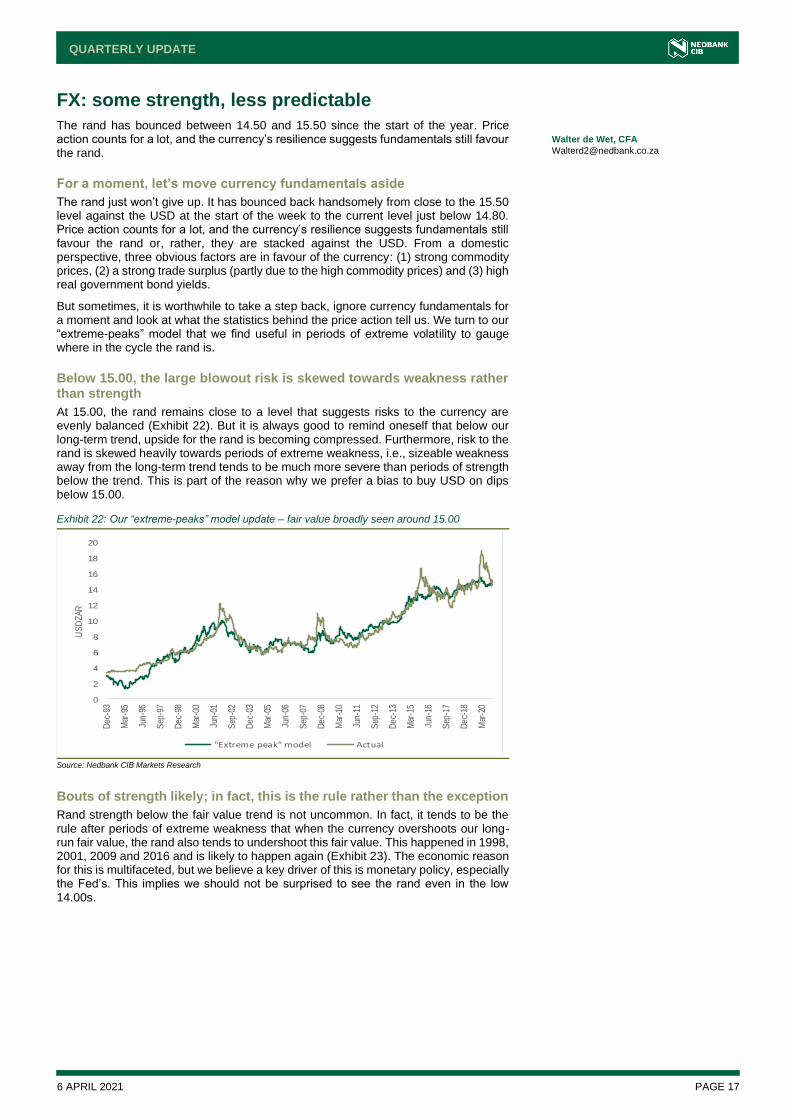
Exhibit 21: Stylised risk appetite statement
Source: Nedbank CIB Markets Research
For yield pickup, we think appetite will be largest for instruments lower down the capital structure of good-quality credit names. We have already seen well-supported bank and insurance capital instruments in 1Q21 and, more recently, ABSA Bank auctioning benchmark senior unsecured notes across the 3-, 5-, 7- and 10-year tenors. We believe this opens the window of opportunity for price discovery for other issuers to follow.
171
45
2762 65
102
150
102
158171
124
169 167 140
305
206
268286
270293
310
232
299 300
228
281 272
211
34
87
136
192 186
210
230
168
222 219
162
203 192
185
0
50
100
150
200
250
300
350
Cre
dit
sp
read
(b
ps)
1Q20 4Q20 1Q21
6 APRIL 2021 PAGE 17
QUARTERLY UPDATE
FX: some strength, less predictable
The rand has bounced between 14.50 and 15.50 since the start of the year. Price action counts for a lot, and the currency’s resilience suggests fundamentals still favour the rand.
For a moment, let’s move currency fundamentals aside
The rand just won’t give up. It has bounced back handsomely from close to the 15.50 level against the USD at the start of the week to the current level just below 14.80. Price action counts for a lot, and the currency’s resilience suggests fundamentals still favour the rand or, rather, they are stacked against the USD. From a domestic perspective, three obvious factors are in favour of the currency: (1) strong commodity prices, (2) a strong trade surplus (partly due to the high commodity prices) and (3) high real government bond yields.
But sometimes, it is worthwhile to take a step back, ignore currency fundamentals for a moment and look at what the statistics behind the price action tell us. We turn to our “extreme-peaks” model that we find useful in periods of extreme volatility to gauge where in the cycle the rand is.
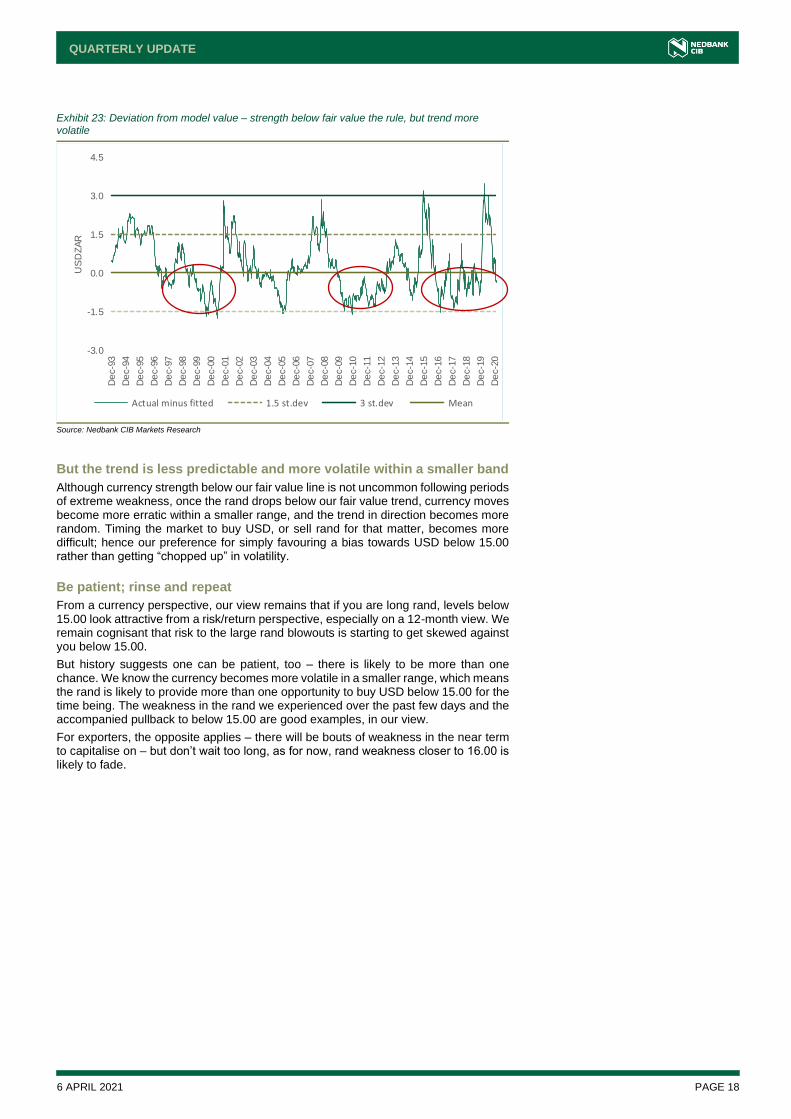
Below 15.00, the large blowout risk is skewed towards weakness rather than strength
At 15.00, the rand remains close to a level that suggests risks to the currency are evenly balanced (Exhibit 22). But it is always good to remind oneself that below our long-term trend, upside for the rand is becoming compressed. Furthermore, risk to the rand is skewed heavily towards periods of extreme weakness, i.e., sizeable weakness away from the long-term trend tends to be much more severe than periods of strength below the trend. This is part of the reason why we prefer a bias to buy USD on dips below 15.00.
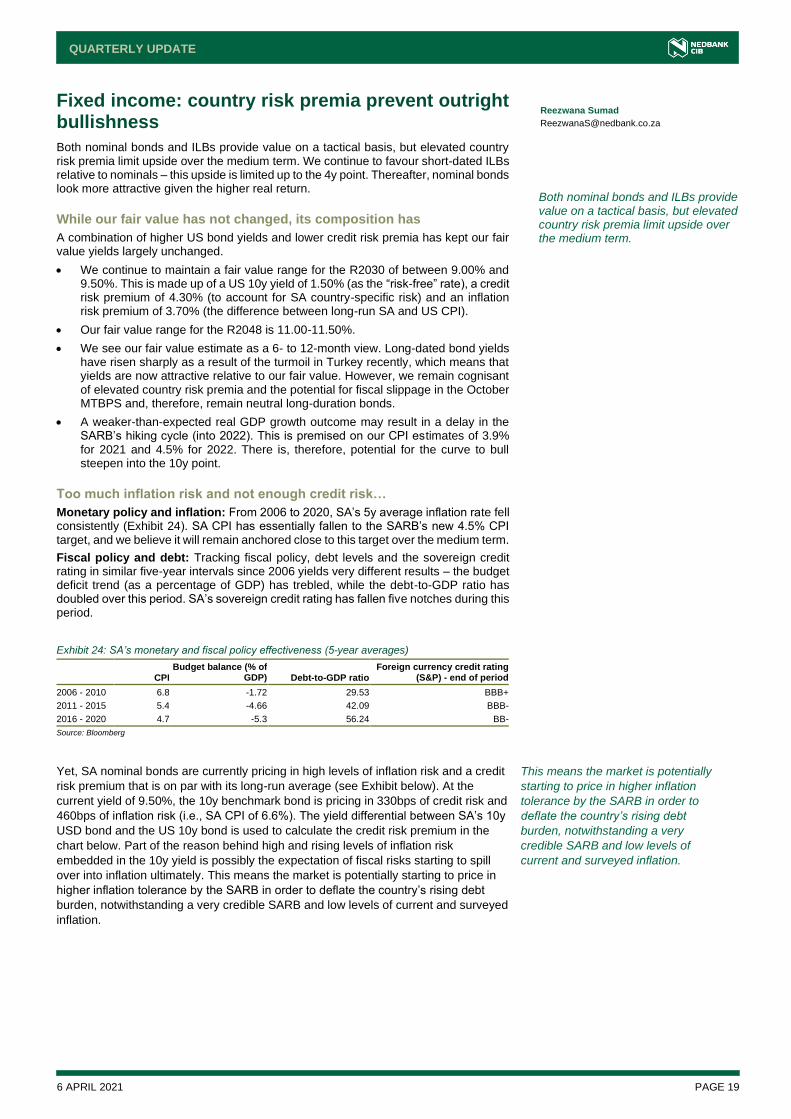
Bouts of strength likely; in fact, this is the rule rather than the exception
Rand strength below the fair value trend is not uncommon. In fact, it tends to be the rule after periods of extreme weakness that when the currency overshoots our long-run fair value, the rand also tends to undershoot this fair value. This happened in 1998, 2001, 2009 and 2016 and is likely to happen again (Exhibit 23). The economic reason for this is multifaceted, but we believe a key driver of this is monetary policy, especially the Fed’s. This implies we should not be surprised to see the rand even in the low 14.00s.
Walter de Wet, CFA
Exhibit 22: Our “extreme-peaks” model update – fair value broadly seen around 15.00
Source: Nedbank CIB Markets Research
0
2
4
6
8
10
12
14
16
18
20
De
c-93
Mar
-95
Jun
-96
Sep
-97
De
c-98
Mar
-00
Jun
-01
Sep
-02
De
c-03
Mar
-05
Jun
-06
Sep
-07
De
c-08
Mar
-10
Jun
-11
Sep
-12
De
c-13
Mar
-15
Jun
-16
Sep
-17
De
c-18
Mar
-20
US
DZ
AR
"Extreme peak" model Actual
6 APRIL 2021 PAGE 18
QUARTERLY UPDATE
But the trend is less predictable and more volatile within a smaller band
Although currency strength below our fair value line is not uncommon following periods of extreme weakness, once the rand drops below our fair value trend, currency moves become more erratic within a smaller range, and the trend in direction becomes more random. Timing the market to buy USD, or sell rand for that matter, becomes more difficult; hence our preference for simply favouring a bias towards USD below 15.00 rather than getting “chopped up” in volatility.
Be patient; rinse and repeat
From a currency perspective, our view remains that if you are long rand, levels below 15.00 look attractive from a risk/return perspective, especially on a 12-month view. We remain cognisant that risk to the large rand blowouts is starting to get skewed against you below 15.00.
But history suggests one can be patient, too – there is likely to be more than one chance. We know the currency becomes more volatile in a smaller range, which means the rand is likely to provide more than one opportunity to buy USD below 15.00 for the time being. The weakness in the rand we experienced over the past few days and the accompanied pullback to below 15.00 are good examples, in our view.
For exporters, the opposite applies – there will be bouts of weakness in the near term to capitalise on – but don’t wait too long, as for now, rand weakness closer to 16.00 is likely to fade.
Exhibit 23: Deviation from model value – strength below fair value the rule, but trend more volatile
Source: Nedbank CIB Markets Research
-3.0
-1.5
0.0
1.5
3.0
4.5
De
c-9
3
De
c-9
4
De
c-9
5
De
c-9
6
De
c-9
7
De
c-9
8
De
c-9
9
De
c-0
0
De
c-0
1
De
c-0
2
De
c-0
3
De
c-0
4
De
c-0
5
De
c-0
6
De
c-0
7
De
c-0
8
De
c-0
9
De
c-1
0
De
c-1
1
De
c-1
2
De
c-1
3
De
c-1
4
De
c-1
5
De
c-1
6
De
c-1
7
De
c-1
8
De
c-1
9
De
c-2
0
US
DZ
AR
Actual minus fitted 1.5 st.dev 3 st.dev Mean
6 APRIL 2021 PAGE 19
QUARTERLY UPDATE
Fixed income: country risk premia prevent outright bullishness
Both nominal bonds and ILBs provide value on a tactical basis, but elevated country risk premia limit upside over the medium term. We continue to favour short-dated ILBs relative to nominals – this upside is limited up to the 4y point. Thereafter, nominal bonds look more attractive given the higher real return.
While our fair value has not changed, its composition has
A combination of higher US bond yields and lower credit risk premia has kept our fair value yields largely unchanged.
• We continue to maintain a fair value range for the R2030 of between 9.00% and 9.50%. This is made up of a US 10y yield of 1.50% (as the “risk-free” rate), a credit risk premium of 4.30% (to account for SA country-specific risk) and an inflation risk premium of 3.70% (the difference between long-run SA and US CPI).
• Our fair value range for the R2048 is 11.00-11.50%.
• We see our fair value estimate as a 6- to 12-month view. Long-dated bond yields have risen sharply as a result of the turmoil in Turkey recently, which means that yields are now attractive relative to our fair value. However, we remain cognisant of elevated country risk premia and the potential for fiscal slippage in the October MTBPS and, therefore, remain neutral long-duration bonds.
• A weaker-than-expected real GDP growth outcome may result in a delay in the SARB’s hiking cycle (into 2022). This is premised on our CPI estimates of 3.9% for 2021 and 4.5% for 2022. There is, therefore, potential for the curve to bull steepen into the 10y point.
Too much inflation risk and not enough credit risk…
Monetary policy and inflation: From 2006 to 2020, SA’s 5y average inflation rate fell consistently (Exhibit 24). SA CPI has essentially fallen to the SARB’s new 4.5% CPI target, and we believe it will remain anchored close to this target over the medium term.
Fiscal policy and debt: Tracking fiscal policy, debt levels and the sovereign credit rating in similar five-year intervals since 2006 yields very different results – the budget deficit trend (as a percentage of GDP) has trebled, while the debt-to-GDP ratio has doubled over this period. SA’s sovereign credit rating has fallen five notches during this period.
Exhibit 24: SA’s monetary and fiscal policy effectiveness (5-year averages)
CPI Budget balance (% of
GDP) Debt-to-GDP ratio Foreign currency credit rating
(S&P) - end of period
2006 - 2010 6.8 -1.72 29.53 BBB+
2011 - 2015 5.4 -4.66 42.09 BBB-
2016 - 2020 4.7 -5.3 56.24 BB-
Source: Bloomberg
Yet, SA nominal bonds are currently pricing in high levels of inflation risk and a credit
risk premium that is on par with its long-run average (see Exhibit below). At the
current yield of 9.50%, the 10y benchmark bond is pricing in 330bps of credit risk and
460bps of inflation risk (i.e., SA CPI of 6.6%). The yield differential between SA’s 10y
USD bond and the US 10y bond is used to calculate the credit risk premium in the
chart below. Part of the reason behind high and rising levels of inflation risk
embedded in the 10y yield is possibly the expectation of fiscal risks starting to spill
over into inflation ultimately. This means the market is potentially starting to price in
higher inflation tolerance by the SARB in order to deflate the country’s rising debt
burden, notwithstanding a very credible SARB and low levels of current and surveyed
inflation.
Reezwana Sumad
Both nominal bonds and ILBs provide value on a tactical basis, but elevated country risk premia limit upside over the medium term.
This means the market is potentially
starting to price in higher inflation
tolerance by the SARB in order to
deflate the country’s rising debt
burden, notwithstanding a very
credible SARB and low levels of
current and surveyed inflation.
6 APRIL 2021 PAGE 20
QUARTERLY UPDATE
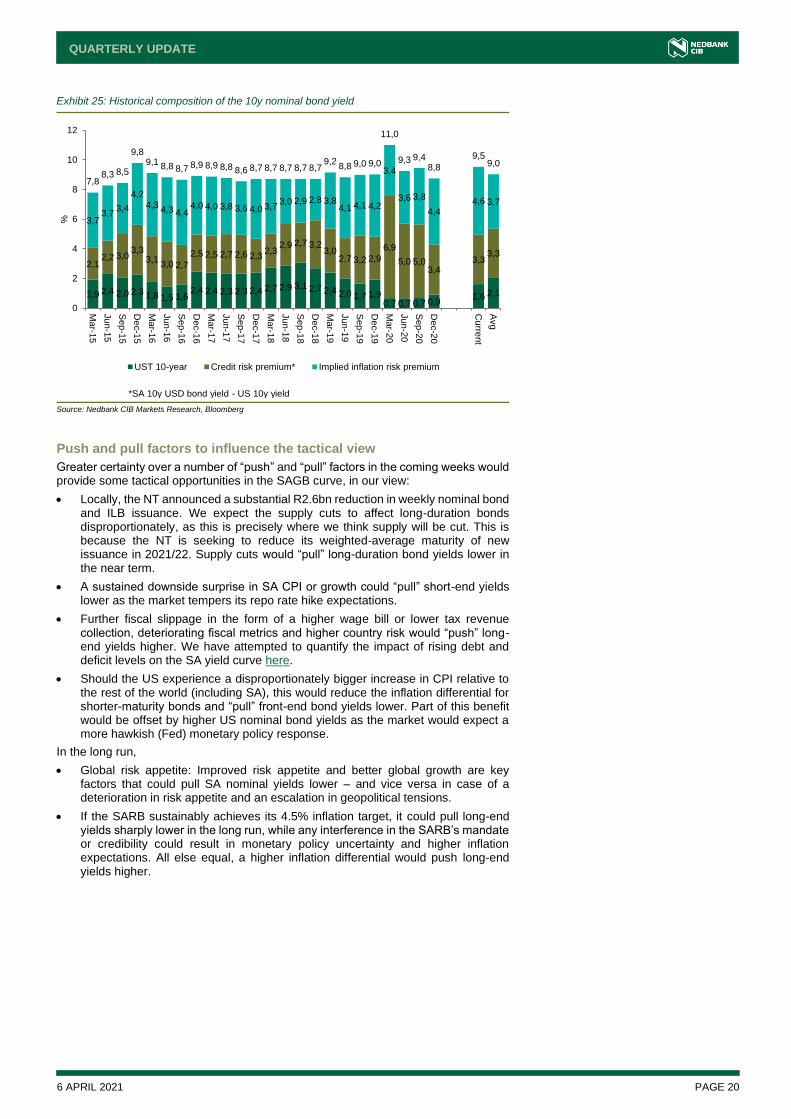
Exhibit 25: Historical composition of the 10y nominal bond yield
Source: Nedbank CIB Markets Research, Bloomberg
Push and pull factors to influence the tactical view
Greater certainty over a number of “push” and “pull” factors in the coming weeks would provide some tactical opportunities in the SAGB curve, in our view:
• Locally, the NT announced a substantial R2.6bn reduction in weekly nominal bond and ILB issuance. We expect the supply cuts to affect long-duration bonds disproportionately, as this is precisely where we think supply will be cut. This is because the NT is seeking to reduce its weighted-average maturity of new issuance in 2021/22. Supply cuts would “pull” long-duration bond yields lower in the near term.
• A sustained downside surprise in SA CPI or growth could “pull” short-end yields lower as the market tempers its repo rate hike expectations.
• Further fiscal slippage in the form of a higher wage bill or lower tax revenue collection, deteriorating fiscal metrics and higher country risk would “push” long-end yields higher. We have attempted to quantify the impact of rising debt and deficit levels on the SA yield curve here.
• Should the US experience a disproportionately bigger increase in CPI relative to the rest of the world (including SA), this would reduce the inflation differential for shorter-maturity bonds and “pull” front-end bond yields lower. Part of this benefit would be offset by higher US nominal bond yields as the market would expect a more hawkish (Fed) monetary policy response.
In the long run,
• Global risk appetite: Improved risk appetite and better global growth are key factors that could pull SA nominal yields lower – and vice versa in case of a deterioration in risk appetite and an escalation in geopolitical tensions.
• If the SARB sustainably achieves its 4.5% inflation target, it could pull long-end yields sharply lower in the long run, while any interference in the SARB’s mandate or credibility could result in monetary policy uncertainty and higher inflation expectations. All else equal, a higher inflation differential would push long-end yields higher.
1,9 2,4 2,0 2,3 1,8 1,5 1,62,4 2,4 2,3 2,3 2,4 2,7 2,9 3,1 2,7 2,4 2,0 1,7 1,9
0,7 0,7 0,7 0,91,6 2,1
2,12,2 3,0
3,33,1
3,0 2,7
2,5 2,5 2,7 2,6 2,32,3
2,9 2,7 3,23,0
2,7 3,2 2,9
6,9
5,0 5,03,4
3,33,3
3,73,7
3,4
4,24,3
4,3 4,44,0 4,0 3,8 3,6 4,0 3,7
3,0 2,9 2,8 3,84,1 4,1 4,2
3,4
3,6 3,8
4,44,6 3,7
7,88,3 8,5
9,89,1 8,8 8,7 8,9 8,9 8,8 8,6 8,7 8,7 8,7 8,7 8,7
9,28,8 9,0 9,0
11,0
9,3 9,48,8
9,59,0
0
2
4
6
8
10
12
Mar-1
5
Ju
n-1
5
Sep
-15
De
c-1
5
Mar-1
6
Ju
n-1
6
Sep
-16
De
c-1
6
Mar-1
7
Ju
n-1
7
Sep
-17
De
c-1
7
Mar-1
8
Ju
n-1
8
Sep
-18
De
c-1
8
Mar-1
9
Ju
n-1
9
Sep
-19
De
c-1
9
Mar-2
0
Ju
n-2
0
Sep
-20
De
c-2
0
Cu
rrent
Avg
%
UST 10-year Credit risk premium* Implied inflation risk premium
*SA 10y USD bond yield - US 10y yield

6 APRIL 2021 PAGE 21
QUARTERLY UPDATE
SA retail – maintaining our positive view from a listed perspective
SA has experienced rapid shifts in consumer spending patterns with visibly strong diverging trends that retailers have responded to quickly. The agility, cash preservation, debt reduction and investment in value-creating strategies by listed SA retailers have supported our more positive view on the sector in recent months. Our five upgrades since December 2020 (PPH, SPP, TFG and SHP all to Overweight, TRU to Neutral) have been followed by favourable share price movements with SA apparel players: +21.3% and SA food players: +19.5% since 1 December 2020. Although share prices have run, we think both the grocery and discretionary retail sectors are likely to generate strong earnings growth over the medium term (SA discretionary two-year CAGR FY21-23e: c.33% and SA food retail: 9.5%).
We still prefer SA discretionary retailers over food retailers, with our top picks in the sector remaining WHL, PPH and MRP, although in the food space, we still think SHP’s refreshed balance sheet, new Checkers strategy gaining momentum and slow exit out of unprofitable non-RSA geographies bode well for a strong earnings recovery for the business. Spar’s Polish recovery is the key catalyst for us in this business.
Exhibit 26: SA retail forecasts
SA apparel retail Rating CMP Target price Upside + DY
(%) FY20 DHEPS FY21e DHEPS FY22e DHEPS FY23e DHEPS 2-yr CAGR FY21-23e
The Foschini Group Overweight 119.0 128.0 7.5% 10.2 2.68 8.39 10.58 98.7%
Pepkor Holdings Overweight 15.6 18.0 15.3% 0.6 0.91 1.21 1.39 23.3%
Woolworths Holdings Overweight 47.6 55.0 15.6% 1.2 2.47 3.34 3.91 25.8%
Mr Price Group Overweight 180.3 200.0 11.0% 10.3 9.75 11.23 12.21 11.9%
Truworths Holdings Neutral 46.0 49.0 6.5% 4.1 4.50 4.84 4.97 5.1%
SA food retail Rating CMP Target price Upside + DY
(%) FY20 DHEPS FY21e DHEPS FY22e DHEPS FY23e DHEPS 2-yr CAGR FY21-23e
Shoprite Holdings Overweight 156.2 160.0 5.4% 7.11 8.45 9.53 10.14 9.6%
Pick n Pay Holdings Neutral 53.4 55.0 7.1% 2.77 2.46 2.93 3.21 14.2%
Spar Group Limited Overweight 193.7 212.0 14.1% 12.63 13.02 13.51 14.28 4.7%
Source: Bloomberg, Nedbank CIB Markets Research
Factors we think are likely to support this growth across discretionary retail: (1) a strong focus on value, casual and athleisure wear, (2) strong inventory management, lower risk of markdowns and more stable gross margins, (3) government assistance with the waiving of import duties on woven fabric, likely to benefit manufacturers and retailers, (4) e-commerce and (5) mid-market homeware, appliances and electronics.
Exhibit 27: Strong diverging trends from Oct to Dec suggesting that value players are likely to remain the key winners going into 2021; PPH, MRP, H&M were key outperformers
Exhibit 28: Recent trends showing mid-market retailers’ woes continuing into 2021, with weak growth reported by WHL and TRU
Source: Company data, Nedbank CIB Markets Research Source: Company data, Nedbank CIB Markets Research
-4,8
%
-4,2
%
2,4
%
-6,6
%-4,2
%
-7,4
%
0,0
%
-7,4
%
-8,2
%
-8,9
%
-2,0
%
-6,9
%
5,6
%
4,1
%
3,8
%
0,3
%
4,0
%
4,0
%
2,0
%
2,0
%
8,9
%
6,3
%
5,0
%
1,3
%
Total sales % ch LfL % ch Inflation Volume
WHL SA CGM TRU Africa
TFG Africa Apparel ex Jet MRP Apparel
H&M Pep/Ack
-12,4
%
-21,8
%
-6,3
%
-3,9
%
-8,3
%
-8,3
%
-11,0
% -7,0
%
-4,2
%
-6,9
%
-6,6
%
-8,3
% -3,1
%
-0,7
%
12,0
%
-0,4
%
-0,1
%
5,8
%
16,6
%
9,8
%
12,0
%
8,9
%
May/June July/Aug Sept/Oct/Nov Oct/Nov/Dec Jan/Feb
WHL SA FBH TRU Africa TFG Africa MRP Group Pep/Ackermans
Saad Chothia
6 APRIL 2021 PAGE 22
QUARTERLY UPDATE
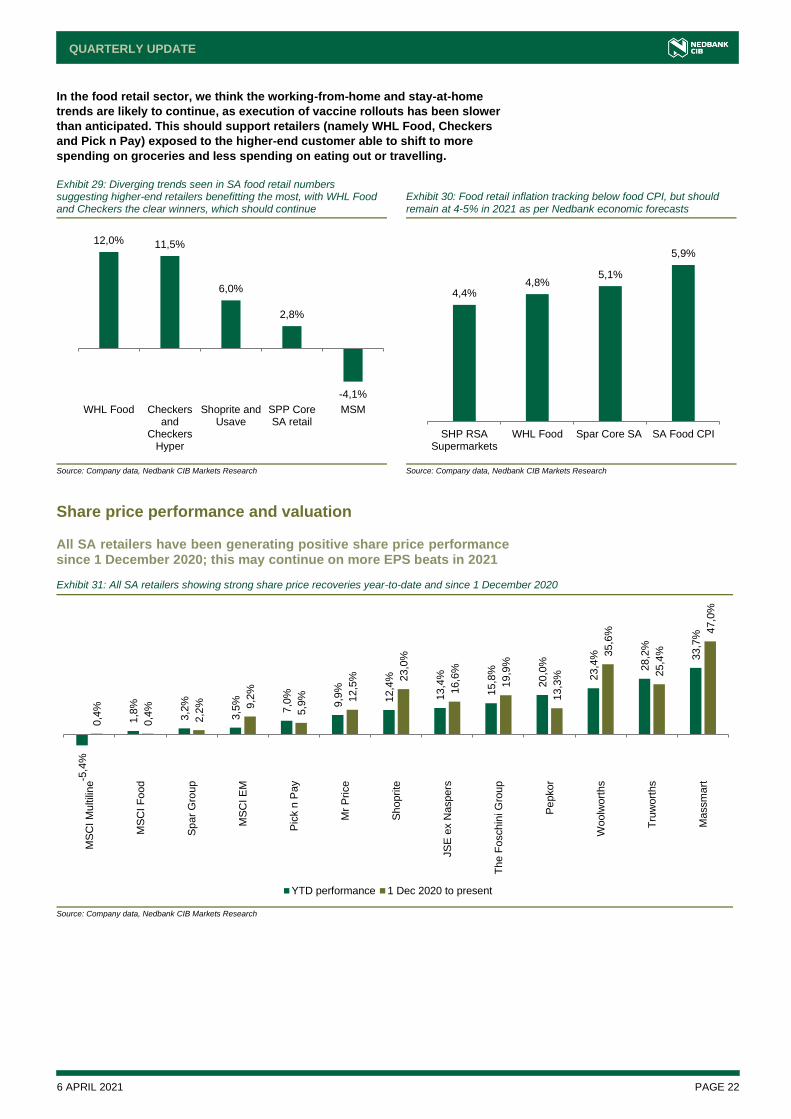
In the food retail sector, we think the working-from-home and stay-at-home
trends are likely to continue, as execution of vaccine rollouts has been slower
than anticipated. This should support retailers (namely WHL Food, Checkers
and Pick n Pay) exposed to the higher-end customer able to shift to more
spending on groceries and less spending on eating out or travelling.
Exhibit 29: Diverging trends seen in SA food retail numbers suggesting higher-end retailers benefitting the most, with WHL Food and Checkers the clear winners, which should continue
Exhibit 30: Food retail inflation tracking below food CPI, but should remain at 4-5% in 2021 as per Nedbank economic forecasts
Source: Company data, Nedbank CIB Markets Research Source: Company data, Nedbank CIB Markets Research
Share price performance and valuation
All SA retailers have been generating positive share price performance since 1 December 2020; this may continue on more EPS beats in 2021
Exhibit 31: All SA retailers showing strong share price recoveries year-to-date and since 1 December 2020
Source: Company data, Nedbank CIB Markets Research
12,0% 11,5%
6,0%
2,8%
-4,1%
WHL Food Checkersand
CheckersHyper
Shoprite andUsave
SPP CoreSA retail
MSM
4,4%4,8%
5,1%
5,9%
SHP RSASupermarkets
WHL Food Spar Core SA SA Food CPI
-5,4
%
1,8
%
3,2
%
3,5
%
7,0
%
9,9
%
12,4
%
13,4
%
15,8
%
20,0
%
23,4
%
28,2
%
33,7
%
0,4
%
0,4
%
2,2
% 9,2
%
5,9
% 12,5
% 23,0
%
16,6
%
19,9
%
13,3
%
35,6
%
25,4
%
47,0
%
MS
CI M
ultili
ne
MS
CI F
ood
Sp
ar
Gro
up
MS
CI E
M
Pic
k n
Pay
Mr
Price
Sh
oprite
JS
E e
x N
aspers
Th
e F
oschin
i G
roup
Pe
pkor
Woolw
ort
hs
Tru
wort
hs
Ma
ssm
art
YTD performance 1 Dec 2020 to present
6 APRIL 2021 PAGE 23
QUARTERLY UPDATE
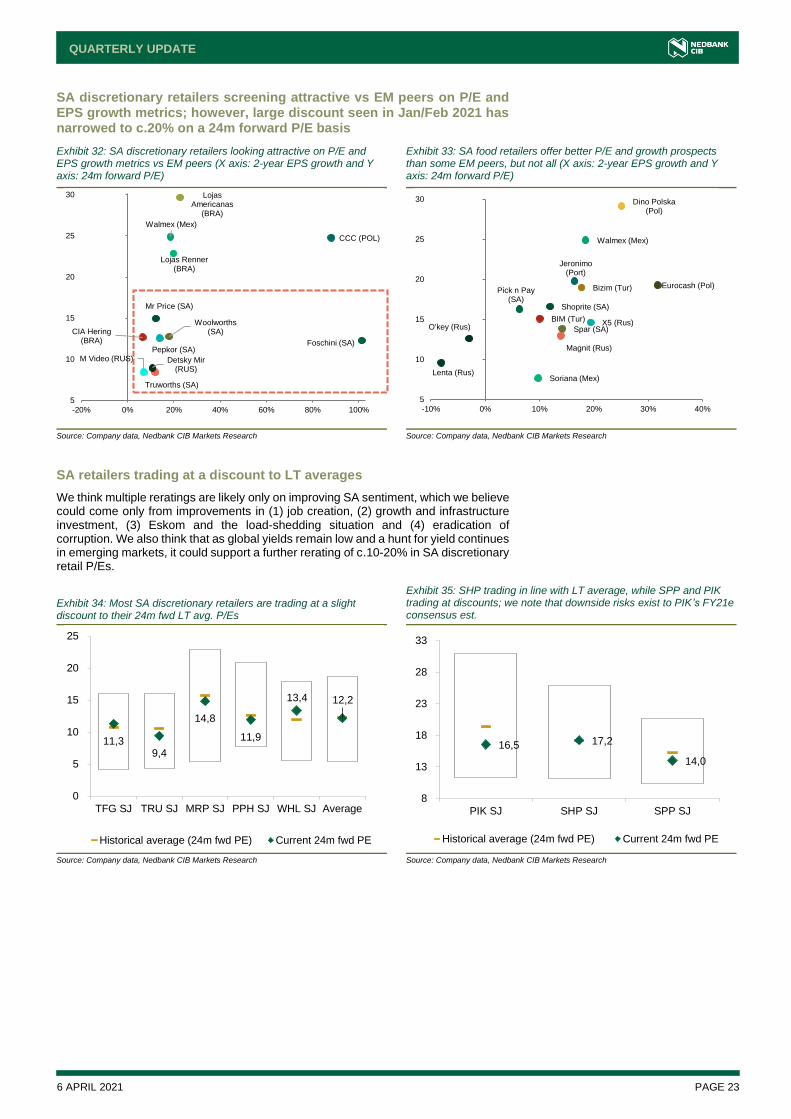
SA discretionary retailers screening attractive vs EM peers on P/E and EPS growth metrics; however, large discount seen in Jan/Feb 2021 has narrowed to c.20% on a 24m forward P/E basis
Exhibit 32: SA discretionary retailers looking attractive on P/E and EPS growth metrics vs EM peers (X axis: 2-year EPS growth and Y axis: 24m forward P/E)
Exhibit 33: SA food retailers offer better P/E and growth prospects than some EM peers, but not all (X axis: 2-year EPS growth and Y axis: 24m forward P/E)
Source: Company data, Nedbank CIB Markets Research Source: Company data, Nedbank CIB Markets Research
SA retailers trading at a discount to LT averages
We think multiple reratings are likely only on improving SA sentiment, which we believe could come only from improvements in (1) job creation, (2) growth and infrastructure investment, (3) Eskom and the load-shedding situation and (4) eradication of corruption. We also think that as global yields remain low and a hunt for yield continues in emerging markets, it could support a further rerating of c.10-20% in SA discretionary retail P/Es.
Exhibit 34: Most SA discretionary retailers are trading at a slight discount to their 24m fwd LT avg. P/Es
Exhibit 35: SHP trading in line with LT average, while SPP and PIK trading at discounts; we note that downside risks exist to PIK’s FY21e consensus est.
Source: Company data, Nedbank CIB Markets Research Source: Company data, Nedbank CIB Markets Research
Mr Price (SA)
Foschini (SA)
Woolworths (SA)
Pepkor (SA)
Truworths (SA)
Detsky Mir (RUS)
CCC (POL)
CIA Hering (BRA)
Walmex (Mex)
Lojas Renner (BRA)
Lojas Americanas
(BRA)
M Video (RUS)
5
10
15
20
25
30
-20% 0% 20% 40% 60% 80% 100%
Shoprite (SA)
Pick n Pay (SA)
Spar (SA)X5 (Rus)
Magnit (Rus)
Dino Polska (Pol)
O'key (Rus)
Lenta (Rus)
Eurocash (Pol)
Jeronimo (Port)
BIM (Tur)
Bizim (Tur)
Walmex (Mex)
Soriana (Mex)
5
10
15
20
25
30
-10% 0% 10% 20% 30% 40%
11,39,4
14,8
11,9
13,4 12,2
0
5
10
15
20
25
TFG SJ TRU SJ MRP SJ PPH SJ WHL SJ Average
Historical average (24m fwd PE) Current 24m fwd PE
16,5 17,2
14,0
8
13
18
23
28
33
PIK SJ SHP SJ SPP SJ
Historical average (24m fwd PE) Current 24m fwd PE
6 APRIL 2021 PAGE 24
QUARTERLY UPDATE
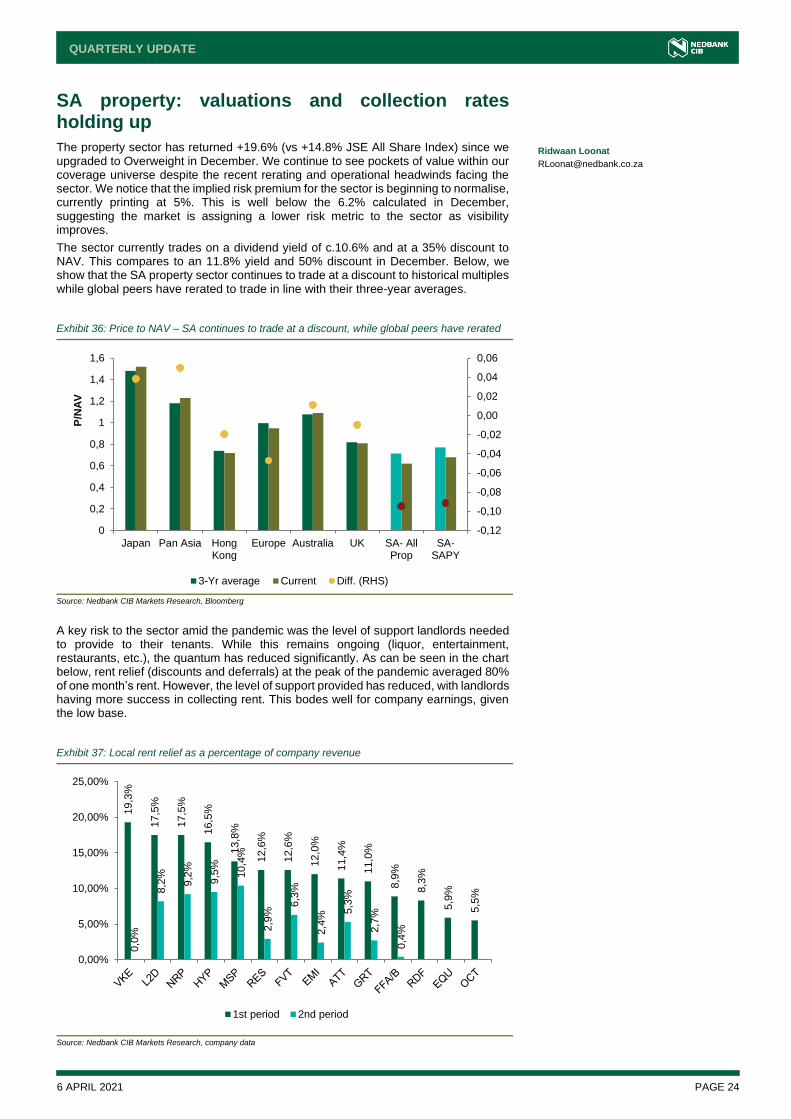
SA property: valuations and collection rates holding up
The property sector has returned +19.6% (vs +14.8% JSE All Share Index) since we upgraded to Overweight in December. We continue to see pockets of value within our coverage universe despite the recent rerating and operational headwinds facing the sector. We notice that the implied risk premium for the sector is beginning to normalise, currently printing at 5%. This is well below the 6.2% calculated in December, suggesting the market is assigning a lower risk metric to the sector as visibility improves.
The sector currently trades on a dividend yield of c.10.6% and at a 35% discount to NAV. This compares to an 11.8% yield and 50% discount in December. Below, we show that the SA property sector continues to trade at a discount to historical multiples while global peers have rerated to trade in line with their three-year averages.
Exhibit 36: Price to NAV – SA continues to trade at a discount, while global peers have rerated
Source: Nedbank CIB Markets Research, Bloomberg
A key risk to the sector amid the pandemic was the level of support landlords needed to provide to their tenants. While this remains ongoing (liquor, entertainment, restaurants, etc.), the quantum has reduced significantly. As can be seen in the chart below, rent relief (discounts and deferrals) at the peak of the pandemic averaged 80% of one month’s rent. However, the level of support provided has reduced, with landlords having more success in collecting rent. This bodes well for company earnings, given the low base.
Exhibit 37: Local rent relief as a percentage of company revenue
Source: Nedbank CIB Markets Research, company data
-0,12
-0,10
-0,08
-0,06
-0,04
-0,02
0,00
0,02
0,04
0,06
0
0,2
0,4
0,6
0,8
1
1,2
1,4
1,6
Japan Pan Asia HongKong
Europe Australia UK SA- AllProp
SA-SAPY
P/N
AV
3-Yr average Current Diff. (RHS)
19,3
%
17,5
%
17,5
%
16,5
%
13,8
%
12,6
%
12,6
%
12,0
%
11,4
%
11,0
%
8,9
%
8,3
%
5,9
%
5,5
%
0,0
%
8,2
%
9,2
%
9,5
%
10,4
%
2,9
%
6,3
%
2,4
%
5,3
%
2,7
%
0,4
%
0,00%
5,00%
10,00%
15,00%
20,00%
25,00%
1st period 2nd period
Ridwaan Loonat

6 APRIL 2021 PAGE 25
QUARTERLY UPDATE
There is no denying that the sector is facing operational headwinds with pressure on vacancy rates and rental growth. The recent earnings season has shown companies prioritising tenant retention given the weak economy. However, this has come at a cost to rentals, with many facing double-digit negative rental reversions in the office, industrial and retail sectors. What is positive is that while vacancy rates have increased, the increase seen is better than what the market was initially expecting given the structural shifts currently taking place.
Exhibit 38: While there is upward pressure on domestic vacancy rates, they are not out of control
Source: Nedbank CIB Markets Research, company data
A key risk that we highlighted was the reduction in asset valuations and the negative impact it would have on balance sheets. Below, we show that while valuations in the local portfolio fell, the rate of decline after June 2020 has slowed, further supporting a rerating in the sector given the discount the sector is currently trading at. What is evident is that companies exposed to larger mall formats in urbanised locations were the hardest hit, while those with retail formats skewed to rural and convenience held up well.
Exhibit 39: Asset valuations with pre-COVID-19 levels based to 100
Source: Nedbank CIB Markets Research, company data
We continue to adopt a cautious stance, favouring companies with healthy balance sheets and diverse and defensive asset portfolios. While some counters such as Redefine may have geared balance sheets, we believe they have levers to pull through reducing their payout policies, offering scrip dividend alternatives or succeeding in asset disposals. We currently have Overweight recommendations on Emira, Fortress A, MAS Real Estate, Nepi Rockcastle, Redefine, Resilient and Vukile.
83,6
8
85,1
5
87,9
88,4
8
88,9
6
90,2
4
90,3
1
91,5
8
92,0
3
94,3
6
95,9
96,5 104,4
3
0
20
40
60
80
100
120
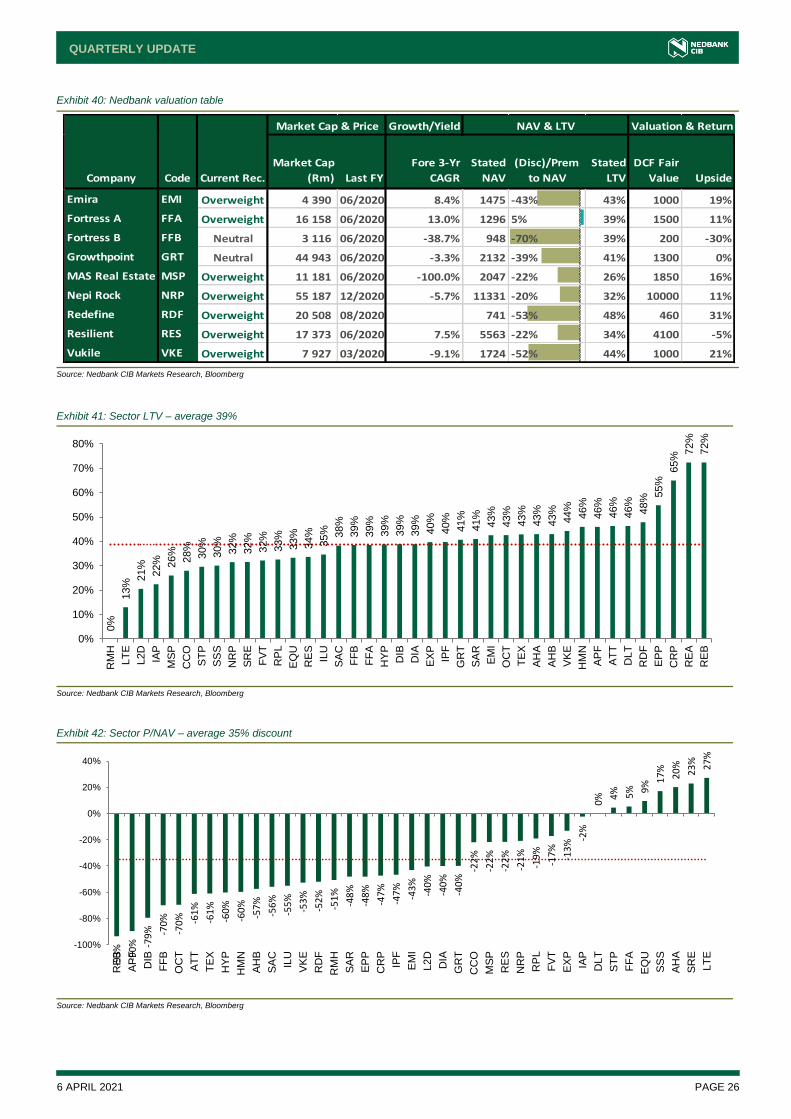
6 APRIL 2021 PAGE 26
QUARTERLY UPDATE
Exhibit 40: Nedbank valuation table
Source: Nedbank CIB Markets Research, Bloomberg
Exhibit 41: Sector LTV – average 39%
Source: Nedbank CIB Markets Research, Bloomberg
Exhibit 42: Sector P/NAV – average 35% discount
Source: Nedbank CIB Markets Research, Bloomberg
Company Code Current Rec.
Market Cap
(Rm) Last FY
Fore 3-Yr
CAGR
Stated
NAV
(Disc)/Prem
to NAV
Stated
LTV
DCF Fair
Value Upside
Emira EMI Overweight 4 390 06/2020 8.4% 1475 -43% 43% 1000 19%
Fortress A FFA Overweight 16 158 06/2020 13.0% 1296 5% 39% 1500 11%
Fortress B FFB Neutral 3 116 06/2020 -38.7% 948 -70% 39% 200 -30%
Growthpoint GRT Neutral 44 943 06/2020 -3.3% 2132 -39% 41% 1300 0%
MAS Real Estate MSP Overweight 11 181 06/2020 -100.0% 2047 -22% 26% 1850 16%
Nepi Rock NRP Overweight 55 187 12/2020 -5.7% 11331 -20% 32% 10000 11%
Redefine RDF Overweight 20 508 08/2020 741 -53% 48% 460 31%
Resilient RES Overweight 17 373 06/2020 7.5% 5563 -22% 34% 4100 -5%
Vukile VKE Overweight 7 927 03/2020 -9.1% 1724 -52% 44% 1000 21%
Market Cap & Price NAV & LTV Valuation & ReturnGrowth/Yield
0%
13%
21%
22% 26%
28%
30%
30%
32%
32%
32%
33%
33%
34%
35% 38%
39%
39%
39%
39%
39%
40%
40%
41%
41%
43%
43%
43%
43%
43%
44%
46%
46%
46%
46%
48% 5
5%
65%
72%
72%
0%
10%
20%
30%
40%
50%
60%
70%
80%
RM
H
LT
E
L2D
IAP
MS
P
CC
O
ST
P
SS
S
NR
P
SR
E
FV
T
RP
L
EQ
U
RE
S
ILU
SA
C
FF
B
FF
A
HY
P
DIB
DIA
EX
P
IPF
GR
T
SA
R
EM
I
OC
T
TE
X
AH
A
AH
B
VK
E
HM
N
AP
F
AT
T
DLT
RD
F
EP
P
CR
P
RE
A
RE
B
-93
%
-90
% -79
% -70
%
-70
% -61
%
-61
%
-60
%
-60
%
-57
%
-56
%
-55
%
-53
%
-52
%
-51
%
-48
%
-48
%
-47
%
-47
%
-43
%
-40
%
-40
%
-40
%
-22
%
-22
%
-22
%
-21
%
-19
%
-17
%
-13
% -2%
0% 4
% 5% 9
% 17
%
20
%
23
% 27
%
-100%
-80%
-60%
-40%
-20%
0%
20%
40%
RE
B
AP
F
DIB
FF
B
OC
T
AT
T
TE
X
HY
P
HM
N
AH
B
SA
C
ILU
VK
E
RD
F
RM
H
SA
R
EP
P
CR
P
IPF
EM
I
L2D
DIA
GR
T
CC
O
MS
P
RE
S
NR
P
RP
L
FV
T
EX
P
IAP
DLT
ST
P
FF
A
EQ
U
SS
S
AH
A
SR
E
LT
E
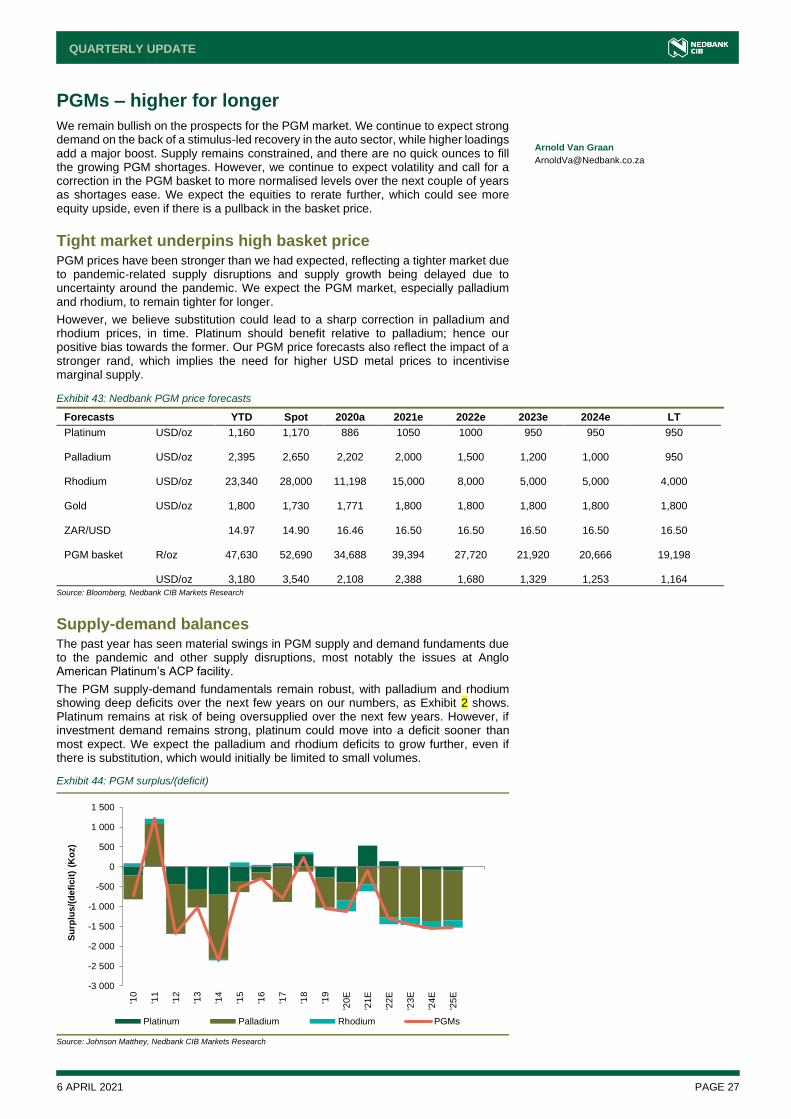
6 APRIL 2021 PAGE 27
QUARTERLY UPDATE
PGMs – higher for longer
We remain bullish on the prospects for the PGM market. We continue to expect strong demand on the back of a stimulus-led recovery in the auto sector, while higher loadings add a major boost. Supply remains constrained, and there are no quick ounces to fill the growing PGM shortages. However, we continue to expect volatility and call for a correction in the PGM basket to more normalised levels over the next couple of years as shortages ease. We expect the equities to rerate further, which could see more equity upside, even if there is a pullback in the basket price.
Tight market underpins high basket price PGM prices have been stronger than we had expected, reflecting a tighter market due to pandemic-related supply disruptions and supply growth being delayed due to uncertainty around the pandemic. We expect the PGM market, especially palladium and rhodium, to remain tighter for longer.
However, we believe substitution could lead to a sharp correction in palladium and rhodium prices, in time. Platinum should benefit relative to palladium; hence our positive bias towards the former. Our PGM price forecasts also reflect the impact of a stronger rand, which implies the need for higher USD metal prices to incentivise marginal supply.
Exhibit 43: Nedbank PGM price forecasts
Forecasts YTD Spot 2020a 2021e 2022e 2023e 2024e LT
Platinum USD/oz 1,160 1,170 886 1050 1000 950 950 950 Palladium USD/oz 2,395 2,650 2,202 2,000 1,500 1,200 1,000 950 Rhodium USD/oz 23,340 28,000 11,198 15,000 8,000 5,000 5,000 4,000 Gold USD/oz 1,800 1,730 1,771 1,800 1,800 1,800 1,800 1,800 ZAR/USD 14.97 14.90 16.46 16.50 16.50 16.50 16.50 16.50 PGM basket R/oz 47,630 52,690 34,688 39,394 27,720 21,920 20,666 19,198 USD/oz 3,180 3,540 2,108 2,388 1,680 1,329 1,253 1,164
Source: Bloomberg, Nedbank CIB Markets Research
Supply-demand balances The past year has seen material swings in PGM supply and demand fundaments due to the pandemic and other supply disruptions, most notably the issues at Anglo American Platinum’s ACP facility.
The PGM supply-demand fundamentals remain robust, with palladium and rhodium showing deep deficits over the next few years on our numbers, as Exhibit 2 shows. Platinum remains at risk of being oversupplied over the next few years. However, if investment demand remains strong, platinum could move into a deficit sooner than most expect. We expect the palladium and rhodium deficits to grow further, even if there is substitution, which would initially be limited to small volumes.
Exhibit 44: PGM surplus/(deficit)
Source: Johnson Matthey, Nedbank CIB Markets Research
-3 000
-2 500
-2 000
-1 500
-1 000
-500
0
500
1 000
1 500
'10
'11
'12
'13
'14
'15
'16
'17
'18
'19
'20E
'21E
'22E
'23E
'24E
'25E
Su
rplu
s/(
defi
cit
) (K
oz)
Platinum Palladium Rhodium PGMs
Arnold Van Graan

6 APRIL 2021 PAGE 28
QUARTERLY UPDATE
Supply The pandemic materially knocked 2020 PGM production, and the effects could linger into 2021. We do not expect a significant surge in secondary supply, and there is not enough recycling supply capacity to fill the potential metal shortages we see. Several other operational challenges could continue to hamper PGM supply, most notably electricity shortages, labour and community unrest, and technical challenges at mining operations and processing facilities.
No quick ounces
Many investors believe the sharp increase in PGM prices could see additional supply coming online quite quickly. We, however, do not expect a sudden rush of new projects to the market; instead, we see a slow build-up over the next five years.
We believe the PGM industry was capital-starved over the past decade, with a sharp decline in real capex since 2012, as Exhibit 45shows. As a result, many of the ore bodies are undercapitalised and some of the older shafts are nearing depletion.
Exhibit 45: Real capex levels are very low – ore bodies need to be recapitalised to boost supply
Source: Company reports, Bloomberg, Nedbank CIB Markets Research
There are several projects in the pipeline that could materially boost output over the next few years, but most of the larger projects have long lead times. We, therefore, do not expect the typical supply-side response as seen during previous bull markets, and believe new supply could take longer to come online than most expect. We expect SA PGM supply to continue to fall over the next 5-10 years in the absence of a material increase in growth capex.
Demand The pandemic materially distorted PGM demand in 2020. However, we still see a strong stimulus-led demand recovery in 2021 and 2022.
Strong auto-market recovery expected
We expect a sharp recovery in 2021 and beyond on the back of incentive schemes and other economic stimulus measures. We also expect vehicle sales to be boosted by pent-up demand. In addition to incentives, there have been a few other factors that have aided the recovery in vehicle sales, including a trend of commuters buying vehicles in order to avoid public transport. These trends could gain momentum and continue to boost 2021 vehicle sales.
0
100
200
300
400
500
600
700
800
900
1 000
5 000
10 000
15 000
20 000
25 000
30 000
35 000
40 000
45 000
50 000
'84
'86
'88
'90
'92
'94
'96
'98
'00
'02
'04
'06
'08
'10
'12
'14
'16
'18
'20
Cap
ex (
R/P
GM
oz)
Real
PG
M b
asket
pri
ce (
R/o
z)
Real PGM basket price Real PGM industry capex
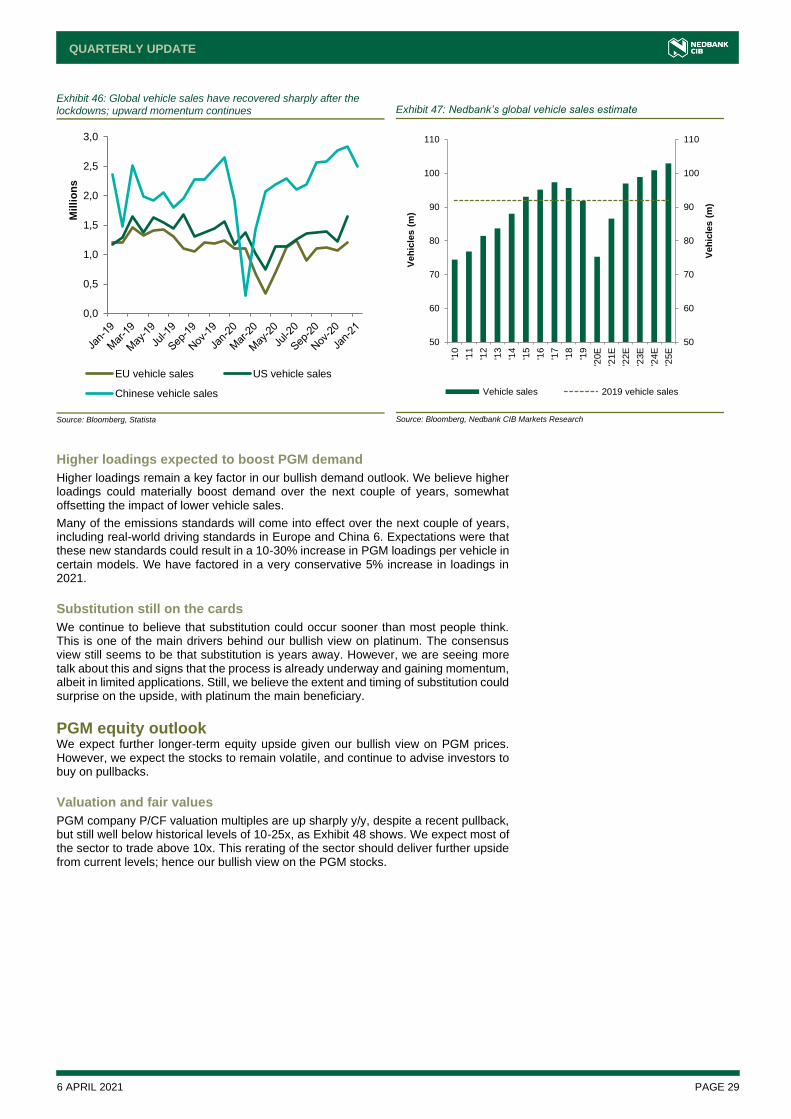
6 APRIL 2021 PAGE 29
QUARTERLY UPDATE
Higher loadings expected to boost PGM demand
Higher loadings remain a key factor in our bullish demand outlook. We believe higher loadings could materially boost demand over the next couple of years, somewhat offsetting the impact of lower vehicle sales.
Many of the emissions standards will come into effect over the next couple of years, including real-world driving standards in Europe and China 6. Expectations were that these new standards could result in a 10-30% increase in PGM loadings per vehicle in certain models. We have factored in a very conservative 5% increase in loadings in 2021.
Substitution still on the cards
We continue to believe that substitution could occur sooner than most people think. This is one of the main drivers behind our bullish view on platinum. The consensus view still seems to be that substitution is years away. However, we are seeing more talk about this and signs that the process is already underway and gaining momentum, albeit in limited applications. Still, we believe the extent and timing of substitution could surprise on the upside, with platinum the main beneficiary.
PGM equity outlook We expect further longer-term equity upside given our bullish view on PGM prices. However, we expect the stocks to remain volatile, and continue to advise investors to buy on pullbacks.
Valuation and fair values
PGM company P/CF valuation multiples are up sharply y/y, despite a recent pullback, but still well below historical levels of 10-25x, as Exhibit 48 shows. We expect most of the sector to trade above 10x. This rerating of the sector should deliver further upside from current levels; hence our bullish view on the PGM stocks.
Exhibit 46: Global vehicle sales have recovered sharply after the lockdowns; upward momentum continues
Source: Bloomberg, Statista
Exhibit 47: Nedbank’s global vehicle sales estimate
Source: Bloomberg, Nedbank CIB Markets Research
0,0
0,5
1,0
1,5
2,0
2,5
3,0
Mil
lio
ns
EU vehicle sales US vehicle sales
Chinese vehicle sales
50
60
70
80
90
100
110
50
60
70
80
90
100
110
'10
'11
'12
'13
'14
'15
'16
'17
'18
'19
'20E
'21E
'22E
'23E
'24E
'25E
Veh
icle
s (
m)
Veh
icle
s (
m)
Vehicle sales 2019 vehicle sales

6 APRIL 2021 PAGE 30
QUARTERLY UPDATE
Stock picks
We expect the PGM stocks to continue trading at a premium to gold stocks. We, therefore, remain Overweight the PGM sector and would be buyers of PGM equities on any pullback. We rate Northam, Sibanye-Stillwater, Impala and RBPlat Overweight, and recommend the stocks in that order of preference.
Exhibit 48: Forward P/CF multiples – we expect PGM equities to rerate further
Source: Bloomberg, Nedbank CIB Markets Research
0
5
10
15
20
25
30
35
40
45
50
0
30
60
90
120
150
Ma
r-06
Se
p-0
6M
ar-
07
Se
p-0
7M
ar-
08
Se
p-0
8M
ar-
09
Se
p-0
9M
ar-
10
Se
p-1
0M
ar-
11
Se
p-1
1M
ar-
12
Se
p-1
2M
ar-
13
Se
p-1
3M
ar-
14
Se
p-1
4M
ar-
15
Se
p-1
5M
ar-
16
Se
p-1
6M
ar-
17
Se
p-1
7M
ar-
18
Se
p-1
8M
ar-
19
Se
p-1
9M
ar-
20
Se
p-2
0M
ar-
21
Fo
rward
P/C
F
Ind
ex
PGM equity index/cash flow6 months forward
usual range between 10x and 25x
Historical trading range
JPLAT Index
P/CF - six months forward
Forward P/CF multiple (six months forward)
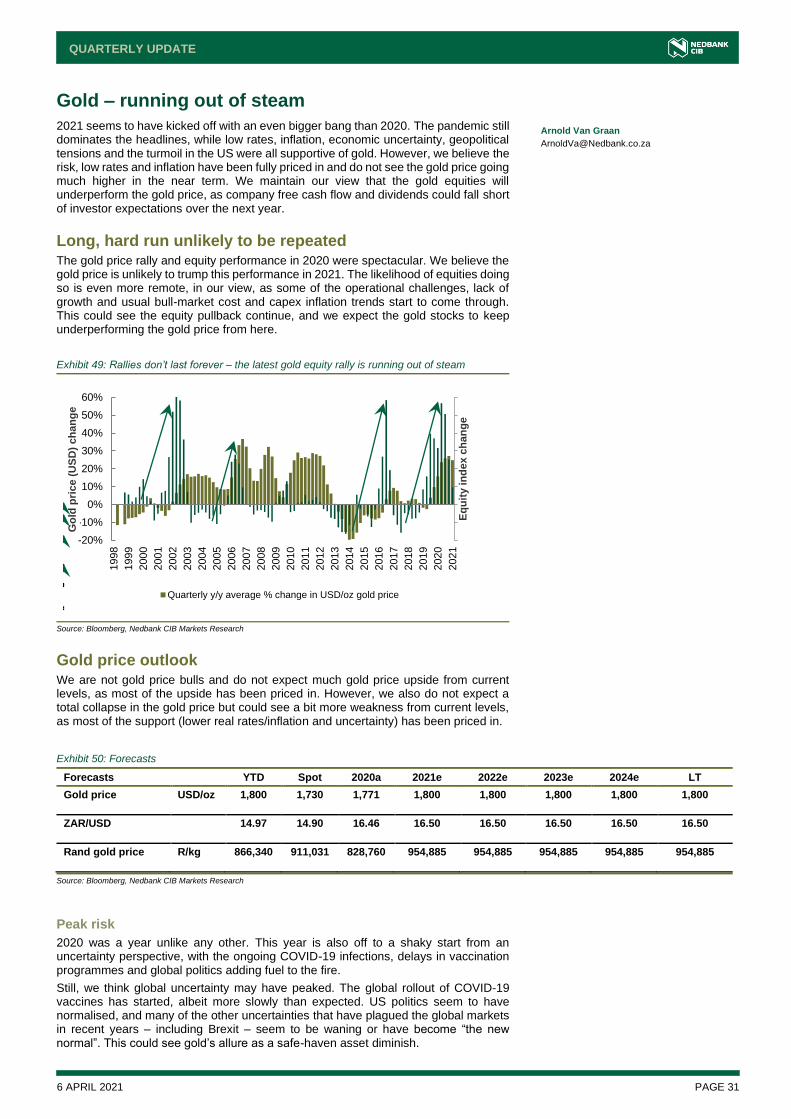
6 APRIL 2021 PAGE 31
QUARTERLY UPDATE
Gold – running out of steam
2021 seems to have kicked off with an even bigger bang than 2020. The pandemic still dominates the headlines, while low rates, inflation, economic uncertainty, geopolitical tensions and the turmoil in the US were all supportive of gold. However, we believe the risk, low rates and inflation have been fully priced in and do not see the gold price going much higher in the near term. We maintain our view that the gold equities will underperform the gold price, as company free cash flow and dividends could fall short of investor expectations over the next year.
Long, hard run unlikely to be repeated The gold price rally and equity performance in 2020 were spectacular. We believe the gold price is unlikely to trump this performance in 2021. The likelihood of equities doing so is even more remote, in our view, as some of the operational challenges, lack of growth and usual bull-market cost and capex inflation trends start to come through. This could see the equity pullback continue, and we expect the gold stocks to keep underperforming the gold price from here.
Gold price outlook We are not gold price bulls and do not expect much gold price upside from current levels, as most of the upside has been priced in. However, we also do not expect a total collapse in the gold price but could see a bit more weakness from current levels, as most of the support (lower real rates/inflation and uncertainty) has been priced in.
Exhibit 50: Forecasts
Forecasts YTD Spot 2020a 2021e 2022e 2023e 2024e LT
Gold price USD/oz 1,800 1,730 1,771 1,800 1,800 1,800 1,800 1,800
ZAR/USD 14.97 14.90 16.46 16.50 16.50 16.50 16.50 16.50
Rand gold price R/kg 866,340 911,031 828,760 954,885 954,885 954,885 954,885 954,885
Source: Bloomberg, Nedbank CIB Markets Research
Peak risk
2020 was a year unlike any other. This year is also off to a shaky start from an uncertainty perspective, with the ongoing COVID-19 infections, delays in vaccination programmes and global politics adding fuel to the fire.
Still, we think global uncertainty may have peaked. The global rollout of COVID-19 vaccines has started, albeit more slowly than expected. US politics seem to have normalised, and many of the other uncertainties that have plagued the global markets in recent years – including Brexit – seem to be waning or have become “the new normal”. This could see gold’s allure as a safe-haven asset diminish.
Arnold Van Graan
Exhibit 49: Rallies don’t last forever – the latest gold equity rally is running out of steam
Source: Bloomberg, Nedbank CIB Markets Research
-20%
-10%
0%
10%
20%
30%
40%
50%
60%
1998
1999
2000
2001
2002
2003
2004
2005
2006
2007
2008
2009
2010
2011
2012
2013
2014
2015
2016
2017
2018
2019
2020
2021
Eq
uit
y i
nd
ex c
ha
ng
e
Go
ld p
rice (
US
D)
ch
an
ge
Quarterly y/y average % change in USD/oz gold price
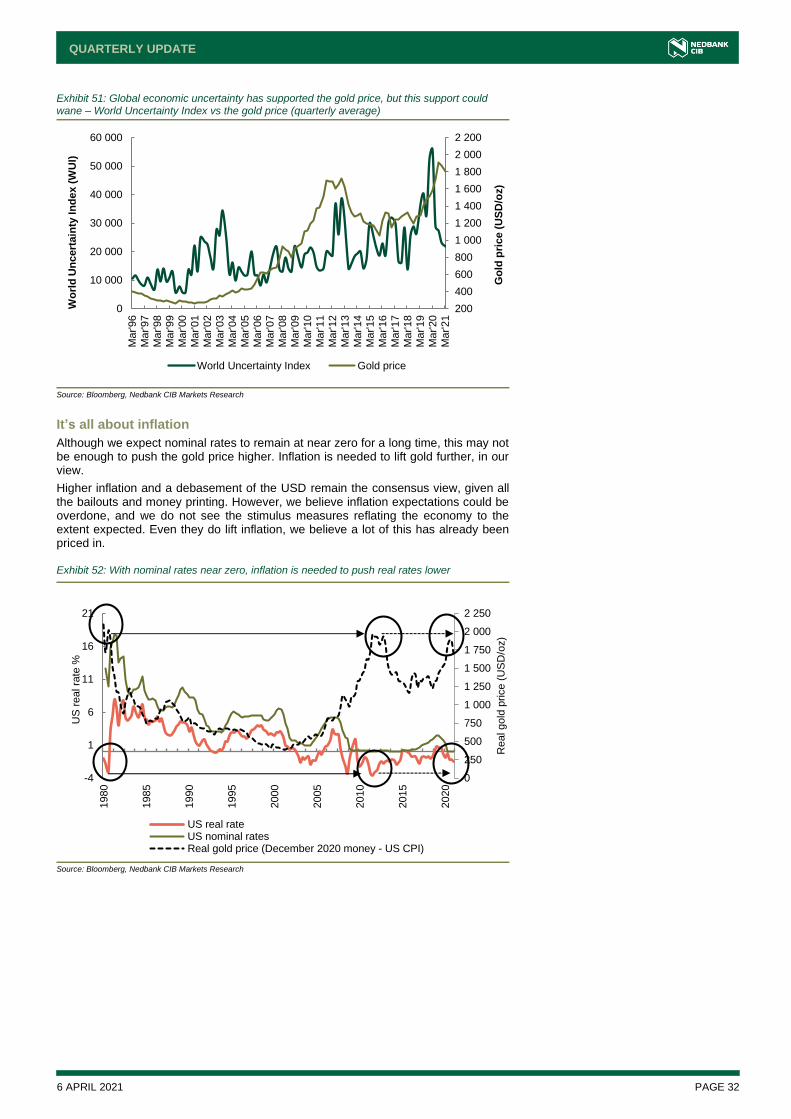
6 APRIL 2021 PAGE 32
QUARTERLY UPDATE
It’s all about inflation
Although we expect nominal rates to remain at near zero for a long time, this may not be enough to push the gold price higher. Inflation is needed to lift gold further, in our view.
Higher inflation and a debasement of the USD remain the consensus view, given all the bailouts and money printing. However, we believe inflation expectations could be overdone, and we do not see the stimulus measures reflating the economy to the extent expected. Even they do lift inflation, we believe a lot of this has already been priced in.
Exhibit 51: Global economic uncertainty has supported the gold price, but this support could wane – World Uncertainty Index vs the gold price (quarterly average)
Source: Bloomberg, Nedbank CIB Markets Research
Exhibit 52: With nominal rates near zero, inflation is needed to push real rates lower
Source: Bloomberg, Nedbank CIB Markets Research
200
400
600
800
1 000
1 200
1 400
1 600
1 800
2 000
2 200
0
10 000
20 000
30 000
40 000
50 000
60 000M
ar'96
Ma
r'97
Ma
r'98
Ma
r'99
Ma
r'00
Ma
r'01
Ma
r'02
Ma
r'03
Ma
r'04
Ma
r'05
Ma
r'06
Ma
r'07
Ma
r'08
Ma
r'09
Ma
r'10
Ma
r'11
Ma
r'12
Mar'13
Ma
r'14
Ma
r'15
Ma
r'16
Ma
r'17
Ma
r'18
Ma
r'19
Ma
r'20
Ma
r'21
Go
ld p
rice (
US
D/o
z)
Wo
rld
Un
cert
ain
ty I
nd
ex (
WU
I)
World Uncertainty Index Gold price
0
250
500
750
1 000
1 250
1 500
1 750
2 000
2 250
-4
1
6
11
16
21
1980
1985
1990
1995
2000
2005
2010
2015
2020
Real gold
price (
US
D/o
z)
US
real ra
te %
US real rateUS nominal ratesReal gold price (December 2020 money - US CPI)

6 APRIL 2021 PAGE 33
QUARTERLY UPDATE
Equities vs gold price Gold equities have outperformed the gold price since 2018, as Exhibit 53shows. However, we believe the gold stocks have now run out of steam. We expect the equities to underperform the gold price over the coming year as the gold producers’ operational and cash flow performance starts to fall short of investor expectations on the back of rising costs, capex and M&A.
Beware of the downturn
We expect most companies to declare exceptionally strong dividends over the next reporting period. However, we see cash available for dividends declining, as we expect operational challenges, rising costs and increased capex to start eroding free cash flow margins over the next year. We also expect the focus to shift towards reserve replacement and growth (which includes growth-fuelled M&A). This move to growth could alter the capital allocation mix, with returns to investors moving down the queue.
This could see the gold equities start to fall short of investor expectations, many of whom seem to be banking on large and sustained dividend payouts. In short, we believe we have seen the best part of the gold price and equity rally and that downside risk both from an operational and valuation perspective is starting to mount.
Valuations and fair values The forward P/CF multiples of SA gold stocks increased sharply towards the latter part of 2020 and traded as high as 10-12x. However, the valuation multiples have pulled back sharply since then, and the sector is now trading at around 4x. We do not expect the ratings to improve materially from here, given the reasons noted earlier. The SA-listed gold equities are still fully valued, in our view. We also do not expect increased talk of M&A, including a takeover of AngloGold and Gold Fields, to push up the multiples.
Exhibit 53: Gold equities have outperformed the gold price since late 2018; further equity outperformance from here will be tough, in our view
Source: Bloomberg, Nedbank CIB Markets Research
0
1
2
3
4
5
6
7
8
9
10
-300
200
700
1 200
1 700
2 200
1998
1999
2000
2001
2002
2003
2004
2005
2006
2007
2008
2009
2010
2011
2012
2013
2014
2015
2016
2017
2018
2019
2020
2021
Go
ld e
qu
ity i
nd
ex/g
old
pri
ce
Go
ld p
rice (
US
D/o
z)
Gold price Gold equity index (JGOLD)/gold price
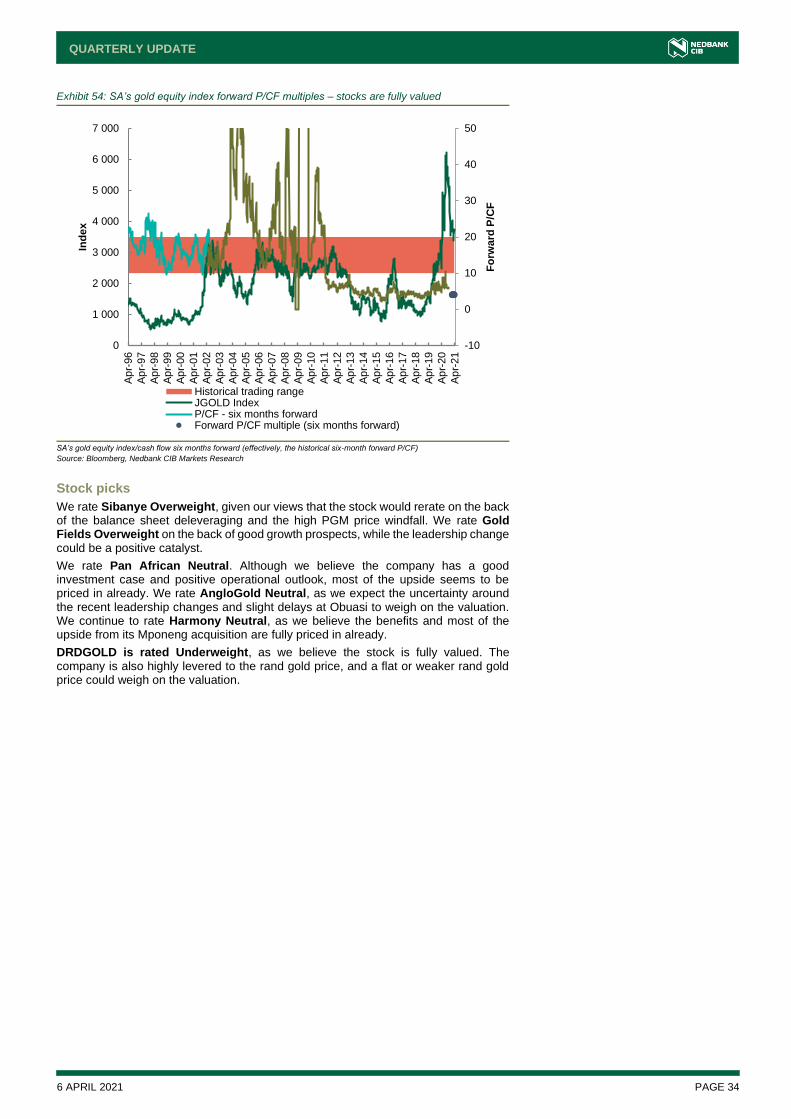
6 APRIL 2021 PAGE 34
QUARTERLY UPDATE
Stock picks
We rate Sibanye Overweight, given our views that the stock would rerate on the back of the balance sheet deleveraging and the high PGM price windfall. We rate Gold Fields Overweight on the back of good growth prospects, while the leadership change could be a positive catalyst.
We rate Pan African Neutral. Although we believe the company has a good investment case and positive operational outlook, most of the upside seems to be priced in already. We rate AngloGold Neutral, as we expect the uncertainty around the recent leadership changes and slight delays at Obuasi to weigh on the valuation. We continue to rate Harmony Neutral, as we believe the benefits and most of the upside from its Mponeng acquisition are fully priced in already.
DRDGOLD is rated Underweight, as we believe the stock is fully valued. The company is also highly levered to the rand gold price, and a flat or weaker rand gold price could weigh on the valuation.
Exhibit 54: SA’s gold equity index forward P/CF multiples – stocks are fully valued
SA’s gold equity index/cash flow six months forward (effectively, the historical six-month forward P/CF)
Source: Bloomberg, Nedbank CIB Markets Research
-10
0
10
20
30
40
50
0
1 000
2 000
3 000
4 000
5 000
6 000
7 000A
pr-
96
Ap
r-97
Ap
r-98
Ap
r-99
Ap
r-00
Ap
r-01
Ap
r-02
Ap
r-03
Ap
r-04
Ap
r-05
Ap
r-06
Ap
r-07
Ap
r-08
Ap
r-09
Ap
r-10
Ap
r-11
Ap
r-12
Ap
r-13
Ap
r-14
Ap
r-15
Ap
r-16
Ap
r-17
Ap
r-18
Ap
r-19
Ap
r-20
Ap
r-21
Fo
rward
P/C
F
Ind
ex
Historical trading rangeJGOLD IndexP/CF - six months forwardForward P/CF multiple (six months forward)
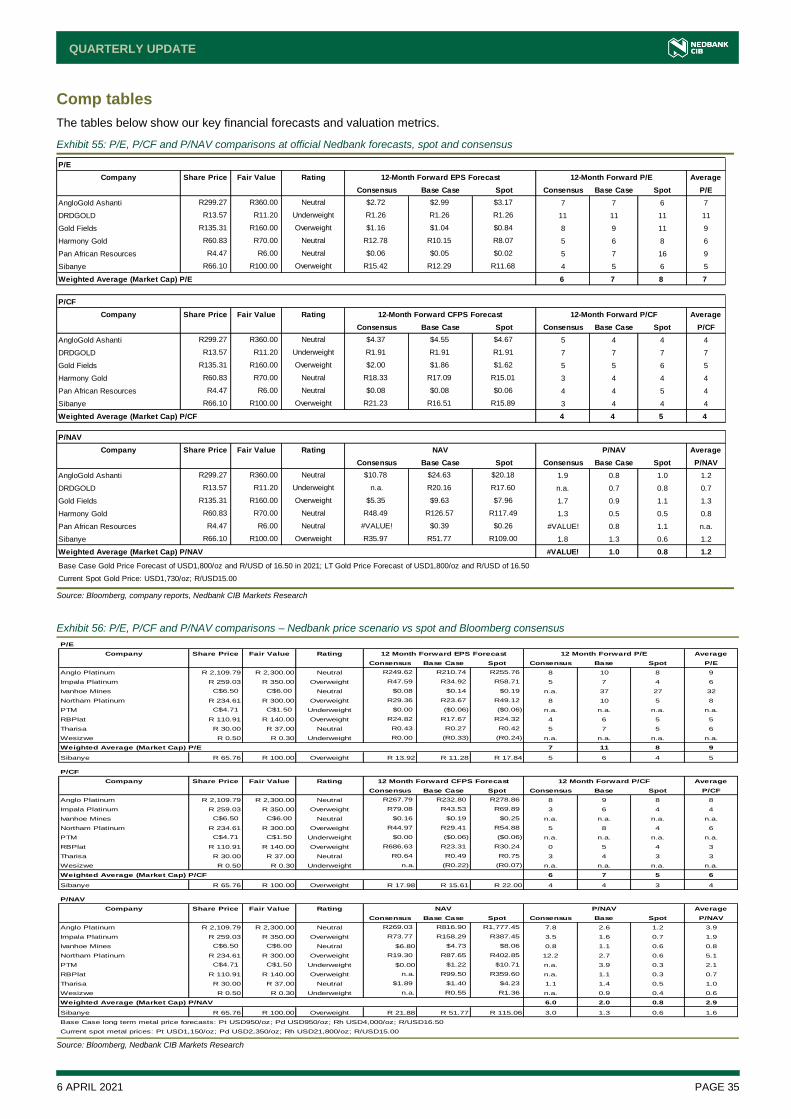
6 APRIL 2021 PAGE 35
QUARTERLY UPDATE
Comp tables
The tables below show our key financial forecasts and valuation metrics.
Exhibit 56: P/E, P/CF and P/NAV comparisons – Nedbank price scenario vs spot and Bloomberg consensus
Source: Bloomberg, Nedbank CIB Markets Research
P/E
Company Share Price Fair Value Rating 12 Month Forward EPS Forecast 12 Month Forward P/E Average
Consensus Base Case Spot Consensus Base Spot P/E
Anglo Platinum R 2,109.79 R 2,300.00 Neutral R249.62 R210.74 R255.76 8 10 8 9
Impala Platinum R 259.03 R 350.00 Overweight R47.59 R34.92 R58.71 5 7 4 6
Ivanhoe Mines C$6.50 C$6.00 Neutral $0.08 $0.14 $0.19 n.a. 37 27 32
Northam Platinum R 234.61 R 300.00 Overweight R29.36 R23.67 R49.12 8 10 5 8
PTM C$4.71 C$1.50 Underweight $0.00 ($0.06) ($0.06) n.a. n.a. n.a. n.a.
RBPlat R 110.91 R 140.00 Overweight R24.82 R17.67 R24.32 4 6 5 5
Tharisa R 30.00 R 37.00 Neutral R0.43 R0.27 R0.42 5 7 5 6
Wesizwe R 0.50 R 0.30 Underweight R0.00 (R0.33) (R0.24) n.a. n.a. n.a. n.a.
Weighted Average (Market Cap) P/E 7 11 8 9
Sibanye R 65.76 R 100.00 Overweight R 13.92 R 11.28 R 17.84 5 6 4 5
P/CF
Company Share Price Fair Value Rating 12 Month Forward CFPS Forecast 12 Month Forward P/CF Average
Consensus Base Case Spot Consensus Base Spot P/CF
Anglo Platinum R 2,109.79 R 2,300.00 Neutral R267.79 R232.80 R278.86 8 9 8 8
Impala Platinum R 259.03 R 350.00 Overweight R79.08 R43.53 R69.89 3 6 4 4
Ivanhoe Mines C$6.50 C$6.00 Neutral $0.16 $0.19 $0.25 n.a. n.a. n.a. n.a.
Northam Platinum R 234.61 R 300.00 Overweight R44.97 R29.41 R54.88 5 8 4 6
PTM C$4.71 C$1.50 Underweight $0.00 ($0.06) ($0.06) n.a. n.a. n.a. n.a.
RBPlat R 110.91 R 140.00 Overweight R686.63 R23.31 R30.24 0 5 4 3
Tharisa R 30.00 R 37.00 Neutral R0.64 R0.49 R0.75 3 4 3 3
Wesizwe R 0.50 R 0.30 Underweight n.a. (R0.22) (R0.07) n.a. n.a. n.a. n.a.
Weighted Average (Market Cap) P/CF 6 7 5 6
Sibanye R 65.76 R 100.00 Overweight R 17.98 R 15.61 R 22.00 4 4 3 4
P/NAV
Company Share Price Fair Value Rating NAV P/NAV Average
Consensus Base Case Spot Consensus Base Spot P/NAV
Anglo Platinum R 2,109.79 R 2,300.00 Neutral R269.03 R816.90 R1,777.45 7.8 2.6 1.2 3.9
Impala Platinum R 259.03 R 350.00 Overweight R73.77 R158.29 R387.45 3.5 1.6 0.7 1.9
Ivanhoe Mines C$6.50 C$6.00 Neutral $6.80 $4.73 $8.06 0.8 1.1 0.6 0.8
Northam Platinum R 234.61 R 300.00 Overweight R19.30 R87.65 R402.85 12.2 2.7 0.6 5.1
PTM C$4.71 C$1.50 Underweight $0.00 $1.22 $10.71 n.a. 3.9 0.3 2.1
RBPlat R 110.91 R 140.00 Overweight n.a. R99.50 R359.60 n.a. 1.1 0.3 0.7
Tharisa R 30.00 R 37.00 Neutral $1.89 $1.40 $4.23 1.1 1.4 0.5 1.0
Wesizwe R 0.50 R 0.30 Underweight n.a. R0.55 R1.36 n.a. 0.9 0.4 0.6
Weighted Average (Market Cap) P/NAV 6.0 2.0 0.8 2.9
Sibanye R 65.76 R 100.00 Overweight R 21.88 R 51.77 R 115.06 3.0 1.3 0.6 1.6
Base Case long term metal price forecasts: Pt USD950/oz; Pd USD950/oz; Rh USD4,000/oz; R/USD16.50
Current spot metal prices: Pt USD1,150/oz; Pd USD2,350/oz; Rh USD21,800/oz; R/USD15.00
Exhibit 55: P/E, P/CF and P/NAV comparisons at official Nedbank forecasts, spot and consensus
Source: Bloomberg, company reports, Nedbank CIB Markets Research
P/E
Company Share Price Fair Value Rating 12-Month Forward EPS Forecast 12-Month Forward P/E Average
Consensus Base Case Spot Consensus Base Case Spot P/E
AngloGold Ashanti R299.27 R360.00 Neutral $2.72 $2.99 $3.17 7 7 6 7
DRDGOLD R13.57 R11.20 Underweight R1.26 R1.26 R1.26 11 11 11 11
Gold Fields R135.31 R160.00 Overweight $1.16 $1.04 $0.84 8 9 11 9
Harmony Gold R60.83 R70.00 Neutral R12.78 R10.15 R8.07 5 6 8 6
Pan African Resources R4.47 R6.00 Neutral $0.06 $0.05 $0.02 5 7 16 9
Sibanye R66.10 R100.00 Overweight R15.42 R12.29 R11.68 4 5 6 5
Weighted Average (Market Cap) P/E 6 7 8 7
P/CF
Company Share Price Fair Value Rating 12-Month Forward CFPS Forecast 12-Month Forward P/CF Average
Consensus Base Case Spot Consensus Base Case Spot P/CF
AngloGold Ashanti R299.27 R360.00 Neutral $4.37 $4.55 $4.67 5 4 4 4
DRDGOLD R13.57 R11.20 Underweight R1.91 R1.91 R1.91 7 7 7 7
Gold Fields R135.31 R160.00 Overweight $2.00 $1.86 $1.62 5 5 6 5
Harmony Gold R60.83 R70.00 Neutral R18.33 R17.09 R15.01 3 4 4 4
Pan African Resources R4.47 R6.00 Neutral $0.08 $0.08 $0.06 4 4 5 4
Sibanye R66.10 R100.00 Overweight R21.23 R16.51 R15.89 3 4 4 4
Weighted Average (Market Cap) P/CF 4 4 5 4Current Spot Gold Price: US$1,730/oz; R/US$15.00"Current Spot Gold Price: US$1,730/oz; R/US$15.00
P/NAV
Company Share Price Fair Value Rating NAV P/NAV Average
Consensus Base Case Spot Consensus Base Case Spot P/NAV
AngloGold Ashanti R299.27 R360.00 Neutral $10.78 $24.63 $20.18 1.9 0.8 1.0 1.2
DRDGOLD R13.57 R11.20 Underweight n.a. R20.16 R17.60 n.a. 0.7 0.8 0.7
Gold Fields R135.31 R160.00 Overweight $5.35 $9.63 $7.96 1.7 0.9 1.1 1.3
Harmony Gold R60.83 R70.00 Neutral R48.49 R126.57 R117.49 1.3 0.5 0.5 0.8
Pan African Resources R4.47 R6.00 Neutral #VALUE! $0.39 $0.26 #VALUE! 0.8 1.1 n.a.
Sibanye R66.10 R100.00 Overweight R35.97 R51.77 R109.00 1.8 1.3 0.6 1.2
Weighted Average (Market Cap) P/NAV #VALUE! 1.0 0.8 1.2
Base Case Gold Price Forecast of USD1,800/oz and R/USD of 16.50 in 2021; LT Gold Price Forecast of USD1,800/oz and R/USD of 16.50
Current Spot Gold Price: USD1,730/oz; R/USD15.00
6 APRIL 2021 PAGE 36
QUARTERLY UPDATE
Telecommunications and media
MTN’s FY20 results were a watershed moment, and in equal measure, revitalised and de-risked its investment case. The historical overhang related to dividend dependency/limitation due to HO debt restrictions has been lifted, effective deleveraging will take place operationally and be further boosted by higher probabilities of ARP execution in CY 2021 (IHS IPO, Nigeria sell-down, SA tower deal, etc.). Dividend transparency has been de-risked, and at a R2.60 base, an effective yield underpin has been created with scope for substantial cash return (ordinary, special and buyback) transformation over the next 12-24 months. Importantly, strong execution on top-line growth will be accompanied by positive leverage on EBITDA (Cell C roaming deal for SA, new MTN Nigeria tower contract, R5bn in digital cost savings, etc.) and earnings (lower effective finance costs), despite ongoing volatility and cautious forecasts on key market FX evolution. We believe the asset/product unbundling strategy for Fintech and Fibre assets will gradually gain investor favour over the medium term and unlock meaningful value. A standalone Mpesa-like fintech business could trade at 14-16x EV/EBITDA (35-40% margin, 3-4% capex intensity) and a pure fibreco fair value multiple (taking into account Africa cost of capital and DM/towerco takeover premiums) could be around 9x – both substantially higher then MTN Group’s current EV/EBITDA of 4.3x.
Stickiness to data consumption will keep Vodacom SA data revenue in double-digit growth territory. Despite further monthly data price cuts (15%) expected from 1 April, we believe the “new normal” of working from home and learning from home is likely to keep demand for data high. Increased roaming revenue from Cell C’s contract base will more than offset the loss in revenue from the Treasury contract that comes to an end in the coming weeks. Data price floors, resumption of P2P money transfer fees and improving macroeconomic activity will drive constant-currency revenue growth in Vodacom’s international markets.
Telkom’s 3Q update was characterised by meaningful FCF and net debt upgrades, in addition to our 0.9%/5.7% FY21e/FY22e EBITDA upgrades. Slightly softer mobile trends were more than offset by improved opex/EBITDA trends for Fixed-line, BCX and Openserve relative to our expectations. Even adjusting for COVID-19-induced reductions in capex, we note that the 3Q FCF margin pre-capex and VERP cost of 33.2% was 13.2% above 1H 2021 levels of 20.0%. Non-cash, seasonal and working capital items (collections, supply chain and handset financing, etc.) are driving structural expansion of FCF margins at Telkom, which underpins our improved gearing (IAS17 0.8-0.9x over the medium term, including R3bn spectrum outlay) and FCF outlook (R2.7-2.8bn annually).
Legal challenges are delaying spectrum auctions, but extension of the free access to temporary spectrum is providing some reprieve to operators. Interdicts granted to Telkom have stalled SA’s first-ever planned spectrum auction. The ICASA has extended free temporary access to spectrum to the end of May, and has also indicated its intention to challenge Telkom’s interdict.
Over the past 12 months, a key determinant of Naspers (NPN)/Prosus (PRX) market performance and associated discount dynamics has been the sharp rerating of Tencent (c.61% since mid-March 2020 lows). PRX has outperformed NPN since it more efficiently captures Tencent’s value accretion, as NPN carries a SWIX weighting dilution and a “double-discount” holding-company structure.
We look more closely at mainland flows into Hong Kong (HK) from the Shanghai (SHG)/Shenzhen (SHZ) Connect programmes and attempt to gauge their impact on and implications for NPN/PRX share prices.
We highlight below our investment thesis for the stocks over the next 12 months:
MTN Group (Overweight, TP: R114) The investment case for MTN Group has been revitalised and de-risked in equal measure following its FY20 results. The historical overhang related to dividend dependency/limitation due to HO debt restrictions has been lifted, effective deleveraging will take place operationally and be further boosted by higher probabilities of ARP execution in CY 2021 (IHS IPO, Nigeria sell-down, SA tower deal, etc.). Dividend transparency has been de-risked, and at a R2.60 base, an effective yield underpin has been created with scope for substantial cash return (ordinary, special and buyback) transformation over the next 12-24 months. Importantly, strong execution on top-line growth will be accompanied by positive leverage on EBITDA (Cell C roaming deal, new MTN Nigeria tower contract, R5bn in digital cost savings, etc.) and earnings (lower effective finance costs), despite ongoing volatility and cautious
Preshendran Odayar
Ziyad Joosub
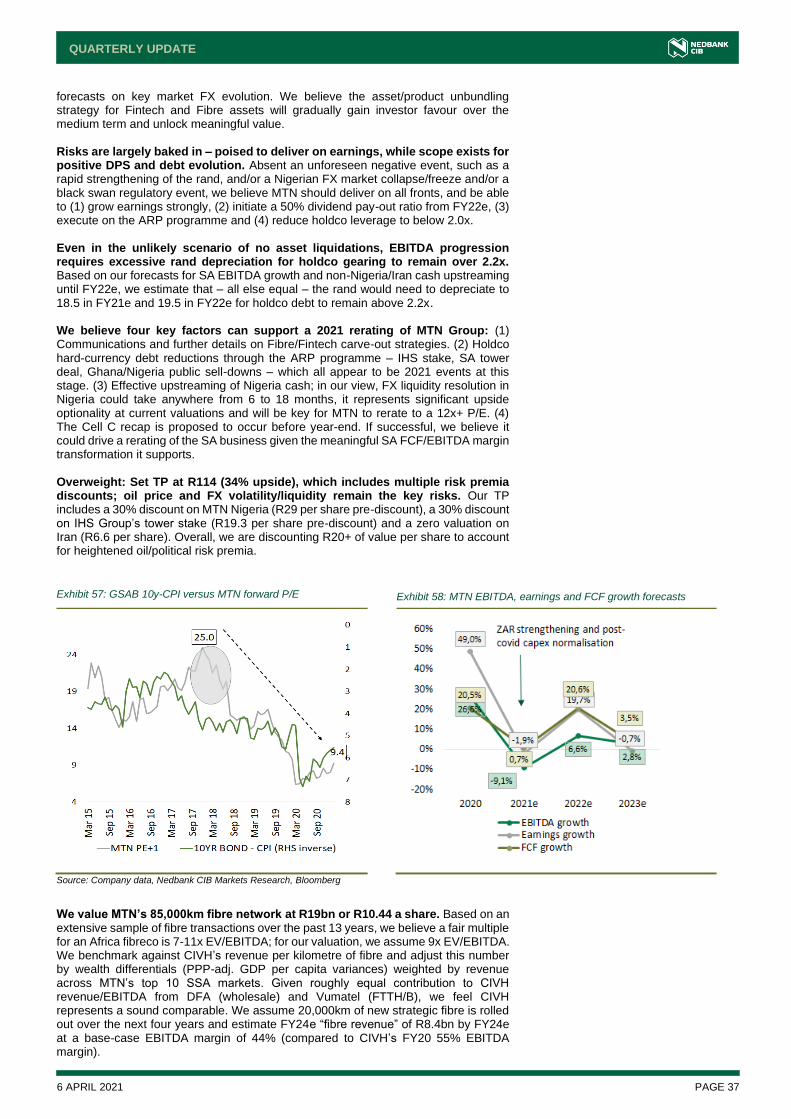
6 APRIL 2021 PAGE 37
QUARTERLY UPDATE
forecasts on key market FX evolution. We believe the asset/product unbundling strategy for Fintech and Fibre assets will gradually gain investor favour over the medium term and unlock meaningful value. Risks are largely baked in – poised to deliver on earnings, while scope exists for positive DPS and debt evolution. Absent an unforeseen negative event, such as a rapid strengthening of the rand, and/or a Nigerian FX market collapse/freeze and/or a black swan regulatory event, we believe MTN should deliver on all fronts, and be able to (1) grow earnings strongly, (2) initiate a 50% dividend pay-out ratio from FY22e, (3) execute on the ARP programme and (4) reduce holdco leverage to below 2.0x. Even in the unlikely scenario of no asset liquidations, EBITDA progression requires excessive rand depreciation for holdco gearing to remain over 2.2x. Based on our forecasts for SA EBITDA growth and non-Nigeria/Iran cash upstreaming until FY22e, we estimate that – all else equal – the rand would need to depreciate to 18.5 in FY21e and 19.5 in FY22e for holdco debt to remain above 2.2x. We believe four key factors can support a 2021 rerating of MTN Group: (1) Communications and further details on Fibre/Fintech carve-out strategies. (2) Holdco hard-currency debt reductions through the ARP programme – IHS stake, SA tower deal, Ghana/Nigeria public sell-downs – which all appear to be 2021 events at this stage. (3) Effective upstreaming of Nigeria cash; in our view, FX liquidity resolution in Nigeria could take anywhere from 6 to 18 months, it represents significant upside optionality at current valuations and will be key for MTN to rerate to a 12x+ P/E. (4) The Cell C recap is proposed to occur before year-end. If successful, we believe it could drive a rerating of the SA business given the meaningful SA FCF/EBITDA margin transformation it supports. Overweight: Set TP at R114 (34% upside), which includes multiple risk premia discounts; oil price and FX volatility/liquidity remain the key risks. Our TP includes a 30% discount on MTN Nigeria (R29 per share pre-discount), a 30% discount on IHS Group’s tower stake (R19.3 per share pre-discount) and a zero valuation on Iran (R6.6 per share). Overall, we are discounting R20+ of value per share to account for heightened oil/political risk premia.
Exhibit 57: GSAB 10y-CPI versus MTN forward P/E Exhibit 58: MTN EBITDA, earnings and FCF growth forecasts
Source: Company data, Nedbank CIB Markets Research, Bloomberg
We value MTN’s 85,000km fibre network at R19bn or R10.44 a share. Based on an extensive sample of fibre transactions over the past 13 years, we believe a fair multiple for an Africa fibreco is 7-11x EV/EBITDA; for our valuation, we assume 9x EV/EBITDA. We benchmark against CIVH’s revenue per kilometre of fibre and adjust this number by wealth differentials (PPP-adj. GDP per capita variances) weighted by revenue across MTN’s top 10 SSA markets. Given roughly equal contribution to CIVH revenue/EBITDA from DFA (wholesale) and Vumatel (FTTH/B), we feel CIVH represents a sound comparable. We assume 20,000km of new strategic fibre is rolled out over the next four years and estimate FY24e “fibre revenue” of R8.4bn by FY24e at a base-case EBITDA margin of 44% (compared to CIVH’s FY20 55% EBITDA margin).
6 APRIL 2021 PAGE 38
QUARTERLY UPDATE
Fintech valuation established at R47.7 (R87bn), of which R15.9 is already built in; implied upside is R31.8. The Fintech carve-out will take months if not the full year. MTN will start at the opco level and then split opco/Fintech, which have similar mapping with minorities, and create appropriate reporting lines. Once the split at an opco level is completed, MTN will consolidate all the Fintech business into a “topco” fintech entity. Our valuation is driven by the following: (1) A four-year Fintech revenue CAGR of 20.5%; this is conservative, as it implies 16% Fintech contribution in FY24e to service revenue versus management’s target of 20%. (2) EBITDA margin assumption of 44% versus Airtel Africa’s disclosed mobile money (MoMo) margin of 50.6%. (3) Terminal-year valuation multiple assumption of 12x EV/EBITDA, based on the 12.2x transaction multiple that The Rise Fund paid for an approximately 7.5% stake in Airtel Africa’s MoMo business on 18 March 2021 – reflecting a valuation for the MoMo business of USD2.65bn/R40bn.
Please see our note MTN Group Ltd: Added optionality – R42 upside from Fibre (R10.44) and Fintech (R31.80) for more details.
Vodacom Group (Overweight, TP: R158) Overall, Group growth prospects have improved; we are more constructive on SA data growth and, consequently, SA FCF margin transformation; the progressive dividend thesis is firmly in place despite the COVID-19-induced macro slowdown. While operational performance is challenging and FX tailwinds are fading for the International Mobile segment, low base effects for SA data and Safaricom underpin our 8.0%/9.5% two-year HEPS/FCF CAGR forecasts for Vodacom Group. We forecast that the FCF margin will expand from 19.6% in FY20 to 21.2% in FY22e. Given the COVID-19 backdrop, growth metrics, FX risk and defensiveness of revenue streams are best-in-class relative to other SA industrials’. Vodacom SA is coming off a low FY20 revenue base with clear growth vectors. These include (1) data monetisation ramping up as less steep price declines support better data conversions despite slower data traffic growth as we exit lockdown cycles, (2) roaming revenue likely to be boosted by larger contractual agreements from February 2021 with Cell C – we note margin on roaming revenue is 80% and (3) IoT.next displaying impressive growth dynamics and driving effective opex savings in relation to network costs. We expect SA service revenue growth of 6.5% in 1H21e to ease slightly to 5.5%/6.0% in 2H21e/FY21e. We believe SA data revenue will maintain double-digit growth over the next 12 months. Vodacom saw its deepest effective data revenue price cuts in 1Q21 as a result of Competition Commission-induced price cuts. Despite this, data demand has increased, and we estimate that data revenue growth of 13.1% was achieved in 3Q21 compared to 14.8%/9.0% in 2Q21/1Q21. We believe concerns about a step down in the pace of data revenue growth is unwarranted due to (1) additional spectrum likely to be allocated on a permanent basis from a cheaper spectrum auction expected at the end of 1Q21, (2) regulatory headwinds from the Competition Commission and the ICASA being firmly in the base/past and (3) sensible competition from Telkom and Cell C in terms of pricing – to which Vodacom has significantly narrowed from what once was a wide pricing gap. Stickiness to M-Pesa will remain despite gradual introduction of fees. While Vodacom’s international operations (including Safaricom) suffered a c.R1.6bn loss in 1H 2021 revenue as a result of free P2P transfers in many markets, the increase in merchants and number of transactions on the platform has been massive (c.77% increase in merchants and c.48% increase in monthly transactions per user). In certain markets where Vodacom has begun reintroducing discounted fees on P2P transfers, the drop in transaction volumes has been negligible. We, therefore, believe that once it begins reintroducing P2P transfer fees in Kenya (albeit at significantly lower rates than pre-COVID-19 levels), its heightened stickiness to the platform will remain and provide a meaningful boost to M-Pesa revenue from 4Q21. Maintain Overweight and increase SoTP-based TP 1.9% to R158 (22% upside); while cognisant of certain risks, we believe SA positives more than offset these. International Mobile operational weakness, reduced FX tailwinds and SA enterprise/roaming revenue volatility are valid risks, but remain marginal, in our view, compared to the data/competition/spectrum positives set to play out across the SA mobile landscape. Vodacom will convert incremental data revenue most efficiently to FCF, supporting a multiple rerating cycle. Opex is well managed, and EBITDA dilution from the Rain two-way spectrum/facility leasing arrangement is modest; also, more
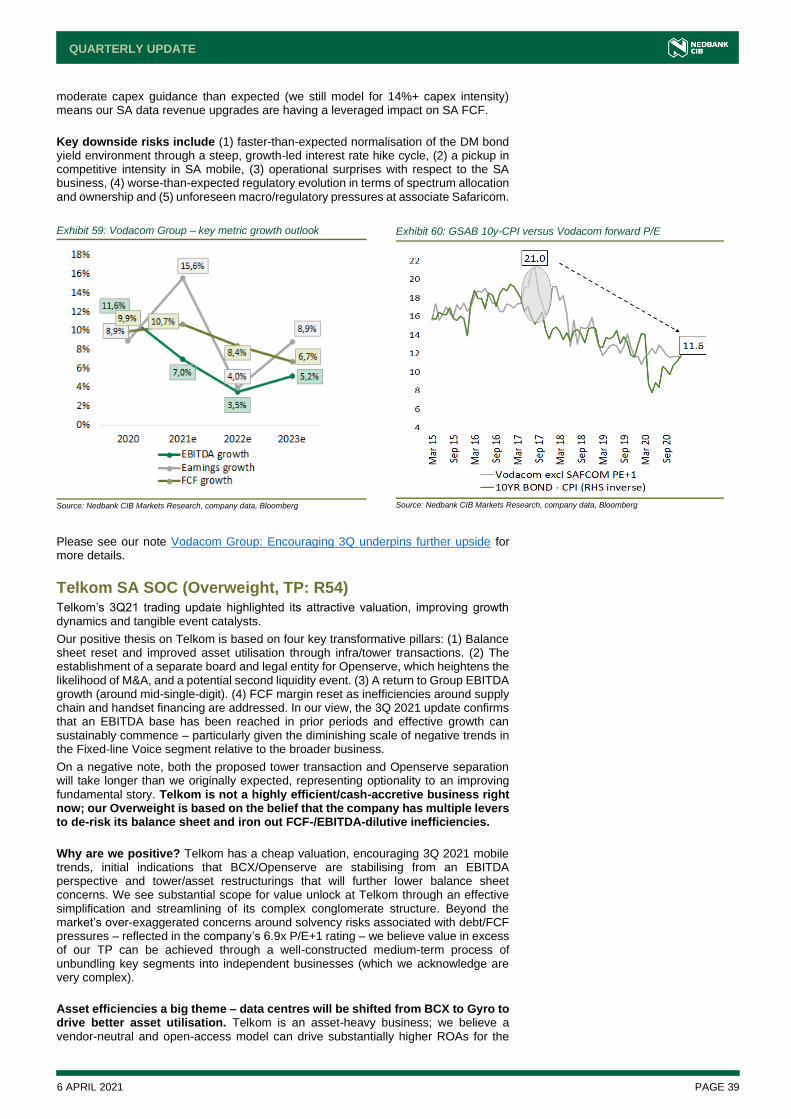
6 APRIL 2021 PAGE 39
QUARTERLY UPDATE
moderate capex guidance than expected (we still model for 14%+ capex intensity) means our SA data revenue upgrades are having a leveraged impact on SA FCF.
Key downside risks include (1) faster-than-expected normalisation of the DM bond yield environment through a steep, growth-led interest rate hike cycle, (2) a pickup in competitive intensity in SA mobile, (3) operational surprises with respect to the SA business, (4) worse-than-expected regulatory evolution in terms of spectrum allocation and ownership and (5) unforeseen macro/regulatory pressures at associate Safaricom.
Please see our note Vodacom Group: Encouraging 3Q underpins further upside for more details.
Telkom SA SOC (Overweight, TP: R54) Telkom’s 3Q21 trading update highlighted its attractive valuation, improving growth dynamics and tangible event catalysts.
Our positive thesis on Telkom is based on four key transformative pillars: (1) Balance sheet reset and improved asset utilisation through infra/tower transactions. (2) The establishment of a separate board and legal entity for Openserve, which heightens the likelihood of M&A, and a potential second liquidity event. (3) A return to Group EBITDA growth (around mid-single-digit). (4) FCF margin reset as inefficiencies around supply chain and handset financing are addressed. In our view, the 3Q 2021 update confirms that an EBITDA base has been reached in prior periods and effective growth can sustainably commence – particularly given the diminishing scale of negative trends in the Fixed-line Voice segment relative to the broader business.
On a negative note, both the proposed tower transaction and Openserve separation will take longer than we originally expected, representing optionality to an improving fundamental story. Telkom is not a highly efficient/cash-accretive business right now; our Overweight is based on the belief that the company has multiple levers to de-risk its balance sheet and iron out FCF-/EBITDA-dilutive inefficiencies.
Why are we positive? Telkom has a cheap valuation, encouraging 3Q 2021 mobile trends, initial indications that BCX/Openserve are stabilising from an EBITDA perspective and tower/asset restructurings that will further lower balance sheet concerns. We see substantial scope for value unlock at Telkom through an effective simplification and streamlining of its complex conglomerate structure. Beyond the market’s over-exaggerated concerns around solvency risks associated with debt/FCF pressures – reflected in the company’s 6.9x P/E+1 rating – we believe value in excess of our TP can be achieved through a well-constructed medium-term process of unbundling key segments into independent businesses (which we acknowledge are very complex).
Asset efficiencies a big theme – data centres will be shifted from BCX to Gyro to drive better asset utilisation. Telkom is an asset-heavy business; we believe a vendor-neutral and open-access model can drive substantially higher ROAs for the
Exhibit 59: Vodacom Group – key metric growth outlook
Source: Nedbank CIB Markets Research, company data, Bloomberg
Exhibit 60: GSAB 10y-CPI versus Vodacom forward P/E
Source: Nedbank CIB Markets Research, company data, Bloomberg
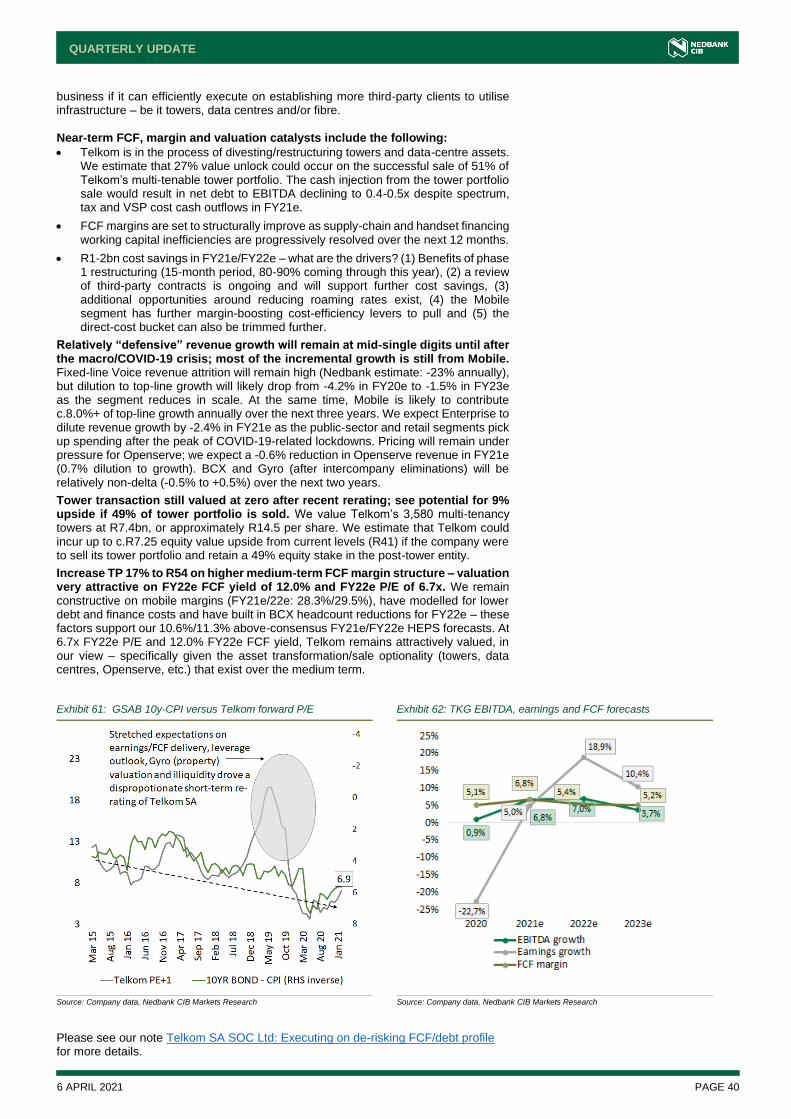
6 APRIL 2021 PAGE 40
QUARTERLY UPDATE
business if it can efficiently execute on establishing more third-party clients to utilise infrastructure – be it towers, data centres and/or fibre. Near-term FCF, margin and valuation catalysts include the following:
• Telkom is in the process of divesting/restructuring towers and data-centre assets. We estimate that 27% value unlock could occur on the successful sale of 51% of Telkom’s multi-tenable tower portfolio. The cash injection from the tower portfolio sale would result in net debt to EBITDA declining to 0.4-0.5x despite spectrum, tax and VSP cost cash outflows in FY21e.
• FCF margins are set to structurally improve as supply-chain and handset financing working capital inefficiencies are progressively resolved over the next 12 months.
• R1-2bn cost savings in FY21e/FY22e – what are the drivers? (1) Benefits of phase 1 restructuring (15-month period, 80-90% coming through this year), (2) a review of third-party contracts is ongoing and will support further cost savings, (3) additional opportunities around reducing roaming rates exist, (4) the Mobile segment has further margin-boosting cost-efficiency levers to pull and (5) the direct-cost bucket can also be trimmed further.
Relatively “defensive” revenue growth will remain at mid-single digits until after the macro/COVID-19 crisis; most of the incremental growth is still from Mobile. Fixed-line Voice revenue attrition will remain high (Nedbank estimate: -23% annually), but dilution to top-line growth will likely drop from -4.2% in FY20e to -1.5% in FY23e as the segment reduces in scale. At the same time, Mobile is likely to contribute c.8.0%+ of top-line growth annually over the next three years. We expect Enterprise to dilute revenue growth by -2.4% in FY21e as the public-sector and retail segments pick up spending after the peak of COVID-19-related lockdowns. Pricing will remain under pressure for Openserve; we expect a -0.6% reduction in Openserve revenue in FY21e (0.7% dilution to growth). BCX and Gyro (after intercompany eliminations) will be relatively non-delta (-0.5% to +0.5%) over the next two years.
Tower transaction still valued at zero after recent rerating; see potential for 9% upside if 49% of tower portfolio is sold. We value Telkom’s 3,580 multi-tenancy towers at R7.4bn, or approximately R14.5 per share. We estimate that Telkom could incur up to c.R7.25 equity value upside from current levels (R41) if the company were to sell its tower portfolio and retain a 49% equity stake in the post-tower entity.
Increase TP 17% to R54 on higher medium-term FCF margin structure – valuation very attractive on FY22e FCF yield of 12.0% and FY22e P/E of 6.7x. We remain constructive on mobile margins (FY21e/22e: 28.3%/29.5%), have modelled for lower debt and finance costs and have built in BCX headcount reductions for FY22e – these factors support our 10.6%/11.3% above-consensus FY21e/FY22e HEPS forecasts. At 6.7x FY22e P/E and 12.0% FY22e FCF yield, Telkom remains attractively valued, in our view – specifically given the asset transformation/sale optionality (towers, data centres, Openserve, etc.) that exist over the medium term.
Exhibit 61: GSAB 10y-CPI versus Telkom forward P/E Exhibit 62: TKG EBITDA, earnings and FCF forecasts
Source: Company data, Nedbank CIB Markets Research
Source: Company data, Nedbank CIB Markets Research
Please see our note Telkom SA SOC Ltd: Executing on de-risking FCF/debt profile for more details.
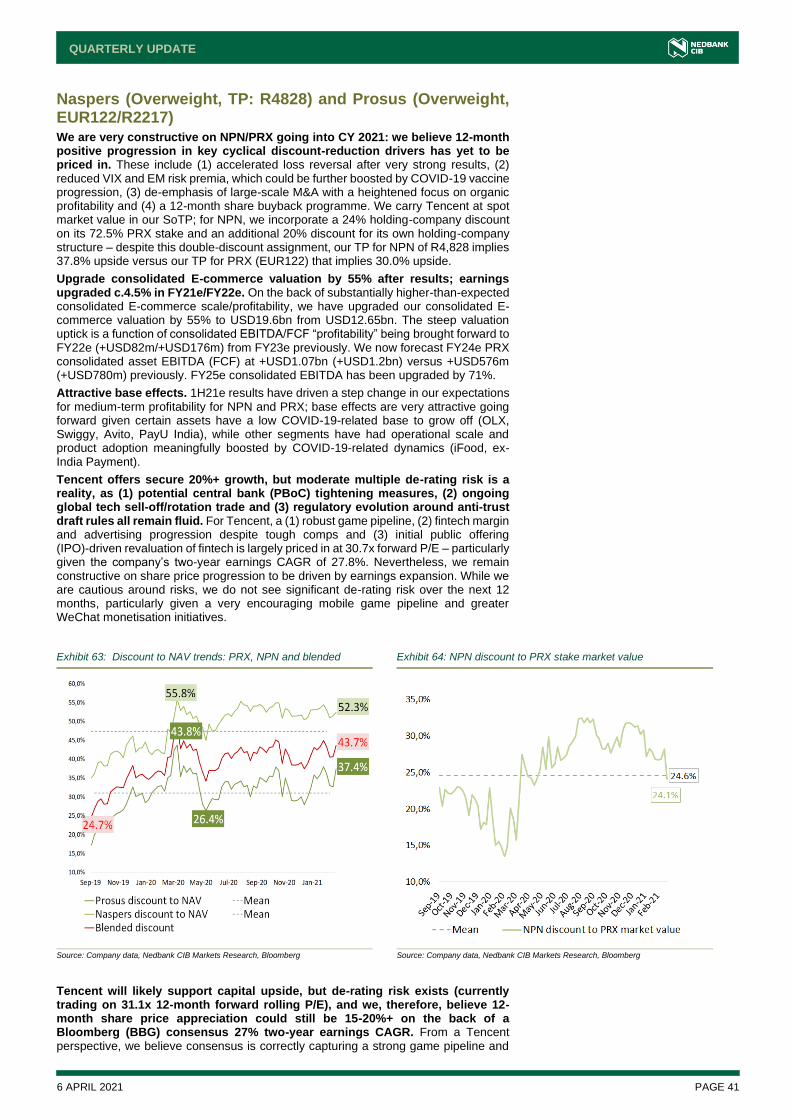
6 APRIL 2021 PAGE 41
QUARTERLY UPDATE
Naspers (Overweight, TP: R4828) and Prosus (Overweight, EUR122/R2217) We are very constructive on NPN/PRX going into CY 2021: we believe 12-month positive progression in key cyclical discount-reduction drivers has yet to be priced in. These include (1) accelerated loss reversal after very strong results, (2) reduced VIX and EM risk premia, which could be further boosted by COVID-19 vaccine progression, (3) de-emphasis of large-scale M&A with a heightened focus on organic profitability and (4) a 12-month share buyback programme. We carry Tencent at spot market value in our SoTP; for NPN, we incorporate a 24% holding-company discount on its 72.5% PRX stake and an additional 20% discount for its own holding-company structure – despite this double-discount assignment, our TP for NPN of R4,828 implies 37.8% upside versus our TP for PRX (EUR122) that implies 30.0% upside.
Upgrade consolidated E-commerce valuation by 55% after results; earnings upgraded c.4.5% in FY21e/FY22e. On the back of substantially higher-than-expected consolidated E-commerce scale/profitability, we have upgraded our consolidated E-commerce valuation by 55% to USD19.6bn from USD12.65bn. The steep valuation uptick is a function of consolidated EBITDA/FCF “profitability” being brought forward to FY22e (+USD82m/+USD176m) from FY23e previously. We now forecast FY24e PRX consolidated asset EBITDA (FCF) at +USD1.07bn (+USD1.2bn) versus +USD576m (+USD780m) previously. FY25e consolidated EBITDA has been upgraded by 71%.
Attractive base effects. 1H21e results have driven a step change in our expectations for medium-term profitability for NPN and PRX; base effects are very attractive going forward given certain assets have a low COVID-19-related base to grow off (OLX, Swiggy, Avito, PayU India), while other segments have had operational scale and product adoption meaningfully boosted by COVID-19-related dynamics (iFood, ex-India Payment).
Tencent offers secure 20%+ growth, but moderate multiple de-rating risk is a reality, as (1) potential central bank (PBoC) tightening measures, (2) ongoing global tech sell-off/rotation trade and (3) regulatory evolution around anti-trust draft rules all remain fluid. For Tencent, a (1) robust game pipeline, (2) fintech margin and advertising progression despite tough comps and (3) initial public offering (IPO)-driven revaluation of fintech is largely priced in at 30.7x forward P/E – particularly given the company’s two-year earnings CAGR of 27.8%. Nevertheless, we remain constructive on share price progression to be driven by earnings expansion. While we are cautious around risks, we do not see significant de-rating risk over the next 12 months, particularly given a very encouraging mobile game pipeline and greater WeChat monetisation initiatives.
Exhibit 63: Discount to NAV trends: PRX, NPN and blended Exhibit 64: NPN discount to PRX stake market value
Source: Company data, Nedbank CIB Markets Research, Bloomberg
Source: Company data, Nedbank CIB Markets Research, Bloomberg
Tencent will likely support capital upside, but de-rating risk exists (currently trading on 31.1x 12-month forward rolling P/E), and we, therefore, believe 12- month share price appreciation could still be 15-20%+ on the back of a Bloomberg (BBG) consensus 27% two-year earnings CAGR. From a Tencent perspective, we believe consensus is correctly capturing a strong game pipeline and
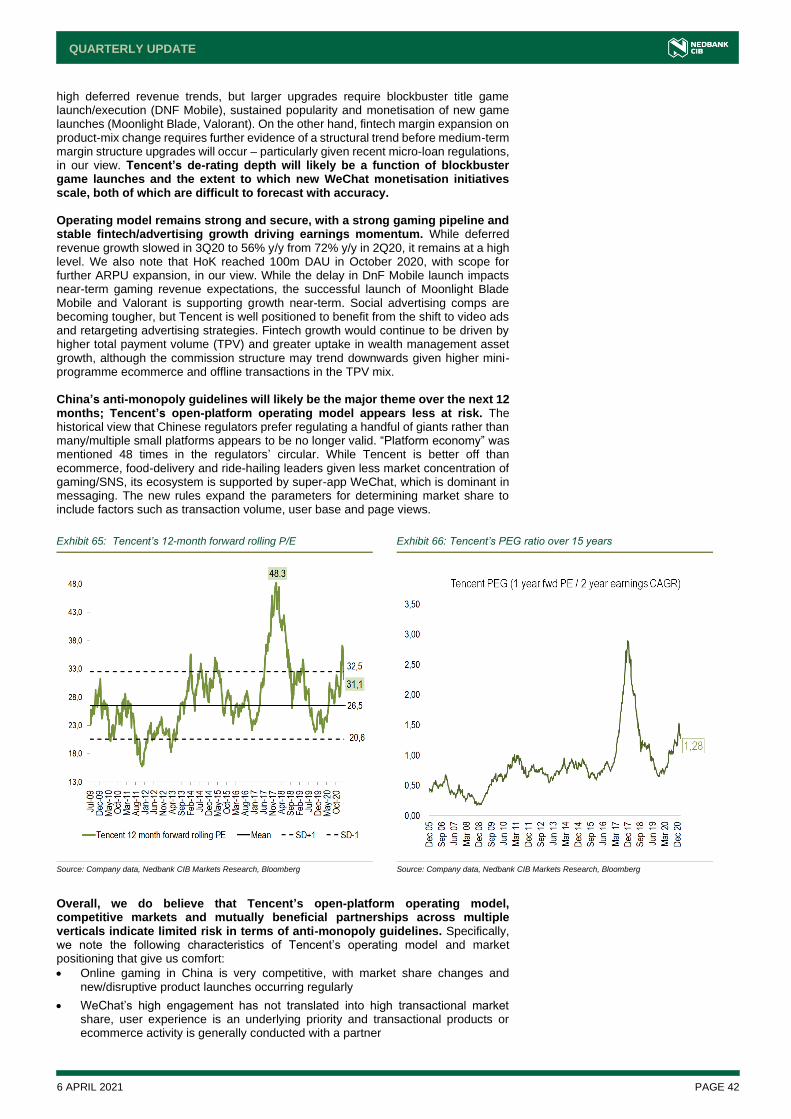
6 APRIL 2021 PAGE 42
QUARTERLY UPDATE
high deferred revenue trends, but larger upgrades require blockbuster title game launch/execution (DNF Mobile), sustained popularity and monetisation of new game launches (Moonlight Blade, Valorant). On the other hand, fintech margin expansion on product-mix change requires further evidence of a structural trend before medium-term margin structure upgrades will occur – particularly given recent micro-loan regulations, in our view. Tencent’s de-rating depth will likely be a function of blockbuster game launches and the extent to which new WeChat monetisation initiatives scale, both of which are difficult to forecast with accuracy. Operating model remains strong and secure, with a strong gaming pipeline and stable fintech/advertising growth driving earnings momentum. While deferred revenue growth slowed in 3Q20 to 56% y/y from 72% y/y in 2Q20, it remains at a high level. We also note that HoK reached 100m DAU in October 2020, with scope for further ARPU expansion, in our view. While the delay in DnF Mobile launch impacts near-term gaming revenue expectations, the successful launch of Moonlight Blade Mobile and Valorant is supporting growth near-term. Social advertising comps are becoming tougher, but Tencent is well positioned to benefit from the shift to video ads and retargeting advertising strategies. Fintech growth would continue to be driven by higher total payment volume (TPV) and greater uptake in wealth management asset growth, although the commission structure may trend downwards given higher mini-programme ecommerce and offline transactions in the TPV mix. China’s anti-monopoly guidelines will likely be the major theme over the next 12 months; Tencent’s open-platform operating model appears less at risk. The historical view that Chinese regulators prefer regulating a handful of giants rather than many/multiple small platforms appears to be no longer valid. “Platform economy” was mentioned 48 times in the regulators’ circular. While Tencent is better off than ecommerce, food-delivery and ride-hailing leaders given less market concentration of gaming/SNS, its ecosystem is supported by super-app WeChat, which is dominant in messaging. The new rules expand the parameters for determining market share to include factors such as transaction volume, user base and page views.
Exhibit 65: Tencent’s 12-month forward rolling P/E Exhibit 66: Tencent’s PEG ratio over 15 years
Source: Company data, Nedbank CIB Markets Research, Bloomberg
Source: Company data, Nedbank CIB Markets Research, Bloomberg
Overall, we do believe that Tencent’s open-platform operating model, competitive markets and mutually beneficial partnerships across multiple verticals indicate limited risk in terms of anti-monopoly guidelines. Specifically, we note the following characteristics of Tencent’s operating model and market positioning that give us comfort:
• Online gaming in China is very competitive, with market share changes and new/disruptive product launches occurring regularly
• WeChat’s high engagement has not translated into high transactional market share, user experience is an underlying priority and transactional products or ecommerce activity is generally conducted with a partner

6 APRIL 2021 PAGE 43
QUARTERLY UPDATE
• Social networking has multiple competitor firms that are well established (Weibo) and/or are gaining market share (Douyin/TikTok)
• Tencent has always been compliant and prudent in following regulations in the past; we also do not see an ability to abuse market power through pricing in gaming and/or SNS
Tencent has traded on a 30.5x forward P/E on average over the past five years; thus, while tech-related names are selling off globally (rising yields, reflation trade), we do not see scope for a significant de-rating from current levels – unless we have very adverse evolution in regulations and/or a sharper global tech sell-off. Valuation may appear moderately lofty, but on the FCF metrics above, mean multiples are warranted. Tencent is forecast to grow operating cash flow by 29.8% in 2020e, largely in line with its five-year average – we find this impressive given the macro/COVID-19-related challenges this year (advertising headwinds) as well as the fintech/content (music/video) scale the company has achieved through multi-year investment programmes. 12-month catalysts: (1) Fintech peer IPO activity and additional segment disclosure could drive a rerating of the fintech sector over the next 12 months, (2) a shorter launch cycle for key online gaming titles combined with better monetisation of 3Q 2020 launches (JX Mobile 2, Dragon Nest mobile), (3) more rapid product-mix evolution and, thus, GP margin expansion for the fintech segment, (4) better-than-expected opex trends supporting non-GAAP operating profit margin beats, (5) minimal operating impact from proposed anti-monopoly guidelines and (6) greater WeChat monetisation.
Please see our Naspers/Prosus: Tencent P/E analysis – made in (mainland) China note for more details.
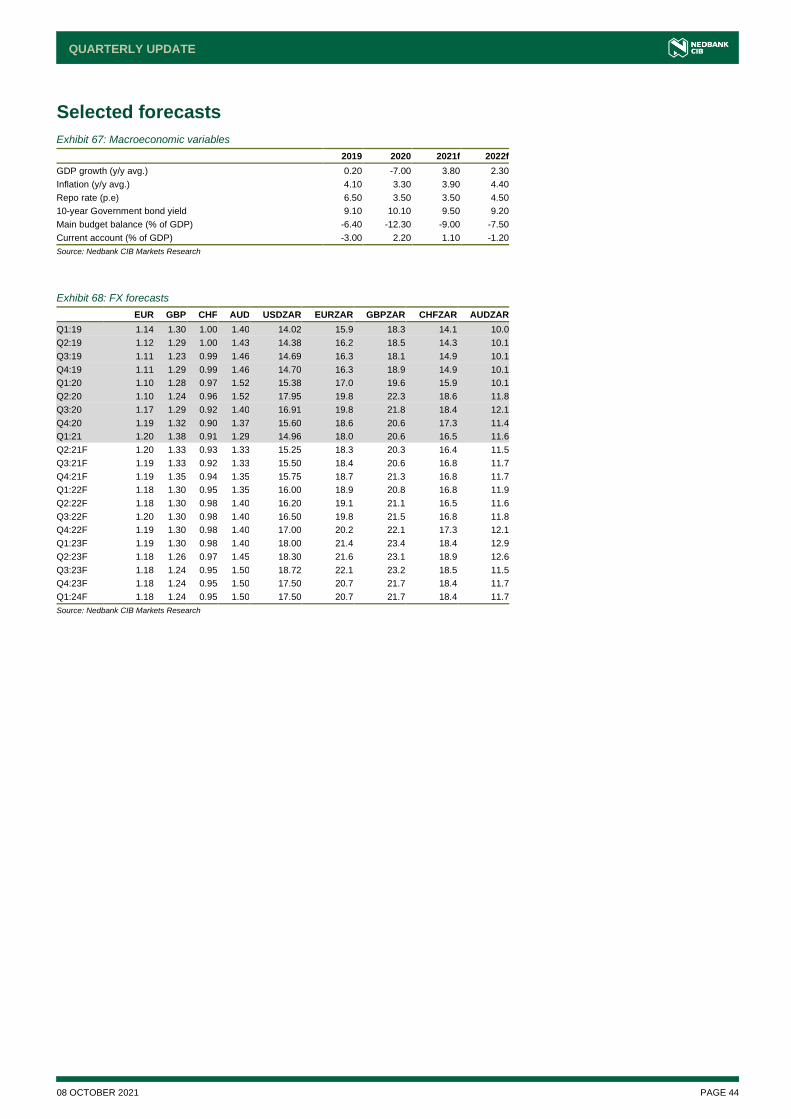
QUARTERLY UPDATE
08 OCTOBER 2021 PAGE 44
Selected forecasts
Exhibit 67: Macroeconomic variables
2019 2020 2021f 2022f
GDP growth (y/y avg.) 0.20 -7.00 3.80 2.30
Inflation (y/y avg.) 4.10 3.30 3.90 4.40
Repo rate (p.e) 6.50 3.50 3.50 4.50
10-year Government bond yield 9.10 10.10 9.50 9.20
Main budget balance (% of GDP) -6.40 -12.30 -9.00 -7.50
Current account (% of GDP) -3.00 2.20 1.10 -1.20
Source: Nedbank CIB Markets Research
Exhibit 68: FX forecasts
EUR GBP CHF AUD USDZAR EURZAR GBPZAR CHFZAR AUDZAR
Q1:19 1.14 1.30 1.00 1.40 14.02 15.9 18.3 14.1 10.0
Q2:19 1.12 1.29 1.00 1.43 14.38 16.2 18.5 14.3 10.1
Q3:19 1.11 1.23 0.99 1.46 14.69 16.3 18.1 14.9 10.1
Q4:19 1.11 1.29 0.99 1.46 14.70 16.3 18.9 14.9 10.1
Q1:20 1.10 1.28 0.97 1.52 15.38 17.0 19.6 15.9 10.1
Q2:20 1.10 1.24 0.96 1.52 17.95 19.8 22.3 18.6 11.8
Q3:20 1.17 1.29 0.92 1.40 16.91 19.8 21.8 18.4 12.1
Q4:20 1.19 1.32 0.90 1.37 15.60 18.6 20.6 17.3 11.4
Q1:21 1.20 1.38 0.91 1.29 14.96 18.0 20.6 16.5 11.6
Q2:21F 1.20 1.33 0.93 1.33 15.25 18.3 20.3 16.4 11.5
Q3:21F 1.19 1.33 0.92 1.33 15.50 18.4 20.6 16.8 11.7
Q4:21F 1.19 1.35 0.94 1.35 15.75 18.7 21.3 16.8 11.7
Q1:22F 1.18 1.30 0.95 1.35 16.00 18.9 20.8 16.8 11.9
Q2:22F 1.18 1.30 0.98 1.40 16.20 19.1 21.1 16.5 11.6
Q3:22F 1.20 1.30 0.98 1.40 16.50 19.8 21.5 16.8 11.8
Q4:22F 1.19 1.30 0.98 1.40 17.00 20.2 22.1 17.3 12.1
Q1:23F 1.19 1.30 0.98 1.40 18.00 21.4 23.4 18.4 12.9
Q2:23F 1.18 1.26 0.97 1.45 18.30 21.6 23.1 18.9 12.6
Q3:23F 1.18 1.24 0.95 1.50 18.72 22.1 23.2 18.5 11.5
Q4:23F 1.18 1.24 0.95 1.50 17.50 20.7 21.7 18.4 11.7
Q1:24F 1.18 1.24 0.95 1.50 17.50 20.7 21.7 18.4 11.7
Source: Nedbank CIB Markets Research
6 APRIL 2021 PAGE 45
QUARTERLY UPDATE
Contact details
Disclaimer
Please click here to view our Nedbank CIB disclaimer
Recommendation structure
We use a relative rating system using terms such as Overweight, Neutral, and Underweight. Overweight: Over the next 12 to 18 months this stock’s total return is expected to outperform the average total return of the stocks in the analyst’s coverage universe Neutral: Over the next 12 to 18 months this stock’s total return is expected to perform in line with the average total return of the stocks in the analyst’s coverage universe Underweight: Over the next 12 to 18 months this stock’s total return is expected to underperform the average total return of the stocks in the analyst’s coverage universe Not rated: We do not maintain an investment recommendation on this stock. Restricted: We are restricted from rating this stock due to a potential conflict of interest, or for legal/policy/regulatory issues Fair value: The fair value is the level the stock should currently trade at if the market were to accept the analyst's view of the stock and if the necessary catalysts were in place to effect this change in perception within the performance horizon. In this way, therefore, the fair value abstracts from the need to take a view on the market or sector. If it is felt that the catalysts are not fully in place to effect a re-rating of the stock to its warranted fair value, the fair value may be interpreted as a target price to be attained at some point in the future, namely in 12 to 18 months’ time, unless a different time frame is specified.
Valuation and risks to fair value
Emira Property Fund: (RIC: EMI SJ, Rec: Overweight, TP: R7.50) Redefine: (RIC: RDF SJ, Rec: Neutral, TP: R4.30) Growthpoint: (RIC: GRT SJ, Rec: Neutral, TP: R13.00) Fortress A: (RIC: FFA SJ, Rec: Overweight, TP: R15.00) Fortress B: (RIC: FFB SJ, Rec: Neutral, TP: R2.00) Resilient: (RIC: RES SJ, Rec: Overweight, TP: R41.00) MAS: (RIC: MSP SJ, Rec: Neutral, TP: R12.50) Nepi Rockcastle: (RIC: NRP SJ, Rec: Overweight, TP: R100.00) Vukile: (RIC: VKE SJ, Rec: Neutral, TP: R9.40) Shoprite Holdings: (RIC: SHP SJ, Rec: Neutral, TP: 140.00) Woolworths Holdings: (RIC: WHL SJ, Rec: Overweight, TP: 44.00) Pick n Pay: (RIC: PIK SJ, Rec: Overweight, TP: 67.00) Spar Group Ltd: (RIC: SPP SJ, Rec: Neutral, TP: R200.00) The Foschini Group (RIC: TFG SJ, Rec: Neutral, TP: R88.00) Mr Price Group (RIC: MRP SJ, Rec: Overweight, TP: R141.00) Truworths Ltd (RIC: TRU SJ, Rec: Underweight, TP: R32.00) Pepkor Holdings (RIC: PPH SJ, Rec: OW, TP: R18.50) AngloGold Ashanti (RIC: ANG SJ, Rec: Neutral, TP: R360) Harmony Gold Mining Company Ltd: (RIC: HAR SJ, Rec: Neutral, TP: R90.00) Sibanye-Stillwater Limited: (RIC: SSW SJ, Rec: Overweight, TP: R90) Gold Fields Limited: (RIC: GFI SJ; Rec: Neutral, TP: R220) DRD Gold Ltd: (RIC: DRD SJ, Rec: Underweight, TP: R11.80) Pan African Resources: (RIC: PAN SJ, Rec: Underweight, TP: R6.00) Anglo American Platinum: (RIC: AMS SJ, Rec: Neutral, TP: R1800) Impala Platinum: (RIC: IMP SJ, Rec: Overweight, TP: R300) Platinum Group Metals: (RIC: PTM SJ, Rec: Underweight, TP: C$2.00) Royal Bafokeng Platinum: (RIC: RBP SJ, Rec: Neutral, TP: R95)
Tharisa: (RIC: THA SJ, Rec: Overweight, TP: R34) Wesizwe: (RIC: WEZ SJ, Rec: Underweight, TP: R0.30) Ivanhoe Mines: (RIC: IVN CN, Rec: Neutral, TP: C$5.00) Northam Platinum: (RIC: NHM SJ, Rec: Overweight, TP: R260.00) MTN (RIC: MTN SJ, Rec: Overweight, TP: R92) Telkom (RIC: TKG SJ, Rec: Overweight, TP: R47) Vodacom (RIC: VOD SJ, Rec: Overweight, TP: R155) Naspers Limited (RIC: NPN SJ, Rec: Overweight, TP: R4828) Prosus NV Amsterdam (RIC: PRX NA, Rec: Neutral, TP: €104.50) Prosus NV Johannesburg (RIC: PRX SJ, Rec: Neutral, TP: R1951) We set our FV relative to disclosed embedded value (EV), which includes the NAV at fair value plus the discount of future expected profits (in-force value). Risks include a slow economic recovery affecting new investment business, persistency and risk experience and the effects of increased market volatility. Upside risks are a strong economic recovery, growth in equity markets, better-than expected cost control and a surprise acquisition.
Head of Research Avinash Kalkapersad +27115374181 +27796899205 [email protected]
Technical Strategist Neels Heyneke +2711 535 4041 +27824101739 [email protected]
Research Analyst Reezwana Sumad +2711294 1753 +27849911011 [email protected]
Analyst: Strategy Walter De Wet +2711294 4744 +27726356268 [email protected]
Analyst: DCM Credit Jones Gondo +27115354050 +27115354050 [email protected]
Analyst: DCM Credit Nthulleng Mphahlele +27112947032 +2773 9571102 [email protected]
Analyst: Property Ridwaan Loonat +2711294 3227 +27722786004 [email protected]
Analyst: Mining Arnold Van Graan +27112959361 +27834543360 [email protected]
Analyst: Retail Sa’ad Chothia +27115374190 +27733165263 [email protected]
Analyst: Telcos, Media & Technology Ziyad Joosub +27115374020 +27 84 580 2413 [email protected]
Analyst: Telcos, Media & Technology Preshendran Odayar +27115374020 +27 72 122 8588 [email protected]

6 APRIL 2021 PAGE 46
QUARTERLY UPDATE
Disclosures
A - Nedbank holds 1% or more of the total issued share capital of the subject company B - Nedbank holds 5% or more of the total issued share capital of the subject company C - The analyst of this report (or a connected person) has a holding in the subject company D - The analyst of this report (or a connected person) has traded in the securities of the subject company in the last 30 days E - The analyst of this report (or a connected person) is a director or officer of the subject company F - The subject company viewed a draft (with no fair value or recommendation included) version of this report to confirm factual accuracy only G - Nedbank earned investment banking fees from the subject company in the last 12 months H - Nedbank has an investment banking relationship with the subject company I - Nedbank has managed or co-managed a primary share issue for the subject company in the past 12 months J - Nedbank has managed or co-managed a secondary share issue for the subject company in the past 12 months K - Nedbank may conduct investment banking business with the subject company in the next 6 months.
Subject Company Relevant Disclosure(s) if any
Emira H
Growthpoint H
Redefine A, H
Vukile None
Nepi Rockcastle plc: None
Resilient REIT G, H
MAS Real Estate Inc None
Fortress Income Fund Limited "A" None
Fortress Income Fund Limited "B" A
Shoprite Holdings H
Woolworths Holdings G, H
Pick n Pay None
SPAR None
The Foshini Group H
Mr Price Group None
Pepkor Holdings H
Truworths Ltd H
AngloGold Ashanti Limited G, H
DRD Gold Ltd None
Gold Fields Limited G, H
Harmony Gold Mining Company Ltd G, H
Pan African Resources G, H
Sibanye Gold Limited A, G, H
Anglo American Platinum G, H
Impala Platinum G, H
Ivanhoe Mines H
Northam Platinum G, H
Platinum Group Metals None
Royal Bafokeng Platinum G, H
Tharisa G, H
Wesizwe H
MTN G, H
Telkom G, H
Vodacom H
Naspers H
Prosus None
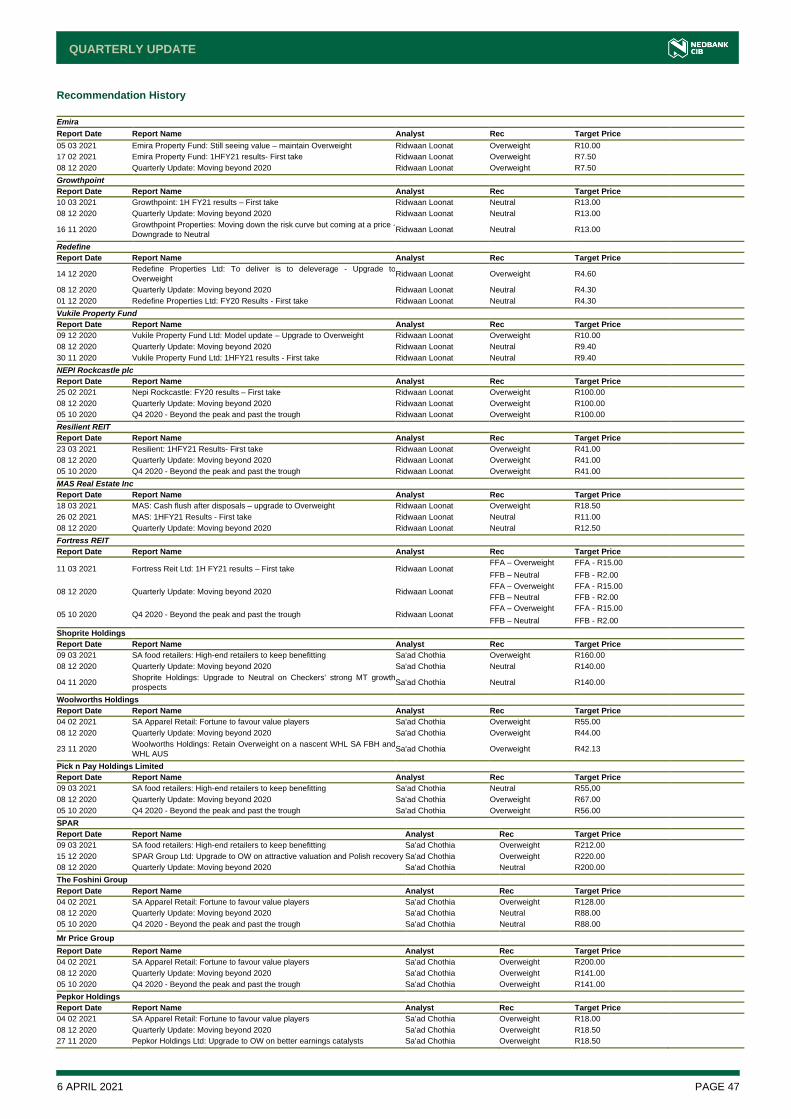
6 APRIL 2021 PAGE 47
QUARTERLY UPDATE
Recommendation History
Emira
Report Date Report Name Analyst Rec Target Price
05 03 2021 Emira Property Fund: Still seeing value – maintain Overweight Ridwaan Loonat Overweight R10.00
17 02 2021 Emira Property Fund: 1HFY21 results- First take Ridwaan Loonat Overweight R7.50
08 12 2020 Quarterly Update: Moving beyond 2020 Ridwaan Loonat Overweight R7.50
Growthpoint
Report Date Report Name Analyst Rec Target Price
10 03 2021 Growthpoint: 1H FY21 results – First take Ridwaan Loonat Neutral R13.00
08 12 2020 Quarterly Update: Moving beyond 2020 Ridwaan Loonat Neutral R13.00
16 11 2020 Growthpoint Properties: Moving down the risk curve but coming at a price -
Downgrade to Neutral Ridwaan Loonat Neutral R13.00
Redefine
Report Date Report Name Analyst Rec Target Price
14 12 2020 Redefine Properties Ltd: To deliver is to deleverage - Upgrade to
Overweight Ridwaan Loonat Overweight R4.60
08 12 2020 Quarterly Update: Moving beyond 2020 Ridwaan Loonat Neutral R4.30
01 12 2020 Redefine Properties Ltd: FY20 Results - First take Ridwaan Loonat Neutral R4.30
Vukile Property Fund
Report Date Report Name Analyst Rec Target Price
09 12 2020 Vukile Property Fund Ltd: Model update – Upgrade to Overweight Ridwaan Loonat Overweight R10.00
08 12 2020 Quarterly Update: Moving beyond 2020 Ridwaan Loonat Neutral R9.40
30 11 2020 Vukile Property Fund Ltd: 1HFY21 results - First take Ridwaan Loonat Neutral R9.40
NEPI Rockcastle plc
Report Date Report Name Analyst Rec Target Price
25 02 2021 Nepi Rockcastle: FY20 results – First take Ridwaan Loonat Overweight R100.00
08 12 2020 Quarterly Update: Moving beyond 2020 Ridwaan Loonat Overweight R100.00
05 10 2020 Q4 2020 - Beyond the peak and past the trough Ridwaan Loonat Overweight R100.00
Resilient REIT
Report Date Report Name Analyst Rec Target Price
23 03 2021 Resilient: 1HFY21 Results- First take Ridwaan Loonat Overweight R41.00
08 12 2020 Quarterly Update: Moving beyond 2020 Ridwaan Loonat Overweight R41.00
05 10 2020 Q4 2020 - Beyond the peak and past the trough Ridwaan Loonat Overweight R41.00
MAS Real Estate Inc
Report Date Report Name Analyst Rec Target Price
18 03 2021 MAS: Cash flush after disposals – upgrade to Overweight Ridwaan Loonat Overweight R18.50
26 02 2021 MAS: 1HFY21 Results - First take Ridwaan Loonat Neutral R11.00
08 12 2020 Quarterly Update: Moving beyond 2020 Ridwaan Loonat Neutral R12.50
Fortress REIT
Report Date Report Name Analyst Rec Target Price
11 03 2021 Fortress Reit Ltd: 1H FY21 results – First take Ridwaan Loonat FFA – Overweight FFA - R15.00
FFB – Neutral FFB - R2.00
08 12 2020 Quarterly Update: Moving beyond 2020 Ridwaan Loonat FFA – Overweight FFA - R15.00
FFB – Neutral FFB - R2.00
05 10 2020 Q4 2020 - Beyond the peak and past the trough Ridwaan Loonat FFA – Overweight FFA - R15.00
FFB – Neutral FFB - R2.00
Shoprite Holdings
Report Date Report Name Analyst Rec Target Price
09 03 2021 SA food retailers: High-end retailers to keep benefitting Sa'ad Chothia Overweight R160.00
08 12 2020 Quarterly Update: Moving beyond 2020 Sa'ad Chothia Neutral R140.00
04 11 2020 Shoprite Holdings: Upgrade to Neutral on Checkers' strong MT growth
prospects Sa'ad Chothia Neutral R140.00
Woolworths Holdings
Report Date Report Name Analyst Rec Target Price
04 02 2021 SA Apparel Retail: Fortune to favour value players Sa'ad Chothia Overweight R55.00
08 12 2020 Quarterly Update: Moving beyond 2020 Sa'ad Chothia Overweight R44.00
23 11 2020 Woolworths Holdings: Retain Overweight on a nascent WHL SA FBH and
WHL AUS Sa'ad Chothia Overweight R42.13
Pick n Pay Holdings Limited
Report Date Report Name Analyst Rec Target Price
09 03 2021 SA food retailers: High-end retailers to keep benefitting Sa'ad Chothia Neutral R55,00
08 12 2020 Quarterly Update: Moving beyond 2020 Sa'ad Chothia Overweight R67.00
05 10 2020 Q4 2020 - Beyond the peak and past the trough Sa'ad Chothia Overweight R56.00
SPAR
Report Date Report Name Analyst Rec Target Price
09 03 2021 SA food retailers: High-end retailers to keep benefitting Sa'ad Chothia Overweight R212.00
15 12 2020 SPAR Group Ltd: Upgrade to OW on attractive valuation and Polish recovery Sa'ad Chothia Overweight R220.00
08 12 2020 Quarterly Update: Moving beyond 2020 Sa'ad Chothia Neutral R200.00
The Foshini Group
Report Date Report Name Analyst Rec Target Price
04 02 2021 SA Apparel Retail: Fortune to favour value players Sa'ad Chothia Overweight R128.00
08 12 2020 Quarterly Update: Moving beyond 2020 Sa'ad Chothia Neutral R88.00
05 10 2020 Q4 2020 - Beyond the peak and past the trough Sa'ad Chothia Neutral R88.00
Mr Price Group
Report Date Report Name Analyst Rec Target Price
04 02 2021 SA Apparel Retail: Fortune to favour value players Sa'ad Chothia Overweight R200.00
08 12 2020 Quarterly Update: Moving beyond 2020 Sa'ad Chothia Overweight R141.00
05 10 2020 Q4 2020 - Beyond the peak and past the trough Sa'ad Chothia Overweight R141.00
Pepkor Holdings
Report Date Report Name Analyst Rec Target Price
04 02 2021 SA Apparel Retail: Fortune to favour value players Sa'ad Chothia Overweight R18.00
08 12 2020 Quarterly Update: Moving beyond 2020 Sa'ad Chothia Overweight R18.50
27 11 2020 Pepkor Holdings Ltd: Upgrade to OW on better earnings catalysts Sa'ad Chothia Overweight R18.50
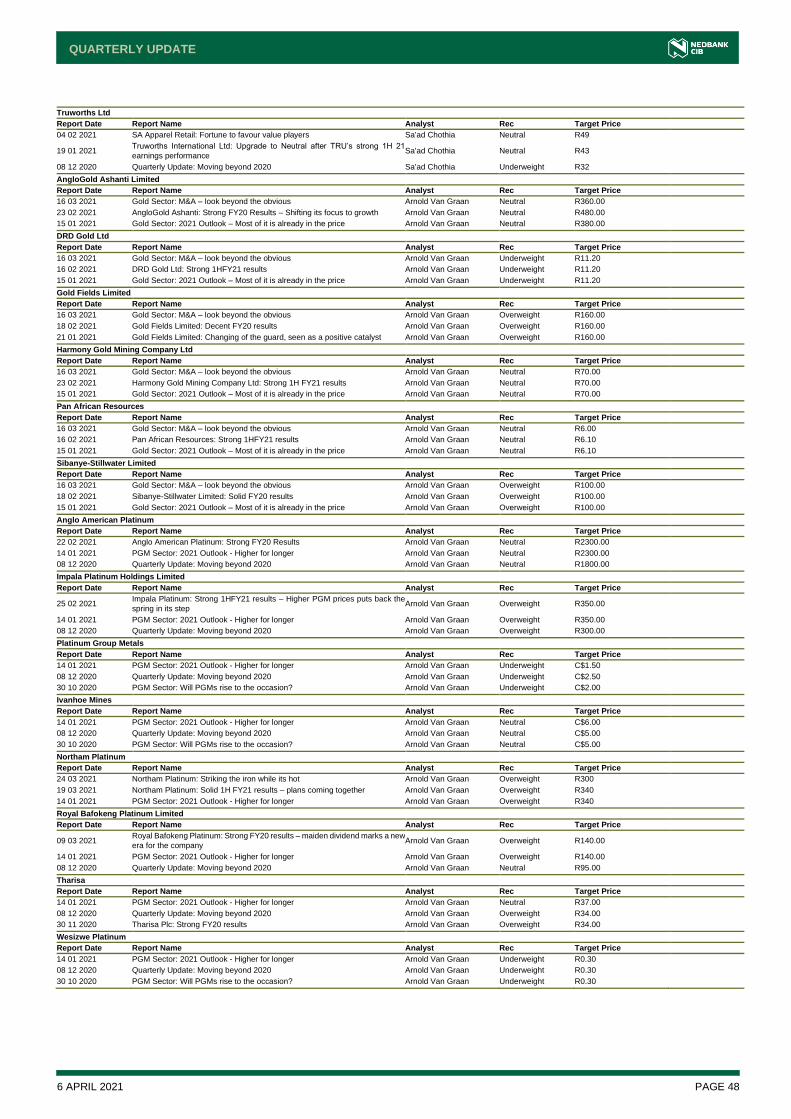
6 APRIL 2021 PAGE 48
QUARTERLY UPDATE
Truworths Ltd
Report Date Report Name Analyst Rec Target Price
04 02 2021 SA Apparel Retail: Fortune to favour value players Sa'ad Chothia Neutral R49
19 01 2021 Truworths International Ltd: Upgrade to Neutral after TRU’s strong 1H 21
earnings performance Sa'ad Chothia Neutral R43
08 12 2020 Quarterly Update: Moving beyond 2020 Sa'ad Chothia Underweight R32
AngloGold Ashanti Limited
Report Date Report Name Analyst Rec Target Price
16 03 2021 Gold Sector: M&A – look beyond the obvious Arnold Van Graan Neutral R360.00
23 02 2021 AngloGold Ashanti: Strong FY20 Results – Shifting its focus to growth Arnold Van Graan Neutral R480.00
15 01 2021 Gold Sector: 2021 Outlook – Most of it is already in the price Arnold Van Graan Neutral R380.00
DRD Gold Ltd
Report Date Report Name Analyst Rec Target Price
16 03 2021 Gold Sector: M&A – look beyond the obvious Arnold Van Graan Underweight R11.20
16 02 2021 DRD Gold Ltd: Strong 1HFY21 results Arnold Van Graan Underweight R11.20
15 01 2021 Gold Sector: 2021 Outlook – Most of it is already in the price Arnold Van Graan Underweight R11.20
Gold Fields Limited
Report Date Report Name Analyst Rec Target Price
16 03 2021 Gold Sector: M&A – look beyond the obvious Arnold Van Graan Overweight R160.00
18 02 2021 Gold Fields Limited: Decent FY20 results Arnold Van Graan Overweight R160.00
21 01 2021 Gold Fields Limited: Changing of the guard, seen as a positive catalyst Arnold Van Graan Overweight R160.00
Harmony Gold Mining Company Ltd
Report Date Report Name Analyst Rec Target Price
16 03 2021 Gold Sector: M&A – look beyond the obvious Arnold Van Graan Neutral R70.00
23 02 2021 Harmony Gold Mining Company Ltd: Strong 1H FY21 results Arnold Van Graan Neutral R70.00
15 01 2021 Gold Sector: 2021 Outlook – Most of it is already in the price Arnold Van Graan Neutral R70.00
Pan African Resources
Report Date Report Name Analyst Rec Target Price
16 03 2021 Gold Sector: M&A – look beyond the obvious Arnold Van Graan Neutral R6.00
16 02 2021 Pan African Resources: Strong 1HFY21 results Arnold Van Graan Neutral R6.10
15 01 2021 Gold Sector: 2021 Outlook – Most of it is already in the price Arnold Van Graan Neutral R6.10
Sibanye-Stillwater Limited
Report Date Report Name Analyst Rec Target Price
16 03 2021 Gold Sector: M&A – look beyond the obvious Arnold Van Graan Overweight R100.00
18 02 2021 Sibanye-Stillwater Limited: Solid FY20 results Arnold Van Graan Overweight R100.00
15 01 2021 Gold Sector: 2021 Outlook – Most of it is already in the price Arnold Van Graan Overweight R100.00
Anglo American Platinum
Report Date Report Name Analyst Rec Target Price
22 02 2021 Anglo American Platinum: Strong FY20 Results Arnold Van Graan Neutral R2300.00
14 01 2021 PGM Sector: 2021 Outlook - Higher for longer Arnold Van Graan Neutral R2300.00
08 12 2020 Quarterly Update: Moving beyond 2020 Arnold Van Graan Neutral R1800.00
Impala Platinum Holdings Limited
Report Date Report Name Analyst Rec Target Price
25 02 2021 Impala Platinum: Strong 1HFY21 results – Higher PGM prices puts back the
spring in its step Arnold Van Graan Overweight R350.00
14 01 2021 PGM Sector: 2021 Outlook - Higher for longer Arnold Van Graan Overweight R350.00
08 12 2020 Quarterly Update: Moving beyond 2020 Arnold Van Graan Overweight R300.00
Platinum Group Metals
Report Date Report Name Analyst Rec Target Price
14 01 2021 PGM Sector: 2021 Outlook - Higher for longer Arnold Van Graan Underweight C$1.50
08 12 2020 Quarterly Update: Moving beyond 2020 Arnold Van Graan Underweight C$2.50
30 10 2020 PGM Sector: Will PGMs rise to the occasion? Arnold Van Graan Underweight C$2.00
Ivanhoe Mines
Report Date Report Name Analyst Rec Target Price
14 01 2021 PGM Sector: 2021 Outlook - Higher for longer Arnold Van Graan Neutral C$6.00
08 12 2020 Quarterly Update: Moving beyond 2020 Arnold Van Graan Neutral C$5.00
30 10 2020 PGM Sector: Will PGMs rise to the occasion? Arnold Van Graan Neutral C$5.00
Northam Platinum
Report Date Report Name Analyst Rec Target Price
24 03 2021 Northam Platinum: Striking the iron while its hot Arnold Van Graan Overweight R300
19 03 2021 Northam Platinum: Solid 1H FY21 results – plans coming together Arnold Van Graan Overweight R340
14 01 2021 PGM Sector: 2021 Outlook - Higher for longer Arnold Van Graan Overweight R340
Royal Bafokeng Platinum Limited
Report Date Report Name Analyst Rec Target Price
09 03 2021 Royal Bafokeng Platinum: Strong FY20 results – maiden dividend marks a new
era for the company Arnold Van Graan Overweight R140.00
14 01 2021 PGM Sector: 2021 Outlook - Higher for longer Arnold Van Graan Overweight R140.00
08 12 2020 Quarterly Update: Moving beyond 2020 Arnold Van Graan Neutral R95.00
Tharisa
Report Date Report Name Analyst Rec Target Price
14 01 2021 PGM Sector: 2021 Outlook - Higher for longer Arnold Van Graan Neutral R37.00
08 12 2020 Quarterly Update: Moving beyond 2020 Arnold Van Graan Overweight R34.00
30 11 2020 Tharisa Plc: Strong FY20 results Arnold Van Graan Overweight R34.00
Wesizwe Platinum
Report Date Report Name Analyst Rec Target Price
14 01 2021 PGM Sector: 2021 Outlook - Higher for longer Arnold Van Graan Underweight R0.30
08 12 2020 Quarterly Update: Moving beyond 2020 Arnold Van Graan Underweight R0.30
30 10 2020 PGM Sector: Will PGMs rise to the occasion? Arnold Van Graan Underweight R0.30

6 APRIL 2021 PAGE 49
QUARTERLY UPDATE
MTN
Report Date Report Name Analyst Rec Target Price
29 03 2021 MTN: Added optionality - R41 upside from fiber (R9.35) and fintech (R31.8) Ziyad Joosub and
Preshendran Odayar Overweight R114
23 02 2021 Telecommunications Industry Insight Ziyad Joosub and
Preshendran Odayar Overweight R90.00
28 01 2021 MTN Group Ltd: 12-month feasible upside excl. Nigeria is 37% Ziyad Joosub and
Preshendran Odayar Overweight R90.00
Telkom
Report Date Report Name Analyst Rec Target Price
23 02 2021 Telecommunications Industry Insight Ziyad Joosub and
Preshendran Odayar Overweight R54.00
23 02 2021 Telkom: Executing on de-risking FCF/Debt profile Ziyad Joosub and
Preshendran Odayar Overweight R54.00
08 12 2020 Quarterly Update: Moving beyond 2020 Ziyad Joosub and
Preshendran Odayar Overweight R47.00
Vodacom
Report Date Report Name Analyst Rec Target Price
23 02 2021 Telecommunications Industry Insight Ziyad Joosub and
Preshendran Odayar Overweight R158
10 02 2021 Vodacom Group Ltd: Encouraging Q3 underpins further upside Ziyad Joosub and
Preshendran Odayar Overweight R158
29 01 2021 Vodacom Group Ltd: 3Q21e preview – SA to remain strong Ziyad Joosub and
Preshendran Odayar Overweight R155
Naspers
Report Date Report Name Analyst Rec Target Price
11 03 2021 Media and Technology: Tencent P/E analysis – Made in (mainland) China Ziyad Joosub and
Preshendran Odayar Overweight R4 828
09 12 2020 Naspers poised for a reduction in cyclical discount Ziyad Joosub and
Preshendran Odayar Overweight R4 062
08 12 2020 Quarterly Update: Moving beyond 2020 Ziyad Joosub and
Preshendran Odayar Overweight R4 223
Prosus
Report Date Report Name Analyst Rec PRX SJ Target Price
11 03 2021 Media and Technology: Tencent P/E analysis – Made in (mainland) China Ziyad Joosub and
Preshendran Odayar Overweight € 122
09 12 2020 Naspers poised for a reduction in cyclical discount Ziyad Joosub and
Preshendran Odayar Neutral €100.5
08 12 2020 Quarterly Update: Moving beyond 2020 Ziyad Joosub and
Preshendran Odayar Neutral €104.5
* Validity time period of the target price or of the recommendation: 12-18 months
Ratings Distribution as at end 31 March 2021
Recommendation Count % of NCIB Total Stocks Covered
Overweight 22 61%
Underweight 3 8%
Neutral 11 31%
36 100%