Quarterly GSA Statement of Partner's Capital
14
Boyd Watterson GSA Fund, LP Quarterly Review First Quarter, 2017 National Archives & Records Administration (NARA) Perris, CA Bloomington, MN Various - DHS (CBP) & GSA VA Regional Benefits Office Columbia, SC
-
Upload
khangminh22 -
Category
Documents
-
view
6 -
download
0
Transcript of Quarterly GSA Statement of Partner's Capital

Boyd Watterson GSA Fund, LP Quarterly Review First Quarter, 2017
National Archives & Records Administration (NARA)Perris, CA
Bloomington, MNVarious - DHS (CBP) & GSA
VA Regional Benefits OfficeColumbia, SC
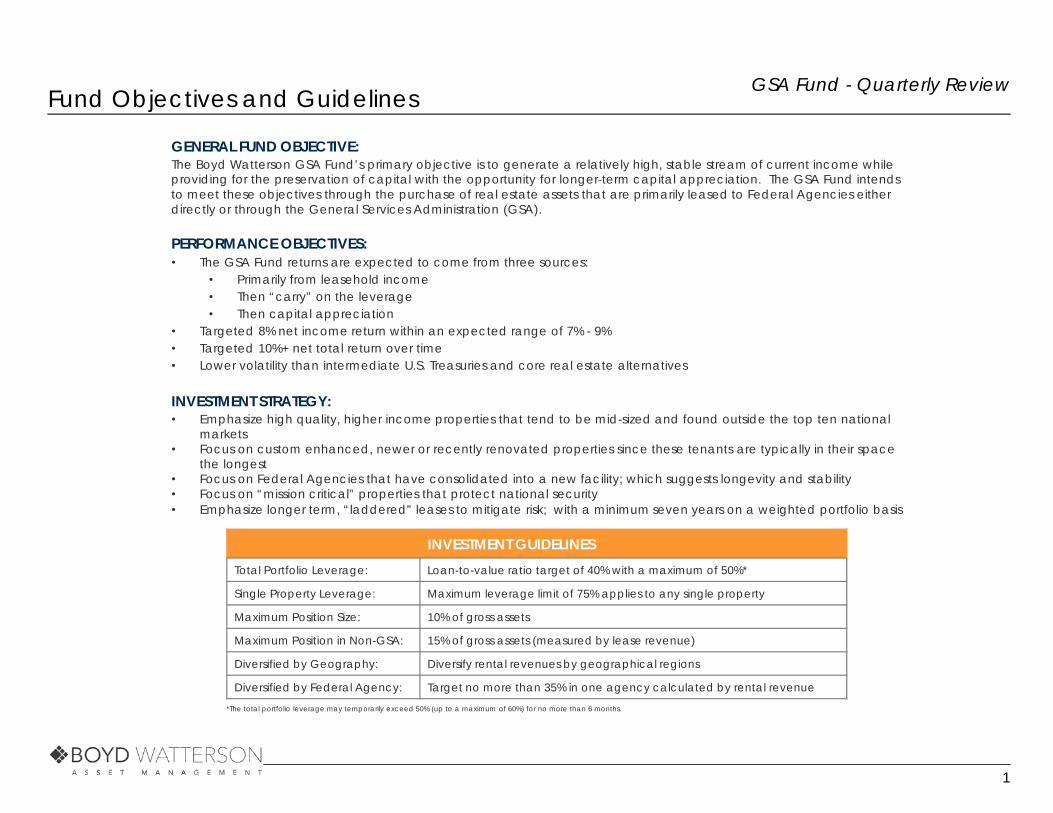
Fund Objectives and Guidelines GSA Fund - Quarterly Review
INVESTMENT GUIDELINESTotal Portfolio Leverage: Loan-to-value ratio target of 40% with a maximum of 50%*
Single Property Leverage: Maximum leverage limit of 75% applies to any single property
Maximum Position Size: 10% of gross assets
Maximum Position in Non-GSA: 15% of gross assets (measured by lease revenue)
Diversified by Geography: Diversify rental revenues by geographical regions
Diversified by Federal Agency: Target no more than 35% in one agency calculated by rental revenue
GENERAL FUND OBJECTIVE:The Boyd Watterson GSA Fund’s primary objective is to generate a relatively high, stable stream of current income while providing for the preservation of capital with the opportunity for longer‐term capital appreciation. The GSA Fund intends to meet these objectives through the purchase of real estate assets that are primarily leased to Federal Agencies either directly or through the General Services Administration (GSA).
PERFORMANCE OBJECTIVES:• The GSA Fund returns are expected to come from three sources:
• Primarily from leasehold income • Then “carry” on the leverage• Then capital appreciation
• Targeted 8% net income return within an expected range of 7% - 9% • Targeted 10%+ net total return over time• Lower volatility than intermediate U.S. Treasuries and core real estate alternatives
INVESTMENT STRATEGY:• Emphasize high quality, higher income properties that tend to be mid-sized and found outside the top ten national
markets• Focus on custom enhanced, newer or recently renovated properties since these tenants are typically in their space
the longest • Focus on Federal Agencies that have consolidated into a new facility; which suggests longevity and stability• Focus on “mission critical” properties that protect national security• Emphasize longer term, “laddered” leases to mitigate risk; with a minimum seven years on a weighted portfolio basis
*The total portfolio leverage may temporarily exceed 50% (up to a maximum of 60%) for no more than 6 months.
1
First Quarter Comments GSA Fund - Quarterly Review
PERFORMANCE COMMENTS• We were within our targeted range of income return for the first quarter of 2017 with a net income return of 1.79%.• The net income return for the trailing12 months totaled 7.79%, which is in our target range of 7-9%. • The total net return (net income return plus price changes) totaled 2.16% in the first quarter of 2017, primarily as a
result of strong income return and moderately higher appraised values on several properties.• The total net return on a trailing 12 months basis was approximately 10.56%, reflecting above average appreciation
over the entire portfolio, which consists of 86 properties as of March 31, 2017.
INVESTMENT ENVIRONMENT• Deal flow in the first quarter was unseasonably strong and the Fund was able to close on 12 deals totaling $141.7
million.• One of our largest competitors recently raised a sizeable amount of debt and equity capital to acquire two large
assets. We view this as a positive as it may lower their capacity to acquire buildings throughout the rest of 2017.• Real estate investors continue to reduce their return expectations for core real estate as cap rates come down and
rent growth slows. We think this will continue to benefit the GSA space as demand should remain strong for income producing assets.
PORTFOLIO STRATEGY• Competition has intensified for GSA assets with long term leases. This has led us to focus on assets with shorter lease
terms in order to find properties with better value. • We have continued to look at multi-property, portfolio deals as a way to meet our diversification targets in a cost
effective manner.• We have recently acquired properties that have a large amount of construction work as we now have the capacity
to manage these projects and the properties tend to sell at a discount.• We are in the process of trying to obtain an investment grade credit rating. This should lead to lower financing costs.
Our target leverage ratio is unchanged at 40%.• We continue to evaluate the size and scope of the GSA market to align our capital growth with the availability of
deal flow in the market.
2

Performance and Capital Summary City of Colorado Springs Cemetery Endowment Fund GSA Period Ending March 31, 2017
Month to Date Quarter to Date Year to Date
Boyd Watterson GSA Fund LP
Trailing 12 MonthsInception to Date
City of Colorado Springs Cemetery Endowment Fund GSA For the period ended March 31, 2017
(12/1/16)
286,831.71 282,636.31 282,636.31Beginning Equity 280,000.00 280,000.00$ $ $ $ $
0.25 1,434.25 1,434.25Deposits 1,434.25 1,434.25
0.25 1,434.25 1,434.25Return of Capital 1,434.25 1,434.25
2,194.18 6,987.77 6,987.77Gross Profit/Loss 9,918.80 9,918.80
‐50.75 ‐50.75 ‐50.75Adjustments** ‐50.75 ‐50.75
288,975.14 289,573.33 289,573.33Gross Capital Balance 289,868.05 289,868.05
306.73 904.92 904.92Management Fees 1,199.64 1,199.64
288,668.41 288,668.41 288,668.41Net Capital Balance 288,668.41 288,668.41$ $ $ $ $
0.64 2.13 2.13Net Return 3.10 3.10% ***%%%%
0.75 2.46 2.46Gross Return 3.54 3.54% ***%%%%
223.38 223.38 223.38Units Held 223.38 223.38
34.89 34.89 34.89Units Adjustment** 34.89 34.89
258.27 258.27 258.27Total Units Held* 258.27 258.27
1,117.69 1,117.69 1,117.69NAV per Unit* 1,117.69 1,117.69
1,107.78 1,107.78 1,107.78Fund NAV per Unit* 1,107.78 1,107.78
Note: The above amounts are unaudited and are not to be used for income tax purposes.* The NAV Per Unit calculated at the period end may vary from the Fund NAV Per Unit based on the date the investor entered the fund.** The prac ce of reflec ng a reduc on in the number of units when a distribu on is made has been changed to conform more closely with industry best prac ces.
The change resulted in a minor cumula ve adjustment to the Net Capital Balance because Net Income and Distribu ons are allocated based on the number of units. *** Returns for periods greater than one year are annualized.
3
Quarterly Activity - 1Q17 GSA Fund - Quarterly Review
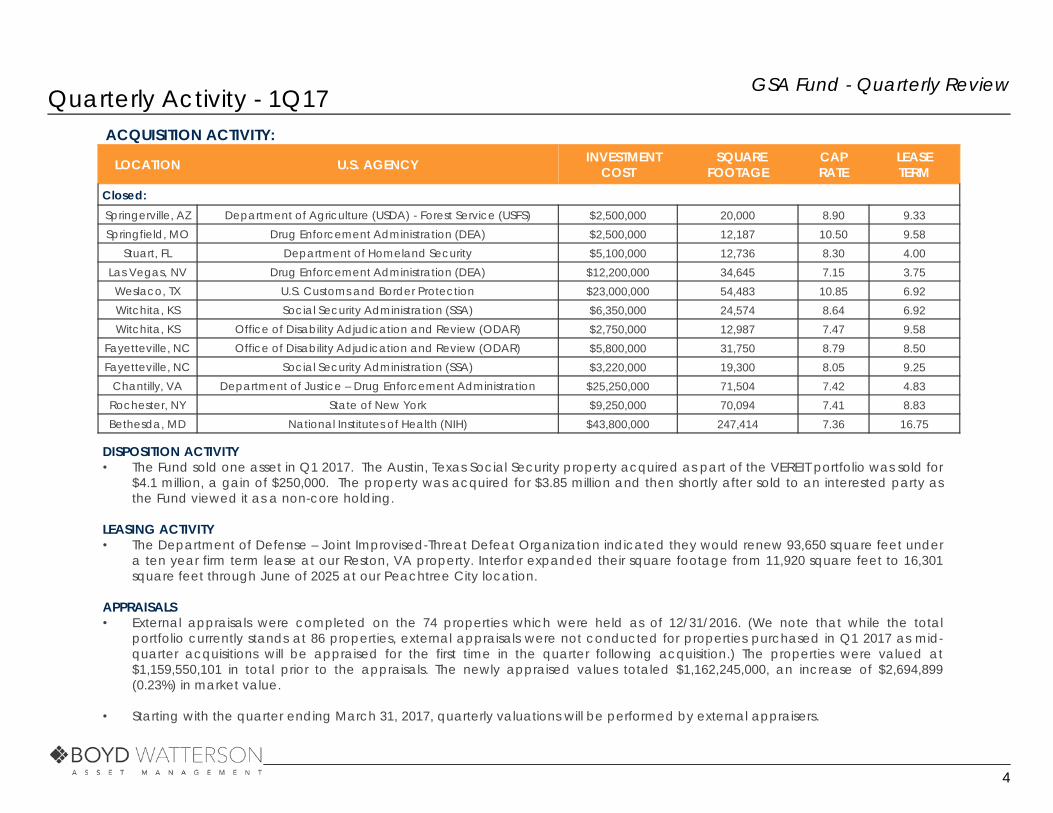
DISPOSITION ACTIVITY• The Fund sold one asset in Q1 2017. The Austin, Texas Social Security property acquired as part of the VEREIT portfolio was sold for
$4.1 million, a gain of $250,000. The property was acquired for $3.85 million and then shortly after sold to an interested party asthe Fund viewed it as a non-core holding.
LEASING ACTIVITY• The Department of Defense – Joint Improvised-Threat Defeat Organization indicated they would renew 93,650 square feet under
a ten year firm term lease at our Reston, VA property. Interfor expanded their square footage from 11,920 square feet to 16,301square feet through June of 2025 at our Peachtree City location.
APPRAISALS• External appraisals were completed on the 74 properties which were held as of 12/31/2016. (We note that while the total
portfolio currently stands at 86 properties, external appraisals were not conducted for properties purchased in Q1 2017 as mid-quarter acquisitions will be appraised for the first time in the quarter following acquisition.) The properties were valued at$1,159,550,101 in total prior to the appraisals. The newly appraised values totaled $1,162,245,000, an increase of $2,694,899(0.23%) in market value.
• Starting with the quarter ending March 31, 2017, quarterly valuations will be performed by external appraisers.
ACQUISITION ACTIVITY:
LOCATION U.S. AGENCY INVESTMENT COST
SQUARE FOOTAGE
CAP RATE
LEASETERM
Closed:Springerville, AZ Department of Agriculture (USDA) - Forest Service (USFS) $2,500,000 20,000 8.90 9.33Springfield, MO Drug Enforcement Administration (DEA) $2,500,000 12,187 10.50 9.58
Stuart, FL Department of Homeland Security $5,100,000 12,736 8.30 4.00Las Vegas, NV Drug Enforcement Administration (DEA) $12,200,000 34,645 7.15 3.75
Weslaco, TX U.S. Customs and Border Protection $23,000,000 54,483 10.85 6.92Witchita, KS Social Security Administration (SSA) $6,350,000 24,574 8.64 6.92Witchita, KS Office of Disability Adjudication and Review (ODAR) $2,750,000 12,987 7.47 9.58
Fayetteville, NC Office of Disability Adjudication and Review (ODAR) $5,800,000 31,750 8.79 8.50Fayetteville, NC Social Security Administration (SSA) $3,220,000 19,300 8.05 9.25
Chantilly, VA Department of Justice – Drug Enforcement Administration $25,250,000 71,504 7.42 4.83Rochester, NY State of New York $9,250,000 70,094 7.41 8.83Bethesda, MD National Institutes of Health (NIH) $43,800,000 247,414 7.36 16.75
4
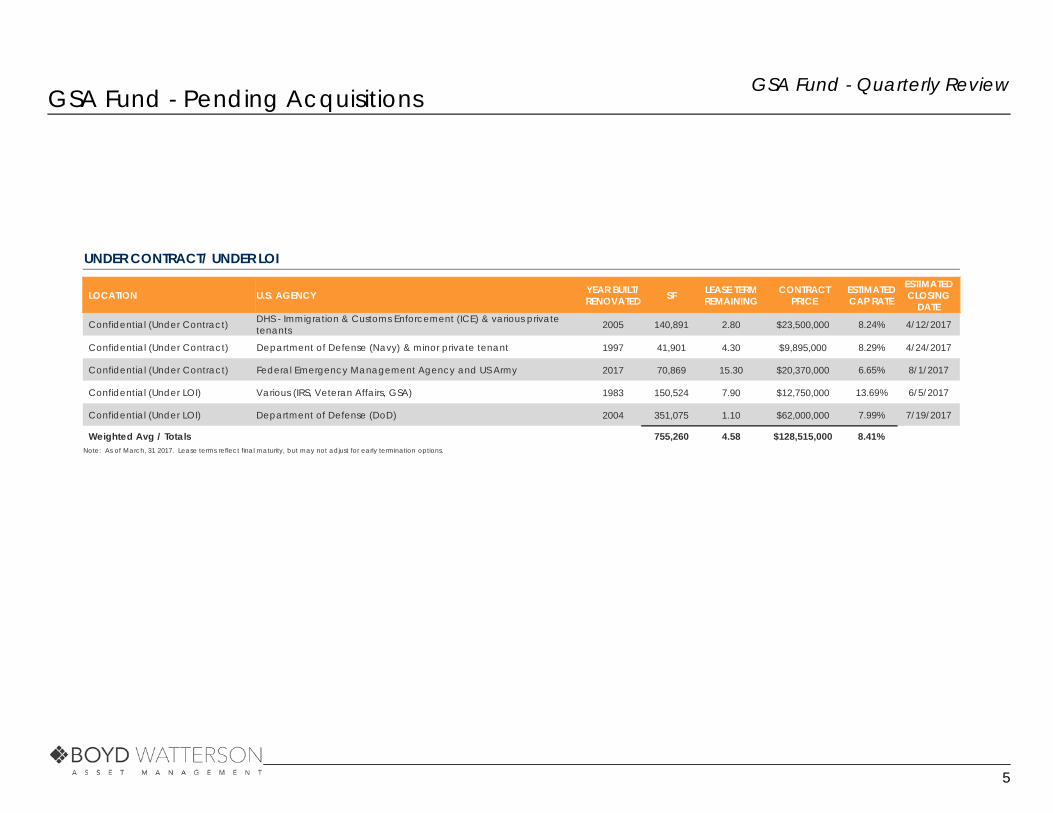
GSA Fund - Pending Acquisitions GSA Fund - Quarterly Review
LOCATION U.S. AGENCY YEAR BUILT/RENOVATED SF LEASE TERM
REMAININGCONTRACT
PRICE ESTIMATEDCAP RATE
ESTIMATEDCLOSING
DATE
Confidential (Under Contract) DHS - Immigration & Customs Enforcement (ICE) & various private tenants 2005 140,891 2.80 $23,500,000 8.24% 4/12/2017
Confidential (Under Contract) Department of Defense (Navy) & minor private tenant 1997 41,901 4.30 $9,895,000 8.29% 4/24/2017
Confidential (Under Contract) Federal Emergency Management Agency and US Army 2017 70,869 15.30 $20,370,000 6.65% 8/1/2017
Confidential (Under LOI) Various (IRS, Veteran Affairs, GSA) 1983 150,524 7.90 $12,750,000 13.69% 6/5/2017
Confidential (Under LOI) Department of Defense (DoD) 2004 351,075 1.10 $62,000,000 7.99% 7/19/2017
Weighted Avg / Totals 755,260 4.58 $128,515,000 8.41%Note: As of March, 31 2017. Lease terms reflect final maturity, but may not adjust for early termination options.
UNDER CONTRACT/ UNDER LOI
5
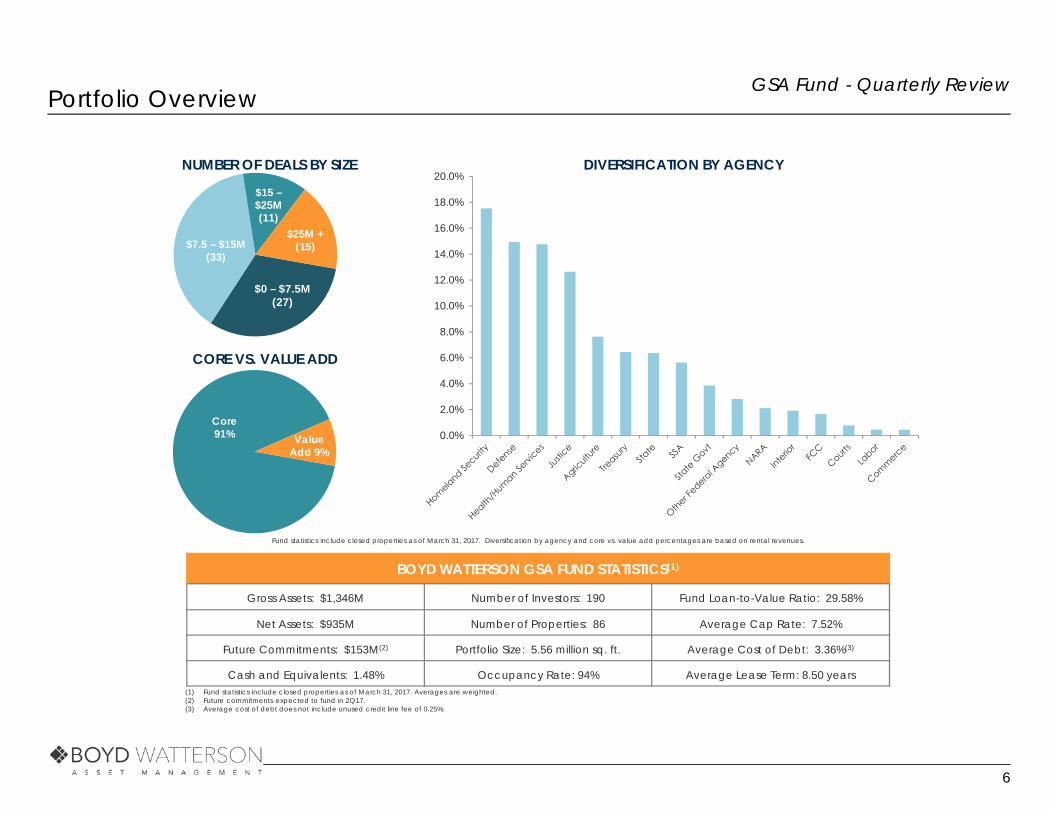
Portfolio Overview GSA Fund - Quarterly Review
NUMBER OF DEALS BY SIZE
$0 – $7.5M(27)
$7.5 – $15M (33)
$15 –$25M (11)
$25M +(15)
(1) Fund statistics include closed properties as of March 31, 2017. Averages are weighted.(2) Future commitments expected to fund in 2Q17.(3) Average cost of debt does not include unused credit line fee of 0.25%.
Fund statistics include closed properties as of March 31, 2017. Diversification by agency and core vs. value add percentages are based on rental revenues.
CORE VS. VALUE ADD
Core91% Value
Add 9%
BOYD WATTERSON GSA FUND STATISTICS(1)
Gross Assets: $1,346M Number of Investors: 190 Fund Loan-to-Value Ratio: 29.58%
Net Assets: $935M Number of Properties: 86 Average Cap Rate: 7.52%
Future Commitments: $153M(2) Portfolio Size: 5.56 million sq. ft. Average Cost of Debt: 3.36%(3)
Cash and Equivalents: 1.48% Occupancy Rate: 94% Average Lease Term: 8.50 years
0.0%
2.0%
4.0%
6.0%
8.0%
10.0%
12.0%
14.0%
16.0%
18.0%
20.0%DIVERSIFICATION BY AGENCY
6
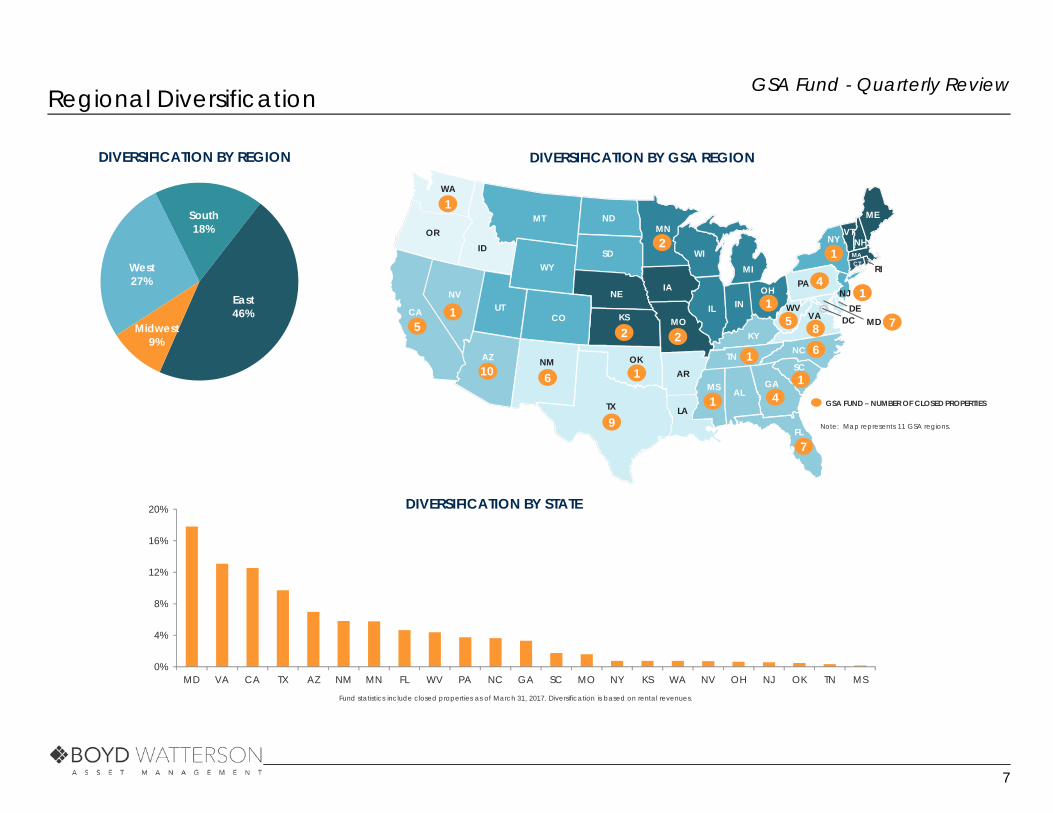
Regional Diversification GSA Fund - Quarterly Review
PA
IL
MO
MI
WI
MN
IA
ND
SD
NE
KS
OK
COUT
AZNM
NV
OR
IDWY
MT
NY
ME
VTNH
MACT
TX
CO
LA
MS ALGA
FL
SC
NC
VA
KY
TN
OH
CA DEMD
PA
INILMO
AR
MIWI
MN
IA
ND
SD
NE
KSUT
AZ NM
NV
ID
WY
MT
NY
ME
VTNH
MA
RI
TX
CO
OK
OR
WA
CT
NJ
DC
AK
GSA FUND – NUMBER OF CLOSED PROPERTIES
Note: Map represents 11 GSA regions.
WV
1
5
2
16
91
7
41
2
1
61
1
5 7
4
8
0%
4%
8%
12%
16%
20%
MD VA CA TX AZ NM MN FL WV PA NC GA SC MO NY KS WA NV OH NJ OK TN MS
DIVERSIFICATION BY STATE
West 27%
South 18%
East 46%
Midwest 9%
DIVERSIFICATION BY REGION
Fund statistics include closed properties as of March 31, 2017. Diversification is based on rental revenues.
DIVERSIFICATION BY GSA REGION
10
12
1
7
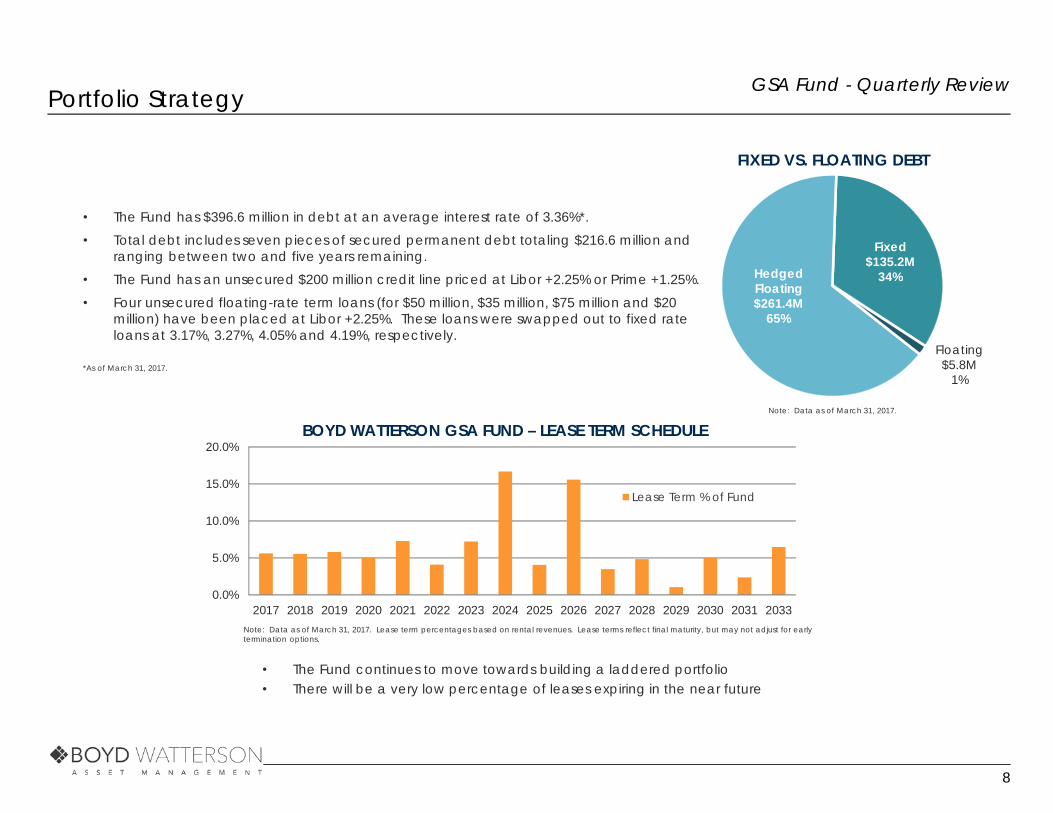
Portfolio Strategy GSA Fund - Quarterly Review
• The Fund continues to move towards building a laddered portfolio• There will be a very low percentage of leases expiring in the near future
0.0%
5.0%
10.0%
15.0%
20.0%
2017 2018 2019 2020 2021 2022 2023 2024 2025 2026 2027 2028 2029 2030 2031 2033
BOYD WATTERSON GSA FUND – LEASE TERM SCHEDULE
Lease Term % of Fund
Note: Data as of March 31, 2017. Lease term percentages based on rental revenues. Lease terms reflect final maturity, but may not adjust for early termination options.
FIXED VS. FLOATING DEBT
Floating$5.8M
1%
Fixed$135.2M
34%
Note: Data as of March 31, 2017.
• The Fund has $396.6 million in debt at an average interest rate of 3.36%*.• Total debt includes seven pieces of secured permanent debt totaling $216.6 million and
ranging between two and five years remaining.• The Fund has an unsecured $200 million credit line priced at Libor +2.25% or Prime +1.25%.• Four unsecured floating-rate term loans (for $50 million, $35 million, $75 million and $20
million) have been placed at Libor +2.25%. These loans were swapped out to fixed rate loans at 3.17%, 3.27%, 4.05% and 4.19%, respectively.
*As of March 31, 2017.
Hedged Floating$261.4M
65%
8

Strategy and Outlook GSA Fund - Quarterly Review
ACQUISITIONS• Q1 2017 acquisitions totaled 12 properties valued at $141.7 million.• At the end of Q1 we had $53.8 million of assets under contract with additional acquisition targets in the pipeline.
ASSET MANAGEMENT• As the Fund grows, we will selectively sell assets when and if we feel we can improve the portfolio by doing so.• We are working to build and maintain a strong relationship with the GSA and the tenant agencies to help ensure
renewals and build the Boyd Watterson GSA Fund brand.• Our focus remains on renewing leases with approaching expirations and filling up existing vacancies.
FINANCING• Interest rates have risen ~100 bps from their mid 2016 low but still remain quite low from a historical perspective.• Debt financing remains attractive with low interest rates, tight spreads, and capital readily available.• The Fund placed $20 million in an unsecured term loan and subsequently swapped the loan at an effective 4.19%
interest rate.• As of year end we had swapped all of our floating rate debt into fixed rate debt. At the current time our only
floating rate debt is through our credit line.
OUTLOOK• The commercial real estate market is anticipating moderately higher interest rates. Boyd does not expect a
significant impact on pricing in the near term, particularly if long term rates remain muted.• The net income return for 2016 fell within our 7-9% target and we expect to be able to achieve this objective for the
foreseeable future.• Boyd expects the higher income focus of the GSA Fund to help insulate the Fund in an economic downturn and
outperform traditional core real estate funds as principal gains in the core market moderate from recent historically high levels.
9
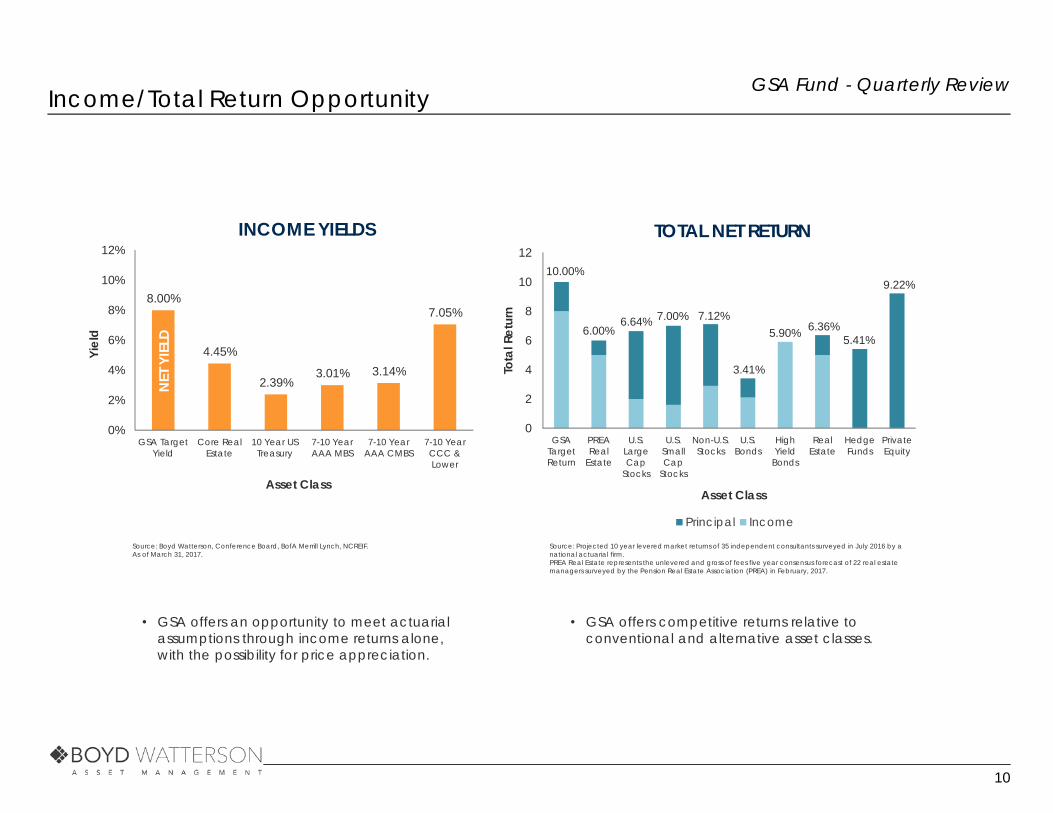
Income/Total Return Opportunity GSA Fund - Quarterly Review
10.00%
6.00%6.64% 7.00% 7.12%
3.41%
5.90% 6.36%5.41%
9.22%
0
2
4
6
8
10
12
GSATargetReturn
PREAReal
Estate
U.S.LargeCap
Stocks
U.S.SmallCap
Stocks
Non-U.S.Stocks
U.S.Bonds
HighYield
Bonds
RealEstate
HedgeFunds
PrivateEquity
Tota
l Ret
urn
Asset Class
TOTAL NET RETURN
Principal Income
Source: Projected 10 year levered market returns of 35 independent consultants surveyed in July 2016 by a national actuarial firm.PREA Real Estate represents the unlevered and gross of fees five year consensus forecast of 22 real estate managers surveyed by the Pension Real Estate Association (PREA) in February, 2017.
8.00%
4.45%
2.39%3.01% 3.14%
7.05%
0%
2%
4%
6%
8%
10%
12%
GSA TargetYield
Core RealEstate
10 Year USTreasury
7-10 YearAAA MBS
7-10 YearAAA CMBS
7-10 YearCCC &Lower
Yiel
d
Asset Class
INCOME YIELDS
Source: Boyd Watterson, Conference Board, BofA Merrill Lynch, NCREIF. As of March 31, 2017.
• GSA offers competitive returns relative to conventional and alternative asset classes.
• GSA offers an opportunity to meet actuarial assumptions through income returns alone, with the possibility for price appreciation.
NET
YIE
LD
10

The Real Estate Cycle GSA Fund - Quarterly Review
-15-10-505
1015
1992 1996 2000 2004 2008 2012 2016
ANNUAL PRINCIPAL RETURN OF NFI-ODCE INDEX
CORE REAL ESTATEPrincipal growth slows when:1) Occupancy rates are high 2) Periodic rent increases stop 3) Local economy weakens
GSA REAL ESTATEPrincipal growth is comparably stable due to:1) High occupancy; long, mainly
fixed leases; high renewals2) High replacement value
25 years 39 years
Principal 1.1% 1.4%
Income 6.0% 6.3%
Total 7.2% 7.7%
NFI-ODCE INDEX RETURNS(1)
1Annualized net of fees returns through December 31, 2016. The 25 year period is the inception of the graph to the left, the 39 year period is the inception of the Index.
Note: The Real Estate Cycle is shown for illustrative purposes and sourced from Colliers International. The band between the two small blue bars under Peak Phase represents Boyd Watterson’s opinion of where real estate is currently located in its cycle. The GSA Cycle is shown for illustrative purposes only based on observations and experience by Boyd Watterson in the GSA market.
The NFI-ODCE (NCREIF Fund Index- Open End Diversified Core Equity) is reported by the National Council of Real Estate Investment Fiduciaries (NCREIF). It is an index of investment returns reporting on both a historical and current basis representing the results of 36 open-end commingled funds pursuing a core investment strategy. The NFI-ODCE Index is capitalization-weighted and includes moderate leverage.
-34.1%
BOTTOM PHASE
PEAK PHASE
Recession Phase
Recovery Phase
THE REAL ESTATE CYCLE
The GSA Cycle
ExpansionPhase
Contraction Phase
11

GSA Fund Holdings GSA Fund - Quarterly Review
LOCATION U.S. AGENCY YEAR BUILT/ SF LEASE TERM PURCHASE GOING-IN CLOSING DATERENOVATED REMAINING PRICE CAP RATE
Morgantown, WV Department of Agriculture (USDA) 2009 34,904 7.42 $10,850,000 7.53% 12/20/2013Morgantown, WV DOL* - Mine Safety & Health Administration (MSHA) 2003 19,969 1.25 $4,225,000 8.14% 12/20/2013Middleburg Hts, OH DHS* - Customs & Border Protection (CBP) 2012 33,387 9.42 $7,962,500 8.12% 2/7/2014Rio Rico, AZ DHS - ICE / Dept. of Interior (DOI) - Fish & Wildlife 2011 29,513 9.25 $13,250,000 7.57% 3/5/2014Kearneysville, WV DHS - Coast Guard (USCG) 2014 42,943 7.25 $11,800,000 6.80% 6/20/2014Miramar, FL DHS - Immigration & Customs Enforcement (ICE) 2010 33,500 8.50 $13,140,000 6.46% 6/20/2014Greenville, NC U.S. Bankruptcy Courthouse 2013 25,411 16.67 $10,250,000 6.78% 7/1/2014Tampa, FL DHS - Military Entrance Processing Command (USMEPCOM) 2012 27,398 9.33 $7,250,000 7.54% 7/31/2014Gettysburg, PA Federal Communications Commission (FCC), NOAA* (NTIA) 2014 91,908 4.67 $16,700,000 7.77% 9/9/2014Flagstaff, AZ Forest Service, National Park Service 2004 48,902 7.42 $9,300,000 7.98% 10/14/2014Las Cruces, NM Department of Justice - Drug Enforcement Administration (DEA) 2009 21,815 7.25 $15,000,000 7.40% 10/20/2014Atlanta, GA Citizenship and Immigration Services (CIS) 2006 76,909 9.75 $11,550,000 8.60% 10/29/2014Beltsville, MD Food & Drug Admin. (FDA), ATF* 2004 105,763 1.33 $16,850,000 10.30% 11/3/2014Albuquerque, NM Department of the Interior, The GAP Inc. 2006 162,892 6.25 $31,500,000 7.30% 11/20/2014Olympia, WA Forest Service 2014 41,814 9.33 $12,025,000 7.20% 12/17/2014York, PA Social Security Administration (SSA) /IRS 2013 21,564 10.83 $7,850,000 6.90% 12/23/2014St. Louis, MO Food & Drug Administration (FDA) 2013 61,308 11.42 $20,500,000 5.99% 1/6/2015Stafford, VA Department of Defense (DoD) 2011 100,338 2.75 $28,250,000 7.44% 1/20/2015Reston, VA Department of Defense (Parkridge II) 2013 95,353 0.83 $34,250,000 7.37% 1/26/2015Linden, NJ Department of Agriculture 2013 30,297 11.75 $7,300,000 7.70% 4/1/2015Melbourne, FL Department of State 2012 56,004 9.42 $11,850,000 6.90% 4/7/2015Baltimore, MD Citizenship and Immigration Services (CIS) 2013 75,980 11.67 $9,900,000 6.97% 4/27/2015Brunswick, GA State of Georgia (Dept. of Human Services) 2014 28,800 12.92 $6,775,000 8.00% 5/4/2015Meridian, MS Social Security Administration (SSA) 2014 9,796 12.50 $1,950,000 8.52% 5/11/2015Tulsa, OK Social Security Administration (SSA) 2005 29,225 3.25 $5,650,000 7.46% 5/14/2015Corpus Christi, TX Social Security Administration (SSA/ODAR) 2002 18,661 0.58 $3,250,000 8.37% 5/14/2015
Greensboro I, NC Various (IRS, Dept. of Health & Human Services (DHHS), Secret Service) 2010 115,200 2.75 $12,100,000 14.61% 5/21/2015
Greensboro II, NC Various (FBI, DEA, Dept. of State, ATF) 1989 127,446 4.92 $7,800,000 9.35% 5/21/2015Austin, TX Department of Treasury - Internal Revenue Service (IRS) 2007 122,316 4.08 $35,000,000 7.22% 6/1/2015Suffolk, VA Department of Defense (DoD) 2007 138,186 10.42 $42,750,000 7.25% 6/3/2015Elkridge I, MD Other Federal Agency 2001 51,361 6.17 $10,550,000 7.48% 7/30/2015Elkridge II, MD Other Federal Agency 2001 80,369 9.58 $19,850,000 7.23% 7/30/2015Phoenix, AZ Department of Agriculture (USDA) – Forest Service (USFS) 2012 32,162 10.42 $4,900,000 7.89% 8/5/2015Kearneysville, WV DHS – Coast Guard (USCG – Operational HQ) 2014 117,776 2.92 $25,000,000 7.04% 8/17/2015
Albuquerque, NM Department of Justice – Drug Enforcement Administration (DEA) 2011 41,847 14.17 $22,000,000 6.58% 8/17/2015
Rio Rancho, NM Social Security Administration (SSA) 2010 9,755 8.25 $4,110,000 7.69% 8/17/2015San Antonio, TX Social Security Administration (SSA) 2009 25,923 7.58 $8,250,000 7.49% 8/17/2015Greenville, TX Social Security Administration (SSA) 2001 9,463 8.08 $1,390,000 7.99% 8/17/2015Silver City, NM Department of Agriculture (USDA) – Forest Service (USFS) 2014 29,554 12.00 $6,250,000 7.39% 8/17/2015Irving, TX Department of Justice – Federal Bureau of Investigation (FBI) 2011 28,417 9.50 $10,200,000 6.66% 9/8/2015Cary, NC DHS - Immigration & Customs Enforcement (ICE) 2015 15,919 13.17 $5,800,000 6.76% 10/1/2015
Nashville, TN Department of Defense - Military Entrance Processing Command (USMEPCOM) 2007 23,391 0.33 $3,320,000 7.03% 10/1/2015
Jacksonville, FL DHS - Border Patrol (BPS) 2004 12,160 2.08 $3,080,000 8.10% 10/1/2015Riviera Beach, FL DHS - Border Patrol (BPS) 2004 23,653 4.42 $8,750,000 7.91% 10/1/2015
HOLDINGS
Note: As of March 31, 2017. Lease terms reflect final maturity, but may not adjust for early termination options.*DOL represents the U.S. Department of Labor; DHS represents the U.S. Department of Homeland Security; NOAA represents the National Oceanic and Atmospheric Administration; and ATF represents the U.S. Bureau of Alcohol, Tobacco, Firearms and Explosives.
12
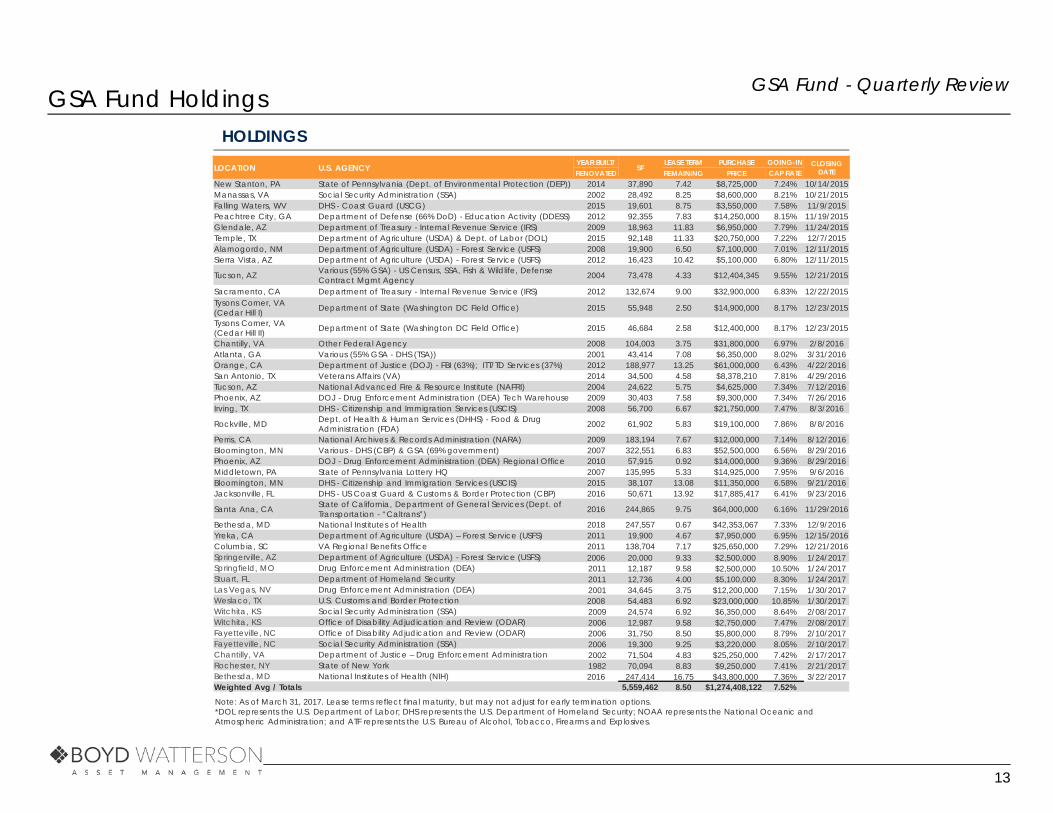
GSA Fund Holdings GSA Fund - Quarterly Review
LOCATION U.S. AGENCY YEAR BUILT/SF
LEASE TERM PURCHASE GOING-IN CLOSING DATERENOVATED REMAINING PRICE CAP RATE
New Stanton, PA State of Pennsylvania (Dept. of Environmental Protection (DEP)) 2014 37,890 7.42 $8,725,000 7.24% 10/14/2015Manassas, VA Social Security Administration (SSA) 2002 28,492 8.25 $8,600,000 8.21% 10/21/2015Falling Waters, WV DHS - Coast Guard (USCG) 2015 19,601 8.75 $3,550,000 7.58% 11/9/2015Peachtree City, GA Department of Defense (66% DoD) - Education Activity (DDESS) 2012 92,355 7.83 $14,250,000 8.15% 11/19/2015Glendale, AZ Department of Treasury - Internal Revenue Service (IRS) 2009 18,963 11.83 $6,950,000 7.79% 11/24/2015Temple, TX Department of Agriculture (USDA) & Dept. of Labor (DOL) 2015 92,148 11.33 $20,750,000 7.22% 12/7/2015Alamogordo, NM Department of Agriculture (USDA) - Forest Service (USFS) 2008 19,900 6.50 $7,100,000 7.01% 12/11/2015Sierra Vista, AZ Department of Agriculture (USDA) - Forest Service (USFS) 2012 16,423 10.42 $5,100,000 6.80% 12/11/2015
Tucson, AZ Various (55% GSA) - US Census, SSA, Fish & Wildlife, Defense Contract Mgmt Agency 2004 73,478 4.33 $12,404,345 9.55% 12/21/2015
Sacramento, CA Department of Treasury - Internal Revenue Service (IRS) 2012 132,674 9.00 $32,900,000 6.83% 12/22/2015Tysons Corner, VA (Cedar Hill I) Department of State (Washington DC Field Office) 2015 55,948 2.50 $14,900,000 8.17% 12/23/2015
Tysons Corner, VA (Cedar Hill II) Department of State (Washington DC Field Office) 2015 46,684 2.58 $12,400,000 8.17% 12/23/2015
Chantilly, VA Other Federal Agency 2008 104,003 3.75 $31,800,000 6.97% 2/8/2016Atlanta, GA Various (55% GSA - DHS (TSA)) 2001 43,414 7.08 $6,350,000 8.02% 3/31/2016Orange, CA Department of Justice (DOJ) - FBI (63%); ITT/TD Services (37%) 2012 188,977 13.25 $61,000,000 6.43% 4/22/2016San Antonio, TX Veterans Affairs (VA) 2014 34,500 4.58 $8,378,210 7.81% 4/29/2016Tucson, AZ National Advanced Fire & Resource Institute (NAFRI) 2004 24,622 5.75 $4,625,000 7.34% 7/12/2016Phoenix, AZ DOJ - Drug Enforcement Administration (DEA) Tech Warehouse 2009 30,403 7.58 $9,300,000 7.34% 7/26/2016Irving, TX DHS - Citizenship and Immigration Services (USCIS) 2008 56,700 6.67 $21,750,000 7.47% 8/3/2016
Rockville, MD Dept. of Health & Human Services (DHHS) - Food & Drug Administration (FDA) 2002 61,902 5.83 $19,100,000 7.86% 8/8/2016
Perris, CA National Archives & Records Administration (NARA) 2009 183,194 7.67 $12,000,000 7.14% 8/12/2016Bloomington, MN Various - DHS (CBP) & GSA (69% government) 2007 322,551 6.83 $52,500,000 6.56% 8/29/2016Phoenix, AZ DOJ - Drug Enforcement Administration (DEA) Regional Office 2010 57,915 0.92 $14,000,000 9.36% 8/29/2016Middletown, PA State of Pennsylvania Lottery HQ 2007 135,995 5.33 $14,925,000 7.95% 9/6/2016Bloomington, MN DHS - Citizenship and Immigration Services (USCIS) 2015 38,107 13.08 $11,350,000 6.58% 9/21/2016Jacksonville, FL DHS - US Coast Guard & Customs & Border Protection (CBP) 2016 50,671 13.92 $17,885,417 6.41% 9/23/2016
Santa Ana, CA State of California, Department of General Services (Dept. of Transportation - “Caltrans”) 2016 244,865 9.75 $64,000,000 6.16% 11/29/2016
Bethesda, MD National Institutes of Health 2018 247,557 0.67 $42,353,067 7.33% 12/9/2016Yreka, CA Department of Agriculture (USDA) – Forest Service (USFS) 2011 19,900 4.67 $7,950,000 6.95% 12/15/2016Columbia, SC VA Regional Benefits Office 2011 138,704 7.17 $25,650,000 7.29% 12/21/2016Springerville, AZ Department of Agriculture (USDA) - Forest Service (USFS) 2006 20,000 9.33 $2,500,000 8.90% 1/24/2017Springfield, MO Drug Enforcement Administration (DEA) 2011 12,187 9.58 $2,500,000 10.50% 1/24/2017Stuart, FL Department of Homeland Security 2011 12,736 4.00 $5,100,000 8.30% 1/24/2017Las Vegas, NV Drug Enforcement Administration (DEA) 2001 34,645 3.75 $12,200,000 7.15% 1/30/2017Weslaco, TX U.S. Customs and Border Protection 2008 54,483 6.92 $23,000,000 10.85% 1/30/2017Witchita, KS Social Security Administration (SSA) 2009 24,574 6.92 $6,350,000 8.64% 2/08/2017Witchita, KS Office of Disability Adjudication and Review (ODAR) 2006 12,987 9.58 $2,750,000 7.47% 2/08/2017Fayetteville, NC Office of Disability Adjudication and Review (ODAR) 2006 31,750 8.50 $5,800,000 8.79% 2/10/2017Fayetteville, NC Social Security Administration (SSA) 2006 19,300 9.25 $3,220,000 8.05% 2/10/2017Chantilly, VA Department of Justice – Drug Enforcement Administration 2002 71,504 4.83 $25,250,000 7.42% 2/17/2017Rochester, NY State of New York 1982 70,094 8.83 $9,250,000 7.41% 2/21/2017Bethesda, MD National Institutes of Health (NIH) 2016 247,414 16.75 $43,800,000 7.36% 3/22/2017Weighted Avg / Totals 5,559,462 8.50 $1,274,408,122 7.52%Note: As of March 31, 2017. Lease terms reflect final maturity, but may not adjust for early termination options.*DOL represents the U.S. Department of Labor; DHS represents the U.S. Department of Homeland Security; NOAA represents the National Oceanic and Atmospheric Administration; and ATF represents the U.S. Bureau of Alcohol, Tobacco, Firearms and Explosives.
HOLDINGS
13