Starch Retrogradation in Rice Cake: Influences of Sucrose ...
Upload
independentCategory
view
4download
0
Quantitative Determination of Sugar Cane Sucrose byMultidimensional Statistical Analysis of theirMid-Infrared Attenuated Total Reflectance Spectra*
rnBoÉNTC CADET,T DOMINIQUE BERTRAND, PAUL ROBERT, JOSEPH MAILLOT,JULES DIEUDONNÉ, ANd CLAUDE ROUCH(Jniuersite de la Réunion, Laboratoire de Chitnie Organique, Faculté des Sciences, BP 5,97490 Sainte Clotilde, Ile de la Réunion,France (F.C., C.R.); INRA, Laboratoire de Technologie Appliquée à la Nutrition, Rue de la Géraudière, BP 527,44026 Nantes
Céd.ex, France (D.8., P.R.); and Centre Technique Interprofessionnel de la Canne et du Sucre, Laboratoire de Recherche et
Déueloppernent, Route de I'ONF, B.P. 140,97464 Saint Denis Cédex, Ile de la Réunion, France (J.M., J.D.)
A fast and accurate method for determining the sucrose content of sugar
cane juice has been developed. The application of principal component
regression (PCR) has been proposed for the development of a prediction
equation of sucrose content by mid-infrared spectroscopy. An attenuated
total reflectance (ÀTR) cell is used in place of the more familiar hans-mission cell. PCR involves two steps: (1) the creation of new syntheticvariables by principal component analysis (PCA) of spectral data, and(2) multiple linear regression (MLR) with these new variables. Results
obtained by this procedure have been compared with those obtained by
the conventional application of polarization.
Index Headings: Mid-infrared spectroscopy; ATR; Prediction; Sucrose.
INTRODUCTION
Polarimetric analysis is the method traditionally em-ployed to determine the sucrose content of juice samplesin the cane sugar industry. Although this technique isadequate under ideal conditions, it may have seriouslimitations under circumstances in which optically activesubstances other than sucrose are present.l Under suchcircumstances more accurate methods of sucrose analysisare required.2,3 These include enzymatic methods, gas-liquid chromatography with prior derivatization, paperchromatography, and liquid chromatography. However,considerations of cost, time of analysis per sample, andcomplexities involved in these technique have hamperedthe acceptance ofthese methods by cane sugar industries.
Near-infrared reflectance is widely used to rapidlymeasure the composition of foods and food products,anotably cereal products.s
Near-infrared reflectance spectroscopy has alreadybeen used for the analysis of sugar content in sugar canesamples. The values obtained are comparable to thosemeasured with a polarimeter.6 The fundamental vibra-tion-rotation bands and the skeletal vibrations fall in themid-infrared range (400-4600 cm-'). However, use of themid-infrared to characterize complex products such as
foods and food products has long been precluded bytechnical problems. The advent of Fourier transformspectrometers, with their many advantages over tradi-tional dispersive instruments, has improved the qualityof infrared data while making data collection faster andeasier.T
Received 23 May 1990; revision received 1 August 1990.* This publication is dedicated to Professor Jean-Claude Meunier.t Author to whom correspondence should be sent.
In addition, new devices and easier techniques havebeen developed to study opaque powders.8 Mid-infraredspectra contain a wealth of information about materialconstituents. Complex spectra make interpretation dif-ficult, but this problem may be overcome by using mul-tidimensional statistical analyses.e'lo
This study investigates mid-infrared ATR potential-ities to determine the amount of sucrose present in sugarcane juice, using new technical developments combinedwith multidimensional statistical analyses. To ourknowledge, this combination has not yet been used forthe analysis of sugar cane juice and could prove to beinteresting.
MATERIALS AND METHODS
Samples. Sampling of sugar cane by coring is used.The average core sample is about 7000 g. After pulver-ization, a subsample of approximately 1000 g is removed.A hydraulic press is used to extract juice from the sub-samples obtained from the coring sampler and from thedisintegrator.
The subsample is pressed for two and a half minutesat 250 bars. A juice preservative is added (lead subacetateat 2.5 g for 150 mL), and storage is carried out at 4oC.
In reconstituted sugar cane juices, sucrose, glucose,and fructose are mixed in proportions in accordance withthose observed in natural sugar cane juices analyzed inour laboratory. Natural juices with sucrose concentra-tions ranging from I to 23% are used as models. Theglucose and fructose concentrations are those corre-sponding to these natural juices.
Glucose, Reducing Sugars, and Sucrose Determina-tions. The enzymatic and colorimetric determinations ofglucose and reducing sugars, respectively, have been de-termined by a continuous flow technique (the IRIS-TDFflow cell analysis method). Glucose oxidase and peroxi-dase are used for the specific determination of glucose.The resulting product (monoimino-p-benzaquinone-4-phenazone) is determined spectrophotometrically at 505-520 nm. The reducing sugars are determined by spec-trophotometry at 460 nm after reaction with neocuproinehydrochloride and cupric sulfate.
The accuracy and reproducibility of this approach arevery high and agree with the demands required for sugarcane analysis. The experimental analysis error (differ-ence between the calculated and known concentrations
ooos-? 028 /91 I 4502-0166S2.00/0
@ 1991 Societÿ for Applied Spectroscopy166 Volume 45, Number 2, 1991 APPLIED SPECTROSCOPY

Enzymatic and polarimetric measures
No. GlucoseReducing
sugar§
Sucrosecontent
(b),Polarization corrected Variation
(o) polarization (b - a\
Mid-FT-IR measures
Pure sucrose solutions Reconstituted juices
Predicted Variationsucrose (d) (d - b)
Predicted Variationsucrose (c) (c - b)
1
2ù4567
8I
1011t213L41516L71819202t2223242526q1
2829303132ôù343536
3839404l424344454647
0.070.080.480.220.190.330.400.300.160.280.200.350.L20.190.320.200.070.340.550.260.100.200.140.080.2L0.t40.250.310.450.410.480.170.070.210.200.t20.190.140.150.560.380.t20.280.090.240.250.10
Mean0.237
Standarddeviation
0.131
0.170.2t0.940.490.420.710.830.630.320.590.410.680.310.400.610.410.180.731.090.610.190.360.280.160.400.310.490.700.950.850.910.330.110.420.360.220.450.290.361.070.770.250.560.200.470.620.2t
Mean0.490
Standarddeviation
0.259
t7.4818.9313.7316.07l7.lLL7.1515.11L6.4716.4618.38L6.5413.95t7.8717.1617.4t17.8017.1 1
L3.5711.7816.83L7.2216.3916.4917.9320.9114.85L5.2312.5015.0314.56L3.5216.63L9.45t7.72L6.371-6.81.
L7.42L5.2916.57L7.6416.4618.0515.84L7.L814.0016.6518.56
MeanL6.429
Standarddeviation
1.796
17.563t9.04713.98916.27t17.279L7.4L615.39016.69116.55518.58916.67314.13L18.03917.30117.55917.933t7.207L3.842L2.09417.110t7.266L6.45416.574t7.97821.008t4.97515.36512.79615.36814.84613.73716.71819.450r7.845t6.43416.85417.63115.38716.74317.90516.70118.13516.007t7.26tt4.t2916.96618.634
0.0830.1170.2590.2010.1690.2660.2800.2210.0950.2090.1330.1810.1690.1410.1490.1330.0970.2720.3140.2800.0460.0640.0840.0480.0980.t250.1350.2960.3380.2860.2t70.0880.0000.t250.0640.0440.2t10.0970.1730.2650.24L0.0850.1670.0810.t290.3160.074
Bias0.163
RMSD0.087
19.16420.73515.52817.99318.70318.800t7.02818.074t7.82420.181t7.84115.35419.29618.63119.104t9.44918.581t5.trzt3.29718.88618.83618.352L8.42r19.87623.7t816.561t7.144L4.36717.356L6.72715.78518.68121.60219.94618.25118.81519.490L7,LL718.58220.44618.83420.18517.91619.263L5.78418.73320.580
1.6011.6881.539t.722t.424L.3841.638I".3831.269t.5921.168t.223L.2571.330L.5451.516L.374L.2701.203t.7761.5701.898L.8471.8982.7101.586L.779L.57t1.9881.8812.0481.9632.r522.1011.8171.9611.8591.7301.8392.5412.t332.0501.9092.0021.6551.7671.946
BiasL.726
RMSD0.334
18.133L9.55714.54416.84717.53817.60015.76016.73416.63918.91116.60814.11018.07817.395t7.67918.039t7.t(t13.779t2.t5717.519t7.622t7.288t7.27018.66922.rt015.59616.14513.453L6.27915.80714.661t7.57920.49818.877L7.246t7.76r18.36616.20517.56219.10017.6t718.94816.84718.05814.836t7.73t19.436
0.5700.5100.5550.5760.2590.1840.3700.0430.0840.322
-0.065-0.021
0.0390.0940.1200.106
-0.066-0.063
0.0630.4090.3560.8340.6960.691L.t020.62t0.7800.6570.9110.961o.9240.8611.048L.0320.8120.9070.7350.8180.8191.1950.9160.8130.8400.7970.7070.7650.802
Bias0.564
RMSD0.366
in an analyüical sample) is less than 2% for both glucoseand reducing sugars.
Sucrose is determined either by direct polarimetricmeasurement (POL) or by correction from the effect ofglucose and fructose. The correction is given by:
(sucrose) : POL - 0.7921(glucose) + 1.38885(fructose)(fructose): (reducing sugar) - (glucose)
with
(sucrose) : POL - 2.18095(glucose) + 1.38885(reducingsugars)
where: POL : the polarimetric measure (noncorrectedsucrose content); (glucose) : the enzymatic determina-tion; (reducing sugars) : the colorimetric determination;and 0.7921 and 1.38885 : the angular rotation measure-ments for glucose and fructose, respectively.
Mid-Infrared Attenuated Total Reflectance Spectra.Mid-Fourier Transformed Infrared (Mid-FT-IR) spectra
APPLIED SPECTROSCOPY 167

Frc. 1a. Fourier transformed mid-IR spectrum of sugar cane juice.
were collected on a Michelson-100 Fourier transformspectrophotometer. Attenuated total reflectance spectrawere obtained with a Specac Overhead ATR system. Thecrystal of the reflectance element is made from zinc sele-nide, a material that is quite inert to water; it is rapidlycleaned between samples by being sprayed with waterand then dried with filter paper.
The data were recorded from 800 to 1250 cm-1in 4-cmincrements at log(l/R), in which È is the ratio of thereflected intensity for the background to that of the sam-ple. Although the ATR experiment does involve the re-flection of the radiation within a crystal, the interactionof the radiation with the sample is a transmittance ofradiation through the sample; this depth of penetrationis wavelength dependent, but it is still passing througha finite layer of the sample. For this reason, plots canread according to absorbance (or transmittance). Thecombination of four scans resulted in an averâge spec-trum. The intensity of the spectra was low; the highestpeaks had log(1/À) values lower than 0.60 on baselinespectra.
Mathematical Treatments. Mathematical treatmentwas performed on a Nec personal computer with software
Frc. 1b. Fourier transformed mid-IR spectra of: (O) HrO; (tr) fructose;(O) glucose, (*) sucrose.
168 Volume 45, Number 2, 1991
Frc. 2. Sucrose content in sugar cane juices: reference concentrations(corrected polarization) vs. predicted concentrations. (a) Prediction set;(b) verification set.
written and developed at the Laboratoire de Technologiedes Aliments des Animaux, INRA, Nantes.
Multidimensional statistical analyses, such as princi-pal component analyses (PCA), describe variation inmultidimensional data by a few synthetic variables. Thesesynthetic variables are linear combinations of all the orig-inal variables and have the advantage of having no cor-relation with each other. Simpler descriptions of datasets are thus obtained with minimal loss of information.These treatments were used for morphological analysisof spectralr and for graphical representation of spectrasimilarity.
Principal component regression (PCR) was used to
Predtcted cotcentrât lons
3 soo
o
aÂ.dtrerd
àU
o)tot{Bq
----+-2a 5 x10
Dj.fference between predicted sucrose (IIID-FTIR) ancl sucrose content(corrected polarization) .
Frc. 3. Frequency ofdistribution vs. deviation between sucrose contents (corrected polarization) and predicted concentrations for natural sugarcane juices.
establish a prediction equation. PCR is basically a mul-tilinear regression applied to scores assessed by PQ4.'z'ts
Interest in the introduction of scores according to theirpredictive ability had already been shown.ra'15
For the prediction equation, the number of regressionterms was predetermined by specifying that the last termintroduced would have a probability of being nonsignif-icant, its value being determined as less than 0.05 (ac-
cording to the .F' test). PCA was applied to the spectrafrom 800 to L250 cm-l (with 235 data points used asprincipal variables). Spectra were centered prior to PCAaccording to:
X,i:A,;-Aj-Ai+A (1)
where X,, : centered data; 4,, : spectral data (lo9 t/R)of spectrum i and wavelength j; A, : mean value of
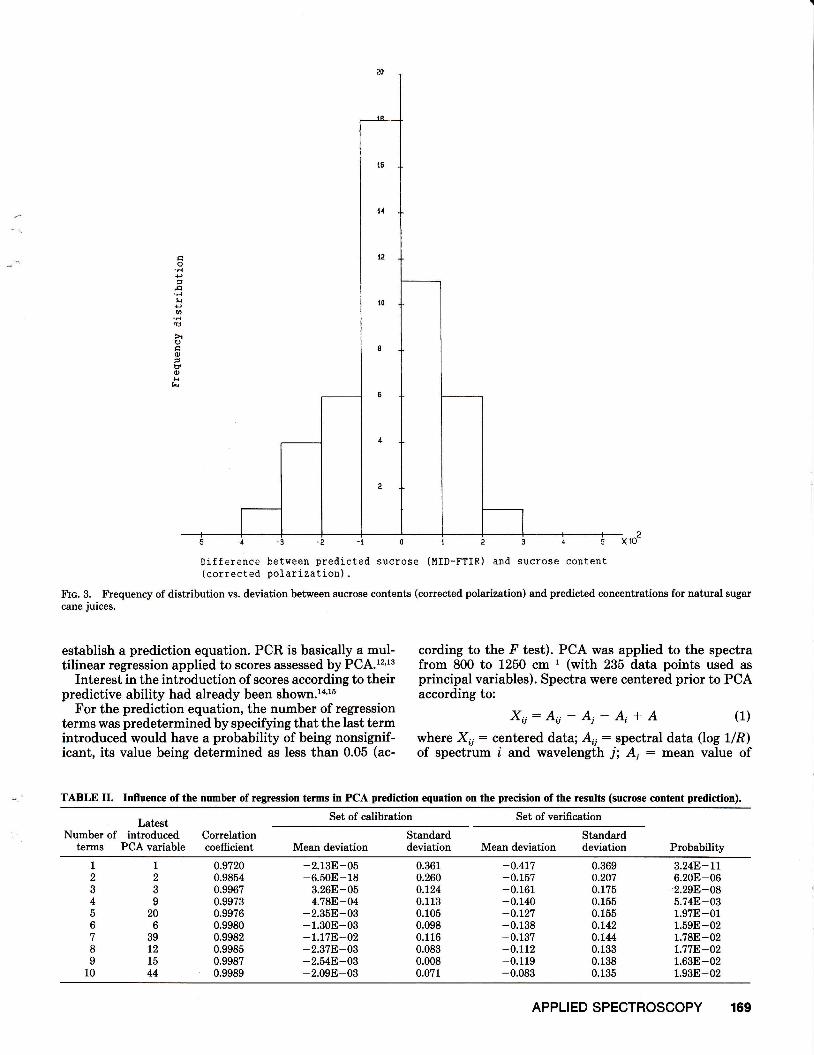
TABLE II. Influence of the number of regression terms in PtCÀ prediction equation on the precision of the results (sucrose content prediction).
LatestNumber of introduced
terms PCA variable
Set of calibration Set of verification
Mean deviation ProbabilityCorrelationcoefficient
Standarddeviation
StandardMean deüation deviation
1,34ô67II
t0
1
23I
206
39L21544
0.97200.98540.99670.99730.99760.99800.99820.99850.99870.9989
-2.13E-05-6.50E-18
3.268-054.788-04
-2.35E-03-1.308-03-t.L7E-02-2.37E-03-2.548-03-2.09E-03
0.3610.260o.t240.1130.1050.0980.1160.0830.0080.071
-0.417-0.157-0.161-0.140-0.t27-0.138-0.137-0.112-0.119-0.083
0.3690.2070.1?50.1550.1550.1420.t440.1330.1380.135
3.24E- 116.20E-062.298-085.748*031.97E-011.59E-021.788-021.778-021.63E-021.93E-02
APPLIED SPECTROSCOPY 169

AXI52
AXISl18.1
18.0
11.1
spectral data at wavelength j for every spectrum; A, :mean value of spectral data of spectrum i for every rtrave-length; and A : average mean of all spectral data in thecollection. The resulting table therefore has a sum ofevery row or every column equal to 0.
The relevance of the prediction equations was estab-lished by the assessment of the bias and of the root meansquare of difference (RMSD) according to Kruschka.l6
Three prediction equations were achieved by usingPCR and changing the calibration set. One was estab-lished on pure sucrose solutions ranging from 1 to25%(g/100 mL). The second one used mixtures of sugars inaccordance with the observed proportions in sugar canejuice (from 10.39 to 20.23% for sucrose). The last oneused the calibration set ofnatural sugar canejuices (from9.47 to L9.93%).
170 Volume 45, Number 2, 1991
RESULTS AND DISCUSSION
Chemical Yalues and Spectra. Chemical values of theverification set are given in Table I. Sucrose ranged from11.78 to 20.91 9/100 mL with an average value of 16.43and a standard deviation equal to 1.80. Glucose and re-ducing sugars, respectively, ranged from 0.07 to 0.56 (av-erage value :0.24, standard deviation : 0.13) and 0.11to 1.09 (average value : 0.49, standard deviation -- 0.26).
The results of sucrose content estimation by polariza-tion without correction were compared with those as-sessed by taking into account the effect of other sugars.The bias and the RMSD were, respectively, 0.163 9/100mL and 0.087 9/100 mL. The bias was significantly dif-ferent from 0 (P > 0.05).
The effects of glucose and reducing sugars on the po-larimetric measurement were therefore not negligible.
Frc. 4. Principal component analysis, Discrimination ef gemples of calibration according to sucrose content (g/100 mL).
vl+J
É
àt{6,{+p,i
cn- 1
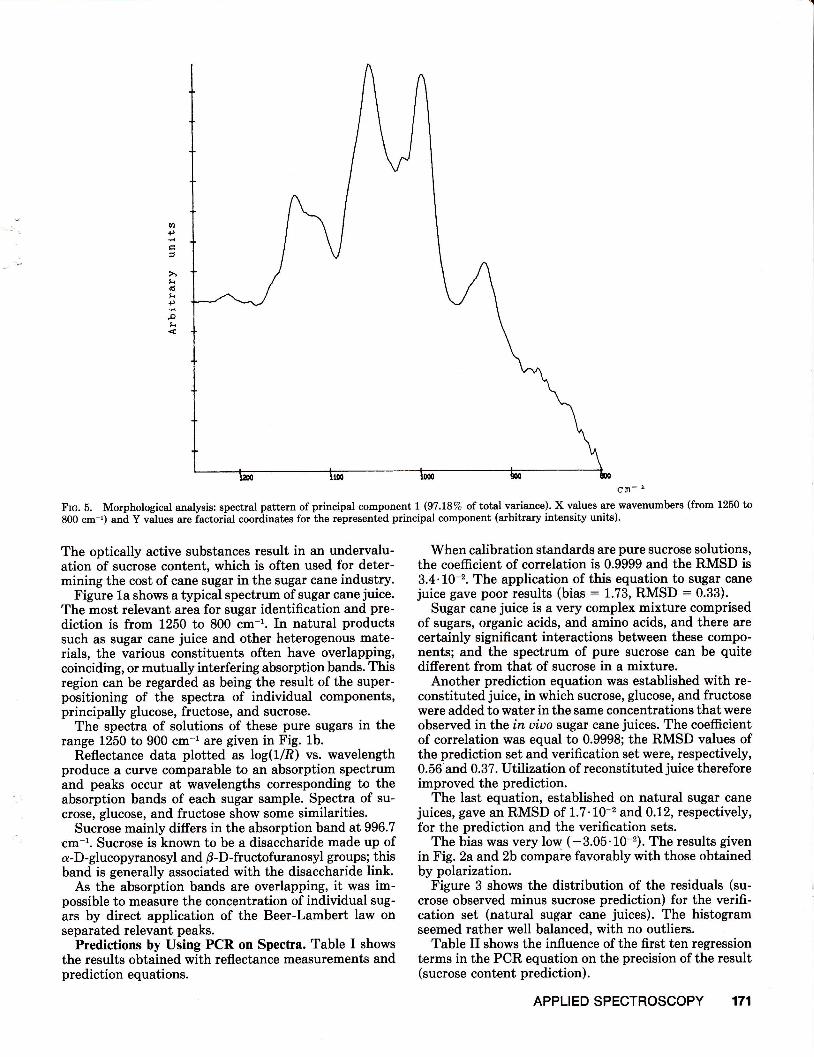
Fre. 5. Morphological analysis: §pectral pattern ofprincipal component I (97.L8% oftotal variance). X values are wavenumbers (from 1250 to800 cm-l) and Y vàues are iactorial coorAinates for the represented principal component (arbitrary intænsity units).
The optically active substances result in an undervalu-ation of sucrose content, which is often used for deter-mining the cost of cane sugar in the sugar cane industry.
Figure la shows a typical spectrum of sugar cane juice.The most relevant area for sugar identification and pre-diction is from 1250 to 800 cm-1. In natural productssuch as sugar cane juice and other heterogenous mate-rials, the various constituents often have overlapping,coinciding, or mutually interfering absorption bands. Thisregion can be regarded as being the result of the super-positioning of the spectra of individual components,principally glucose, fructose, and sucrose.
The spectra of solutions of these pure sugars in therunge L250 to 900 cm-1 are given in Fig. 1b.
Reflectance data plotted as log(1/8) vs. wavelengthproduce a curve comparable to an absorption spectrumand peaks occur at wavelengths corresponding to theabsorption bands of each sugar sample. Spectra of su-crose, glucose, and fructose show some similarities.
Sucrose mainly differs in the absorption band at 996.7cm-1. Sucrose is known to be a disaccharide made up ofa-D - glucopyranosyl and 0-D -fructofuranosyl groups; thisband is generally associated with the disaccharide link.
As the absorption bands are overlapping, it was im-possible to measure the concentration of individual sug-ars by direct application of the Beer-Lambert law onseparated relevant peaks.
Predictions by Using PCR on Spectra. Table I showsthe results obtained with reflectance measurements andprediction equations.
When calibration standards are pure sucrose solutions,the coefficient of correlation is 0.9999 and the RMSD is3.4.10-'z. The application of this equation to sugar canejuice gave poor results (bias : 1.73, RMSD : 0.33).
Sugar cane juice is a very complex mixture comprisedof sugars, organic acids, and amino acids, and there arecertainly significant interactions between these compo-nents; and the spectrum of pure sucrose can be quitedifferent from that of sucrose in a mixture.
Another prediction equation was established with re-constituted juice, in which sucrose, glucose, and fructosewere added to water in the szlme concentrations that wereobserved in the in uiuo sugar cane juices. The coefficientof correlation was equal to 0.9998; the RMSD values ofthe prediction set and verification set \ryere, respectively,0.56 and 0.37. Utilization of reconstituted juice thereforeimproved the prediction.
The last equation, established on natural sugar canejuices, gave an RMSD of 1.7'10*2 and 0.12, respectively,for the prediction and the verification sets.
The bias was very low ( - 3.05 ' 10-'z). The results givenin Fig. 2a and 2b compare favorably with those obtainedby polarization.
Figure 3 shows the distribution of the residuals (su-crose observed minus sucrose prediction) for the verifi-cation set (natural sugar cane juices). The histogramseemed rather well balanced, with no outliers.
Table II shows the influence of the first ten regressionterms in the PCR equation on the precision of the result(sucrose content prediction).
APPLIED SPECTROSCOPY 171
The first introduced component gave a correlation co-efficient equal to 0.9718. Other components improvedthe equation.
Principal Component Analysis. Figure 4 shows the mostpredictive map (components L and 2). Samples are dis-tributed according to their sucrose content. Axis l- seems
to be representative of sucrose concentration. The spec-tral pattern (eigenvectors) of component 1 (Fie. 5) isin agreement with this distribution. Spectral pattern 1
shows positive bands representative of the disaccharidelink of saccharose (997 cm-') and the ring C-O stretchingvibrations (1054, 1105 cm-l); the absorption band atLl}7is related to the strongly coupled sugar COH bendingmodes.17'18
These bands were already visible by direct examina-tion of the original spectra, although with slight shifting.
CONCLUSION
Attenuated total reflectance mid-infrared Fouriertransform spectroscopy shows potential for the quanti-fication of sucrose in clarified sugar cane juice.
In sugar cane juice, significant wavenumbers have beenidentified for sucrose (927.59; 997.02; L054.87; 1116.51;1137.80 cm-t).Prediction equations give results that aremore accurate and, in particular, more pertinent thanthose obtained by polarization. The use of PCA variablesrequires only a short computation time. The whole pro-cedure (PCA + multiple linear regression * predictionwith about 59 samples) requires no more than twentyminutes. The spectral acquisition time is shorter thanthe time required for polarization measurements. Theseresults could prove to be interesting for the sugar caneindustry.
ACKNOWLEDGMENTS
This work was supported by a grant from the Ministère de la Re-cherche et de la Technologie and the Conseil Gènéral.
1. G. P. Meade and J. C. P. Chen, Cane Sugar Handboo& (J. Wileyand Sons, New York, 1985), 11th ed.
2. M. A. Brokensha, R. H. Niemeyer, and K. J. SchÊifler, "A Com-parison of the Estimation of Sucrose in Sugar Cane Juice byPolarimetric and Gas Liquid Chromatographic Methods," in Pro-ceedings of the 52nd Congress of the South African Sugar Tech'nologists' Association (South African Sugar Technologists' Asso-ciation, Mount Edgecombe, Natal, 1978), pp. 54-58.
3. K. J. Schâfier and I. A. Smith, "True Sucrose versus POL: TheEffect on Cane Quality and Factory Balance Data," in Proceedingsof the 52nd Congress of the South African Sugar Technologists'Associotion (South African Sugar Technologists' Association, MountEdgecombe, Natal, 1978), pp. 59-63.
4. K. H. Norris, "Near-Infrared Reflectance Spectroscopy," inCereals78: Better Nutrition for the World's Millions, Y. Pomerantz, Ed.(American Association of Cereal Chemists, Manhattan, Kansas,1978), p. 245-254.
5. B. G. Osborne, S. Douglas, and T. Fearn, J' Food Technol. 17,355(1982).
6. C. B. Suerzut, A. French, S. Faught, and L. R. Vergma, "SugarCane Analysis Using NIR Spectroscopy," presented at the South-west Region Meeting of the American Society of Agricultural En-gineers (1986).
?. P. R. Griffiths and J. A. de Haseth, Fourier Transform InfraredSpectrometry (J. Wiley and Sons, New York, 1986).
8. M. P. Fuller and P. R. Griffiths, Anal. Chem. 50, 1906 (1978).
9. M. F. Devaux, D. Bertrand, and G. Martin, Cereal Chem. 63, 151(1986).
10. I. A. Cowe and J. W. McNicol, Appl. Spectrosc. 39, 257 (1985).
11. J. le Nouvel,Etude d'une Famille de Courbes par Méthodes d'Ana-lyse de Données . Application d I' Analyse Morphologique de CourbesProuenant de Données Médicales, Thèse de 3 ème cycle, UniversitéRennes I, France (1981).
12. J. Lefebvre, Introduction aux Analyses Statistiques Multidirnen-sionnelles (Masson, Paris, 1983), 3rd ed., pp. 137-148.
13. L. Lebart, A. Morineau, and N. Tabard, Techniques de la Descrip-tion Statistique (Dunod, Paris, 1977), pp. 7-46.
14. P. Dagneli e, Analy se Statistique d Plusieurs Variables (Les Press-es Agronomiques de Gembloux, Belgium, 1975), pp. 185-190.
15. D. Bertrand, M. Lila, V. Furtoss, P. Robert, and G. Downey, J. Sci.Food Agric. 41,299 (L987).
16. W, R. Hruschka, "Data Analysis: Wavelength Selection Methods,"ln Near-Infrared Technology in the Agricultural and Foods In-d.ustries, P. Williams and K. Norris, Eds. (American Associationof Cereal Chemists, St. PauI, Minnesota, 1987), pp. 35-55.
17. M. Mathlouthi and C. Luu, Carbohydr. Res. 81, 203 (1980).18. T. W. Barrett, Spectrochim. Acta 37À 233 (1981).
172 Volume 45, Number 2, 1991
Copyright © 2022 FDOKUMEN