Quantitative determination of de-conjugated chrysene metabolites in fish bile by HPLC-fluorescence...
13
Quantitative determination of de-conjugated chrysene metabolites in fish bile by HPLC-fluorescence and GC–MS Grete Jonsson a, * , Ingrid C. Taban a ,K are B. Jørgensen b , Rolf C. Sundt a a RF-Akvamiljø, Mekjarvik 12, N-4070 Randaberg, Norway b Stavanger University College, P.O. Box 8002, N-4068 Stavanger, Norway Received 10 April 2003; received in revised form 11 September 2003; accepted 30 September 2003 Abstract Two analytical methods have been evaluated for quantitative determination of de-conjugated chrysene metabolites in fish bile. High performance liquid chromatography-fluorescence (HPLC-F) and gas chromatography–mass spec- trometry (GC–MS) were compared regarding instrumental and overall limits of detection (LOD) as well as recoveries for the following nine chrysene compounds: 1-, 2,- 3-, 4- and 6-hydroxychrysene (1-, 2-, 3-, 4- and 6-OH-chr), 1,2- dihydroxy-1,2-dihydrochrysene (1,2-DHD-chr), 3,4-dihydroxy-3,4-dihydrochrysene (3,4-DHD-chr), 5,6-dihydroxy-5,6- dihydrochrysene (5,6-DHD-chr) and chrysene. Instrumental LODs were comparable for the two methods whereas the overall LOD was better for HPLC-F. Recoveries varied per chrysene compound for both HPLC-F (62–107%) and GC– MS (48–124%). In vivo formed chrysene metabolites were studied in the bile of Atlantic cod (Gadus morhua) exposed to chrysene (1 mg/kg) via intra-peritoneal (i.p.) and inter-muscular (i.m.) injection. Total amounts of chrysene metabolites were three times higher in i.p. compared to i.m. exposed cod bile, but the relative distribution of determined metabolites was very similar. 1,2-DHD-chr was the most prominent metabolite in de-conjugated bile and constituted more than 88% of the total chrysene metabolites. Additional chrysene metabolites formed were 3,4-DHD-chr and 1-, 2-, 3- and 4- OH-chr. K-region chrysene metabolites (oxidation at carbons 5 and 6) were not detected and seem to be a less favoured biotransformation route. The two methods were applied and evaluated for analysis of chrysene metabolites in two bile reference materials (BCR 720 and 721) and a limited number of field exposed cods. Ó 2003 Elsevier Ltd. All rights reserved. Keywords: Chrysene metabolites; Fish bile; In vivo metabolism; HPLC-F; GC–MS 1. Introduction Chrysene is a symmetrical polycyclic aromatic hy- drocarbon (PAH) consisting of four condensed benzene rings (Fig. 1). It is formed through incomplete com- bustion of organic material and is a ubiquitous envi- ronmental contaminant (Grimmer and Pott, 1983). The presence of chrysene in the environment is mainly due to human activities (ATSDR, 1990). A relatively low sol- ubility in seawater (2 lg/l at 25 °C) will promote the adsorption of chrysene to particulate material, followed by sedimentation (Neff, 1979). Two- and three-ring PAHs deposited in the sediment are quite rapidly de- graded by bacteria, fungi and algae (Cerniglia and Heitkamp, 1989). Larger PAHs are more resistant to microbial attack, and their relative concentrations in the * Corresponding author. Tel.: +47-51875517; fax: +47- 51875540. E-mail address: [email protected] (G. Jonsson). 0045-6535/$ - see front matter Ó 2003 Elsevier Ltd. All rights reserved. doi:10.1016/j.chemosphere.2003.09.026 Chemosphere 54 (2004) 1085–1097 www.elsevier.com/locate/chemosphere
-
Upload
independent -
Category
Documents
-
view
0 -
download
0
Transcript of Quantitative determination of de-conjugated chrysene metabolites in fish bile by HPLC-fluorescence...

Chemosphere 54 (2004) 1085–1097
www.elsevier.com/locate/chemosphere
Quantitative determination of de-conjugatedchrysene metabolites in fish bile byHPLC-fluorescence and GC–MS
Grete Jonsson a,*, Ingrid C. Taban a, K�aare B. Jørgensen b, Rolf C. Sundt a
a RF-Akvamiljø, Mekjarvik 12, N-4070 Randaberg, Norwayb Stavanger University College, P.O. Box 8002, N-4068 Stavanger, Norway
Received 10 April 2003; received in revised form 11 September 2003; accepted 30 September 2003
Abstract
Two analytical methods have been evaluated for quantitative determination of de-conjugated chrysene metabolites
in fish bile. High performance liquid chromatography-fluorescence (HPLC-F) and gas chromatography–mass spec-
trometry (GC–MS) were compared regarding instrumental and overall limits of detection (LOD) as well as recoveries
for the following nine chrysene compounds: 1-, 2,- 3-, 4- and 6-hydroxychrysene (1-, 2-, 3-, 4- and 6-OH-chr), 1,2-
dihydroxy-1,2-dihydrochrysene (1,2-DHD-chr), 3,4-dihydroxy-3,4-dihydrochrysene (3,4-DHD-chr), 5,6-dihydroxy-5,6-
dihydrochrysene (5,6-DHD-chr) and chrysene. Instrumental LODs were comparable for the two methods whereas the
overall LOD was better for HPLC-F. Recoveries varied per chrysene compound for both HPLC-F (62–107%) and GC–
MS (48–124%). In vivo formed chrysene metabolites were studied in the bile of Atlantic cod (Gadus morhua) exposed to
chrysene (1 mg/kg) via intra-peritoneal (i.p.) and inter-muscular (i.m.) injection. Total amounts of chrysene metabolites
were three times higher in i.p. compared to i.m. exposed cod bile, but the relative distribution of determined metabolites
was very similar. 1,2-DHD-chr was the most prominent metabolite in de-conjugated bile and constituted more than
88% of the total chrysene metabolites. Additional chrysene metabolites formed were 3,4-DHD-chr and 1-, 2-, 3- and 4-
OH-chr. K-region chrysene metabolites (oxidation at carbons 5 and 6) were not detected and seem to be a less favoured
biotransformation route. The two methods were applied and evaluated for analysis of chrysene metabolites in two bile
reference materials (BCR 720 and 721) and a limited number of field exposed cods.
� 2003 Elsevier Ltd. All rights reserved.
Keywords: Chrysene metabolites; Fish bile; In vivo metabolism; HPLC-F; GC–MS
1. Introduction
Chrysene is a symmetrical polycyclic aromatic hy-
drocarbon (PAH) consisting of four condensed benzene
rings (Fig. 1). It is formed through incomplete com-
*Corresponding author. Tel.: +47-51875517; fax: +47-
51875540.
E-mail address: [email protected] (G. Jonsson).
0045-6535/$ - see front matter � 2003 Elsevier Ltd. All rights reserv
doi:10.1016/j.chemosphere.2003.09.026
bustion of organic material and is a ubiquitous envi-
ronmental contaminant (Grimmer and Pott, 1983). The
presence of chrysene in the environment is mainly due to
human activities (ATSDR, 1990). A relatively low sol-
ubility in seawater (�2 lg/l at 25 �C) will promote the
adsorption of chrysene to particulate material, followed
by sedimentation (Neff, 1979). Two- and three-ring
PAHs deposited in the sediment are quite rapidly de-
graded by bacteria, fungi and algae (Cerniglia and
Heitkamp, 1989). Larger PAHs are more resistant to
microbial attack, and their relative concentrations in the
ed.

OH
OH
OH
OH
OH
K-region
Bay-region
Bay-region
K-region
(a)
(b)
(c)
(d)
Fig. 1. Molecular structures of (a) chrysene, (b) 2-OH-chr,
(c) 1,2-DHD-chr and (d) 3,4-DHD-chr.
1086 G. Jonsson et al. / Chemosphere 54 (2004) 1085–1097
sediment will consequently increase with time (Cerniglia
and Heitkamp, 1989). Release of industrial waste and
refined oil products (lubricating oil, diesel oil and engine
oil) into the marine environment contributes to rela-
tively high sediment concentrations of chrysene in in-
dustrialised areas (Malins et al., 1985; Naes et al., 1995;
Witt, 1995).
Chrysene is absorbed by fish via various routes.
Uptake of water-borne chrysene is considered to be
more efficient as compared to uptake from sediment
(Beyer et al., 1998) and food (Neff, 1985; Niimi and
Dookhran, 1989). Chrysene exposure cannot be accu-
rately determined in fish by measurement of tissue levels,
due to the efficient metabolism of PAHs (Varanasi et al.,
1989). The first step in the metabolism includes an in-
troduction of oxygen by the mixed function oxygenase
(MFO) system, producing phase I metabolites such as
e.g. phenols, dihydrodiols and epoxides. Conjugation of
phase I metabolites results in highly water-soluble phase
II metabolites, such as glucuronic acid and sulphonic
acid conjugates. Excretion of the larger PAHs occurs
mainly via bile and urine following biotransformation
(Varanasi et al., 1989).
Chrysene is considered to exhibit weak carcinogenic
activity via metabolic activation to dihydrodiols (Fig. 1)
and dihydrodiol-epoxides (Wenzel-Hartung et al., 1990;
Harvey, 1991; Glatt et al., 1993). 1,2-dihydroxy-1,2-di-
hydrochrysene (1,2-DHD-chr) has been identified as a
precursor for the formation of the ultimate carcinogenic
chrysene metabolite 1,2-dihydroxy-3,4-epoxy-1,2,3,4-
tetrahydrochrysene (bay-region diol epoxide) (Grimmer
et al., 1988). Several studies have investigated the in
vitro metabolism of chrysene in various cell types, such as
e.g. human pulmonary and hepatic microsomes (Koehl
et al., 1996), rat microsomes (Jacob et al., 1996) and
hamster lung cells (Jacob et al., 1990). Oxidation at the
1,2- and 3,4-position resulting in formation of two di-
hydrodiols, 1,2-DHD-chr and 3,4-dihydroxy-3,4-dihy-
drochrysene (3,4-DHD-chr) and four phenols, 1-, 2-, 3-
and 4-hydroxychrysene (1-, 2-, 3- and 4-OH-chr) were
identified as the main metabolic pathway. Oxidation at
the 5,6-position (K-region) seems to be a less favoured
route (Grimmer et al., 1988). Pangrekar et al. (1995,
2003) and Shappell et al. (1996) have studied the in vitro
metabolism of chrysene by brown bullhead (Ameriurus
nebulosus) liver microsomes. The major metabolite
formed was 1,2-DHD-chr followed by 3,4-DHD-chr and
smaller amounts of hydroxychrysenes and 5,6-dihy-
droxy-5,6-dihydrochrysene (5,6-DHD-chr).
PAH exposure to fish has been successfully moni-
tored in feral (Krahn et al., 1986; van der Oost et al.,
1994; Aas et al., 2001) and laboratory exposed (Aas
et al., 2000a; Jonsson et al., unpublished data) fish by
measurements of their metabolites in bile. The analysis
has been performed by fixed fluorescence (FF) (Lin
et al., 1996; Aas et al., 2000b), synchronous fluorescence
scan (SFS) (Ariese et al., 1993) and high performance
fluorescence chromatography with fluorescence detec-
tion (HPLC-F) (Krahn et al., 1984; Krahn et al., 1986)
for semi-quantitative determination. Quantitative de-
termination of specific de-conjugated metabolites has
regularly been carried out by HPLC-F (Krahn et al.,
1987; van Schanke et al., 2001; Ruddock et al., 2002;
Jonsson et al., 2003) and gas chromatography with mass
spectrometry detection (GC–MS) (Solbakken et al.,
1980; Krahn et al., 1992; Jonsson et al., accepted for
publication; Jonsson et al., 2003). In a former study,
Jonsson et al. (accepted for publication) evaluated SFS
and HPLC-F as screening methods for the determina-
tion of chrysene exposure to fish. The feasibility of the
methods for chrysene metabolite identification was

G. Jonsson et al. / Chemosphere 54 (2004) 1085–1097 1087
limited due to fluorescence interference from an un-
known number of three- and four-ring aromatics.
However, both methods provided semi-quantitative con-
centrations of chrysene metabolites and distinguished
clearly between exposed and non-exposed individuals.
To our knowledge, no studies have been carried out
in order to characterize in vivo formed chrysene me-
tabolites in fish. Leonard and Hellou (2001) examined
the relative amounts of conjugated versus unchanged
chrysene in bile of orally exposed speckled trout (Salv-
elinus fontinalis) and 1-OH-chr has been used as a
monitoring parameter for PAH exposure (Ruddock
et al., 2002, 2003). Another study determined chrysene–
DNA interaction in viviparous blenny (Zoarces vivipa-
rous) and indicated its possible genotoxic potential
in fish (Noaksson et al., 1998). In the present study,
HPLC-F and GC–MS in selected ion mode (SIM) have
been evaluated for quantitative determination of chry-
sene, five OH-chrysenes and three DHD-chrysenes in
fish bile. Instrumental and overall detection limits as
well as recoveries have been established for the investi-
gated compounds. The metabolic profile of chrysene has
been identified and compared in bile of inter-muscularly
(i.m.) and intra-peritoneally (i.p.) exposed Atlantic cod
(Gadus morhua). Applicability of the two analytical
methods has been demonstrated by analyses of bile from
field exposed fish and two certified fish bile reference
materials.
2. Experimental
2.1. Chemicals
Chrysene-trans-1,2-dihydrodiol (1,2-DHD-chr),
chrysene-trans-3,4-dihydrodiol (3,4-DHD-chr), chrysene-
trans-5,6-dihydrodiol (5,6-DHD-chr) and 1-hydroxy-
chrysene (1-OH-chr) were purchased from the National
Cancer Institute’s Chemical Carcinogen Repository,
Midwest Research Institute (Kansas City, MO). 4-hy-
droxychrysene (4-OH-chr) and 6-hydroxychrysene (6-
OH-chr) were supplied by Promochem Standard Supplies
AB (Kungsbacka, Sweden) and Dr. Ehrenstorfer (Augs-
burg, Germany), respectively. 2-hydroxychrysene (2-OH-
chr) and 3-hydroxychrysene (3-OH-chr) were synthesized
by Dr. K�aare B. Jørgensen, Stavanger University College,
Norway. Chrysene, perylene and b-glucuronidase with
5% sulphatase activity (Type HP-2) were obtained from
Sigma-Aldrich (Steinheim, Germany). N-trimethylsilyl-
imidazole (TMSI) in pyridine (21%W/V) was supplied by
Varian (Morton Grove, IL, USA). Sodiumacetate,
4-chloro-1-hydroxynaphthalene (4-Cl-naphthol), anhy-
drous sodiumsulphate (pesticide grade), ammonia, ace-
tonitrile (HPLC grade) and ethyl acetate (pesticide grade)
were provided by Merck (Darmstadt, Germany).
Calibration standards for HPLC-F analysis of a
mixture of chrysene, 2-OH-chr, 4-OH-chr and three
dihydrodiols were prepared in acetonitrile at eight con-
centration levels (3–3000 ng/g). A separate set of HPLC-
F calibration standards were prepared for 1-, 3- and
6-OH-chr (0.7–1000 ng/g) to prevent chromatographic
overlap. Perylene (500 ng/g) was added as an internal
standard prior to final dilution. GC–MS calibration
standards of a mixture of all chrysene compounds were
prepared in ethyl acetate at nine concentration levels
(3–7500 ng/g). 4-Cl-naphthol (300 ng/g) was added as a
surrogate internal standard prior to derivatisation with
TMSI (100 ll), and perylene (800 ng/g) as a GC internal
standard prior to analysis.
Instrumental limits of detection (LOD), based on a
signal-to noise-ratio of 3:1 for peak areas, using diluted
standard solutions were determined for both HPLC-F
and GC–MS.
2.2. Fish bile samples
Single PAH exposure: Atlantic cod (G. morhua), 46
individuals with an average weight of 679± 135 g, were
caught in a non-polluted area outside Stavanger on the
south-west coast of Norway, and acclimatised in the
laboratory for one week prior to exposure. Exposure of
cod to single PAHs was performed in order to prepare
bile material for the present study and additional rele-
vant studies concerning determination and identification
of PAH metabolites in fish bile (Jonsson et al., unpub-
lished data; Jonsson et al., 2003). They were divided into
ten groups, n ¼ 3–7, where the number of fish in each
PAH exposure group varied with how extensive we
planned to study their respective metabolites. Eight
groups were exposed to single PAHs in a carrier (cod
liver oil) by intra-peritoneal (i.p.) injection at the fol-
lowing concentrations: Naphthalene (NPH), fluorene
(FLU), phenanthrene (PHE), dibenzothiophene (DBT),
fluoranthene (FLAN), pyrene (PYR), chrysene, benzo
[a]pyrene (BaP) at 5, 2, 2, 2, 1, 1, 1 and 1 mg/kg fish,
respectively. One group was exposed to 1 mg chrysene/
kg fish by inter-muscular (i.m.) injection between the
two major axial muscles. The remaining group was in-
jected carrier and kept in non-contaminated seawater
for preparation of ‘‘blank’’ bile. The fish were sacrificed
five days following exposure by a sharp blow to the
head, and bile from each group was pooled, homoge-
nized and stored at )80 �C until chemical analysis. The
fish were not fed during acclimatisation and exposure.
Flounder bile (Platichthys flesus), i.p. exposed to an-
thracene (ANT, 2 mg/kg fish) and benz[a]anthracene
(BaA, 1 mg/kg), was kindly received from Dr. Freek
Ariese at Vrije University in Amsterdam, the Nether-
lands. Bile from chrysene exposed cod was used for
characterization of in vivo formed metabolites. Bile
from cod and flounder exposed to the other PAHs was

1088 G. Jonsson et al. / Chemosphere 54 (2004) 1085–1097
used to identify possible analytical interference with
chrysene and its metabolites.
Field exposed fish: Atlantic cod (800± 450 g) were
caught with fish traps at five different sites within the
strait of Karmsundet (Krokaneset, Kopervik, Bøv�aagen,Austvik and Høgevarde) and at a reference site, Salvøy.
Høgevarde is situated close to one of the discharge-
points of the aluminium works’ gas scrubbing effluent.
The other sampling sites are less loaded with PAH-
pollution. A description of the sampling sites has been
published by Aas et al. (2001). Bile from two individual
fish at each field site was analysed.
BCR 720 and 721: The preparation of two candidate
fish bile reference materials has been described by Ariese
et al. (in press). One group of flounder (P. flesus) was
exposed to contaminated sediment (BCR 720), and one
group of plaice (Pleuronectes platessa) was exposed to
dispersed droplets of crude oil (BCR 721).
2.3. Sample preparation
Preparation of hydrolysed bile samples was per-
formed mainly as described by Jonsson et al. (2003).
Briefly, 5–50 mg of bile was treated with 3000 units of b-glucuronidase and 150 units of sulphatase activity (in
sodium acetate buffer, pH 5.0) and incubated for 2 h at
40 �C. Perylene (0.2–0.4 lg) was added to the samples as
an internal standard. Acetonitrile was added to give a
final concentration of 70%, and an overall dilution of the
bile varying from 20 to 200 times.
In the case of GC–MS analysis, 4-Cl-naphthol (0.2–
0.3 lg) was added as a surrogate standard to 20–100 mg
of fish bile prior to hydrolysis of the conjugates as de-
scribed above. Hydrolysed metabolites were extracted
with ethyl acetate (0.5 ml, 4 times) and the combined
extracts dried with anhydrous sodium sulphate before
concentration to 0.5 ml. Preparation of trimethylsilyl-
ethers (TMS-ethers) was carried out at room tempera-
ture by addition of TMSI (100 ll) and at least 15 min.
reaction time. Finally, perylene (0.5–0.6 lg) was addedas GC–MS internal standard.
Recoveries of chrysene, five OH-chrysenes and three
DHD-chrysenes by HPLC-F and GC–MS were deter-
mined for three different concentrations by adding
known amounts to ‘‘blank’’ bile. The nine chrysene
compounds had to be divided into two groups (as for
calibration standards, 2.1) for HPLC-F recovery deter-
mination, in order to prevent chromatographic overlap.
Recovery samples were carefully mixed by hand for at
least 30 s and thereafter treated as described for the
samples. For both methods, the added internal standard
corrected automatically for differences in total volume
and variations in injected volume. In addition, the sur-
rogate standard added to GC–MS samples correct for
volume changes during sample preparation, such as loss
of organic solvent during extraction. The steps assessed
by the GC–MS recovery procedure was extraction and
derivatisation efficiencies of individual chrysene com-
pounds, and compound loss during sample preparation
due to chemical instability such as oxidation. Overall
limits of detection (LOD) were determined for HPLC-F
and GC–MS by dilution of the respective recovery
samples until the signal to noise ratio was 3:1 for peak
areas.
2.4. HPLC-F analysis
The HPLC system consisted of a Waters 600E qua-
ternary pump controlled by a Waters 600 controller,
connected to a Waters 717 plus autosampler (Millipore
Corporation, Milford, MA, USA). Detection was per-
formed by a Spectra system FL 3000 fluorescence de-
tector (Thermo Separation Products, FL, USA) at the
excitation/emission (ex/em) wavelengths pairs 270/390
nm and 380/430 nm (slit widths 20 nm) for chrysene
compounds and perylene, respectively. The autosampler
injected 10 ll of standard solutions or diluted hydroly-
sed bile onto the heated (50 �C) analytical column,
Vydac 201TP52 C18 5 lm, 2.1 mm · 250 mm (Vydac,
Hesperia, CA, USA). The system was controlled by
Millenium 2010 Chromatography Manager (Millipore
Corporation, Milford, MA, USA). The HPLC mobile
phase consisted of (A) 5% acetonitrile in 0.05 M am-
monium acetate buffer (pH 4.0) and (B) 90% acetoni-
trile, containing 0.05 M ammonium acetate to keep the
ammonium acetate concentration constant throughout
the run. The elution profile was as follows: 0–3 min,
isocratic 25% B; 3–40 min, 25–100% B linear gradient;
40–42 min, isocratic 100% B; 42–45 min, 100–25% B
linear gradient; 45–65 min, isocratic 25% B. The flow
rate was 0.45 ml/min.
The optimal fluorescence wavelength pairs were de-
termined for solutions of single compounds dissolved in
60–100% acetonitrile (degassed for 10 min with nitro-
gen). Fluorescence analysis of the standard solutions
was performed immediately after preparation by a Per-
kin Elmer LS50B luminescence spectrometer. Optimi-
sation was done by a successive change of emission and
excitation scan parameters until the highest signal in-
tensity was attained. Spectra were recorded in capped
0.5 cm quartz cuvettes with slit widths set to 5 nm for
both excitation (ex) and emission (em).
2.5. GC–MS analysis
Chrysene and TMS-ethers of OH-chrysenes and
DHD-chrysenes were analysed by a GC–MS system
consisting of a HP5890 series II Gas chromatograph,
Finnigan A200S autosampler and a Finnigan MAT
SSQ7000 mass spectrometer (Thermo Finnigan, Hudd-
inge, Sweden). The system was controlled by a DEC
station 5000. Helium was used as carrier gas and the

G. Jonsson et al. / Chemosphere 54 (2004) 1085–1097 1089
applied column was CP-Sil 8 CB-MS, 50 m· 0.25 mm
and 0.25 lm film-thickness (Instrument Teknikk A.S.,
Oslo, Norway). Samples and calibration standards (1 ll)were injected on a split/splitless injector with splitless
mode on for 1 min. The temperatures for the injector,
transfer-line and ion source were held at 250, 300 and
240 �C, respectively, and the GC oven temperature
programme was as follows: 120 �C for 1 min., 120–250
�C at 25 �C/min, 250–320 �C at 2 �C/min and held at 320
�C for 15 min. Quantitative determination was done in
selected ion mode (SIM). The targeted mass to charge
(m=z) ratios were selected on the basis of preliminary
analysis in full scan mode (SCAN) at 70 eV in order to
identify the most abundant ions.
2.6. Calculation
Response factor curves for quantitative analysis were
fitted by least-square regression for the nine chrysene
compounds measured by both HPLC-F and GC–MS.
Pearson’s correlation coefficients, r2, calculated for
HPLC-F analysis of 1-OH-chr, 2-OH-chr, 3-OH-chr, 4-
OH-chr, 6-OH-chr, 1,2-DHD-chr, 3,4-DHD-chr, 5,6-
DHD-chr and chrysene were 0.9998, 0.9999, 0.9999,
0.9997, 0.9998, 0.9998, 1.0000, 1.0000 and 1.0000, re-
spectively. GC–MS analysis of the same order of chry-
sene compounds resulted in the following r2 values:
0.994, 0.998, 0.991, 0.996, 0.995, 0.991, 0.989, 0.997 and
0.994, respectively.
3. Results and discussion
3.1. Detection of chrysene metabolites
Maximum fluorescence signals for the investigated
chrysene compounds were achieved at excitation (ex)
and emission (em) wavelengths between 266–278 and
364–382 nm, respectively (Table 1). Acetonitrile and
distilled water in various proportions were used as sol-
Table 1
Optimal fluorescence wavelength pairs (ex/em) for chrysene compoun
Code Compound Solvent,
% acetonitrile
1 1-OH-chr 80 and 100
2 2-OH-chr 80 and 100
3 3-OH-chr 80 and 100
4 4-OH-chr 80 and 100
5 6-OH-chr 80 and 100
6 1,2-DHD-chr 60, 80 and 100
7 3,4-DHD-chr 60, 80 and 100
8 5,6-DHD-chr 60, 80 and 100
9 Chrysene 80 and 100
aWavelength pair used for HPLC-F analysis.
vents for determination of optimum wavelength pairs. A
change in solvent composition altered the signal inten-
sity, but did not lead to shift in optimum wavelength
pair. The relatively water-soluble DHD-chrysenes re-
sponded with increased signal intensity when the water
fraction increased from 0% to 40%, whereas the opposite
was observed for OH-chrysenes and chrysene (results
not shown). One of two optimum wavelength pairs for
1,2-DHD-chr, ex/em 270/390 nm, was used for HPLC-F
analysis. This selection was based on the identification
of 1,2-DHD-chr as the most abundant chrysene me-
tabolite formed in vitro by brown bullhead liver mi-
crosomes (Shappell et al., 1996; Pangrekar et al., 2003).
The use of one wavelength pair throughout the chro-
matographic run will prevent missing information due to
a turbulent baseline. This was considered to be an ad-
vantage, especially for analysis of field exposed samples,
even with a 3–42% loss of sensitivity for individual
chrysene compounds (Table 1).
The molecular ions of chrysene and OH-chrysenes (as
TMS-ethers) were found to be the most abundant ions
when analysed in full scan mode (Table 2). Other promi-
nent masses of OH-chrysenes were [M) 15]þ and
[M) 31]þ. Fragmentation of TMS-ethers of 1,2-DHD-chr
and 3,4-DHD-chr revealed m=z ¼ 191:1, [CH(OTMS)2]þ,
as the most abundant ion, whereas m=z ¼ 73:1,[Si(CH3)3]
þ, was most prominent for 5,6-DHD-chr. The
relative intensities of the molecular ions varied between
6% and 47% for DHD-chrysenes. Ions selected for
quantitative determination of chrysene compounds are
shown in Table 2. The reported fragmentation pattern
is consistent with those reported for chrysene com-
pounds (Jacob and Grimmer, 1987) and for metabo-
lites of PHE, PYR and FLAN in fish bile (Krahn et al.,
1987).
3.2. Separation and identification of chrysene metabolites
Chrysene, three DHD-chrysenes and two OH-chry-
senes were well separated by HPLC-F (Fig. 2a) when
ds
Optimal signal,
ex/em (nm/nm)
270/390 nma,
% of maximum signal
268/368 77
266/380 80
268/374 66
270/370 74
270/378 97
270/370 100
278/372 79
266/364 64
266/382 58

Table 2
Relative intensities of abundant mass fragments of chrysene compounds analysed in full scan mode
Compoundsa M(g/mol)a
Relative intensities of mass fragments (%) SIMb
M+ M) 15 M) 31 M) 90 191.1 147.1 73.1 m=z
1-OH-chr 316 100 33 20 16 316, 301
2-OH-chr 316 100 30 24 28 316, 301
3-OH-chr 316 100 31 16 23 316, 301
4-OH-chr 316 100 28 34 24 316, 301
6-OH-chr 316 100 22 14 22 316, 301
1,2-DHD-chr 406 6 5 100 15 65 406, 191
3,4-DHD-chr 406 19 6 100 15 86 406, 191
5,6-DHD-chr 406 47 32 40 60 100 406, 191
Chrysene 228 100 228
a TMS-ethers of OH-chrysenes and DHD-chrysenes.bMass to charge ratios ðm=zÞ selected for quantitative analysis in SIM mode.
Fig. 2. HPLC-F and GC–MS chromatograms of nine chrysene compounds (a) and (e), bile from chrysene (1 mg/kg i.p.) exposed fish
(b) and (f), bile from BaA (1 mg/kg i.p.) exposed fish (c) and (g), and blank bile (d) and (h). Peak identity: (1) 1-OH-chr, (2) 2-OH-chr,
(3) 3-OH-chr, (4) 4-OH-chr, (5) 6-OH-chr, (6) 1,2-DHD-chr, (7) 3,4-DHD-chr, (8) 5,6-DHD-chr and (9) chrysene.
1090 G. Jonsson et al. / Chemosphere 54 (2004) 1085–1097
simultaneously injected. Two pairs of OH-chrysenes, 3-
OH-chr and 2-OH-chr, as well as 4-OH-chr and 1-OH-
chr, were partly separated by HPLC-F (Fig. 2a),
whereas 2-OH-chr and 6-OH-chr suffered from total
chromatographic overlap. Bile from chrysene exposed
cod were analysed and six responding peaks (Fig. 2b)
tentatively identified as 1- and 4-OH-chr, 2-OH-chr and/
or 6-OH-chr, 3-OH-chr, 1,2-DHD-chr, 3,4-DHD-chr
and chrysene by comparison with retention times and
peak shapes of the standard mixture. The most signifi-
cant metabolite was 1,2-DHD-chr, whereas the two
corresponding diols, 1-OH-chr and 2-OH-chr, were
present as less abundant peaks. Oxidation at carbon five
or six was not revealed by the employed HPLC-F
G. Jonsson et al. / Chemosphere 54 (2004) 1085–1097 1091
method and the relatively limited number of available
standard compounds. This could be due to concentra-
tions below the detection limit and/or chromatographic
overlap of 6-OH-chr with 2-OH-chr. The observed oxi-
dation at carbon one to four is in agreement with the
determined regioselectivity of in vitro metabolism of
chrysene by brown bullhead liver microsomes (Pangre-
kar et al., 1995; Pangrekar et al., 2003).
Bile from environmentally exposed fish includes a
large number of PAH metabolites. Possible interferences
from metabolites of selected PAHs were evaluated by
analyses of bile from single compound exposed fish. Bile
from BaA exposed fish contained one major and one less
abundant peak responding at the employed fluorescence
wavelength pair (Fig. 2c). The major responding BaA
and chrysene metabolite (1,2-DHD-chr) were not sepa-
rated by the used HPLC-method. Metabolites originat-
ing from the other investigated two- to five-ring PAHs
did not interfere with HPLC-F determination of chry-
sene metabolites (data not shown). Background fluo-
rescence signal from ‘‘blank’’ bile is shown in Fig. 2d.
Full separation of all chrysene compounds subjected
to investigation was accomplished by GC–MS (Fig. 2e,
chrysene did not respond under the SIM conditions used
to determine its metabolites). The presence of 1-, 2-, 3-
and 4-OH-chr, 1,2-DHD-chr and chrysene in bile from
chrysene exposed cod was confirmed by GC–MS (Fig.
2f), but a relatively high overall LOD (Table 3) com-
plicated the confirmation of 3,4-DHD-chr. Further-
more, 5,6-DHD-chr and 6-OH-chr was not present at
detectable levels in the bile of chrysene exposed cod,
although the overall LODs for these two compounds
were relatively low (Table 3). BaA metabolites did not
interfere with GC–MS determination of 1,2-DHD-chr,
but to a large extent with 1-OH-chr. Less pronounced
interference was observed between BaA metabolites and
Table 3
Instrumental and overall limits of detection (LOD) for chrysene com
Compound Instrumental LODa
HPLC-F GC–MS SIM
pg injected pg injected
1-OH-chr 12 5
2-OH-chr 2.0 12
3-OH-chr 1.0 3
4-OH-chr 1.8 2
6-OH-chr 0.5 2
1,2-DHD-chr 5.0 15
3,4-DHD-chr 0.8 5
5,6-DHD-chr 1.5 1
Chrysene 0.8 3
a Signal to noise ratio was 3:1.b TMS-ethers of OH-chrysenes and DHD-chrysenes.c Spiked ‘‘blank’’ bile.
2- and 3-OH-chr (Fig. 2g). MS selectivity prevented any
interference from PAH metabolites with dissimilar
masses.
3.3. Limits of detection and recoveries
Instrumental LODs were comparable for the two
analytical techniques, HPLC-F and GC–MS, regarding
the analysis of nine chrysene compounds (Table 3).
However, better LODs were achieved for seven out of
nine compounds when analysed by HPLC-F. The posi-
tion of the oxidised carbon in the chrysene molecule
seems to have an influence on the LOD. Oxidation at
carbon three to six results in better LOD as compared to
oxidation at carbon one and two. 1-OH-chr and 5,6-
DHD-chr yielded improved sensitivity by GC–MS
analysis. Overall LOD was generally better by HPLC-F
analysis of all chrysene compounds as compared to GC–
MS (Table 3). Three compounds, 1-OH-chr, 4-OH-chr
and 5,6-DHD-chr, displayed comparable overall LOD
for both methods. The loss of GC–MS sensitivity when
analysing chrysene compounds in spiked bile reflects a
labour demanding sample preparation procedure. The
slowest eluting compounds (1- and 2-OH-chr and 1,2-
DHD-chr) result in broader chromatographic peaks and
hence a decrease in sensitivity (Jonsson et al., 2003).
HPLC-F recoveries of OH-chrysenes and DHD-
chrysenes were >85%, at all tested concentrations (Table
4). Added concentrations were at least four times the
overall LOD. HPLC-F recovery of chrysene was poor
(62–75%) as compared to the other chrysene compounds
(Table 4). Chrysene is less water soluble than OH-
chrysenes and DHD-chrysenes and will therefore pre-
cipitate more easily with particulate material during
sample preparation and centrifugation. Decreasing re-
coveries with increasing concentrations was observed for
pounds
Overall LODa in 30 ll bileb HPLC-F GC–MS SIMb
ng/g bilec ng/g bilec
60 120
18 300
10 90
24 60
5 50
50 500
12 150
14 50
6 80

Table 4
Recoveries of chrysene compounds analysed by HPLC-F and GC–MS SIM at varying concentration levels
Compound HPLC-F GC–MS SIM
Added
(ng/g bile)
Recovery, n ¼ 5%
(±1 SD)
Added
(ng/g bile)
Recovery, n ¼ 5%
(±1 SD)
1-OH-chr 1731 99 (3) 2852 111 (13)
5309 93 (3) 8938 124 (15)
18 290 88 (2) 30 665 109 (13)
2-OH-chr 115 99 (7) 4926 109 (6)
348 91 (4) 15 441 112 (9)
1036 92 (4) 52 976 99 (13)
3-OH-chr 82 101 (7) 2491 99 (8)
249 95 (3) 7808 102 (10)
742 94 (3) 26 787 107 (10)
4-OH-chr 106 100 (9) 1351 102 (7)
325 93 (6) 4235 105 (13)
1121 85 (5) 14 531 121 (10)
6-OH-chr 67 104 (7) 1147 99 (4)
207 95 (4) 3593 96 (12)
712 86 (3) 12 328 93 (8)
1,2-DHD-chr 4324 107 (5) 8007 58 (6)
13 262 100 (4) 25 097 47 (5)
45 690 95 (5) 86 105 48 (7)
3,4-DHD-chr 192 100 (4) 3011 63 (6)
588 94 (1) 9439 52 (6)
2027 91 (1) 32 384 52 (6)
5,6-DHD-chr 182 99 (7) 667 84 (6)
558 92 (1) 2091 73 (4)
1921 90 (2) 7175 72 (6)
Chrysene 69 75 (4) 1767 100 (9)
213 69 (2) 5540 91 (6)
733 62 (2) 19 008 92 (5)
1092 G. Jonsson et al. / Chemosphere 54 (2004) 1085–1097
all chrysene compounds. These findings may indicate
saturation of the solvent phase (70% acetonitrile) and
equilibrium between dissolved and precipitated com-
pounds. GC–MS recoveries of chrysene were increased
as compared to HPLC-F (Table 4), and four repetitive
extractions with ethyl acetate explain the improved re-
covery. Average recoveries for 1-, 2-, 3- and 4-OH-chr
exceeded 100% and might partly result from decompo-
sition of 1,2- and 3,4-DHD-chr (Table 4) in the injector,
as reported for TMS-derivatives of BaP-dihydrodiols
(Takahashi et al., 1979). The relatively low recoveries
(47–63%) of these two DHD-chrysenes support this as-
sumption. GC–MS recovery of the third DHD-chrysene
(5,6-DHD-chr) was better (72–84%), and might be a
result of less decomposition as indicated by the recovery
of 6-OH-chr (<100%). Better results for 5,6-OH-chr can
also be explained by the fact that this molecule is more
compact and volatile than the two other dihydrodiol-
isomers, 1,2- and 3,4-DHD-chr, and will therefore elute
at a shorter retention time as a narrower chromato-
graphic peak (Fig. 2e). The generally low recovery of the
DHD-chrysenes could partly be a result of decomposi-
tion, as indicated above, although TMS-derivatives of
DHD-chrysenes are less vulnerable to decomposition
than the free dihydrodiols (Krahn et al., 1987). A re-
duced extraction efficiency of the relatively polar DHD-
chrysenes as compared to chrysene and OH-chrysenes
could also explain the low recoveries for these com-
pounds.
3.4. Metabolic profile of chrysene exposed Atlantic cod
Quantification of individual metabolites in chrysene
exposed cod was accomplished by use of HPLC-F, after
confirmation of the compound identity by GC–MS
analysis. One prominent metabolite, 1,2-DHD-chr
(>88%), was excreted in the bile of chrysene exposed cod
(Table 5). Minor concentrations, <6%, of 3,4-DHD-chr

Table 5
Chrysene metabolites determined by HPLC-F in the bile of intra-peritoneal (i.p.) and inter-muscularly (i.m.) exposed Atlantic cod
(G. morhua)
Route Concentration, ng/g bile (±SD), n ¼ 5
Sum 1,2-DHD-chr 3,4-DHD-chr 1- and 4-OH-chra 2-OH-chr 3-OH-chr Chrysene
i.p. 12 581 (317) 11 160 (389) 176 (19) 281 (19) 720 (65) 131 (3) 113 (12)
i.m. 4263 (181) 3814 (174) 53 (8) 76 (12) 209 (22) 51 (2) 60 (9)
aNot separated.
HPLC - FFluoresence270 / 390 nm
Time (min)
(a)
(b)
(c)
7
450
7
7
6
6
6
34+1
34+1
34+1
is
is
is
Fig. 3. HPLC-F of field exposed (Austvik) fish bile (a), BCR
720 (b) and BCR 721 (c). Peak identity: (1) 1-OH-chr, (3) 3-OH-
chr, (4) 4-OH-chr, (6) 1,2-DHD-chr, and (7) 3,4-DHD-chr.
G. Jonsson et al. / Chemosphere 54 (2004) 1085–1097 1093
and 1-, 2-, 3- and 4-OH-chr were determined as well. K-
region oxidised metabolites were not detectable by any
of the two analytical techniques, and seem to be a less
favoured route for biotransformation of chrysene by
Atlantic cod. The relative distribution of chrysene me-
tabolites in bile was nearly identical for i.m. and i.p.
injected cod (Fig. 4b). Total amount of chrysene me-
tabolites were approximately three times higher in i.p. as
compared to i.m. injected cod (Table 5, Fig 4a). This
may indicate a rapid uptake of i.p. administered chry-
sene into the systemic circulation. A delayed entrance
into the bloodstream and hence a delay in excretion
might explain lower levels of bile metabolites in i.m.
injected cod. However, we cannot draw any firm con-
clusions regarding distribution and excretion of i.p.
versus i.m. administered chrysene due to the limited
number of samples and only one single sampling point.
The HPLC-F profile of chrysene metabolites in cod bile
displayed at least four peaks that could not be identified
with the available standards (Fig 2b, i.p. injection).
Chromatographic retention times indicate decreased
water solubility for these unknown compounds as
compared to DHD-chrysenes. Possible identities might
be quinones and/or epoxides of chrysene. A similar se-
lectivity for formation of DHD metabolites with a bay-
region double bond by fish have been observed for PHE
(1,2-DHD-PHE) (Solbakken et al., 1983; Goksøyr et al.,
1986) and BaP (7,8-DHD-BaP) (Varanasi and Gmur,
1981; Kennedy et al., 1989; van Schanke et al., 2000).
3.5. Chrysene metabolites in bile of fish exposed to
complex PAH mixtures
The applicability of HPLC-F for determination of
chrysene metabolites in bile of fish exposed to complex
mixtures of xenobiotics was evaluated by analysis of two
reference materials, BCR 720 and BCR 721, and bile
from field exposed fish (Fig 3). HPLC-F analysis re-
vealed responding peaks at the retention times of two
diols, 1,2- and 3,4-DHD-chr, and three hydroxychryse-
nes, 3- and 1- + 4-OH-chr, (Fig. 3a–c). GC–MS analysis
confirmed the presence of the most abundant metabo-
lite, 1,2-DHD-chr. The other peaks were identified by
HPLC-F analysis of the respective bile samples spiked
with low concentrations of standard compounds due
insufficient concentration for GC–MS analysis. Indica-
tive values of total and relative amounts of determined
chrysene metabolites are presented in Fig. 4. All com-
pound concentrations, except for 1,2-DHD-chr which
was quantified by GC–MS, were determined by HPLC-
F and corrected with the average recovery for each
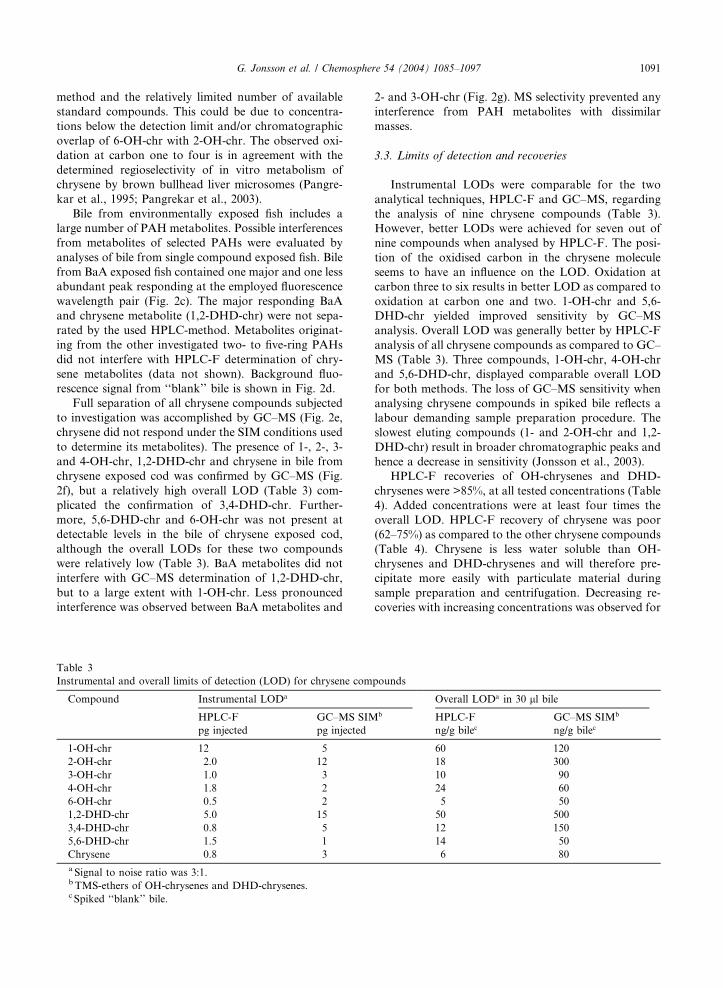
compound (Table 4). Despite the variation in total
chrysene metabolite concentration (Fig. 4a), relative
amounts of individual metabolites were similar for 1,2-
DHD-chr (Fig. 4b). However, a relatively large differ-
ence in the levels of 3,4-DHD-chr and hydroxychrysenes
was observed between field samples and laboratory in-
jected samples. HPLC-F of bile from fish exposed to
combustion type PAHs (Fig. 3a and b) or oil PAHs
(Fig. 3c) displayed a large number of eluting peaks.
Chromatographic overlap of e.g. BaA metabolites or
alkylated PAH metabolites complicated the accurate
quantitative determination of chrysene metabolites.
However, additional analysis by GC–MS enabled con-
firmation and determination of the most abundant

Fig. 4. Total concentrations of chrysene compounds (chrysene, 1,2-DHD-chr, 3,4-DHD-chr, 1-OH-chr, 3-OH-chr and 4-OH-chr) in
analysed fish bile (a) and the relative distribution of individual chrysene metabolites (b). All compounds were determined by HPLC-F,
except for GC–MS determination of 1,2-DHD-chr in BCR 720 and 721, and field exposed samples.
1094 G. Jonsson et al. / Chemosphere 54 (2004) 1085–1097
chrysene metabolites. Analysed reference materials and
field exposed bile represent two additional exposure
routes to i.p. and i.m. injection. The prominent 1,2-
DHD-chr in all analysed samples (Fig. 4b) indicates a
similar regioselective metabolism, independent of expo-
sure route. The relative proportions of individual me-
tabolites vary more pronounced for the less abundant
metabolites and may be a result of variation in exposure
route or chromatographic interference from unknown
peaks in fish bile from complex exposures.
1,2-DHD-chr (carcinogenic precursor) was the major
abundant metabolite in studied fish bile, independent of
exposure source and route. The absolute configuration
of the metabolite plays an important role for the car-
cinogenic activity (Thakker et al., 1985), and the [R,R]
configuration of 1,2-DHD-chr is far more potent than
the [S,S] isomer. In vitro metabolism of chrysene by
brown bullhead liver microsomes yields 70–78% of the
most potent stereoisomer (Pangrekar et al., 2003). The
absolute configuration of in vivo formed 1,2-DHD-chr
has to the authors’ knowledge not yet been described.
Chrysene, BaA and their alkylated homologues are
constituents in fossil PAH sources continuously released
into the marine environment (Neff, 1979; Utvik, 1999).
Acquiring knowledge about the potential adverse effects
of specific PAHs to marine biota has been an important
topic for many years. Understanding the stereoselective
in vivo metabolism and effects of PAHs still remains as a
future challenge.
4. Conclusions
HPLC-F and GC–MS have been evaluated for
quantitative analysis of chrysene, five OH-chrysenes and
three DHD-chrysenes in fish bile. Instrumental LODs
were comparable for the two employed methods, but
slightly better for seven out of nine compounds when
analysed by HPLC-F. The overall LOD was better for
all nine chrysene compounds when analysed by HPLC-F
as compared to GC–MS. HPLC-F recoveries were
>85% for OH-chr and DHD-chr and between 62% and
65% for chrysene. GC–MS recoveries for chrysene
increased to >92%, whereas the recoveries for DHD-
chrysenes decreased. OH-chrysene recoveries, except 6-
OH-chr, were exceeding 100% and may be a result from
degradation of 1,2- and 3,4-DHD-chr in the injector.
G. Jonsson et al. / Chemosphere 54 (2004) 1085–1097 1095
In vivo formed chrysene metabolites have been
characterized in cod bile by HPLC-F and GC–MS
analysis. Oxidation occurs at carbon 1–4 in the chrysene
molecule, with 1,2-DHD-chr as the most prominent
metabolite following i.p. and i.m. administration. 1,2-
DHD-chr is a precursor of the carcinogenic 1,2-DHD-
3,4-epoxide, and thus an important indication of the
carcinogenic activity of chrysene.
The combination of HPLC-F and GC–MS allowed
characterization of chrysene and its metabolites in bile
of fish exposed to pure chrysene. Determination of
chrysene metabolites in two reference bile samples and
field exposed fish bile were more challenging, but could
be accomplished for the most abundant compounds by
combining the two analytical techniques.
Acknowledgements
The authors thank Dr. Endre Aas for providing us
with field exposed samples. Dr. Jonny Beyer is ac-
knowledged for assistance with laboratory exposures
and for reviewing the manuscript. We thank Norsk Agip
in Stavanger, a Norwegian subsidiary of the Italian
EniGroup, for financial support. This work was per-
formed at the RF-Akvamiljø facilities in Stavanger,
Norway.
References
Aas, E., Baussant, T., Balk, L., Liewenborg, B., Andersen,
O.K., 2000a. PAH metabolites in bile, cytochrome P4501A
and DNA adducts as environmental risk parameters for
chronic oil exposure: a laboratory experiment with Atlantic
cod. Aquat. Toxicol. 51, 241–258.
Aas, E., Beyer, J., Goksoyr, A., 2000b. Fixed wavelength
fluorescence (FF) of bile as a monitoring tool for poly-
aromatic hydrocarbon exposure in fish: an evaluation of
compound specificity,inner filter effect and signal interpre-
tation. Biomarkers 5, 9–23.
Aas, E., Beyer, J., Jonsson, G., Reichert, W.L., Andersen,
O.K., 2001. Evidence of uptake, biotransformation and
DNA binding of polyaromatic hydrocarbons in Atlantic
cod and corkwing wrasse caught in the vicinity of an
aluminium works. Mar. Environ. Res. 52, 213–229.
Ariese, F., Kok, S.J., Verkaik, M., Gooijer, C., Velthorst,
N.H., Hofstraat, J.W., 1993. Synchronous fluorescence
spectrometry of fish bile: a rapid screening method for the
biomonitoring of PAH exposure. Aquat. Toxicol. 26, 273–
286.
Ariese, F., Beyer, J., Wells, D., Maier, E.A. The certification of
the contents (mass fractions) of PAH metabolites in two fish
bile samples: BCR 720, 1-hydroxyphenanthrene, 1-hydroxy-
pyrene and 3-hydroxybenzo[a]pyrene in sediment-exposed
flounder bile. BCR 721, 1-hydroxypyrene in oil-exposed
plaice bile, European Commission, BCR information series,
in press.
ATSDR (Agency for Toxic Substance and Disease Registry),
1990. Toxicological profile for chrysene. Prepared by
Clement Assoc., Inc. under contract 205-88-0608. U.S.
Public Health Service, ATSDR/TP-88/11.
Beyer, J., Aas, E., Borgenvik, H.K., Ravn, P., 1998. Bioavail-
ability of PAH in effluent water from an aluminium works
evaluated by transplant caging and biliary fluorescence
measurements of Atlantic cod (Gadus morhua L.). Mar.
Environ. Res. 46, 233–236.
Cerniglia, C.E., Heitkamp, M.A., 1989. Microbial degradation
of polycyclic aromatic hydrocarbons (PAH) in the aquatic
environment. In: Varanasi, U. (Ed.), Metabolism of Poly-
cyclic Aromatic Hydrocarbons in the Aquatic Environment.
CRC Press Inc., Boca Raton, FL, USA, pp. 41–68.
Glatt, H., Wameling, C., Elsberg, S., Thomas, H., Marquardt,
H., Hewer, A., Phillips, D.H., Oesch, F., Seidel, A., 1993.
Genotoxicity characteristics of reverse diol-epoxides of
chrysene. Carcinogenesis 14, 11–19.
Goksøyr, A., Solbakken, J.E., Klungsøyr, J., 1986. Regioselec-
tive metabolism of phenanthrene in Atlantic cod (Gadus
morhua): studies on the effects of monooxygenase inducers
and role of cytochromes P-450. Chem.-Biol. Interact. 60,
247–263.
Grimmer, G., Pott, F., 1983. Occurrence of PAH. In: Grimmer,
G. (Ed.), Environmental Carcinogens: Polycyclic Aromatic
Hydrocarbons. CRC Press Inc., Boca Raton, FL, USA,
pp. 61–128.
Grimmer, G., Brune, H., Dettbarn, G., Heinrich, U., Jacob, J.,
Mohtashamipur, E., Norpoth, K., Pott, F., Wenzelhartung,
R., 1988. Urinary and fecal excretion of chrysene and
chrysene metabolites by rats after oral, intraperitoneal,
intratracheal or intrapulmonary application. Arch. Toxicol.
62, 401–405.
Harvey, R.G., 1991. Polycyclic aromatic hydrocarbons: chem-
istry and carcinogenesis. Cambridge University Press,
Cambridge. pp. 26–49.
Jacob, J., Grimmer, G., 1987. Capillary gas chromatographical
analysis and mass spectrometric identification of polycyclic
aromatic hydrocarbon metabolites from biological materi-
als. Anal. Chem. 9, 49–89.
Jacob, J., Doehmer, J., Grimmer, G., Soballa, V., Raab, G.,
Seidel, A., Greim, H., 1996. Metabolism of phenanthrene,
benz[a]anthracene, benzo[a]pyrene, chrysene and benzo[c]-
phenanthrene by eight cDNA-expressed human and rat
cytochromes P450. Polycycl. Aromat. Compd. 10, 1–9.
Jacob, J., Grimmer, G., Raab, G., Emura, M., Riebe, M.,
Mohr, U., 1990. Metabolism of pyrene and chrysene in
epithelial human bronchial and hamster lung cells. Int. J.
Environ. Anal. Chem. 38, 221–230.
Jonsson, G., Bechmann, R.K., Baussant, T. Bioaccumulation,
biotransformation and elimination of polycyclic aromatic
hydrocarbons in sheepshead minnow (Cyprinodon variega-
tus) exposed to contaminated seawater, accepted.
Jonsson, G., Beyer, J., Wells, D., Ariese, F., 2003. The
application of HPLC-F and GC–MS to the analysis of
selected hydroxy polycyclic aromatic hydrocarbons in two
certified fish bile reference materials. J. Environ. Monit. 5,
513–520.
Kennedy, C.J., Gill, K.A., Walsh, P.J., 1989. Thermal modu-
lation of benzo[a]pyrene metabolism by the gulf toadfish,
Opsanus beta. Aquat. Toxicol. 15, 331–344.

1096 G. Jonsson et al. / Chemosphere 54 (2004) 1085–1097
Koehl, W., Amin, S., Yamazaki, H., Ueng, Y.F., Tateishi,
T., Guengerich, F.P., Hecht, S.S., 1996. Metabolic activa-
tion of chrysene by human hepatic and pulmonary cyto-
chrome P450 enzymes. Polycycl. Aromat. Compd. 10,
59–66.
Krahn, M.M., Myers, M.S., Burrows, D.G., Malins, D.C.,
1984. Determination of metabolites of xenobiotics in the
bile from polluted waterways. Xenobiotica 14, 633–646.
Krahn, M.M., Rhodes, L.D., Myers, M.S., Moore, L.K.,
MacLeod Jr., W.D., Malins, D.C., 1986. Associations
between metabolites of aromatic compounds in bile and
the occurrence of hepatic lesions in English sole (Parophrys
vetulus) from Puget Sound, Washington. Arch. Environ.
Contam. Toxicol. 15, 61–67.
Krahn, M.M., Burrows, D.G., MacLeod, W.D.J., Malins,
D.C., 1987. Determination of individual metabolites of
aromatic compounds in hydrolyzed bile of English sole
(Parophrys vetulus) from polluted sited in Puger Sound,
Washington. Arch. Environ. Contam. Toxicol. 16, 511–
522.
Krahn, M.M., Burrows, D.G., Ylitalo, G.M., Brown, D.W.,
Wigren, C.A., Collier, T.K., Chan, S.L., Varanasi, U., 1992.
Mass spectrometric analysis for aromatic compounds in bile
of fish sampled after the Exxon Valdez oil spill. Environ.
Sci. Technol. 26, 116–126.
Leonard, J.D., Hellou, J., 2001. Separation and character-
ization of gall bladder bile metabolites from speckled
trout, salvelinus fontinalis, exposed to individual polycyc-
lic aromatic compounds. Environ. Toxicol. Chem. 20, 618–
623.
Lin, E.L.C., Cormier, S.M., Torsella, J.A., 1996. Fish biliary
polycyclic aromatic hydrocarbon metabolites estimated by
fixed-wavelength fluorescence: comparison with HPLC-
fluorescent detection. Ecotoxicol. Environ. Saf. 35, 16–23.
Malins, D.C., Krahn, M.M., Brown, D.W., Rhodes, L.D.,
Myers, M.S., McCain, B.B., Chan, S.L., 1985. Toxic
chemicals in marine sediments and biota from Mukilteo,
Washington: relationships with hepatic neoplasms and
other hepatic lesions in English sole (Parophrys vetulus).
J. Natl. Cancer Inst. 74, 487–494.
Naes, K., Knutzen, J., Berglind, L., 1995. Occurrence of PAH
in marine organisms and sediments from smelter discharge
in Norway. Sci. Total Environ. 163, 93–106.
Neff, J.M., 1979. Polycyclic Aromatic Hydrocarbons in the
Aquatic Environment. Sources, Fates and Biological Ef-
fects. Applied Science Publishers, London.
Neff, J.M., 1985. Polycyclic aromatic hydrocarbons. In: Rand,
G.M., Petrocelli, S.R. (Eds.), Fundamentals of Aquatic
Toxicology. Methods and Applications. Hemisphere, New
York, USA, pp. 416–454.
Niimi, A.J., Dookhran, G.P., 1989. Dietary absorption effi-
ciencies and elimination rates of polycyclic aromatic hydro-
carbons (PAHs) in rainbow trout (Salmo gairdneri).
Environ. Toxicol. Chem. 8, 719–722.
Noaksson, E., Tjarnlund, U., Ericson, G., Balk, L., 1998.
Biological effects on viviparous blenny exposed to chrysene
and held in synthetic as well as in natural brackish water.
Mar. Environ. Res. 46, 81–85.
Pangrekar, J., Kandaswami, C., Kole, P., Kumar, S., Sikka,
H.C., 1995. Comparative metabolism of benzo(a)pyrene,
chrysene and phenanthrene by brown bullhead liver micro-
somes. Mar. Environ. Res. 39, 51–55.
Pangrekar, J., Kole, P.L., Honey, S.A., Kumar, S., Sikka, H.C.,
2003. Metabolism of chrysene by brown bullhead liver
microsomes. Toxicol. Sci. 71, 67–73.
Ruddock, P.J., Bird, D.J., McCalley, D.V., 2002. Bile meta-
bolites of polycyclic aromatic hydrocarbons in three species
of fish from the Severn Estuary. Ecotoxicol. Environ. Saf.
51, 97–105.
Ruddock, P.J., Bird, D.J., McEvoy, J., Peters, L.D., 2003. Bile
metabolites of polycyclic aromatic hydrocarbons (PAHs) in
European eels Anguilla anguilla from United Kingdom
estuaries. Sci. Total Environ. 301, 105–117.
Shappell, N.W., Carlino, U., Amin, S., Kumar, S., Sikka, H.C.,
1996. Comparative metabolism of chrysene (CHR) and 5-
methyl chrysene (5-MeCHR) by liver microsomes from rats
and fish. Carcinogenesis 37, 129.
Solbakken, J.E., Palmork, K.H., Neppelberg, T., Scheline,
R.R., 1980. Urinary and biliary metabolites of phenan-
threne in the coalfish (Pollachius virens). Acta Pharmacol.
Toxicol. 46, 127–132.
Solbakken, J.E., Solberg, M., Palmork, K.H., 1983. A com-
parative study on the disposition of three aromatic hydro-
carbons in Flounder (Platichthys flesus). FiskDir. Skr. Ser.
HavUnders. 17, 473–482.
Takahashi, G., Kinoshita, K., Hashimoto, K., Yasuhira, K.,
1979. Identification of benzo[a]pyrene metabolites by gas
chromatograph–mass spectrometer. Cancer Res. 39, 1814–
1818.
Thakker, D.R., Yagi, H., Levin, W., Wood, A.W., Conney,
A.H., Jerina, D.M., 1985. Polycyclic aromatic hydrocar-
bons: metabolic activation to ultimate carcinogens, in:
Anders, M.W. (Ed.), Bioactivation of Foreign Compounds.
Academic Press, Orlando, FL, USA, pp. 177–242.
Utvik, T.I.R., 1999. Chemical characterisation of produced
water from four offshore oil production platforms in the
North Sea. Chemosphere 39, 2593–2606.
van der Oost, R., Van Schooten, F.J., Ariese, F., Heida, H.,
Satumalay, K., Vermeulen, N.P.E., 1994. Bioaccumulation,
biotransformation and DNA-binding of PAHs in feral eel
(Anguilla-Anguilla) exposed to polluted sediments––a field
survey. Environ. Toxicol. Chem. 13, 859–870.
van Schanke, A., Boon, J.P., Aardoom, Y., van Leest, A., Van
Schooten, F.J., Maas, L., van den Berg, M., Everaarts,
J.M., 2000. Effect of a dioxin-like PCB (CB 126) on the
biotransformation and genotoxicity of benzo[a]pyrene in the
marine flatfish dab (Limanda limanda). Aquat. Toxicol. 50,
403–415.
van Schanke, A., Holtz, F., van der Meer, J., Boon, J.P., Ariese,
F., Stroomberg, G., van den Berg, M., Everaarts, J.M.,
2001. Dose- and time-dependent formation of biliary
benzo[a]pyrene metabolites in the marine flatfish dab
(Limanda limanda). Environ. Toxicol. Chem. 20, 1641–1647.
Varanasi, U., Gmur, D.J., 1981. Hydrocarbons and metabolites
in English sole (Parophrys vetulus) exposed simultaneously
to [3H] benzo[a]pyrene and [14C] naphthalene in oil-
contaminated sediment. Aquat. Toxicol. 1, 49–67.
Varanasi, U., Stein, J.E., Nishimoto, M., 1989. Biotransforma-
tion and deposition of polycyclic aromatic hydrocarbons
(PAH) in fish, in: Varanasi, U. (Ed.), Metabolism of

G. Jonsson et al. / Chemosphere 54 (2004) 1085–1097 1097
Polycyclic Aromatic Hydrocarbon in the Aquatic Environ-
ment. CRC Press Inc., Boca Raton, FL, pp. 93–150.
Wenzel-Hartung, R., Brune, H., Grimmer, G., Germann, P.,
Timm, J., Wosniok, W., 1990. Evaluation of the carcino-
genic potency of 4 environmental polycyclic aromatic
compounds following intrapulmonary application in rats.
Exp. Pathol. 40, 221–227.
Witt, G., 1995. Polycyclic aromatic hydrocarbons in water
and sediment of the Baltic Sea. Mar. Pollut. Bull. 31, 237–
248.