Quantitative assessment of neuromotor function in workers with current low exposure to mercury vapor
13
Quantitative tremor assessment in workers with current low exposure to mercury vapor Gunilla Wastensson a, ⁎ , Daniel Lamoureux b , Gerd Sällsten a , Anne Beuter b,c , Lars Barregård a a Department of Occupational and Environmental Medicine, Sahlgrenska University Hospital, and University of Göteborg, Box 414, SE-405 30 Göteborg, Sweden b Centre de Neuroscience de la Cognition, Université du Québec à Montréal, Montréal, Québec, C.P. 8888, Canada H3C 3P8 c Institut de Cognitique, Université Victor Segalen Bordeaux 2, Zone Nord, 146 rue Leo Saignat, 33076 Bordeaux Cedex, France Received 14 February 2006; received in revised form 30 August 2006; accepted 4 September 2006 Available online 14 September 2006 Abstract Measurement of tremor has been used in several occupational studies of workers with long-term exposure to mercury vapor (Hg 0 ). Recent studies indicate an adverse effect even at relatively low exposure levels. In the present study, we used sensitive quantitative methods to assess tremor in chloralkali workers with current low exposure to Hg 0 . Neurological examinations and recordings of tremor using both an accelerometer and a laser-based system were conducted in 43 mercury-exposed workers and 22 age-matched referents. The median urinary mercury concentration in exposed workers was 5.9 (1.3–25) μg/g creatinine (μg/gC), while it was 0.7 (0.2–4.1) μg/gC in referents. The mean exposure time was 15 years, and the median cumulative mercury index was 161 years × μg/gC in exposed workers. There were no differences between the exposed workers and the referents in the clinical evaluation of tremor. In the quantitative tremor tests, no associations were found with current or cumulative mercury exposure for the majority of tremor measures. There were indications that exposure to Hg 0 was associated with a lowering of tremor frequency in the non-dominant hand, and a possible interaction with smoking. The differences were small, however, and overall, this study indicates no significant adverse effects on tremor at these exposure levels. © 2006 Elsevier Inc. All rights reserved. Keywords: Tremor; Mercury vapor; Quantitative methods; Chloralkali workers 1. Introduction Exposure to mercury vapor (Hg 0 ) may cause adverse effects on the brain and kidneys, and the central nervous system (CNS) is considered to be a critical organ [55]. Occupational exposure occurs in chloralkali plants, mercury mines, thermometer factories, gold mines, and dental clinics. After inhalation of Hg 0 , 80% is retained in the body. Excretion is via urine and feces, with an estimated half-life of about 2 months [16]. Mercury vapor rapidly crosses the blood–brain barrier and diffuses to all parts of the brain. Here, it is oxidized to divalent mercury (Hg 2+ ), which is assumed to be the proximate toxic agent, exerting its action by attaching to thiol groups present in most proteins [16]. The mechanism of its action on brain function is poorly understood, but it has been demonstrated that exposure to Hg ions induces retrograde degeneration of the neuron membrane in vitro, possibly by interfering with formation of microtubules [32]. Following Hg 0 exposure, the earliest symptoms and signs of poisoning include a neurasthenic syndrome, with unspecific symptoms such as fatigue, irritability, and shyness, and a fine tremor initially involving the hands [55]. Tremor is defined as an involuntary rhythmic movement of a body part, and may originate from mechanical oscillations produced in sensorimotor loops, or from normal and patholog- ical oscillators in central neuronal networks [23]. Physiologic tremor is a normal mechanical tremor that may be enhanced by several factors including anxiety, stress, fatigue, and certain drugs [29]. In addition, tremors naturally fluctuate over time, so that one of the major problems in measuring tremor is to obtain a representative sample [3]. For assessment of tremor, subjective clinical methods (such as clinical rating scales), objective functional performance tests, or physiological techniques such Neurotoxicology and Teratology 28 (2006) 681 – 693 www.elsevier.com/locate/neutera ⁎ Corresponding author. Tel.: +46 31 773 2894; fax: +46 31 82 5004. E-mail address: [email protected] (G. Wastensson). 0892-0362/$ - see front matter © 2006 Elsevier Inc. All rights reserved. doi:10.1016/j.ntt.2006.09.001
-
Upload
independent -
Category
Documents
-
view
3 -
download
0
Transcript of Quantitative assessment of neuromotor function in workers with current low exposure to mercury vapor

gy 28 (2006) 681–693www.elsevier.com/locate/neutera
Neurotoxicology and Teratolo
Quantitative tremor assessment in workers with current lowexposure to mercury vapor
Gunilla Wastensson a,⁎, Daniel Lamoureux b, Gerd Sällsten a, Anne Beuter b,c, Lars Barregård a
a Department of Occupational and Environmental Medicine, Sahlgrenska University Hospital, and University of Göteborg, Box 414, SE-405 30 Göteborg, Swedenb Centre de Neuroscience de la Cognition, Université du Québec à Montréal, Montréal, Québec, C.P. 8888, Canada H3C 3P8
c Institut de Cognitique, Université Victor Segalen Bordeaux 2, Zone Nord, 146 rue Leo Saignat, 33076 Bordeaux Cedex, France
Received 14 February 2006; received in revised form 30 August 2006; accepted 4 September 2006Available online 14 September 2006
Abstract
Measurement of tremor has been used in several occupational studies of workers with long-term exposure to mercury vapor (Hg0). Recentstudies indicate an adverse effect even at relatively low exposure levels. In the present study, we used sensitive quantitative methods to assesstremor in chloralkali workers with current low exposure to Hg0. Neurological examinations and recordings of tremor using both an accelerometerand a laser-based system were conducted in 43 mercury-exposed workers and 22 age-matched referents. The median urinary mercuryconcentration in exposed workers was 5.9 (1.3–25) μg/g creatinine (μg/gC), while it was 0.7 (0.2–4.1) μg/gC in referents. The mean exposuretime was 15 years, and the median cumulative mercury index was 161 years×μg/gC in exposed workers. There were no differences between theexposed workers and the referents in the clinical evaluation of tremor. In the quantitative tremor tests, no associations were found with current orcumulative mercury exposure for the majority of tremor measures. There were indications that exposure to Hg0 was associated with a lowering oftremor frequency in the non-dominant hand, and a possible interaction with smoking. The differences were small, however, and overall, this studyindicates no significant adverse effects on tremor at these exposure levels.© 2006 Elsevier Inc. All rights reserved.
Keywords: Tremor; Mercury vapor; Quantitative methods; Chloralkali workers
1. Introduction
Exposure to mercury vapor (Hg0) may cause adverse effectson the brain and kidneys, and the central nervous system (CNS)is considered to be a critical organ [55]. Occupational exposureoccurs in chloralkali plants, mercury mines, thermometerfactories, gold mines, and dental clinics. After inhalation ofHg0, 80% is retained in the body. Excretion is via urine andfeces, with an estimated half-life of about 2 months [16].Mercury vapor rapidly crosses the blood–brain barrier anddiffuses to all parts of the brain. Here, it is oxidized to divalentmercury (Hg2+), which is assumed to be the proximate toxicagent, exerting its action by attaching to thiol groups present inmost proteins [16]. The mechanism of its action on brain
⁎ Corresponding author. Tel.: +46 31 773 2894; fax: +46 31 82 5004.E-mail address: [email protected] (G. Wastensson).
0892-0362/$ - see front matter © 2006 Elsevier Inc. All rights reserved.doi:10.1016/j.ntt.2006.09.001
function is poorly understood, but it has been demonstrated thatexposure to Hg ions induces retrograde degeneration of theneuron membrane in vitro, possibly by interfering withformation of microtubules [32]. Following Hg0 exposure, theearliest symptoms and signs of poisoning include a neurasthenicsyndrome, with unspecific symptoms such as fatigue, irritability,and shyness, and a fine tremor initially involving the hands [55].
Tremor is defined as an involuntary rhythmic movement of abody part, and may originate from mechanical oscillationsproduced in sensorimotor loops, or from normal and patholog-ical oscillators in central neuronal networks [23]. Physiologictremor is a normal mechanical tremor that may be enhanced byseveral factors including anxiety, stress, fatigue, and certaindrugs [29]. In addition, tremors naturally fluctuate over time, sothat one of the major problems in measuring tremor is to obtain arepresentative sample [3]. For assessment of tremor, subjectiveclinical methods (such as clinical rating scales), objectivefunctional performance tests, or physiological techniques such

Table 1The background characteristics of, and exposure data for, 43 exposed workersand 22 referents
Exposed (n=43) Referents (n=22)
Mean age, yrs (range) 41 (25–65) 40 (21–61)Shift work (n) 65% (28) 68% (15)Smoking (n) 26% (11) 27% (6)Tobacco use (n) 53% (23) 32% (7)Amalgam fillings (n) 86% (37) 95% (21)Eating fish N2 times/week (n) 5% (2) 14% (3)Mean exposure time, yrs (range) 15 (2–32) –U–Hg μg/gC⁎ 5.9 (1.3–25) 0.7 (0.2–4.1)U–Hgcum year×μg/gC⁎ 161 (8–1 440) –U–Hgm5 μg/gC⁎ 6.8 (2.1–37) –
⁎Median values.
682 G. Wastensson et al. / Neurotoxicology and Teratology 28 (2006) 681–693
as EMG and accelerometry have been used [3]. Somecomputerized systems for measuring tremor are commerciallyavailable. They are portable and simple to use, and one of themhas been standardized and evaluated [18,20]. In recent years, ahighly sensitive quantitative method for measuring tremor usinglasers [10] has been developed and applied on subjects exposedto methylmercury in the general population [8].
Tremor measurement has been used in several studies ofworkers with current long-term exposure to Hg0, as reviewed byBeuter and de Geoffroy [7], and in some more recent studies[13,14,19,24,35,40,51], as well as in studies of previouslyexposed workers [1,2,5,26,33,38,43]. Increased tremor has beenobserved at urinary mercury levels about 30 μg/g creatinine[55], but some studies indicate a possible effect at even lower(U–Hg 20–25 μg/g or μg/l) exposure levels [15,25,31].Consequently, even though many studies in this field havebeen conducted, a specific no-observed-adverse-effect levelcannot be settled, and it has been discussed whether low-leveloccupational exposure, or even exposure from amalgamfillings, may affect the CNS [16].
The aim of this study was to investigate the effects on theCNS in chloralkali workers with current low-level exposure toHg0, using highly sensitive quantitative methods for measure-ment of tremor. A cumulative exposure index was alsocalculated for each individual, making it possible to separatean effect on tremor due to previous Hg0 exposure. A further aimwas to compare quantitative methods with traditional clinicalqualitative methods of measuring tremor.
2. Methods
2.1. Study design and subjects
The data in this cross-sectional study were collected inSeptember–October 2000. We recruited 58 mercury-exposedchloralkali workers and 35 unexposed referents from twodifferent plants located in the same geographic area. Allchloralkali workers had been regularly monitored for mercuryin urine (U–Hg) by local Occupational Health Service units. Intotal, there were 83 mercury-exposed workers at the two plants.Among the workers employed at the plant for at least 1 year, andwithout exposure to other heavy metals or organic solvents, the60 workers with the highest concentrations of U–Hg during thelast few months were approached. One of the workers declinedbecause of lack of time and another was on sick leave. Thereferent group was recruited among blue-collar workers fromfive other departments with similar working conditions as theexposed subjects, at the same two plants. Among the targetgroup of 42 blue-collar workers, three subjects were on sickleave and another four subjects declined because of lack of timeor motivation. After having given informed consent, theremaining 58 exposed workers and 35 referents, all men, wereexamined at their ordinary workplaces. The study was approvedby the Ethics Committee of the Sahlgrenska UniversityHospital.
Based on the clinical examination and interview (see below),28 subjects were excluded because of medication (five exposed
subjects and three referents), diseases such as diabetes mellitus,essential tremor, skull or whiplash injury (six exposed subjectsand two referents), or other circumstances (pain in the upperlimbs, lack of sleep, nervousness, colds) that could possiblyaffect tremor or coordination (four exposed subjects and eightreferents). The main analyses in the study were performed onthe remaining 65 subjects (43 exposed and 22 referents). Theexposed group and the referents were similar with regard to age,work schedule (i.e., shift work or daytime work), smokinghabits, fish consumption, and amalgam fillings, and this wasalso the case in the original group of 93 subjects. Thebackground characteristics of the 43 exposed workers and 22referents are given in Table 1.
2.2. Exposure assessment
Information about exposure time and present work schedule(see above) was collected in a questionnaire. For assessment ofthe current mercury exposure, a first morning urine sample wastaken at home in a mercury-free polyethylene bottle. Thesamples were first stored in refrigerators, and then frozen untilanalysis. The total mercury concentration was determined usingan atomic fluorescence technique after preconcentration on agold trap [6]. Samples were digested for 1 h at room temperatureusing a 5:1 mixture of perchloric and nitric acid. Each samplewas analyzed in duplicate with a coefficient of variation ofabout 5%. The detection limit was 0.3 nmol/L (0.06 μg/L).External quality control samples (Quebec Toxicological Centre,Quebec, Canada) were analyzed together with the samples tocheck for accuracy. The results, 25 nmol/L (SD 5.5, n=8),221 nmol/L (SD 0, n=2), and 389 nmol/L (SD 0, n=2), were inaccordance with the target values of 25 nmol/L, 229 nmol/L,and 399 nmol/L, respectively. The concentration of U–Hg wasexpressed in μg/g creatinine (μg/gC) to correct for differences inurinary flow rate. Creatinine was determined using a modifiedkinetic Jaffé method [37].
For each individual, a cumulative exposure index (U–Hgcum) was calculated from previous concentrations ofmercury in blood or urine by summing up the yearly meanlevels. If both urine and blood samples were available for anindividual for a certain year, the urinary mercury levels were
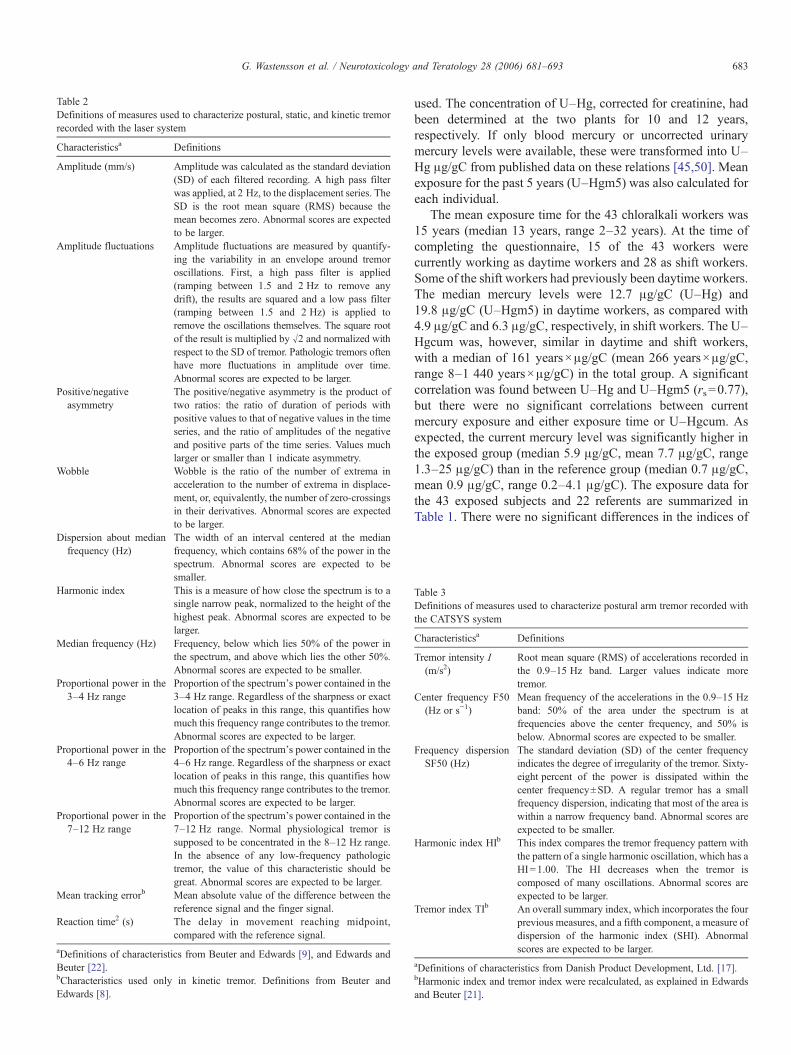
Table 2Definitions of measures used to characterize postural, static, and kinetic tremorrecorded with the laser system
Characteristicsa Definitions
Amplitude (mm/s) Amplitude was calculated as the standard deviation(SD) of each filtered recording. A high pass filterwas applied, at 2 Hz, to the displacement series. TheSD is the root mean square (RMS) because themean becomes zero. Abnormal scores are expectedto be larger.
Amplitude fluctuations Amplitude fluctuations are measured by quantify-ing the variability in an envelope around tremoroscillations. First, a high pass filter is applied(ramping between 1.5 and 2 Hz to remove anydrift), the results are squared and a low pass filter(ramping between 1.5 and 2 Hz) is applied toremove the oscillations themselves. The square rootof the result is multiplied by √2 and normalized withrespect to the SD of tremor. Pathologic tremors oftenhave more fluctuations in amplitude over time.Abnormal scores are expected to be larger.
Positive/negativeasymmetry
The positive/negative asymmetry is the product oftwo ratios: the ratio of duration of periods withpositive values to that of negative values in the timeseries, and the ratio of amplitudes of the negativeand positive parts of the time series. Values muchlarger or smaller than 1 indicate asymmetry.
Wobble Wobble is the ratio of the number of extrema inacceleration to the number of extrema in displace-ment, or, equivalently, the number of zero-crossingsin their derivatives. Abnormal scores are expectedto be larger.
Dispersion about medianfrequency (Hz)
The width of an interval centered at the medianfrequency, which contains 68% of the power in thespectrum. Abnormal scores are expected to besmaller.
Harmonic index This is a measure of how close the spectrum is to asingle narrow peak, normalized to the height of thehighest peak. Abnormal scores are expected to belarger.
Median frequency (Hz) Frequency, below which lies 50% of the power inthe spectrum, and above which lies the other 50%.Abnormal scores are expected to be smaller.
Proportional power in the3–4 Hz range
Proportion of the spectrum's power contained in the3–4 Hz range. Regardless of the sharpness or exactlocation of peaks in this range, this quantifies howmuch this frequency range contributes to the tremor.Abnormal scores are expected to be larger.
Proportional power in the4–6 Hz range
Proportion of the spectrum's power contained in the4–6 Hz range. Regardless of the sharpness or exactlocation of peaks in this range, this quantifies howmuch this frequency range contributes to the tremor.Abnormal scores are expected to be larger.
Proportional power in the7–12 Hz range
Proportion of the spectrum's power contained in the7–12 Hz range. Normal physiological tremor issupposed to be concentrated in the 8–12 Hz range.In the absence of any low-frequency pathologictremor, the value of this characteristic should begreat. Abnormal scores are expected to be larger.
Mean tracking errorb Mean absolute value of the difference between thereference signal and the finger signal.
Reaction time2 (s) The delay in movement reaching midpoint,compared with the reference signal.
aDefinitions of characteristics from Beuter and Edwards [9], and Edwards andBeuter [22].bCharacteristics used only in kinetic tremor. Definitions from Beuter andEdwards [8].
683G. Wastensson et al. / Neurotoxicology and Teratology 28 (2006) 681–693
used. The concentration of U–Hg, corrected for creatinine, hadbeen determined at the two plants for 10 and 12 years,respectively. If only blood mercury or uncorrected urinarymercury levels were available, these were transformed into U–Hg μg/gC from published data on these relations [45,50]. Meanexposure for the past 5 years (U–Hgm5) was also calculated foreach individual.
The mean exposure time for the 43 chloralkali workers was15 years (median 13 years, range 2–32 years). At the time ofcompleting the questionnaire, 15 of the 43 workers werecurrently working as daytime workers and 28 as shift workers.Some of the shift workers had previously been daytime workers.The median mercury levels were 12.7 μg/gC (U–Hg) and19.8 μg/gC (U–Hgm5) in daytime workers, as compared with4.9 μg/gC and 6.3 μg/gC, respectively, in shift workers. The U–Hgcum was, however, similar in daytime and shift workers,with a median of 161 years×μg/gC (mean 266 years×μg/gC,range 8–1 440 years×μg/gC) in the total group. A significantcorrelation was found between U–Hg and U–Hgm5 (rs=0.77),but there were no significant correlations between currentmercury exposure and either exposure time or U–Hgcum. Asexpected, the current mercury level was significantly higher inthe exposed group (median 5.9 μg/gC, mean 7.7 μg/gC, range1.3–25 μg/gC) than in the reference group (median 0.7 μg/gC,mean 0.9 μg/gC, range 0.2–4.1 μg/gC). The exposure data forthe 43 exposed subjects and 22 referents are summarized inTable 1. There were no significant differences in the indices of
Table 3Definitions of measures used to characterize postural arm tremor recorded withthe CATSYS system
Characteristicsa Definitions
Tremor intensity I(m/s2)
Root mean square (RMS) of accelerations recorded inthe 0.9–15 Hz band. Larger values indicate moretremor.
Center frequency F50(Hz or s−1)
Mean frequency of the accelerations in the 0.9–15 Hzband: 50% of the area under the spectrum is atfrequencies above the center frequency, and 50% isbelow. Abnormal scores are expected to be smaller.
Frequency dispersionSF50 (Hz)
The standard deviation (SD) of the center frequencyindicates the degree of irregularity of the tremor. Sixty-eight percent of the power is dissipated within thecenter frequency±SD. A regular tremor has a smallfrequency dispersion, indicating that most of the area iswithin a narrow frequency band. Abnormal scores areexpected to be smaller.
Harmonic index HIb This index compares the tremor frequency pattern withthe pattern of a single harmonic oscillation, which has aHI=1.00. The HI decreases when the tremor iscomposed of many oscillations. Abnormal scores areexpected to be larger.
Tremor index TIb An overall summary index, which incorporates the fourprevious measures, and a fifth component, a measure ofdispersion of the harmonic index (SHI). Abnormalscores are expected to be larger.
aDefinitions of characteristics from Danish Product Development, Ltd. [17].bHarmonic index and tremor index were recalculated, as explained in Edwardsand Beuter [21].

684 G. Wastensson et al. / Neurotoxicology and Teratology 28 (2006) 681–693
mercury exposure between excluded subjects (exposed n=15,referents n=13) and those included in the final group.
2.3. Clinical examination and questionnaires
The subjects completed a questionnaire about previous andcurrent diseases, medication, and fish, alcohol, tobacco, andcoffee consumption. They also completed the Q16 question-naire containing 16 questions regarding subjective symptoms.The Q16 has previously been used for screening purposes inworkers exposed to organic solvents as well as neurotoxicmetals [36]. Additional information concerning the subjects'state of health was collected at interviews before the physicalexaminations. Two specialists in occupational medicine carriedout the physical examinations so as to identify and excludesubjects with diseases or other conditions that may affecttremor, such as medication, pain, or temporary indisposition.The examination included Romberg's test, and tests ofcoordination (diadochokinesis, finger–nose and knee–heeltest), sensory function, deep tendon reflexes, gait, motorstrength and tone, all of which were classified as normal orabnormal. Another purpose of the physical examination was toassess resting, postural, and intention tremors, which weregraded as absent, slight (barely noticeable tremor), or moderate(obvious, noticeable tremor but b2 cm excursions). In all, thequestionnaires and clinical examination lasted for about 30 min.
Table 4Results from measurement of postural tremor with the laser-based system (for an ex
Characteristicsa Group comparisons
Exposed (n=41) Referents (n=22)
Mean SD Mean SD
Dominant handAmplitude (mm/s) 0.00841 0.005 0.00941 0.01Amplitude fluctuations 0.406 0.16 0.401 0.12Pos./Neg. asymmetry 1.04 0.14 1.00 0.08Wobble 1.54 0.14 1.55 0.13Harmonic index 0.865 0.05 0.865 0.04Median frequency (Hz) 8.48 1.37 8.45 0.98Dispersion (med. freq.) (Hz) 4.53 1.19 4.40 1.17Proportional power (3–4 Hz) 0.0874 0.05 0.0862 0.03Proportional power (4–6 Hz) 0.129 0.06 0.132 0.06Proportional power (7–12 Hz) 0.397 0.12 0.419 0.13
Non-dominant handAmplitude (mm/s) 0.00749 0.004 0.00868 0.01Amplitude fluctuations 0.388 0.15 0.365 0.09Pos./Neg. asymmetry 1.02 0.12 1.02 0.11Wobble 1.54 0.11 1.50 0.08Harmonic index 0.85 0.05 0.871 0.05Median frequency (Hz) 8.71 1.38 8.63 0.84Dispersion (med. freq.) (Hz) 4.67 1.14 4.18 1.29Proportional power (3–4 Hz) 0.0830 0.04 0.0721 0.03Proportional power (4–6 Hz) 0.125 0.06 0.108 0.04Proportional power (7–12 Hz) 0.396 0.13 0.485 0.13aMean of both recordings.bt-test, adjusted for unequal variance.c⁎p-value b0.05.dn=38.
2.4. Quantitative tremor tests
Within 30 min after the clinical evaluation, the quantitativemeasurements of tremor were performed by a neuropsychologistwho was blinded with respect to the subjects' exposure status. Ineleven subjects (five exposed subjects and six referents), thelaser test was done on a later occasion due to technical failure.Tremor was first recorded using a laser-based system. Thesensors relied on a triangulation principle to record displacementof the index finger, as described in detail elsewhere [10]. At thebeginning of each recording day, the lasers were calibrated usinga microinch while recordings were taken at three predetermineddistances. Once seated for testing, the subjects had their armsattached to supports. A light splint (b7 g) was fixed to the indexfinger so that the sensor beam was positioned at 10 cm from themetacarpophalangeal joint. First, postural finger tremor withoutvisual feedback was recorded twice, simultaneously in bothhands [8]. Each recording period lasted 30 s and was separatedfrom the next recording period by a 15-second pause.
Using the same experimental setup, postural finger tremorwith visual feedback (static tremor) was first recorded on theright side and then on the left side. Visual feedback was giventhrough an oscilloscope placed about 80 cm from the subject'seyes. Tremor was recorded twice during an uninterrupted, 90-second recording session, divided into three 30-second periods.During the first and the last 30-second recording period, while
planation of the characteristics, see Table 2)
Correlation coefficientsc (Spearman's)
All (n=63) Exposed (n=41)
p-valueb U–Hg U–Hg U–Hgcum U–Hgm5d
0.44 −0.01 0.22 0.31 0.310.90 0.08 0.24 −0.01 0.010.10 0.23 0.11 0.23 0.270.91 −0.04 −0.21 −0.12 −0.220.97 0.09 0.14 −0.14 0.240.94 0.02 0.16 0.11 0.150.66 0.05 −0.07 −0.01 −0.110.92 −0.07 −0.12 −0.07 −0.120.89 −0.07 −0.10 −0.04 −0.070.50 −0.07 −0.01 0.00 0.07
0.31 −0.11 0.01 0.08 −0.060.45 −0.03 −0.06 −0.14 −0.140.92 0.07 0.22 −0.03 0.250.13 0.16 −0.06 0.16 −0.020.09 −0.17 −0.07 −0.05 0.000.76 0.01 0.08 −0.13 −0.020.12 0.10 −0.05 0.11 −0.050.21 0.22 0.28 0.06 0.220.21 0.26⁎ 0.33⁎ 0.12 0.250.01 −0.35⁎ −0.26 −0.34⁎ −0.36⁎

Table 5Results from tremor measurements on tremor frequency, stratified by smokinghabits, in the laser system and the CATSYS system (median values)
Non-smokers Smokers
Exposed(n=31)
Referents(n=16)
Exposed(n=10)
Referents(n=6)
Dominant handLaser test Median Median p-valueb Median Median p-valueb
Medianfrequency(Hz)
8.40 8.60 0.39 9.30 8.55 0.32
Prop. power(3–4 Hz)
0.0830 0.0795 0.95 0.0755 0.0760 1.00
Prop. power(4–6 Hz)
0.129 0.110 0.87 0.111 0.114 0.71
Prop. power(7–12 Hz)
0.413 0.384 0.83 0.307 0.425 0.49
CATSYS systema
Centerfrequency(Hz)
7.70 7.90 0.10 7.20 7.90 1.00
Non-dominant handLaser testMedianfrequency(Hz)
8.30 8.60 0.33 9.10 8.15 0.09
Prop. power(3–4 Hz)
0.0770 0.0635 0.05 0.0795 0.0910 0.43
Prop. power(4–6 Hz)
0.115 0.100 0.04 0.117 0.135 0.46
Prop. power(7–12 Hz)
0.402 0.454 0.03 0.330 0.439 0.23
CATSYS systema
Centerfrequency(Hz)
7.70 8.55 0.02 7.40 7.70 0.54
aNon-smokers (exposed, n=30; referents, n=16) and smokers (exposed, n=11;referents, n=5).bCalculated using Wilcoxon's rank sum test.
685G. Wastensson et al. / Neurotoxicology and Teratology 28 (2006) 681–693
looking at the oscilloscope screen, the subject had to maintain aline corresponding to his finger's position superimposed onto afixed reference line appearing on the oscilloscope screen. Thetwo static recording periods were separated by a kinetic tremorepisode that consisted of a tracking task. In this task (kinetictremor), the subject had to follow as precisely as possible withhis index finger a reference line that moved up and down on theoscilloscope during 30 s. Finally, the recordings weretransformed into calculated measures (Table 2) shown else-where to be sensitive and reliable [9,22].
Postural tremor was also measured using an accelerometer.For this, the Tremor Pen® of the CATSYS system (DanishProduct Development, Ltd., Snekkersten, Denmark) was used.The stylus (12 cm×0.8 cm) contains a biaxial microaccele-rometer sensitive in a plane perpendicular to the central axis ofthe stylus and is individually calibrated with a calibration file.During the recording period, subjects were asked to hold thelight stylus as they would hold an ordinary pen, with the elbowjoint bent at a right angle and free from body contact or anyobstacles. The stylus was held horizontally, parallel to theabdomen, at approximately 10 cm in front of the navel, whiletremor was recorded three times in succession for each handduring 8.2 s. Fourier transformation was used to determine thepower distribution normalized across a frequency band varyingfrom 0.9 Hz to 15 Hz. All procedures and measures (Table 3)used in this study are described in detail in the CATSYS user'smanual [17] and also presented in another paper [18].
2.5. Statistics
In the analyses, we used themeans of the recordings performedwith the laser-based system (two recordings of postural tremorwithout visual feedback, two trials of static tremor in eachrecording, and two recordings of kinetic tremor) and the medianof three measurements using the CATSYS system. For groupcomparisons, Student's t-test (nN20), Wilcoxon's rank sum test,chi-squared test, or Fisher's exact test were used. Agreementbetween clinical rating of tremor and quantitative tremormeasure-ments was assessed using Pearson's and Spearman's correlationscoefficients. Associations between the tremor measures, mercuryexposure, and potential confounders (age, shift work, smoking)were evaluated using Spearman's correlation coefficients.Multiple linear regression analysis was used to examine asso-ciations between tremor measures and mercury exposure, ad-justed for potential confounders in the entire group, and amongthe exposed subjects. The exposure indices (U–Hg, U–Hgm5,U–Hgcum) were included separately in the model. Two-tailedp-values ofb0.05 are reported as statistically significant. Statisticswere calculatedwith the SAS statistical package, version 8.2 [47].
3. Results
3.1. The Q16 questionnaire
Few subjective symptoms were reported in the Q16questionnaire. The mean number of positive answers was 1.7among the exposed workers (n=43) and 1.5 among the referents
(n=22). In the exposed group, five subjects reported more thanfour symptoms, compared with three subjects among the ref-erents. Among the exposed workers, two subjects reported morethan six symptoms, while none of the referents did. No associa-tions were found between number of symptoms and age, smok-ing habits, work schedule, or the indices for mercury exposure.
3.2. Clinical tremor
There were no statistically significant differences in clinicaltremor between the two groups with respect to tremor pre-valence or type of tremor. At the physical examination, tremorcould be detected in 7/43 (16%) exposed subjects, and in 3/22(14%) referents. Among the exposed subjects, 5/43 (12%) had aslight postural tremor in one or two hands, while 3/22 (14%)referents had a moderate (one subject) or slight (two subjects)postural tremor in two hands. In the exposed group, 5/43 (12%)had slight or moderate intention tremor in one or two hands;among the referents, intention tremor was found in 2/22 (9%)subjects. One of the referents had moderate intention and
686 G. Wastensson et al. / Neurotoxicology and Teratology 28 (2006) 681–693
postural tremor in two hands, with no family history of tremorand an otherwise normal physical examination. One exposedsubject had a slight resting tremor in one hand. We found noassociations between clinical tremor and current or cumulativemercury exposure, age, smoking habits, or work schedule. Theresults were similar for the total group (58+35 subjects).
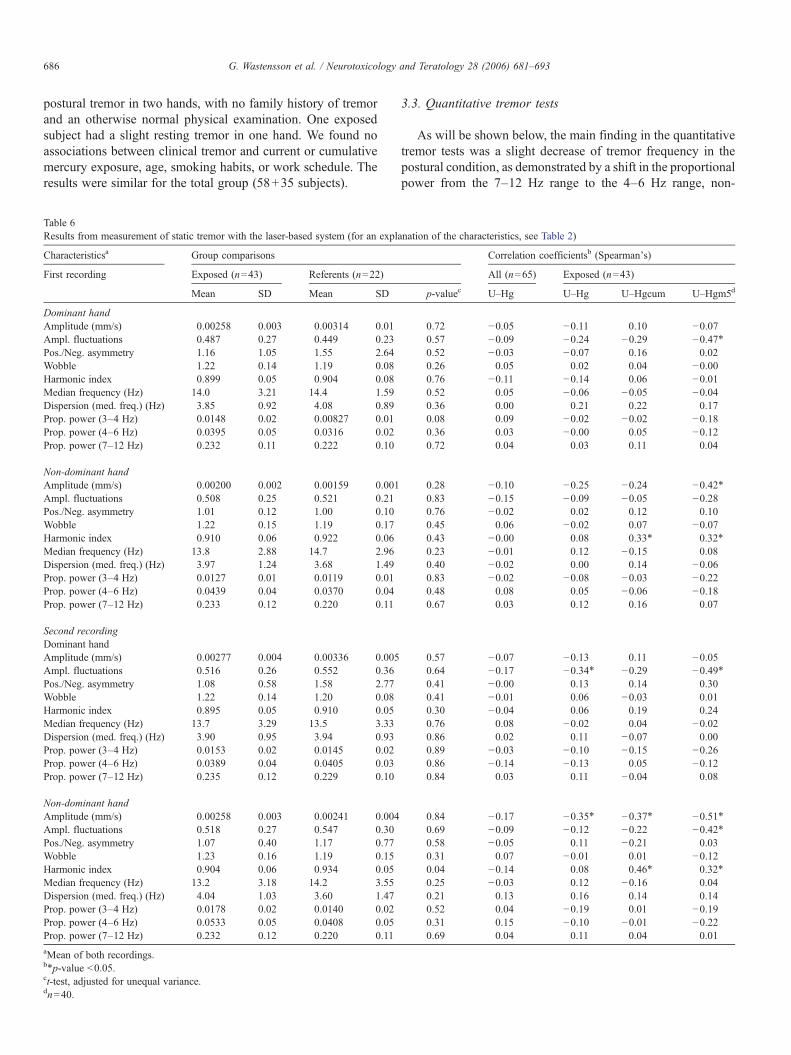
Table 6Results from measurement of static tremor with the laser-based system (for an expla
Characteristicsa Group comparisons
First recording Exposed (n=43) Referents (n=22)
Mean SD Mean SD
Dominant handAmplitude (mm/s) 0.00258 0.003 0.00314 0.01Ampl. fluctuations 0.487 0.27 0.449 0.23Pos./Neg. asymmetry 1.16 1.05 1.55 2.64Wobble 1.22 0.14 1.19 0.08Harmonic index 0.899 0.05 0.904 0.08Median frequency (Hz) 14.0 3.21 14.4 1.59Dispersion (med. freq.) (Hz) 3.85 0.92 4.08 0.89Prop. power (3–4 Hz) 0.0148 0.02 0.00827 0.01Prop. power (4–6 Hz) 0.0395 0.05 0.0316 0.02Prop. power (7–12 Hz) 0.232 0.11 0.222 0.10
Non-dominant handAmplitude (mm/s) 0.00200 0.002 0.00159 0.001Ampl. fluctuations 0.508 0.25 0.521 0.21Pos./Neg. asymmetry 1.01 0.12 1.00 0.10Wobble 1.22 0.15 1.19 0.17Harmonic index 0.910 0.06 0.922 0.06Median frequency (Hz) 13.8 2.88 14.7 2.96Dispersion (med. freq.) (Hz) 3.97 1.24 3.68 1.49Prop. power (3–4 Hz) 0.0127 0.01 0.0119 0.01Prop. power (4–6 Hz) 0.0439 0.04 0.0370 0.04Prop. power (7–12 Hz) 0.233 0.12 0.220 0.11
Second recordingDominant handAmplitude (mm/s) 0.00277 0.004 0.00336 0.005Ampl. fluctuations 0.516 0.26 0.552 0.36Pos./Neg. asymmetry 1.08 0.58 1.58 2.77Wobble 1.22 0.14 1.20 0.08Harmonic index 0.895 0.05 0.910 0.05Median frequency (Hz) 13.7 3.29 13.5 3.33Dispersion (med. freq.) (Hz) 3.90 0.95 3.94 0.93Prop. power (3–4 Hz) 0.0153 0.02 0.0145 0.02Prop. power (4–6 Hz) 0.0389 0.04 0.0405 0.03Prop. power (7–12 Hz) 0.235 0.12 0.229 0.10
Non-dominant handAmplitude (mm/s) 0.00258 0.003 0.00241 0.004Ampl. fluctuations 0.518 0.27 0.547 0.30Pos./Neg. asymmetry 1.07 0.40 1.17 0.77Wobble 1.23 0.16 1.19 0.15Harmonic index 0.904 0.06 0.934 0.05Median frequency (Hz) 13.2 3.18 14.2 3.55Dispersion (med. freq.) (Hz) 4.04 1.03 3.60 1.47Prop. power (3–4 Hz) 0.0178 0.02 0.0140 0.02Prop. power (4–6 Hz) 0.0533 0.05 0.0408 0.05Prop. power (7–12 Hz) 0.232 0.12 0.220 0.11aMean of both recordings.b⁎p-value b0.05.ct-test, adjusted for unequal variance.dn=40.
3.3. Quantitative tremor tests
As will be shown below, the main finding in the quantitativetremor tests was a slight decrease of tremor frequency in thepostural condition, as demonstrated by a shift in the proportionalpower from the 7–12 Hz range to the 4–6 Hz range, non-
nation of the characteristics, see Table 2)
Correlation coefficientsb (Spearman's)
All (n=65) Exposed (n=43)
p-valuec U–Hg U–Hg U–Hgcum U–Hgm5d
0.72 −0.05 −0.11 0.10 −0.070.57 −0.09 −0.24 −0.29 −0.47⁎0.52 −0.03 −0.07 0.16 0.020.26 0.05 0.02 0.04 −0.000.76 −0.11 −0.14 0.06 −0.010.52 0.05 −0.06 −0.05 −0.040.36 0.00 0.21 0.22 0.170.08 0.09 −0.02 −0.02 −0.180.36 0.03 −0.00 0.05 −0.120.72 0.04 0.03 0.11 0.04
0.28 −0.10 −0.25 −0.24 −0.42⁎0.83 −0.15 −0.09 −0.05 −0.280.76 −0.02 0.02 0.12 0.100.45 0.06 −0.02 0.07 −0.070.43 −0.00 0.08 0.33⁎ 0.32⁎
0.23 −0.01 0.12 −0.15 0.080.40 −0.02 0.00 0.14 −0.060.83 −0.02 −0.08 −0.03 −0.220.48 0.08 0.05 −0.06 −0.180.67 0.03 0.12 0.16 0.07
0.57 −0.07 −0.13 0.11 −0.050.64 −0.17 −0.34⁎ −0.29 −0.49⁎0.41 −0.00 0.13 0.14 0.300.41 −0.01 0.06 −0.03 0.010.30 −0.04 0.06 0.19 0.240.76 0.08 −0.02 0.04 −0.020.86 0.02 0.11 −0.07 0.000.89 −0.03 −0.10 −0.15 −0.260.86 −0.14 −0.13 0.05 −0.120.84 0.03 0.11 −0.04 0.08
0.84 −0.17 −0.35⁎ −0.37⁎ −0.51⁎0.69 −0.09 −0.12 −0.22 −0.42⁎0.58 −0.05 0.11 −0.21 0.030.31 0.07 −0.01 0.01 −0.120.04 −0.14 0.08 0.46⁎ 0.32⁎
0.25 −0.03 0.12 −0.16 0.040.21 0.13 0.16 0.14 0.140.52 0.04 −0.19 0.01 −0.190.31 0.15 −0.10 −0.01 −0.220.69 0.04 0.11 0.04 0.01

687G. Wastensson et al. / Neurotoxicology and Teratology 28 (2006) 681–693
dominant hand, among exposed subjects as measured by thelaser system. Furthermore, a decrease in center frequency in thesame (non-dominant) hand was found in exposed subjectsamong non-smokers.
3.3.1. The laser system
3.3.1.1. Postural tremor. We found no significant groupdifferences, except for proportional power in the 7–12 Hzrange. The exposed chloralkali workers had lower proportionalpower in this range in the non-dominant hand (Table 4).Moreover, we found an inverse correlation (Spearman) betweenproportional power in the 7–12 Hz range for the non-dominanthand, and U–Hg. However, the correlation with U–Hg was notsignificant in the exposed group only (Table 4). In the multipleregression analyses, proportional power in the 7–12 Hz range inthe non-dominant hand was inversely associated with U–Hg( p=0.004) in the entire group (n=65), also with age, shift work,and smoking included in the model. The association did notremain significant in the exposed group only ( p=0.06), butthere was a similar association with U–Hgm5 ( p=0.03).
Furthermore, there was a significant correlation betweencurrent mercury exposure and proportional power in the 4–6 Hzrange in the non-dominant hand in the entire group, as well asamong exposed workers. Significant associations betweencurrent Hg0 exposure, U–Hgm5, and proportional power inthe 3–4 Hz and 4–6 Hz ranges were found in the non-dominanthand in the multivariate analyses with age, shift work, and
Table 7Results from measurement of kinetic tremor with the laser-based system (for an exp
Characteristicsa Group comparisons
Exposed (n=42) Referents (n=22)
Mean SD Mean SD
Dominant handMean tracking error 14.1 2.30 14.8 3.23Reaction time (s) 0.334 0.07 0.357 0.09Pos./Neg. asymmetry 1.20 0.24 1.19 0.20Harmonic index 0.902 0.03 0.892 0.04Median frequency (Hz) 5.72 0.96 6.20 1.68Dispersion (med. freq.) (Hz) 2.40 0.78 2.64 1.11Proportional power (3–4 Hz) 0.232 0.06 0.228 0.08Proportional power (4–6 Hz) 0.325 0.07 0.296 0.08Proportional power (7–12 Hz) 0.252 0.07 0.278 0.11
Non-dominant handMean tracking error 14.2 1.82 14.5 2.60Reaction time (s) 0.343 0.07 0.364 0.12Pos./Neg. asymmetry 1.15 0.15 1.17 0.16Harmonic index 0.852 0.05 0.833 0.06Median frequency (Hz) 8.53 2.96 9.25 2.95Dispersion (med. freq.) (Hz) 4.33 1.62 4.85 1.60Proportional power (3–4 Hz) 0.146 0.08 0.135 0.08Proportional power (4–6 Hz) 0.231 0.09 0.213 0.10Proportional power (7–12 Hz) 0.228 0.06 0.213 0.04aMean of both recordings.bt-test, adjusted for unequal variance.c⁎p-value b0.05.dn=39.
smoking included in the model. However, these associationswere no longer significant when a single outlier was excluded.
A comparison between the eight workers with the highestU–Hgcum (U–HgcumN300, 75th percentile) and 19 age-matched referents likewise showed lower proportional powerin the 7–12 Hz range in the exposed group in the non-dominanthand ( p=0.002). There was also a tendency towards higherproportional power in the 3–4 Hz ( p=0.10) and the 4–6 Hzrange ( p=0.07) in the non-dominant hand among the exposedworkers (not tabulated). However, except from an inversecorrelation between proportional power in the 7–12 Hz rangefor the non-dominant hand and U–Hgcum (Table 4), noassociations between cumulative Hg0 exposure and tremorfrequency were found.
In the referent group, smokers had higher proportional powerin the 3–4 Hz range ( p=0.03) and the 4–6 Hz range ( p=0.01),compared with non-smokers, in the non-dominant hand, andtherefore we stratified the analysis by smoking habits. In thenon-dominant hand of non-smokers, exposed subjects (n=31,mean age 40 years) had higher proportional power in the 3–4 Hz ( p=0.05) and 4–6 Hz ranges, and, as in the entire group,lower proportional power in the 7–12 Hz range compared withthe referents (n=16, mean age 40 years) (Table 5). Nodifferences were found when we compared exposed subjects(n=10) and referents (n=6) among smokers; however, thegroups were small (Table 5). Some subjects used wet snuff,which could have a similar effect as cigarette smoking. Whenwe stratified the analyses by tobacco (including wet snuff)/non-
lanation of the characteristics, see Table 2)
Correlation coefficientsc (Spearman's)
All (n=64) Exposed (n=42)
p-valueb U–Hg U–Hg U–Hgcum U–Hgm5d
0.33 0.00 0.00 0.35⁎ 0.010.28 −0.03 0.03 0.43⁎ 0.030.75 0.02 −0.01 0.36⁎ 0.300.26 0.02 −0.16 −0.17 −0.35⁎0.22 −0.16 −0.08 0.09 0.060.31 −0.14 −0.08 0.08 0.030.83 0.08 0.06 −0.06 −0.080.13 0.22 0.11 −0.15 −0.000.31 −0.08 −0.01 0.04 0.13
0.52 0.01 −0.03 0.25 −0.160.44 0.02 0.02 0.32⁎ −0.030.65 0.00 0.15 0.40⁎ 0.290.20 0.08 −0.06 −0.19 −0.160.35 −0.10 −0.07 0.20 0.100.23 −0.13 −0.13 0.14 0.020.60 0.06 −0.03 −0.28 −0.230.46 0.11 0.14 −0.17 −0.050.20 −0.10 −0.24 0.29 −0.07

Table 8Results from measurement of postural tremor with the CATSYS system (for an explanation of the characteristics, see Table 3)
Characteristicsa Group comparisons Correlation coefficients (Spearman's)
Exposed (n=41) Referents (n=21) All (n=62) Exposed (n=41)
Mean SD Mean SD p-valueb U–Hg U–Hg U–Hgcum U–Hgm5c
Dominant handTremor intensity (m/s2) 0.139 0.06 0.129 0.03 0.42 0.00 −0.05 0.12 0.12Harmonic index 1.99 0.34 2.05 0.32 0.51 −0.06 −0.04 0.22 0.27Center frequency (Hz) 7.60 0.91 8.00 1.02 0.11 −0.21 −0.09 −0.10 −0.14Frequency dispersion (Hz) 2.95 0.70 2.86 0.67 0.63 0.06 −0.0 0.06 −0.21Tremor index 1.19 1.09 1.07 0.49 0.55 −0.06 −0.09 0.07 −0.04
Non-dominant handTremor intensity (m/s2) 0.138 0.06 0.118 0.02 0.08 0.03 −0.06 0.07 0.06Harmonic index 1.85 0.37 1.76 0.22 0.21 0.05 −0.01 0.05 0.20Center frequency (Hz) 7.86 1.09 8.12 1.20 0.39 −0.21 −0.10 0.12 −0.03Frequency dispersion (Hz) 3.29 0.78 3.40 0.51 0.52 −0.01 0.03 0.10 −0.18Tremor index 1.31 0.89 0.941 0.28 0.02d 0.04 −0.12 0.13 −0.02aMedian of three recordings.bt-test, adjusted for unequal variance.cn=38.dp=0.21 (calculated with Wilcoxon's rank sum test).
Fig. 1. Center frequency (F50) stratified by smoking and Hg0 exposure in the non-
dominant hand (n=62).
688 G. Wastensson et al. / Neurotoxicology and Teratology 28 (2006) 681–693
tobacco use, the results pointed in the same direction, thoughthe results were less significant.
There was no group difference with respect to amplitude, butthere was a borderline correlation between amplitude in thedominant hand and U–Hgcum (rs=0.31, p=0.05), and U–Hgm5 (rs=0.31, p=0.06), respectively (Table 4). Moreover,there was a significant (p=0.01) association between U–Hgcumand amplitude in the dominant hand in a multiple linear re-gression analysis, with age, shift work, and smoking included inthe model, and a similar, though non-significant, association(p=0.06) between U–Hgm5 and amplitude in the dominanthand. No association was found with current mercury exposure.A significant association between current Hg exposure and am-plitude fluctuations in the dominant hand, with age, shift work,and smoking included in the model disappeared when a singleoutlier was excluded.
3.3.1.2. Static tremor. Surprisingly, in the non-dominanthand, we found an inverse correlation between amplitudeand U–Hgm5 in the first recording and between amplitude andU–Hg, U–Hgcum, and U–Hgm5 among exposed workers, inthe second recording. Furthermore, amplitude fluctuationswere inversely correlated to U–Hgm5 (dominant hand) in thefirst recording, and to U–Hg (dominant hand) and U–Hgm5(both hands) among exposed workers in the second recording(Table 6), implying better performance with higher current andcumulative exposure. A significant group difference withrespect to harmonic index (HI) ( p=0.04) was also found in thesecond recording in the non-dominant hand, but again, thiswas not in the expected, abnormal direction. The indices ofprevious Hg0 exposure (U–Hgcum and U–Hgm5) were,however, correlated to HI in the non-dominant hand in bothrecordings (Table 6), indicating worse performance with higherprevious Hg0 exposure, but this finding was not supported bythe multivariate analyses. Otherwise, there were no other
significant group differences, and current Hg0 exposure wasnot related to any of the effect measures in the static tremor testin the entire group (Table 6).
The median frequency in the non-dominant hand decreasedin the entire group (n=65) between the two recordings (i.e.,before and after the finger tracking task) ( p=0.009); a similartendency was seen in the dominant hand ( p=0.05). A signif-icant decrease in median frequency ( p=0.01), and an increasein proportional power in the 4–6 Hz range ( p=0.03) in the non-dominant hand were seen only among the exposed subjects.When the exposed and referent groups were compared withrespect to change in performance between the first and secondrecording of static tremor, however, no significant differenceswere found.

Table 9Tremor characteristics from the laser and CATSYS systems, by clinical tremorgradea
Clinical tremor
Laser test Normal (n=69) Abnormal (n=9)
Dominant hand Median Median p-valueb rsAmplitude (mm/s) 0.007 0.0110 0.004 0.34
Non-dominant hand Normal (n=66) Abnormal (n=12)Amplitude (mm/s) 0.00650 0.0135 0.01 0.30
CATSYS system Normal (n=79) Abnormal (n=10)
Dominant hand Median MedianIntensity (m/s2) 0.12 0.175 0.006 0.31
Non-dominant hand Normal (n=75) Abnormal (n=14)Intensity (m/s2) 0.11 0.16 0.0002 0.41
aClinical tremor grades dichotomized into normal and abnormal (slight andmoderate) tremor for group comparisons. The original three grades of clinicaltremor were used for calculating correlations coefficients (Spearman's).bCalculated using Wilcoxon's rank sum test.
689G. Wastensson et al. / Neurotoxicology and Teratology 28 (2006) 681–693
3.3.1.3. Kinetic tremor. We found no differences in any of theoutcome variables when we compared the exposed group andthe referents (Table 7). No effects on amplitude were found, andwith respect to frequency, the only finding, in the multivariateanalyses, was an inverse association between U–Hgm5 andproportional power in the 7–12 Hz range ( p=0.04) in the non-dominant hand. Among the exposed workers, there was asignificant correlation between U–Hgcum and reaction time inboth hands (Table 7), but as expected, the associationdisappeared when age was taken into account in the multivariateanalyses. A correlation between U–Hgcum and mean trackingerror was found in the dominant hand, but similarly, theassociation did not remain significant in themultivariate analyses.Among the exposed subjects, U–Hgcum was correlated topositive/negative asymmetry in both hands, with worse perfor-mance at higher U–Hgcum. In the non-dominant hand, thisassociation remained significant in the multivariate analyses withage, shift work, and smoking included in the model.
3.3.2. The CATSYS systemThere were no statistically significant group differences
between the chloralkali workers and referents in the outcomevariables derived from the CATSYS system except with regardto the tremor index (TI) (Table 8). Data for TI were, however, notnormally distributed and with a non-parametric test, thedifference was not statistically significant. Furthermore, no cor-relations were found with any of the exposure indexes (Table 8).We found significant associations in the multivariate analysesbetween current Hg exposure and intensity and TI in the non-dominant hand, and an inverse, though insignificant, associationwith center frequency (F50) in the dominant hand. However,these associations did not remain significant when a singleoutlier was removed.
Interestingly, we found lower F50 ( p=0.02) among smokersin the non-dominant hand in the reference group. Consequently,we performed an analysis stratified by smoking/non-smoking.Non-smoking referents had the highest F50, followed by
Fig. 2. Amplitude (laser test) related to clinical tremor grade in the non-dominanthand (n=78).
exposed non-smokers, smoking referents, and exposed smokers(Fig. 1). Among the non-smoking subjects, the exposed grouphad significantly lower F50 in the non-dominant handcompared with the referents ( p=0.02), and there was also asimilar tendency in the dominant hand ( p=0.1) (Table 5).Similarly as in the laser test, we stratified the analyses bytobacco (including wet snuff)/non-tobacco use, and again theresults pointed in the same direction, though less significant.
3.4. Comparison between clinical tremor assessment andquantitative tremor tests
We used the entire group to examine agreement betweenclinical ratings of postural tremor and quantitative tests results,and after exclusion of missing subjects, 89 subjects remainedfor analyses with the CATSYS system. For the laser test, onlysubjects who were tested on the same occasion as the clinicalevaluation were included, leaving 78 subjects for analyses. Inthe laser test, two subjects with the highest clinical scores(moderate tremor) in the non-dominant hand also had the mostextreme values in amplitude in the non-dominant hand (Fig. 2).In the CATSYS test, one out of three subjects with the highestscore in clinical tremor in the dominant hand was identified ashaving an abnormal value for tremor intensity. Since very fewsubjects had moderate tremor, the results of the clinicalexaminations were dichotomized into “tremor: yes” (slightand moderate tremor) or “no”. Clinical tremor was found in 14(non-dominant hand) and ten subjects (dominant hand) whoalso were examined with the CATSYS test, and twelve (non-dominant hand) and nine subjects (dominant hand) who tookpart in the laser test. Subjects classified as having clinical tremorhad significantly higher amplitude (laser test) and tremorintensity (CATSYS system) in both hands (Table 9). However,when agreement between clinical evaluation of tremor (threegrades) and quantitative tremor measurements was assessedusing the Spearman's correlation coefficient, the association

Fig. 3. The association between amplitude (laser test) and intensity as measuredby the CATSYS system in the non-dominant hand (n=74).
690 G. Wastensson et al. / Neurotoxicology and Teratology 28 (2006) 681–693
between clinical tremor and quantitative outcome variables wasgenerally low (Table 9). A comparison between the twoquantitative tests was also performed. The correlation coeffi-cients (Pearson) between amplitude of displacement asmeasured by the laser system, and intensity as measured bythe CATSYS system were r=0.35 ( p=0.002) and r=0.50( pb0.0001) for the dominant and non-dominant hand, re-spectively. The association between the two tests in the non-dominant hand is shown in Fig. 3.
4. Discussion
In this study of chloralkali workers with current low-levelexposure to Hg0, no effect of mercury exposure was seen ontremor amplitude, irrespective of method. There were, however,some indications of a lowering of tremor frequency by mercuryexposure. There were no differences between exposed subjectsand referents in clinical tremor, and agreement with the quanti-tative measures was generally low.
An increase in tremor amplitude has consistently been reportedin studies with high or moderate current Hg0 exposure[30,44,46,53,54] down to exposure levels of about 35 μg/g [52],although some studies report no effect [14,40,41,48]. Inaccordance with the present study, no effects on tremor amplitudewere seen in several other studieswith low (U–Hgup to 25μg/g orμg/l) current exposure levels [15,19,24,25,31,35], some of whichused the CATSYS system [19,35], except for a possible effect in astudy of gold traders [13]. In summary, our results, using state ofthe arts methods, confirm that there seems to be no effect of Hg0
exposure on tremor amplitude at low exposure levels.In the present study, the exposed workers had significantly
lower proportional power in the 7–12 Hz range and a tendencytowards higher proportional power in the 4–6 Hz range in thelaser test, indicating a lowering of tremor frequency with currentHg0 exposure in the non-dominant hand. The group differencewas supported by an inverse association between proportionalpower in the 7–12 Hz range and current Hg0 exposure.
Furthermore, a significantly lower F50 was found, using theCATSYS system, in the exposed non-smokers than in their non-smoking referents. The results from previous studies on Hg0
exposure and tremor frequency are contradictory. In studieswith high or moderate current Hg0 exposure, tremor frequencywas found to increase [41,52,54], remain unaltered[14,40,44,48], or decrease [30]. In contrast to our results,some studies with low exposure (U–Hg 20–25 μg/g or μg/l)indicate increasing tremor frequency following current Hg0
exposure [15,25]. Two studies using the CATSYS system[19,35] found no effects on tremor frequency at exposure levelsabout U–Hg 10 μg/g or lower. Therefore, previous studies donot support our finding that tremor frequency may decreasefollowing Hg0 exposure. The laser system is, however, moresensitive to the high-frequency components in the frequencyspectrum than the accelerometer [21], and there are no previousstudies of low Hg0 exposure using the laser system. The factthat several of our findings on tremor frequency point in thesame direction (a decrease), and were consistently found in thesame (non-dominant) hand, irrespective of method, speaksagainst an effect due to chance.
An important question is whether an observed effect ontremor is due to current or historical Hg0 exposure. In our study,proportional power in the 7–12 Hz range was inverselycorrelated to U–Hgcum, and the group differences inproportional power were most pronounced when we comparedworkers with the highest U–Hgcum exposure with the referents.Consequently, there is a possibility that a lowering of frequencymay be a persistent effect of previous exposure to Hg0.However, no reports with regard to effects on tremor frequencydue to historical Hg0 exposure are available, except for a recentstudy using the CATSYS system which showed no effect [5]. Asignificant association between U–Hgcum and amplitude in thedominant hand was found in the laser test (postural tremorwithout visual feedback). Increased hand tremor has beenreported in studies on previously exposed workers [1,2,26,43],and also supported by other studies showing that increased handtremor is more related to past than current Hg0 exposure[25,30,44]. However, no relation between cumulative Hg0
exposure (mean Cum U–Hg around 220 years×μg/gC) andincreased hand tremor was seen in another study of chloralkaliworkers [24], and neither was any effect seen when the samegroup was examined using the CATSYS system 5 years aftercessation of exposure [5]. Furthermore, the negative outcome inthe CATSYS test in the present study, together with our findingsin the static tremor test indicating lower amplitude (i.e., betterperformance) with increasing Hg0 exposure in the non-dominant hand also speak against a true effect.
The effect on tremor frequency was found only in the non-dominant hand, in contrast to other studies using quantitativemethods, where an effect of Hg0 exposure on tremor was seen inboth hands [13,30,41,44,46,52–54]. In some studies, tremorwas only measured in the right/dominant hand [15,25].Significant differences in physiological tremor between handshave been demonstrated with the laser system in a study ofhealthy female subjects [12]. In a study of dental personnel withlow Hg0 exposure, effects on finger tapping were seen solely in

691G. Wastensson et al. / Neurotoxicology and Teratology 28 (2006) 681–693
the non-dominant hand [42]. The possibility that an effect ofHg0 exposure may be expressed differently in the dominant/non-dominant hand cannot be excluded.
Exposure to cigarette smoke has been reported to induce tailtremor in rats [28] and increase tremor amplitude in humans[23,34,49]. Amplitude in postural tremor has been reported tobe significantly increased at least up to half an hour aftersmoking has ceased [39]. Our subjects had not smoked 30 minbefore tremor testing, but the time of their last cigarette was notrecorded. Smoking habits has recently been pointed out as animportant confounder in studies of Hg0 exposed populations[5]. Increased tremor related to smoking habits has beenreported in occupational studies using a hole tremormeter[4,5,24], and the CATSYS system [4,5]. In the present study,smokers had lower tremor frequency in the referent group, butnot in the exposed group. In a population study using theCATSYS system for tremor evaluation, lower F50 was reportedamong smokers in accordance with our findings [11]; however,no effect on F50 among smokers was found in two recentoccupational studies [4,5]. In the present study, an effect of Hgexposure on tremor frequency was seen in the non-smokinggroup, but not among smokers. The reason for this may be thatsmoking obscures the effect of mercury on tremor frequency. Asfar as we know, the effect of Hg0 exposure on tremor has notbeen evaluated before with stratification for smoking habits.
Amplitude of postural tremor measured by laser, andintensity measured by the CATSYS system were chosen forcomparison with clinical tremor because these variables arebelieved to be most similar to the clinical assessment of tremor.The agreement between clinical assessment of tremor severityand the quantitative tremor measurements was low, inaccordance with other studies [8,22]. Tremor fluctuates overtime by nature and a plausible explanation for the lowagreement is the time delay between the clinical examinationand the quantitative tests (up to 15 min for the laser and up to30 min for the CATSYS system). In another study [27], inwhich the quantitative tremor measurements were obtainedimmediately after the clinical examinations, moderately goodagreement was reported between clinical tremor and tremorintensity measured by the CATSYS system. Laser measuresdisplacement amplitude in contrast to the CATSYS system,which uses acceleration data. In clinical assessment, tremor isassessed visually while subjects are asked to hold their armsagainst gravity, a condition presumed to affect displacementmore than acceleration [20]. Nevertheless, the low agreementbetween clinical rating and amplitude from the laser test was notencouraging in the present study. Possibly, subtle changes indisplacement detected by the lasers are not visible at clinicalexamination. The fact that the clinical examination and thequantitative tests were performed by different examiners mayalso have affected the results as tremor is easily affected bystress and anxiety.
In order to detect a possible effect of Hg0 at these exposurelevels, sensitive methods are required, as only subtle effects ontremor may be expected. Moreover, “noise” from otherconditions that produce tremor, and confounders in theexamined population may also affect our ability to detect
minor changes in tremor due to Hg0 exposure. Two differentquantitative systems for measuring tremor, an accelerometer(the CATSYS system) and a highly sensitive laser systemrecording displacement were used in this study. The agreementbetween the two quantitative methods was low to moderate. Thelaser system records in one axis only, while the CATSYS systemdoes in two. Moreover, differences between the two tests in therecording procedures may also be of importance, e.g. durationof tests, and support of forearms. A high association was shownbetween different variables including amplitude when simulta-neous recordings with the two systems were performed [20].The systems produced, however, very different results when therecordings were not simultaneous, indicating that the time factoris very important.
In our opinion, the comparability between the exposedworkers and the referents was good. They were similar in age,smoking habits, and work schedule (Table 1), and they wereemployed at the same plants. The relatively long mean time ofemployment (15 years) and the low turnover rate among theexposed workers speak against selection bias due to a “healthyworker effect”. Furthermore, subjects with diseases or medica-tion that may affect tremor were excluded, so we assume thatany group difference was probably due to an effect of mercury.However, when the number of subjects was reduced, our abilityto detect a possible effect of tremor may have been affected. Wetherefore performed some of the main analyses on the originalgroup for comparison, with similar results.
The analyses were systematically checked for outliers, andall results in this paper are reported with and without outliers ifthe outcome of the analyses was affected. Several results in thestatistical tests of the CATSYS and laser system (postural laser)were affected by a single outlier (see Results). This outlier, asubject with high exposure during the last years (U–Hg 24.5 μg/gC, U–Hgm5 37 μg/gC), had the highest values in intensity, TI,and HI, and the lowest values in center frequency in both handswhen tested with the CATSYS system. Similarly, in the lasertest, this subject had the highest values in wobble, amplitudefluctuations, and proportional power in the 3–4 Hz and 4–6 Hzranges, and the lowest values in proportional power in the 7–12 Hz range in both hands. However, the effect on proportionalpower in the 7–12 range in the laser test could not be explainedby this outlier, nor could we explain the effect on frequency,seen in the non-smoking group alone (postural laser andCATSYS test), as the subject in question was a smoker. Thissubject had no family history of tremor, and had a normalphysical examination, and no clinical tremor. However, hismean U–Hg in the last 5 years prior to the examination (37 μg/gC) was above the level (around 30 μg/g) where an effect oftremor has been shown earlier [55]. Thus, an effect of Hgexposure can not be excluded as a cause of the abnormal resultsin the quantitative tremor tests in this subject.
The statistical power of detecting a shift of frequency wasmoderate to good with the methods used in the present study.The power was 80% (α=0.05) to detect a 20% decrease in theproportional power in the 7–12 range (n=41+22), and 50% todetect a 5% decrease in center frequency (n=30+16, non-smokers); effect sizes as found in the present study. In this study,

692 G. Wastensson et al. / Neurotoxicology and Teratology 28 (2006) 681–693
multiple comparisons were performed. Our results shouldtherefore be interpreted with caution. There are several pro-cedures for adjusting the α-values in order to control the prob-ability of false rejection of the null hypothesis. The question ofwhether to adjust or not is debated and depends on the purpose ofthe analysis. A first study may be of an exploratory nature, andform the basis of future experiments. Then the p-values can beinterpreted as exploratory measures, indicating which contrastsare of interest for further investigations.
In summary, none of the methods used (qualitative andquantitative) support the hypothesis that there is an effect of Hg0
on tremor amplitude at the exposure levels under discussion.However, our study provides limited support for a decrease intremor frequency in the non-dominant hand caused by mercuryexposure, but this finding has to be confirmed in a subsequentstudy. Assessment of clinical tremor seems to be of less value asa tool for detecting subtle changes in tremor at low level Hg0
exposure, but it may still be important in identifying andexcluding subjects with increased tremor due to diseases orother pathological conditions in the CNS. For future studies, weemphasize the importance of controlling for confounders (e.g.,smoking), as a small effect of Hg0 exposure may otherwise beobscured.
Acknowledgements
The authors would like to thank the participants in this study,and the staff at the local Occupational Health service units, fortheir assistance. We are grateful to Annika Claesson, for thehelpful assistance with collecting and handling the urinesamples, and the late Andreas Schütz, head of the laboratoryat the Department of Occupational and Environmental Medicinein Lund.
References
[1] J.W. Albers, L.R. Kallenbach, L.J. Fine, G.D. Langolf, R.A. Wolfe, P.D.Donofrio, A.G. Alessi, K.A. Stolp-Smith, M.B. Bromberg, Neurologicalabnormalities associated with remote occupational elemental mercuryexposure, Ann. Neurol. 24 (1988) 651–659.
[2] A. Andersen, D.G. Ellingsen, T. Mørland, H. Kjuus, A neurological andneurophysiological study of chloralkali workers previously exposed tomercury vapour, Acta Neurol. Scand. 88 (1993) 427–433.
[3] P.G. Bain, Clinical measurement of tremor, Mov. Disord. 13 (Suppl 3)(1998) 77–80.
[4] R. Bast-Pettersen, D.G. Ellingsen, S.M. Hetland, Y. Thomassen,Neuropsychological function in manganese alloy plant workers, Int.Arch. Occup. Environ. Health 77 (2004) 277–287.
[5] R. Bast-Pettersen, D.G. Ellingsen, J. Efskind, Rita Jordskogen, Y.Thomassen, A neurobehaviorial study of chloralkali workers after thecessation of exposure to mercury vapor, Neurotoxicology 26 (2005)427–437.
[6] I.A. Bergdahl, A. Schütz, G.Å. Hansson, Automated determination ofinorganic mercury in blood after sulphuric acid treatment using coldvapour atomic absorption spectrometry and inductive heated gold traps,Analyst 120 (1995) 1205–1209.
[7] A. Beuter, A. de Geoffroy, Can tremor be used to measure the effects ofchronic mercury exposure in human subjects? Neurotoxicology 17 (1996)213–228.
[8] A. Beuter, R. Edwards, Tremor in Cree subjects exposed to methylmer-cury: a preliminary study, Neurotoxicol. Teratol. 20 (1998) 581–589.
[9] A. Beuter, R. Edwards, Using frequency domain characteristics to dis-criminate physiologic and parkinsonian tremors, J. Clin. Neurophysiol. 16(1999) 484–494.
[10] A. Beuter, A. de Geoffroy, P. Cordo, The measurement of tremor usingsimple laser systems, J. Neurosci. Methods 53 (1994) 47–54.
[11] A. Beuter, R. Ewards, A. deGeoffroy, D.Mergler, K. Hudnell, Quantificationof neuromotor function for detection of the effects of manganese,Neurotoxicology 20 (1999) 355–366.
[12] A. Beuter, R. Edwards, A. Boucher, Physiological tremor: does handednessmake a difference? Int. J. Neurosci. 101 (2000) 9–19.
[13] H. Biernat, S.A. Ellias, L. Wermuth, D. Cleary, E.C. de Oliveira Santos,P.J. Jørgensen, R.G. Feldman, P. Grandjean, Tremor frequency patternsin mercury vapor exposure, compared with early Parkinson's disease andessential tremor, Neurotoxicology 20 (1999) 945–952.
[14] A.C. Bittner Jr., D. Echeverria, J.S. Woods, H.V. Aposhian, C. Naleway,M.D. Martin, R.K. Mahurin, N.J. Heyer, M. Cianciola, Behavioral effectsof low-level exposure to Hg0 among dental professionals: a cross-studyevaluation of psychomotor tests, Neurotoxicol. Teratol. 20 (1998) 429–439.
[15] L.J. Chapman, S.L. Sauter, R.A. Henning, V.N. Dodson, W.G. Reddan,C.G. Matthews, Differences in frequency of finger tremor in otherwiseasymptomatic mercury workers, Br. J. Ind. Med. 47 (1990) 838–843.
[16] T.W. Clarkson, The three modern faces of mercury, Environ. HealthPerspect. 110 (Suppl 1) (2002) 11–23.
[17] Danish Product Development, TREMOR 7.0 User's Manual, Snekkersten,Denmark, 1996.
[18] C. Després, D. Lamoureux, A. Beuter, Standarization of a neuromotor testbattery: the CATSYS System, Neurotoxicology 21 (2000) 725–736.
[19] D. Echeverria, H.V. Aposhian, J.S. Woods, N.J. Heyer, M.M. Aposhian,A.C. Bittner Jr., R.K. Mahurin, M. Cianciola, Neurobehavioral effectsfrom exposure to dental amalgam Hg0: new distinctions between recentexposure and Hg body burden, FASEB J. 12 (1998) 971–980.
[20] R. Edwards, A. Beuter, Sensitivity and specificity of a portable systemmeasuring postural tremor, Neurotoxicol. Teratol. 19 (1997) 95–104.
[21] R. Edwards, A. Beuter, Indexes for identification of abnormal tremor usingcomputer tremor evaluation, IEEE Trans. Biomed. Eng. 46 (1999)895–898.
[22] R. Edwards, A. Beuter, Using time domain characteristics to discriminatephysiologic and parkinsonian tremors, J. Clin. Neurophysiol. 17 (2000)87–100.
[23] R.J. Elble, Central mechanisms of tremor, J. Clin. Neurophysiol. 13 (1996)133–144.
[24] D.G. Ellingsen, R. Bast-Pettersen, J. Efskind, Y. Thomassen, Neuropsy-chological effects of low mercury vapor exposure in chloralkali workers,Neurotoxicology 22 (2001) 249–258.
[25] R.F. Fawer, Y. De Ribaupierre, M.P. Guillemin, M. Berode, M. Lob,Measurement of hand tremor induced by industrial exposure to metallicmercury, Br. J. Ind. Med. 40 (1983) 204–208.
[26] H. Frumkin, R. Letz, P.L. Williams, F. Gerr, M. Pierce, A. Sanders, L.Elon, C.C. Manning, J.S. Woods, V.S. Hertzberg, P. Mueller, B.B. Taylor,Health effects of long-term mercury exposure among chloralkali plantworkers, Am. J. Ind. Med. 39 (2001) 1–18.
[27] F. Gerr, R. Letz, R.C. Green, Relationships between quantitative measuresand neurologist's clinical rating of tremor and standing steadiness in twoepidemiological studies, Neurotoxicology 21 (2000) 753–760.
[28] Y. Gomita, K. Suemaru, K. Furuno, Y. Araki, Tail-tremor induced byexposure to cigarette smoke in rats, Pharmacol. Biochem. Behav. 40(1991) 453–455.
[29] M. Hallett, Overview of human tremor physiology,Mov. Disord. 13 (suppl 3)(1998) 43–48.
[30] G.D. Langolf, D.B. Chaffin, R. Henderson, H.P. Whittle, Evaluation ofworkers exposed to elemental mercury using quantitative tests of tremorand neuromuscular function, Am. Ind. Hyg. Assoc. J. 39 (1978) 976–984.
[31] S. Langworth, O. Almkvist, E. Söderman, B.O. Wikström, Effects ofoccupational exposure to mercury vapour on the central nervous system,Br. J. Ind. Med. 49 (1992) 545–555.
[32] C.C. Leong, N.I. Syed, F.L. Lorscheider, Retrograde degeneration ofneurite membrane structural integrity of nerve growth cones following invitro exposure to mercury, NeuroReport 26 (2001) 733–737.

693G. Wastensson et al. / Neurotoxicology and Teratology 28 (2006) 681–693
[33] R. Letz, F. Gerr, D. Cragle, R.C. Green, J. Watkins, A.T. Fidler, Residualneurologic deficits 30 years after occupational exposure to elementalmercury, Neurotoxicology 21 (2000) 459–474.
[34] O.C. Lippold, E.J. Williams, C.G. Wilson, Finger tremor and cigarettesmoking, Br. J. Clin. Pharmacol. 10 (1980) 83–86.
[35] R. Lucchini, I. Cortesi, P. Facco, L. Benedetti, D. Camerino, P. Carta, M.L.Urbano, A. Zaccheo, L. Alessio, Neurotoxic effect of exposure to lowdoses of mercury, Med. Lav. 93 (2002) 202–214.
[36] I. Lundberg, M. Högberg, H. Michélsen, G. Nise, C. Hogstedt, Evaluationof the Q16 questionnaire on neurotoxic symptoms and a review of its use,Occup. Environ. Med. 54 (1997) 343–350.
[37] J.A. Lustgarten, R.E. Wenk, Simple, rapid kinetic method for serumcreatinine measurement, Clin. Chem. 18 (1972) 1419–1422.
[38] T. Mathiesen, D.G. Ellingsen, H. Kjuus, Neuropsychological effectsassociated with exposure to mercury vapor among former chloralkaliworkers, Scand. J. Work, Environ. & Health 25 (1999) 342–350.
[39] K.A. Maykoski, M.B. Rubin, A.C. Day, Effects of cigarette smoking onpostural muscle tremor, Nurs. Res. 25 (1976) 39–43.
[40] J.E. McCullough, R. Dick, J. Rutchik, Chronic mercury exposureexamined with a computer-based tremor system, J. Occup. Environ.Med. 43 (2001) 295–300.
[41] J.M. Miller, D.B. Chaffin, R.G. Smith, Subclinical psychomotor andneuromuscular changes in workers exposed to inorganic mercury, Am. Ind.Hyg. Assoc. J. (1975) 725–733.
[42] C.H. Ngim, S.C. Foo, K.W. Boey, J. Jeyaratnam, Chronic neurobeha-vioural effects of elemental mercury in dentists, Br. J. Ind. Med. 49 (1992)782–790.
[43] T.J. Powell, Chronic neurobehavioral effects of mercury poisoning on agroup of Zulu chemical workers, Brain Inj. 14 (2000) 797–814.
[44] H. Roels, J.P. Gennart, R. Lauwerys, J.P. Buchet, J. Malchaire, A. Bernard,Surveillance of workers exposed to mercury vapor: validation of apreviously proposed biological threshold limit value for mercuryconcentration in urine, Am. J. Ind. Med. 7 (1985) 45–71.
[45] H. Roels, S. Abdeladim, E. Ceulemans, R. Lauwerys, Relationshipsbetween the concentrations of mercury in air and in blood or urine inworkers exposed to mercury vapour, Ann. Occup. Hyg. 31 (1987)135–145.
[46] H. Roels, S. Abdeladim, M. Braun, J. Malchaire, R. Lauwerys, Detectionof hand tremor in workers exposed to mercury vapor: a comparative studyof three methods, Environ. Res. 49 (1989) 152–165.
[47] SAS Statistical Software Version 8, SAS Institute Inc., Cary, NC, USA,1999.
[48] F. Schuckmann, Study of preclinical changes in workers exposed toinorganic mercury in chloralkali plants, Int. Arch. Occup. Environ. Health44 (1979) 193–200.
[49] S.M. Shiffman, E.R. Gritz, J. Maltese, M.A. Lee, N.G. Schneider, M.E.Jarvik, Effects of cigarette smoking and oral nicotine on hand tremor, Clin.Pharmacol. Ther. 33 (1983) 800–805.
[50] E. Symanski, G. Sällsten, L. Barregård, Variability in airborne andbiological measures of exposure to mercury in the chloralkali industry:implication for epidemiological studies, Environ. Health Perspect. 108(2000) 569–573.
[51] P. Urban, E. Lukas, L. Benicky, E. Moscovicova, Neurological andelectrophysiological examination on workers exposed to mercury vapors,Neurotoxicology 17 (1996) 191–196.
[52] M.M. Verberk, H.J. Sallé, C.H. Kempler, Tremor in workers with lowexposure to metallic mercury, Am. Ind. Hyg. Assoc. J. 47 (1986) 559–562.
[53] A.M. Williamsson, R.K. Teo, J. Sanderson, Occupational mercuryexposure and its consequences for behaviour, Int. Arch. Environ. Health50 (1982) 273–286.
[54] R.W. Wood, A.B. Weiss, B. Weiss, Hand tremor induced by industrialexposure to inorganic mercury, Arch. Environ. Health 26 (1973) 249–252.
[55] World Health Organization (WHO), Environmental Health Criteria 118,Inorganic Mercury, WHO, Geneva, 1991.