Eotaxin-1 in exhaled breath condensate of stable and unstable asthma patients
Upload
independentCategory
view
0download
0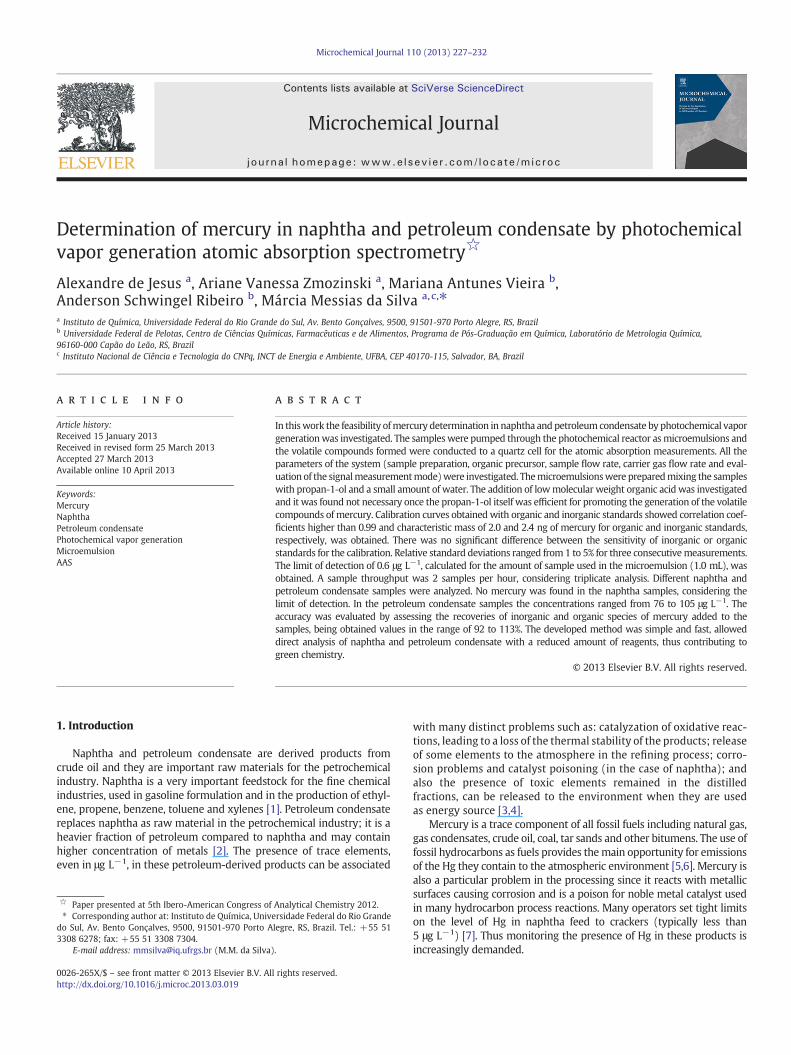
Microchemical Journal 110 (2013) 227–232
Contents lists available at SciVerse ScienceDirect
Microchemical Journal
j ourna l homepage: www.e lsev ie r .com/ locate /mic roc
Determination of mercury in naphtha and petroleum condensate by photochemicalvapor generation atomic absorption spectrometry☆
Alexandre de Jesus a, Ariane Vanessa Zmozinski a, Mariana Antunes Vieira b,Anderson Schwingel Ribeiro b, Márcia Messias da Silva a,c,⁎a Instituto de Química, Universidade Federal do Rio Grande do Sul, Av. Bento Gonçalves, 9500, 91501-970 Porto Alegre, RS, Brazilb Universidade Federal de Pelotas, Centro de Ciências Químicas, Farmacêuticas e de Alimentos, Programa de Pós-Graduação em Química, Laboratório de Metrologia Química,96160-000 Capão do Leão, RS, Brazilc Instituto Nacional de Ciência e Tecnologia do CNPq, INCT de Energia e Ambiente, UFBA, CEP 40170-115, Salvador, BA, Brazil
☆ Paper presented at 5th Ibero-American Congress of⁎ Corresponding author at: Instituto de Química, Univ
do Sul, Av. Bento Gonçalves, 9500, 91501-970 Porto A3308 6278; fax: +55 51 3308 7304.
E-mail address: [email protected] (M.M. da Silva)
0026-265X/$ – see front matter © 2013 Elsevier B.V. Alhttp://dx.doi.org/10.1016/j.microc.2013.03.019
a b s t r a c t
a r t i c l e i n f oArticle history:Received 15 January 2013Received in revised form 25 March 2013Accepted 27 March 2013Available online 10 April 2013
Keywords:MercuryNaphthaPetroleum condensatePhotochemical vapor generationMicroemulsionAAS
In thiswork the feasibility ofmercury determination in naphtha and petroleumcondensate by photochemical vaporgenerationwas investigated. The sampleswere pumped through the photochemical reactor asmicroemulsions andthe volatile compounds formed were conducted to a quartz cell for the atomic absorption measurements. All theparameters of the system (sample preparation, organic precursor, sample flow rate, carrier gas flow rate and eval-uation of the signalmeasurementmode)were investigated. Themicroemulsionswere preparedmixing the sampleswith propan-1-ol and a small amount of water. The addition of lowmolecular weight organic acid was investigatedand it was found not necessary once the propan-1-ol itself was efficient for promoting the generation of the volatilecompounds of mercury. Calibration curves obtained with organic and inorganic standards showed correlation coef-ficients higher than 0.99 and characteristic mass of 2.0 and 2.4 ng of mercury for organic and inorganic standards,respectively, was obtained. There was no significant difference between the sensitivity of inorganic or organicstandards for the calibration. Relative standard deviations ranged from1 to 5% for three consecutivemeasurements.The limit of detection of 0.6 μg L−1, calculated for the amount of sample used in the microemulsion (1.0 mL), wasobtained. A sample throughput was 2 samples per hour, considering triplicate analysis. Different naphtha andpetroleum condensate samples were analyzed. No mercury was found in the naphtha samples, considering thelimit of detection. In the petroleum condensate samples the concentrations ranged from 76 to 105 μg L−1. Theaccuracy was evaluated by assessing the recoveries of inorganic and organic species of mercury added to thesamples, being obtained values in the range of 92 to 113%. The developed method was simple and fast, alloweddirect analysis of naphtha and petroleum condensate with a reduced amount of reagents, thus contributing togreen chemistry.
© 2013 Elsevier B.V. All rights reserved.
1. Introduction
Naphtha and petroleum condensate are derived products fromcrude oil and they are important raw materials for the petrochemicalindustry. Naphtha is a very important feedstock for the fine chemicalindustries, used in gasoline formulation and in the production of ethyl-ene, propene, benzene, toluene and xylenes [1]. Petroleum condensatereplaces naphtha as raw material in the petrochemical industry; it is aheavier fraction of petroleum compared to naphtha and may containhigher concentration of metals [2]. The presence of trace elements,even in μg L−1, in these petroleum-derived products can be associated
Analytical Chemistry 2012.ersidade Federal do Rio Grandelegre, RS, Brazil. Tel.: +55 51
.
l rights reserved.
with many distinct problems such as: catalyzation of oxidative reac-tions, leading to a loss of the thermal stability of the products; releaseof some elements to the atmosphere in the refining process; corro-sion problems and catalyst poisoning (in the case of naphtha); andalso the presence of toxic elements remained in the distilledfractions, can be released to the environment when they are usedas energy source [3,4].
Mercury is a trace component of all fossil fuels including natural gas,gas condensates, crude oil, coal, tar sands and other bitumens. The use offossil hydrocarbons as fuels provides themain opportunity for emissionsof the Hg they contain to the atmospheric environment [5,6]. Mercury isalso a particular problem in the processing since it reacts with metallicsurfaces causing corrosion and is a poison for noble metal catalyst usedin many hydrocarbon process reactions. Many operators set tight limitson the level of Hg in naphtha feed to crackers (typically less than5 μg L−1) [7]. Thus monitoring the presence of Hg in these products isincreasingly demanded.

228 A. de Jesus et al. / Microchemical Journal 110 (2013) 227–232
The main problems of the determination of Hg in these samplesare the fact that they are very complex and Hg is found in very lowlevels, requiring the use of highly sensitive techniques. There arefew works in the literature concerning Hg determination in thesesamples. The direct analysis of naphtha and petroleum condensateafter dilution of the samples with xylene by ICP-MS was proposedby Olsen et al. [8]. These authors reported that samples could beanalyzed directly without pretreatment and the elements weredetermined simultaneously. However the standard deviation for Hgwas very high, probably due to the instability of this element in or-ganic solvent and possibly some memory effects. The emulsificationof the samples with Triton X-100 was also proposed: it was reportedthat with the formation of emulsions a stability of at least one hourwas obtained [9]. With the use of GF AAS, which is a techniqueadequate for complex matrices, and using Pd solution as chemicalmodifier, Santos et al. [10] used detergentless microemulsion as sam-ple preparation and pre-concentrated Hg by multiple injections in thegraphite tube obtaining a limit of detection of 0.78 μg L−1. Ceccarelliet al. [11] analyzed naphtha samples directly in the graphite tube forHg determination obtaining a limit of detection of 32 μg kg−1.
The formation and analysis of emulsions or microemulsions havebeen successfully applied for the preparation of oil samples, due to thehomogeneous dispersion and stabilization of the oil microdroplets inthe aqueous phase, which brings the viscosity close to that of anaqueous solution and reduces the organic load of the system. Besides,it allows the use of aqueous standards for calibration instead of expen-sive and instable organometallic standards. This technique has beenapplied for determination of other elements in petroleum derivatives,as naphtha and petroleum condensate [1,3,12–14].
The use of methods based on vapor generation as sample intro-duction can offer important advantages for analysis of complex ma-trices, such as petroleum derivatives. With the previous separationbetween the analyte and the matrix and efficiency in sample intro-duction, great improvement in the limit of detection can be achievedand some serious spectroscopic and/or matrix interferences elimi-nated [15]. The main vapor generation methods (as cold vapor andhydride generation) normally make use of expensive and instable re-agents, as tetrahydroborate (NaBH4). Other disadvantages are thatfew elements can be converted to volatile compounds, the presenceof transition metals (as Ni, Co and Cu) can cause the decompositionof the analyte hydride and themain reductor used, NaBH4, is a poten-tial source of contamination [16]. Besides, the complete digestion ofthese organic samples is frequently required. There are a few worksabout determination of Hg in petroleum derivates (gasoline sam-ples) using chemical vapor generation without digestion procedures[17,18]. Due to all the aspects cited the development of alternativevapor generation systems for the determination of trace elementsin complex samples is still necessary in atomic spectrometry.
An alternative method based on photochemical vapor generation(PVG) was proposed [15]. This method consists in the formation ofanalyte volatile compounds from the sample by the interaction be-tween an organic precursor added to the sample and the ultravioletlight from the photochemical reactor. Then, the obtained volatilecompounds are separated from the residual solution and carried tothe detection system. In 2007, He et al. [19] published a critical eval-uation of the applications of PVG in atomic spectrometry and discus-sion about the advances of the technique. The authors emphasizedseveral advantages of the method such as no need of using relativelyexpensive and/or unstable reagents such as tetrahydroborate, thatmakes the method simpler, greener and in most cases cost-effective,besides the expanded number of detectable elements. Moreover, dueto the higher tolerance to interferences, a drastic digestion of the sam-ple is often unnecessary, as in the case of Hg determination in biologicaltissues solubilized with formic acid [20,21] or tetramethylammoniumhydroxide [21]. Other examples are the direct determination of Hg inethanol fuel [22] and wine and liquors [23].
In ten years of existence, several investigations have been done thathelp the understanding of the process occurring during photochemicalvapor generation. However, there are still few applications to real sam-ples. Based on the best of our knowledge, the use of PVG for determina-tion of Hg in petroleum derivatives has not been published yet.
The present work proposes the use of the photochemical vaporgeneration coupled with atomic absorption spectrometry for the directdetermination of Hg in naphtha and petroleum condensate samples.The objective is to obtain a simple, fast and accurate method usingdetergentless microemulsions as sample preparation, avoiding diges-tion procedures.
2. Experimental
2.1. Instrumentation
A photochemical reactor, consisting of spiral quartz tubing(115 cm × 1.3 mm i.d × 3.0 mm o.d, Internal volume: 2.3 mL)wrapped around of a low-pressure Hg vapor UV lamp (254 nm,18 W, TUV PL-L, Philips, Poland), was constructed.
Samples were propelled through the photochemical reactor with theassistance of a Reglo peristaltic pump (Ismatec, Switzerland). A flow ofnitrogen (Air liquide, Canoas, Brazil) was introduced in the line afterthe photochemical reactor to carry the volatile species; the flow ratewas controlled by a flow meter (Cole Parmer, Vernon Hills, IL, USA).The volatile species formed mixed with the nitrogen were introducedin a gas–liquid separator to separate the residual waste from the gaseousphase. After the separation, the volatile species were transported to aquartz tube (10 mm i.d × 10 cm length) for atomic absorptionmeasure-ments. Measurements were performed with an AAS 6 Vario Atomicabsorption spectrometer (Analytik Jena, Jena, Germany) equipped witha deuterium background corrector. An Hg hollow cathode lamp (NarvaG.L.E., Berlin, Germany) was used as line source, operating at 5 mA andslit of 1.2 nm, and the wavelength was set at 253.7 nm. Measurementswere available in peak height mode. A schematic of the system is illus-trated in Fig. 1.
2.2. Reagents and samples
Analytical grade reagentswere used for all experiments. The inorganicworking standards were daily prepared by dilution of the 1000 mg L−1
Hg stock solution (Mercury (II) nitrate, Merck, Darmstadt, Germany)with distilled, deionized water with a specific resistivity of 18 MΩ.cmobtained from a Milli-Q water purification system (Millipore, Bedford,MA, USA). The organic working standards were prepared by dilution ofthe 100 μg g−1 Hg stock solution (Mercury Alkyl Dithiocarbamate,Conostan, Ponca City, OK, USA) with propan-1-ol (Merck). Formic acid85% (v/v) (Synth, Diadema, SP, Brazil) was investigated as lowmolecularweight organic precursor (LMWOP) to obtain the photochemical vaporgeneration. Propan-1-ol and butan-1-ol (J.T. Baker, USA) were used inthe microemulsion preparation. Naphtha and petroleum condensateswere provided by Brazilian refineries.
2.3. Sample preparation
The sample preparation consisted in the formation of 2.0 mL ofmicroemulsion. The adopted composition for the microemulsions was:sample (50% v/v), propan-1-ol (48% v/v) and water (2% v/v). In themicroemulsions for calibration the inorganic or organic Hg standards(0.0, 25.0, 50.0, 75.0 and 100.0 μg L−1) were mixed just with propan-1-ol. Recovery tests with inorganic and organic Hg standards have beenperformed for one naphtha and two petroleum condensate samples.In the microemulsion preparation, the microemulsified sampleswere spiked with 100 and 200 ng of inorganic or organic standards.For all measurements the microemulsions were prepared in triplicate

Fig. 1. Schematic of the experimental PVG system.
229A. de Jesus et al. / Microchemical Journal 110 (2013) 227–232
(n = 3). The microemulsions were analyzed immediately after thepreparation.
Fig. 2. Influence of organic precursors on the absorbance signal of 200 ng Hg added tonaphtha microemulsion. All microemulsions contained 50% (v/v) of naphtha and thefollowing reagents: A) 30% propan-1-ol + 20% formic acid; B) 30% butan-1-ol + 20%formic acid; C) 50% propan-1-ol; D) 50% butan-1-ol; E) 50% propan-1-ol (measure-ment carried out without UV radiation). Total volume of microemulsion: 2.0 mL.
3. Results and discussion
3.1. Sample preparation aspects
The most appropriate sample preparation for the naphtha andpetroleum condensate samples was the formation of detergentlessmicroemulsions. In the microemulsified medium the stabilization ofhydrophilic or hydrophobic compounds is either possible, besidesthe facility of preparation and feasibility of addition of either inorganicor organic standards [24]. In all the detergentless microemulsionsthe amount of sample (naphtha or petroleum condensate) was 50%(v/v). Initially, the necessity of addition of organic precursors to themicroemulsions has been investigated. Some Hg spiked microemulsionswere prepared adding 20% (v/v) of organic precursor (formic acid) to50% (v/v) of the sample spiked with 200 ng of Hg standard and thevolume completed at 100% (v/v) with propan-1-ol or butan-1-ol.Formic acid was chosen because it is themost used organic precursorin the analysis by photochemical vapor generation; it is reported thatthis acid presents a fast decomposition under UV irradiation, whichgives rise to the formation of reducing species more easily usingshort UV irradiation times [25,26]. Tests without addition of formicacid and also without the UV irradiation were carried out. Theabsorbance signals obtained for the spiked Hg added to naphthamicroemulsions are presented in Fig. 2. It can be seen that withoutthe use of formic acid (experiments C and D) there were an increasein the absorbance signals. In the literature the use of alcohols asorganic precursor was already described [27] instead of the low mo-lecular weight organic acids, as formic acid. Li et al. [23] proposed amethod for determination of Hg in wine and liquor samples withoutthe use of organic precursor, associating the generatedHg to the ethanolpresent in these samples. In this work, propan-1-ol and butan-1-ol,which were used in the preparation of the microemulsion, could beused as organic precursors for the photochemical vapor generationof Hg from the samples. This result was very useful because thesample preparation could be simplified. After this experimentpropan-1-ol was adopted as organic precursor in the followingmeasurements. Butan-1-ol can also be used with almost similarresults. As expected, no signal can be detected without the use ofUV irradiation (experiment E).
Themicroemulsion adopted, containing 50% (v/v) sample, 48% (v/v)propan-1-ol and 2% (v/v) water, was stable for at least 24 h. The use ofmineral acids, that may increase the stability of the analyte in themicroemulsion [1,3,4,12,14], was not used in this work becausesome authors [28,29] observed that the presence of mineral acids(HNO3 and HCl), even at low concentration, drastically suppressesvapor generation by radical formation. For this reason, the stabilityof the analyte in the microemulsion was not investigated, and themicroemulsions were analyzed immediately after the preparation, asdescribed above.
3.2. Optimization of PVG conditions
The conditions of PVG have been optimized with microemulsionsof naphtha samples spiked with 200 ng Hg. The first parameter opti-mized was the sample flow rate. By adjusting the sample flow rate,different residence times of the sample in the reactor were achieved.As can be seen in the Fig. 3a, the lower is the flow rate the higher isthe absorbance signal in the investigated range, probably due tothe higher exposition time of the sample to UV radiation. Howevera sample flow rate of 3.5 mL min−1 (4 min of analysis) was choseninstead of 2.4 mL min−1, taken into account the excessive time ofanalysis achieved with the last condition (around of 8 min).
After the optimization of the sample flow rate, the optimization ofthe carrier gas flow rate was carried out (Fig. 3b). The range investigat-edwas from theminimum flow rate possible to usewith the flowmeter(45 mL min−1) up to 138 mL min−1.With the increase of theflow ratethe absorbance signal of Hg started to decrease, because the residencetime of the atomic cloud in the absorption cell decreased. Using theminimum flow rate, the highest values of absorbance were obtainedbut in some experiments the solution almost stopped within the trans-port tube because the flow ratewas very low. A little increase in the car-rier gasflow rate could avoid this problem. Thus the carrier gasflow ratewas set at 58 mL min−1. In this last condition, a better profile of the ab-sorbance signal was also obtained, as shown in Fig. 4.
3.3. Figures of merit
All measurements were obtained in peak area and peak height. Thesensitivity in peak area was higher than peak height, but the standarddeviationwas higher in peak area, resulting in a higher limit of detection
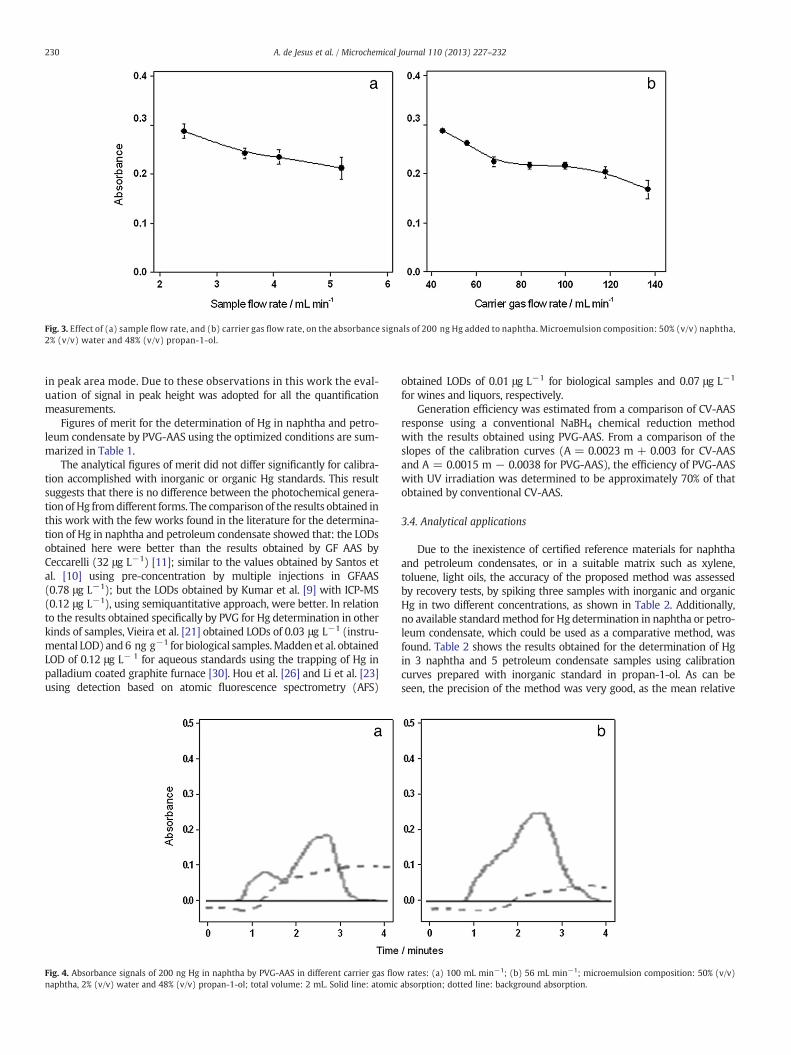
Fig. 3. Effect of (a) sample flow rate, and (b) carrier gas flow rate, on the absorbance signals of 200 ng Hg added to naphtha. Microemulsion composition: 50% (v/v) naphtha,2% (v/v) water and 48% (v/v) propan-1-ol.
230 A. de Jesus et al. / Microchemical Journal 110 (2013) 227–232
in peak area mode. Due to these observations in this work the eval-uation of signal in peak height was adopted for all the quantificationmeasurements.
Figures of merit for the determination of Hg in naphtha and petro-leum condensate by PVG-AAS using the optimized conditions are sum-marized in Table 1.
The analytical figures of merit did not differ significantly for calibra-tion accomplished with inorganic or organic Hg standards. This resultsuggests that there is no difference between the photochemical genera-tion ofHg fromdifferent forms. The comparison of the results obtained inthis work with the few works found in the literature for the determina-tion of Hg in naphtha and petroleum condensate showed that: the LODsobtained here were better than the results obtained by GF AAS byCeccarelli (32 μg L−1) [11]; similar to the values obtained by Santos etal. [10] using pre-concentration by multiple injections in GFAAS(0.78 μg L−1); but the LODs obtained by Kumar et al. [9] with ICP-MS(0.12 μg L−1), using semiquantitative approach, were better. In relationto the results obtained specifically by PVG for Hg determination in otherkinds of samples, Vieira et al. [21] obtained LODs of 0.03 μg L−1 (instru-mental LOD) and 6 ng g−1 for biological samples.Madden et al. obtainedLOD of 0.12 μg L− 1 for aqueous standards using the trapping of Hg inpalladium coated graphite furnace [30]. Hou et al. [26] and Li et al. [23]using detection based on atomic fluorescence spectrometry (AFS)
Fig. 4. Absorbance signals of 200 ng Hg in naphtha by PVG-AAS in different carrier gas flownaphtha, 2% (v/v) water and 48% (v/v) propan-1-ol; total volume: 2 mL. Solid line: atomic
obtained LODs of 0.01 μg L−1 for biological samples and 0.07 μg L−1
for wines and liquors, respectively.Generation efficiency was estimated from a comparison of CV-AAS
response using a conventional NaBH4 chemical reduction methodwith the results obtained using PVG-AAS. From a comparison of theslopes of the calibration curves (A = 0.0023 m + 0.003 for CV-AASand A = 0.0015 m − 0.0038 for PVG-AAS), the efficiency of PVG-AASwith UV irradiation was determined to be approximately 70% of thatobtained by conventional CV-AAS.
3.4. Analytical applications
Due to the inexistence of certified reference materials for naphthaand petroleum condensates, or in a suitable matrix such as xylene,toluene, light oils, the accuracy of the proposed method was assessedby recovery tests, by spiking three samples with inorganic and organicHg in two different concentrations, as shown in Table 2. Additionally,no available standardmethod for Hg determination in naphtha or petro-leum condensate, which could be used as a comparative method, wasfound. Table 2 shows the results obtained for the determination of Hgin 3 naphtha and 5 petroleum condensate samples using calibrationcurves prepared with inorganic standard in propan-1-ol. As can beseen, the precision of the method was very good, as the mean relative
rates: (a) 100 mL min−1; (b) 56 mL min−1; microemulsion composition: 50% (v/v)absorption; dotted line: background absorption.
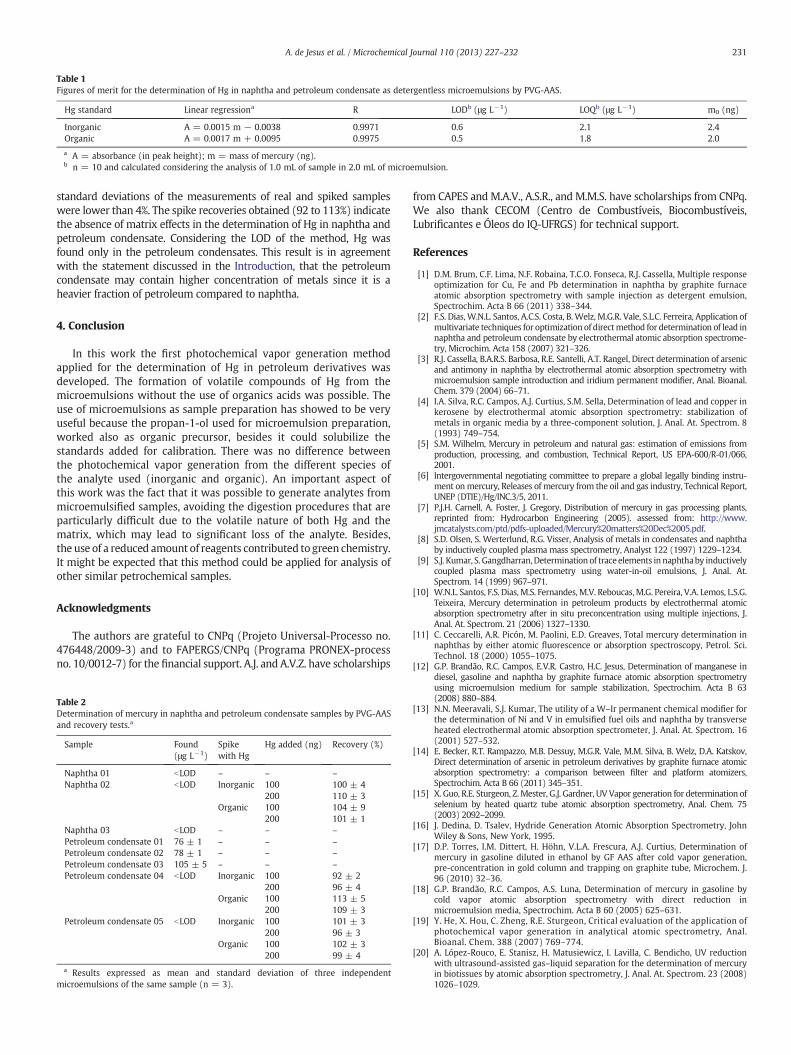
Table 1Figures of merit for the determination of Hg in naphtha and petroleum condensate as detergentless microemulsions by PVG-AAS.
Hg standard Linear regressiona R LODb (μg L−1) LOQb (μg L−1) m0 (ng)
Inorganic A = 0.0015 m − 0.0038 0.9971 0.6 2.1 2.4Organic A = 0.0017 m + 0.0095 0.9975 0.5 1.8 2.0
a A = absorbance (in peak height); m = mass of mercury (ng).b n = 10 and calculated considering the analysis of 1.0 mL of sample in 2.0 mL of microemulsion.
231A. de Jesus et al. / Microchemical Journal 110 (2013) 227–232
standard deviations of the measurements of real and spiked sampleswere lower than 4%. The spike recoveries obtained (92 to 113%) indicatethe absence of matrix effects in the determination of Hg in naphtha andpetroleum condensate. Considering the LOD of the method, Hg wasfound only in the petroleum condensates. This result is in agreementwith the statement discussed in the Introduction, that the petroleumcondensate may contain higher concentration of metals since it is aheavier fraction of petroleum compared to naphtha.
4. Conclusion
In this work the first photochemical vapor generation methodapplied for the determination of Hg in petroleum derivatives wasdeveloped. The formation of volatile compounds of Hg from themicroemulsions without the use of organics acids was possible. Theuse of microemulsions as sample preparation has showed to be veryuseful because the propan-1-ol used for microemulsion preparation,worked also as organic precursor, besides it could solubilize thestandards added for calibration. There was no difference betweenthe photochemical vapor generation from the different species ofthe analyte used (inorganic and organic). An important aspect ofthis work was the fact that it was possible to generate analytes frommicroemulsified samples, avoiding the digestion procedures that areparticularly difficult due to the volatile nature of both Hg and thematrix, which may lead to significant loss of the analyte. Besides,the use of a reduced amount of reagents contributed to green chemistry.It might be expected that this method could be applied for analysis ofother similar petrochemical samples.
Acknowledgments
The authors are grateful to CNPq (Projeto Universal-Processo no.476448/2009-3) and to FAPERGS/CNPq (Programa PRONEX-processno. 10/0012-7) for the financial support. A.J. and A.V.Z. have scholarships
Table 2Determination of mercury in naphtha and petroleum condensate samples by PVG-AASand recovery tests.a
Sample Found(μg L−1)
Spikewith Hg
Hg added (ng) Recovery (%)
Naphtha 01 bLOD – – –
Naphtha 02 bLOD Inorganic 100 100 ± 4200 110 ± 3
Organic 100 104 ± 9200 101 ± 1
Naphtha 03 bLOD – – –
Petroleum condensate 01 76 ± 1 – – –
Petroleum condensate 02 78 ± 1 – – –
Petroleum condensate 03 105 ± 5 – – –
Petroleum condensate 04 bLOD Inorganic 100 92 ± 2200 96 ± 4
Organic 100 113 ± 5200 109 ± 3
Petroleum condensate 05 bLOD Inorganic 100 101 ± 3200 96 ± 3
Organic 100 102 ± 3200 99 ± 4
a Results expressed as mean and standard deviation of three independentmicroemulsions of the same sample (n = 3).
from CAPES and M.A.V., A.S.R., and M.M.S. have scholarships from CNPq.We also thank CECOM (Centro de Combustíveis, Biocombustíveis,Lubrificantes e Óleos do IQ-UFRGS) for technical support.
References
[1] D.M. Brum, C.F. Lima, N.F. Robaina, T.C.O. Fonseca, R.J. Cassella, Multiple responseoptimization for Cu, Fe and Pb determination in naphtha by graphite furnaceatomic absorption spectrometry with sample injection as detergent emulsion,Spectrochim. Acta B 66 (2011) 338–344.
[2] F.S. Dias, W.N.L. Santos, A.C.S. Costa, B.Welz, M.G.R. Vale, S.L.C. Ferreira, Application ofmultivariate techniques for optimization of directmethod for determination of lead innaphtha and petroleum condensate by electrothermal atomic absorption spectrome-try, Microchim. Acta 158 (2007) 321–326.
[3] R.J. Cassella, B.A.R.S. Barbosa, R.E. Santelli, A.T. Rangel, Direct determination of arsenicand antimony in naphtha by electrothermal atomic absorption spectrometry withmicroemulsion sample introduction and iridium permanent modifier, Anal. Bioanal.Chem. 379 (2004) 66–71.
[4] I.A. Silva, R.C. Campos, A.J. Curtius, S.M. Sella, Determination of lead and copper inkerosene by electrothermal atomic absorption spectrometry: stabilization ofmetals in organic media by a three-component solution, J. Anal. At. Spectrom. 8(1993) 749–754.
[5] S.M. Wilhelm, Mercury in petroleum and natural gas: estimation of emissions fromproduction, processing, and combustion, Technical Report, US EPA-600/R-01/066,2001.
[6] Intergovernmental negotiating committee to prepare a global legally binding instru-ment onmercury, Releases of mercury from the oil and gas industry, Technical Report,UNEP (DTIE)/Hg/INC.3/5, 2011.
[7] P.J.H. Carnell, A. Foster, J. Gregory, Distribution of mercury in gas processing plants,reprinted from: Hydrocarbon Engineering (2005). assessed from: http://www.jmcatalysts.com/ptd/pdfs-uploaded/Mercury%20matters%20Dec%2005.pdf.
[8] S.D. Olsen, S. Werterlund, R.G. Visser, Analysis of metals in condensates and naphthaby inductively coupled plasma mass spectrometry, Analyst 122 (1997) 1229–1234.
[9] S.J. Kumar, S. Gangdharran,Determination of traceelements in naphthaby inductivelycoupled plasma mass spectrometry using water-in-oil emulsions, J. Anal. At.Spectrom. 14 (1999) 967–971.
[10] W.N.L. Santos, F.S. Dias,M.S. Fernandes,M.V. Reboucas,M.G. Pereira, V.A. Lemos, L.S.G.Teixeira, Mercury determination in petroleum products by electrothermal atomicabsorption spectrometry after in situ preconcentration using multiple injections, J.Anal. At. Spectrom. 21 (2006) 1327–1330.
[11] C. Ceccarelli, A.R. Picón, M. Paolini, E.D. Greaves, Total mercury determination innaphthas by either atomic fluorescence or absorption spectroscopy, Petrol. Sci.Technol. 18 (2000) 1055–1075.
[12] G.P. Brandão, R.C. Campos, E.V.R. Castro, H.C. Jesus, Determination of manganese indiesel, gasoline and naphtha by graphite furnace atomic absorption spectrometryusing microemulsion medium for sample stabilization, Spectrochim. Acta B 63(2008) 880–884.
[13] N.N. Meeravali, S.J. Kumar, The utility of a W–Ir permanent chemical modifier forthe determination of Ni and V in emulsified fuel oils and naphtha by transverseheated electrothermal atomic absorption spectrometer, J. Anal. At. Spectrom. 16(2001) 527–532.
[14] E. Becker, R.T. Rampazzo, M.B. Dessuy, M.G.R. Vale, M.M. Silva, B. Welz, D.A. Katskov,Direct determination of arsenic in petroleum derivatives by graphite furnace atomicabsorption spectrometry: a comparison between filter and platform atomizers,Spectrochim. Acta B 66 (2011) 345–351.
[15] X. Guo, R.E. Sturgeon, Z.Mester, G.J. Gardner, UV Vapor generation for determination ofselenium by heated quartz tube atomic absorption spectrometry, Anal. Chem. 75(2003) 2092–2099.
[16] J. Dedina, D. Tsalev, Hydride Generation Atomic Absorption Spectrometry, JohnWiley & Sons, New York, 1995.
[17] D.P. Torres, I.M. Dittert, H. Höhn, V.L.A. Frescura, A.J. Curtius, Determination ofmercury in gasoline diluted in ethanol by GF AAS after cold vapor generation,pre-concentration in gold column and trapping on graphite tube, Microchem. J.96 (2010) 32–36.
[18] G.P. Brandão, R.C. Campos, A.S. Luna, Determination of mercury in gasoline bycold vapor atomic absorption spectrometry with direct reduction inmicroemulsion media, Spectrochim. Acta B 60 (2005) 625–631.
[19] Y. He, X. Hou, C. Zheng, R.E. Sturgeon, Critical evaluation of the application ofphotochemical vapor generation in analytical atomic spectrometry, Anal.Bioanal. Chem. 388 (2007) 769–774.
[20] A. López-Rouco, E. Stanisz, H. Matusiewicz, I. Lavilla, C. Bendicho, UV reductionwith ultrasound-assisted gas–liquid separation for the determination of mercuryin biotissues by atomic absorption spectrometry, J. Anal. At. Spectrom. 23 (2008)1026–1029.

232 A. de Jesus et al. / Microchemical Journal 110 (2013) 227–232
[21] M.A. Vieira, A.S. Ribeiro, A.J. Curtius, R.E. Sturgeon, Determination of totalmercury andmethylmercury in biological samples by photochemical vapor generation, Anal.Bioanal. Chem. 388 (2007) 837–847.
[22] C.S. Silva, E.Q. Oreste, A.M. Nunes, M.A. Vieira, A.S. Ribeiro, Determination of mercuryin ethanol biofuel by photochemical vapor generation, J. Anal. At. Spectrom. 27 (2012)689–694.
[23] Y. Li, C.B. Zheng, Q. Ma, L. Wu, C.W. Hu, X.D. Hou, Sample matrix-assisted photo-induced chemical vapor generation: a reagent free green analytical method forultrasensitive detection of mercury in wine or liquor samples, J. Anal. At. Spectrom.21 (2006) 82–85.
[24] A. Jesus, M.M. Silva, M.G.R. Vale, The use of microemulsion for determination ofsodium and potassium in biodiesel by flame atomic absorption spectrometry,Talanta 74 (2008) 1378–1384.
[25] P. Grinberg, Z.Mester, R.E. Sturgeon,A. Ferretti,Generation of volatile cobalt species byUV photoreduction and their tentative identification, J. Anal. At. Spectrom. 23 (2008)583–587.
[26] X. Hou, X. Ai, X. Jiang, P. Deng, C. Zheng, Y. Lv, UV light-emitting-diode photochemicalmercury vapor generation for atomic fluorescence spectrometry, Analyst 137 (2012)686–690.
[27] C. Han, C. Zheng, J.Wang, G. Cheng, Y. Lv, X.Hou, Photo-induced cold vapor generationwith low molecular weight alcohol, aldehyde, or carboxylic acid for atomic fluores-cence spectrometric determination of mercury, Anal. Bioanal. Chem. 388 (2007)825–830.
[28] A.S. Ribeiro,M.A. Vieira, S.Willie, A.J. Curtius, R.E. Sturgeon, Ultrasound-assisted vaporgeneration of mercury, Anal. Bioanal. Chem. 388 (2007) 849–857.
[29] P. Grinberg, R.E. Sturgeon, Ultra-trace determination of iodine in sediments andbiological material using UV photochemical generation-inductively coupled plasmamass spectrometry, Spectrochim. Acta B 64 (2009) 235–241.
[30] J.T. Madden, N. Fitzgerald, Investigation of ultraviolet photolysis vapor generationwith in-atomizer trapping graphite furnace atomic absorption spectrometry forthe determination of mercury, Spectrochim. Acta B 64 (2009) 925–927.
Copyright © 2022 FDOKUMEN