
Photochemical production of hydrogen peroxide and methylhydroperoxide in coastal waters
Upload
independentCategory
view
0download
0
Atmospheric Environment 37 (2003) 4179–4194
Comparison of photochemical mechanisms for airquality modeling
Pedro Jimeneza, Jose M. Baldasanoa, Donald Dabdubb,*aEnvironmental Modeling Laboratory, Universitat Polit"ecnica de Catalunya, Avda. Diagonal, 647, Planta 10, Barcelona 08028, SpainbDepartment of Mechanical and Aerospace Engineering, Henry Samueli School of Engineering, University of California at Irvine,
Irvine, CA 92697-3975, USA
Received 18 February 2003; accepted 7 July 2003
Abstract
Photochemical mechanisms are a critical module of air quality models. In the past 20 years, several mechanisms have
been developed to study the chemistry of the troposphere. This work compares several state-of-the-science
photochemical mechanisms (including LCC, CBM-IV, RADM2, EMEP, RACM, SAPRC99, and CACM which have
never been compared before in other studies). Concise descriptions of the chemical schemes are included. The main
difference among existing mechanisms is the lumping technique used to classify organic compounds into surrogate
groups. First, box model calculations are conducted to highlight the features that lead to differences in the modeled
behaviors of photochemical pollutants and their precursors. Results indicate that most chemical schemes yield similar
ozone concentrations. Nevertheless, there are significant discrepancies, mainly in predicted concentration of HNO3,
HO2 and total PAN among model simulations. Finally, the sources of the discrepancy are identified.
r 2003 Elsevier Ltd. All rights reserved.
Keywords: Air quality models; Atmospheric chemistry; Modeling; Ozone; Kinetic mechanisms
1. Introduction
One of the most important components of air quality
models (AQMs) is the photochemical mechanism. A
photochemical mechanism for tropospheric chemistry is
a mathematical description of photochemical processes
of the lower atmosphere through a series of chemical
reactions involving primary and secondary pollutants.
Photochemical mechanisms used in AQMs are not
described in full detail because chemical reactions
produce a large number of intermediate non-stable
compounds, which disappear quickly and are difficult to
detect because of a lack of adequate instrumentation. In
addition, the large amount of potential species inhibits
the creation of a fully described mechanism from a
computational standpoint. Species considered in a
photochemical mechanism are categorized as inorganic
compounds (NOx, Ox, HOx, and SOx) and organic
compounds, mainly volatile organic compounds
(VOCs). The variety of VOCs emitted to the atmosphere
is wide, and its spatial and temporal speciation in
emission inventories is complex. Because of the lack of
detailed information about VOCs in emission inven-
tories, species in the chemical mechanism are not usually
explicit, but lumped. The implementation of a mechan-
ism into an AQM involves the solution of a highly
coupled, non-linear, system of stiff differential equa-
tions. The majority of the computing time for tropo-
spheric gas-phase modeling (80–90%) is consumed
integrating the chemistry of rate equations (Dennis
et al., 1996). Therefore, it is critical to avoid introducing
unnecessary complexity into the photochemical mechan-
ism. Divergence points among different chemical
schemes are: (1) formulation of the reaction mechanism,
(2) rate constants for the reactions and their temperature
and pressure dependencies, and (3) temporal integration
ARTICLE IN PRESS
*Corresponding author. Tel.: +1-949-824-6126; fax: +1-949-
824-8585.
E-mail address: [email protected] (D. Dabdub).
1352-2310/$ - see front matter r 2003 Elsevier Ltd. All rights reserved.
doi:10.1016/S1352-2310(03)00567-3

of the reaction rates by the chemical solver (Kuhn et al.,
1998). In this paper, the results of a comparison of seven
photochemical models are presented. Table 1 lists the
mechanism studied, their main characteristics and the
AQMs where they are implemented (Russell and
Dennis, 2000). Key species followed in this study are
O3, NO, NO2, NO3, HNO3, peroxyacetyl nitrate (PAN),
HO2, H2O2 and two organic compounds: ethene and
isoprene. The election of these species is based on other
works (Gao et al., 1996; Olson et al., 1997; Kuhn et al.,
1998; Luecken et al., 1999), and comprises the most
important photooxidant species.
2. Previous comparisons of mechanisms
It is well known that different photochemical mechan-
isms produce dissimilar results. Some authors have
compared several schemes throughout the past decade.
Jeffries and Tonnesen (1994) compared the CBM-IV
and SAPRC90 using a Lagrangian model, with an
analysis method that includes a mass budget to
determine the origin of the differences between them.
Both mechanisms are based in the same set of
experiments of a photochemical smog chambers study.
The most important discrepancies were found in high
VOC/NOx ratios, producing a smaller amount of O3
with CBM-IV.
Poppe et al. (1996) compared 12 chemical mechanisms
with numeric simulations in a box model. They used five
scenarios, three of them without emissions, to determine
the behavior of reactions in the farthest areas from
emission sources; and two with emissions. Most
mechanisms reported similar O3 levels. On the other
hand, concentrations of PAN, H2O2 and NO3 depended
much on the mechanism used. The difference in the
prediction of concentrations of ozone among all
photochemical mechanisms was of 30%.
Olson et al. (1997) presented the results from the
Intergovernmental Panel on Climate Change (IPCC)
tropospheric photochemical model intercomparison
(PhotoComp). The authors used a 5-day diurnal box
model simulation to compare the mixing ratios of O3,
NO, H2O2 and diurnal values of HO2 and OH.
Photodissociation rates displayed significant differences,
with a root-mean-square (rms) error ranging from 76–
9% for O3 and NO2 to 715% for H2O2 and CH2O.
With in the inclusion of non-methane organic gases in
the simulation, O3 and NOx means and medians
diverged by up to 25%. Models lacking the pressure
and water-vapor pathways of the HO2 self-reactions
tended to predict lower H2O2 mixing ratios in favor of
increased HO2. Differences in HO2, in turn, were
likely due to the inconsistent reaction rates used by the
models for the self-HO2 reaction to yield H2O2, and to
differences in the model-calculated photolysis of H2O2
and CH2O.
Kuhn et al. (1998) compared nine chemical mechan-
isms. The pressure and water-vapor pathways of the
HO2 self-reaction were not included in all mechanisms.
Significant differences in H2O2 predictions were ex-
plained partly by an incorrect use of the HO2 self-
reaction rate constant and by differences in the
treatment of the peroxy radical interactions. One of
the main conclusions was that most chemical schemes
examined yielded similar O3 concentrations, despite
differences in the hydrocarbon lumping. The calculated
concentrations of other longer-lived species like H2O2
and PAN differed considerably (up to 73%). Also, some
of the differences in schemes presented in the compar-
ison reflected differences in numerical solution methods
rather than differences in chemistry.
Luecken et al. (1999) examined the production and
speciation of reactive oxidized nitrogen (NOy) from
three mechanisms. The most important reaction in NOy
chemistry is the oxidation of isoprene, which influences
the production of PAN and organic nitrate. Differences
among mechanisms caused large differences in NOy
concentrations. Nitric acid production during the day
was consistent among mechanisms. PAN concentration
was determined by acyl peroxy radicals (C2O3) rates,
meanwhile NO3 prediction for models varied over a
large range.
Andersson-Skold and Simpson (1999) described the
chemical comparison between the EMEP chemical
scheme and a more comprehensive chemical mechanism,
the IVL. Despite the divergences in the complexities of
the models, predicted ozone levels from both chemical
mechanisms were similar for different scenarios. Differ-
ences in ozone appeared because of the description of
the organic chemistry; IVL treats the chemistry of
each VOC in greater depth, including features as
RONO2 formation and extensive RO2+RO2 chemistry,
not included in EMEP. A major difference between
the schemes was a higher formation of aldehydes in the
IVL scheme, brought about mainly by OH+alkane
reactions.
Tonnesen and Luecken (2000) compared SAPRC99
and CB-IV 99 using a Lagrangian model, OZIPR. They
found that both mechanisms produce similar predictions
for ozone at conditions near the ridgeline of maximum
O3. Nevertheless, CB-IV 99 predicts higher O3 levels for
radical-limited conditions, and SAPRC99 predicts high-
er ozone concentrations for NOx-limited conditions.
Furthermore, there was considerable temporal varia-
bility between the two mechanisms (ozone production is
much more rapid in SAPRC99).
Dodge (2000) reviewed five chemical mechanisms
used in air quality simulation models (the CBM-IV,
the SAPRC mechanism, the RADM2 and RACM
models and a new mechanism called the Morphecule
ARTICLE IN PRESSP. Jimenez et al. / Atmospheric Environment 37 (2003) 4179–41944180
ARTIC
LEIN
PRES
S
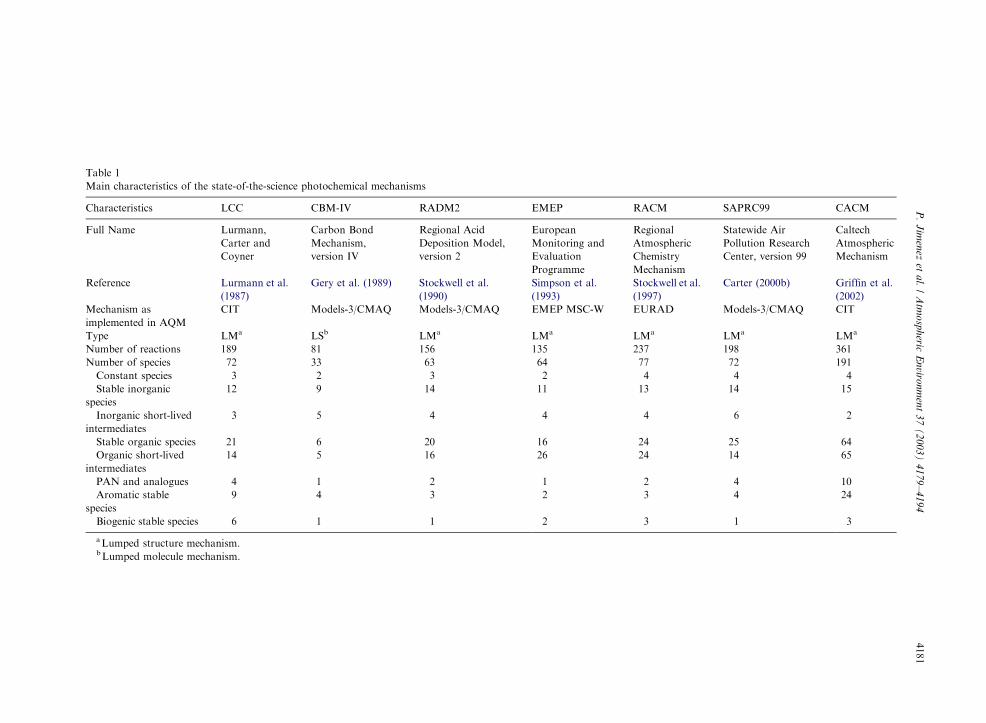
Table 1
Main characteristics of the state-of-the-science photochemical mechanisms
Characteristics LCC CBM-IV RADM2 EMEP RACM SAPRC99 CACM
Full Name Lurmann,
Carter and
Coyner
Carbon Bond
Mechanism,
version IV
Regional Acid
Deposition Model,
version 2
European
Monitoring and
Evaluation
Programme
Regional
Atmospheric
Chemistry
Mechanism
Statewide Air
Pollution Research
Center, version 99
Caltech
Atmospheric
Mechanism
Reference Lurmann et al.
(1987)
Gery et al. (1989) Stockwell et al.
(1990)
Simpson et al.
(1993)
Stockwell et al.
(1997)
Carter (2000b) Griffin et al.
(2002)
Mechanism as
implemented in AQM
CIT Models-3/CMAQ Models-3/CMAQ EMEP MSC-W EURAD Models-3/CMAQ CIT
Type LMa LSb LMa LMa LMa LMa LMa
Number of reactions 189 81 156 135 237 198 361
Number of species 72 33 63 64 77 72 191
Constant species 3 2 3 2 4 4 4
Stable inorganic
species
12 9 14 11 13 14 15
Inorganic short-lived
intermediates
3 5 4 4 4 6 2
Stable organic species 21 6 20 16 24 25 64
Organic short-lived
intermediates
14 5 16 26 24 14 65
PAN and analogues 4 1 2 1 2 4 10
Aromatic stable
species
9 4 3 2 3 4 24
Biogenic stable species 6 1 1 2 3 1 3
aLumped structure mechanism.bLumped molecule mechanism.
P.
Jim
enez
eta
l./
Atm
osp
heric
En
viron
men
t3
7(
20
03
)4
17
9–
41
94
4181

Mechanism). The mechanisms yielded similar ozone
predictions when exercised under clean tropospheric
conditions as well as under conditions more representa-
tive of polluted boundary layer. Ozone predictions were
found to agree within 10%. Nevertheless, concentrations
of other oxidants such as H2O2 differed considerably.
The novel approaches of this document are that the
comparison presented here includes those chemical
schemes as used by AQMs with the latest available
parameterizations up to date. In addition, CACM
mechanism has never been included previously in a
comparison work. CACM is a mechanism with an
increasing importance since it provides the right specia-
tion of organics necessary for secondary aerosol
production.
3. Photochemical mechanisms
A brief description of the mechanisms as implemented
in the AQMs depicted in Table 1 is presented in this
section, summarizing the main characteristics that
should be underlined and that highlighting their
differences.
The LCC mechanism is presented in Lurmann et al.
(1987). In all, 48 of the species are treated as integrated
species in the kinetic solver. Three of the species (M, O2
and H2O) are treated as constants and 14 of the species
are treated as steady-state species. Aromatic reactions
include a parameterized representation of the aromatic
ring opening products. PAN analogues from non-a-dicarbonyl products are lumped with PAN analogues
formed in other areas of the mechanism. Since the early
LCC mechanism did not include biogenic species, the
modified scheme used in the CIT Airshed Model
(McRae et al., 1992) includes biogenic organic com-
pounds such as isoprene, a-pinene, b-pinene, myrcene, g-carene and limonene and their reactions with OH, O,
NO3 and ozone, and also revises the oxidation of
organic compounds by the reaction with OH, compris-
ing 169 reactions and 65 species.
CBM-IV (Gery et al., 1989) is a lumped-structure
condensed mechanism. Carbon bond approach is
utilized for the lumping of organic species. The
mechanism contains 33 species represented in 81
reactions, and treats the reactions of four different types
of species: inorganic species, explicit organic species,
organic species represented by carbon surrogates, and
organic species that are represented by molecular
surrogates. Inorganic chemistry is represented explicitly
with no lumping. Organics represented explicitly are
formaldehyde, ethene and isoprene. Carbon bond
surrogates describe the chemistry of different types of
carbon bonds commonly found as parts of larger
molecules. CBM-IV is widely used in research and
regulatory AQMs as Models-3/CMAQ (Byun and
Ching, 1999), and this will be the scheme implemented
in this comparison.
RADM2 (Stockwell et al., 1990) is built on the
RADM1 scheme (Stockwell, 1986). It includes 156
reactions among 63 species. The most important
upgrades include three classes of higher alkanes, a
detailed treatment of aromatic chemistry, two higher
alkene classes that represent internal and terminal
alkenes, treatment of ketones and dicarbonyl species as
classes distinct from aldehydes, inclusion of isoprene as
an explicit species and a detailed treatment of peroxy
radical–peroxy radical reactions. Inorganic species
include 14 stable species, four reactive intermediates
and three abundant stable species (oxygen, nitrogen and
water). H2 is not included in the mechanism. Atmo-
spheric organic chemistry is represented by 26 stable
species and 16 peroxy radicals. VOCs are grouped
together into a manageable set of VOC classes based on
similarity of oxidation reactivity and emission magni-
tudes (Middleton et al., 1990). Organic compounds are
aggregated into 15 classes of reactive organic species.
The implementation of RADM2 in Models-3/CMAQ is
analogous to that described by Stockwell et al. (1990)
with only two minor modifications: the reaction of OH
with cresol was reformulated to eliminate negative
stoichiometry in the mechanism, and the concentration
of methane is assumed to be constant (Gipson and
Young, 1999).
EMEP (Simpson, 1992; Simpson et al., 1993) is of
particular importance to policy-related studies in Eur-
ope. It uses a lumped molecule approach to represent
organic compounds. Each species in the EMEP mechan-
ism represents a range of species of similar structure and
reactivity. Photodissociation rates for 13 species are
specified in the model as a function of the solar zenith
angle. The EMEP version used is based on Simpson et al.
(1993), but the isoprene mechanism has been updated,
implementing some reactions proposed by Paulson and
Seinfeld (1992). EMEP includes reactions of isoprene
with OH, NO3 and ozone. In addition, eight reactions
and four species proposed by Simpson (1995) have been
added to model the interactions between the peroxy
radicals from the isoprene degradation and HO2. This
updated mechanism includes 135 reactions and 64
species, and is used on the EMEP MSC-W AQM
(Simpson, 1992, 1995), developed to study formation
and transport of ozone over long term periods in
Europe.
RACM (Stockwell et al., 1997) is a completely revised
version of the RADM2. The mechanism includes 17
stable inorganic species, four inorganic intermediates, 32
stable organic species (four of these are primarily of
biogenic origin) and 24 organic intermediates, in 237
reactions. Changes in inorganic chemistry from previous
RADM2 mechanism were relatively small. An accurate
representation of the production of CO2 is excluded
ARTICLE IN PRESSP. Jimenez et al. / Atmospheric Environment 37 (2003) 4179–41944182

both from RADM2 and RACM mechanisms. In
RACM, the VOCs are aggregated into 16 anthropogenic
and three biogenic model species. The grouping of
organic chemical species into the RACM model species
is based on the magnitudes of the emission rates,
similarities in functional groups and the compound’s
reactivity toward OH. The organic chemistry was
revised significantly. The aromatic chemistry was more
widely treated in RACM, including amounts of products
from the aromatic-OH addition that had been ignored in
RADM2. The oxidation mechanism for isoprene, a-pinene, and d-limonene is more detailed and realistic
than that in the RADM2 mechanism. This scheme has
been implemented in the EURAD AQM (Hass, 1991).
The latest version of the SAPRC mechanism,
designated SAPRC99 (Carter, 2000a) represents a
complete update of the SAPRC90 mechanism by Carter
(1990). The mechanism has assignments for 400 types of
VOCs, and can be used to estimate reactivities for 550
VOC categories. The inorganic reactions in the mechan-
ism are essentially the same as those included in previous
versions. A total of 24 model species are used to
represent the reactive organic product species: 11 are
explicit, and 13 represent groups of similar products
using the lumped molecule approach. The PAN
analogue formed from glyoxal is lumped with the rest
of the higher PAN analogues. Isoprene photooxidation
products in the mechanism are included. SAPRC uses
a condensed representation of the reactive organic
oxidation products and a higher condensed representa-
tion of peroxy reactions than does RADM2 or RACM.
The SAPRC99 mechanism used in Models-3/CMAQ
consists of 72 species in 198 reactions, as described in
Carter (2000b).
CACM, developed by Griffin et al. (2002), is the first
detailed mechanism directed toward explicit formation
of the semivolatile products that could constitute
observed secondary organic aerosols (SOAs), and has
been implemented in the CIT airshed model. It includes
a total of 191 species and 361 reactions: 120 fully
integrated species (15 inorganic, 71 reactive organic and
34 unreactive organic), 67 pseudo-steady-state species
(two inorganic and 65 organic); and four fixed-concen-
tration species. The inorganic chemistry within CACM
is derived primarily from the SAPRC99. Primary
organic compounds are lumped in a manner similar to
that described by Stockwell et al. (1997). Oxidation
reactions of surrogate parents are tracked individually.
The lumped model compound corresponding to a given
individual parent hydrocarbon is determined by con-
sidering the size of the molecule, its structural char-
acteristics, its functionality, its reactivity, and its SOA
forming potential. Isoprene is treated explicitly in the
CACM, and methyl-vinyl-ketone and methacrolein are
major oxidation products of isoprene and are included
explicitly. For monoterpenes, CACM incorporates a
class (BIOH) for those monoterpenes that have rela-
tively high SOA yield parameters, and another class
(BIOL) for those with a relatively low SOA-yield.
4. Methodology
The results presented here correspond to a scenario
representing a remote troposphere simulation, since this
is the simplest and straightforward case to analyze and
one that is consistent with previous studies as described
below. This scenario starts from an initial set of trace gas
concentrations without emissions, and is sensitive to the
details of the formulation of organic species and the rate
constants for the reactions in the individual schemes. In
addition, this work is focused on elucidating the
variability of results among published models, and
therefore parameters were chosen to make all mechan-
isms absolutely comparable. The methods used are
similar to those followed by Poppe et al. (2001). The
photolysis rate coefficients are calculated for the long-
itude and latitude of the South Coast Air Basin of
California. Simulations account for diurnally depen-
dence of photolysis rate coefficients. The base tempera-
ture is 298.16K, remaining constant during the
simulation. Calculations are started at 0 LST and cover
the following 24 h; all the same, results show the hours
where solar radiation is present, from 6 LST until 18
LST, since photochemical processes are more active at
this time of the day. The initial concentrations are
derived from Gao et al. (1996) and Seefeld and
Stockwell (1999). All depositions are set to zero in order
to concentrate on differences in the chemical schemes.
Table 2 shows other parameters of the scenarios
modeled.
Simulations are performed using a zero-dimensional
box model. The stiffness of the system of ordinary
differential equations (ODE) requires the use a robust
numerical integrator. The VODE library (Brown et al.,
1989), in its single precision version (SVODE), is chosen
to perform the simulations. Gurciullo et al. (1998),
reported that VODE is a factor of two faster than the
second most efficient solver included in the comparison
for the same tolerated accuracy.
Before summarizing the results, it is worth emphasiz-
ing that this works represents a comparison of models. It
is impossible to know what ‘correct results’ should be
from any atmospheric chemical scheme. Comparison
with smog-chamber data could be a useful complement;
nevertheless, smog chambers also represent a very
artificial system with many unknown influences. Because
of all these reasons, the methodology used in this work
proposes the comparison of models with an average
tendency, and has been widely supported and applied in
the literature (Olson et al., 1997; Kuhn et al., 1998;
among others).
ARTICLE IN PRESSP. Jimenez et al. / Atmospheric Environment 37 (2003) 4179–4194 4183

5. Results
5.1. Inorganic chemistry of nitrogen oxides and ozone
The kinetics of the gas-phase reactions of inorganic
species in the troposphere are relatively well-understood.
For instance, Ox–HOx–NOx interactions are reflected in
a similar way in all mechanisms studied here. Gas-phase
inorganic reactions are described, reviewed and evalu-
ated by DeMore et al. (2000) and Atkinson et al. (1999).
However, there are a few reactions not fully under-
stood that impact the ability to quantify the formation,
cycling and losses of O3 and NOx in the troposphere
(Atkinson, 2000).
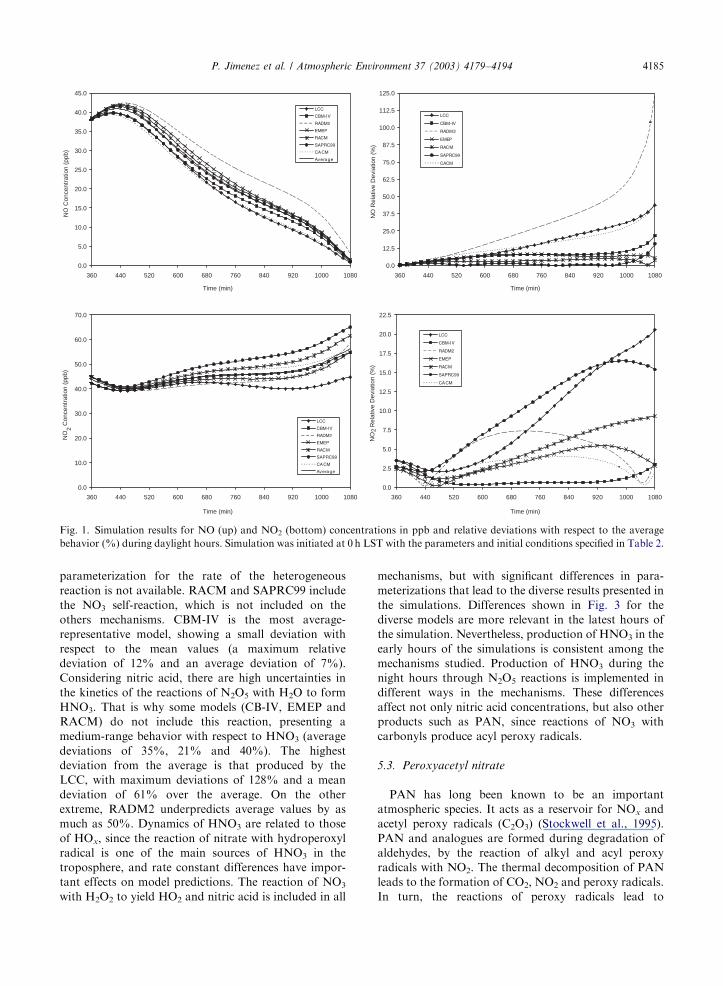
In general, predicted concentrations of NOx for all
models show only small differences (Fig. 1). RADM2
has by far the highest NO concentrations, twice as much
as the mean. On the other hand, LCC and CACM
mechanisms underpredict NO, yielding 16% less NO
than the average. SAPRC99’s predictions for NO2 are
10% higher than the mean and lie on the top of the
range. On the other side, LCC shows an averaged
prediction of about 9% under the mean values. The
explanation of this result is that LCC contains the
fastest parameterizations for the transformation of NOx
to nitrate radical and nitric acid; as will be described
later, LCC predicts the highest levels of HNO3. Another
significant difference to report is that EMEP mechanism
does not include the nitrous acid (HONO) reactions, and
this species represents one of the main sources of
hydroxyl radical and NO in the troposphere, since
HONO is rapidly photolyzed at wavelengths under
400 nm during daytime hours (Finlayson-Pitts and
Pitts, 2000).
Ozone concentrations are sensitive to NO and NO2
concentrations and their reactions in the troposphere
(Table 3), and also to the NO2 photolysis rate and PAN
formation and loss rates (Gao et al., 1996). The
important reactions responsible for O3 destruction are
directly related to OH and HO2 chemistry. Fig. 2 shows
ozone concentrations during high photochemical activ-
ity hours. CACM is the highest-yielding mechanism
(values 19% over the average). CACM’s predictions are
twice as large as those produced by RADM2, which
presents a 25% deviation below the average. The
maximum deviation of all mechanisms for ozone
formation is less than 20% for all simulations. The
average deviation is between 1% and 10%. Results
obtained show a relation between the dynamics of ozone
and hydroperoxide radicals, since those pollutants are
coupled through the reaction O3+HO2-OH+2O2.
Most of the model differences with respect to ozone
concentrations are traced to differences in the destruc-
tion of O3 due to reaction with HO2.
5.2. Nitrate radical and nitric acid
The nitrate radical (NO3) is a strong oxidizing agent
and reacts with a number of other atmospheric species.
The prerequisite for NO3 radical production is the
simultaneous presence of NO2 and O3 in the same air
mass. The reaction NO2+O3-NO3+O2 is the only
primary source of NO3 in the troposphere (Seinfeld and
Pandis, 1998). During daytime, NO3 rapidly photolyzes
and reacts with NO to yield NO2. In addition, NO3
reacts with NO2 during nighttime hours to create N2O5.
Daytime NO3 concentrations are shown due to its
relation with HNO3 levels, and since they can provide an
idea of the similarity of the photolysis rates included in
the mechanisms. The majority of HNO3 produced in all
simulations during daylight hours is through the
OH+NO2-HNO3 reaction, which is one of the most
important daytime reactions affecting O3 and HOx.
During nighttime, N2O5 reacts with water vapor to yield
HNO3. As shown in Fig. 3, NO3 concentrations vary
over a large range, and carry high relative deviations
with respect to the average. Models result range from
the ones predicted by CACM (an average overprediction
of 42% in NO3 values) to the values given by RADM2
(a relative deviation of 52% under the average values).
The reason behind such dramatic differences is that the
mechanisms implement different NO3 reactions (Table
3). The gas-phase reaction of NO3 with water vapor has
a minor importance with respect to the heterogeneous
reaction of NO3 with liquid water, and an accurate
ARTICLE IN PRESS
Table 2
Parameters specifications and initial conditions (ppm) for
scenario
Latitude: 34.058�N
Longitude: 118.250�W
Start time: 27 August 1987 (0 h LST)
Species Initial concentration (ppm)
NO/NOx (ppm/ppm) 0.8
NO 0.06664
NO2 0.01666
O3 0.03
Ethene 0.0193
Isoprene 0.0007
Formaldehyde 0.02
Lumped aldehydes 0.0147
CO 1.0
Methane 3.0
H2 0.5
O2 209,000
N2 781,000
M 1,000,000
H2O 15,500
Temperature: 298.16K
Pressure: 1013.25mbar
P. Jimenez et al. / Atmospheric Environment 37 (2003) 4179–41944184
parameterization for the rate of the heterogeneous
reaction is not available. RACM and SAPRC99 include
the NO3 self-reaction, which is not included on the
others mechanisms. CBM-IV is the most average-
representative model, showing a small deviation with
respect to the mean values (a maximum relative
deviation of 12% and an average deviation of 7%).
Considering nitric acid, there are high uncertainties in
the kinetics of the reactions of N2O5 with H2O to form
HNO3. That is why some models (CB-IV, EMEP and
RACM) do not include this reaction, presenting a
medium-range behavior with respect to HNO3 (average
deviations of 35%, 21% and 40%). The highest
deviation from the average is that produced by the
LCC, with maximum deviations of 128% and a mean
deviation of 61% over the average. On the other
extreme, RADM2 underpredicts average values by as
much as 50%. Dynamics of HNO3 are related to those
of HOx, since the reaction of nitrate with hydroperoxyl
radical is one of the main sources of HNO3 in the
troposphere, and rate constant differences have impor-
tant effects on model predictions. The reaction of NO3
with H2O2 to yield HO2 and nitric acid is included in all
mechanisms, but with significant differences in para-
meterizations that lead to the diverse results presented in
the simulations. Differences shown in Fig. 3 for the
diverse models are more relevant in the latest hours of
the simulation. Nevertheless, production of HNO3 in the
early hours of the simulations is consistent among the
mechanisms studied. Production of HNO3 during the
night hours through N2O5 reactions is implemented in
different ways in the mechanisms. These differences
affect not only nitric acid concentrations, but also other
products such as PAN, since reactions of NO3 with
carbonyls produce acyl peroxy radicals.
5.3. Peroxyacetyl nitrate
PAN has long been known to be an important
atmospheric species. It acts as a reservoir for NOx and
acetyl peroxy radicals (C2O3) (Stockwell et al., 1995).
PAN and analogues are formed during degradation of
aldehydes, by the reaction of alkyl and acyl peroxy
radicals with NO2. The thermal decomposition of PAN
leads to the formation of CO2, NO2 and peroxy radicals.
In turn, the reactions of peroxy radicals lead to
ARTICLE IN PRESS
0.0
5.0
10.0
15.0
20.0
25.0
30.0
35.0
40.0
45.0
360 440 520 600 680 760 840 920 1000 1080
NO
Con
cent
ratio
n (p
pb)
0.0
12.5
25.0
37.5
50.0
62.5
75.0
87.5
100.0
112.5
125.0
360 440 520 600 680 760 840 920 1000 1080
NO
Rel
ativ
e D
evia
tion
(%)
0.0
10.0
20.0
30.0
40.0
50.0
60.0
70.0
360 440 520 600 680 760 840 920 1000 1080
NO
2 Con
cent
ratio
n (p
pb)
0.0
2.5
5.0
7.5
10.0
12.5
15.0
17.5
20.0
22.5
360 440 520 600 680 760 840 920 1000 1080
NO
2 R
elat
ive
Dev
iatio
n (%
)
Time (min) Time (min)
Time (min) Time (min)
Fig. 1. Simulation results for NO (up) and NO2 (bottom) concentrations in ppb and relative deviations with respect to the average
behavior (%) during daylight hours. Simulation was initiated at 0 h LST with the parameters and initial conditions specified in Table 2.
P. Jimenez et al. / Atmospheric Environment 37 (2003) 4179–4194 4185

ARTICLE IN PRESS
Table 3
Similarities and differences between the chemistry of inorganic species in the chemical schemes
Reaction LCC CBM-IV RADM2 EMEP RACM SAPRC99 CACM
NOx and O3 chemistryNO2+hn-NO+O X X X X X X XO3+hn-O+O2 X X X X X X XO3+hn-OSD+O2 X X X X X X XHONO+hn-NO+OH X X X X XHONO+hn-0.9NO+0.1NO2+0.9OH+0.1HO2 XHONO+hn-NO2+HO2 XHNO4+hn-HO2+NO2 XO+O2+M-O3+M X X X X X X XO+NO+M-NO2+M X X X X XO+NO2-NO+O2 X X X X X XO+O3-2O2 X X XOSD+H2O-2OH X X X X X XOSD+M-O+M X X X X X XO3+OH-HO2+O2 X X X X X X XO3+HO2-OH+2O2 X X X X X X XNO+NO+O2-2NO2 X X X X X XNO+NO2+H2O-2HONO XNO+O3-NO2+O2 X X X X X X XNO+OH+M-HONO+M X X X X X XNO+HO2-NO2+OH X X X X X X XNO2+NO3-NO+NO2+O2 X X X X X X XNO2+HO2+M-HNO4+M X X X X X XHONO+OH-NO2+H2O X X X XHONO+HONO-NO+NO2 XHNO4+M-NO2+HO2+M X X X X X XHNO4+OH-NO2+O2+H2O X X X X XSO2+OH-H2SO4+HO2 X X X X X XCO+OH-HO2+CO2 X X X X X X
NO3 and HNO3 chemistryNO3+hn-NO+O2 X X X X X XNO3+hn-NO2+O X X X X X XNO3+hn-0.89NO2+0.89 O+0.11NO XHNO3+hn-NO2+OH X X X XHNO4+hn-0.65HO2+0.65NO2+0.35OH+0.35NO3 XHNO4+hn-0.61HO2+0.61NO2+0.39OH+0.39NO3 XO+NO2+M-NO3+M X X X X XNO2+O3-NO3+O2 X X X X X X XNO2+OH-HNO3 X X X X X X XNO2+H2O-HONO – NO2+HNO3 X XHNO3+OH-NO3+H2O X X X X X X XNO3+OH-NO2+HO2 X X XNO3+HO2-HNO3+O2 X XNO3+HO2-0.8NO2+0.2HNO3+0.8OH+O2 X XNO3+HO2-0.7NO2+0.3HNO3+0.7OH+O2 XNO3+HO2+M-HNO3+O2+M XNO3+HO2+H2O-HNO3+O2+H2O XNO3+H2O2-HO2+HNO3 XNO3+NO3-2NO2+O2 X XNO3+NO-2NO2 X X X X X X XNO3+NO2+M-N2O5+M X X X X X X XN2O5-NO2+NO3 X X X X X X XN2O5+H2O-2HNO3 X X X X
HO2 and H2O2 chemistryH2O2+hn-2OH X X X X X X XHO2+OH-H2O+O2 X X X X XHO2+HO2-H2O2 X X X X X X XHO2+HO2+H2O-H2O2+O2+H2O X X X X X X XH2O2+OH-HO2+H2O X X X X X X XOH+H2-HO2 X X X
P. Jimenez et al. / Atmospheric Environment 37 (2003) 4179–41944186

production of HO2 and formaldehyde, which contribute
to photochemical reactions including ozone formation.
Therefore, variations of PAN are related to those of
ozone with respect to time of the day, but not with
respect to amplitude (Grosjean et al., 2001). Results
obtained from this study show that peak concentrations
of PAN precede those of ozone by 1 h, as depicted in
Figs. 2 and 4. Peroxy nitrate species are treated
differently in the mechanisms under study (Table 4).
For instance, CACM considers 10 different peroxy
ARTICLE IN PRESS
0.0
10.0
20.0
30.0
40.0
50.0
60.0
70.0
360 440 520 600 680 760 840 920 1000 1080
O3
Con
cent
ratio
n (p
pb)
0.0
5.0
10.0
15.0
20.0
25.0
30.0
35.0
40.0
45.0
50.0
55.0
60.0
360 440 520 600 680 760 840 920 1000 1080
O3
Rel
ativ
e D
evia
tion
(%)
Time (min)Time (min)
Fig. 2. Simulation results for ozone concentrations (ppb) and relative deviations with respect to the average behavior (%) during
daylight hours. Simulation was initiated at 0 h LST with the parameters and initial conditions specified in Table 2.
0.000
0.001
0.002
0.003
0.004
0.005
0.006
360 440 520 600 680 760 840 920 1000 1080
Time (min)
NO
3 C
once
ntra
tion
(ppb
)
0.0
10.0
20.0
30.0
40.0
50.0
60.0
70.0
80.0
90.0
100.0
360 440 520 600 680 760 840 920 1000 1080
Time (min)
NO
3 R
elat
ive
Dev
iatio
n (%
)
0.0
5.0
10.0
15.0
20.0
25.0
30.0
35.0
40.0
360 440 520 600 680 760 840 920 1000 1080
Time (min)
HN
O3
Con
cent
ratio
n (p
pb)
0.0
15.0
30.0
45.0
60.0
75.0
90.0
105.0
120.0
135.0
360 440 520 600 680 760 840 920 1000 1080
Time (min)
HN
O3
Rel
ativ
e D
evia
tion
(%)
Fig. 3. Simulation results for NO3 (up) and HNO3 concentrations (bottom) in ppb and relative deviations with respect to the average
behavior (%) during daylight hours. Simulation was initiated at 0 h LST with the parameters and initial conditions specified in Table 2.
P. Jimenez et al. / Atmospheric Environment 37 (2003) 4179–4194 4187

nitrates depending on the source of the species. EMEP
distinguishes between PAN and a peroxy methacroleinyl
nitrate. Meanwhile, LCC and CBM-IV consider just the
PAN. SAPRC99 considers also peroxy propionyl nitrate
and other higher alkyl PAN analogues, PAN analogues
formed from aromatic aldehydes and a PAN analogue
formed from methacrolein. RADM2 and RACM lump
peroxy nitrates into PAN and higher saturated PANs,
and unsaturated PANs. Simulations results, shown in
Fig. 4, illustrate that the amount of total PAN species
formed by the various chemical schemes differs con-
siderably. RADM2 presents the lowest PAN values,
with a maximum deviation with respect to mean
mechanisms’ value around 60%. On the other side,
RACM and CACM yield the highest PAN levels, with a
maximum deviation of 53% and 78%, respectively. The
most representative mechanism with respect to average
predictions is SAPRC99, with a mean relative deviation
of 12%. Peroxy nitrate formation and decay rates differ
substantially among the mechanisms, and depend on the
magnitude of the competing reactions of C2O3 radical,
which differs in their implementation in the different
mechanisms. The yield of PAN is affected strongly by
the choice of rate parameters (Kley et al., 1999). While
the rate of PAN formation is similar among the
mechanism considered, there are various differences in
the implementation of PAN decomposition. For exam-
ple, in most mechanisms (CBM-IV, RADM2, RACM,
SAPRC99, CACM), PAN yields the corresponding acyl
peroxy radical and NO2 through an equilibrium reac-
tion, but chemical kinetics differ considerably. EMEP
treats the formation of PAN as a fixed-rate reaction. On
the other hand, LCC and EMEP include PAN decom-
position as a strong temperature-dependent reaction,
considering similar kinetics parameters. Luecken et al.
(1999) reported that reactions of NO3 with carbonyls,
mainly acetaldehyde, lead to peroxy radicals, which
react with NO2 to yield peroxynitrates. Therefore, not
only NO3 but also aldehyde considerations in the
mechanisms influence PAN concentrations. CACM
and LCC use similar kinetics for the reaction of
aldehydes with NO3, and this reaction rate is the highest
for all the mechanisms compared, which explains the
highest levels of PAN production shown in Fig. 4
ARTICLE IN PRESS
0.0
0.2
0.4
0.6
0.8
1.0
1.2
1.4
360 440 520 600 680 760 840 920 1000 1080
PA
N C
once
ntra
tion
(ppb
)
0.0
10.0
20.0
30.0
40.0
50.0
60.0
70.0
80.0
90.0
100.0
110.0
360 440 520 600 680 760 840 920 1000 1080
PA
N R
elat
ive
Dev
iatio
n (%
)
Time (min)Time (min)
Fig. 4. Simulation results for total PAN concentrations (ppb) and relative deviations with respect to the average behavior (%) during
daylight hours. Simulation was initiated at 0 h LST with the parameters and initial conditions specified in Table 2.
Table 4
Peroxy nitrate species included in the mechanisms
Reaction LCC CBM-IV RADM2 EMEP RACM SAPRC99 CACM
Peroxy pentionyl nitrate X
Peroxyacetyl nitrate (PAN) X X X X X X X
Unsaturated PANs X X
Peroxy propionyl nitrate (PPN) X X X
Keto-PPN X
Methylene-PPN (derived from methacrolein) X X X
Peroxy nitrate derived from glyoxal X
Peroxy 3-methyl-heptionyl nitrate X
Peroxy 2-hydroxy-3-isopropyl-6-keto-heptionyl nitrate X
Peroxy 3-isopropyl-4-hydroxy-2-butenionyl-nitrate
(PAN analogue derived from aromatic aldehydes) X X
Peroxy nitrate derived from glyoxalic acid X
P. Jimenez et al. / Atmospheric Environment 37 (2003) 4179–41944188

(average overpredictions of 42% and 33%, respectively).
In contrast, CBM-IV and EMEP use the slowest rates.
As a result, PAN concentrations are also the lowest,
underestimating the average values by 30% and 51%.
RADM2, RACM and SAPRC99 present similar kinetic
considerations, but show different behaviors due to
differences in aldehydes concentrations reported by the
models. RADM2 yields the lowest aldehyde concentra-
tions, which reflects in a lower PAN concentrations with
respect to the other two models with similar reaction
rates.
5.4. Hydrogen peroxide and hydroperoxyde radical
Hydrogen peroxide (H2O2) and hydroperoxide radical
(HO2) are photochemical products that serve as
precursors of odd-oxygen as well as reservoirs of odd-
hydrogen radicals. The generation of H2O2 and HO2 is
affected by the levels of chemical components such as
NOx, CO, methane and non-methane hydrocarbons
(Lee et al., 2000). H2O2 and organic peroxides chemistry
is a weak point in most mechanisms, because of the
many complex reactions and possible unknowns that are
important under low NOx/VOC ratio conditions (Kuhn
et al., 1998). All mechanisms implement similar reac-
tions for hydrogen peroxide: the bimolecular combina-
tion of HO2, H2O2 photolysis and the reaction of H2O2
with OH to regenerate HO2 radicals (Table 3).
Furthermore, kinetic constants and reaction rates are
similar for all mechanisms. HO2 self-reaction is the only
important gas-phase source of hydrogen peroxide in the
troposphere. As a result, HO2 and H2O2 concentrations
are closely related. Rates for this reaction are identical in
CACM and SAPRC99; RADM2, EMEP and RACM
use the expression referenced in DeMore et al. (2000);
LCC and CBM-IV differ from the rest in kinetics
considerations. Fig. 5 shows that differences among the
mechanisms are important. RADM2 predicts the lowest
concentrations of HO2 and H2O2, with production rates
that are 53% and 71% lower than the mean, and
showing maximum relative deviations of 95% and 85%,
respectively. These deviations are due to the explicit
treatment of HO2 and organic peroxide radicals in the
model (Stockwell, 1995). On the other hand, LCC
ARTICLE IN PRESS
0.0E+00
1.0E-04
2.0E-04
3.0E-04
4.0E-04
5.0E-04
6.0E-04
7.0E-04
360 440 520 600 680 760 840 920 1000 1080
Time (min)
HO
2 C
once
ntra
tion
(ppb
)
0.0
10.0
20.0
30.0
40.0
50.0
60.0
70.0
80.0
90.0
100.0
110.0
360 440 520 600 680 760 840 920 1000 1080
Time (min)
HO
2 R
elat
ive
Dev
iatio
n (%
)
0.0E+00
2.0E-04
4.0E-04
6.0E-04
8.0E-04
1.0E-03
1.2E-03
1.4E-03
360 440 520 600 680 760 840 920 1000 1080
Time (min)
H2
O2
Con
cent
ratio
n (p
pb)
0.0
15.0
30.0
45.0
60.0
75.0
90.0
105.0
120.0
135.0
150.0
360 440 520 600 680 760 840 920 1000 1080
Time (min)
H2
O2
Rel
ativ
e D
evia
tion
(%)
Fig. 5. Simulation results for HO2 (up) and H2O2 (bottom) concentrations in ppb and relative deviations with respect to the average
behavior (%) during daylight hours. Simulation was initiated at 0 h LST with the parameters and initial conditions specified in Table 2.
P. Jimenez et al. / Atmospheric Environment 37 (2003) 4179–4194 4189

parameterizations lead to the highest peroxide values,
producing average deviations of 46% for HO2 and 92%
for H2O2. The mechanism that predicts concentrations
closest to the average is SAPRC99 for HO2 (under-
estimation of 11%) and RACM for H2O2 (under-
estimation of 13%). Differences among all mechanisms
originate from different considerations of water-vapor
dynamics. HO2 and OH concentrations are overpre-
dicted by the HO2 and HO2 reaction when water vapor
is not considered, which leads to an underestimate of
gas-phase hydrogen peroxide formation rates and to an
overestimate of ozone and organic peroxide formation
rates (Stockwell, 1995).
5.5. Alkenes
In the troposphere, alkenes react with atomic oxygen,
OH radicals, NO3 radicals and ozone through the
double bonded carbons (Atkinson, 2000). The reasons
for focusing on ethene and isoprene in this study are
diverse. Both are significant contributors to PAN and
organic nitrate formation (Luecken et al., 1999). Ethene
is the simplest alkene emitted from anthropogenic
sources, and because of its high reactivity with respect
to ozone formation, it is included explicitly in all
mechanisms. Isoprene is the most significant biogenic
compound, and its chemistry is analogous to that of
alkenes. Chemicals schemes in this work aggregate
biogenic stable species attending to different criteria
(Table 5). CACM classifies biogenics attending to the
potential to generate SOAs, meanwhile most mechan-
isms include only isoprene, and LCC and RACM treat
species explicitly as pinene, limonene, myrcene and
carene. Isoprene is considered in all mechanisms because
of its importance in photochemical chemistry. As shown
in Fig. 6, ethene parameterization is similar in all
mechanisms. The oldest mechanisms (LCC, RADM2
and CBM-IV) produce higher relative deviations, which
ARTICLE IN PRESS
Table 5
Reactions of biogenic stable species included in the mechanisms
Reaction Biogenic stable species chemistry
LCC CBM-IV RADM2 EMEP RACM SAPRC99 CACM
Isoprene+OH X X X X X X X
Isoprene+NO3 X X X X X X X
Isoprene+O3 X X X X X X X
Isoprene+O X X X X X
APINa+OH X X
APIN+NO3 X X
APIN+O3 X X
BPINb+OH X
BPIN+NO3 X
BPIN+O3 X
LIMc+OH X X
LIM+NO3 X X
LIM+O3 X X
Myrcene+OH X
Myrcene+NO3 X
Myrcene+O3 X
g-Carene+OH X
g-Carene+NO3 X
g-Carene+O3 X
BIOLd+OH X
BIOL+NO3 X
BIOL+O3 X
BIOL+O X
BIOHe+OH X
BIOH+NO3 X
BIOH+O3 X
BIOH+O X
aa-Pinene and other cyclic terpenes with one double bond.bb-Pinene.cd-Limonene and other cyclic diene-terpenes.dLow SOA monoterpene species (a-terpineol).eHigh SOA monoterpene species (g-terpinene).
P. Jimenez et al. / Atmospheric Environment 37 (2003) 4179–41944190

are no larger than 16%. The kinetics of ethene are
slower for RADM2, meanwhile LCC is the most-rapidly
reactive mechanism. EMEP and SAPRC99 implement
similar parameterizations. Minimum deviations are
under 2% for RACM, which would be the average-
representative model. Isoprene is highly reactive in the
atmosphere, and its lifetime is relatively short when
compared to other organic species as ethene. Mechan-
isms that do not include atomic oxygen reaction with
isoprene (RADM2 and EMEP) yield the highest over-
predictions (115% and 22% with respect to the average).
LCC and CACM levels are under the average values
(57% and 43%). Finally, RACM yields the smallest
deviations with respect to the mean, around 20%. One
of the sources of the alkenes discrepancy among
mechanisms is the alkene reaction with O3P, since
RADM2 and EMEP do not include it in their schemes.
Its importance derives from the fact that the kinetic
constant of the alkene+O3P is of the same order of
magnitude as the alkene+OH and greater than the
alkene+O3 kinetic constant.
6. Summary and conclusions
A comparison of photochemical mechanisms for air
quality modeling is presented. Predictions of different
tropospheric reaction mechanisms for a common set of
initial and boundary conditions are compared to
identify factors affecting the accuracy of reactivity
simulations. The range of concentrations predicted by
the box mechanisms show the state-of-the-science in
tropospheric chemistry. All the chemical schemes are
used as part of chemical transport models, and the main
conclusions of the results are summarized as follows: (1)
NOx does not show important differences, except in the
case of RADM2, since all the mechanisms relied on the
same kinetic and mechanistic data for inorganic
chemistry. EMEP mechanism does not include the
HONO chemistry. RADM2 implements the oldest
parameterizations considered in this comparison (LCC
and CBM-IV are older mechanisms, but their chemistry
has been revised). As a result, NO concentrations
predicted by RADM2 deviate with respect to the
ARTICLE IN PRESS
0.0
2.0
4.0
6.0
8.0
10.0
12.0
14.0
16.0
18.0
20.0
360 440 520 600 680 760 840 920 1000 1080
Eth
ene
Con
cent
ratio
n (p
pb)
0.0
1.5
3.0
4.5
6.0
7.5
9.0
10.5
12.0
13.5
15.0
16.5
360 440 520 600 680 760 840 920 1000 1080
Eth
ene
Rel
ativ
e D
evia
tion
(%)
0.0
0.1
0.2
0.3
0.4
0.5
0.6
0.7
360 440 520 600 680 760 840 920 1000 1080
Isop
rene
Con
cent
ratio
n (p
pb)
0.0
30.0
60.0
90.0
120.0
150.0
180.0
210.0
240.0
270.0
300.0
360 440 520 600 680 760 840 920 1000 1080
Isop
rene
Rel
ativ
e D
evia
tion
(%)
Time (min) Time (min)
Time (min)Time (min)
Fig. 6. Simulation results for ethene (up) and isoprene (bottom) concentrations in ppb and relative deviations with respect to the
average behavior (%) during daylight hours. Simulation was initiated at 0 h LST with the parameters and initial conditions specified in
Table 2.
P. Jimenez et al. / Atmospheric Environment 37 (2003) 4179–4194 4191

average. (2) The mechanisms that tend to predict higher
ozone concentrations are CACM and LCC. This high
O3-productivity is accompanied by a high formation of
organic hydroperoxides. Deviations in predicted ozone
concentrations among the models are due to different
consideration in mechanisms’ compounds. This effect
becomes more pronounced for reactive species produ-
cing a high yield of aldehydes, and thereby PAN and
analogues. (3) NO3 concentrations vary over a large
range for the different mechanisms, and present high
relative deviations with respect to the average. An
explanation may come from the different NO3 reactions
considered in the models. HNO3 tendency is also
strongly related to that of HOx, since the reaction of
nitrate with hydroperoxyl radical is the main source of
HNO3 in the troposphere. NO3+HO2 is included in all
mechanisms, but with important differences in para-
meterizations that lead to the diverse results found in the
simulations. (4) Divergence between different mechan-
isms in the case of total PAN is important, since the
yield of total PAN is affected by the choice of rate
parameters. Peroxy nitrate formation and decay rates
differ substantially among the diverse mechanisms, as
well as C2O3 radical reactions. (5) The differences in
hydroperoxide and hydrogen peroxide are relevant, and
are traced to the inconsistent conversion rates for HO2
to H2O2 reaction and to the water-vapor concentration
dependences of the HO2 self-reaction. (6) Alkenes
chemistry is consistent among the models considered
in this comparison, and does not show important
differences. Most mechanisms include similar kinetics
parameterizations for ethene and isoprene, and the only
important divergence comes from the fact that the
reaction of these compounds with atomic oxygen is not
considered in all models.
Results obtained in this work are summarized in
Table 6. They are consistent with other comparison
exercises found in the bibliography and previously
exposed in Section 2. The conclusions from this model
comparison confirms that even for the simulation of
ARTICLE IN PRESS
Table 6
Comparison of the deviation of mechanisms’ results with respect to the average value
Species % deviation of individual mechanisms from average values
LCC CBM-IV RADM2 EMEP RACM SAPRC99 CACM
NO Max �43.8 �21.4 +123.8a +8.3 +4.9b +15.7 �44.6Average �15.7 �7.4 +30.0a +6.3 +3.3 �1.5b �15.6
NO2 Max �20.6a �3.5b �7.4 �5.4 +9.3 +16.5 +4.1
Average �8.9 �1.0b �4.7 �3.2 +4.7 +10.0a +2.8
O3 Max +18.2 +6.0 �56.4a �19.2 �2.9b +14.0 +41.4
Average +6.2 +4.4 �25.4a �10.4 �1.4b +8.3 +18.6
NO3 Max +55.6 �12.3b �86.0 �45.2 �20.9 +21.3 +88.0a
Average +35.0 �7.1b �51.8a �30.5 �12.5 +13.4 +42.1
HNO3 Max +127.8a +125.9 �96.2 �92.3b �94.9 �95.4 +125.2
Average +61.4a +35.5 �49.8 +21.4b �29.1 �40.0 +27.9
PAN Max +100.7a +46.1b �59.6 �64.2 +56.1 �53.1 +77.7
Average +41.8 �30.1 �37.1 �50.8a +42.0 +12.2b +33.0
HO2 Max +83.2 +51.5 �95.1 �39.3 �41.0 �39.3b +105.0a
Average +45.7 +12.5 �53.2a �15.7 �11.8 �11.1b +34.5
H2O2 Max +142.8a �31.5b �84.7 �58.7 �65.1 �71.0 +110.0
Average +103.4a �20.3 �70.8 �15.6 �12.6b �29.1 +36.9
Ethene Max �15.1a �11.2 +15.0 +7.5 +1.3b +8.6 �5.8Average �7.3 �6.8 +7.5a �4.7 +0.9b +4.4 �3.3
Isoprene Max �91.8 +82.8 +271.8a +51.8 +42.5b +79.0 �72.7Average �56.7 +55.8 +115.3a +22.3 +19.7b +43.2 �42.5
aMaximum deviations with respect to the average value.bMinimum deviations with respect to the average value.
P. Jimenez et al. / Atmospheric Environment 37 (2003) 4179–41944192

extremely simple situations, there can be discrepancies in
predicted concentrations. Furthermore, this study shows
that such discrepancies are significant in most of the
cases and quantifies typical biases among various
mechanisms.
References
Andersson-Skold, Y., Simpson, D., 1999. Comparison of the
chemical schemes of the EMEP MSC-W and IVL photo-
chemical trajectory models. Atmospheric Environment 33
(7), 1111–1129.
Atkinson, R., 2000. Atmospheric chemistry of VOCs and NOx.
Atmospheric Environment 34, 2063–2101.
Atkinson, R., Baulch, D.L., Cox, R.A., Hampson Jr., R.F.,
Kerr, J.A., Rossi, M.J., Troe, J., 1999. Evaluated kinetic
and photochemical data for atmospheric chemistry, organic
species: supplement VII. Journal of Physical and Chemical
Reference Data 28, 191–393.
Brown, P.N., Byrne, G.D., Hindmarsh, A.C., 1989. VODE: a
variable-coefficient ODE solver. Journal on Scientific and
Statistical Computing 10 (5), 1038–1051.
Byun, D.W., Ching, J.K.S. (Eds.), 1999. Science algorithms of
the EPA Models-3 Community Multiscale Air Quality
(CMAQ) modeling system. EPA Report No. EPA-600/R-
99/030, Office of Research and Development. US Environ-
mental Protection Agency, Washington, DC.
Carter, W.P.L., 1990. A detailed mechanism for the gas-phase
atmospheric reactions of organic compounds. Atmospheric
Environment 24A, 481–518.
Carter, W.P.L., 2000a. Documentation on the SAPRC-99
chemical mechanism for VOC reactivity assessment. Final
Report to California Air Resources Board Contract No. 92-
329 and 95-308, May 2000.
Carter, W.P.L., 2000b. Implementation of the SAPRC-99
chemical mechanism into the Models-3 Framework. Report
to the US Environmental Agency, 29 January 2000.
DeMore, W.B., Sander, S.P., Friedl, R.P., Golden, D.M.,
Hampson, R.F., Kurylo, M.J., Howard, C.J., Ravishan-
kara, A.R., Kolb, C.E., Moortgart, G.K., Molina, M.J.,
2000. Chemical kinetics and photochemical data for use in
stratospheric modeling. Supplement to Evaluation 12:
update of key reactions. In: Evaluation 13, NASA Panel
for Data Evaluation. Jet Propulsion Laboratory Publication
00-3, Pasadena, CA, 9 March.
Dennis, R.L., Byun, D.W., Novak, J.H., Gallupi, K.J., Coats,
C.J., Vouk, M.A., 1996. The next generation of integrated
air quality modeling: EPA’s Models-3. Atmospheric
Environment 30 (12), 1925–1938.
Dodge, M.C., 2000. Chemical oxidant mechanisms for air
quality modeling: critical review. Atmospheric Environment
34 (12–14), 2103–2130.
Finlayson-Pitts, B.J., Pitts, J.N., 2000. Chemistry of the Upper
and Lower Atmosphere. Theory, Experiments and Applica-
tions. Academic Press, New York, UK, p. 969.
Gao, D., Stockwell, W.R., Milford, J.B., 1996. Global
uncertainty analysis of a regional-scale gas-phase che-
mical mechanism. Journal of Geophysical Research 101,
9107–9119.
Gery, M.W., Whitten, G.Z., Killus, J.P., Dodge, M.C., 1989. A
photochemical kinetics mechanism for urban and regional
scale computer modeling. Journal of Geophysical Research
94 (D10), 12925–12956.
Gipson, G.L., Young, J.O., 1999. Gas-phase chemistry. In:
Byun, D.W., Ching, J.K.S. (Eds.), Science Algorithms of the
EPA Models-3 Community Multiscale Air Quality System
(CMAQ) Modeling System. US Environmental Protection
Agency, Atmospheric Modeling Division, Research Trian-
gle Park, NC, EPA 600/R-99/030.
Griffin, R.J., Dabdub, D., Seinfeld, J.H., 2002. Secondary
organic aerosol, 1. Atmospheric chemical mechanism for
production of molecular constituents. Journal of Geophy-
sical Research 107, 4332–4357.
Grosjean, E., Grosjean, D., Woodhouse, L.F., 2001. Perox-
yacetyl nitrate and peroxypropionyl nitrate during SCOS
97-NARSTO. Environmental Science and Technology 35,
4007–4014.
Gurciullo, C.S., Pandis, S.N., Kumar, N., Lurmann, F.W.,
1998. Development and testing of an aqueous-phase
chemistry module for Eulerian chemical transport models.
Final Report prepared for the Coordinating Research
Council, Atlanta, GA by Carnegie Mellon University,
Pittsburgh, PA and Sonoma Technology, Inc., Petaluma,
CA, STI-997510-1822-FR, June 1998.
Hass, H., 1991. Description of the EURAD chemistry transport
module (CTM) version 2. In: Ebel, A., Neubauer, F.M.,
Speth, P. (Eds.), Report 83. Institute of Geophysics and
Meteorology, University of Cologne, Cologne, Germany.
Jeffries, H.F., Tonnesen, J., 1994. A comparison of two
photochemical reaction mechanisms using mass balance
and process analysis. Atmospheric Environment 28,
2991–3003.
Kley, D., Kleinmann, M., Sanderman, H., Krupa, S., 1999.
Photochemical oxidants: state of the science. Environmental
Pollution 100, 19–42.
Kuhn, M., Builtjes, P.J.H., Poppe, D., Simpson, D., Stockwell,
W.R., Andersson-Skold, Y., Baart, A., Das, M., Fiedler, F.,
Hov, O., Kirchner, F., Makar, P.A., Milford, J.B., Roemer,
M.G.M., Ruhnke, R., Strand, A., Vogel, B., Vogel, H.,
1998. Intercomparison of the gas-phase chemistry in several
chemistry and transport models. Atmospheric Environment
32, 693–709.
Lee, M., Heikes, B.G., O’Sullivan, D.W., 2000. Hydrogen
peroxide and organic hydroperoxide in the troposphere: a
review. Atmospheric Environment 34, 3475–3494.
Luecken, D.J., Tonnesen, G.S., Sickles, J.E., 1999. Differences
in NOy speciation predicted by three photochemical
mechanisms. Atmospheric Environment 33 (7), 1073–1084.
Lurmann, F.W., Carter, W.P.L., Coyner, L.A., 1987. A
surrogate species chemical reaction mechanism for urban-
scale air quality simulation models. Report prepared for the
US Environmental Protection Agency Contract No. 68-02-
4104, Research Triangle Park, NC, EPA 600/3-87/014.
McRae, G.J., Russell, A.G., Harley, R.A., 1992. CIT Photo-
chemical Airshed Model—Systems Manual. Carnegie Mel-
lon University, Pittsburgh, PA, and California Institute of
Technology, Pasadena, CA, February 1992.
Middleton, P., Stockwell, W.R., Carter, W.P.L., 1990. Aggre-
gation of volatile organic compound emissions for regional
modeling. Atmospheric Environment 6, 1107–1133.
ARTICLE IN PRESSP. Jimenez et al. / Atmospheric Environment 37 (2003) 4179–4194 4193

Olson, J., Prather, M., Berntsen, T., Carmichael, G., Chatfield,
R., Connell, P., Derwent, R., Horowitz, L., Jin, S.,
Kanakidou, M., Kasibhatla, P., Kotamarthi, R., Kuhn,
M., Law, K., Penner, J., Perliski, L., Sillman, S., Stordal, F.,
Thompson, A., Wild, O., 1997. Results from the inter-
governmental panel on climate change (IPCC) photochemi-
cal model intercomparison (PhotoComp). Journal of
Geophysical Research 102, 5979–5991.
Paulson, S.E., Seinfeld, J.H., 1992. Development and evalua-
tion of a photooxidation mechanism for isoprene. Journal
of Geophysical Research 97, 20703–20715.
Poppe, D., Andersson-Skold, Y., Baart, A., Builtjes, P.J.H.,
Das, M., Hov, O., Kirchner, F., Kuhn, M., Makar, P.A.,
Milford, J.B., Roemer, M.G.M., Ruhnke, R., Simpson, D.,
Stockwell, W.R., Strand, A., Vogel, B., Vogel, H., 1996.
Intercomparison of the gas-phase chemistry of several
numerical chemistry and transport models. In: EURO-
TRAC Special Report 1996, Garmisch-Partenkirchen,
Germany.
Poppe, D., Aumont, B., Ervens, B., Geiger, H., Herrmann, H.,
Roth, E.-P., Seidl, W., Stockwell, W.R., Vogel, B., Wagner,
S., Weise, D., 2001. Scenarios for modeling multiphase
tropospheric chemistry. Journal of Atmospheric Chemistry
40, 77–86.
Russell, A., Dennis, R., 2000. NARSTO critical review of
photochemical models and modeling. Atmospheric Envir-
onment 34, 2283–2324.
Seefeld, S., Stockwell, W.R., 1999. First-order sensitivity
analysis of models with time-dependent parameters: an
application to PAN and ozone. Atmospheric Environment
33, 2491–2953.
Seinfeld, J.H., Pandis, S.N., 1998. Atmospheric Chemistry and
Physics: from Air Pollution to Climate Change. Wiley, New
York, p. 1326.
Simpson, D., 1992. Long period modeling of photochemical
oxidants in Europe, calculation for July 1985. Atmospheric
Environment 26A (9), 1609–1634.
Simpson, D., 1995. Biogenic emissions in Europe, 2. Implica-
tion for ozone control strategies. Journal of Geophysical
Research 100 (D11), 22891–22906.
Simpson, D., Andersson-Skold, Y., Jenkin, M.E., 1993.
Updating the chemical scheme for the EMEP MSC-W
oxidant model: current status. EMEP MSC-W note 2/93.
Norwegian Meteorological Institute, Oslo, Norway.
Stockwell, W.R., 1986. A homogeneous gas phase mechanism
for use in a regional acid deposition model. Atmospheric
Environment 20, 1615–1632.
Stockwell, W.R., 1995. On the HO2+HO2 reaction: its
misapplication in atmospheric chemistry models. Journal
of Geophysical Research 100 (D6), 11695–11698.
Stockwell, W.R., Middleton, P., Chang, J.S., Tang, X., 1990.
The second generation regional acid deposition model
chemical mechanism for regional air quality modeling.
Journal of Geophysical Research 95, 16343–16367.
Stockwell, W.R., Milford, J.B., Gao, D., Yang, Y.J., 1995. The
effect of acetyl peroxy–peroxy radical reactions on perox-
yacetyl nitrate and ozone concentrations. Atmospheric
Environment 29 (14), 1591–1599.
Stockwell, W.R., Kirchner, F., Kuhn, M., Seefeld, S., 1997.
A new mechanism for regional atmospheric chemistry
modeling. Journal of Geophysical Research 102 (D22),
25847–25879.
Tonnesen, G.S., Luecken, D., 2000. Intercomparison of
photochemical mechanisms using response surfaces and
process analysis. In: Millennium NATO/CCMS Interna-
tional Meeting on Air Pollution Modeling and its Applica-
tion, 15–19 May 2000. American Meteorological Society,
Boulder, CO, USA.
ARTICLE IN PRESSP. Jimenez et al. / Atmospheric Environment 37 (2003) 4179–41944194
Copyright © 2022 FDOKUMEN