Quantifying optical and SAR image relationships for tropical landscape features in the Amazônia
11
This article was downloaded by:[IBICT INPE] On: 24 August 2007 Access Details: [subscription number 738903133] Publisher: Taylor & Francis Informa Ltd Registered in England and Wales Registered Number: 1072954 Registered office: Mortimer House, 37-41 Mortimer Street, London W1T 3JH, UK International Journal of Remote Sensing Publication details, including instructions for authors and subscription information: http://www.informaworld.com/smpp/title~content=t713722504 Quantifying optical and SAR image relationships for tropical landscape features in the Amazônia Online Publication Date: 01 January 2007 To cite this Article: Shimabukuro, Y. E., Almeida-Filho, R., Kuplich, T. M. and de Freitas, R. M. (2007) 'Quantifying optical and SAR image relationships for tropical landscape features in the Amazônia', International Journal of Remote Sensing, 28:17, 3831 - 3840 To link to this article: DOI: 10.1080/01431160701236829 URL: http://dx.doi.org/10.1080/01431160701236829 PLEASE SCROLL DOWN FOR ARTICLE Full terms and conditions of use: http://www.informaworld.com/terms-and-conditions-of-access.pdf This article maybe used for research, teaching and private study purposes. Any substantial or systematic reproduction, re-distribution, re-selling, loan or sub-licensing, systematic supply or distribution in any form to anyone is expressly forbidden. The publisher does not give any warranty express or implied or make any representation that the contents will be complete or accurate or up to date. The accuracy of any instructions, formulae and drug doses should be independently verified with primary sources. The publisher shall not be liable for any loss, actions, claims, proceedings, demand or costs or damages whatsoever or howsoever caused arising directly or indirectly in connection with or arising out of the use of this material. © Taylor and Francis 2007
-
Upload
independent -
Category
Documents
-
view
3 -
download
0
Transcript of Quantifying optical and SAR image relationships for tropical landscape features in the Amazônia

This article was downloaded by:[IBICT INPE]On: 24 August 2007Access Details: [subscription number 738903133]Publisher: Taylor & FrancisInforma Ltd Registered in England and Wales Registered Number: 1072954Registered office: Mortimer House, 37-41 Mortimer Street, London W1T 3JH, UK
International Journal of RemoteSensingPublication details, including instructions for authors and subscription information:http://www.informaworld.com/smpp/title~content=t713722504
Quantifying optical and SAR image relationships fortropical landscape features in the Amazônia
Online Publication Date: 01 January 2007To cite this Article: Shimabukuro, Y. E., Almeida-Filho, R., Kuplich, T. M. and deFreitas, R. M. (2007) 'Quantifying optical and SAR image relationships for tropicallandscape features in the Amazônia', International Journal of Remote Sensing,28:17, 3831 - 3840To link to this article: DOI: 10.1080/01431160701236829URL: http://dx.doi.org/10.1080/01431160701236829
PLEASE SCROLL DOWN FOR ARTICLE
Full terms and conditions of use: http://www.informaworld.com/terms-and-conditions-of-access.pdf
This article maybe used for research, teaching and private study purposes. Any substantial or systematic reproduction,re-distribution, re-selling, loan or sub-licensing, systematic supply or distribution in any form to anyone is expresslyforbidden.
The publisher does not give any warranty express or implied or make any representation that the contents will becomplete or accurate or up to date. The accuracy of any instructions, formulae and drug doses should beindependently verified with primary sources. The publisher shall not be liable for any loss, actions, claims, proceedings,demand or costs or damages whatsoever or howsoever caused arising directly or indirectly in connection with orarising out of the use of this material.
© Taylor and Francis 2007

Dow
nloa
ded
By:
[IB
ICT
INP
E] A
t: 12
:55
24 A
ugus
t 200
7 Quantifying optical and SAR image relationships for tropical landscapefeatures in the Amazonia
Y. E. SHIMABUKURO*, R. ALMEIDA-FILHO, T. M. KUPLICH and R. M. DE
FREITAS
Instituto Nacional de Pesquisas Espaciais (INPE), Divisao de Sensoriamento Remoto,
Av. dos Astronautas, 1758, CEP 12227-010, Sao Jose dos Campos, SP, Brazil
(Received 22 August 2006; in final form 21 December 2006 )
This paper discusses the relationship between SAR and optical data for an
Amazonian test-site with different land cover types. L-band HH JERS-1 SAR
and Landsat TM images acquired few days apart from each other in 1994 and
1997 were analyzed. Landsat TM fraction images (vegetation, soil, and shade)
were used to characterize the terrain features in the study area. Based on 220
samples randomly distributed over different land cover types in the fraction and
SAR bands, a regression analysis was performed. Consistent results between
SAR data and fraction images suggest that L-band SAR data may be a
complementary source of information for mapping land cover changes in
Amazonia, especially to monitor deforestation in areas frequently blurred by
cloud cover in optical images.
1. Introduction
In tropical areas, Landsat Thematic Mapper (TM) fraction-images derived from
linear spectral mixing modeling have been demonstrated to be an adequate source of
information for discriminating land cover types, particularly forested and clear-cut
areas (Adams et al. 1995, Shimabukuro et al. 1998).
Due to a sensitivity to forest structure, L-band Synthetic Aperture Radar (SAR)
data have been used as an alternative source of information to map deforestation
(Almeida-Filho et al. 2005, Rignot et al. 1997, Sgrenzaroli et al. 2002). Japanese
Earth Resources Satellite (JERS) SAR data, from the Global Rain Forest Mapping
(GRFM) initiative, were used in a 100-m resolution mosaic of Amazonia for the
detection of deforestation, although detection accuracy was dependent on the
segmentation method used (Sgrenzaroli et al. 2002). Almeida-Filho et al. (2005)
tested the use of L-band GRFM SAR data for the mapping of deforestation in
Amazonia, using a similar methodology to the operational Brazilian Estimate of
Deforestation Project (PRODES). Results pointed out a difficulty in detecting initial
stages of deforestation (when residual trees still remain on the ground), although
‘complete’ clear-cuts were detected accurately.
The synergism between optical and SAR data to map land cover classes in
Amazonia has been demonstrated (e.g. Kuplich 2006, Rignot et al. 1997, Sgrenzaroli
et al. 2002). However, attempts to quantitatively estimate and compare the
responses of different land cover types in both optical and SAR data have not been
*Corresponding author. Email: [email protected]
International Journal of Remote Sensing
Vol. 28, No. 17, 10 September 2007, 3831–3840
International Journal of Remote SensingISSN 0143-1161 print/ISSN 1366-5901 online # 2007 Taylor & Francis
http://www.tandf.co.uk/journalsDOI: 10.1080/01431160701236829
Dow
nloa
ded
By:
[IB
ICT
INP
E] A
t: 12
:55
24 A
ugus
t 200
7
accomplished yet. A study by Imhoff et al. (1986), found ‘extremely low correlations
between the radar image patterns and any of the individual Landsat MSS bands’.
Obviously, such a conclusion cannot be generalized to all land cover use types found
in a tropical landscape. SAR bands in varied wavelengths and polarizations show
different discriminating properties for tropical land cover types (Hoekman and
Quinones 2000), although the knowledge about their capabilities is not as complete
as for the optical data.
Taking into account the above considerations, the objective of this study is to
investigate the relationships between JERS-1 SAR and TM fraction images for an
Amazonian test-site with different land cover use types.
2. Study area
The study area is located in the south of Rondonia State, western Brazilian
Amazonia (figure 1), and comprises approximately 4000 km2. The region is mainly
covered by tropical forest that has been partially cleared over the past 30 years. To
carry out the study in this area, we selected two Landsat-TM scenes acquired on 9
August 1994 and 1 August 1997, which were analyzed, respectively, with two JERS-
1 SAR images acquired on 4 August 1994 and on 8 August 1997.
3. Image processing and interpretation
Based on satellite ephemeris, the 1994 TM images were geometrically corrected to
the Universal Transverse Mercator (UTM) coordinate system, using a first-degree
polynomial algorithm. This scene was used as reference to co-register the 1997 TM
images. In all cases, the co-registration accuracies were better than 0.8 pixels.
Similarly, the JERS-1 SAR images were also co-registered to the TM images and
resampled to the same spatial resolution (pixel 30 m630 m).
Figure 1. Location of the study area.
3832 Y. E. Shimabukuro et al.

Dow
nloa
ded
By:
[IB
ICT
INP
E] A
t: 12
:55
24 A
ugus
t 200
7
Figure 2 shows the 1994 TM image (R5G4B3) and the land cover map of the
study area derived from this image. The land cover map was obtained by digital
classification following the procedure presented by Shimabukuro et al. (1998),
which is based on image segmentation using a region growing algorithm, followed
by unsupervised classification, and post-classification image editing. This
procedure minimizes the omission and commission errors of the classification
(Almeida-Filho and Shimabukuro 2002). The classes include: (i) primary forest,
(ii) savanna, (iii) deforested areas, (iv) burned forest, (v) burned grassland and
(vi) flooded vegetation. In the scene acquired in 1997, the areas covered by the
classes burned forest and burned grassland had been converted to deforestation
areas.
In the next step, the Landsat TM data were converted to vegetation, soil, and
shade fraction images, using a Linear Spectral Mixing Model (Shimabukuro and
Smith 1991). These fraction images are produced to enhance different characteristics
of land cover, expressed as different mixtures of a few scene components. Thus, the
vegetation fraction image highlights densities of the vegetation cover; soil fraction
image highlights areas of bare soils; and shade fraction images highlights shades in
forest canopy, which emphasize differences in forest cover types (Shimabukuro et al.
1998).
The JERS-1 SAR operated in L-band frequency (wavelength of 23.5 cm), with
HH polarization and right-looking off-nadir angle of 35 degrees. The ground
resolution was 18 m in both range and azimuth directions, and the swath width
75 km. The two JERS-1 images selected for this investigation were processed to
standard level 2.1, i.e. 16 bits ground range, 3 looks and a pixel spacing of
12.5612.5 m. Several adaptive and non-adaptive filters were tested to reduce
speckle noise in the SAR images. The best results in terms of minimum loss of
textural information and preservation of edges, estimated by visual inspection, were
obtained with a 565 window Gamma Filter as implemented in the ENVI software
(Shi and Fung 1994).
Figure 2. (a) Landsat TM acquired on 4 August 1994 and (b) corresponding land covermap.
Quantifying optical and SAR image relationships 3833
Dow
nloa
ded
By:
[IB
ICT
INP
E] A
t: 12
:55
24 A
ugus
t 200
7
JERS-1 SAR DNs (digital number) were converted to backscatter coefficient (su)using the following equation (Rosenqvist 1996, Shimada 2001):
so~10 log10X
DNð Þ2.
n� �
zCF,
where DN5digital number of image pixels; n5100 pixels sampled and
CF5calibration factor. The calibration factor was 285.34 for both acquisitions,
according to the processing dates of the SAR images (Almeida-Filho et al. 2005).
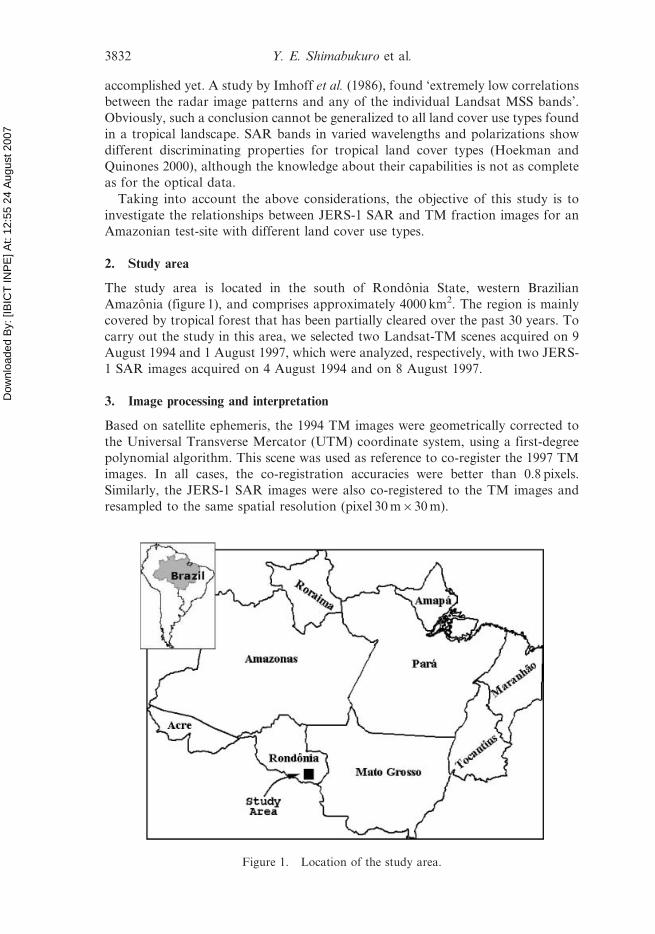
Figure 3 shows SAR backscattering values of the land cover types for 1994 and
1997 data sets. It can be observed a clear difference between forest and deforestation
samples for both 1994 and 1997 SAR images. Forest and burned forest show similar
backscatter values in the 1994 SAR image. Flooded vegetation areas presented
similar responses for both SAR images, while there is a slightly different response
for savanna areas due to the land surface characteristics of this land cover type.
Visual inspection of SAR images clearly showed the high contrast between forest
(medium gray) and cleared areas (dark gray). However, some clear-cut areas in the
1994 image (mapped as burned forest in TM image) appeared in light gray tones in
the JERS-1 image, contrary to what was expected. For the 1997 data the same clear-
cut areas (burned forest in 1994) showed an expected behavior in both types of data,
appearing in dark shades in the JERS-1 image. This fact is related to the stage of thedeforestation process, as pointed out by Stone and Woodwell (1988), i.e. in 1994
these areas had been cut and burned, but presented some wood material left on the
ground.
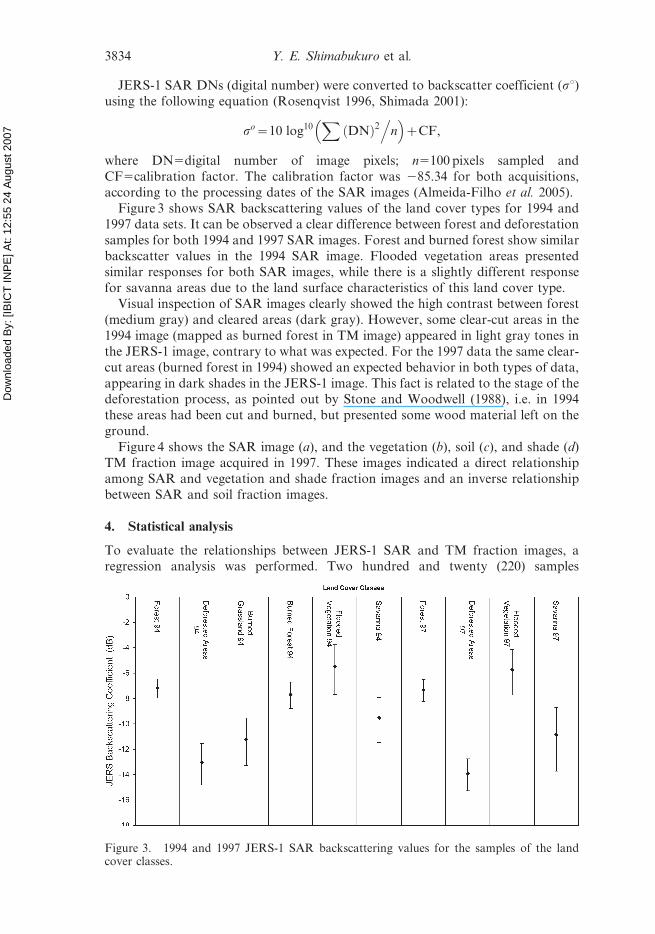
Figure 4 shows the SAR image (a), and the vegetation (b), soil (c), and shade (d)
TM fraction image acquired in 1997. These images indicated a direct relationshipamong SAR and vegetation and shade fraction images and an inverse relationship
between SAR and soil fraction images.
4. Statistical analysis
To evaluate the relationships between JERS-1 SAR and TM fraction images, aregression analysis was performed. Two hundred and twenty (220) samples
Figure 3. 1994 and 1997 JERS-1 SAR backscattering values for the samples of the landcover classes.
3834 Y. E. Shimabukuro et al.
Dow
nloa
ded
By:
[IB
ICT
INP
E] A
t: 12
:55
24 A
ugus
t 200
7
(10610 pixels) randomly distributed over all the classified land cover types were
acquired for the 1994 and 1997 SAR and TM fraction images. It should be
mentioned that over this time period (1994–1997) some areas covered with burned
forest and burned grassland were converted to deforestation areas. Therefore, some
samples of burned forest and burned grassland classes were converted to samples of
deforestation class.
For the regression analysis, SAR backscatter values were considered as the
dependent variable and TM-derived vegetation, soil, and fraction image values were
considered the independent variables.
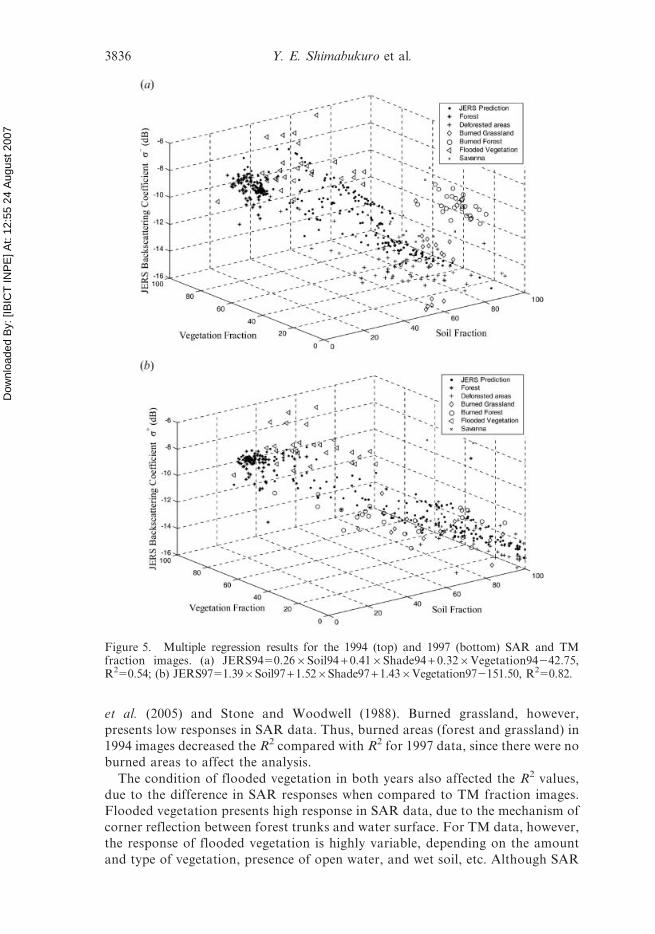
Multiple regression analysis showed coefficients of determination (R2) of 0.54
(figure 5, top) and 0.82 (figure 5, bottom) for the 1994 and 1997 data sets,
respectively. R2 values were obtained considering all 220 samples acquired in SAR
and TM fraction images (vegetation, soil, and shade). Variation in R2 values from
1994 to 1997 is explained by the surface characteristics of the land cover classes
considered in this study. The samples collected over burned forest and over
burned grassland classes in the 1994 images became samples over deforested class
in the 1997 images. Deforested areas are characterized by smooth surfaces in the
SAR data (low backscattering response if dry soil) and high soil proportion in the
TM fraction images. Although burned forest and burned grassland in practice are
deforested areas, they respond differently in SAR and TM fraction images.
Burned forest presents high SAR responses, due to the fact that the deforestation
process had not been completed at the time of the SAR image acquisition, i.e.
there is wood material remaining on the ground as discussed in Almeida-Filho
(a) (b)
(c) (d )
Figure 4. (a) JERS-1 SAR and (b) vegetation, (c) soil, and (d) shade fraction images derivedfrom Landsat TM data acquired in August 1997.
Quantifying optical and SAR image relationships 3835
Dow
nloa
ded
By:
[IB
ICT
INP
E] A
t: 12
:55
24 A
ugus
t 200
7
et al. (2005) and Stone and Woodwell (1988). Burned grassland, however,
presents low responses in SAR data. Thus, burned areas (forest and grassland) in
1994 images decreased the R2 compared with R2 for 1997 data, since there were no
burned areas to affect the analysis.
The condition of flooded vegetation in both years also affected the R2 values,
due to the difference in SAR responses when compared to TM fraction images.
Flooded vegetation presents high response in SAR data, due to the mechanism of
corner reflection between forest trunks and water surface. For TM data, however,
the response of flooded vegetation is highly variable, depending on the amount
and type of vegetation, presence of open water, and wet soil, etc. Although SAR
Figure 5. Multiple regression results for the 1994 (top) and 1997 (bottom) SAR and TMfraction images. (a) JERS9450.266Soil94 + 0.416Shade94 + 0.326Vegetation94242.75,R250.54; (b) JERS9751.396Soil97 + 1.526Shade97 + 1.436Vegetation972151.50, R250.82.
3836 Y. E. Shimabukuro et al.
Dow
nloa
ded
By:
[IB
ICT
INP
E] A
t: 12
:55
24 A
ugus
t 200
7
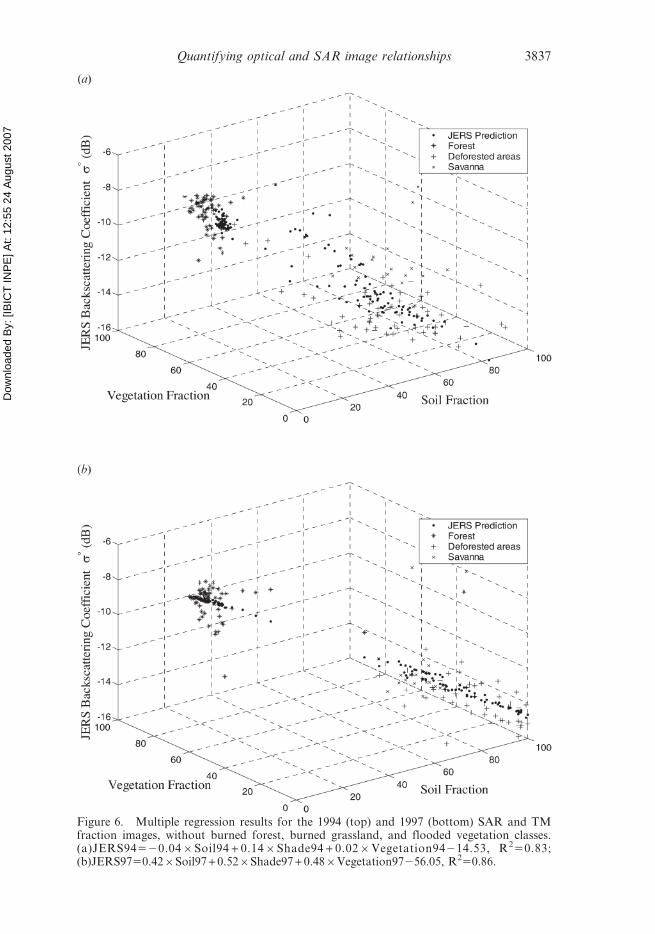
Figure 6. Multiple regression results for the 1994 (top) and 1997 (bottom) SAR and TMfraction images, without burned forest, burned grassland, and flooded vegetation classes.(a)JERS94520.046Soil94 + 0.146Shade94 + 0.026Vegetation94214.53, R250.83;(b)JERS9750.426Soil97 + 0.526Shade97 + 0.486Vegetation97256.05, R250.86.
Quantifying optical and SAR image relationships 3837
Dow
nloa
ded
By:
[IB
ICT
INP
E] A
t: 12
:55
24 A
ugus
t 200
7
responses were similar for both dates, the fraction image values varied due to
flooded vegetation characteristics as observed by TM fraction images over the
time period.
Increase of multiple regression coefficient of determination occurred if burned
forest, burned grassland, and flooded vegetation classes were not considered in the
analysis. This was especially true for the year of 1994, with R2 values increasing from
0.54 to 0.83, as indicated in figure 6 (top). The low increase (0.82 to 0.86) for 1997
(figure 6, bottom) data set also confirmed the influence of these classes.
The regression analysis performed with the individual TM fraction images and
SAR data also produced higher R2 when considering data without the three classes
(burned forest, burned grassland, and flooded vegetation). As indicated in table 1,
there was a consistent increase in R2 values of TM fraction images regressed to SAR
data from 1994 compared with 1997, particularly if burned classes were not
included.
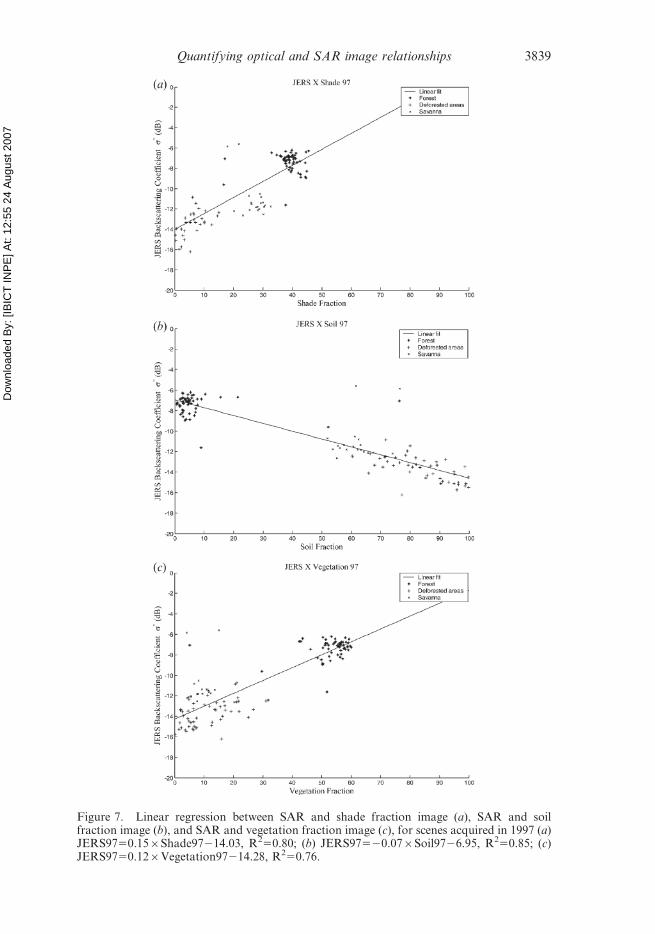
Figure 7 shows the scatterplot of shade fraction and SAR images (top) with higher
values for forest class in both data. For deforestation class, values in shade fraction
and SAR images are lower and, for savanna class, with less dense vegetation and
some soil response, values are intermediate. The scatterplot of soil fraction and SAR
images (middle) shows inverse results, i.e. lower values in soil fraction and higher
values in SAR image for forest class. For deforestation class, values are higher for
soil and lower for SAR images and, for savanna class, with less dense vegetation
cover and some soil response, values are intermediate. On the other hand, the
scatterplot of vegetation fraction and SAR images (bottom) shows higher values for
forest class in both data. For deforestation class, values in vegetation and SAR
images are lower and, for savanna class, with less dense vegetation and some soil
response, values are intermediate. These results confirmed that JERS-1 SAR
responses are strongly related to land surface characteristics as represented by land
cover classes in the TM fraction images.
5. Conclusions
Multiple regression analysis indicated that SAR data are highly correlated with
information derived from Landsat-TM fraction images (shade, soil and vegetation),
for different features in the Amazonian landscape. Features related to recently
burned areas with wood material left over, however, were not related in SAR and
Landsat-TM fraction images.
These results confirm the potential of using L-band SAR data as a
complementary source of information for mapping land cover types in Amazonia,
especially in areas with frequent cloud cover.
Table 1. R2 values of TM fraction images regressed to SAR data for 1994 and 1997.
SAR and TM fraction images 1994 1997
Soil fraction images 0.41 0.77Soil fraction images (without burned and flooded vegetation classes) 0.76 0.85Shade fraction images 0.30 0.79Shade fraction images (without burned and flooded vegetation classes) 0.72 0.80Vegetation fraction images 0.13 0.55Vegetation fraction images (without burned and flooded vegetation classes) 0.52 0.76
3838 Y. E. Shimabukuro et al.
Dow
nloa
ded
By:
[IB
ICT
INP
E] A
t: 12
:55
24 A
ugus
t 200
7
Figure 7. Linear regression between SAR and shade fraction image (a), SAR and soilfraction image (b), and SAR and vegetation fraction image (c), for scenes acquired in 1997 (a)JERS9750.156Shade97214.03, R250.80; (b) JERS97520.076Soil9726.95, R250.85; (c)JERS9750.126Vegetation97214.28, R250.76.
Quantifying optical and SAR image relationships 3839
Dow
nloa
ded
By:
[IB
ICT
INP
E] A
t: 12
:55
24 A
ugus
t 200
7
AcknowledgmentsJERS-1 SAR images were provided by the Earth Observation Research and
Application Center (EORC) of the Japan Aerospace Exploration Agency (JAXA),
within the framework of the JERS-1 SAR Global Rain Forest Mapping (GRFM)
Project, and Landsat-TM images were provided by the National Institute for Space
Research (INPE). The authors also thank the reviewers for their valuable comments
and suggestions to improve the manuscript.
ReferencesADAMS, J.B., SABOL, D., KAPOS, V., ALMEIDA-FILHO, R., ROBERTS, D.A., SMITH, M.O. and
GILLESPIE, A.R., 1995, Classification of multispectral images based on fractions of
endmembers: application to land-cover in the Brazilian Amazon. Remote Sensing of
Environment, 52, pp. 137–152.
ALMEIDA-FILHO, R. and SHIMABUKURO, Y.E., 2002, Digital processing of a Landsat-TM time-
series for mapping and monitoring degraded areas caused by independent gold miners,
Roraima State, Brazilian Amazon. Remote Sensing of Environment, 79, pp. 42–50.
ALMEIDA-FILHO, R., ROSENQVIST, A., SHIMABUKURO, Y.E. and SANTOS, J.R., 2005,
Evaluation and perspectives of using multi-temporal L-band SAR data to monitor
deforestation in the Brazilian Amazonia. IEEE Geoscience and Remote Sensing
Letters, 2, pp. 409–412.
HOEKMAN, D.H. and QUINONES, M.J., 2000, Land cover type and biomass classification using
AirSAR data for evaluation of monitoring scenarios in the Colombian Amazon.
IEEE Transactions on Geoscience and Remote Sensing, 38, pp. 685–696.
IMHOFF, M.L., STORY, M., VERMILLION, C., KHAN, F. and POLCYN, F., 1986, Forest canopy
characterization and vegetation penetration assessment with space-borne radar. IEEE
Transactions on Geoscience and Remote Sensing, 24, pp. 535–542.
KUPLICH, T.M., 2006, Classifying regenerating forest stages in Amazonia using remotely
sensed images and a neural network. Forest Ecology and Management, 234, pp. 1–9.
RIGNOT, E., SALAS, W.A. and SKOLE, D.L., 1997, Mapping deforestation and secondary
growth in Rondonia, Brazil, using imaging radar and Thematic Mapper data. Remote
Sensing of Environment, 59, pp. 167–179.
ROSENQVIST, A., 1996, Evaluation of JERS-1/SAR and Almaz/SAR backscatter for rubber
and oil palm stands in West Malaysia. International Journal of Remote Sensing, 17,
pp. 191–202.
SGRENZAROLI, M., dE GRANDI, G.F., EVA, H. and ACHARD, F., 2002, Tropical forest cover
monitoring: estimates from the GRFM JERS-1 radar mosaic using zooming techniques
and validation. International Journal of Remote Sensing, 23, pp. 1329–1355.
SHI, Z. and FUNG, K.B., 1994, A comparison of digital speckle filters. In Proceedings of
IGARSS 94, 8–12 August 1994 (Piscataway, NJ: IEEE), pp. 2129–2133.
SHIMABUKURO, Y.E. and SMITH, J.A., 1991, The least-squares mixing models to generate
fraction images derived from remote sensing multispectral data. IEEE Transactions on
Geoscience and Remote Sensing, 29, pp. 16–20.
SHIMABUKURO, Y.E., BATISTA, G.T., MELLO, E.M.K., MOREIRA, J.C. and DUARTE, V., 1998,
Using shade fraction image segmentation to evaluate deforestation in Landsat
Thematic Mapper images of the Amazon region. International Journal of Remote
Sensing, 19, pp. 535–541.
SHIMADA, M., 2001, User’s Guide to NASDA’s SAR products. Ver.3. Tokyo, 23p.
STONE, T.A. and WOODWELL, G.M., 1988, Shuttle imaging radar analysis of land use in
Amazonia. International Journal of Remote Sensing, 9, pp. 95–105.
3840 Quantifying optical and SAR image relationships