Thermal buckling analysis for stiffened orthotropic cylindrical ...
Upload
independentCategory
view
4download
0
Quantifying Effective Magnetic Moments of Narrow CylindricalObjects in MRI
Yu-Chung N. Cheng1, Ching-Yi Hsieh2, Jaladhar Neelavalli3, and E. Mark Haacke11 Department of Radiology, Wayne State University, Detroit, MI 482012 Medical Physics Program, Wayne State University, Detroit, MI 482013 Department of Biomedical Engineering, Wayne State University, Detroit, MI 48201
AbstractA new procedure for accurately measuring effective magnetic moments of long cylinders ispresented. Partial volume, dephasing, and phase aliasing effects are naturally included and overcomein our approach. Images from a typical gradient echo sequence at one single echo time are usuallysufficient to quantify the effective magnetic moment of a cylindrical-like object. Only pixels in theneighborhood of the object are needed. Our approach can accurately quantify the magnetic momentsand distinguish subpixel changes of cross sections between cylindrical objects. Uncertainties of ourprocedure are studied through the error propagation method. Images acquired with differentparameters are used to test the robustness of our method. Alternate approaches and their limitationsto extract magnet moments of objects with different orientations are also discussed. Our method hasthe potential to be applied to any long object whose cross section is close to a disk.
KeywordsCISSCO; magnetic moment; MRI; quantification; subpixel; susceptibility
1 IntroductionChanges of blood oxygenation cause a change in the magnetic susceptibility of venous blood.This is the basis of functional magnetic resonance imaging (fMRI) (e.g., see [1]). For thisreason, there has been a strong interest to quantify the magnetic susceptibility of venous blood.As a forward problem, researchers in MRI usually model a blood vessel as an infinitely longcylinder and calculate its MR signal with a known susceptibility of the vessel obtained fromex vivo studies [2]. In order to avoid the partial volume effect in MRI but to obtain accurateresults, an ex vivo study usually analyzes the phase information both inside and outside acylindrical test tube whose diameter occupies at least 10 image pixels [2]. If the wall thicknessof the test tube can be neglected, this approach can accurately recover the susceptibilitydifference between the materials inside and outside the cylinder. On the other hand, the invivo measurement of the blood susceptibility has also been performed on vessels with largeenough diameters (e.g., [3]). Nonetheless, the quantification of susceptibility of a cylindricalobject with a small diameter has been a challenging problem and has not yet been tackled. Untilrecently, we [4] and Sedlacik et al. [5] have attempted to solve this inverse problem with twoindependent approaches. The former requires a priori knowledge of the cylinder radius while
Corresponding author: Y.-C. N. Cheng, MRI Center/Concourse Research, Harper University Hospital, 3990 John R Street, Detroit MI,48201, Tel: 313-966-8220, Fax: 313-745-9182, [email protected].
NIH Public AccessAuthor ManuscriptPhys Med Biol. Author manuscript; available in PMC 2010 November 1.
Published in final edited form as:Phys Med Biol. 2009 November 21; 54(22): 7025–7044. doi:10.1088/0031-9155/54/22/018.
NIH
-PA Author Manuscript
NIH
-PA Author Manuscript
NIH
-PA Author Manuscript
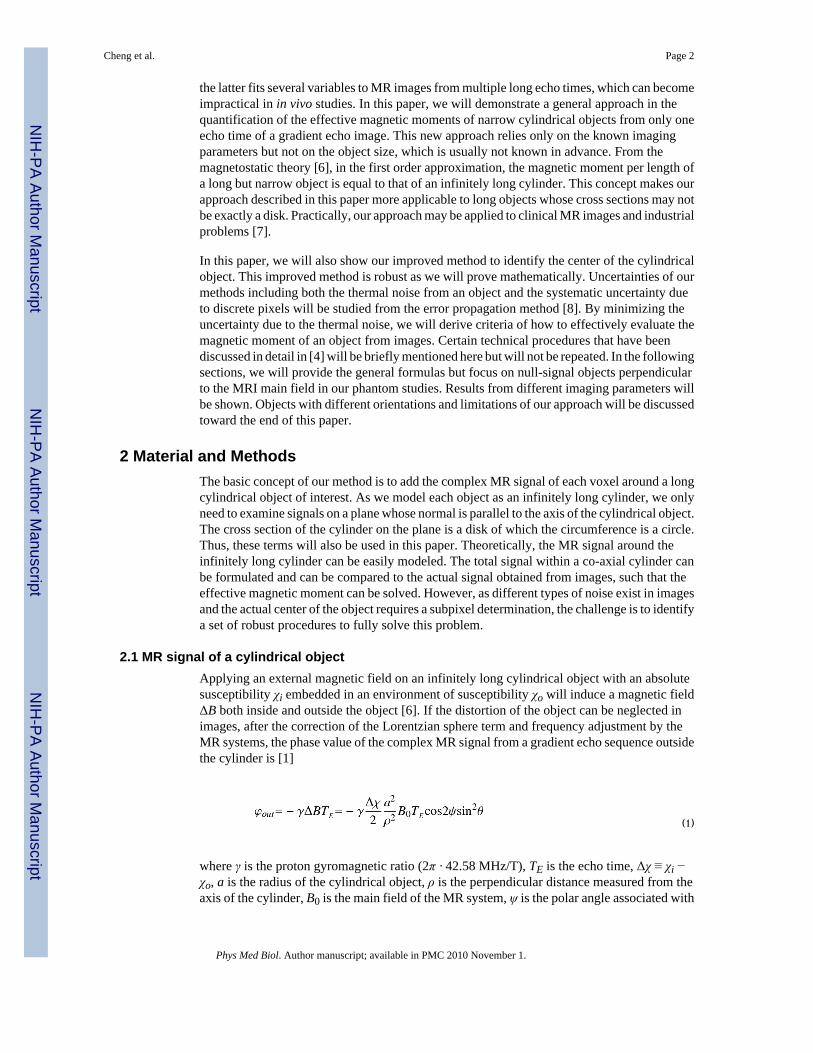
the latter fits several variables to MR images from multiple long echo times, which can becomeimpractical in in vivo studies. In this paper, we will demonstrate a general approach in thequantification of the effective magnetic moments of narrow cylindrical objects from only oneecho time of a gradient echo image. This new approach relies only on the known imagingparameters but not on the object size, which is usually not known in advance. From themagnetostatic theory [6], in the first order approximation, the magnetic moment per length ofa long but narrow object is equal to that of an infinitely long cylinder. This concept makes ourapproach described in this paper more applicable to long objects whose cross sections may notbe exactly a disk. Practically, our approach may be applied to clinical MR images and industrialproblems [7].
In this paper, we will also show our improved method to identify the center of the cylindricalobject. This improved method is robust as we will prove mathematically. Uncertainties of ourmethods including both the thermal noise from an object and the systematic uncertainty dueto discrete pixels will be studied from the error propagation method [8]. By minimizing theuncertainty due to the thermal noise, we will derive criteria of how to effectively evaluate themagnetic moment of an object from images. Certain technical procedures that have beendiscussed in detail in [4] will be briefly mentioned here but will not be repeated. In the followingsections, we will provide the general formulas but focus on null-signal objects perpendicularto the MRI main field in our phantom studies. Results from different imaging parameters willbe shown. Objects with different orientations and limitations of our approach will be discussedtoward the end of this paper.
2 Material and MethodsThe basic concept of our method is to add the complex MR signal of each voxel around a longcylindrical object of interest. As we model each object as an infinitely long cylinder, we onlyneed to examine signals on a plane whose normal is parallel to the axis of the cylindrical object.The cross section of the cylinder on the plane is a disk of which the circumference is a circle.Thus, these terms will also be used in this paper. Theoretically, the MR signal around theinfinitely long cylinder can be easily modeled. The total signal within a co-axial cylinder canbe formulated and can be compared to the actual signal obtained from images, such that theeffective magnetic moment can be solved. However, as different types of noise exist in imagesand the actual center of the object requires a subpixel determination, the challenge is to identifya set of robust procedures to fully solve this problem.
2.1 MR signal of a cylindrical objectApplying an external magnetic field on an infinitely long cylindrical object with an absolutesusceptibility χi embedded in an environment of susceptibility χo will induce a magnetic fieldΔB both inside and outside the object [6]. If the distortion of the object can be neglected inimages, after the correction of the Lorentzian sphere term and frequency adjustment by theMR systems, the phase value of the complex MR signal from a gradient echo sequence outsidethe cylinder is [1]
(1)
where γ is the proton gyromagnetic ratio (2π · 42.58 MHz/T), TE is the echo time, Δχ ≡ χi −χo, a is the radius of the cylindrical object, ρ is the perpendicular distance measured from theaxis of the cylinder, B0 is the main field of the MR system, ψ is the polar angle associated with
Cheng et al. Page 2
Phys Med Biol. Author manuscript; available in PMC 2010 November 1.
NIH
-PA Author Manuscript
NIH
-PA Author Manuscript
NIH
-PA Author Manuscript

ρ, and θ is the angle between the main field direction and the axis of the cylinder. Figure 1shows the coordinate system used in Eq. 1.
In the context of this paper, it is Δχ that we wish to measure from experiments. Thus, the termsusceptibility in this paper refers to Δχ rather than the absolute susceptibility of the object. Inaddition, we have adopted SI units. From Eq. 1, we define the maximal (or minimal, dependingon the sign of Δχ) phase value g as
(2)
and the effective magnetic moment (or “magnetic moment, hereafter) as
(3)
Under the same consideration, the induced phase value inside the cylinder is [1]
(4)
If we consider a pseudo cylinder with radius R that is co-axial with the cylindrical object (seeFig. 2), for g ≠ 0, the overall MR signal of the pseudo cylinder from a gradient echo sequenceis [4]
(5)
where ℓ is an arbitrary length of the cylindrical object and can be the slice thickness of theimage, J0 is the zeroth order Bessel function, ρ0,c is the effective spin density of the cylindricalobject, and ρ0 is the effective spin density of the tissue around the object. Both ρ0,c and ρ0 areconstants but depend on imaging and tissue parameters such as relaxation times. Although Eq.5 is derived for an infinitely long cylinder, practically, it is the MR signal per unit length ofthe pseudo cylinder (S/ℓ) that is needed in our analysis. Thus, an image slice whose normalcomponent is parallel to the cylinder axis should be used in all quantifications. On that slice,the cross section of the cylindrical object appears as a disk. The same is true for the co-axialpseudo cylinder. The orientation of the cylinder, θ, can be estimated from the coordinates ofthe two ends of the cylindrical object in images. Therefore, the unknowns in Eq. 5 are reducedto g, p, ρ0, and ρ0,c.
2.2 Determining the center of the cylindrical objectEquation 5 is valid only when the center of the disk (i.e., the cross section of the cylindricalobject) is identical to the center of the pseudo disk. Thus the first step is to identify the centerof the disk. When a cylindrical object itself has no MR signal, i.e., ρ0,c = 0, we can identify thecenter of the object by minimizing the imaginary part of the signal (Eq. 5) within the pseudodisk [4].
Cheng et al. Page 3
Phys Med Biol. Author manuscript; available in PMC 2010 November 1.
NIH
-PA Author Manuscript
NIH
-PA Author Manuscript
NIH
-PA Author Manuscript

When a cylindrical object has a non-zero ρ0,c, even if the pseudo circle is replaced by twopseudo concentric circles such that the imaginary part from the annular ring is theoreticallyzero, the above approach still fails. This is because when the object has an imaginary part ofthe MR signal, its point spread function leads to an additional imaginary signal in each pixeloutside the object. On the other hand, although the “subvoxel shift approach by [5] is valid, itrequires many Fourier transformations of an image and thus longer computing time. We offertwo alternate approaches below.
The first alternate approach is to maximize the real part of the signal from an annular ringregion where the disk is completely inside the smaller pseudo circle. Assume that the annularring region is formed by two pseudo circles with radii R1 and R2 and a < R1 < R2. The center
of the object is located at coordinates (x0, y0) with . The MR signal from theannular ring is
(6)
where the relations between ρ, ρ, ψ, and ψ in the integrand are given by ρcosψ = x0 + ρcosψand ρsinψ = y0 + ρsinψ. One can analytically prove that at x0 = y0 = 0, , and .Appendix A proves that the real part of the signal is maximum at x0 = y0 = 0 under certainconditions.
The second approach is to minimize the real part of the signal within one pseudo circle with
radius R. With the parameters defined above and with , the MR signal of the pseudodisk is
(7)
where the relations ρcosψ = x0+ ρcosψ and ρsinψ = y0+ ρsinψ still hold. In addition, r(ψ) is theminimal value of ρ and satisfies r(ψ) cosψ = x0 + a cosψ and r(ψ) sinψ = y0 + a sinψ. This leadsto
(8)
and
(9)
where and .
Cheng et al. Page 4
Phys Med Biol. Author manuscript; available in PMC 2010 November 1.
NIH
-PA Author Manuscript
NIH
-PA Author Manuscript
NIH
-PA Author Manuscript

Again, one can analytically prove that at x0 = y0 = 0, , and . Appendix B provesthat the real part of the signal is minimum at x0 = y0 = 0.
All these approaches will fail when θ = 0. In this special case, no phase value is outside theobject (see Eq. 1). The MR signal becomes:
(10)
where A is an arbitrarily shaped area that encloses the disk. Only the size of the object can bedetermined in this case.
2.3 Magnetic moment of the cylindrical objectAs shown in Fig. 3, if three arbitrary concentric circles with radii R1, R2, and R3 are chosen,then three complex signals S1, S2, and S3 can be calculated from MR images as described in[4]. In order to improve the accuracy of our approach, each image pixel is further divided into100 subpixels in the calculations of the complex signals Si [4]. From Eq. 5, we obtain
(11)
where the effective magnetic moment, p, becomes the only unknown in the equation. Note thatboth ±p satisfy Eq. 11 but the correct sign of p may be determined from MR phase images withthe help of Eq. 1. From Eq. 1, it is clear that is the maximal (or minimal) phase valueat the circumference of the i-th circle (where i = 1, 2, 3). Therefore, if any Ri is chosen largerthan the phase aliasing area, then will be always less than π and the solution of |psin2 θ| can be numerically searched between 0 and with a Van Wijngaarden-Dekker-Brent method [9], where Rmin is the smallest radius among three circles Ri. With the choicesof in the following subsection, the solution of p2 sin4 θ in Eq. 11 is unique. This isbecause ∫ dx/x2 J0(x) can be well approximated by −1/x − x/4 in our consideration, which leadsto a monotonic function of p2 sin4 θ in Eq. 11. For example, when is 0.5 and
is 1, the deviation between the exact integral and its approximation is 0.5%. When is 1 and varies from 2.5 to 3.0, the deviation increases monotonically
from 7% to 12%. Thus, the initial guess of |p sin2 θ| may be chosen as . After p is solved,the effective spin density ρ0 can be solved from the signal of an annular ring, e.g., S1 − S2.
The above discussion is generally valid except when the angle θ is close to zero. At θ = 0, nomagnetic moment appears in the signal, which is given by Eq. 10.
2.4 Uncertainty of the magnetic momentIt is important to study the uncertainty of the method when it is applied to actual images. Inaddition, in order to determine the optimal choices of three radii for the quantification of themagnetic moment, the study of the uncertainty can provide some insights. Thermal noise dueto the presence of an object and systematic noise due to discrete pixels in images always exist.They lead to the uncertainty of p. By defining p ≡ p sin2 θ and rewriting Eq. 11, we can derivethe uncertainty of p through error propagation [8]:
Cheng et al. Page 5
Phys Med Biol. Author manuscript; available in PMC 2010 November 1.
NIH
-PA Author Manuscript
NIH
-PA Author Manuscript
NIH
-PA Author Manuscript

(12)
where hij is defined as
(13)
with i, j = 1, 2, 3 and
(14)
Here is chosen to be between 0 and π for all i. In the derivation of Eq. 12, we havealready assumed that R3 < R2 < R1 such that the uncertainty from the annular ring regionbetween R2 and R3 is uncorrelated with the uncertainty from the area between R1 and R2. Theuncertainty from each annular ring consists of the thermal noise and the systematic noise. Both
noise sources are also uncorrelated. The former can be approximated by where σ is the standard deviation of the thermal noise in the image and ΔxΔy is the image in-plane resolution [4]. The systematic noise is represented by εij calculated from δ(SiSj) ≡ εij|SiSj| when the thermal noise is neglected. The uncertainty due to the systematic noise δ(SiSj)can be calculated if the center of the cylindrical object, the radius of the object, and thesusceptibility difference are all known. Some examples were shown in [4,10].
Equation 12 can be rewritten as
(15)
where SNR ≡ ρ0/σ is the signal to noise ratio of the magnitude image. In order to determinethe optimal combination of φ1, φ2, and φ3, for simplicity, we assume ε12 = ε23 = 0 in Eq. 15and numerically search for the minimum of δp/p with 0 < φi ≤ π for i = 1, 2, 3.
2.5 Resolving the susceptibility when the object has no spin densityThe susceptibility can be calculated from the known effective magnetic moment, if the radiusof the object can be determined. Two approaches are considered to determine the radius of theobject when the object has no spin density. The first approach is to utilize a spin echo sequence.The second approach is to perform a gradient echo sequence at a short echo time.
If a spin echo sequence is used to image the cross section of the object, the MR signal from anarbitrarily uniform area A that includes the object is:
Cheng et al. Page 6
Phys Med Biol. Author manuscript; available in PMC 2010 November 1.
NIH
-PA Author Manuscript
NIH
-PA Author Manuscript
NIH
-PA Author Manuscript

(16)
where ρ0,SE is the effective spin density (a constant) of the spin echo images. We have neglectedthe dephasing effect during the sampling time. With two arbitrary areas A1 and A2 such thatA2 is completely enclosed by A1, ρ0,SE and the cross section of the object πa2 can be determined.The uncertainty of the cross section can be derived from the error propagation method.
(17)
Note that SNR in Eq. 17 refers to the signal to noise ratio of the spin echo image. The noisebetween A2 and A1 − A2 is uncorrelated. In order to minimize the uncertainty, it is obviousfrom Eq. 17 that the area A1A2 should be chosen as large as possible before heterogeneity isencountered in the images, while the area A2 should be chosen as small as possible but largerthan πa2. In fact, A2 has to be larger than the area of the distorted object in the image so thecross section of the object can be estimated more accurately.
In the gradient echo approach, an additional pseudo circle with radius R may be used to solveEq. 5 as g becomes the only unknown after both p and ρ0 are found. However, Fig. 4ademonstrates that the integral in Eq. 5 oscillates and quickly approaches an asymptotic valuewhen |g| or echo time increases (with a fixed p). This is due to the J0 function and 1/x2 in theintegrand. In order to obtain a unique solution of g from Eq. 5, the echo time TE needs to bechosen short enough such that |g| is at least less than 2.4, which is the first root of the J0(x)function. However, in order to distinguish the solution from the asymptotic value of the integralwith the presence of noise in images, the value of |g| may have to be much less than 2.4. Theradius R also needs to be large enough such that |p/R2| is much less than 2.4. We will showsome examples in the Results section.
2.6 Phantom studiesImages from three different gel phantoms are analyzed in this paper. The first set of imagescome from the phantom images in [4]. A narrow but long air cylinder with a diameter of roughly1.6 mm appears in the images. Images acquired from a coronal 3D gradient echo sequence(Fig. 3) and a spin echo sequence are available for our re-analyses. The imaging parameters ofthe gradient echo sequence were: TE = 5 ms and 20 ms, TR = 50 ms, flip angle = 15°, readbandwidth = 390 Hz per pixel (Hz/pixel), resolution = 1 mm ×1 mm ×1 mm, and fields of view= 256 mm ×128 mm ×64 mm. The imaging parameters of the spin echo sequence were: TE =8.4 ms, TR = 400 ms, read bandwidth = 130 Hz/pixel, resolution ≈ 0.55 mm ×0.55 mm, fieldsof view = 140 mm ×140 mm, slice thickness = 1.5 mm, 18 slices, and slice spacing = 1.95 mm.
The second set of images is from a phantom that consisted of a hollow straw in the gel. As oneend of the straw was sealed, the hollow straw created another air cylinder in the gel phantom.The diameter of the straw was 5.24 ± 0.01 mm. This phantom was prepared with 107 g of thegel powder in 1200 ml distilled water. The straw was placed vertically in the phantom whenthe gel was in its liquid form. Coronal images of a multiple echo 3D gradient echo sequenceand a spin echo sequence were acquired. The imaging parameters of the gradient echo sequencewere: TE = 5 ms, 10 ms, and 15 ms, TR = 25 ms, flip angle = 15°, read bandwidth = 610 Hz/pixel for TE = 5 ms and 220 Hz/pixel for the other two echo times, resolution = 1 mm ×1 mm×1 mm, and fields of view = 256 mm ×256 mm ×96 mm. The imaging parameters of the spin
Cheng et al. Page 7
Phys Med Biol. Author manuscript; available in PMC 2010 November 1.
NIH
-PA Author Manuscript
NIH
-PA Author Manuscript
NIH
-PA Author Manuscript

echo sequence were TE = 15 ms, TR = 550 ms, read bandwidths = 90 Hz/pixel and 590 Hz/pixel, resolution = 1 mm ×1 mm, fields of view = 256 mm ×256 mm, slice thickness = 2 mm,20 slices, and slice spacing = 2 mm. Both air cylinders were placed perpendicular to the mainfield of the MR system. All images were acquired from a 1.5 T Siemens Sonata system. Thephase images were all filtered by a high pass filter [11] that has a minimal effect on our studyhere [4]. A high pass filter will also remove the eddy current effects and the constantbackground phase in a given set of phase images.
The distortion of objects in images (Fig. 5) due to the susceptibility effect was studied byvarying the read bandwidth. These studies were preformed on another straw phantom made ona different day. The read bandwidths of the gradient echo sequence at TE = 10 ms were variedfrom 70 Hz/pixel, 220 Hz/pixel, 350 Hz/pixel, to 700 Hz/pixel. Other imaging parametersremained the same as those listed in the above paragraph.
2.7 Image simulationsIn order to calculate the correct systematic noise (or uncertainty) due to discrete pixels, bothimage parameters and measured magnetic moments are used. In addition, the susceptibilitydifference between the air and gel is assumed to be 9.4 ppm [12]. The simulations and theaddition of Gaussian noise were described in [4]. It is worth mentioning again that properrotations of data after Fourier transformation are required. This is due to different definitionsof the Fourier transformation in different computer software, but we follow the definitionprovided in [1].
In all simulations, we assume that θ = π/2, Δχ= 9.4 ppm, and B0 = 1.5 T. The image resolutionis set to 1 mm ×1 mm (or 1 pixel ×1 pixel). Other parameters are provided with correspondingsimulated result in the next Section.
3 Results3.1 Center of the object
The one circle approach appears to be the easiest method in the identification of the objectcenter. The radius of the pseudo circle cannot be too small or too large. In the former case, thethermal noise and discrete pixels will contribute significant uncertainty to the process. Wewould recommend a radius of at least three pixels. In the latter case, the overall MR signal willbe dominated from the pixels without magnetic moment information and become insensitiveto identifying the center. Equation 36 in Appendix C is consistent with these considerations.Based on the phase images, a circle whose circumference intersects with phase values around±2 radians along the vertical and horizontal axes is a reasonable choice while the phase of 2.6radians would be the optimal choice. In the approach of using two concentric circles, we suggestusing radii that differ by at least one pixel such that enough pixels are used in the analysis.Based on our experience in simulation and phantom studies, the center of the object identifiedby any of our three procedures often differs from the actual center by 0.1 to 0.3 pixel. Inaddition, all the results from the one circle approach agree with the theoretical criterion (Eq.36 in Appendix C). We have also tried the approach by Sedlacik et al. [5] on some of oursimulated images and have identified the same centers determined by our one-circle method.However, as the “subvoxel shift approach by [5] involves a 2D Fourier transformation of everypossible center, while our method only requires a sum of complex numbers from theneighboring subpixels, our method takes less than half the computing time of their approach.
3.2 Optimal choice of the radii combinationSimulations of Eq. 15 reveal that the uncertainty of the magnetic moment will be at a minimumwhen the three phase values are smallest, roughly 1 radian, and 2.5–3 radians. This result means
Cheng et al. Page 8
Phys Med Biol. Author manuscript; available in PMC 2010 November 1.
NIH
-PA Author Manuscript
NIH
-PA Author Manuscript
NIH
-PA Author Manuscript

that one circle should be chosen as large as possible while the other two circles should bechosen when their radii are roughly the lengths from the center of the object to the desiredphase values. All circles should be outside the phase aliasing region. Due to the left handedsetting by MRI manufacturers, note that the signs in all phase images of Fig. 3 are opposite tothe signs in Eq. 1 (right handed system). Practically, as the uncertainty in the phase image isinversely proportional to SNR in the magnitude image [1], the radius of the largest circle canbe chosen where the phase value is not smaller than 0.1 radian. Furthermore, as the MR signalis discretized and the center of the object may be different from the center of a pixel, the phasevalue measured from MR images may not be exactly equal to any of the above desired phasevalues and may not be symmetric around the object. In addition, phase values close to ±πradians may not be available from the phase profiles due to the partial volume effect. Simulatedphase profiles shown in Fig. 6 reflect these practical problems.
In any case, the phase profiles are only used as references for choosing the radii of the threecircles for the measurements of the magnetic moment. It is not necessary to identify the exactphase values for our measurements. In fact, any choice of three circles can lead to a solutionof the magnetic moment except that the uncertainty may be larger than desired (see below).Nevertheless, in order to better estimate the uncertainty (Eq. 15) due to each radius used in ouranalyses, we have averaged four radii and their corresponding phase values taken from avertical and a horizontal phase profile through the center of the object.
3.3 Measurements of the magnetic momentTable 1a lists the magnetic moments obtained from our previous data [4]. As the radii of thethree circles are chosen as described above, the uncertainties calculated from Eq. 15 are lessthan 10%. As a comparison, when the radii of the largest circles are reduced, the uncertaintiesof the measured magnetic moments are increased but are still within 16% (Table 1b).
In theory, the effective magnetic moment is proportional to the echo time. The results of themagnetic moment obtained from different echo times clearly show that relationship withinuncertainties in Table 1. With the known radius of the object 0.8 mm and an assumed Δχ= 9.4ppm, the theoretical magnetic moments at TE = 5 ms and 20 ms are 6.04 radian·mm2 and 24.14radian·mm2, respectively. That the magnetic moment at the bottom slice is smaller than thatat the top is likely due to the collapsing of the air cylinder in the gel phantom.
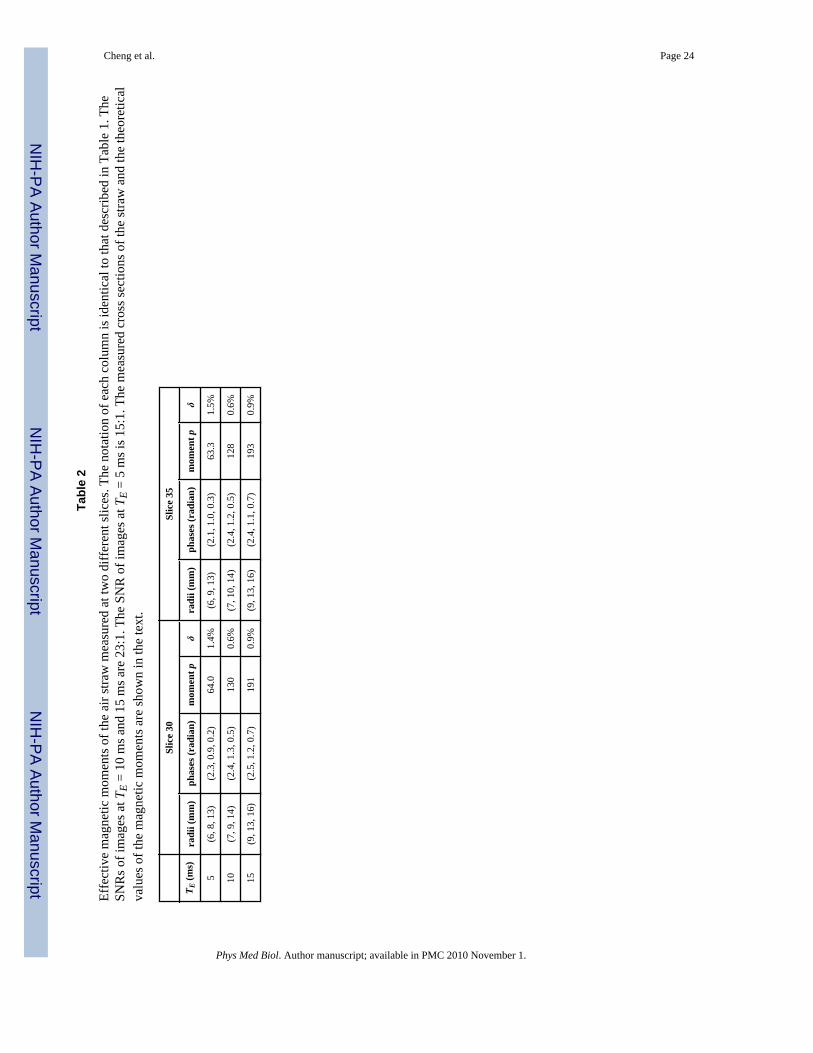
Two slices of the second phantom (straw phantom) at three echo times are analyzed and theirresults are shown in Table 2. As the diameter of the straw is 5.24 ± 0.01 mm, the theoreticalmagnetic moments at TE = 5 ms, 10 ms and 15 ms are 64.7 radian·mm2, 129.5 radian·mm2,and 194.2 radian·mm2, respectively. Even though the cross section of the straw is slightlydeformed during the solidification of the gel solution, the measured magnetic moments are stillin good agreement with the theoretical values and between themselves at different echo times.However, when the calculated uncertainty is less than 1%, one will need to consider theinaccuracy due to pure numerical algorithms which can be as large as 0.3% [4].
Table 3 shows magnetic moments of the straw at four different read bandwidths from the sameslice. All the measured magnetic moments agree with each other within uncertainties.Therefore, our measurements of the magnetic moment from a gradient echo sequence do notseem to be affected by the distortion effect even at a relatively low bandwidth. The measuredmoments in both Tables 2 and 3 are slightly different from the theoretical values as the presenceof the gel powder used in the phantoms can shift the susceptibility away from that of purewater. As we choose the radii outside the phase aliasing regions, we also effectively avoid thedistortion effect.
Cheng et al. Page 9
Phys Med Biol. Author manuscript; available in PMC 2010 November 1.
NIH
-PA Author Manuscript
NIH
-PA Author Manuscript
NIH
-PA Author Manuscript

3.4 Estimations of object volumes from spin echo imagesWhen the object has no spin density, the cross section of the object and its uncertainty arecalculated based on Eq. 16 and Eq. 17. Three slices of the spin echo images from our previousstudy are analyzed as they correspond to slice 10, 19, and 37 of the gradient echo images. Themeasured cross sections are shown in Table 4. The result from slice 19 agrees well with thetheoretical value of the object cross section, 2.01 mm2. In general, the results from Table 4also indicate a collapse at the bottom of the phantom and an enlargement of the object at thetop of the phantom.
For the straw phantom, one slice of the spin echo images at two different read bandwidths isanalyzed. The SNR is 33:1 for images acquired with bandwidth 90 Hz/pixel and is 11:1 forimages with bandwidth 590 Hz/pixel. The measured cross sections are 21.4 ± 0.3 mm2 and22.2 ± 0.8 mm2 at bandwidth 90 Hz/pixel and 590 Hz/pixel, respectively. In the former case,A1 = 1148 mm2 and A2 = 120 mm2, while in the latter case A1 = 821 mm2 and A2 = 69 mm2.The theoretical value of the cross section is 21.6 mm2 if the cross section is a perfect disk. Asthe straw has slightly deformed inside the gel phantom, its cross section may not be a perfectdisk but has a smaller cross section than that of the perfect disk, given the same circumference.These results show good agreement between the measurements and the theoretical value withinuncertainties predicted by Eq. 17. The results also indicate that the geometric distortion doesnot significantly affect the quantification.
3.5 Resolving susceptibility from gradient echo simulations with no spin density of the objectIn addition to our efforts in the previous subsection, we also explore the possibility ofquantifying susceptibility from gradient echo images. We investigate this possibility withsimulations. If all variables and parameters are known, we can calculate the MR signal in eachcase. Such an MR signal is a number and is displayed as a horizontal straight line in Fig. 4a or4b. On the other hand, if the magnetic moment p is known but the susceptibility and objectradius are not known, then we can simulate the MR signal as a function of g, as shown as acurve in Fig. 4a or 4b. The intersections of the curve and the line indicate the possible solutionsof the susceptibility. The result shown in Fig. 4a indicates that the minimal value of |Δχ| (witha fixed p) can be extracted at a given echo time. In this example, the minimal value of |Δχ| isroughly 1.5 ppm, much less than 9.4 ppm used for the image simulations. If the echo time isshortened, as shown in Fig. 4b, then g or susceptibility is likely to be uniquely determined. Ifthe thermal noise is added as one arbitrary unit (compared to ρ0ℓ, which is 10 units) and animage resolution is assumed as 1 mm2, then the uncertainty of the signal S within a radius R
(3 mm) is roughly 5.3 units ( ). This means that the signal S is within one standarddeviation of the asymptotic value shown in Fig. 4a when g is larger than roughly 3.5. On theother hand, with a much shorter echo time (which may be impractical), the susceptibility andradius of the object can be resolved from Eq. 5 and Fig. 4b. However, this result implies thatthe spin echo approach presented in the above subsection seems better.
The examples shown in Fig. 4a and 4b indicate that one cannot accurately determine thesusceptibility and object size through a curve fitting of data from long echo times, where gbecomes too large. If sufficient noise had been included in the simulations, both Fig. 4c and4d demonstrate that the volume fraction and susceptibility each can only be roughly determinedat orders of magnitude through curve fitting. However, when an object has enough MR signal,the curve fitting method appears applicable to determine the susceptibility and volume of theobject [5]. This is because Eq. 4 only contains the susceptibility information (i.e., g), ratherthan the magnetic moment (i.e., p).
Cheng et al. Page 10
Phys Med Biol. Author manuscript; available in PMC 2010 November 1.
NIH
-PA Author Manuscript
NIH
-PA Author Manuscript
NIH
-PA Author Manuscript

4 DiscussionThree common problems in MRI have been overcome in our method of obtaining the magneticmoment: partial volume effect, dephasing effect (signal loss shown in Fig. 6a and 6c), and thephase aliasing effect (shown in Fig. 6d). In our examples, the partial volume effect isovershadowed by the dephasing effect. These are practical reasons why our method appliedon small objects is much better than the conventional least squares fitting method or the methodof measuring the relaxation time . Some results of how bad the least squares fitting methodhas performed are shown in [4].
As shown in Fig. 6, even when the object has no signal, the actual center of the object may notbe in the pixel with the lowest magnitude signal. This fact implies that the center of the objecthas to be determined based on the information outside the object, as suggested by ourprocedures here or by Sedlacik et al. [5]. However, the approach by [5] will take much longertime than ours.
After the center of the object is identified, two phase profiles through the object center alongthe vertical and horizontal directions are used for the selections of the radii of three circles. Allthree circles should be larger than the phase aliasing area around the object but the smallestcircle should be as small as possible (i.e., as close to the aliased phase as possible). However,as shown in Fig. 6, the maximum phase value may not be close to ±π radians but a choice ofa slightly larger radius of the smallest circle does not seem to increase the uncertainty much.Due to the discrete pixels, a function can be used to interpolate the phase values such that moreaccurate phase values can be used for the selections of three radii at non-integer pixels. Forthis purpose, we have tried a linear function and a function based on Eq. 1 and we have foundno difference of which function to use. This is clearly supported by the fact that Eq. 11 doesnot rely on the knowledge of phase values, which only serve as references of how to choosethe radii. The radii of non-integer pixels are an important feature in our method. For example,if we consider two radii at 2.3 and 2.6 pixels, both radii refer to the same pixel along the verticaland horizontal directions. However, as the signal inside a circle can change even with a slightchange of its radius, Eq. 11 offers a much more accurate way to solve the magnetic moment.Practically, a uniform region may appear only around the neighborhood of the object. Evenwith non-optimal choices of radii, our method appears to be effective as most of theuncertainties listed in Table 1b are still within 10%.
The uncertainty δp/p derived from Eq. 15 is inversely proportional to SNR and (or ).This is clearly shown in Table 1. Although Eq. 15 implies that the longer the echo time, thesmaller the uncertainty, it is important to remember that the SNR of the material around theobject will also reduce when the echo time increases. Thus, if the echo time is longer than therelaxation time T2 of the surrounding material, the uncertainty will likely increase.
The systematic uncertainty and the uncertainty due to the thermal noise in the measurementsof magnetic moments are comparable in most of our phantom studies. Although all sources ofuncertainties are considered uncorrelated in Eq. 15, actually, the systematic uncertainties fromtwo annular rings S1S2 and S2S3 may be partially correlated as they share the same boundary(2πR2). However, we have neglected that correlation in this research.
Given the uncertainties and magnetic moments shown in Table 1, the internal collapsing of theair cylinder in the first phantom seems the only explanation. The measurements of the crosssections from the spin echo images also support this finding (Table 4). This collapsing is notobvious from the visual inspection of images. Assuming Δχ= 9.4 ppm, the radius of the aircylinder appears to change from 0.8 mm (slice 19) to 0.67 mm (slice 46). With an image
Cheng et al. Page 11
Phys Med Biol. Author manuscript; available in PMC 2010 November 1.
NIH
-PA Author Manuscript
NIH
-PA Author Manuscript
NIH
-PA Author Manuscript

resolution of 1 mm ×1 mm, such a subpixel change of the object radius can be clearlydistinguished from our magnetic moment measurements.
The presence of the object susceptibility can lead to distortion artifacts and dephasing effectsin images. They occur in all images but in the gradient echo images the dephasing effect at theecho dominates the artifacts unless the read bandwidth is very low. A usual way to minimizethe distortion artifacts is to increase the read bandwidth in a sequence. However this changewill lead to a lower SNR in images and thus a larger uncertainty (Eq. 15 and Table 4). Ourphantom studies indicate that the geometric distortion does not seem to affect the measurementsof magnetic moment as shown in Table 3. In the spin echo images, as the dephasing effect dueto the susceptibility difference can be enhanced during the sampling period, the measuredvolume of the object should be treated as the maximal volume. This is supported by the resultsshown in Table 4. The geometric distortion also does not seem to affect the volumemeasurements of the objects from the spin echo images.
Although the absolute susceptibility of gel is assumed as the same as the absolute susceptibilityof water, −9 ppm, in our analyses, the actual susceptibility of the gel may be slightly differentthan that of water.
4.1 Resolving susceptibility and volume when the object has no spin densityFurther examination of Eq. 17 indicates some interesting aspects and the limitation of the spinecho approach. If the cross section of the object occupies more than one pixel in the image,then the uncertainty estimated from Eq. 17 does not depend on the image resolution but it
depends on the fields of view. This is because SNR is proportional to where Lxand Ly are the fields of view along the two orthogonal directions. However, if the cross sectionof the object is within one pixel, then the smallest A2 that can be chosen is ΔxΔy. If the secondterm in Eq. 17 can be neglected, then the uncertainty is proportional to . Thismeans that a spin echo image with a high resolution can determine the size of the object moreaccurately, even at the expense of a low SNR or a long imaging time. On the other hand, if theobject is less than one pixel after the image has been acquired, the uncertainty of Eq. 17 in thiscase becomes ΔxΔy/SNR. This means that if the volume fraction of the object in a pixel(πa2/(ΔxΔy)) is less than 1/SNR, the estimated uncertainty of the cross section is more than100%.
Practically, a spin echo sequence is routinely performed in each clinical diagnosis. As themagnetic moment can be determined from one gradient echo sequence described in Section2.3, knowing the radius of the object will automatically lead to the value of susceptibility. Theonly exception is when θ = 0. In this special case, only the size of the object can be determined.When a gradient echo image and a spin echo image are analyzed, no registration of the imagesis required in our approach.
In the gradient echo approach, the susceptibility and volume cannot be resolved individuallywhen the susceptibility is larger than a certain value with a fixed magnetic moment (see Fig.4a). This is consistent with the theory of electromagnetism, as in the far field the magneticmoment of an object is the leading term [6]. In general, our experience shows that the gradientecho approach for determining object susceptibility is not favorable, as the desired echo timeto minimize distortions and signal losses may need to be very short and thus require a veryhigh read bandwidth. For this reason, the spin echo approach is a better method.
Cheng et al. Page 12
Phys Med Biol. Author manuscript; available in PMC 2010 November 1.
NIH
-PA Author Manuscript
NIH
-PA Author Manuscript
NIH
-PA Author Manuscript

5 ConclusionOur method can accurately quantify the effective magnetic moment of a narrow cylinder fromMR images. It has overcome three general problems in MRI and is applicable to small objectsin a locally uniform background. However, the application of our method is not limited to smallobjects. The effective magnetic moment of an object can be obtained from standard gradientecho images while the volume of the object may be derived from typical spin echo images. Wehave demonstrated the feasibility of our approaches through phantom studies. In addition, aphantom study has revealed that a subpixel change of the object volume can be distinguishedfrom the change of magnetic moment using our method in MRI.
AcknowledgmentsThis work was supported in part by the Department of Radiology at Wayne State University and NIH HL062983-04A2.The authors would like to thank Mr. Zahid Latif, R.T., and Mr. Yang Xuan for technical assistance in phantom imaging.The authors would also like to acknowledge the use of Mathematica. The author Y.-C. N. Cheng would like to thankDr. William Condit for his stimulating discussions.
References1. Haacke, EM.; Brown, RW.; Thompson, MR.; Venkatesan, R. Magnetic Resonance Imaging: Physical
Principles and Sequence Design. John Wiley & Sons; 1999.2. Weisskoff RM, Kiihne S. MRI susceptometry: image-based measurement of absolute susceptibility of
MR contrast agent and human blood. Magn Reson Med 1992;24:375–383. [PubMed: 1569876]3. Lai S, Hopkins AL, Haacke EM, Li D, Wasserman BA, Buckley P, Friedman L, Meltzer H, Hedera
P, Friedland R. Identification of vascular structures as a major source of signal contrast in highresolution 2D and 3D functional activation imaging of the motor cortex at 1.5 T: Preliminary results.Magn Reson Med 1993;30:387–392. [PubMed: 8412613]
4. Cheng YCN, Hsieh CY, Neelavalli J, Liu Q, Dawood MS, Haacke EM. A complex sum method ofquantifying susceptibilities in cylindrical objects: The first step toward quantitative diagnosis of smallobjects in MRI. Magn Reson Imaging 2007;25(8):1171–1180. [PubMed: 17905248]
5. Sedlacik J, Rauscher A, Reichenbach JR. Obtaining blood oxygenation levels from MR signal behaviorin the presence of single venous vessels. Magn Reson Med 2007;58:1035–1044. [PubMed: 17969121]
6. Jackson, JD. Classical Electrodynamics. New York: John Wiley & Sons; 1999.7. Robson P, Hall L. Identifying particles in industrial systems using MRI susceptibility artifacts.
American Institute of Chemical Engineers 2005;51(6):1633–1640.8. Bevington, PR.; Robinson, DK. Data Reduction and Error Analysis for the Physical Sciences. New
York: McGraw-Hill; 1992.9. Press, WH.; Flannery, BP.; Teukolsky, SA.; Vetterling, WT. Numerical Recipes in C. New York:
Cambridge University Press; 1992.10. Hsieh, C-Y.; Cheng, Y-CN.; Neelavalli, J.; Haacke, EM. An improved approach of quantifying
magnetic moments of small in-vivo objects. Proceedings of the International Society for MagneticResonance in Medicine; 2007. p. 2596
11. Haacke EM, Xu Y, Cheng YCN, Reichenbach J. Susceptibility weighted imaging (SWI). Magn ResonMed 2004;52(3):612–618. [PubMed: 15334582]
12. Lide, DR., editor. Handbook of Chemistry and Physics. 87. New York: CRC Press; 2006–2007.
Appendix
A Maximizing the real signal from an annular ring to identify the object centerWe first define β ≡ ρ2 = (ρcosψ −x0)2+(ρsinψ−y0)2 and α ≡ (ρcosψ−x0)2− (ρsinψ −y0)2 suchthat
Cheng et al. Page 13
Phys Med Biol. Author manuscript; available in PMC 2010 November 1.
NIH
-PA Author Manuscript
NIH
-PA Author Manuscript
NIH
-PA Author Manuscript

(18)
We also define
(19)
such that the MR signal S is
(20)
The first derivatives of f with respect to x0 and y0 are
(21)
(22)
The second derivatives of f with respect to x0 and y0 at x0 = y0 = 0 are
(23)
(24)
As
(25)
(26)
Cheng et al. Page 14
Phys Med Biol. Author manuscript; available in PMC 2010 November 1.
NIH
-PA Author Manuscript
NIH
-PA Author Manuscript
NIH
-PA Author Manuscript

(27)
it becomes clear that
(28)
and
(29)
As R2 > R1 and the maximum of xJ1(x) occurs at x ≈ 2.4, the first root of J0(x), proper choicesof R1 and R2 can lead to a negative value of Eq. 29. Therefore, the object center can be identifiedby maximizing the real part of the signal from an annular ring.
B Minimizing the real signal of a circle to identify the object centerThe calculations used in this Section require the results derived in the Appendix A and Eq. 9.At x0 = y0 = 0, r(ψ) = a and the relevant MR signal is
(30)
which is identical to Eq. 20 if the upper and lower limits of the ρ integral are properly replaced.
The second derivatives of Eq. 7 are the results derived from Appendix A with proper changesof the integral limits, plus the following term:
(31)
where
(32)
The second derivative with respect to y0 has the identical format with x0 replaced by y0.
After tedious derivations, we obtain
Cheng et al. Page 15
Phys Med Biol. Author manuscript; available in PMC 2010 November 1.
NIH
-PA Author Manuscript
NIH
-PA Author Manuscript
NIH
-PA Author Manuscript

(33)
and
(34)
when 0 < |p/R2| < 3.8, the second root of J1(x). That the result of Eq. 34 only depends on Rrather than both R and a indicates that this procedure of finding the object center is still valideven if the center of the circle R is outside the object. From a different point of view, when anobject (such as a nanoparticle) is very small, one can identify the center of the object byreplacing the small object by a much larger object but with the identical magnetic moment p.This is because when the value of |g| is larger than roughly 5, one cannot unambiguouslydetermine the volume of the object based on the gradient echo signal (see Fig. 4a).
C Accuracy of the object centerEven though the center of the object can be determined by the method described in theAppendix B, the center cannot be accurately located due to the presence of noise in images.Consider the Taylor expansion of the MR signal
(35)
where the first order terms vanish, as described in the main text. The center of the object cannotbe accurately determined if the sum of the second order terms is less than the noise term andeven if the higher order terms are neglected. Using the result of Eq. 34 and considering only
the thermal noise, , the following criterion can be established
(36)
The maximum of x1.5J1(x) occurs at x ≈ 2.6 and the maximum is roughly 2. At x = 1.5 and 2,x1.5 J1(x) = 1.02 and 1.63, respectively. With a given magnetic moment p in an image, Eq. 36clearly defines how accurate the center can be determined.
Cheng et al. Page 16
Phys Med Biol. Author manuscript; available in PMC 2010 November 1.
NIH
-PA Author Manuscript
NIH
-PA Author Manuscript
NIH
-PA Author Manuscript

Figure 1.A schematic drawing shows the coordinate systems used in Eq. 1. Note that the axis of thecylinder is chosen to be parallel to the z-axis only for the derivation of Eq. 5. After derivingEq. 5, only angle θ is relevant for further discussions.
Cheng et al. Page 17
Phys Med Biol. Author manuscript; available in PMC 2010 November 1.
NIH
-PA Author Manuscript
NIH
-PA Author Manuscript
NIH
-PA Author Manuscript

Figure 2.A schematic drawing shows the cross section of a cylindrical object with radius a, enclosed bya co-axial pseudo cylinder whose radius is R. The total MR signal within the pseudo cylindercan be formulated.
Cheng et al. Page 18
Phys Med Biol. Author manuscript; available in PMC 2010 November 1.
NIH
-PA Author Manuscript
NIH
-PA Author Manuscript
NIH
-PA Author Manuscript

Figure 3.(a) Magnitude and (b) its associated phase image at an echo time of 5 ms show an air cylinderin the gel phantom. (c) Magnitude and (d) phase image at an echo time of 20 ms show the sameair cylinder in the gel phantom. Although the actual radius of the cylinder is 0.8 mm and theimage resolution is 1 mm ×1 mm, cross sections of the cylinder appear to be different inmagnitude images and larger than actual sizes. Note the dipolar phase aliasing patterns in thephase image (d). Circles are explained in the text.
Cheng et al. Page 19
Phys Med Biol. Author manuscript; available in PMC 2010 November 1.
NIH
-PA Author Manuscript
NIH
-PA Author Manuscript
NIH
-PA Author Manuscript

Figure 4.Demonstration of the theoretical signals due to long echo times. For simplicity, no noise hasbeen added in any of these simulations. (a) A plot of the integral in Eq. 5 as a function of gwith ρ0ℓ = 10 units, a = 1 mm, TE = 5 ms, ρ0,c = 0, and R = 3 mm, such that p is 9.43radian·mm2 and the true value of g is 9.43 radians. The actual MR signal S is represented bya horizontal line. The intersections of the horizontal line and the curve represent possiblesolutions of g. (b) Similar to (a), except that TE is reduced to 0.35 ms, such that the true valueof g is 0.66. (c) Normalized signals based on Eq. 5 as a function of echo time. The solid blackcurve is plotted with the volume fraction 0.1 and susceptibility 0.95 ppm from [5]. The dashedgreen curve and the dashed red curve are simulated with volume fraction 0.02 and 0.17, andsusceptibility 4.75 and 0.57 ppm, respectively, such that the product of the volume fractionand susceptibility is identical in all three curves. (d) Similar to (c), but the black curve issimulated with volume fraction 0.3 and susceptibility 0.95 ppm. The dashed green curve andthe red curve are simulated with volume fraction 0.1 and 0.43, and susceptibility 2.85 and 0.67ppm, respectively.
Cheng et al. Page 20
Phys Med Biol. Author manuscript; available in PMC 2010 November 1.
NIH
-PA Author Manuscript
NIH
-PA Author Manuscript
NIH
-PA Author Manuscript

Figure 5.Gradient echo gel images of an empty straw perpendicular to the main field with different readbandwidths are shown. The echo time of these images is 10 ms. (a) Magnitude and (b) itsassociated phase image were acquired with a bandwidth of 70 Hz/pixel. Note the distortionartifacts in both (a) and (b). (c) Magnitude and (d) phase image were acquired with a bandwidthof 350 Hz/pixel. No obvious distortion is observed in (c) or (d).
Cheng et al. Page 21
Phys Med Biol. Author manuscript; available in PMC 2010 November 1.
NIH
-PA Author Manuscript
NIH
-PA Author Manuscript
NIH
-PA Author Manuscript

Figure 6.An infinitely long cylinder with radius 0.8 pixel is simulated without the thermal noise. Thecenter of the object is purposely shifted to the 128.9th pixel in simulations. Our methodidentified a center that is only 0.1 pixel away from the simulated center. The magnitude (a)and its associated phase profile (b) are simulated with an echo time of 5 ms. The magnitude(c) and its phase profile (d) are simulated with a TE of 20 ms. Note the asymmetric phasepatterns in (b) and (d) and asymmetric dephasing profiles in (a) and (c). These profiles agreevery well with those obtained from actual gel phantom data. Also note that each pixel containsonly one complex signal, displayed as dots in these plots. The lines connecting the dots haveno special meaning.
Cheng et al. Page 22
Phys Med Biol. Author manuscript; available in PMC 2010 November 1.
NIH
-PA Author Manuscript
NIH
-PA Author Manuscript
NIH
-PA Author Manuscript

NIH
-PA Author Manuscript
NIH
-PA Author Manuscript
NIH
-PA Author Manuscript
Cheng et al. Page 23
Tabl
e 1
(a) M
agne
tic m
omen
ts o
f six
slic
es fr
om th
e ex
istin
g im
ages
at e
cho
times
of 5
ms a
nd 2
0 m
s. Th
e fir
st c
olum
n lis
ts th
e sl
ice
num
ber,
with
the
smal
ler
num
ber r
epre
sent
ing
the
top
slic
e. T
he se
cond
and
the
seve
nth
colu
mns
list
the
valu
es o
f the
thre
e ra
dii (
in u
nits
of m
m o
r pix
el) u
sed
in E
q. 1
1 to
solv
e th
em
agne
tic m
omen
t. Th
e th
ird a
nd th
e ei
ghth
col
umns
list
the
corr
espo
ndin
g av
erag
ed p
hase
val
ue o
f eac
h ra
dius
. The
four
th a
nd th
e ni
nth
colu
mns
list
the
mag
netic
mom
ent s
olve
d fr
om E
q. 1
1. T
he fi
fth a
nd th
e te
nth
colu
mns
list
the
over
all u
ncer
tain
ty o
f the
mag
netic
mom
ent f
rom
Eq.
15.
Thi
s unc
erta
inty
,w
hich
incl
udes
bot
h th
erm
al n
oise
and
syst
emat
ic n
oise
, was
cal
cula
ted
from
the
erro
r pro
paga
tion
met
hod
and
sim
ulat
ions
, res
pect
ivel
y. T
he si
xth
and
the
elev
enth
col
umns
list
the
unce
rtain
ty o
f sys
tem
atic
noi
se c
alcu
late
d fr
om si
mul
atio
ns. T
he S
NR
of t
he im
ages
at b
oth
echo
tim
es is
abo
ut 1
4:1.
(b) S
imila
rto
(a),
mag
netic
mom
ents
of i
dent
ical
six
slic
es a
re a
naly
zed
with
non
-opt
imal
cho
ices
of r
adiu
s com
bina
tions
. The
pha
se o
f eac
h ra
dius
list
ed in
the
third
and
the
eigh
th c
olum
ns w
as th
e in
terp
olat
ed a
nd a
vera
ged
valu
e. S
ome
mea
sure
d cr
oss s
ectio
ns a
re li
sted
in T
able
4
(a)
T E =
5 m
sT E
= 2
0 m
s
slic
era
dii (
mm
)ph
ases
(rad
ian)
mom
ent p
δε 1
2ε 2
3ra
dii (
mm
)ph
ases
(rad
ian)
mom
ent p
δε 1
2ε 2
3
10(1
.6, 2
.7, 5
.0)
(2.3
, 1.0
, 0.3
)7.
114%
0.05
50.
003
(3.1
, 5.0
, 7.0
)(2
.4, 1
.0, 0
.3)
27.6
2%0.
022
0.00
5
19(1
.6, 2
.4, 5
.0)
(1.8
, 1.0
, 0.2
)5.
828%
0.09
80.
010
(3.6
, 5.0
, 7.0
)(2
.1, 0
.9, 0
.3)
23.6
4%0.
010
0.00
4
28(1
.6, 2
.4, 5
.0)
(1.8
, 1.0
, 0.2
)5.
569%
0.09
70.
010
(2.9
, 4.0
, 7.0
)(2
.0, 1
.0, 0
.3)
21.3
3%0.
060
0.00
5
37(1
.6, 2
.6, 5
.0)
(1.7
, 0.7
, 0.1
)5.
078%
0.05
60.
010
(2.9
, 4.0
, 7.0
)(2
.0, 1
.0, 0
.3)
19.1
5%0.
054
0.03
9
43(1
.4, 2
.6, 5
.0)
(1.7
, 0.9
, 0.1
)4.
625%
0.01
20.
007
(2.5
, 3.8
, 7.0
)(2
.0, 1
.0, 0
.2)
18.8
3%0.
052
0.00
1
46(1
.4, 2
.6, 5
.0)
(1.7
, 0.9
, 0.1
)4.
524%
0.02
10.
005
(2.4
, 3.5
, 7.0
)(2
.0, 1
.4, 0
.2)
17.8
3%0.
040
0.00
5
(b)
T E =
5 m
sT E
= 2
0 m
s
slic
era
dii (
mm
)ph
ases
(rad
ian)
mom
ent p
δε 1
2ε 2
3ra
dii (
mm
)ph
ases
(rad
ian)
mom
ent p
δε 1
2ε 2
3
10(1
.6, 2
.3, 2
.7)
(2.3
, 1.4
, 1.0
)6.
936%
0.01
0.12
(3.1
, 3.6
, 4.1
)(2
.4, 1
.9, 1
.4)
26.1
6%0.
091.
40
19(1
.6, 1
.9, 2
.4)
(1.8
, 1.5
, 1.0
)6.
0615
%0.
480.
17(3
.6, 4
.2, 5
.0)
(2.1
, 1.3
, 0.9
)23
.79%
0.09
0.02
28(1
.6, 2
.0, 2
.4)
(1.8
, 1.3
, 1.0
)5.
9614
%0.
210.
23(2
.9, 3
.4, 4
.0)
(2.0
, 1.4
, 1.0
)21
.07%
0.37
0.01
37(1
.6, 1
.9, 2
.3)
(1.7
, 1.4
, 1.0
)4.
8216
%0.
140.
09(2
.9, 3
.4, 4
.0)
(2.0
, 1.4
, 1.0
)18
.310
%0.
200.
02
43(1
.4, 1
.8, 2
.1)
(1.7
, 1.3
, 1.0
)4.
317%
0.02
0.05
(2.5
, 3.4
, 3.8
)(2
.0, 1
.5, 1
.0)
18.6
4%0.
160.
16
46(1
.4, 1
.7, 2
.2)
(1.7
, 1.4
, 0.9
)4.
226%
0.02
0.03
(2.4
, 3.4
, 3.8
)(2
.0, 1
.5, 1
.0)
17.0
4%0.
030.
10
Phys Med Biol. Author manuscript; available in PMC 2010 November 1.
NIH
-PA Author Manuscript
NIH
-PA Author Manuscript
NIH
-PA Author Manuscript
Cheng et al. Page 24
Tabl
e 2
Effe
ctiv
e m
agne
tic m
omen
ts o
f the
air
stra
w m
easu
red
at tw
o di
ffer
ent s
lices
. The
not
atio
n of
eac
h co
lum
n is
iden
tical
to th
at d
escr
ibed
in T
able
1. T
heSN
Rs o
f im
ages
at T
E =
10 m
s and
15
ms a
re 2
3:1.
The
SN
R o
f im
ages
at T
E =
5 m
s is 1
5:1.
The
mea
sure
d cr
oss s
ectio
ns o
f the
stra
w a
nd th
e th
eore
tical
valu
es o
f the
mag
netic
mom
ents
are
show
n in
the
text
.
Slic
e 30
Slic
e 35
T E (m
s)ra
dii (
mm
)ph
ases
(rad
ian)
mom
ent p
δra
dii (
mm
)ph
ases
(rad
ian)
mom
ent p
δ
5(6
, 8, 1
3)(2
.3, 0
.9, 0
.2)
64.0
1.4%
(6, 9
, 13)
(2.1
, 1.0
, 0.3
)63
.31.
5%
10(7
, 9, 1
4)(2
.4, 1
.3, 0
.5)
130
0.6%
(7, 1
0, 1
4)(2
.4, 1
.2, 0
.5)
128
0.6%
15(9
, 13,
16)
(2.5
, 1.2
, 0.7
)19
10.
9%(9
, 13,
16)
(2.4
, 1.1
, 0.7
)19
30.
9%
Phys Med Biol. Author manuscript; available in PMC 2010 November 1.

NIH
-PA Author Manuscript
NIH
-PA Author Manuscript
NIH
-PA Author Manuscript
Cheng et al. Page 25
Table 3
Study of the distortion effect in gradient echo images (Fig. 5). The theoretical value is 129.5 radian·mm2. Theresults indicate that distortion has minimal effect to our method.
Slice 10 at TE = 10 ms
BW (Hz/pixel) 70 220 350 700
p (radian·mm2) 125.1 ± 0.4 126.6 ± 0.6 124.7 ± 0.6 124.2 ± 1.0
Phys Med Biol. Author manuscript; available in PMC 2010 November 1.

NIH
-PA Author Manuscript
NIH
-PA Author Manuscript
NIH
-PA Author Manuscript
Cheng et al. Page 26
Table 4
Three cross sections Ameasured of the narrow air cylinder are analyzed from the spin echo images. The areas ofA1 and A2 are shown in the number of pixels while the values of Ameasured and Apredicted are shown in units ofmm2. The uncertainties of the measured cross sections (Ameasured) are calculated from Eq. 17. The predictedcross sections (Apredicted) are calculated from the magnetic moments in Table 1a divided by the assumedsusceptibility difference 9.4 ppm. The uncertainties in this calculation are not listed. The SNR of the spin echoimages is 5:1.
Slice A1 A2 Ameasured Apredicted
10 721 43 3.06 ± 0.74 2.31
19 725 39 2.75 ± 0.70 1.97
37 725 40 2.17 ± 0.71 1.59
Phys Med Biol. Author manuscript; available in PMC 2010 November 1.
Copyright © 2022 FDOKUMEN