Quantification of Vertical Irregularities for Earthquake ... - MDPI
19
Citation: Nady, O.; Mahfouz, S.Y.; Taher, S.E.-D.F. Quantification of Vertical Irregularities for Earthquake Resistant Reinforced Concrete Buildings. Buildings 2022, 12, 1160. https://doi.org/10.3390/ buildings12081160 Academic Editors: Daniele Perrone and Emanuele Brunesi Received: 23 June 2022 Accepted: 30 July 2022 Published: 3 August 2022 Publisher’s Note: MDPI stays neutral with regard to jurisdictional claims in published maps and institutional affil- iations. Copyright: © 2022 by the authors. Licensee MDPI, Basel, Switzerland. This article is an open access article distributed under the terms and conditions of the Creative Commons Attribution (CC BY) license (https:// creativecommons.org/licenses/by/ 4.0/). buildings Article Quantification of Vertical Irregularities for Earthquake Resistant Reinforced Concrete Buildings Omar Nady 1, * , Sameh Youssef Mahfouz 1 and Salah El-Din Fahmy Taher 2 1 Construction and Building Engineering Department, Arab Academy for Science Technology and Maritime Transport, Smart Village, Cairo 12577, Egypt; [email protected] 2 Structural Engineering Department, College of Engineering, Tanta University, Tanta 31527, Egypt; [email protected] * Correspondence: [email protected] Abstract: In modern urban construction, irregular buildings are increasingly constructed to fulfill architectural and functional requirements. However, these buildings revealed unfavorable seismic performance during the past earthquake records. When the seismic design codes deal with the issue of building irregularity, little attention is paid to the location of irregularity. In the current study, a detailed structural analysis was performed to investigate the effects of the location of mass, stiffness, setback, and combined irregularities on the structural seismic response of twelve irregular building models. Based on the dynamic properties of the building, an irregularity index is proposed to quantify the effects of the magnitude and location of various types of vertical irregularities. The proposed index was able to successfully quantify all types of vertical irregularities. Keywords: earthquake engineering; seismic design; dynamic analysis; moment-resisting frames; irregularity; irregularity index 1. Introduction Earthquakes, as natural catastrophic events, are often associated with socio-economic impacts [1,2]. During the past earthquake records, irregular buildings showed bad seismic performance [3–9]. Most seismic design codes (IS 1893:2002, EC8 2004, UBC 97, NBCC 2005, IBC 2003, ASCE 2002, TEC 2007, ECP-201:2012) [10–17] recommend different limits for the building irregularities. However, these design codes quantify the irregularities in terms of magnitude, neglecting the influence of irregularity location. Several researchers investigated the influence of the magnitudes and locations of vertical irregularities on the seismic response of the buildings [18–24]. Accordingly, they proposed indices to quantify the degree of vertical irregularities. The first efforts were made by Karavasilis et al. [18] to examine the effect of changes in setback configuration on the deformation demands (i.e., maximum roof displacement and maximum drift) of steel moment-resisting frames (MRF). They found that the geometrical configurations of setbacks influence the height-wise distribution of deformation demands. They also proposed two indices based on the building geometry to quantify the effect of setback irregularities. Roy and Mahato [19] modified the indices proposed by Karavasilis et al. [18] to make them valid for reinforced concrete (RC) stepped frames. Sarkar et al. [20] proposed an irregularity index based on the first mode participation factor to quantify the degree of vertical irregularity for stepped frames. Furthermore, they suggested an empirical equation to determine the fundamental time period of stepped frames as a function of the irregularity index. This equation was confirmed by the modal analysis of seventy-eight stepped frames. Varadharajan et al. [21] investigated the seismic response of short-period buildings with irregular setback frames. According to the study results, short-period structures showed higher reactions than long-period structures. Bhosale et al. [22] quantified the degree of vertical irregularity for RC stepped frames, setback frames, open ground story Buildings 2022, 12, 1160. https://doi.org/10.3390/buildings12081160 https://www.mdpi.com/journal/buildings
-
Upload
khangminh22 -
Category
Documents
-
view
3 -
download
0
Transcript of Quantification of Vertical Irregularities for Earthquake ... - MDPI
Citation: Nady, O.; Mahfouz, S.Y.;
Taher, S.E.-D.F. Quantification of
Vertical Irregularities for Earthquake
Resistant Reinforced Concrete
Buildings. Buildings 2022, 12, 1160.
https://doi.org/10.3390/
buildings12081160
Academic Editors: Daniele Perrone
and Emanuele Brunesi
Received: 23 June 2022
Accepted: 30 July 2022
Published: 3 August 2022
Publisher’s Note: MDPI stays neutral
with regard to jurisdictional claims in
published maps and institutional affil-
iations.
Copyright: © 2022 by the authors.
Licensee MDPI, Basel, Switzerland.
This article is an open access article
distributed under the terms and
conditions of the Creative Commons
Attribution (CC BY) license (https://
creativecommons.org/licenses/by/
4.0/).
buildings
Article
Quantification of Vertical Irregularities for EarthquakeResistant Reinforced Concrete BuildingsOmar Nady 1,* , Sameh Youssef Mahfouz 1 and Salah El-Din Fahmy Taher 2
1 Construction and Building Engineering Department, Arab Academy for Science Technology and MaritimeTransport, Smart Village, Cairo 12577, Egypt; [email protected]
2 Structural Engineering Department, College of Engineering, Tanta University, Tanta 31527, Egypt;[email protected]
* Correspondence: [email protected]
Abstract: In modern urban construction, irregular buildings are increasingly constructed to fulfillarchitectural and functional requirements. However, these buildings revealed unfavorable seismicperformance during the past earthquake records. When the seismic design codes deal with theissue of building irregularity, little attention is paid to the location of irregularity. In the currentstudy, a detailed structural analysis was performed to investigate the effects of the location of mass,stiffness, setback, and combined irregularities on the structural seismic response of twelve irregularbuilding models. Based on the dynamic properties of the building, an irregularity index is proposedto quantify the effects of the magnitude and location of various types of vertical irregularities. Theproposed index was able to successfully quantify all types of vertical irregularities.
Keywords: earthquake engineering; seismic design; dynamic analysis; moment-resisting frames;irregularity; irregularity index
1. Introduction
Earthquakes, as natural catastrophic events, are often associated with socio-economicimpacts [1,2]. During the past earthquake records, irregular buildings showed bad seismicperformance [3–9]. Most seismic design codes (IS 1893:2002, EC8 2004, UBC 97, NBCC 2005,IBC 2003, ASCE 2002, TEC 2007, ECP-201:2012) [10–17] recommend different limits for thebuilding irregularities. However, these design codes quantify the irregularities in terms ofmagnitude, neglecting the influence of irregularity location.
Several researchers investigated the influence of the magnitudes and locations ofvertical irregularities on the seismic response of the buildings [18–24]. Accordingly, theyproposed indices to quantify the degree of vertical irregularities. The first efforts weremade by Karavasilis et al. [18] to examine the effect of changes in setback configurationon the deformation demands (i.e., maximum roof displacement and maximum drift) ofsteel moment-resisting frames (MRF). They found that the geometrical configurationsof setbacks influence the height-wise distribution of deformation demands. They alsoproposed two indices based on the building geometry to quantify the effect of setbackirregularities. Roy and Mahato [19] modified the indices proposed by Karavasilis et al. [18]to make them valid for reinforced concrete (RC) stepped frames. Sarkar et al. [20] proposedan irregularity index based on the first mode participation factor to quantify the degree ofvertical irregularity for stepped frames. Furthermore, they suggested an empirical equationto determine the fundamental time period of stepped frames as a function of the irregularityindex. This equation was confirmed by the modal analysis of seventy-eight steppedframes. Varadharajan et al. [21] investigated the seismic response of short-period buildingswith irregular setback frames. According to the study results, short-period structuresshowed higher reactions than long-period structures. Bhosale et al. [22] quantified thedegree of vertical irregularity for RC stepped frames, setback frames, open ground story
Buildings 2022, 12, 1160. https://doi.org/10.3390/buildings12081160 https://www.mdpi.com/journal/buildings
Buildings 2022, 12, 1160 2 of 19
frames, and floating column frames. They proposed an index based on the effectivemodal mass and first mode participation factors. The first mode participation factor wasconsidered an appropriate measure to quantify vertical irregularity for the investigatedframes. Rathnasiri et al. [23] proposed an index to quantify the degree of vertical irregularityof RC buildings. The index was based on the modal base shear. The authors found thatthe index accurately assessed the degree of irregularity in stepped frames, floating columnframes, and setback frames. Siva Naveen et al. [24] investigated the seismic response ofRC frames with various types of vertical irregularities (i.e., mass, stiffness, and setbackirregularities). They found that certain combinations of irregularities reduced the structuralresponse compared to the regular structures subjected to seismic forces. The combination ofstiffness and vertical geometric irregularities produced the highest displacement response.
Despite the efforts of the researchers to investigate the effects of the vertical irregu-larities on the structural response, little attention was paid to considering the irregularitylocation [25,26]. Moreover, few researchers considered the impact of mass, stiffness, andcombined irregularities [24,26] and, accordingly, the quantification of the proposed indiceswas limited to setback irregularities only [18–21].
Thus, the main objective of the current study is to investigate the influence of thelocation of various vertical irregularities (i.e., mass, stiffness, setback, and combined ir-regularities) on the maximum structural response. The current study also aims to acquirean irregularity index to quantify various types of vertical irregularities depending on thestructural dynamic features (i.e., mass and stiffness). To this end, twelve three-dimensionalRC MRFs were analyzed using the finite element software program ETABS by applyinglinear static analysis (i.e., equivalent static load method) and linear dynamic analysis (i.e.,response spectrum and time history methods).
2. Methodology
In the current study, seismic responses of various vertical irregular MRFs were ob-tained numerically using finite element software (ETABS), by applying the equivalent staticload method (ESL), response spectrum method (RS), and the time history method (TH).These methods are summarized in the following sub-sections. The major input data areas follows: the seismic zone in Cairo city is classified as zone 3 in ECP-201 [17], and theshape of the spectrum is type (1). The structures are classified as residential structures witha significant factor = 1. The soil is classified as stiff soil with a soil class of C. The verticalloads are considered when the reduction factor R = 5 is used, and the frame structure resiststhe total base shear without using shear walls or bracings [27].
2.1. Equivalent Static Load (ESL) Method
The ESL method was utilized in the initial design stage to calculate the design internalforces of structural elements by applying linear elastic analysis of the structure. Thismethod is applied to regular structures whose dynamic response is mainly affected by thefundamental vibration waves of the structure in each plane.
2.2. Response Spectrum (RS) Method
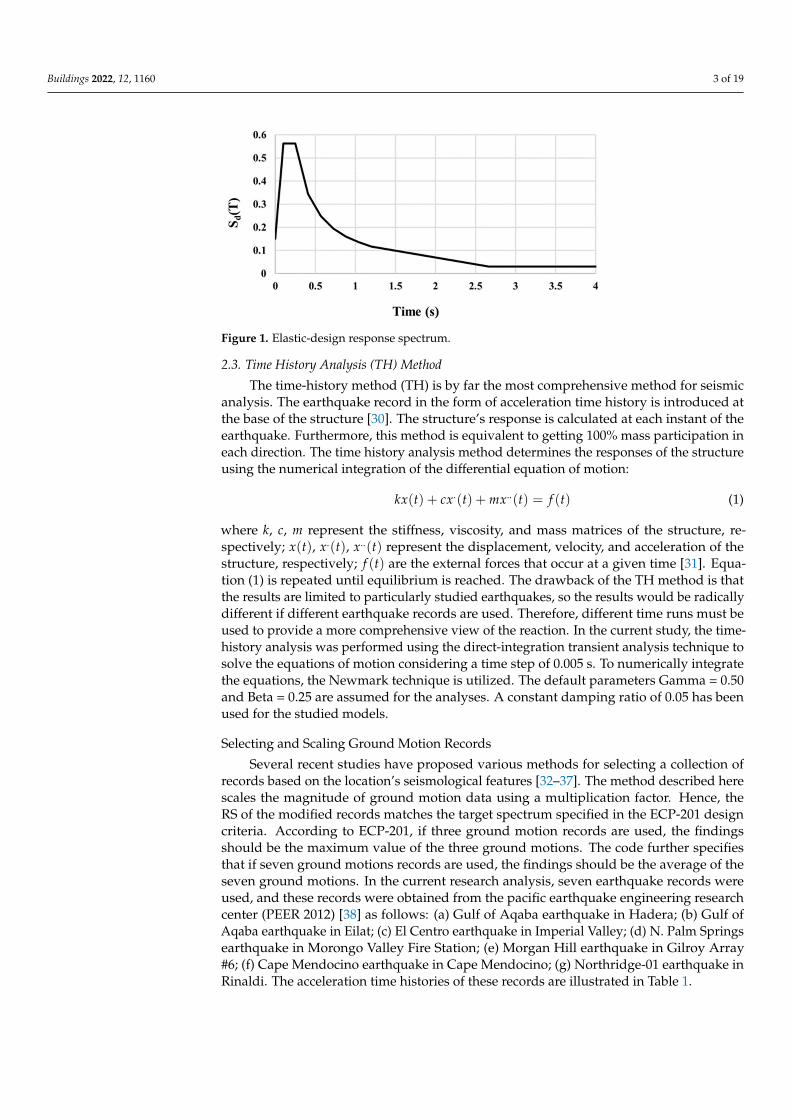
The RS method can be applied to regular and irregular structures. RS provides severalvibration modes to capture at least 90% of the structure’s mass in each direction [28].Figure 1 shows the elastic design RS curve applied in the current study. The elastic RSis modified by introducing a strength reduction factor R to indicate an inelastic responsedemand or an estimated damage level demand of the entire structure caused during theearthquake excitation [29].
Buildings 2022, 12, 1160 3 of 19
Figure 1. Elastic-design response spectrum.
2.3. Time History Analysis (TH) Method
The time-history method (TH) is by far the most comprehensive method for seismicanalysis. The earthquake record in the form of acceleration time history is introduced atthe base of the structure [30]. The structure’s response is calculated at each instant of theearthquake. Furthermore, this method is equivalent to getting 100% mass participation ineach direction. The time history analysis method determines the responses of the structureusing the numerical integration of the differential equation of motion:
kx(t) + cx.(t) + mx..(t) = f (t) (1)
where k, c, m represent the stiffness, viscosity, and mass matrices of the structure, re-spectively; x(t), x.(t), x..(t) represent the displacement, velocity, and acceleration of thestructure, respectively; f (t) are the external forces that occur at a given time [31]. Equa-tion (1) is repeated until equilibrium is reached. The drawback of the TH method is thatthe results are limited to particularly studied earthquakes, so the results would be radicallydifferent if different earthquake records are used. Therefore, different time runs must beused to provide a more comprehensive view of the reaction. In the current study, the time-history analysis was performed using the direct-integration transient analysis technique tosolve the equations of motion considering a time step of 0.005 s. To numerically integratethe equations, the Newmark technique is utilized. The default parameters Gamma = 0.50and Beta = 0.25 are assumed for the analyses. A constant damping ratio of 0.05 has beenused for the studied models.
Selecting and Scaling Ground Motion Records
Several recent studies have proposed various methods for selecting a collection ofrecords based on the location’s seismological features [32–37]. The method described herescales the magnitude of ground motion data using a multiplication factor. Hence, theRS of the modified records matches the target spectrum specified in the ECP-201 designcriteria. According to ECP-201, if three ground motion records are used, the findingsshould be the maximum value of the three ground motions. The code further specifiesthat if seven ground motions records are used, the findings should be the average of theseven ground motions. In the current research analysis, seven earthquake records wereused, and these records were obtained from the pacific earthquake engineering researchcenter (PEER 2012) [38] as follows: (a) Gulf of Aqaba earthquake in Hadera; (b) Gulf ofAqaba earthquake in Eilat; (c) El Centro earthquake in Imperial Valley; (d) N. Palm Springsearthquake in Morongo Valley Fire Station; (e) Morgan Hill earthquake in Gilroy Array#6; (f) Cape Mendocino earthquake in Cape Mendocino; (g) Northridge-01 earthquake inRinaldi. The acceleration time histories of these records are illustrated in Table 1.

Buildings 2022, 12, 1160 4 of 19
Table 1. Characteristics of time history acceleration records used in the analysis. (PGA: peak groundacceleration; PGV: peak. ground velocity; PGD: peak ground displacement).
Level PGA(g) EarthquakeName Year Station Name Input Wave Earthquake
MagnitudeScaleFactor
PGV(cm/s)
PGD(cm)
Low0.0125 Gulf of Aqaba 1995 Hadera HAD-NS 7.20 6 2.1 0.650.0805 Gulf of Aqaba 1995 Eilat EIL-NS 7.20 1.3 10.6 4.39
Moderate
0.2107 El Centro 1940 Imperial Valley ELC-NS 6.95 0.46 30.2 23.91
0.3332 N. Palm Springs 1986 Morongo ValleyFire Station MVH045 6.06 0.5204 8.7890 1.5499
0.4061 Morgan Hill 1984 Gilroy Array #6 G06000 6.19 0.999 14.1750 1.6034
High 0.7388 Cape Mendocino 1992 Cape Mendocino CPM000 7.01 0.183 58.0740 57.83400.9582 Northridge-01 1994 Rinaldi RRS228 6.69 0.139 42.1880 3.7191
3. Finite Element Modeling
Three-dimensional structures were mathematically modeled and analyzed using thefinite element software program ETABS [39]. These models adequately depicted the spatialdistribution of the structure’s mass and stiffness to compute the dynamic response of thestructure. The beams and columns were handled as frame elements with rigid joints. Thismodel considers the flexural stiffness of the beam and beam-column joint dimensions, aswell as the stiffness of the panel zone. This model also considers the distribution of shearforces, flexural moments, and axial forces. As a result, it could be able to determine thedistribution of seismic design demands more accurately.
The slabs were modeled as shell elements with rigid floor diaphragms to distributethe loads uniformly to the columns. In-plane membrane stiffness and out-of-plane bendingstiffness were considered [40]. Rigid foundations were assumed for the structures underconsideration. Therefore, the soil-foundation interaction and foundation flexibility effectswere ignored. The steps for structural modeling with ETABS are illustrated in the nextFigure 2.
Figure 2. Flowchart of the modeling procedures using ETABS.
Buildings 2022, 12, 1160 5 of 19
4. Description of Structural Models
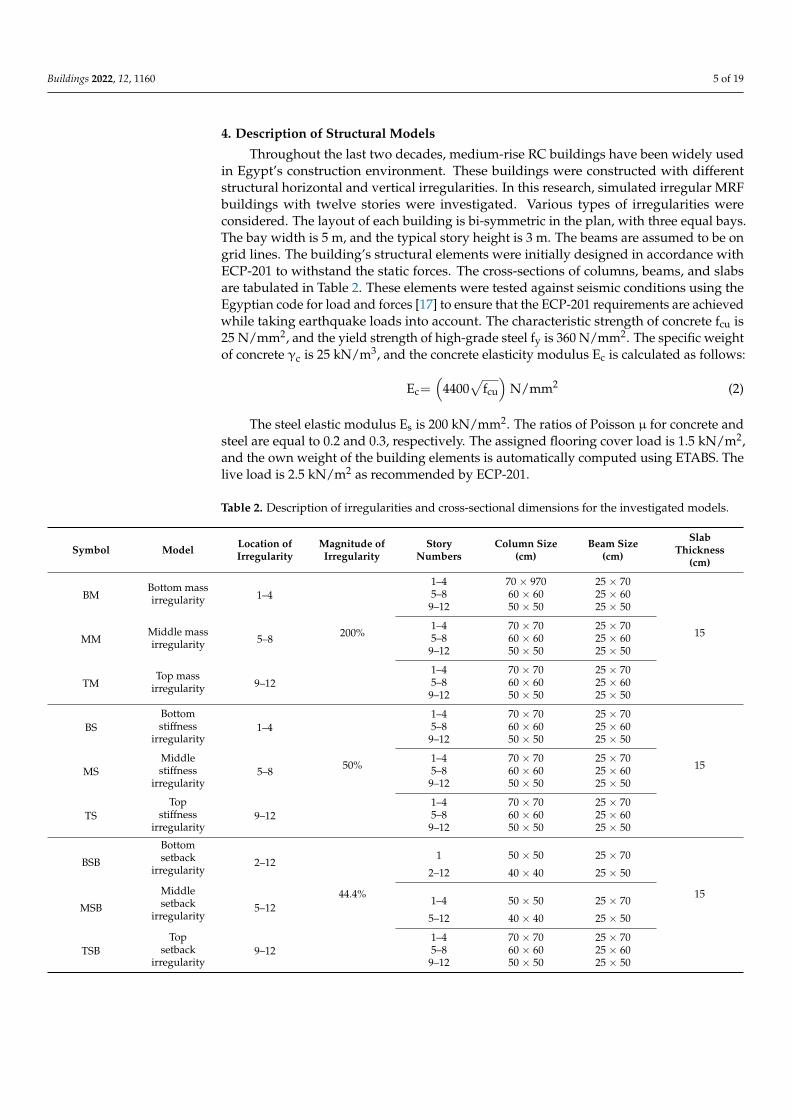
Throughout the last two decades, medium-rise RC buildings have been widely usedin Egypt’s construction environment. These buildings were constructed with differentstructural horizontal and vertical irregularities. In this research, simulated irregular MRFbuildings with twelve stories were investigated. Various types of irregularities wereconsidered. The layout of each building is bi-symmetric in the plan, with three equal bays.The bay width is 5 m, and the typical story height is 3 m. The beams are assumed to be ongrid lines. The building’s structural elements were initially designed in accordance withECP-201 to withstand the static forces. The cross-sections of columns, beams, and slabsare tabulated in Table 2. These elements were tested against seismic conditions using theEgyptian code for load and forces [17] to ensure that the ECP-201 requirements are achievedwhile taking earthquake loads into account. The characteristic strength of concrete fcu is25 N/mm2, and the yield strength of high-grade steel fy is 360 N/mm2. The specific weightof concrete γc is 25 kN/m3, and the concrete elasticity modulus Ec is calculated as follows:
Ec=(
4400√
fcu
)N/mm2 (2)
The steel elastic modulus Es is 200 kN/mm2. The ratios of Poisson µ for concrete andsteel are equal to 0.2 and 0.3, respectively. The assigned flooring cover load is 1.5 kN/m2,and the own weight of the building elements is automatically computed using ETABS. Thelive load is 2.5 kN/m2 as recommended by ECP-201.
Table 2. Description of irregularities and cross-sectional dimensions for the investigated models.
Symbol Model Location ofIrregularity
Magnitude ofIrregularity
StoryNumbers
Column Size(cm)
Beam Size(cm)
SlabThickness
(cm)
BMBottom massirregularity 1–4
200%
1–4 70 × 970 25 × 70
15
5–8 60 × 60 25 × 609–12 50 × 50 25 × 50
MMMiddle massirregularity 5–8
1–4 70 × 70 25 × 705–8 60 × 60 25 × 609–12 50 × 50 25 × 50
TMTop mass
irregularity 9–121–4 70 × 70 25 × 705–8 60 × 60 25 × 609–12 50 × 50 25 × 50
BSBottomstiffness
irregularity1–4
50%
1–4 70 × 70 25 × 70
15
5–8 60 × 60 25 × 609–12 50 × 50 25 × 50
MSMiddlestiffness
irregularity5–8
1–4 70 × 70 25 × 705–8 60 × 60 25 × 609–12 50 × 50 25 × 50
TSTop
stiffnessirregularity
9–121–4 70 × 70 25 × 705–8 60 × 60 25 × 609–12 50 × 50 25 × 50
BSB
Bottomsetback
irregularity2–12
44.4%
1 50 × 50 25 × 70
15
2–12 40 × 40 25 × 50
MSB
Middlesetback
irregularity5–12
1–4 50 × 50 25 × 70
5–12 40 × 40 25 × 50
TSBTop
setbackirregularity
9–121–4 70 × 70 25 × 705–8 60 × 60 25 × 609–12 50 × 50 25 × 50

Buildings 2022, 12, 1160 6 of 19
Table 2. Cont.
Symbol Model Location ofIrregularity
Magnitude ofIrregularity
StoryNumbers
Column Size(cm)
Beam Size(cm)
SlabThickness
(cm)
BCBottom
combinedirregularity
1
mass (400%)stiffness (47%)setback (44.4%)
1 70 × 70 - 602-4 70 × 70 25 × 70 155–8 60 × 60 25 × 60 159–12 50 × 50 25 × 50 15
MCMiddle
combinedirregularity
4
1–3 70 × 70 25 × 70 154 70 × 70 - 60
5–8 60 × 60 25 × 60 159–12 50 × 50 25 × 50 15
TCTop
combinedirregularity
81–7 70 × 70 25 × 70 158 70 × 70 - 60
9–12 60 × 60 25 × 50 15
4.1. Models with Mass Irregularity
Three different locations of mass irregularities were considered for the same building:(a) bottom mass (BM) model (i.e., bottom one-third of the building with heavy mass);(b) middle mass (MM) model (i.e., middle one-third of the building with heavy mass);and (c) top mass (TM) model, (i.e., top one-third of the building with heavy mass). Thedescriptions of building models with mass irregularities are described in Table 2 andFigure 3.
Figure 3. Building models with mass irregularity: (a) bottom mass (BM); (b) middle mass (MM);(c) top mass (TM).
4.2. Models with Stiffness Irregularity
Three different locations of stiffness irregularity were considered for the same building,where three model cases were investigated: (a) bottom stiffness (BS) model (i.e., bottomone-third of the building with stiffness irregularity); (b) middle stiffness (MS) model, (i.e.,middle one-third of the building with stiffness irregularity); and (c) top stiffness (TS) model,(i.e., top one-third of the building with stiffness irregularity). The descriptions of buildingmodels with stiffness irregularities are described in Table 2 and Figure 4.

Buildings 2022, 12, 1160 7 of 19
Figure 4. Building models with stiffness irregularity: (a) bottom stiffness (BS); (b) middle stiffness(MS); (c) top stiffness (TS).
4.3. Models with Setback Irregularity
Three setback irregularity models were considered: (a) bottom setback (BSB) model,(i.e., bottom one-third of the building with setback irregularity); (b) middle setback (MSB)model (i.e., middle one-third of the building with setback irregularity); and (c) top setback(TSB) model, (i.e., top one-third of the building with setback irregularity). Table 2 andFigure 5 illustrate the details of building models with setback irregularity.
Figure 5. 3D-models with setback irregularity: (a) Top Setback (TSB); (b) Middle Setback (MSB);(c) Bottom Setback (BSB).
Buildings 2022, 12, 1160 8 of 19
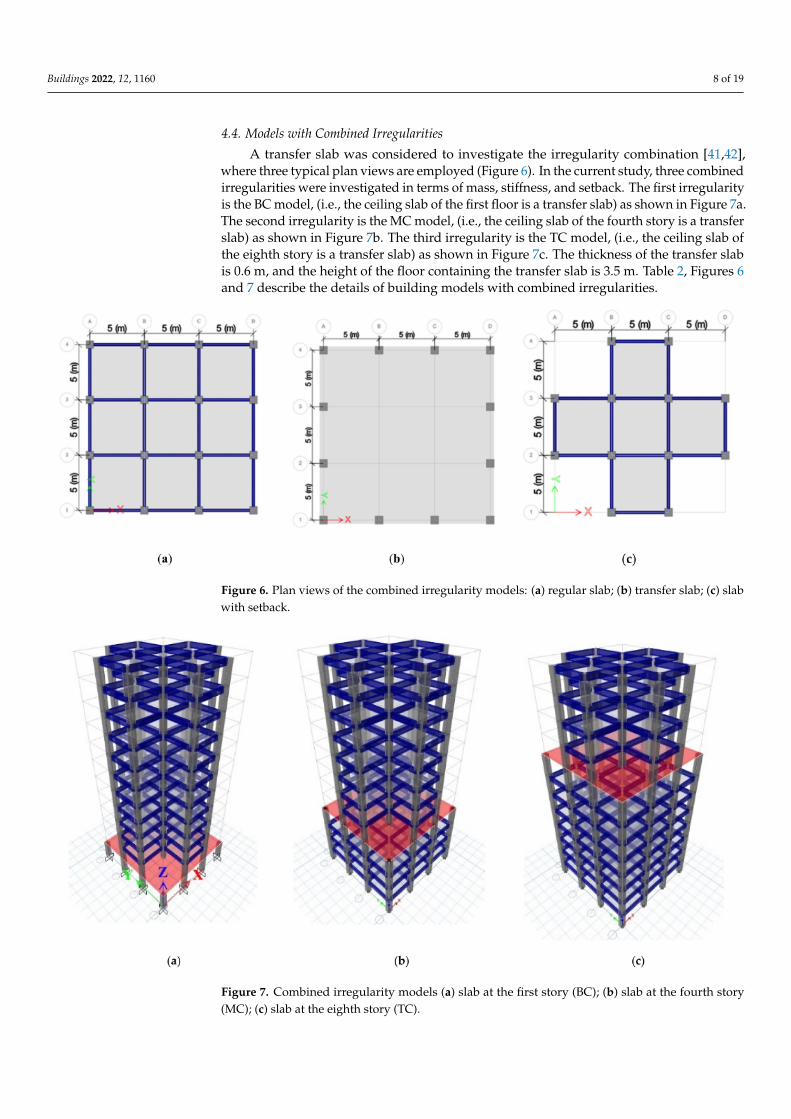
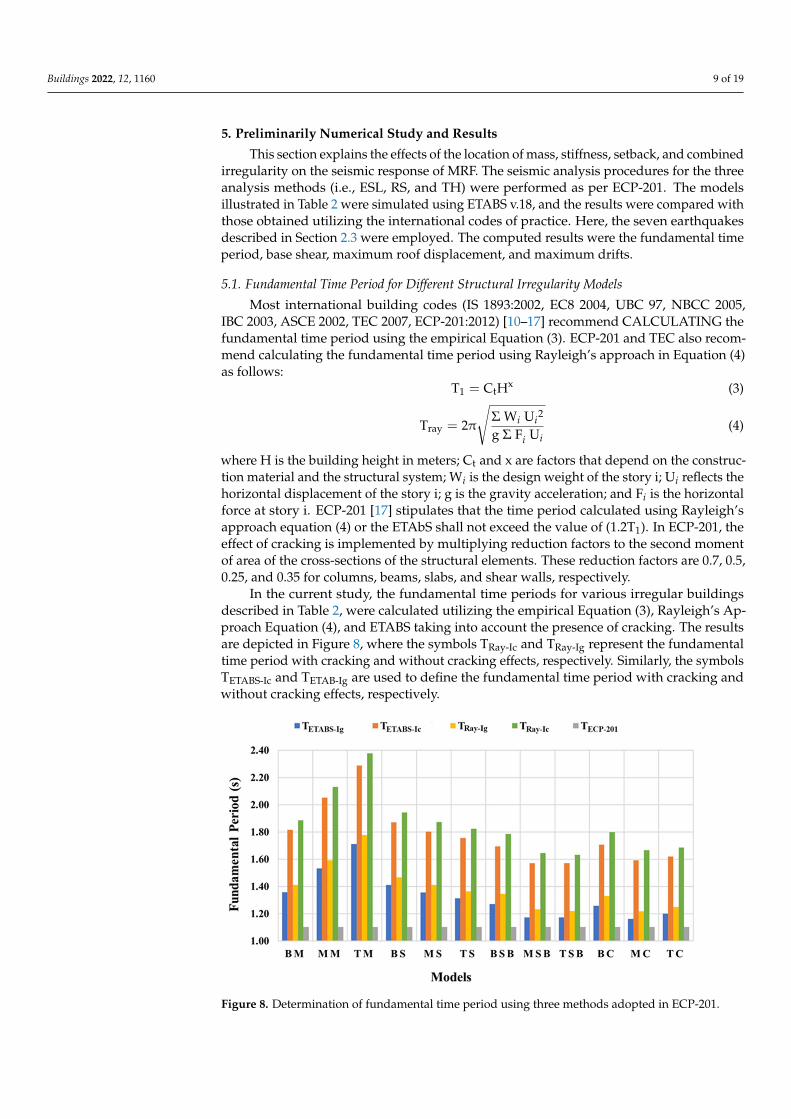
4.4. Models with Combined Irregularities
A transfer slab was considered to investigate the irregularity combination [41,42],where three typical plan views are employed (Figure 6). In the current study, three combinedirregularities were investigated in terms of mass, stiffness, and setback. The first irregularityis the BC model, (i.e., the ceiling slab of the first floor is a transfer slab) as shown in Figure 7a.The second irregularity is the MC model, (i.e., the ceiling slab of the fourth story is a transferslab) as shown in Figure 7b. The third irregularity is the TC model, (i.e., the ceiling slab ofthe eighth story is a transfer slab) as shown in Figure 7c. The thickness of the transfer slabis 0.6 m, and the height of the floor containing the transfer slab is 3.5 m. Table 2, Figures 6and 7 describe the details of building models with combined irregularities.
Figure 6. Plan views of the combined irregularity models: (a) regular slab; (b) transfer slab; (c) slabwith setback.
Figure 7. Combined irregularity models (a) slab at the first story (BC); (b) slab at the fourth story(MC); (c) slab at the eighth story (TC).
Buildings 2022, 12, 1160 9 of 19
5. Preliminarily Numerical Study and Results
This section explains the effects of the location of mass, stiffness, setback, and combinedirregularity on the seismic response of MRF. The seismic analysis procedures for the threeanalysis methods (i.e., ESL, RS, and TH) were performed as per ECP-201. The modelsillustrated in Table 2 were simulated using ETABS v.18, and the results were compared withthose obtained utilizing the international codes of practice. Here, the seven earthquakesdescribed in Section 2.3 were employed. The computed results were the fundamental timeperiod, base shear, maximum roof displacement, and maximum drifts.
5.1. Fundamental Time Period for Different Structural Irregularity Models
Most international building codes (IS 1893:2002, EC8 2004, UBC 97, NBCC 2005,IBC 2003, ASCE 2002, TEC 2007, ECP-201:2012) [10–17] recommend CALCULATING thefundamental time period using the empirical Equation (3). ECP-201 and TEC also recom-mend calculating the fundamental time period using Rayleigh’s approach in Equation (4)as follows:
T1 = CtHx (3)
Tray = 2π
√Σ Wi Ui
2
g Σ Fi Ui(4)
where H is the building height in meters; Ct and x are factors that depend on the construc-tion material and the structural system; Wi is the design weight of the story i; Ui reflects thehorizontal displacement of the story i; g is the gravity acceleration; and Fi is the horizontalforce at story i. ECP-201 [17] stipulates that the time period calculated using Rayleigh’sapproach equation (4) or the ETAbS shall not exceed the value of (1.2T1). In ECP-201, theeffect of cracking is implemented by multiplying reduction factors to the second momentof area of the cross-sections of the structural elements. These reduction factors are 0.7, 0.5,0.25, and 0.35 for columns, beams, slabs, and shear walls, respectively.
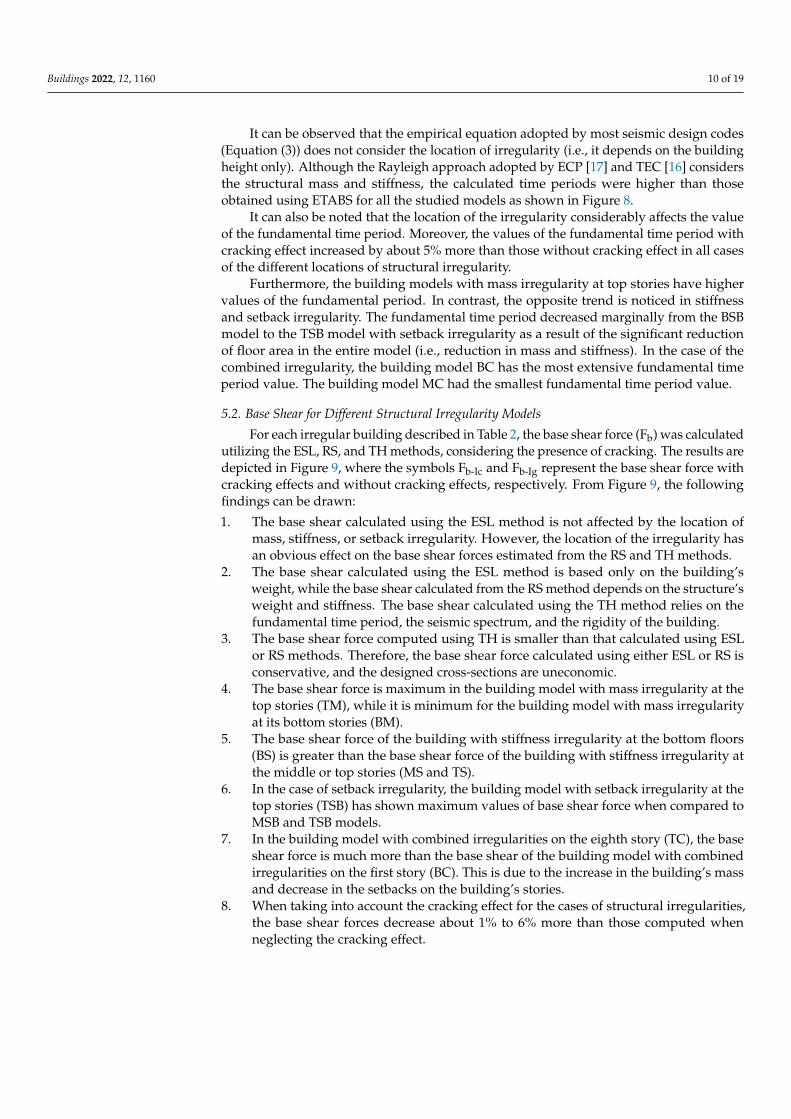
In the current study, the fundamental time periods for various irregular buildingsdescribed in Table 2, were calculated utilizing the empirical Equation (3), Rayleigh’s Ap-proach Equation (4), and ETABS taking into account the presence of cracking. The resultsare depicted in Figure 8, where the symbols TRay-Ic and TRay-Ig represent the fundamentaltime period with cracking and without cracking effects, respectively. Similarly, the symbolsTETABS-Ic and TETAB-Ig are used to define the fundamental time period with cracking andwithout cracking effects, respectively.
Figure 8. Determination of fundamental time period using three methods adopted in ECP-201.
Buildings 2022, 12, 1160 10 of 19
It can be observed that the empirical equation adopted by most seismic design codes(Equation (3)) does not consider the location of irregularity (i.e., it depends on the buildingheight only). Although the Rayleigh approach adopted by ECP [17] and TEC [16] considersthe structural mass and stiffness, the calculated time periods were higher than thoseobtained using ETABS for all the studied models as shown in Figure 8.
It can also be noted that the location of the irregularity considerably affects the valueof the fundamental time period. Moreover, the values of the fundamental time period withcracking effect increased by about 5% more than those without cracking effect in all casesof the different locations of structural irregularity.
Furthermore, the building models with mass irregularity at top stories have highervalues of the fundamental period. In contrast, the opposite trend is noticed in stiffnessand setback irregularity. The fundamental time period decreased marginally from the BSBmodel to the TSB model with setback irregularity as a result of the significant reductionof floor area in the entire model (i.e., reduction in mass and stiffness). In the case of thecombined irregularity, the building model BC has the most extensive fundamental timeperiod value. The building model MC had the smallest fundamental time period value.
5.2. Base Shear for Different Structural Irregularity Models
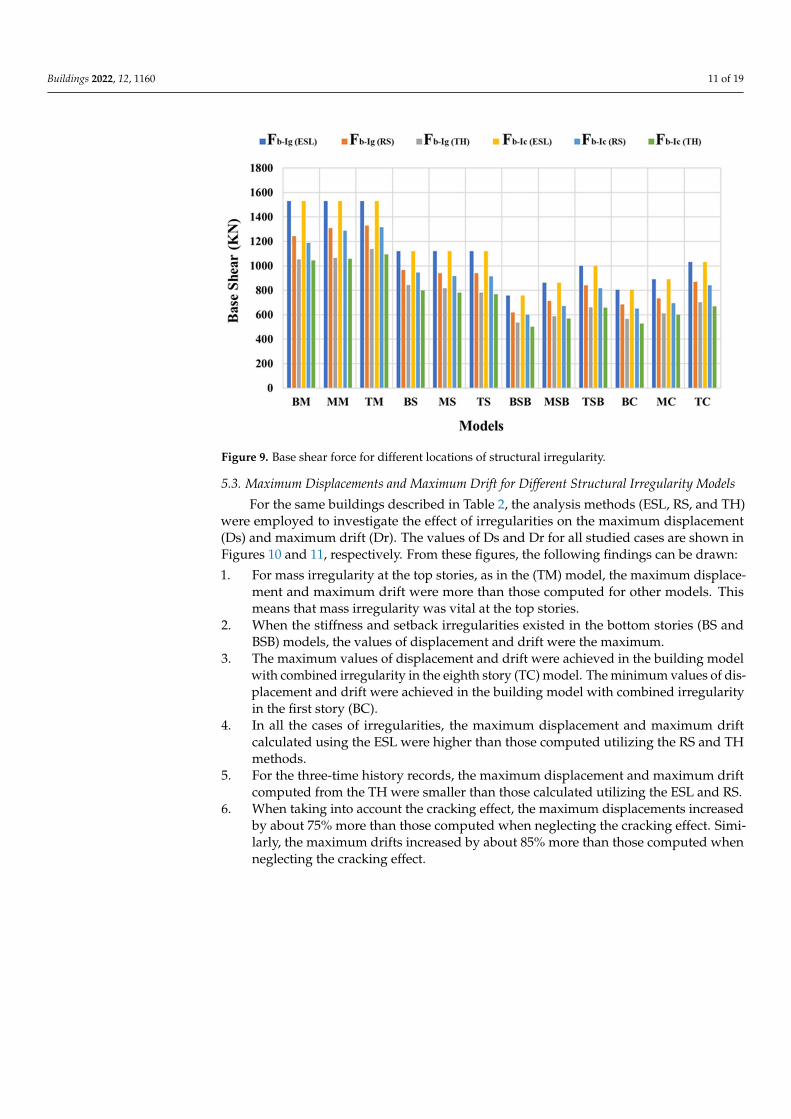
For each irregular building described in Table 2, the base shear force (Fb) was calculatedutilizing the ESL, RS, and TH methods, considering the presence of cracking. The results aredepicted in Figure 9, where the symbols Fb-Ic and Fb-Ig represent the base shear force withcracking effects and without cracking effects, respectively. From Figure 9, the followingfindings can be drawn:
1. The base shear calculated using the ESL method is not affected by the location ofmass, stiffness, or setback irregularity. However, the location of the irregularity hasan obvious effect on the base shear forces estimated from the RS and TH methods.
2. The base shear calculated using the ESL method is based only on the building’sweight, while the base shear calculated from the RS method depends on the structure’sweight and stiffness. The base shear calculated using the TH method relies on thefundamental time period, the seismic spectrum, and the rigidity of the building.
3. The base shear force computed using TH is smaller than that calculated using ESLor RS methods. Therefore, the base shear force calculated using either ESL or RS isconservative, and the designed cross-sections are uneconomic.
4. The base shear force is maximum in the building model with mass irregularity at thetop stories (TM), while it is minimum for the building model with mass irregularityat its bottom stories (BM).
5. The base shear force of the building with stiffness irregularity at the bottom floors(BS) is greater than the base shear force of the building with stiffness irregularity atthe middle or top stories (MS and TS).
6. In the case of setback irregularity, the building model with setback irregularity at thetop stories (TSB) has shown maximum values of base shear force when compared toMSB and TSB models.
7. In the building model with combined irregularities on the eighth story (TC), the baseshear force is much more than the base shear of the building model with combinedirregularities on the first story (BC). This is due to the increase in the building’s massand decrease in the setbacks on the building’s stories.
8. When taking into account the cracking effect for the cases of structural irregularities,the base shear forces decrease about 1% to 6% more than those computed whenneglecting the cracking effect.
Buildings 2022, 12, 1160 11 of 19
Figure 9. Base shear force for different locations of structural irregularity.
5.3. Maximum Displacements and Maximum Drift for Different Structural Irregularity Models
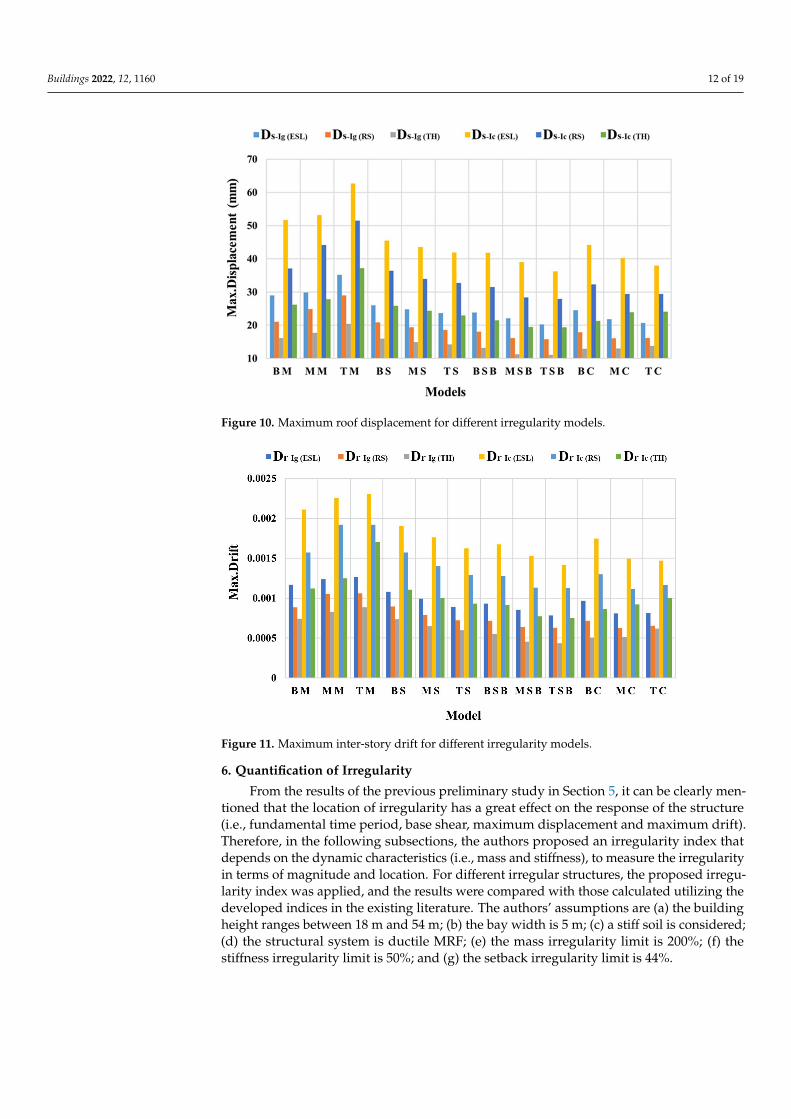
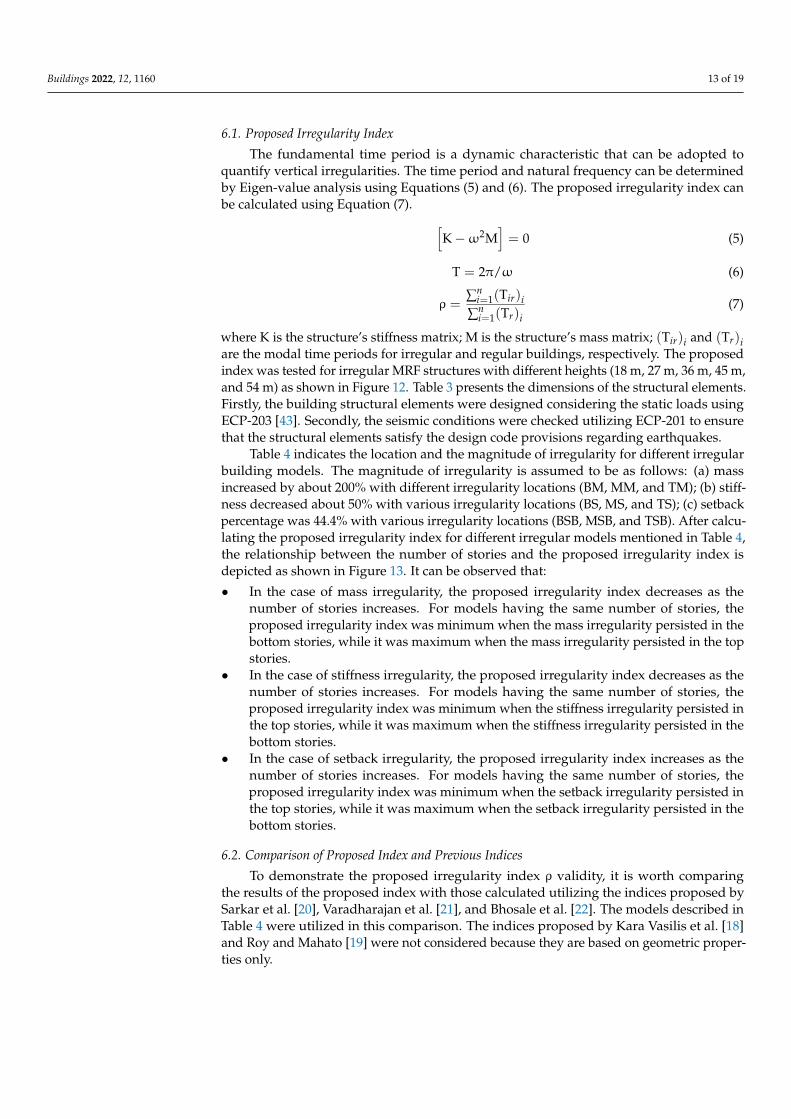
For the same buildings described in Table 2, the analysis methods (ESL, RS, and TH)were employed to investigate the effect of irregularities on the maximum displacement(Ds) and maximum drift (Dr). The values of Ds and Dr for all studied cases are shown inFigures 10 and 11, respectively. From these figures, the following findings can be drawn:
1. For mass irregularity at the top stories, as in the (TM) model, the maximum displace-ment and maximum drift were more than those computed for other models. Thismeans that mass irregularity was vital at the top stories.
2. When the stiffness and setback irregularities existed in the bottom stories (BS andBSB) models, the values of displacement and drift were the maximum.
3. The maximum values of displacement and drift were achieved in the building modelwith combined irregularity in the eighth story (TC) model. The minimum values of dis-placement and drift were achieved in the building model with combined irregularityin the first story (BC).
4. In all the cases of irregularities, the maximum displacement and maximum driftcalculated using the ESL were higher than those computed utilizing the RS and THmethods.
5. For the three-time history records, the maximum displacement and maximum driftcomputed from the TH were smaller than those calculated utilizing the ESL and RS.
6. When taking into account the cracking effect, the maximum displacements increasedby about 75% more than those computed when neglecting the cracking effect. Simi-larly, the maximum drifts increased by about 85% more than those computed whenneglecting the cracking effect.
Buildings 2022, 12, 1160 12 of 19
Figure 10. Maximum roof displacement for different irregularity models.
Figure 11. Maximum inter-story drift for different irregularity models.
6. Quantification of Irregularity
From the results of the previous preliminary study in Section 5, it can be clearly men-tioned that the location of irregularity has a great effect on the response of the structure(i.e., fundamental time period, base shear, maximum displacement and maximum drift).Therefore, in the following subsections, the authors proposed an irregularity index thatdepends on the dynamic characteristics (i.e., mass and stiffness), to measure the irregularityin terms of magnitude and location. For different irregular structures, the proposed irregu-larity index was applied, and the results were compared with those calculated utilizing thedeveloped indices in the existing literature. The authors’ assumptions are (a) the buildingheight ranges between 18 m and 54 m; (b) the bay width is 5 m; (c) a stiff soil is considered;(d) the structural system is ductile MRF; (e) the mass irregularity limit is 200%; (f) thestiffness irregularity limit is 50%; and (g) the setback irregularity limit is 44%.
Buildings 2022, 12, 1160 13 of 19
6.1. Proposed Irregularity Index
The fundamental time period is a dynamic characteristic that can be adopted toquantify vertical irregularities. The time period and natural frequency can be determinedby Eigen-value analysis using Equations (5) and (6). The proposed irregularity index canbe calculated using Equation (7). [
K −ω2M]= 0 (5)
T = 2π/ω (6)
ρ =∑n
i=1(Tir)i∑n
i=1(Tr)i(7)
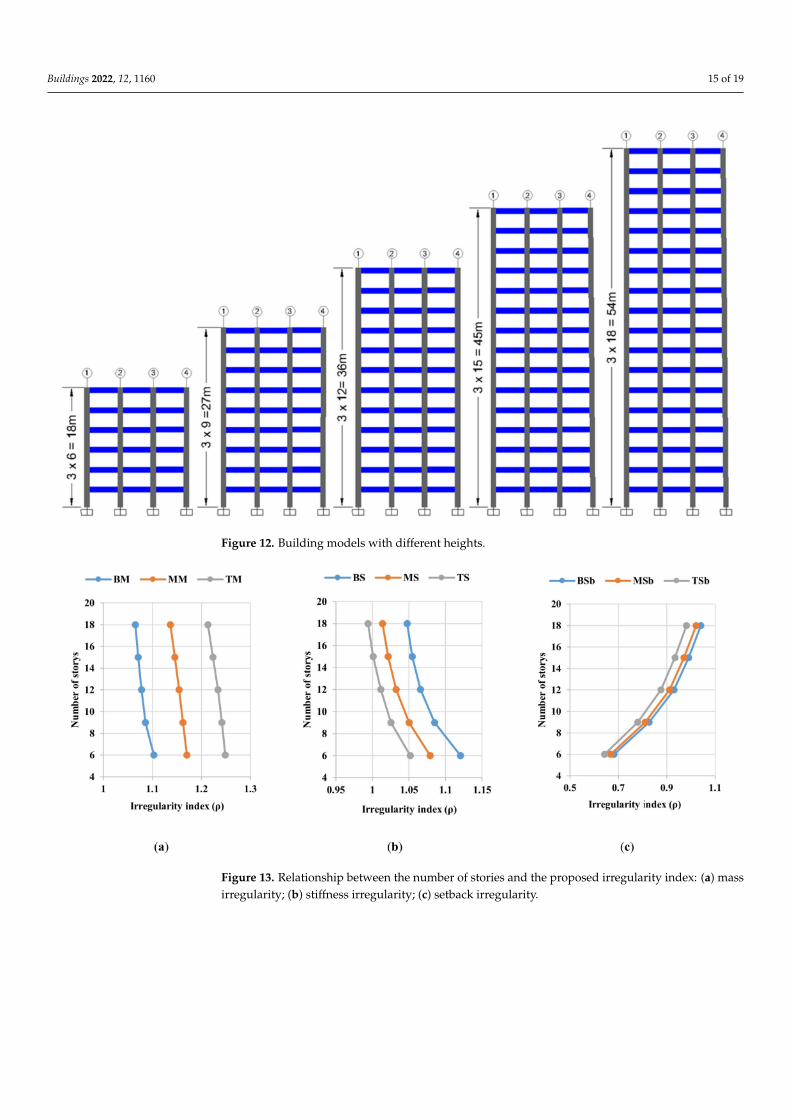
where K is the structure’s stiffness matrix; M is the structure’s mass matrix; (Tir)i and (Tr)iare the modal time periods for irregular and regular buildings, respectively. The proposedindex was tested for irregular MRF structures with different heights (18 m, 27 m, 36 m, 45 m,and 54 m) as shown in Figure 12. Table 3 presents the dimensions of the structural elements.Firstly, the building structural elements were designed considering the static loads usingECP-203 [43]. Secondly, the seismic conditions were checked utilizing ECP-201 to ensurethat the structural elements satisfy the design code provisions regarding earthquakes.
Table 4 indicates the location and the magnitude of irregularity for different irregularbuilding models. The magnitude of irregularity is assumed to be as follows: (a) massincreased by about 200% with different irregularity locations (BM, MM, and TM); (b) stiff-ness decreased about 50% with various irregularity locations (BS, MS, and TS); (c) setbackpercentage was 44.4% with various irregularity locations (BSB, MSB, and TSB). After calcu-lating the proposed irregularity index for different irregular models mentioned in Table 4,the relationship between the number of stories and the proposed irregularity index isdepicted as shown in Figure 13. It can be observed that:
• In the case of mass irregularity, the proposed irregularity index decreases as thenumber of stories increases. For models having the same number of stories, theproposed irregularity index was minimum when the mass irregularity persisted in thebottom stories, while it was maximum when the mass irregularity persisted in the topstories.
• In the case of stiffness irregularity, the proposed irregularity index decreases as thenumber of stories increases. For models having the same number of stories, theproposed irregularity index was minimum when the stiffness irregularity persisted inthe top stories, while it was maximum when the stiffness irregularity persisted in thebottom stories.
• In the case of setback irregularity, the proposed irregularity index increases as thenumber of stories increases. For models having the same number of stories, theproposed irregularity index was minimum when the setback irregularity persisted inthe top stories, while it was maximum when the setback irregularity persisted in thebottom stories.
6.2. Comparison of Proposed Index and Previous Indices
To demonstrate the proposed irregularity index ρ validity, it is worth comparingthe results of the proposed index with those calculated utilizing the indices proposed bySarkar et al. [20], Varadharajan et al. [21], and Bhosale et al. [22]. The models described inTable 4 were utilized in this comparison. The indices proposed by Kara Vasilis et al. [18]and Roy and Mahato [19] were not considered because they are based on geometric proper-ties only.

Buildings 2022, 12, 1160 14 of 19
Table 3. Dimensions of structural elements.
Properties of Structural Members
6-story building
story number 1,2 3,4 5,6column (cm) 50 × 50 40 × 40 40 × 40beam (cm) 25 × 70 25 × 60 25 × 50slab (cm) 15 15 15
9-story building
story number 1–3 4–6 7–9column (cm) 60 × 60 50 × 50 40 × 40beam (cm) 25 × 70 25 × 60 25 × 50slab (cm) 15 15 15
12-story building
story number 1–4 5–8 9–12column (cm) 70 × 70 60 × 60 50 × 50beam (cm) 25 × 70 25 × 60 25 × 50slab (cm) 15 15 15
15-story building
story number 1–5 6–10 11–15column (cm) 80 × 80 70 × 70 60 × 60beam (cm) 25 × 70 25 × 60 25 × 50slab (cm) 15 15 15
18-story building
story number 1–6 7–12 13–18column (cm) 90 × 90 80 × 80 70 × 70beam (cm) 25 × 70 25 × 60 25 × 50slab (cm) 15 15 15
Table 4. Description of different irregularity models.
ModelsLocation
ofIrregularity
MassIrregularity
Models
Magnitudeof
Irregularity
StiffnessIrregularity
Models
Magnitudeof
Irregularity
SetbackIrregularity
Models
Magnitudeof
Irregularity
6-story1,2 BM
200%
BS
50%
BSB
44%
3,4 MM MS MSB5,6 TM TS TSB
9-story1–3 BM BS BSB4–6 MM MS MSB7–9 TM TS TSB
12-story1–4 BM BS BSB5–8 MM MS MSB
9–12 TM TS TSB
15-story1–5 BM BS BSB
6–10 MM MS MSB11–15 TM TS TSB
18-story1–6 BM BS BSB
7–12 MM MS MSB13–18 TM TS TSB
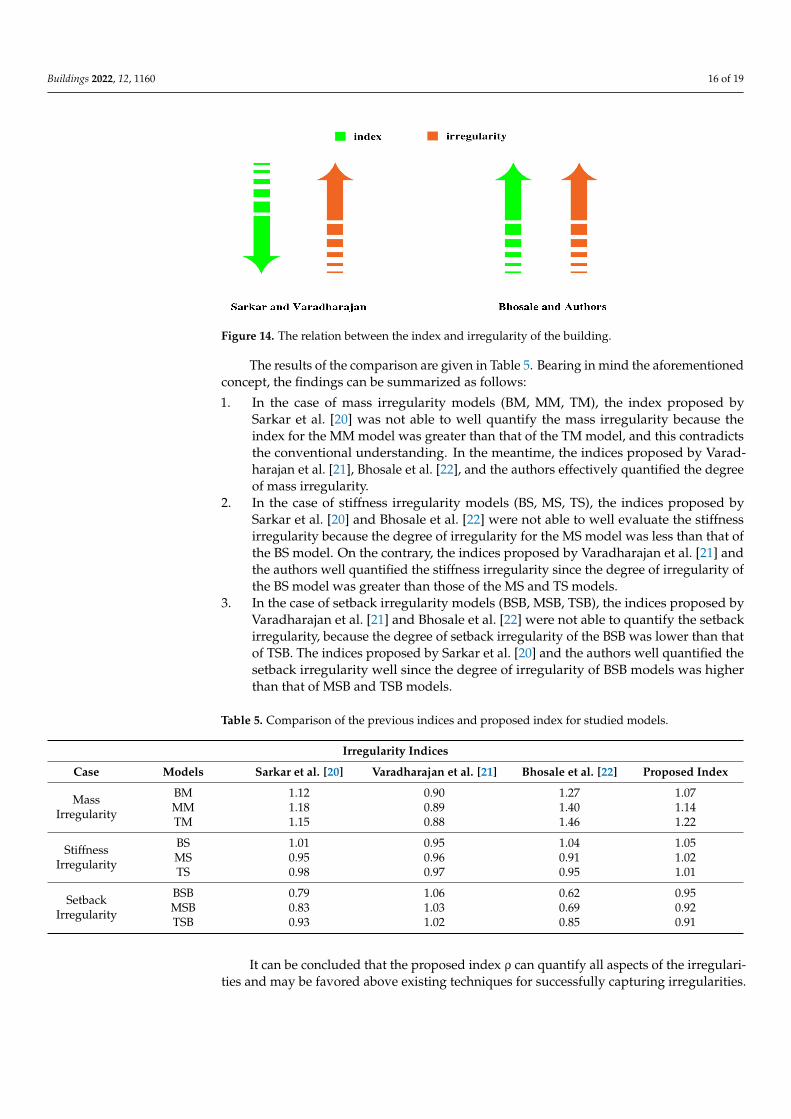
The graphical representation of the irregularity index concept for each author is givenin Figure 14. In the indices proposed by Sarkar et al. [20] and Varadharajan et al. [21], thelower index means higher building irregularity. On the contrary, the lower index meanslower building irregularity for the indices proposed by Bhosale et al. [22] and the authors.
Buildings 2022, 12, 1160 15 of 19
Figure 12. Building models with different heights.
Figure 13. Relationship between the number of stories and the proposed irregularity index: (a) massirregularity; (b) stiffness irregularity; (c) setback irregularity.
Buildings 2022, 12, 1160 16 of 19
Figure 14. The relation between the index and irregularity of the building.
The results of the comparison are given in Table 5. Bearing in mind the aforementionedconcept, the findings can be summarized as follows:
1. In the case of mass irregularity models (BM, MM, TM), the index proposed bySarkar et al. [20] was not able to well quantify the mass irregularity because theindex for the MM model was greater than that of the TM model, and this contradictsthe conventional understanding. In the meantime, the indices proposed by Varad-harajan et al. [21], Bhosale et al. [22], and the authors effectively quantified the degreeof mass irregularity.
2. In the case of stiffness irregularity models (BS, MS, TS), the indices proposed bySarkar et al. [20] and Bhosale et al. [22] were not able to well evaluate the stiffnessirregularity because the degree of irregularity for the MS model was less than that ofthe BS model. On the contrary, the indices proposed by Varadharajan et al. [21] andthe authors well quantified the stiffness irregularity since the degree of irregularity ofthe BS model was greater than those of the MS and TS models.
3. In the case of setback irregularity models (BSB, MSB, TSB), the indices proposed byVaradharajan et al. [21] and Bhosale et al. [22] were not able to quantify the setbackirregularity, because the degree of setback irregularity of the BSB was lower than thatof TSB. The indices proposed by Sarkar et al. [20] and the authors well quantified thesetback irregularity well since the degree of irregularity of BSB models was higherthan that of MSB and TSB models.
Table 5. Comparison of the previous indices and proposed index for studied models.
Irregularity Indices
Case Models Sarkar et al. [20] Varadharajan et al. [21] Bhosale et al. [22] Proposed Index
MassIrregularity
BM 1.12 0.90 1.27 1.07MM 1.18 0.89 1.40 1.14TM 1.15 0.88 1.46 1.22
StiffnessIrregularity
BS 1.01 0.95 1.04 1.05MS 0.95 0.96 0.91 1.02TS 0.98 0.97 0.95 1.01
SetbackIrregularity
BSB 0.79 1.06 0.62 0.95MSB 0.83 1.03 0.69 0.92TSB 0.93 1.02 0.85 0.91
It can be concluded that the proposed index ρ can quantify all aspects of the irregulari-ties and may be favored above existing techniques for successfully capturing irregularities.

Buildings 2022, 12, 1160 17 of 19
7. Conclusions and Scope for Future Works
In the current study, RC building models with various types, magnitudes, locations ofmass, stiffness, setback, and combined irregularities were analyzed. Firstly, several analysisapproaches were used to evaluate irregular building models. Secondly, a factor namedirregularity index was recommended to quantify the magnitude and location of differentirregularities, depending on the building’s dynamic characteristics. The main conclusionsare outlined as follows:
1. The location of the irregularity has a considerable influence on the structural seismicresponse. Therefore, to accurately quantify the irregularity, both the magnitude andlocation of the irregularity must be included.
2. The comparison between the proposed index and the indices of the previous studiesdemonstrated the ability of the proposed index to quantify all types of irregularitiesconsidered in the current study.
The current study clarified the effect of different types of vertical irregularities on thestructural seismic response. The effects of horizontal irregularities could be included infuture work. The proposed index is limited to moment-resisting frame (MRF) buildings.Thus, the proposed index could be adjusted to include the effects of the dual systems(i.e., MRF and shear walls). Simple equations could be suggested to estimate the seismicresponse demands such as maximum displacement and maximum drift for irregularbuildings in terms of the proposed index based on the regression analysis.
Author Contributions: Conceptualization, S.E.-D.F.T., S.Y.M. and O.N.; methodology, S.E.-D.F.T.,S.Y.M. and O.N.; validation, O.N.; formal analysis, O.N.; writing—original draft preparation, S.Y.M.and O.N.; writing—review and editing, S.Y.M. and O.N.; visualization, O.N.; supervision, S.E.-D.F.T.and S.Y.M.; project administration, S.Y.M. All authors have read and agreed to the published versionof the manuscript.
Funding: This research received no external funding.
Institutional Review Board Statement: Not applicable.
Informed Consent Statement: Not applicable.
Data Availability Statement: The FE data used to support the research results are available on request.
Acknowledgments: The authors would like to acknowledge the encouragement and support of Eng.Mohammed Rady Ewis Deif.
Conflicts of Interest: The authors declare no conflict of interest.
References1. Brunesi, E.; Peloso, S.; Pinho, R.; Nascimbene, R. Cyclic testing and analysis of a full-scale cast-in-place reinforced concrete
wall-slab-wall structure. Bull. Earthq. Eng. 2018, 16, 4761–4796. [CrossRef]2. Blasi, G.; Perrone, D.; Aiello, M.A.; Pecce, M.R. Seismic performance assessment of piping systems in bare and infilled RC
buildings. Soil Dyn. Earthq. Eng. 2021, 149, 106897. [CrossRef]3. Dogangn, A. Performance of reinforced concrete buildings during the May 1, 2003 Bingöl Earthquake in Turkey. Eng. Struct. 2004,
26, 841–856. [CrossRef]4. Kirac, N.; Dogan, M.; Ozbasaran, H. Failure of weak-storey during earthquakes. Eng. Fail. Anal. 2011, 18, 572–581. [CrossRef]5. Fraser, S.; Raby, A.; Pomonis, A.; Goda, K.; Chian, S.C.; Macabuag, J.; Offord, M.; Saito, K.; Sammonds, P. Tsunami damage to
coastal defences and buildings in the March 11th 2011 Mw9.0 Great East Japan earthquake and tsunami. Bull. Earthq. Eng. 2013,11, 205–239. [CrossRef]
6. Westenenk, B.; de la Llera, J.C.; Jünemann, R.; Hube, M.A.; Besa, J.J.; Lüders, C.; Inaudi, J.A.; Riddell, R.; Jordán, R. Analysis andinterpretation of the seismic response of RC buildings in Concepción during the February 27, 2010, Chile earthquake. Bull. Earthq.Eng. 2013, 11, 69–91. [CrossRef]
7. Asıkoglu, A.; Vasconcelos, G.; Lourenço, P. Overview on the nonlinear static procedures and performance-based approach onmodern unreinforced masonry buildings with structural irregularity. Buildings 2021, 11, 147. [CrossRef]
8. Ruggieri, S.; Uva, G. Accounting for the spatial variability of seismic motion in the pushover analysis of regular and irregular rcbuildings in the new italian building code. Buildings 2020, 10, 177. [CrossRef]

Buildings 2022, 12, 1160 18 of 19
9. Ruggieri, S.; Fiore, A.; Uva, G. A New Approach to Predict the Fundamental Period of Vibration for Newly- designed ReinforcedConcrete Buildings. J. Earthq. Eng. 2021. [CrossRef]
10. IS1893-2002; Bureau of Indian Standards–Indian Standard Criteria for Earthquake Resistant Design of Structures Part 1: GeneralProvisions and Buildings. Bureau of Indian Standards: New Delhi, India, 2002.
11. EC8. Eurocode 8: Design of Structures for Earthquake Resistance—Part 1: General Rules, Seismic Actions and Rules for Buildings; TheEuropean Union Per Regulation 305/2011, Directive 98/34/EC, Directive 2004/18/EC; European Committee for Standardization(CEN): Brussels, Belgium, 2011; Volume 1, p. 2005.
12. UBC. 1997 Uniform Building Code; International Conference Building Officials: Whittier, CA, USA, 1997; Volume 2.13. NBBC. National Building Code of Canada 2005; National Research Council of Canada: Ottawa, ON, Canada, 2006; Volume 1.14. IBC. 2003 International Building Code®First Printing: December 2002 ISBN # 1-892395-56-8 (Soft); International Code Council (ICC):
Washington, DC, USA, 2003.15. ASCE. American Society of Civil Elilgineers SEI/ASCE 7-02 Second Edition Minimum Design Loads for Buildings and Other Structures,
2nd ed.; American Society of Civil Engineers: Reston, VA, USA, 2013; Volume 552.16. TEC. Turkish Earthquake Code; Ministry of Interior, Disaster and Emergency Management Authority: Ankara, Turkey, 2007.17. ECP-Egyptian Code of Practice—201. Egyptian Code of Practice No-201 for Design Loads for Construction Works; Research Center for
Housing and Construction, Ministry of Housing, Utilities and Urban Planning: Cairo, Egypt, 2012.18. Karavasilis, T.L.; Bazeos, N.; Beskos, D.E. Seismic response of plane steel MRF with setbacks: Estimation of inelastic deformation
demands. J. Construct. Steel Res. 2008, 64, 644–654. [CrossRef]19. Roy, R.; Mahato, S. Equivalent lateral force method for buildings with setback: Adequacy in elastic range. Earthq. Struct 2013, 4,
685–710. [CrossRef]20. Sarkar, P.; Prasad, M.; Menon, D. Vertical geometric irregularity in stepped building frames. Eng. Struct. 2010, 32, 2175–2182.
[CrossRef]21. Varadharajan, S.; Sehgal, V.; Saini, B. Determination of inelastic seismic demands of RC moment resisting setback frames. Arch.
Civ. Mech. Eng. 2013, 13, 370–393. [CrossRef]22. Bhosale, A.; Davis, R.; Sarkar, P. Vertical Irregularity of Buildings : Regularity Index versus Seismic Risk. ASCE-ASME J. Risk
Uncertain. Eng. Syst. Part A Civ. Eng. 2017, 3, 04017001. [CrossRef]23. Rathnasiri, H.; Jayasinghe, J.; Bandara, C. Development of Irregularity Index Based on Dynamic Characteristics to Quantify the
Vertical Geometric Irregularities. Engineer 2020, 53, 41. [CrossRef]24. Naveen, S.; Abraham, N.; Kumari, A. Analysis of irregular structures under earthquake loads. Procedia Struct. Integr. 2019, 14,
806–819. [CrossRef]25. Sadashiva, V.K.; Macrae, G.A.; Deam, B.L.; Fenwick, R. Determination of Acceptable Structural Irregularity Limits for the Use of
Simplified Seismic Design Methods. In Proceedings of the New Zealand Society of Earthquake Engineering (NZSEE) Conference,Wairakei, New Zealand, 11–13 April 2008.
26. Varadharajan, S.; Sehgal, V.K.; Saini, B. Review of different structural irregularities in buildings. J. Struct. Eng. 2012, 39, 393–418.27. Abdel-Raheem, K.; Abdel Raheem, S.; Soghair, H.; Ahmed, M. Evaluation of Seismic Performance of Multistory Buildings
Designed According To Egyptian Code. JES J. Eng. Sci. 2010, 38, 381–402. [CrossRef]28. Kunnath, S.; Kalkan, E. Evaluation of Seismic Deformation Demands Using Non-Linear Procedures in Multistory Steel and
Concrete Moment Frames. ISET J. Earthq. Technol. 2004, 41, 159–181.29. Thuat, D. Van Strength reduction factor demands for building structures under different seismic levels. Struct. Des. Tall Spec.
Build. 2012, 24, 421–439. [CrossRef]30. Boore, D. Simulation of ground motion using the stochastic method. Pure Appl. Geophys. 2003, 160, 635–676. [CrossRef]31. Sobrado, V.; Yaranga, R.; Orihuela, J. Analysis of seismic bidirectionality on response of reinforced concrete structures with
irregularities of l-shaped plan and soft story. IOP Conf. Ser. Mater. Sci. Eng. 2020, 910, 012001. [CrossRef]32. Najafi, L.; Tehranizadeh, M. Ground motion selection and scaling in practice. Period. Polytech. Civ. Eng. 2015, 59, 233–248.
[CrossRef]33. Vera, C.; Mcverry, G.; Ingham, J. Ground motion records for time-history analysis of URM buildings in New Zealand—The North
Island. In Proceedings of the NZSEE Annual Technical Conference, Wairakei, New Zealand, 11–13 April 2008; pp. 1–8.34. Dhakal, R.; Singh, S.; Mander, J. Effectiveness of earthquake selection and scaling method in New Zealand. Bull. N. Z. Soc. Earthq.
Eng. 2007, 40, 160–171. [CrossRef]35. Iervolino, I.; Cornell, C. Record selection for nonlinear seismic analysis of structures. Earthq. Spectra 2005, 21, 685–713. [CrossRef]36. Bommer, J.; Acevedo, A. The use of real earthquake accelerograms as input to dynamic analysis. J. Earthq. Eng. 2004, 8, 43–91.
[CrossRef]37. Baker, J.; Cornell, C. Spectral shape, epsilon and record selection. Earthq. Eng. Struct. Dyn. 2006, 35, 1077–1095. [CrossRef]38. UC Berkeley, Pacific Earthquake Engineering Research Center. PEER Strong Ground Motion Databases. Available online:
https://peer.berkeley.edu/peer-strong-ground-motion-databases (accessed on 25 June 2021).39. Computers and Structures Inc. ETABS: Integrated Software for Structural Analysis and Design; Computers and Structures Inc.:
Berkeley, CA, USA, 2018. Available online: https://www.csiamerica.com/products/etabs (accessed on 20 June 2019).40. Abdel Raheem, S.; Abdel Zaher, A.; Taha, A. Finite element modeling assumptions impact on seismic response demands of
MRF-buildings. Earthq. Eng. Eng. Vib. 2018, 17, 821–834. [CrossRef]

Buildings 2022, 12, 1160 19 of 19
41. Osman, A.; Abdel Azim, M. Analysis and Behavior of High-rise Buildings with Transfer Plate System. In Proceedings of the 13thArab Structural Engineering Conference, Blida, Algeria, 12–15 December 2015.
42. Abdelbasset, Y.; Sayed-Ahmed, E.; Mourad, S. High-rise buildings with transfer floors: Drift calculations. In Proceedings of the37th IABSE Symposium Report. International Association for Bridge and Structural Engineering, Madrid, Spain, 3–5 September2014; pp. 637–644. [CrossRef]
43. ECP-Egyptian Code of Practice—203. Egyptian Code of Practice No-203 for Design and Construction of Concrete Structures; ResearchCenter for Housing and Construction, Ministry of Housing, Utilities and Urban Planning: Cairo, Egypt, 2018.