PACIFIC EARTHQUAKE ENGINEERING RESEARCH CENTER
233
PACIFIC EARTHQUAKE ENGINEERING RESEARCH CENTER Preliminary Studies on the Dynamic Response of a Seismically Isolated Prototype Gen-IV Sodium-Cooled Fast Reactor (PGSFR) Benshun Shao Andreas H. Schellenberg Matthew J. Schoettler Stephen A. Mahin Department of Civil and Environmental Engineering University of California, Berkeley PEER Report No. 2017/11 Pacific Earthquake Engineering Research Center Headquarters at the University of California, Berkeley December 2017 PEER 2017/11 December 2017
-
Upload
khangminh22 -
Category
Documents
-
view
5 -
download
0
Transcript of PACIFIC EARTHQUAKE ENGINEERING RESEARCH CENTER

PACIFIC EARTHQUAKE ENGINEERING RESEARCH CENTER
Preliminary Studies on the Dynamic Response of a Seismically Isolated Prototype Gen-IV
Sodium-Cooled Fast Reactor (PGSFR)
Benshun ShaoAndreas H. Schellenberg
Matthew J. SchoettlerStephen A. Mahin
Department of Civil and Environmental Engineering University of California, Berkeley
PEER Report No. 2017/11Pacific Earthquake Engineering Research Center
Headquarters at the University of California, Berkeley
December 2017PEER 2017/11
December 2017

Disclaimer
The opinions, fi ndings, and conclusions or recommendations expressed in this publication are those of the author(s) and do not necessarily refl ect the views of the study sponsor(s), the Pacifi c Earthquake Engineering Research Center, or the Regents of the University of California.

Preliminary Studies on the Dynamic Response of a Seismically Isolated Prototype Gen-IV
Sodium-Cooled Fast Reactor (PGSFR)
Benshun Shao
Andreas H. Schellenberg
Matthew J. Schoettler
Stephen A. Mahin
Department of Civil and Environmental Engineering University of California, Berkeley
PEER Report No. 2017/11 Pacific Earthquake Engineering Research Center
Headquarters at the University of California, Berkeley
December 2017

ii

iii
ABSTRACT
The KEPCO Engineering and Construction Company, Inc. (KEPCO E&C) is developing a Prototype Gen-IV Sodium-Cooled Fast Reactor (PGSFR). Preliminary evaluations of the behavior of the isolated PGSFR when subjected to seismic and aircraft impact loading conditions were conducted to support design efforts by KEPCO E&C. Results and key findings of these analyses are as follows: (i) because isolator deformations are typically quite small for the considered seismic excitation levels, the benefit of seismic isolation could be enhanced with revised isolator designs that reduce the apparent yield strength and permit greater displacement demands; (ii) the amplitudes of acceleration and displacement responses resulting from the impact of a large aircraft are similar to or exceed the demands imposed by a seismic event based on the NRC hazard with a peak ground acceleration of 0.3g, and (iii) as provided, the isolator initial stiffness is poorly conditioned since it leads to fundamental isolation frequencies that are not well separated from the plant’s superstructure frequencies, and triggers some resonance that significantly increases floor acceleration response spectra.

iv

v
ACKNOWLEDGMENTS
This report summarizes results, observations, and findings developed as part of the initial phase of a research project entitled “Prototype Gen-IV Sodium-cooled Fast Reactor (PGSFR) with Seismic Isolation Adaptation (Phase 1).” This research was supported by Contract No. KCN04-15-46 from KEPCO Engineering and Construction Company, Inc. (KEPCO E&C) to the Pacific Earthquake Engineering Research Center (PEER). The authors are grateful for this opportunity to collaborate and financial support.
In addition, the PEER research team appreciates the advice and technical support provided by the engineering staff of KEPCO E&C, with special thanks to Drs. Sang-Hoon Lee and Young-Suk Lee. Their interest in and promotion of this research was exceptional.
The authors are grateful to those whose expertise helped improve the quality and outcome of the research. Ground motions provided by Professor Jack Baker at Stanford University provided the basis for developing the ground motions used in these studies. Dr. Frank McKenna provided support on developing the OpenSees structural analysis models used in the numerical studies described in this report.
The authors are especially indebted to the project’s internal and external advisory committee for the numerous useful comments and suggestions. The expert committee participants during this phase included: Professors Ehud Greenspan, James Kelly, and Per Peterson from the University of California at Berkeley, and Charles Boardman (Consultant), Dr. Robert Budnitz (LBNL), Dr. Annie Kammerer (PEER/Consultant), Robert Kassawara (EPRI), Dr. Robert Kennedy (RPK Structural Mechanics), Joseph Maffei (Maffei Structural Engineering), Fred Tajirian (Chevron), and Dr. Wen Tseng (ECWST Consultants).
The opinions, findings, and conclusions or recommendations expressed in this publication are those of the author(s) and do not necessarily reflect the views of the KEPCO Engineering and Construction Company, Inc., the Regents of the University of California, or the Pacific Earthquake Engineering Research Center.

vi

vii
CONTENTS
ABSTRACT ................................................................................................................................ iii
ACKNOWLEDGMENTS ............................................................................................................ v
TABLE OF CONTENTS ........................................................................................................... vii
LIST OF TABLES ....................................................................................................................... xi
LIST OF FIGURES ................................................................................................................... xiii
1 INTRODUCTION............................................................................................................. 1
1.1 Introduction ............................................................................................................1
1.2 Scope of Report ......................................................................................................1
2 LITERATURE SURVEY RELATED TO SEISMICALLY ISOLATED FAST BREEDER REACTORS ....................................................................................... 3
2.1 Introduction ............................................................................................................3
2.2 Power Reactor Innovative Small Module (PRISM) ...........................................4
2.2.1 Project Description .......................................................................................4
2.3 The Sodium Advanced Fast Reactor (SAFR) ......................................................7
2.3.1 Project Description .......................................................................................7
2.4 Advanced Demonstration Fast Breeder Reactor plant (DFBR) ........................9
2.4.1 Project Description .......................................................................................9
2.4.2 Phase 1: Horizontal Seismic Isolation System for the DFBR....................10
2.4.3 Phase 2: Development of 3D Isolation System for DFBR ........................12
2.4.4 Shaking Table Tests and Analysis Model with High-Damping Rubber Bearings for the DFBR ..................................................................15
2.5 Fast Reactor Cycle Technology Development (FaCT) Project (JSFR) ...........16
2.5.1 Project Description .....................................................................................16
2.6 Secure, Transportable, Autonomous Reactor-Liquid Metal (STAR-LM) ........................................................................................................................18
2.6.1 Project Description .....................................................................................18
2.6.2 Two-Dimensional Isolation System for STAR-LM Reactor .....................19
2.6.3 Three-Dimensional Isolation System for STAR-LM Reactor ...................20
2.7 Korea Advanced Liquid Metal Reactor (KALIMER) .....................................20
2.7.1 Project Description .....................................................................................20

viii
2.7.2 KALIMER-600 ..........................................................................................22
2.8 Seismic-Initiated Events Risk Mitigation in Lead-Cooled Reactor (SILER) .................................................................................................................22
2.8.1 Project Description .....................................................................................22
2.9 Discussion of Critical Issues ................................................................................25
2.9.1 Isolation Strategy .......................................................................................25
2.9.2 Vertical Isolation ........................................................................................28
2.9.3 Seismic Gap Size and Hard or Soft Stops ..................................................29
3 PARAMETRIC STUDY OF A SEISMICALLY ISOLATED RIGID MASS .......... 31
3.1 Introduction ..........................................................................................................31
3.2 Analysis Model .....................................................................................................31
3.2.1 Reactor Containment Building Model .......................................................31
3.2.2 Isolator Model ............................................................................................32
3.3 Ground-Motion Selection for Analysis ..............................................................33
3.4 Summary of Parameters Considered .................................................................38
3.4.1 Comparison of Bouc–Wen and Bilinear Models .......................................38
3.4.2 Different Bearing Characteristic Strength, Qd ...........................................38
3.4.3 Different Initial Stiffness K0 ......................................................................39
3.5 Analysis Results and Discussion .........................................................................39
3.5.1 Response Values Determined by Bouc–Wen and Bilinear Models ...........39
3.5.2 Comparison of Responses for Different Qd ...............................................43
3.5.3 Comparison of Responses for Different K0 ...............................................48
3.6 Conclusion and Summary ...................................................................................52
4 DYNAMIC ANALYSES OF A SEISMICALLY ISOLATED PGSFR SUBJECTED TO EARTHQUAKE EXCITATION ................................................... 53
4.1 Introduction ..........................................................................................................53
4.2 Development of a Refined 3D Model in OpenSees ............................................53
4.2.1 Plant General Description and Geometry ..................................................54
4.2.2 Material and Damping Properties ..............................................................56
4.2.3 Analysis Model ..........................................................................................57
4.2.4 Dead Load and Eigenvalue Analysis Results ............................................60
4.3 Ground Motions Considered in the Analyses ....................................................63
4.4 Parametric Study Summary ...............................................................................64
4.4.1 Comparison of Different Kinitial ..................................................................65

ix
4.4.2 Comparison of Different Tiso ......................................................................65
4.4.3 Comparison of Different Fy .......................................................................65
4.5 Analysis Results and Discussion .........................................................................66
4.5.1 Results for Different Kinitial .........................................................................66
4.5.3 Results for Different Tiso ............................................................................78
4.5.4 Results for Different Fy ..............................................................................86
4.6 Conclusion and Summary ...................................................................................93
5 DYNAMIC ANALYSES OF A SEISMICALLY ISOLATED PGSFR SUBJECTED TO AIRCRAFT IMPACT ..................................................................... 95
5.1 Introduction ..........................................................................................................95
5.2 Study Background ...............................................................................................97
5.2.1 Force Loading Function for Aircraft Impact .............................................97
5.3 Aircraft Impact Cases ..........................................................................................99
5.3.1 Impact Force Loading Scenarios ...............................................................99
5.3.2 Parametric Study Cases ............................................................................100
5.4 Analysis Results and Discussion .......................................................................101
5.4.1 Responses Considering Different Kinitial ...................................................102
5.4.2 Responses Considering Different Tiso ......................................................123
5.4.3 Responses Considering Different Fy ........................................................139
5.7 Sensitivity of Responses to Impact Loading Conditions ................................146
5.4.4 Sensitivity of Responses to Change of Impact Velocity ..........................146
5.4.5 Sensitivity of Responses to Change of Loading-Function Shapes ..........150
5.4.6 Summary of the Sensitivity Study ...........................................................153
5.9 Response Comparison between Aircraft Impact Analysis and Seismic Analysis ...............................................................................................................154
5.10 Summary of Observations and Conclusions....................................................168
6 SUMMARY AND RECOMMENDATIONS FOR FUTURE RESEARCH ............ 171
6.1 Summary .............................................................................................................171
6.2 Recommendations for Future Research ..........................................................182
6.2.1 Seismic Hazard Characterization .............................................................183
6.2.2 Aircraft Impact Characterization and Parametric Studies .......................183
6.2.3 Improved Numerical Modeling of PGSFR ..............................................184
6.2.4 Improved Modeling of Isolation Bearings and Isolation Systems ...........185
6.2.5 Parametric Investigations for Isolation Systems ......................................187

x
6.3 General Recommendations ...............................................................................188
REFERENCES .......................................................................................................................... 189

xi
LIST OF TABLES
Table 2.1 List of previous projects on the study of seismic isolation for use in fast breeder reactors. .......................................................................................................3
Table 2.2 General summary of specifications for the PRISM reactor. ....................................4
Table 2.3 General summary of specifications for the SAFR reactor. ......................................8
Table 2.4 General summary of specifications for the DFBR reactor. ....................................10
Table 2.5 General summary of specifications for the FaCT reactor. .....................................17
Table 2.6 General summary of specifications for the STAR-LM reactor. ............................19
Table 2.7 General summary of specifications for the KALIMER reactor. ............................21
Table 2.8 General summary of specifications for the SILER reactor. ...................................22
Table 3.1 Summary of individual cases considered in the rigid mass parametric study and parameter values used for each case. .....................................................38
Table 4.1 Frame element section properties (in.)...................................................................59
Table 4.2 Initial lead-rubber bearing element properties (kip, in.). .......................................60
Table 4.3 Nodal weight and mass assignments (kip, in.). ......................................................60
Table 4.4 Eigen-frequencies of fixed-base model. ................................................................61
Table 4.5 Eigen-frequencies of the seismically isolated model. ............................................62
Table 4.6 Summary of analysis cases used in the parametric study. .....................................64
Table 5.1 Summary of analysis cases and loading scenarios considered in the parametric study. ..................................................................................................101
Table 6.1(a) Summary of results of seismic analysis for different cases.* ..............................173
Table 6.1(b) Summary on results of seismic analysis for different cases [continuation of Table 6.1 (a)].* .....................................................................................................173
Table 6.2(a) Summary of results of aircraft impact analysis of Boeing-737 impact at location 1.* ...........................................................................................................176
Table 6.2(b) Summary of results of aircraft impact analysis of Boeing-737 impact at location 1.* ...........................................................................................................176
Table 6.3(a) Summary of results of aircraft impact analysis of Boeing-737 impact at location 2.* ...........................................................................................................177

xii
Table 6.3(b) Summary of results of aircraft impact analysis of Boeing-737 impact at location 2.* ...........................................................................................................177
Table 6.4(a) Summary of results of aircraft impact analysis of Boeing-737 impact at location 3.* ...........................................................................................................178
Table 6.4(b) Summary of results of aircraft impact analysis of Boeing-737 impact at
location 3.*...........................................................................................................178
Table 6.5(a) Summary of results of aircraft impact analysis of Boeing-747 impact at
location 1.*...........................................................................................................179
Table 6.6(a) Summary of results of aircraft impact analysis of Boeing-747 impact at location 2.* ...........................................................................................................180
Table 6.6(b) Summary of results of aircraft impact analysis of Boeing-747 impact at location 2.* ...........................................................................................................180
Table 6.7(a) Summary of results of aircraft impact analysis of Boeing-747 impact at location 3.* ...........................................................................................................181
Table 6.7(b) Summary of results of aircraft impact analysis of Boeing-747 impact at location 3.* ...........................................................................................................181

xiii
LIST OF FIGURES
Figure 2.1 PRISM 1395 MW target commercial plant [Berglund et al. 1987]. ........................4
Figure 2.2 PRISM power block [Kwant and Boardman 1992]. ................................................5
Figure 2.3 Schematic of reactor and base isolator [Tajirian et al. 1990]. .................................5
Figure 2.4 Bearing used in the project [Tajirian et al. 1992]. ...................................................6
Figure 2.5 Schematic of SAFR reactor [Johnson et al. 1988]. ..................................................8
Figure 2.6 Schematic of isolated system for the SAFR design [Tajirian et al. 1990]. ..............9
Figure 2.7 Comparison of horizontal and vertical response spectra for SAFR design [Tajirian et al. 1990]. ...............................................................................................9
Figure 2.8 Schematic of seismic isolated system [Sawada et al. 1989]. .................................11
Figure 2.9 Layout of bearing and schematic of isolated reactor containment building for the DFBR [Kato et al. 1991]. ...........................................................................11
Figure 2.10 Rubber bearing with steel damper system for the DFBR [Kato et al. 1995a]. ...................................................................................................................12
Figure 2.11 Schematic of five proposed types of three-dimensional isolation systems. ...........14
Figure 2.12 Setup of the shaking table test for the DBFR project [Kitamura 2009]. ................15
Figure 2.13 Original design of the DFBR considered as the basis of the test specimen shown in Figure 2.12 [Kitamura 2009]. .................................................................15
Figure 2.14 Test specimen and analysis model for DFBR with high-damping rubber bearings [Watanabe et al. 2000a]. ..........................................................................16
Figure 2.15 Schematic of high-damping rubber bearing used in the test ([Watanabe et al. 2000a]................................................................................................................16
Figure 2.16 FAcT reactor containment building and seismic isolation systems [Okamura et al. 2011]. ...........................................................................................17
Figure 2.17 Thick laminated rubber bearings and oil dampers used in the FAcT reactor facility [Okamura et al. 2011]. ...............................................................................17
Figure 2.18 Design seismic loading of FAcT JSFR [Okamura et al. 2011]..............................18
Figure 2.19 Schematic of STAR-LM reactor [Yoo et al. 2002]. ...............................................19
Figure 2.20 KALIMER reactor module and steam generator [Hahn et al 1995]. .....................21
Figure 2.21 Set up of the shaking table test of the KALIMER [Yoo et al. 2000]. ....................21
Figure 2.22 Schematic images of ELSY. ..................................................................................23
Figure 2.23 General layout of MYRRHA. ................................................................................24
Figure 2.24 Schematic of bearings used for SILER. .................................................................24
Figure 2.25 Pipeline expansion joints being tested for SILER. ................................................24

xiv
Figure 2.26 Schematic of bumper mechanism. .........................................................................25
Figure 2.27 Different building isolation strategies [Shiojiri et al. 1989]. .................................26
Figure 2.28 Primary component isolation strategy [Shiojiri et al. 1989]. .................................27
Figure 2.29 Combined isolation strategy [Shiojiri et al. 1989]. ................................................27
Figure 2.30 Localized vertical isolation [Shiojiri et al. 1989]. ..................................................28
Figure 2.31 Schematic of one of the proposed 3D isolation system for DFBR. .......................28
Figure 3.1 Simplified rigid-mass model for analysis. .............................................................32
Figure 3.2 Hysteresis loops of the two bearing models used in the rigid mass analysis: (a) bilinear isolator model and (b) Bouc–Wen isolator model. .............................32
Figure 3.3 Horizontal (top) and vertical (bottom) pseudo acceleration response spectra for the set of 20 dispersion-appropriate motions selected to match the 5% damped USNRC RG1.60 target spectrum with a PGA = 0.3g in an average sense over the frequency range from 0.25 Hz–20 Hz. .............................34
Figure 3.4 Horizontal (top) and vertical (bottom) displacement response spectra for the set of 20 dispersion-appropriate motions selected to match the 5% damped USNRC RG1.60 target spectrum with a PGA = 0.3g in an average sense over the frequency range from 0.25 Hz–20 Hz. ...........................................35
Figure 3.5 Horizontal (top) and vertical (bottom) pseudo acceleration response spectra for the set of 20 dispersion-appropriate motions selected to match the 5% damped EUR 2.4.6 target spectrum with a PGA = 0.3g in an average sense over the frequency range from 0.25 Hz–20 Hz. .............................36
Figure 3.6 Horizontal (top) and vertical (bottom) displacement response spectra for the set of 20 dispersion-appropriate motions selected to match the 5% damped EUR 2.4.6 target spectrum with a PGA = 0.3g in an average sense over the frequency range from 0.25 Hz–20 Hz. .....................................................37
Figure 3.7 Median and 84th-percentile isolator displacement spectra under the NRC hazard. Response values using bilinear and Bouc–Wen models are plotted together for comparison. Values at the isolator period of 2.1 sec are marked in the plot. .................................................................................................40
Figure 3.8 Median and 84th-percentile isolator displacement spectra under the EUR hazard. Response values using bilinear and Bouc–Wen models are plotted together for comparison. Values at the isolator period of 2.1 sec are marked in the plot. .................................................................................................41
Figure 3.9 Median and 84th-percentile isolated mass total acceleration spectra under the NRC hazard. Response values using bilinear and Bouc–Wen models are plotted together for comparison. Values at the isolator period of 2.1 sec are marked in the plot. ...........................................................................................42

xv
Figure 3.10 Median force (total acceleration) reduction ratio under the NRC hazard. Response values using bilinear and Bouc–Wen models are plotted together for comparison. Values at the isolator period of 2.1 sec are marked in the plot. ........................................................................................................................43
Figure 3.11 Median and 84th-percentile isolator displacement spectra under the NRC hazard. Response values using a bilinear model with different Qd (5% W, 7.5% W, 10% W, and 12% W) are plotted together for comparison. Values at the isolator period of 2.1 sec are marked in the plot. .........................................44
Figure 3.12 Median effective period spectra under the NRC hazard. Response values using a bilinear model with different Qd (5% W, 7.5% W, 10% W, and 12% W) are plotted together for comparison. Values at the isolator period of 2.1 sec are marked in the plot. ...........................................................................45
Figure 3.13 Median and 84th-percentile isolated mass total acceleration spectra under the NRC hazard. Response values using a bilinear model with different Qd (5% W, 7.5% W, 10% W, and 12% W) are plotted together for comparison. Values at the isolator period of 2.1 sec are marked in the plot. .............................46
Figure 3.14 Median force (acceleration) reduction ratio using isolation system under the NRC hazard. Response values using a bilinear model with different Qd (5% W, 7.5% W, 10% W, and 12% W) are plotted together for comparison. Values at the isolator period of 2.1 sec are marked in the plot. ........47
Figure 3.15 Force (acceleration) versus bearing displacement relation under the NRC hazard. Response values using a bilinear model with different Qd (5% W, 7.5% W, 10% W, and 12% W) are plotted together for comparison. .....................47
Figure 3.16 Median and 84th-percentile isolator displacement spectra under the NRC hazard. Response values using a bilinear model with different α (0.1%, 1%, 5%, and 10%) are plotted together for comparison. Values at the isolator period of 2.1 sec are marked in the plot. ...................................................49
Figure 3.17 Median and 84th-percentile isolated mass acceleration spectra under the NRC hazard. Response values using a bilinear model with different α (0.1%, 1%, 5%, and 10%) are plotted together for comparison. Values at the isolator period of 2.1 sec are marked in the plot. .............................................50
Figure 3.18 Median force (acceleration) reduction ratio using the NRC hazard. Response values using a bilinear model with different α (0.1%, 1%, 5%, and 10%) are plotted together for comparison. Values at the isolator period of 2.1 sec are marked in the plot. ...........................................................................51
Figure 3.19 Median force (acceleration) versus bearing displacement relation under the NRC hazard. Response values using a bilinear model with different α (0.1%, 1%, 5%, and 10%) are plotted together for comparison. ...........................51

xvi
Figure 4.1 Perspective and schematic view of PGSFR power plant. ......................................54
Figure 4.2 Plan view of preliminary PGSFR general arrangement with dimensions. ............55
Figure 4.3 Elevation view of preliminary PGSFR general arrangement with dimensions. ............................................................................................................56
Figure 4.4 3D view, plan view, and elevation view of analysis model. ..................................58
Figure 4.5 Section property definitions for the reactor containment building and auxiliary building frame elements (kip, in.) ...........................................................59
Figure 4.6 Axial load distribution in isolators under dead-load case. .....................................61
Figure 4.7 Selected mode shapes of fixed-base model. ..........................................................62
Figure 4.8 Selected mode shapes of the seismically isolated model. ......................................63
Figure 4.9 Median horizontal floor acceleration spectra for first floor, fourth floor, and roof of the reactor containment building. Base-isolated cases with different initial stiffness and fixed-base cases with different PGA are compared. ...............................................................................................................68
Figure 4.10 84th-percentile horizontal floor acceleration spectra for first floor of the reactor containment building. Base-isolated cases with different initial stiffness and fixed-base cases with different PGA are compared. .........................69
Figure 4.11 Median horizontal floor acceleration spectra for first floor, third floor, and roof of the AUX. Base-isolated cases with different initial stiffness and fixed-base cases with different PGA are compared. ..............................................71
Figure 4.12 Median vertical floor acceleration spectra for first floor, fourth floor, and roof of the reactor containment building. Base-isolated cases with different initial stiffness and fixed-base cases with different PGA are compared. ..............73
Figure 4.13 Median maximum story drifts for reactor containment and auxiliary buildings. Base-isolated cases with different initial stiffness and fixed-base cases with different PGA are compared. ................................................................74
Figure 4.14 84th-percentile maximum story drifts for reactor containment and auxiliary buildings. Base-isolated cases with different initial stiffness and fixed-base cases with different PGA are compared. ................................................................75
Figure 4.15 Southwest Bearing H1 direction hysteresis loop and displacement orbit under NRC PGA 0.3g ground-motion time-history number 9. The isolation system with different initial stiffnesses are shown together. ..................76
Figure 4.16 Center Bearing H1 direction hysteresis loop and displacement orbit under NRC PGA 0.3g ground-motion time-history number 9. The isolation system with different initial stiffnesses are shown together. .................................77
Figure 4.17 Median horizontal floor acceleration spectrum for first floor, fourth floor, and top floors of the reactor containment building. Base-isolated cases with different isolation period and fixed-base case under PGA 0.3g NRC motion set and fixed-base under PGA 0.1g motion set are compared. ..................80

xvii
Figure 4.18 Median horizontal floor acceleration spectrum for first, third, and top floors of the auxiliary building. Base-isolated cases with different isolation period and fixed-base case under PGA 0.3g NRC motion set and fixed-base under PGA 0.1g motion set are compared. ....................................................81
Figure 4.19 Median maximum drift responses for the reactor containment building and auxiliary building. Base-isolated cases with different isolation period and fixed-base case under PGA 0.3g NRC motion set and fixed-base under PGA 0.1g motion set are compared. ......................................................................83
Figure 4.20 Southwest Bearing H1 direction hysteresis loop and displacement orbit under NRC PGA 0.3g ground-motion time-history number 4. The isolation system with different isolation periods are shown together. ...................84
Figure 4.21 Southwest Bearing H1 direction hysteresis loop and displacement orbit under NRC PGA 0.3g ground motion time-history number 4. The isolation system with different isolation periods are shown together. ..................................85
Figure 4.22 Horizontal floor acceleration spectrum for top floor of the reactor containment building is shown. Base-isolated cases with different isolation period and fixed-base case under 0.3g NRC motion set and fixed base under 0.1g is compared. The response is for ground-motion 4. ............................86
Figure 4.23 Median horizontal floor acceleration spectrum for first floor, fourth floor, and top floors of the reactor containment building. Base-isolated cases with different bearing yield forces and fixed-base cases under PGA 0.3g NRC motion set and fixed-base case under PGA 0.1g motion set are compared. ...............................................................................................................88
Figure 4.24 Median horizontal floor acceleration spectrum for first floor, third floor, and top floors of the auxiliary building. Base-isolated cases with different bearing yield forces and the fixed-base case under PGA 0.3g NRC motion set and fixed base under PGA 0.1g motion set are compared. ..............................89
Figure 4.25 Median maximum drift responses for reactor containment building and auxiliary building. Base-isolated cases with different bearing yield forces and fixed-base case under PGA 0.3g NRC motion set and fixed-base case under PGA 0.1g motion set are compared. ............................................................90
Figure 4.26 Center Bearing H1 direction hysteresis loop and displacement orbit under NRC PGA 0.3g ground-motion time-history number 19. The isolation system with different yield strengths are shown together. .....................................91
Figure 4.27 Southwest Bearing H1 direction hysteresis loop and displacement orbit under NRC PGA 0.3g ground-motion time-history number 19. The isolation system with different yield strengths are shown together. ......................92
Figure 5.1 Force loading functions for aircraft impact analysis. Impact loading histories for a Boeing-747-400 and Boeing-737-900 are used in this study. The forcing function for a Boeing-707-320 is shown for reference (after Blandford et al. [2009]). .........................................................................................98

xviii
Figure 5.2 Location and direction considered for the impact loading in this study. Two types of aircraft were considered for each location. The H1 direction is along the longitudinal axis of the structure, and the H2 direction is along the transverse axis. ...............................................................................................100
Figure 5.3 Floor acceleration spectra in the H1 direction for the auxiliary building. Impact Scenario 1 (Boeing-737 at location 1); fixed-base and base-isolated cases with different Kinitial (Tiso = 3 sec and Fy = 0.1 W). .....................................103
Figure 5.4 Floor acceleration spectra in the H2 direction for the auxiliary building. Impact Scenario 1 (Boeing-737 at location 1); fixed-base and base-isolated cases with different Kinitial (Tiso = 3 sec and Fy = 0.1 W). .....................................104
Figure 5.5 Peak floor accelerations along height. Impact Scenario 1 (Boeing-737 at location 1); fixed-base and base-isolated cases with different Kinitial (Tiso = 3 sec and Fy = 0.1 W). ..........................................................................................105
Figure 5.6 Vertical floor acceleration spectra for auxiliary building. Impact Scenario 1 (Boeing-737 at location 1); fixed-base and base-isolated cases with different Kinitial (Tiso = 3 sec and Fy = 0.1 W)........................................................105
Figure 5.7 Peak story drifts along height. Impact Scenario 1 (Boeing-737 at location 1); fixed-base and base-isolated cases with different Kinitial (Tiso = 3 sec and Fy = 0.1 W). ..........................................................................................................107
Figure 5.8 Maximum floor rotations along height. Impact Scenario 1 (Boeing-737 at location 1); fixed-base and base-isolated cases with different Kinitial (Tiso = 3 sec and Fy = 0.1 W). ..........................................................................................107
Figure 5.9 Floor acceleration spectra for reactor containment building in the H2 direction. Impact Scenario 1 (Boeing-737 at location 1): fixed-base and base-isolated cases with different Kinitial (Tiso = 3 sec and Fy = 0.1 W). ...............110
Figure 5.10 Peak floor accelerations along height of the reactor containment building. Impact Scenario 1 (Boeing-737 at location 1): fixed-base and base-isolated cases with different Kinitial (Tiso = 3 sec and Fy = 0.1 W). .....................................111
Figure 5.11 Peak story drifts along height for the reactor containment building. Impact Scenario 1 (Boeing-737 at location 1): fixed-base and base-isolated cases with different Kinitial (Tiso = 3 sec and Fy = 0.1 W). ..............................................111
Figure 5.12 Hysteresis loops and displacement orbits for bearings at the four corners of the base mat. Impact Scenario 1 (Boeing-737 at location 1): base-isolated cases with different Kinitial (Tiso = 3 sec and Fy = 0.1 W). .......................112
Figure 5.13 Floor acceleration spectra in the auxiliary building in the H2 direction. Impact Scenario 4 (Boeing-747 at location 1): fixed-base and base-isolated cases with different Kinitial (Tiso = 3 sec; Fy = 0.1 W). ...........................................114
Figure 5.14 Peak floor accelerations along height of the auxiliary building. Impact Scenario 4 (Boeing-747 at location 1): fixed-base and base-isolated cases with different Kinitial (Tiso = 3 sec and Fy = 0.1 W). ..............................................115

xix
Figure 5.15 Peak story drifts along height. Impact Scenario 4 (Boeing-747 at location 1): fixed-base and base-isolated cases with different Kinitial (Tiso = 3 sec and Fy = 0.1 W). ..........................................................................................................116
Figure 5.16 Maximum floor rotations along height. Impact Scenario 4 (Boeing-747 at location 1): fixed-base and base-isolated cases with different Kinitial (Tiso = 3 sec and Fy = 0.1 W). ..........................................................................................116
Figure 5.17 Floor acceleration spectra for the reactor containment building in the H2 direction. Impact Scenario 4 (Boeing-747 at location 1): fixed-base and base-isolated cases with different Kinitial (Tiso = 3 sec and Fy = 0.1 W). ...............119
Figure 5.18 Peak floor accelerations along height. Impact Scenario 4 (Boeing-747 at location 1): fixed-base and base-isolated cases with different Kinitial (Tiso = 3 sec and Fy = 0.1 W). ..........................................................................................120
Figure 5.19 Peak floor rotations along height for the reactor containment building. Impact Scenario 4 (Boeing-747 at location 1): fixed-base and base-isolated cases with different Kinitial (Tiso = 3 sec and Fy = 0.1 W). .....................................120
Figure 5.20 Hysteresis loops and displacement orbits for bearings at the four corners of the base mat. Impact Scenario 4 (Boeing-747 at location 1): base-isolated cases with different Kinitial (Tiso = 3 sec and Fy = 0.1 W). .......................121
Figure 5.21 Floor acceleration spectra for the auxiliary building in the H2 direction. Impact Scenario 2 (Boeing-737 at location 2): fixed-base and base-isolated cases with different Tiso (Kinitial = 10 Kpostyield and Fy = 0.1 W). ............................125
Figure 5.22 Peak floor accelerations along height for the auxiliary building. Impact Scenario 2 (Boeing-737 at location 2): fixed-base and base-isolated cases with different Tiso (Kinitial = 10 Kpostyield and Fy = 0.1 W). .....................................126
Figure 5.23 Peak story drifts along height for the auxiliary building. Impact Scenario 2 (Boeing-737 at location 2): fixed-base and base-isolated cases with different Tiso (Kinitial = 10 Kpostyield and Fy = 0.1 W). .............................................126
Figure 5.24 Maximum floor rotations along height for the auxiliary building. Impact Scenario 2 (Boeing-737 at location 2): fixed-base and base-isolated cases with different Tiso (Kinitial = 10 Kpostyield and Fy = 0.1 W). .....................................127
Figure 5.25 Floor acceleration response spectra for the reactor containment building in the H2 direction. Impact Scenario 2 (Boeing-737 at location 2): fixed-base and base-isolated cases with different Tiso (Kinitial = 10 Kpostyield and Fy = 0.1 W). ........................................................................................................................129
Figure 5.26 Peak floor accelerations along height for the reactor containment building. Impact Scenario 2 (Boeing-737 at location 2): fixed-base and base-isolated cases with different Tiso (Kinitial = 10 Kpostyield and Fy = 0.1 W). ............................130
Figure 5.27 Peak story drifts along height for the reactor containment building. Impact Scenario 2 (Boeing-737 at location 2): fixed-base and base-isolated cases with different Tiso (Kinitial = 10 Kpostyield and Fy = 0.1 W). .....................................130

xx
Figure 5.28 Hysteresis loops and displacement orbits for bearings at the four corners of the base mat. Impact Scenario 2 (Boeing-737 at location 2): base-isolated cases with different Tiso (Kinitial = 10 Kpostyield and Fy = 0.1 W). ..............131
Figure 5.29 Floor acceleration spectra for auxiliary building in the H2 direction. Impact Scenario 5 (Boeing-747 at location 2): fixed-base and base-isolated cases with different Tiso (Kinitial = 10 Kpostyield and Fy = 0.1 W). ............................134
Figure 5.30 Peak floor accelerations along height for the auxiliary building. Impact Scenario 5 (Boeing-747 at location 2): fixed-base and base-isolated cases with different Tiso (Kinitial = 10 Kpostyield and Fy = 0.1 W). .....................................135
Figure 5.31 Maximum floor rotations along height for the auxiliary building. Impact Scenario 5 (Boeing-747 at location 2): fixed-base and base-isolated cases with different Tiso (Kinitial = 10 Kpostyield and Fy = 0.1 W). .....................................135
Figure 5.32 Floor acceleration spectra for the reactor containment building in the H2 direction. Impact Scenario 5 (Boeing-747 at location 2): fixed-base and base-isolated cases with different Tiso (Kinitial = 10; Kpostyield and Fy = 0.1 W). ........................................................................................................................136
Figure 5.33 Peak floor accelerations along height for the reactor containment building. Impact Scenario 5 (Boeing-747 at location 2): fixed-base and base-isolated cases with different Tiso (Kinitial = 10 Kpostyield and Fy = 0.1 W). ............................137
Figure 5.34 Maximum floor rotations along height for the reactor containment building. Impact Scenario 5 (Boeing-747 at location 2): fixed-base and base-isolated cases with different Tiso (Kinitial = 10 Kpostyield and Fy = 0.1 W). ......137
Figure 5.35 Hysteresis loops and displacement orbits for bearings at the four corners of the base mat. Impact Scenario 5 (Boeing-747 at location 2); base-isolated cases with different Tiso (Kinitial = 10 Kpostyield and Fy = 0.1 W). ..............138
Figure 5.36 Floor acceleration spectra for the auxiliary building in the H1 direction. Impact Scenario 6 (Boeing-747 at location 3): fixed-base and base-isolated cases with different Fy (Kinitial = 10 Kpostyield and Tiso = 3 sec). .............................141
Figure 5.37 Peak floor acceleration responses along height of the auxiliary building. Impact Scenario 6 (Boeing-747 at location 3): fixed-base and base-isolated cases with different Fy (Kinitial = 10 Kpostyield and Tiso = 3 sec). .............................142
Figure 5.38 Floor acceleration spectra for the reactor containment building in the H1 direction. Impact Scenario 6 (Boeing-747 at location 3): fixed-base and base-isolated cases with different Fy (Kinitial = 10 Kpostyield and Tiso = 3 sec). .......143
Figure 5.39 Peak floor acceleration along height of the reactor containment building. Impact Scenario 6 (Boeing-747 at location 3): fixed-base and base-isolated cases with different Fy (Kinitial = 10 Kpostyield and Tiso = 3 sec). .............................144
Figure 5.40 Hysteretic loops and displacement orbits for the four corner bearings in the PGSFR. Impact Scenario 6 (Boeing-747 at location 3): fixed-base and base-isolated cases with different Fy (Kinitial = 10 Kpostyield and Tiso = 3 sec). .......145

xxi
Figure 5.41 Loading functions used for aircraft impact analysis due to Boeing-747-400 with different impact speeds. ...............................................................................147
Figure 5.42 Maximum drift ratios under different impact velocities of aircraft: (a) maximum drift response of the auxiliary building and (b) maximum drift response of the reactor containment building. .....................................................147
Figure 5.43 Maximum rotation responses under different impact velocities of aircraft: (a) maximum rotation response of the auxiliary building and (b) maximum rotation response of the reactor containment building. ........................................148
Figure 5.44 Maximum top floor horizontal acceleration spectrum value for the reactor containment building and the auxiliary building under different impact velocities: (a) maximum top floor acceleration spectrum of the auxiliary building and (b) maximum top floor acceleration spectrum of the reactor containment building. ..........................................................................................149
Figure 5.45 Maximum isolator displacement responses at different impact velocities: (a) real displacement response amplitude and (b) normalized displacement amplitude relative to 100% cruising speed. .........................................................149
Figure 5.46 Different loading-function shapes considered in this section. All the loading functions had the same momentum value. ..............................................150
Figure 5.47 Maximum drift response under different loading-function shapes: (a) maximum drift response of the auxiliary building and (b) maximum drift response of the reactor containment building. .....................................................151
Figure 5.48 Maximum rotation response under different loading-function shapes: (a) maximum rotation response of the auxiliary building and (b) maximum rotation response of the reactor containment building. ........................................151
Figure 5.49 Maximum top floor horizontal acceleration spectrum value for the reactor containment building and the auxiliary building under different loading-function shapes: (a) maximum top floor acceleration spectrum of the auxiliary building and (b) maximum top floor acceleration spectrum of the reactor containment building. ..............................................................................153
Figure 5.50 Maximum isolator displacement responses under different loading-function shapes.....................................................................................................153
Figure 5.51 Floor peak drift responses along height for the auxiliary building. Impact Scenario 1 (Boeing-737 at location 1) and seismic condition under the PGA 0.3g event; responses are for the fixed-base case. ......................................156
Figure 5.52 Floor acceleration spectra for the auxiliary building. Impact Scenario 1 (Boeing-737 at location 1) and seismic condition under PGA 0.3g event; responses are for the fixed-base case. ..................................................................157
Figure 5.53 Floor peak drift responses along height for the reactor containment building. Impact Scenario 1 (Boeing-737 at location 1) and seismic condition under PGA 0.3g event; responses are for the base-isolated case (Fy = 10% W, Kinitial = 10 Kpostyield, and Tiso = 3 sec). ............................................158

xxii
Figure 5.54 Floor acceleration spectra for the reactor containment building. Impact Scenario 1 (Boeing-737 at location 1) and seismic condition under PGA 0.3g event; responses are for the base-isolated case (Fy = 10% W, Kinitial = 10 Kpostyield, and Tiso = 3 sec). ...............................................................................159
Figure 5.55 Floor peak drift responses along height for the auxiliary building. Impact Scenario 1 (Boeing-737 at location 1) and seismic condition under PGA 0.3g event; responses are for the base-isolated case (Fy = 10% W, Kinitial = 10 Kpostyield, and Tiso = 3 sec). ...............................................................................160
Figure 5.56 Floor acceleration spectra for the auxiliary building. Impact Scenario 1 (Boeing-737 at location 1) and seismic condition under PGA 0.3g event; responses are for the base-isolated case (Fy = 10% W, Kinitial = 10 Kpostyield, and Tiso = 3 sec). ...................................................................................................161
Figure 5.57 Floor peak drift responses along height for the auxiliary building. Impact Scenario 4 (Boeing-747 at location 1) and seismic condition under PGA 0.3g event; responses are for the fixed-base case. ...............................................162
Figure 5.58 Floor acceleration spectra for the auxiliary building. Impact Scenario 4 (Boeing-747 at location 1) and seismic condition under PGA 0.3g event; responses are for the fixed-base case. ..................................................................163
Figure 5.59 Floor peak drift responses along height for the reactor containment building. Impact Scenario 4 (Boeing-747 at location 1) and seismic condition under PGA 0.3g event; responses are for the base-isolated case (Fy = 10% W, Kinitial = 10 Kpostyield, and Tiso = 3 sec). ............................................164
Figure 5.60 Floor acceleration spectra for the reactor containment building. Impact Scenario 4 (Boeing-747 at location 1) and seismic condition under PGA 0.3g event; responses are for the base-isolated case (Fy = 10% W, Kinitial = 10 Kpostyield, and Tiso = 3 sec). ...............................................................................165
Figure 5.61 Floor peak drift responses along height for the auxiliary building. Impact Scenario 4 (Boeing-747 at location 1) and seismic condition under PGA 0.3g event; responses are for the base-isolated case (Fy = 10% W, Kinitial = 10 Kpostyield, and Tiso = 3 sec). ...............................................................................166
Figure 5.62 Floor acceleration spectra for the auxiliary building. Impact Scenario 4 (Boeing-747 at location 1) and seismic condition under PGA 0.3g event; responses are for the base-isolated case (Fy = 10% W, Kinitial = 10 Kpostyield, and Tiso = 3 sec). ...................................................................................................167
1
1 INTRODUCTION
1.1 INTRODUCTION
In the search for safe, economical, and environmentally friendly sources of electric power, many energy providers are turning to new technologies. These include advanced sodium-cooled fast reactors, which offer significant benefits in terms of safety, efficiency, and sustainability, and seismic isolation, which can substantially reduce demands and improve the performance of structures and their mechanical systems and components.
This report does not discuss any particular advantages and disadvantages of fast reactors. It presents the results of a preliminary study aimed at assessing the feasibility of using seismic isolation to help safeguard sodium-cooled fast reactors from hazards posed by strong earthquake ground shaking and aircraft impact. To focus this report, simplified numerical models were examined that are representative in general terms of a Prototype Gen-IV Sodium-Cooled Fast Reactor (PGSFR) being considered by the KEPCO Engineering and Construction Company, Inc. (KEPCO E&C). Since the details of the plant design and the required seismic and aircraft impact hazards are not yet known, the results are preliminary. However, they are useful in the conceptual design process of a PGSFR and the possible use of seismic isolation.
1.2 SCOPE OF REPORT
This report is divided into 6 chapters as follows:
Chapter 1. Introduction
Chapter 2. Literature Survey Related to Seismically Isolated Fast Breeder Reactors
Chapter 3. Parametric study of a Seismically Isolated Rigid Mass
Chapter 4. Dynamic Analysis of a Seismically Isolated PGSFR Subjected to Earthquake Excitation
Chapter 5. Dynamic Analysis of a Seismically Isolated PGSFR Subjected to Aircraft Impact
Chapter 6. Summary and Recommendations for Future Research

2

3
2 LITERATURE SURVEY RELATED TO SEISMICALLY ISOLATED FAST BREEDER REACTORS
2.1 INTRODUCTION
Currently, no fast reactor has been constructed using seismic isolation. However, the increased safety and sustainability of fast reactors suggests that a comparable effort to increase seismic safety margins would be useful. This is consistent with the overall stringent performance goals stipulated for Gen-IV reactors. It is thought that seismic loading is more important for fast reactors than for conventional commercial nuclear power plants (NPPs) due to the systems, components, and equipment used, which are characterized as being heavy and flexible.
This chapter presents a brief review of previous studies on the application of seismic isolation to fast breeder reactors. Included are a detailed introduction of each project and a discussion on several key points relevant to the seismic isolation of fast breeder reactors. A list of projects reviewed in this chapter is summarized in Table 2.1 below.
Table 2.1 List of previous projects on the study of seismic isolation for use in fast breeder reactors.
Country Project Name
Full name Approximate time
line
USA PRISM Power Reactor Innovative Small Module 1984–1994
SAFR The Sodium Advanced Fast Reactor 1988–1995
Japan DFBR Demonstration Fast Breeder Reactor 1989–2001
JSFR Japan Sodium-cooled Fast Reactor 1995–2000
Korea STAR-LM
The Secure, Transportable, Autonomous Reactor-Liquid Metal
2002–2005
KALIMER Korea Advanced Liquid Metal Reactor 2009–2012
Europe SILER Seismic Initiated events risk Mitigation in Lead-cooled
Reactor 2012–present

2.2 P
2.2.1 P
In 1981, Metal ReModule three idena thermaFigure 2.m (20 ft)1992; Taspecifica
Rea
Reabui
Dim
Deseart
Bea
Bas
POWER RE
Project Des
General Eleactor (LMR(PRISM). Tntical 465 M
al efficiency.1, and a sch) in diameterajirian et al.ations for the
Table 2.2
actor capacit
actor containlding weight
mension:
sign safe shuthquake (SS
aring type:
se isolation s
Figure 2.1
EACTOR IN
scription
ectric CompR) conceptuaThe target coMW power by of 32.9% hematic of ear, 18.9 m (6. 1990] as se PRISM rea
2 Gene
ty:
nment t:
utdown E)
system:
PRISM 1
NNOVATIVE
pany (GE) inal design, wommercial Plocks, for an[Berglund each power bl2 ft) high, ashown in Fiactor.
eral summary
465 MW per
40 MN (9000
Reactor vess
Horizontal: 0
High shape f
Only horizon
1395 MW targ
4
E SMALL M
nitiated a prwhich resultePRISM plann overall planet al. 1987]. lock is show
and is supporigure 2.3; se
y of specifica
power block
0 kip) for whole
sel diameter of
.3g, Vertical: 0
factor laminated
tal isolation sys
get commerc
MODULE (
rogram to ded in the Pont has nine rnt net electri An overvie
wn in Figure rted from thee Table 2.2
ations for the
e isolated struct
f 6.1 m (20 ft), h
0.3g
d rubber bearin
stem with 20 b
cial plant [Be
PRISM)
develop an inower Reactorreactor modical rating ofew of the p2.2. The rea
he top [Kwan2 for a gen
e PRISM rea
ture
height of 18.9 m
ng
bearings for eac
erglund et al
nnovative Lr Inherently
dules arrangf 1395 MW,
plant is showactor vessel int and Board
neral summa
ctor.
m (62 ft)
ch reactor
l. 1987].
Liquid y Safe ged in , with wn in is 6.1 dman
ary of

Tthe horizto horizoacceleratcritical sbetween control rodecreasedloads by response
T20 large-shown innatural rufactor (H
Figu
Figure 2.3
The reactor mzontal directiontal groundtion. This limsystems, com
the componod drives wid relative dia factor ofis insensitiv
The entire iso-diameter stn Figure 2.3ubber [DerhaHSF) of the
ure 2.2 P
3 Schem
module, RVAion with a fud motion esmits the ine
mponents, annents minimith their guidisplacementsf three. Anove to the soil
olated structueel-laminate. The elastomam et al. 198e isolation b
PRISM powe
matic of reac
ACS, and heundamental ssentially asertial loads and structure
mizes the forde elements.s is to increather advantal properties a
ure weighs aed elastomermeric comp85]. Accordibearings pro
5
r block [Kwa
ctor and base
ead access afrequency os a rigid boand increase
es. Also, thercing functio. The combinase the reactage of seismat the site [K
approximatelric bearings;ound used cing to Tajiriaovides suffi
ant and Boar
e isolator [Ta
area structureof 0.75 Hz. Tody with lites the structe reduction on for seismned effect otor capacity mic isolationKwant and B
ly 40 MN (9; it is houseconsists of aan et al. [19
ficient intrin
rdman 1992].
ajirian et al. 1
es are seismThe isolated ttle amplifictural designin the relat
mic interferef decreased to sustain h
n is that theoardman 19
9000 kip) aned in an unda highly fille90], the rela
nsic stiffness
.
1990].
mically isolatsystem resp
cation of grn margins foive displace
ence betweeload transfe
horizontal see nuclear isl92].
nd is supportederground sied, high-damatively high ss in the ve
ted in ponds round or the ement n the
er and ismic and’s
ed on ilo as
mping shape ertical

directionunnecessmaximumdeterminseismicit
Tvertical sgoals areshear strathe beari(52 in.) iin.-) thickto severaknown as
Aperformawell as sextreme hpreferredassemblyconfigura
n to minimizsary. The sem horizontalne the cost ofty [Gyorey e
The main parstiffness ande a horizontaain during angs for this in diameter ak rubber bon
al steel shim s HSF bearin
An extensiveance characteeveral quarthorizontal te
d connectiony to the aations [Tajir
(a) Schem
Fig
ze amplificateismic desigl and verticaf raising the t al. 1992].
rameters govd the allowaal frequencyan SSE evencondition isand (23.1 innded to 29 stplates, it wa
ngs.
e experimenteristics of ther-scale bearests, an ultimn type for nadaptor platrian and Kell
matic of bearin
ure 2.4
tions due togn basis wasal acceleratioSSE capabil
verning the dable shear stry of 0.75 Hznt was takens 190 mm (7n.) high. Eachteel shims; sas possible t
tal program he PRISM Hrings. The se
mate verticalnuclear appltes were inly 1988; Maz
ng
Bearing used
6
o vertical gros a design son of 0.3g. Ality from the
design of therains for difz and a vert
n as 50%. Th7.5 in.) [Tajirh bearing cosee Figure 2.o achieve a
was undertSF bearingseries of testsl load test, anlications, twnvestigated: zda et al. 19
(
d in the proje
ound motionsafe shutdowAdditional ane original 0.3
e bearings arfferent earthtical frequenhe maximumrian et al. 19onsists of thi.4. By usinghigh vertica
taken at UCs. Eight half-s included: vnd a bucklin
wo methods dowel typ
989; and Kell
(b) Hysteresis
ect [Tajirian
ns, making wn earthquanalysis has a3g to 0.5g fo
re the requirehquake levelncy of 20 Hm horizontal992]. The beirty layers o
g thin layers al stiffness. S
C Berkeley t-scale bearinvertical testsng load test.
for connecpe connectily et al. 1990
s loop for cycl
et al. 1992].
vertical isolake (SSE) walso been door zones of h
ed horizontas. The frequ
Hz. The allowl displacemeearings are 1
of 12.7-mm- of rubber bo
Such bearing
to investigatngs were test, horizontal To determin
cting the beions and b0].
ic shear test
lation with a one to higher
al and uency wable ent in 1.3 m (0.5-
onded gs are
te the ted as tests,
ne the earing bolted

7
2.3 THE SODIUM ADVANCED FAST REACTOR (SAFR)
2.3.1 Project Description
The Sodium Advanced Fast Reactor (SAFR) was designed by Rockwell International. SAFR utilizes LMR technology to provide an innovative power system, which is reportedly inherently safe, reliable, and cost competitive with alternate energy options [Johnson et al. 1988]. SAFR is a modular power system that uses a 900 MW (thermal) reactor to generate superheated steam, which drives a 350 MW turbine. The SAFR reactor assembly is shown in Figure 2.5. The vessel is 11.9 m (39 ft) in diameter, and 14.6 m (48 ft) high. The reactor assembly module is a standardized shop-fabricated unit housed in a building constructed above grade with plan dimensions of 37.8 m (124 ft) 25 m (82 ft); see Figure 2.6. The entire SAFR building, which weighs 280 MN (63,000 kip) is supported on 100 seismic isolators; see Table 2.3 for a general summary of specifications for the SAFR reactor.
The SAFR design provides vertical as well as horizontal isolation. The design horizontal frequency is 0.5 Hz, and the vertical frequency is 3 Hz. This is achieved by using bearings with thicker rubber layers bonded to fewer steel shims, resulting in bearings that are flexible both vertically and horizontally [Tajirian et al. 1990]. The bearing is 1.08 m (42 in.) in diameter and 413 mm (16.25 in.) high. Each bearing consists of three layers of 101-mm- (4-in.-) thick rubber, resulting in a low shape factor (LSF) of 2.3. The seismic design basis was a SSE with a maximum horizontal and vertical acceleration of 0.3g. Additional analysis was performed to determine the cost of raising the SSE capability from the original 0.3g to 0.5g for zones of higher seismicity.
Dynamic analyses were performed by Tajirian et al. [1990] to compare the response of SAFR with and without isolation. Figure 2.7 compares the horizontal and vertical response spectra at the reactor supports. The isolated system resulted in substantial reductions in horizontal accelerations at all the equipment resonant frequencies. In the vertical direction, the response was amplified at the vertical isolation frequencies but was reduced at frequencies greater than 4 Hz, which is the vertical frequency of the range of equipment. The maximum SSE horizontal displacement of the bearings was 229 mm (9 in.). Small amounts of uplift due to rocking were computed in unanchored corner bearings.
The same tests done at UC Berkeley for the SAFR project were conducted for the PRISM project. The tests for the LSF bearings were performed to demonstrate the feasibility of using LSF bearings and to verify the validity of the design equations. Six quarter-scale bearings were tested. Two types of rubber compound (filled high-damping rubber versus unfilled rubber) and two types of end plate connection (dowelled versus bolted) were investigated [Aiken et al. 1989].

Reactor
Reactorweight:
Dimens
Design s
Bearing
Base iso
Table 2.
r capacity:
r containmen
ion:
safe shutdow
g type:
olation syste
Figu
.3 Gene
nt building
wn earthqua
em:
ure 2.5 S
eral summar
900 MW
Reactor whole iso
Reactor
ke Horizont
Low sha
Both hor
Schematic of
8
ry of specific
W
containment bolated structure
vessel diamete
tal: 0.3g, Vertic
pe factor lamin
rizontal and ver
f SAFR react
cations for th
building weight:e
er of 11.9 m (3
cal: 0.3g
nated rubber be
rtical isolation,
tor [Johnson
he SAFR reac
280 MN (63,0
39 ft.), height of
earing
100 bearings
n et al. 1988].
ctor.
000 kip) for the
f 14.6 m (48 ft)
.

Fig
Figu
2.4 A
2.4.1 P
In the co“Joyo” hThese subreeder r
gure 2.6
re 2.7 C[T
ADVANCED
Project Des
ourse of devhas operateduccesses havreactor “DFB
Schematic o
Comparison oTajirian et al.
D DEMONS
scription
veloping a d satisfactorve led JapanBR” with su
of isolated sy
of horizontal. 1990].
STRATION
Japanese Faily, and thenese utilitie
ubsequent co
9
ystem for the
and vertical
FAST BRE
ast Breeder e prototype s to conside
ommercializa
e SAFR desi
l response s
EEDER RE
Reactor (FFBR “Monjer constructation of the
gn [Tajirian e
spectra for SA
EACTOR PL
FBR), the exnju” has achtion of a deFBR design
et al. 1990].
AFR design
LANT (DFB
xperimental hieved criticemonstrationn around the
BR)
FBR cality. n fast e year

10
2030 [Ueta et al. 1995]; see Table 2.4 for a general summary of specifications for the DFBR reactor.
The design study for the DFBR was conducted by the Japan Atomic Power Co. (JAPC), which is the principal organization entrusted by nine electric power companies and the Electric Power Development Co. Ltd. to investigate construction of the DFBR. Construction of a FBR plant in a seismically vulnerable country like Japan must be very sensitive to seismic design requirements. Given Japan’s seismicity, many consider base isolation as the optimum design approach for FBRs [Kato et al. 1991].
In 1987, a testing and research program was begun under contract with the Ministry of International Trade and Industry (MITI) to verify the reliability and effectiveness of seismic isolation for the FBR. It was intended to select appropriate seismic isolation concepts and then determine their effectiveness and feasibility, and finally to develop a rough draft of design technical guidelines [Sawada et al. 1989]. A schematic of the isolated system is shown in Figure 2.8.
In the conceptual design phase, several seismic isolation concepts were proposed and compared, including building isolation, component isolation, and combined isolation. From a preliminary study of construction costs, the horizontal building isolation requires the smallest number of bearings and was expected to result in ample cost-reduction savings. The project contained two phases discussed below.
Table 2.4 General summary of specifications for the DFBR reactor.
Reactor containment building weight:
10,000 kN (2248 kips) for whole isolated structure
Dimension: Reactor vessel diameter of 11.9 m (39 ft.), height of 14.6 m (48 ft)
Design safe shutdown earthquake Horizontal: 0.3g, Vertical: 0.3g
Bearing type: Laminated rubber bearing
Base isolation system: Horizontal only; 175 bearings
2.4.2 Phase 1: Horizontal Seismic Isolation System for the DFBR
Design and analysis studies have been completed on the seismically isolated reactor containment building (RCB). The arrangement of the bearings and a schematic of the isolated RCB are shown in Figure 2.9. The isolation system is composed of laminated rubber and steel bar dampers; see Figure 2.10.
The results of the analytical studies show the base-isolated FBR plant is capable of resisting very large seismic motions. The study reported that severe seismic loads were not transmitted to safety related components [Kato et al. 1991]. The ultimate state of the system was also investigated. Studies showed that the isolation layer has an appreciable seismic safety margin for the design-basis SSE considered. Torsional response of the plant was investigated using a special numerical model consistent with computational capabilities available at the time of the study. The analysis results show that torsion had insignificant influence on the total

responseinfluence
Bbegun incontract developmappropriadevelop a
Figu
. However, e on the ultim
Besides the pn 1987 by th
with Minisment of the ate seismic a rough draf
Figure 2.
re 2.9 Lfo
the rockingmate behavio
preliminary he Central Rtry of Interdesign of tisolation co
ft of design t
8 Schem
ayout of beaor the DFBR
g response oor [Kato et a
analytical stResearch In
rnational Trathe demonstoncepts, to dechnical gui
matic of seis
aring and sch[Kato et al. 1
11
of the isolaal. 1995b].
tudies, an adnstitute of Eade and Indtration reactodetermine thidelines [Shi
smic isolated
hematic of is1991].
ated DFBR
dditional tesElectric Powdustry (MITor. The stud
heir effectiveiojiri 1991].
d system [Saw
solated react
building ha
st and researwer Industry TI). These sdies were ineness and fe
wada et al. 1
tor containm
as a much l
rch program(CRIEPI) u
studies suppntended to sfeasibility, an
1989].
ment building
larger
m was under
ported select nd to
g

Figu
2.4.3 P
The seismoccurred horizontamitigate three-dim
Tbased onSeismic Ithe main(V+2D S
Tmajor prisprings wefficient required analysis m
T
re 2.10 R19
Phase 2: De
mic isolatiolargely from
al seismic ithe seismic l
mensional se
Two types ofn practicalityIsolation Sy
n componentSIS).
The developmivate compawere selectefrom the ptesting of lamethods.
The three-dim
A thremecha
A thre[Kajii
Doublthree-2.11(c
A cabet al. 2
Rubber bearin995a].
evelopmen
on technologm 1987–199isolation sysloads in the ismic isolati
f three-dimey and cost-efystem (3D SIts within a
ment of the anies in Japaned as the veperspective oarge-scale sp
mensional iso
ee-dimensionanism [Kahi
ee-dimensioni et al. 2000]
le metal belldimensional
c).
ble reinforced2000]; see F
ng with steel
nt of 3D Iso
gy developed97. This resustem [JEAGvertical direion system fo
ensional seisffectiveness.IS); the otheplant alread
3D isolation involved iertical isolaof design, lpecimens to
olated system
nal base isolwazaki et al
nal seismic i; see Figure
lows air presl seismic iso
d three-dimeFigure 2.11d.
12
l damper sys
olation Sys
d for the Dulted in the pG 2000]. Hoection. Therefor FBR bega
smic isolatio. One approaer approach dy outfitted
on system wn the develo
ation devicelayout, maino verify the
ms studied in
lation system. 2000]; see
isolation sys2.11b.
ssure springsolator [Nakam
ensional base.
stem for the
stem for D
FBR projecpublication owever, a refore, a largean in 2000 [K
on systems wach was an was a local with a horiz
was establishopment of FB. The dish ntenance, andesign conc
ncluded:
m incorporatiFigure 2.11
stem using a
s with LRBsmura et al. 2
e isolation a
DFBR [Kato
FBR
ct in the horof a design remaining ce-scale projeKato et al. 2
were selecteintegrated th vertical isozontal base
hed by colleBRs. For thesprings wer
nd economycept and val
ing a hydraua.
hydraulic cy
s as an integr2000]; see Fi
ir spring [Ka
et al.
rizontal direguideline fo
challenge wect on design2003].
ed for the Dhree-dimens
olation systemisolation sy
ecting ideas e V+2D SISre thought ty. Both conlidate design
ulic
ylinder
rated igure
ageyama
ection or the
was to ning a
DFBR sional m for ystem
from , dish to be
ncepts n and

13
A three-dimensional seismic isolation device with laminated rubber bearings and rolling seal-type air springs [Suhara et al. 2000]; see Figure 2.11e.
For the DFBR project, extensive testing was conducted. Besides bearing tests, shaking table tests were also carried out to prove the effectiveness of base isolation and to study the behavior of the isolated system. To grasp the ultimate behavior of the seismically isolated DFBR plant under earthquakes at a level beyond the design ground motions and to establish ultimate strength design methods for the seismic isolators, a series of shaking table tests were conducted on a large seismically isolated test specimen using the “E-Defense” shaking table in Japan.
The test specimen consisted of concrete mass blocks and an isolation layer with six lead-plug laminated rubber bearings (LRBs). A superstructure consisting of reinforced concrete (RC) walls and additional concrete and steel plate masses was incorporated in the specimen design. The gross mass of upper structure of the test specimen was about 5.3 MN (1191 kip). The diameter of the 1/3-scale LRBs used was 505 mm (18.9 in.). The test configuration is shown in Figure 2.12, and the original reactor schematic considered in the test is shown in Figure 2.13.
Three behaviors were assumed as the ultimate behavior of the seismic isolation system: (1) loss of response reduction function of isolation system by hardening of rubber; (2) nonlinear response behavior by the cracking of the concrete wall; and (3) braking of the LRB. The test specimen was designed to show the ultimate behavior in the above-mentioned order.

Figu
ure 2.11 S
(a)
(c)
Schematic of
f five propos
14
(e)
ed types of tthree-dimens
(b)
(d)
sional isolation systems
.

Fi
Figu
2.4.4 SB
High-damof base specifica(elastic) post-yielthe total (1000 kippurpose simulatiothe param
(a) Schem
igure 2.12
re 2.13 Os
Shaking TaBearings fo
mping laminisolation s
ations of thesstiffness of d tangent stibuilding wep). A seriesof verifyin
on analyses meters used t
matic of specim
Setup of th
Original desighown in Figu
ble Tests aor the DFB
nated rubber systems forse prototypethe bearing iffness of thight was 0.1
s of shakingng seismic of the shakito characteri
men
he shaking ta
gn of the DFBure 2.12 [Kita
and AnalysR
bearings (Hr the demoe devices weshould be T
he bearing sh1. The designg table tests
safety andng table testize the seism
15
able test for t
BR consideramura 2009].
sis Model w
HDRB) were onstration Dere that the pT1 = 1.0 sec,hould be T2 n axial capacemploying
d adequacy ts were carr
mic isolation
(b)
the DBFR pr
red as the ba.
with High-
also consideDFBR projperiod assoc, the effectiv= 2.0 sec, acity of thesea scaled moof analytic
ried out conssystem [Wa
) Photo of tes
roject [Kitam
asis of the tes
-Damping R
ered as one oect. The s
ciated with tve period asand the yielde devices waodel were ccal methodssidering sevatanabe et al.
t
mura 2009].
st specimen
Rubber
of the three seismic isolthe initial loasociated wit
d strength raas about 4.45conducted fos. Subsequeeral variatio. 2000a; 200
types lation ading th the
atio to 5 MN or the ently,
ons of 00b].

Tcharacterprototypeand protoconsistedconfigurain diamet
Figu
Figu
2.5 F(J
2.5.1 P
The JapaSodium CDevelopmenhancedfor ~2050includes the FaCT
The shaking tristics of the. Similitudeotype. The
d of a three-sation of the ter with a tot
re 2.14 Tb
re 2.15 Sa
FAST REACJSFR)
Project Des
an Atomic ECooled Fast ment projectd safety, and0. It is envisother innova
T reactor.
table test mohe DFBR. Te was followsuperstructustory steel frspecimen Htal rubber th
est specimeearings [Wat
Schematic of l. 2000a].
CTOR CYC
scription
Energy AgenReactor as pt. The plant
d increased rsioned as a sative techno
odel is showThe specimewed so that bure, for whicrame. The ce
HDRB is showhickness equa
n and analystanabe et al.
high-dampin
CLE TECHN
ncy (JAEA) part of the Ft design aimreliability. Csodium-coolelogies; see T
16
wn in Figure en was takeboth accelerach the propenter of gravwn in Figural to 16 mm
sis model for 2000a].
ng rubber be
NOLOGY D
undertook aFast Reactor med to achievCommercialied fast reactTable 2.5 for
2.14. The men to be a ation and str
portions are vity was locare 2.15. The
m (0.63 in.).
r DFBR with
earing used i
DEVELOPM
a conceptuaCycle Techve improvedzation of thi
tor with a por a general s
model repres1/15.3 sca
ress were eqthe same a
ated on the sbearing was
high-dampin
in the test ([W
MENT (FAC
al design stuhnology (FaCd economic is plant conc
ower output summary of
sents the dynale model oqual in the ms for the Dsecond floors 92 mm (3.
ng rubber
Watanabe et
CT) PROJE
udy for the JCT) Research
competitivecept is schedof 1500 MWspecification
namic of the model FBR,
r. The 6 in.)
t
ECT
Japan h and eness, duled
W and ns for

Disolation sensitivit2010]. Fostringent that of thnew advathicker th
Tisolation bearing a
Rea
Bea
Figu
Figu
Due to the thsystem was
ty of the sysollowing theand require
hose consideanced seismihan the previ
The RCB andsystem is i
and energy-d
Table 2.
actor capacit
aring:
re 2.16 F[O
re 2.17 Tre
hin walled ns employed stems, compoe Niigata-keed that seismered in the ic isolation sious ones in
d the seismicinstalled betdissipation d
.5 Gene
ty:
AcT reactor Okamura et a
hick laminateactor facility
nature of mato reduce thonents, and n Chuetsu-o
mic forces acdevelopmensystem was dconjunction
c isolation sytween an up
device are sho
eral summar
1500 MW
Laminated ru
containmenal. 2011].
ted rubber bey [Okamura
17
any componehe seismic fequipment t
oki earthquakcting on critnt of previoudeveloped u
n with oil dam
ystem of JSFpper base mown in Figu
ry of specific
ubber bearings
t building an
earings and et al. 2011].
ents of Japaforces. This to severe groke in 2007, tical componus seismic isusing laminatmpers.
FR are shownmat and a loure 2.17.
cations for th
s
nd seismic is
oil dampers
anese SFR dwas in larg
ound motiondesign crite
nents be redsolation systed rubber b
n in Figure 2ower base m
he FaCT reac
solation syst
used in the
designs, a sege part due tn [Okamura eria became duced to lesstems. As su
bearings that
2.16. The semat. An isol
ctor.
tems
FAcT
ismic to the et al. more
s than uch, a
were
ismic lation

Twas the seismic rFigure 2.
Tthrough tin lieu olaminatiomargin otandem. Tthe vertic
2.6 S(S
2.6.1 P
The Secumodule freactor smodule, thicknesscoolant vft) and isvessel hathick. Th
Figure 2.1
The design sepreliminary resistance, th.18. Vertical
The study shothe thicker lof steel bar ons of the beof safety in dThe natural cal direction
SECURE, TSTAR-LM)
Project Des
ure, Transpofor 300-MWstructure forand a guards of the modvessel, whichs 14 m (45.9as an outsidehe total weig
18 Design
eismic loadidesign seism
he design sel seismic loa
ows that the aminated rudampers im
earings mitigdesign was period of th. The diamet
TRANSPOR
scription
ortable, AutoW steam suppr STAR-LMd vessel. It isdule is assumh is a welded9 ft) high ane diameter o
ght of the rea
n seismic loa
ings of JSFRmic loadingeismic loadids were assu
advanced isubber bearingmproved dagated the verreportedly ie system in ter of the be
RTABLE, A
onomous Reply of using
M includes as shown schmed to be 12d structure ond 5 cm (2 inof 5.85 m (1actor structu
18
ading of FAc
R are showng of the initiing was incrumed two-th
solation systegs with a lon
amping perfortical seismincreased bythe horizontaring was se
AUTONOMO
eactor–Liquig lead-bismua reactor mohematically i2.65 m (41.5f stainless stn.) thick. Th9.2 ft.), is 1
ure without a
cT JSFR [Oka
n in Figure 2ial design streased to be
hirds of the h
em mitigatesnger period;
formance. Mic force, resuy using bearital direction et at 1600 mm
OUS REAC
id Metal (STuth as a heavodule, four in Figure 2.15 ft) and 5.0 teel, has an ohe coolant v14.2 m (46.6and with the
amura et al. 2
2.18. The Retage of SFRe greater thahorizontal se
s the horizon; the adoptio
Moreover, thulting in a loings and viswas 3.4 secm (63 in.).
CTOR-LIQU
TAR-LM) ivy liquid-msteam gene
19. The outscm (2 in.), r
outside diamvessel is con6 ft.) long an
coolant insi
2011].
eference S2 R. To improvan for JSFR
eismic loads.
ntal seismic on of oil damhe thicker ruonger periodscous dampec and 0.125 s
UID METAL
s a small remetal coolanterators, a coside diameterespectively
meter of 5.5 mtained in a gnd 25 mm (ide of the co
wave ve its
R; see
force mpers ubber
d. The ers in sec in
L
eactor . The
oolant er and y. The m (18 guard 1 in.)
oolant

module ageneral s
Tseismicalvertical system an
Reabui
Dim
Deseart
Bea
Bas
2.6.2 T
High-dam2.85 MNbe 0.5 H(10.9 in.)high within.). The shear stra
are about 3.5summary of s
The nuclear lly base-isoldirection. Tnd a three-di
Figu
Table 2.6
actor containlding weight
mension:
sign safe shuthquake (SS
aring type:
se isolation s
Two-Dimen
mping laminN (640 kip) a
z and 21 Hz). The isolath 29 rubber design targe
ain.
56 MN (800specification
island in wlated RCB
Two isolatioimensional s
ure 2.19 S
Genera
nment t:
utdown E)
system:
nsional Iso
nated rubber and the horizz, respectivetors had an olayers alternets for the is
0 kip) and 27ns for the ST
which the rwith an SSn systems wseismic isola
Schematic o
al summary o
27.6 MN (620
Reactor vessThickness 0.
Horizontal: 0
Laminated ru
Both two dim
lation Syst
bearings wezontal isolatly. Design doutside diamnating with 2solators were
19
7.6 MN (620TAR-LM rea
reactor strucSE of 0.3g iwere studieation system
of STAR-LM r
of specificat
00 kip) for who
sel diameter of 05 m (2 in.)
.3g, Vertical: 0
ubber bearings
mensional and t
tem for ST
ere used. Thion frequenc
displacementmeter of 120 28 layers ofe a damping
00 kip), respactor.
cture is conin horizontad: a two-di
m.
reactor [Yoo
tions for the
ole isolated stru
f 5.5 m (18 ft), h
0.2g
s
three dimensio
TAR-LM Re
he vertical decy and the vt in the horizcm (47.2 in
f steel for a tcoefficient
pectively; se
ntained is dal direction imensional
et al. 2002].
STAR-LM re
ucture
height of 16.9 m
onal
eactor
esign load wvertical frequzontal direct
n.) and weretotal height of 12% and
ee Table 2.6
designed to and 0.2g in
seismic isol
eactor.
m (55.4 ft.)
was selected uency were tion was 27. 50 cm (19.of 27.8 cm 300% maxi
for a
be a n the lation
to be set to .8 cm 7 in.) (10.9
imum

20
2.6.3 Three-Dimensional Isolation System for STAR-LM Reactor
A three-dimensional isolator was developed whereby HDRBs were designed to isolate horizontal seismic loadings, working in tandem with independent vertical isolation device that employed a series of disc springs oriented in the vertical direction. The resulting isolator assembly was effective in reducing both vertical and horizontal seismic loadings. The vertical design load and horizontal isolation frequency was 2.85 MN (640 kip) and 0.5 Hz, respectively. These values are the same as that for the two-dimensional isolator case.
When compared with the conventional fixed-base design, the two- and three-dimensional isolation systems reduced the floor accelerations in the horizontal direction by a factor of 4 at the upper basement and a factor of 20 at the bottom of the coolant vessel. Compared to the fixed-base system, the three-dimensional isolation system reduced the floor accelerations in the vertical direction by a factor of 2.4 at the upper base mat, and by a factor of 7.4 at the bottom of the coolant vessel.
The maximum shear displacement for the two- and the three-dimensional systems is calculated as 19.97 cm (7.9 in.), equivalent to 109% shear strain, which is well within the maximum shear failure limit of 300%. The maximum relative displacement in the vertical direction for the three-dimensional isolation system was 4.4 cm (1.7 in.).
2.7 KOREA ADVANCED LIQUID METAL REACTOR (KALIMER)
2.7.1 Project Description
The research and development program on the seismic base isolation system for the KALIMER NPP began in 1993 as a project by the Korean Atomic Energy Research Institute (KAERI) as a national long-term R&D program. The objective of this program is as follows: to enhance the seismic safety, produce an economic design, and standardize plant design through the development of technologies based on seismic base isolation for liquid metal reactors [Yoo. et al. 2000]; see Table 2.7 for a general summary of specifications for the KALIMER project. The original KALIMER design is shown in Figure 2.20. It produces 333 MW per reactor module. Subsequent designs are capable of generating significantly more power.
The design of the seismically isolated RCB of KALIMER is based on a 0.3g SSE. Laminated rubber bearings were proposed for the project. In order to understand the mechanical behavior of the proposed bearings, extensive tests on reduced-scale LRB specimens were performed [Yoo et al. 1995, 1997; Kelly et al. 1997]. Quarter-scale high-damping LRBs and 1/8-scale low-damping LRBs were tested. Several of the bearing specimens are shown in Figure 2.21(a). To investigate the seismic isolation capability and verify the seismic analysis methodology, shaking table tests were carried out with a test model designed to simulate the KALIMER RCB and structures [Yoo et al. 2000]; Figure 2.21(b).
Besides these tests, analysis methodologies using finite element (FE) methods were developed to predict the behavior of the LRB proposed for isolating KALIMER; the analysis results were compared with the test results. Once they were verified, numerical simulation models were then used to analyze the response of the seismic isolated KALIMER structure and critical systems and components.

T(0.15g) adirectionand relatThe respreactor vvertical dto the veof the inp
Rea
Bea
The seismic and SSE (0.3ns. The seismive displace
ponses are revessel liner, sdirection, sigertical structuput motion.
Table 2.7
actor capacit
aring:
Figure 2.20
(a) Test
Figure 2.21
design load3g). Seismic
mic responsesments in the
educed arounsupport barr
gnificant respural frequen
Genera
ty:
KALIMER
LRB specime
Set up of
ds used in ac input motios of reactor se horizontal nd 14 times rel, and coreponse ampli
ncy of 8.1 Hz
al summary o
333 MW
Laminated ru
R reactor mo
n
f the shaking
21
analyses areons were impstructures wdirection: 0.in IHX, nin
e compared tfications occz located in
of specificat
ubber bearings
odule and ste
g table test o
e the operatimposed in botwere reduced
.11g for the ne times in to the non-iscurred in wh the domina
tions for the
s
eam generat
(b) Shaking
of the KALIM
ing basis eath the horizosignificantlyOBE and 0EMP, and esolated casehole structurate excitation
KALIMER re
tor [Hahn et a
table test for
ER [Yoo et a
arthquake (Oontal and vey for acceler.22g for the eight times i. Note that i
re, which wan frequency
eactor.
al 1995].
KALIMER
al. 2000].
OBE) ertical ration SSE.
in the in the as due
band

22
2.7.2 KALIMER-600
In recent years, KAERI has extended the development of KALIMER to include the mid-sized SFR called the KALIMER-600. Its design was intended to satisfy Generation-IV reactor design goals. Its conceptual design was completed in 2007. The main features of the structural design of KALIMER-600 were the seismically isolated RCB [Hahn et al. 2007]. The reactor vessel is 18 m (59 ft) high and 50 mm (2 in.) thick, with an outer diameter of 11.41 m (37.4 ft). The total reactor weight is nearly 24.9 MN (5600 kip). Seismic isolation between the ground and lower base mat in the KALIMER-600 uses 164 seismic isolators that are 1.2 m (47.25 in.) in diameter.
A total of 164 HDRBs are to be installed between ground and the lower base mat in the KALIMER-600 reactor and fuel-handling buildings. The seismic gap between the isolated RCB and the non-isolated wall is about 1.2 m (47 in.), which is sufficient to avoid contact even when the plant is subjected to a beyond-design earthquake with a peak ground acceleration (PGA) of 1.0g [Forni et al. 2012].
2.8 SEISMIC-INITIATED EVENTS RISK MITIGATION IN LEAD-COOLED REACTOR (SILER)
2.8.1 Project Description
SILER is a project partially funded by the European Commission aimed at studying and controlling the risk associated with Generation-IV Heavy Liquid Metal reactors subjected to seismic events and developing adequate protection measures in the event of such shaking. Attention is focused on evaluating the effects of earthquakes on the structures and most critical components, with particular regards to unexpected (beyond-design) events and the identification of mitigation strategies [Forni et al. 2012]; see Table 2.8 for a general summary of specifications for the SILER reactor.
Table 2.8 General summary of specifications for the SILER reactor.
Reactor capacity 600 MW (ELSY)
Reactor containment building weight:
2800 tons for whole isolated structure
Dimension: Reactor vessel diameter of 11.4 m (37.3 ft.), height of 18 m (59 ft.), thickness 0.05 m (2 in.).
Design safe shutdown earthquake (SSE)
Horizontal: 0.3g, Vertical: 0.3g
Bearing type: Laminated rubber bearings

(a) S
T
1
2
T2.24(a)] to be testaim of Preliminaboth ELSwhole nu
Tdirectionisolators been testthe near
Schematic of r
Two types of
. ELSY (EdevelopmFramewortype reacta completbase conf
. MYRRHMYRRHAthe BelgiureplacemeFigure 2.2both isola
Two types oand a LRB [ted in full-sccarefully eary design oSY and MYRuclear island
The seismic nal horizonta
are installedted; see Figu
future. In a
reactor contain
Figur
f reactors we
uropean Leament in Septe
rk Program tor, cooled bte seismic anfigurations.
HA (Multi-PuA is a flexibum Nuclear ent for its ma23. In the fraated and fixe
of isolators a[Figure 2.24cale and realevaluating thof the seismiRRHA using.
gap is to bal displacemd. In additioure 2.25. Addaddition, a
nment buildin
re 2.22 Sc
ere selected f
ad-Cooled Syember 2006. of EURATO
by pure lead,nalysis of EL
urpose Hybrile experimenResearch Ceaterial-testinamework of ed-base cond
are being c4(b)]. The isolistic three-dhe safety mic isolation g FE models
be covered wments and to on, an expanditional testsrestraining
23
g
chematic ima
for this study
ystem): The The ELSY p
OM. The EL see Figure 2
LSY was car
id Research ntal acceleraenter, SCK.Cng reactor, BSILER, a co
ditions will b
onsidered inolators deve
directional dymargins in system mads. In both ca
with a weathavoid infiltrsion joint fos of umbilicamechanism
(b) F
ages of ELSY
y:
European Lproject is sp
LSY referenc2.22. As parrried out for
Reactor for ator-driven sCEN. MYRR
BR2. A sketcomplete seismbe carried ou
n the SILEReloped in theynamic cond
event of de up of HDases, seismic
therproof joitration of waor the pipes al cords are using rubbe
Finite-element
Y.
Lead Fast Reonsored by t
ce design is art of the framboth the iso
High-tech Asystem beingRHA is intench of the planmic analysis
ut.
R project: ae SILER Proditions up tobeyond-desi
DRBs has bec isolation w
int capable ater into thecrossing theexpected toer bumpers
t node
eactor beganthe Sixth a 600 MW p
mework of SIlated and fix
Application)g developed nded as a nt is shown is of MYRRH
a HDRB [Foject are expo failure, witign earthquen complete
was applied t
of absorbine vault where seismic gap be carried oto limit iso
n
pool-ILER, xed-
: at
in HA in
Figure pected th the uakes. ed for to the
ng bi-re the p has out in olator

displacemisolator fsoftens displacem
(a)
(a) Sa
ment was cofrom failure the hamme
ments exceed
Schematic of
ample of high
Figu
onsidered as under larger
ering betwed design valu
reactor conta
Figur
-damping rub
Figure 2.24
ure 2.25 P
shown in Fir-than-expecen the isoues.
ainment buildi
re 2.23 Ge
bber bearing
4 Schema
Pipeline expa
24
igure 2.26. Tcted excitatiolated buildi
ng
eneral layout
atic of bearin
ansion joints
This “soft stoons. It limitsing and th
(b)
t of MYRRHA
(b) Sample
ngs used for
s being teste
op” is intends the isolatorhe foundatio
) Finite-elemen
A.
of lead-rubbe
SILER.
ed for SILER.
ded to protecr deformationon when la
nt node
er bearing
.
ct the n and ateral

2.9 D
Because fast reactmost compiping thresist seiin fast rethe event
WeconomicisolationconsistenCooled investigamost fastanother.
2.9.1 Is
In the deinput, anof the prRCB andplane at tor at mulhorizontadirectionprovide avertical dseveral is
Astudies isapproachhorizonta
DISCUSSIO
fast reactor tor vessels,
mmercial NPhat are well smic loads. actors maket of strong gr
While it maycal and reli. This use ont with the pFast Reacto
ated around tt reactor dev
solation St
esign of anyd the type an
rojects summd a mat founthe base of ltiple levels al direction
ns. Furthermadditional lodirection. Assolation conc
As illustrateds whole-buil
h is versatileal and vertic
Figure 2.
ON OF CRIT
systems opepiping, and
PPs, the highsuited to prHowever, th
e conventionround shakin
y be possibleiable to redf a robust, ppassive appror. Seismic the world fovelopment pr
trategy
y isolation synd mechanic
marized abovndation suppa structure, are not uncoonly, but
more, some iocalized isolas outlined incepts are pos
d in Figure 2lding isolatie as it can pcal direction
.26 Schem
TICAL ISSU
erate at virtuother comp
h pressure ofrovide the sthe thin-wall
nal seismic dng.
e to increaseduce demandpassive technroach to im
isolation tor buildings,rograms hav
ystem, the local characterve place theported on thand cases wommon. Somsome prov
isolate the cation of sele
n studies of tssible.
2.27, the moon, i.e., the
provide isolans. In the fo
25
matic of bum
UES
ually atmosponents tend
f the system trength, stiffcomponent
design approa
e the seismicds through nology to im
mproving thetechnology , bridges, anve considere
ocation of thristics of the
e isolators behe ground. I
where the isome isolationide isolatiocomplete st
ected regionsthe very earl
ost commonisolation sy
ation in the former case,
mper mechan
pheric pressuto be very tresults in thfness, and bs and pipingaches for tra
c capacity ofthe approp
mprove the se operating s
has been nd industrialed using one
he isolators,e isolation syetween a baIt is not necolation planen designs proon in both tructure in ts of the buildliest DFBR
nly used straystem is set horizontal d the isolato
nism.
ure at high tthin-walled
hick-wall prebuckling resig and the headitional NP
f the systempriate applicseismic safesafety of a extensively
l structures. e form of sei
, the directioystem must base mat suppcessary to ple is providedovide seismithe horizon
the horizontding or of coproject [Shi
ategy in prevunder the w
direction onors might eit
temperatureand flexible
essure vesselistance needeavy coolantPPs insufficie
m, it may be cation of seety of the plaGen-IV Sod
researchedAs noted ea
ismic isolati
on of the sebe selected. porting the wlace the isold above this ic isolation intal and vetal directionomponents iiojiri et al. 1
vious fast rewhole RCB.nly or in botther transmi
s, the e. For ls and ded to t used ent in
more ismic ant is dium-d and arlier, on or
ismic Most
whole lation level
in the ertical n, but in the 989],
eactor This th the it the

vertical cexcitationreactor. Vlarge vermotions carefullyso that thproviding
Aparticular2.28 whestudies fhowever,
Inthe isolatthe bearinthe case oloads duecan be acmass. Nolimit to cords, etc
Arelative dbetween isolated pumbilicavalidated
components ns. This maVertical isolrtical and roat the top o
y selecting thhe isolation g a mechanic
Another isolarly sensitiveere the reactfor the PRIS, the internal
n the case shtion plane. Sngs supportiof the wholee to vertical chieved by loote that morethis approacc.
Any of the adisplacementhe reactor
portions of tl cords to
d.
Figure 2
unreduced ay be a problation may socking motiof the structhe vertical st
plane is loccal or hydrau
ation concepe to horizonttor vessel is SM and STAl primary co
hown in FigSince the reaing the vessee-building is
input motioocating the be than one loch due the i
approaches nt inside thevessel and g
the plant. Spaccommoda
2.27 Differ
to the superblem for masolve some ions. The roture. Zhou etiffness of thcated near tulic anti-roc
pt is to isolatal and/or veisolated at
AR-LM planmponent is.
ure 2.28, theactor vessel iel in this conolation sche
ons and rockbearing planocal part of tincreasing c
using locale building dgenerators, pecial deviceate these rel
rent building
26
rstructure, orany critical of these proocking moti
et al. [2013]he bearings, he center-ofking mechan
ate the speciertical vibraits top. Thisnts. In this
e center-of-mis a very heanfiguration wematic. This king responsne near the elthe plant cou
costs of prov
ized compodue to the reor other umes or expanslative move
g isolation st
r actually amcomponentsoblems, but ion can am sought to mmodifying t
f-mass of thnism.
ific componeations. This as is the samconfiguratio
mass of the avy componwill likely hahelps the bee. Further relevation of tuld be isolatviding mult
onent or regelative mov
mbilical connsion joints foements may
trategies [Sh
mplify the es and system
the system mplify long-p
mitigate rocthe configurhe supported
ents inside tapproach is
me approach on, the RCB
vessel is signent within thave higher aearings resisteductions inthe reactor vted. There mtiple seismic
gion isolatiovement of thnecting the ior the piping
need to be
hiojiri et al. 19
effects of vems used in a
is susceptibperiod horizcking motionation of the
d structure, o
the RCB thashown in Fused in the
B is not isol
gnificantly bhe whole syxial loads tht possible ten
n rocking movessel’s centemay be a prac gaps, umb
on should ehe piping syisolated and g system or e developed
989].
ertical a fast ble to zontal ns by plant or by
at are Figure
prior lated;
below ystem, han in nsion
otions er-of-ctical
bilical
xpect ystem
non-other
d and

Awhole buvertical dhorizontalimited ebe provineeded.
Fspecific cof isolatideterminis isolatesystems.
Fvertical strategy strategy s
Figure 2
Figu
Another possuilding in hodirection; seal and verticeffectivenessded for tho
or the horizcomponents ion, the bette
ned and inveed, the relatDetailed inv
or the vertiisolators prand will be should be ba
.28 Prima
ure 2.29 C
sibility is to orizontal diree Figure 2.al isolation i
s in reducingse special c
zontal directiprovide sim
er seismic restigated if thtive displacvestigation o
cal directionoperties. Sediscussed i
ased on the l
ary compone
Combined is
combine threction and 29. A speciin a single pg the rockingcomponents
ion, the isolmilar responsesponse. Thhe whole RCement must
of methods fo
n, it is geneeparating thein more detaayout of the
27
ent isolation
olation strat
e two strateprovide iso
ial applicatioplane, but to g response. where extra
lation for thse reductione rocking re
CB is isolatet be accomm
for accommo
erally difficue horizontalail below. Uplant and th
strategy [Sh
tegy [Shiojiri
egies. A typiolation for thon of this cdesign the vSupplementa protection
he whole RCn effects; essesponse of thed. In the camodated by
odating the d
ult to obtainl and vertic
Ultimately, the specific re
hiojiri et al. 1
i et al. 1989].
ical examplehe internal econcept wouvertical isolatal vertical in in the ver
CB and localsentially, thehe whole rea
ase where they deformatiodisplacement
n the optimacal isolationthe selectionequirements
989].
e is to isolatequipment iuld be to proation to havesolation can
rtical directi
lized isolatioe wider the ractor needs e primary syon of the pt is needed.
al horizontan is a promn of the isol
of the proje
te the in the ovide
e only n then ion is
on of range to be
ystem piping
al and mising lation ect.

2.9.2 V
Vertical approach
Aisolation a device loads due2.30, coisprings oor other s
Vertical Iso
isolation wahes:
Localstructushakin
Using
As shown in as a supplemto lower th
e to gravity, il springs weor air springssupplementa
Fig
Figure 2.31
lation
as considered
ly adding veure, which ang.
g a complete
Figure 2.30ment to the
he vertical nvertical exc
ere selecteds have been al viscous da
gure 2.30
Schemat
d in most of
ertical isolatiare already g
three-dimen
0, Shojiri ethorizontal is
natural frequcitations, andd as the vert
used. Such sampers to pro
Localized ve
tic of one of
28
f the projects
ion systems lobally isola
nsional seism
t al. [1989] solation syst
uency and dad overturningical load-besprings are govide dampi
ertical isolati
the propose
s reviewed a
for individuated against h
mic isolation
studied imptem. Localizamp vibratiog forces. For
earing devicegenerally suping in the ve
ion [Shiojiri
ed 3D isolatio
above. There
ual componenhorizontal g
n solution.
plementing lzed vertical ions, as wellr the projecte. In other cpplemented
ertical directi
et al. 1989].
on system fo
e are two ge
nts of the ground
localized veisolation reql as bear vet shown in Fcases, metalwith oil dam
ion of vibrat
or DFBR.
eneral
ertical quires ertical Figure l disk mpers tion.

29
Most fast reactor projects that consider vertical isolation use devices capable of providing three-dimensional isolation. Several approaches are available to incorporate the vertical isolation as part of a larger, comprehensive isolation assembly. One approach has been called partial three-dimensional approach as it is achieved by reducing the vertical stiffness of the original horizontal isolation system. This is most easily and commonly achieved using laminated elastomeric bearings. This was done for the SFAR project, which used LSF rubber bearings whereby thicker rubber layers are laminated to fewer steel shims. As a result, the bearings are more flexible vertically as well as horizontally [Tajirian et al. 1990]; bearings can be manufactured with a vertical design frequency of 3 Hz.
A number of studies have been carried out in Japan where the overall bearing subassembly incorporates a separate horizontal and vertical isolation mechanism. This approach was followed for Phase 2 of the DFBR project. Laminated rubber bearings that provide horizontal isolation for the superstructure are each supported on vertically oriented metallic, hydraulic or air springs (combined with vertical viscous dampers). Shown in Figure 2.31, this approach can provide isolation in both the horizontal and vertical direction. As pointed out earlier, however, the use of three-dimensional isolation system has the potential to introduce an additional rocking movement to the superstructure. Therefore, a detailed investigation is needed when considering a three-dimensional isolation system, and supplemental dampers and other mechanisms may be needed to suppress the rocking motion introduced. These mechanisms may reduce the effectiveness of the horizontal isolation and increase costs.
2.9.3 Seismic Gap Size and Hard or Soft Stops
Designers of isolation systems are required to provide a seismic gap to accommodate the relative displacements of the isolators; however, the size of the seismic gap is not well established. As noted previously, the U.S. NRC is developing guidelines that suggest that a NPP should have more than a 90% confidence of not exceeding the deformation capacity of the isolation system or contacting a hard stop for a large beyond-design-basis event. This can result in the need for a very large isolator capacity. In previous studies, the base isolation system has been sized for the design-level SSE. When analyzing the safety evaluation of the whole system, the margin of safety in beyond-design-level earthquakes requires providing both a reasonable seismic gap size and a suitable “stopping” mechanism.
Usually, the seismic gap size is selected according to the displacements expected at the design event plus some margin of safety. However, if a larger than expected event occurs, the resulting displacements may be larger than the size of the seismic gap. In such a case, contact between the lower mat of the RCB and the surrounding moat wall may induce large impact loads at the base of the isolated structure. This impact will propagate large forces and accelerations up the RCB.
The draft U.S. NRC guidelines for seismic isolated NPPs [Kammerer et al. 2012] require a hard stop; many researchers are exploring mechanisms to soften this stop to avoid intense impact loads. A solution to this critical problem is still under development. For the reviewed SILER project, a rubber bumper stopping mechanism was developed in order to absorb the impact energy. In other cases, the deformation hardening characteristics of recrystallizing rubber

30
bearings, HDRBs, and some types of friction bearings are being explored as a soft-stop mechanism.
Several investigations, including the E-Defense tests that were undertaken for the DFBR project in Japan, have examined approaches that exploit the behavior of the bearings themselves. However, the amount of energy absorbed by these soft-stop mechanisms may not be enough to limit the displacements and avoid the hard stop; additionally, the forces developed by the bearings may be large enough to still transmit unacceptably large forces and accelerations to critical structures, systems and components (SSCs). Therefore, to ensure an appropriate safety margin, seismic gap sizes need to be determined according to detailed analysis on the ultimate behavior of the isolation system.

31
3 PARAMETRIC STUDY OF A SEISMICALLY ISOLATED RIGID MASS
3.1 INTRODUCTION
Before investigating multi-degree-of-freedom analysis models, a parametric study was conducted using a simplified analysis model to generate nonlinear response spectra of the isolated NPP superstructure. This study assumed that the NPP superstructure consists of a rigid mass block with one isolator element representing all isolators in the isolation layer. Key design parameters of the isolator were studied through bi-directional response history analysis. The purpose of this simplified parametric study was to obtain a general sense of how the response of the isolated PGSFR will be affected by isolator properties. Furthermore, the parametric study illustrates how changing a design parameter of the isolation system influences the seismic response of the NPP and also provides guidance on isolation parameters that lead to improved response.
3.2 ANALYSIS MODEL
In this phase of the study, a rigid mass representing the reactor facility and one isolator bearing representing the whole isolation system, which can capture the bi-directional behavior, are defined. Initial isolator parameters were chosen to best capture the dynamic characteristics of the original isolation system as provided by KEPCO E&C. The MATLAB programming language for technical computing was used for modeling and numerical analysis.
3.2.1 Reactor Containment building Model
The RCB was simplified as a rigid mass with a total weight of 152,000 tonf (335,000 kip). Since the RCB is typically very stiff in both horizontal directions as well as in the vertical direction, it is reasonable to assume for the purposes of this preliminary study that it is a perfectly rigid mass block. No supplemental viscous damping was introduced, so the damping of the whole system was provided by the hysteretic behavior of the isolator only, which is an ideal case for a base-isolated structure. The two components of the simulation model are shown in Figure 3.1.

3.2.2 Is
The typemodel wcomparedappropriathe two bparametethe beariratio α. Fsharp as corners, values prmoves ina circulahorizontarigid mas
Figu
solator Mo
e of isolator were used tod. Bi-directiate ground-mbearing moders: Qd, whicing, the initiFor the Boucompared t
the Bouc–Wroduce more
n both horizoar yield sual coupling—ss parametric
re 3.2 Ha
Figure 3.1
del
considered o model theional numerimotion sets, dels are shoch is the chaial stiffness
uc–Wen modto the biline
Wen model ue rounded contal directiourface under—neither in c study.
(a)
Hysteresis loonalysis: (a) b
Simplifie
in these anae LRB, andical responsewhich are dwn in Figur
aracteristic sK0, and the
del, the cornear model. Tutilizes an adcorners and ons simultanr two-compterms of for
ops of the twbilinear isola
32
d rigid-mass
alyses was ad results froe-history an
described in re 3.2. The btrength or ap
e post-yield ners of the hTo characterdditional parlarger value
neously and ponent earthrce or kinem
wo bearing mator model an
s model for a
a LRB. Bothom the two nalyses were
the next secbilinear mod
approximatelstiffness αK
hysteresis lorize the sharrameter η (ηes produce scaptures the
hquake inpumatic coupli
models used nd (b) Bouc–
analysis.
h a bilinear amodeling conducted u
ction. The hydel is charaly the appareK0 or the pooop were rorpness of thη = 0.5 to 20sharper corne bi-directionut conditioning—were c
(b)
in the rigid m–Wen isolato
and a Bouc–approaches using disperysteresis loo
acterized by ent yield forost-yield stifounded instee hysteresis 0), where smners. The benal behaviorns. No vertconsidered in
mass or model.
–Wen were
rsion-ops of
three rce of ffness ad of loop
maller earing r with tical–n this

33
3.3 GROUND-MOTION SELECTION FOR ANALYSIS
To assess the performance of a seismically isolated NPP, it is important to select appropriate input ground acceleration histories in order to obtain unbiased estimates of the structural response of the isolation system and the plant superstructure. To perform the parameter studies described herein, ground-motion ensembles with a fairly large number of records were used. Such ground-motion ensembles are essential in performing meaningful studies of the behavior of seismically isolated NPPs and to develop a better understanding of the effect of seismic isolation on plant performance.
Regulatory Guidelines issued by the U.S. Nuclear Regulatory Commission (NRC) [NRC 2014] and European Utility Requirements (EUR) [EU 2012] were used to define target response spectra in the horizontal and vertical directions. Based on these target spectra, six different ground-motion sets were developed previously for a study on seismic isolation technology applied to the APR 1400 NPP, which PEER conducted for KEPCO E&C. For this previous study, PEER generated dispersion-appropriate, single-damping spectral-matched and multi-damping spectral-matched ground-motions sets for both the NRC and the EUR target response spectra scaled to a PGA of 0.5g.
No specific construction sites were given for this preliminary study, and the properties of the seismic isolation systems vary widely; therefore, to investigate their effectiveness in the application to PGSFR power plants, unconditional (structure- and site-independent) ground-motion records need to be utilized. Furthermore, in light of the USNRC draft NUREG on Technical Considerations for Seismic Isolation of Nuclear Facilities [Kammerer et al. 2013], which requires the assessment of probabilistic performance measures and confidence levels, it is essential to correctly characterize the dispersion of the ground motions and the dispersion of the caused structural response for design as well as beyond-design-level shaking intensities. Hence, this work used two of the earlier developed ground-motion sets, namely, the dispersion-appropriate sets based on the NRC and EUR target spectra. Both of these sets consist of 20 three-component ground motions; their development is described in detail in Schellenberg et al. [2014].
For this study, the design-level target spectra for the isolated NPP is set at a PGA of 0.3g, and the design-level target spectra for the fixed-base NPP is set at a PGA of 0.1g. It was therefore necessary to amplitude scale the ground motions from the previous study by 0.6 for the isolated plant analyses and by 0.2 for the fixed-base plant analyses. In addition, the high-frequency enrichment, which is added to the USNRC RG1.60 target spectrum, was left unmodified at 50 Hz instead of reducing it to 40 Hz, so that the NRC ground-motion set did not have to be regenerated but could simply be scaled to the required PGA levels.
The individual and mean pseudo-acceleration spectra and displacement spectra for the USNRC RG1.60 set of 20 dispersion-appropriate records scaled to a PGA of 0.3g are plotted in Figure 3.3 and Figure 3.4. The individual and mean pseudo-acceleration spectra and displacement spectra for the EUR 2.4.6 set of 20 dispersion-appropriate records scaled to a PGA of 0.3g are shown in Figure 3.5 and Figure 3.6. For the targeted effective isolation period of 2 sec, the expected mean isolator displacement demand from the EUR motion set is around 7.6 cm (3 in.) and around 25.4 cm (10 in.) for the NRC motion set, which is a factor of 3.3 larger than the demands produced by the EUR-motion set.

34
Figure 3.3 Horizontal (top) and vertical (bottom) pseudo acceleration response spectra for the set of 20 dispersion-appropriate motions selected to match the 5% damped USNRC RG1.60 target spectrum with a PGA = 0.3g in an average sense over the frequency range from 0.25 Hz–20 Hz.
Pse
ud
o A
ccel
erat
ion
[g
]P
seu
do
Acc
eler
atio
n [
g]

35
Figure 3.4 Horizontal (top) and vertical (bottom) displacement response spectra for the set of 20 dispersion-appropriate motions selected to match the 5% damped USNRC RG1.60 target spectrum with a PGA = 0.3g in an average sense over the frequency range from 0.25 Hz–20 Hz.
Dis
pla
cem
ent
[in
.]D
isp
lace
men
t [i
n.]

36
Figure 3.5 Horizontal (top) and vertical (bottom) pseudo acceleration response spectra for the set of 20 dispersion-appropriate motions selected to match the 5% damped EUR 2.4.6 target spectrum with a PGA = 0.3g in an average sense over the frequency range from 0.25 Hz–20 Hz.
Pse
ud
o A
ccel
erat
ion
[g
]P
seu
do
Acc
eler
atio
n [
g]

37
Figure 3.6 Horizontal (top) and vertical (bottom) displacement response spectra for the set of 20 dispersion-appropriate motions selected to match the 5% damped EUR 2.4.6 target spectrum with a PGA = 0.3g in an average sense over the frequency range from 0.25 Hz–20 Hz.
Dis
pla
cem
ent
[in
.]D
isp
lace
men
t [i
n.]

38
3.4 SUMMARY OF PARAMETERS CONSIDERED
The parametric study aims to look at the effect of the key bearing design parameters on the response of the isolated structure. Different combinations of parameter values were studied, and general trends were assessed based on the numerical analysis results. For each of the analysis cases with a certain combination of parameters values, the isolation post-yield period was set from 0.001 sec to 6 sec—corresponding to the horizontal axis in the nonlinear spectra plots—and peak responses were recorded for each of the period values. The wide range of periods investigated helped generate useful nonlinear response spectra. Details on each of the cases or parameter combinations are shown in Table 3.1.
Table 3.1 Summary of individual cases considered in the rigid mass parametric study and parameter values used for each case.
Bearing model
Qd/W Post-yield
stiffness ratio η Post-yield
period
Bouc–Wen vs. bilinear Bouc-Wen 10% 1% 1.0
0.001 to 6
Bilinear 10% 1% NA
Different Qd
Bilinear 5% 1% NA
Bilinear 7.5% 1% NA
Bilinear 10% 1% NA
Bilinear 12% 1% NA
Different K0
Bilinear 7.5% 0.1% NA
Bilinear 7.5% 1% NA
Bilinear 7.5% 5% NA
Bilinear 7.5% 10% NA
3.4.1 Comparison of Bouc–Wen and Bilinear Models
First, the bilinear model and the rounded Bouc–Wen model are compared. The purpose of this preliminary comparison is to investigate the effect on the response due to the roundness of the analytical hysteresis loops. The comparison can also be interpreted as a comparison of a LRB and a single friction-pendulum bearing since the latter gives exact bilinear behavior, while the former will bring rounded hysteretic behavior. To compare the two models, the characteristic force, Qd, was kept at 10%, and the post-yield ratio was kept at 1%. Different isolation periods in terms of post-yield period from 0.001 to 6 sec were considered, and comparisons were made based on the peak response for each of the two bearing models.
3.4.2 Different Bearing Characteristic Strength, Qd
An important design parameter is the characteristic strength of the bearing. Since the initial stiffness is always large, the yielding force of the bearing is almost the same as Qd. Therefore, the study can also be considered as a parametric study on yielding force, which indicates the threshold needed to begin the movement of the isolation system. In this parameter analysis, Qd of

39
5% W, 7% W, 10% W, and 12% W were considered and compared, where W indicates the total gravity force compressing the bearing. Although, the vertical force will change due to vertical ground motion and rocking response during the time-history analysis, the assumption was made that it remains constant for the simplified model investigated here. For this comparison, the post-yield stiffness ratio was kept at 1%. For each value of Qd, different isolation periods were considered from 0.001–6 sec.
3.4.3 Different Initial Stiffness K0
The comparison for this part of the study aims to investigate the effect of the initial stiffness of the isolation system on the response. The design-level seismic event of 0.3g PGA for NPPs means that the movement of the isolation system is relatively small, and large numbers of cycles occur within the elastic range of the bearing. Therefore, the initial stiffness of the bearing is an important parameter. To construct the nonlinear response spectra, for each case the study investigated the response of the system through a wide range of isolation periods (0.001–6 sec); therefore, this part of the analysis used the post-yield stiffness ratio, α, to represent the initial stiffness. For the same isolation period that results in the same post-yield stiffness, different α values ranging from 0.1%–10% were investigated to represent equivalently different initial stiffnesses.
3.5 ANALYSIS RESULTS AND DISCUSSION
The responses considered in this parametric study are isolator displacement and rigid mass total acceleration. Since the model contains a perfectly rigid mass on top of an isolator element, the total acceleration times the mass is equal to the shear force in the isolator. Therefore, the response of the total acceleration can be interpreted as approximately the total base shear the isolated reactor will experience. Peak response in each parametric study case is plotted against a wide range of isolation post-yield periods to generate the nonlinear response spectra for all 20 ground motions used in these analyses. Median as well as 84th-percentile responses (one standard deviation above median) are presented. Since each time-history analysis is a bi-directional analysis, the peak response was taken as the norm of the values of the two directions.
3.5.1 Response Values Determined by Bouc–Wen and Bilinear Models
Results are compared first in terms of the peak isolator displacement; see Figure 3.7. The nonlinear bearing displacement spectrum of the median response under the NRC and EUR motion sets were plotted together with the 84th-percentile response spectrum. Results show that the total displacement demand of the isolator is around 15.24 cm (6 in.) for the NRC motion set if using the isolator post-yield period of 2.1 sec, which is the targeted isolation period used in the seismic isolation design of many fast breeder reactors from previous projects. The 84th-percentile demand is around 0.25 m (10 in.) under the NRC motion set, which is approximately 1.5 times the median response. Considering the dispersion of earthquake loading and uncertainty of ground motion, 1.5 seems a reasonable number to move from median response to one standard deviation above.

Figu
Inthat a larsince theHoweverthe isolatperiod beisolator. periods.
Aplots by
re 3.7 Mhpa
n comparingrger isolatione lower postr, the isolatotion period beyond aboutFrom the pl
A comparisonthe solid lin
Median and 8azard. Respolotted togethre marked in
g the responn period willt-yield stiffn
or displacembecause of tt 4 sec doesot, the slope
n of the bilinne and the d
4th-percentileonse values her for compn the plot.
nse for differl result in larness will ha
ment demand the relative not make m
e of the displ
near model adashed line, r
40
e isolator disusing biline
parison. Valu
rent periodsrger bearing
ave less condoes not in
small grounmuch differelacement spe
and the Boucrespectively
splacement sear and Boucues at the iso
s along the hg displacemenstraint on tncrease expond-motion inence on the ectrum tend
c–Wen mody, demonstra
spectra undec–Wen modeolator period
horizontal axent demandsthe displacemonentially wintensity. Incr
displacemends to decreas
del, which arates that the
er the NRC ls are of 2.1 sec
xis, it is obv. This is intument of beaith an increarease of isolnt demand oe with incre
re indicated idifference o
vious uitive aring. ase of lation of the easing
in the of the

response to the inisomewhaflexible.
Tset scaleddesign. Halso inve
Figu
is negligiblitial assumptat larger dif
The responsed to 0.3g PG
However, anestigated, and
re 3.8 Mhpa
e in terms otion of a rig
fference in r
es shown in GA indicate nother commd the isolator
Median and 8azard. Respolotted togethre marked in
f peak displgid superstruresponse wh
Figure 3.7, the anticipa
monly used gr displaceme
4th-percentileonse values her for compn the plot.
41
acement respucture. The twhen the supe
for the NRated responsround-motioent response
e isolator disusing biline
parison. Valu
ponse. The mtwo bearing erstructure a
RC dispersionse under the on target spee is shown in
splacement sear and Boucues at the iso
minor differmodels are
above the iso
n-appropriatSSE level c
ectrum, the En Figure 3.8.
spectra undec–Wen modeolator period
rence may bexpected to olation syste
te ground-mconsidered iEUR hazard
er the EUR ls are of 2.1 sec
e due have
em is
motion in the
d, was

Figu
Cisolation compared0.3g PGANRC hazspectra hspectrum
re 3.9 Mthase
Comparing thperiod of 2
d to 15.24 cmA. The 84th-pzard resultedhave the sa
m has much
Median and 8he NRC hazare plotted toec are marke
he response 2.1 sec, the m (6 in.) undpercentile red in around 2ame PGA, t
higher valu
4th-percentileard. Responsgether for coed in the plot
amplitude inmedian respder NRC mo
esponse unde254 mm (10their frequeues compare
42
e isolated mse values usiomparison. Vt.
n Figure 3.8 ponse underotion, althouer EUR haza0 in.). As poncy content
ed to the EU
ass total accing bilinear aValues at the
and Figure r EUR motiugh the targeard is aroundinted out eats are very UR target, e
celeration spand Bouc–We isolator per
3.7 for the sion is arounet spectra wed 35.6 mm (1arlier, althou
different. Tespecially in
pectra under Wen models
riod of 2.1
same systemnd 25 mm (ere both scal1.4 in.), whil
ugh the two tThe NRC t
n the long-p
r
m with 1 in.) led to le the target target
period

range relsubseque
Facceleratsystem wincrease from 2 toby 30%. responseresponseforce redmass and3.9, it is isolation 2.1-sec p
Figu
3.5.2 C
Characteindicatesare compcomparisbearing mparametr
levant to theent studies w
rom results tion or 0.2 Wwith a 2.1-seof the isolat
o 4 sec will rThe differen. The 84th-p; the ratio is
duction ratiod the peak gr
easy to conperiod incre
post-yield pe
re 3.10 MRtom
Comparison
ristic streng the thresho
pared with Qson in Sectiomodel or a Bric study in t
e isolation swill all be car
shown in W base shearec post-yieldion period wreduce the fonce betweenpercentile fo consistent w, which is d
round accelenclude that teases. The friod when co
Median force Response valogether for c
marked in the
n of Respo
gth is an imold needed fQd equal to 5on 3.5.1 shoBouc–Wen bthis section w
system. Becrried out with
Figure 3.9 r is expectedd period und
will reduce thorce demand
n the bearingorce demanwith the scaldefined as theration, is shothe effectiveforce reductiompared to t
(total accelelues using b
comparison. e plot.
onses for D
mportant parfor initiation%, 7.5%, 10
owed there ibearing modwill use the
43
ause of the h the NRC h
of the peakd in the isolader the NRChe force demd by 50% bu models is nd is aroundle obtained i
he ratio betwown in Figu
eness of the ion factor is the fixed-ba
eration) reduilinear and BValues at the
Different Q
rameter in t of post yie0%, and 12%is almost no
del in this simperfect bilin
large differhazard only.
k total accelated RCB whC hazard wi
mand. The inut only increanegligible wid 0.3g, whicin the isolato
ween the totaure 3.10. Der
isolation sy around 2.5
ase case.
ction ratio uBouc–Wen me isolator pe
Qd
the design ld movemen
% of the weio difference mplified rignear bearing
rence in resp
leration resphen using a ith 0.3g PGA
ncrease of thease the displith respect toch is 1.5 tior displacemal acceleratiorived from thystem will in
for an isola
under the NRmodels are pleriod of 2.1 s
of isolationnt of the isoight on the bin response
id mass caseg model. Bec
ponse ampli
ponse, 0.2g seismic isolA. An addite isolation placement demo the accelerimes the m
ment demandon in the isohe trend in Fncrease wheation system
RC hazard. otted
sec are
n systems, wolator. Four bearing. Since using a bile, the subseqcause of the
itude,
total lation tional
period mand ration edian
d. The olated Figure en the
m with
which cases
ce the linear quent large

initial stiof Qd can
Fmedian aperiod is period beground-m
Figu
ffness, Qd ann also be inte
irst, peak beand 84th-perc
pronouncedeyond arounmotion excita
re 3.11 Mh7at
nd Fy valueserpreted as th
earing displacentile level d in this plotnd 3 sec becaation.
Median and 8azard. Respo.5% W, 10% t the isolator
s are nearly the yield forc
acement respresponses. T
t, but the depause of the s
4th-percentileonse values W, and 12% r period of 2.
44
the same force of the bea
ponse was inThe dependependence desmall displac
e isolator disusing a bilinW) are plotte.1 sec are ma
r the bilineararing.
nvestigated aence of isola
ecreases withcement of th
splacement snear model wed together farked in the
r model. The
as shown in ator displaceh the increashe isolator u
spectra undewith differentfor comparisplot.
erefore, the v
Figure 3.11ement on isose of the isolunder this lev
er the NRC t Qd (5% W, son. Values
value
with olator lation vel of

Tnoticeabldisplacemyield forc2.1-sec ison Qd is effective defined b
TresponseW–12% have littldisplacemstiffness.effect is Since for“force deComparinaccount f
Tmass; thiaround 3isolation
Figu
The dependenle as indicatment demandce, the displsolation perisimilar. Sinperiod of th
based on the
The peak tots on differenW, represenle deviation ment demand Therefore, reversed at rce and totaemand” is usng the medifor the scatte
The force redis factor is s
3 sec, a largsystem is la
re 3.12 MuW2
nce of the rted by diffed. Comparinlacement demiod. With th
nce larger isohe system casecant stiffn
tal acceleratint Qd is not
nt a wide ranas observed
ds imposed balthough Qd
larger isolatal acceleratiosed subsequian and 84th-er of the resp
duction factoshown in Figer Qd will p
arger, the larg
Median effectsing a biline
W) are plotted.1 sec are ma
response on rent lines in
ng between amand drops he increase oolator displaan be obtainness from the
ion responseas significa
nge of practd in the figuby a small Qd is smaller, tor periods won are equivuently in this-percentile reponses due to
or was comgure 3.14. Fproduce a lager Qd has a
tive period spear model witd together foarked in the
45
yield forcen Figure 3.1a Qd of 5% Wfrom around
of the isolatiacements resned as showne origin.
e is shown ant as might tical values, ure. InterestinQd produce la
the total horwhere the lo
valent in thes section to responses, a o the uncerta
mputed by coFrom this ploarger force rea smaller forc
pectra underth different Q
or comparisoplot.
e Fy or chara11. Larger QW and 10% d 0.20 m (8.ion period, tsult with difn in Figure
in Figure 3be expectedbut the resu
ngly, for lowarger force drizontal sheaower Qd proe simplified represent thefactor of 1.5ainty in the i
omparing theot, it can beeduction facce reduction
r the NRC haQd (5% W, 7.5on. Values at
acteristic strQd results inW, which is 2 in.) to 0.1
the dependenfferences in 3.12. The e
3.13. The ded. The paramulting accelew isolator pdemands duear force migoduces lowerigid mass
e total accel5 is still a reinput excitat
ese results we seen that bctor. When t
n factor than
azard. Respo5% W, 10% Wt the isolator
rength Qd isn smaller iso
around twic3 m (5 in.) ance of the reQd, the resuffective peri
ependence ometer valueseration respoeriods, the l
e to the post-ght be largerr force demsystem, the
leration respeasonable ration.
with a fixedbelow a perithe period oa lower Qd.
onse values W, and 12%
period of
s also olator ce the at the esults ulting iod is
of the s, 5% onses larger -yield r. The
mands. term
ponse. atio to
d-base od of
of the

Aisolator dA larger even if talready displacem
Figu
As demonstradesign. This Qd may pro
the effect isexceed the
ment demand
re 3.13 Mth(5V
ated above, balance is a
oduce smalles not predom
design ford is shown in
Median and 8he NRC haza5% W, 7.5% W
Values at the
a force and achieved throer displacemminant. Howrce limit. Tn Figure 3.1
4th-percentileard. ResponsW, 10% W, anisolator peri
46
displacemenough design
ment demandwever, if Qd
The relation5 to better u
e isolated mse values usind 12% W) aiod of 2.1 sec
nt tradeoff mn parameters ds, but it mayd is too largn between understand th
ass total accing a bilinear
are plotted toc are marked
must be balalike isolatio
y bring largege, the desig
force demahe relationsh
celeration spr model with
ogether for cd in the plot.
anced in termon period aner force demgn objectiveand and behip.
pectra under h different Qd
omparison.
ms of nd Qd. mands may
earing
r d

Figu
Figu
Widentifyinparameteidentifiedrepresent
re 3.14 Mth(5V
re 3.15 Fh7
When considng appropriaers is visuald to determts Qd = 264
Median force he NRC haza5% W, 7.5% W
Values at the
orce (acceleazard. Respo.5% W, 10%
dering the fate design pally apparent
mine if they 4 152 kip
(acceleratioard. ResponsW, 10% W, anisolator peri
eration) versuonse values W, and 12%
force demanarameters sut. Subsequen
are withins in Figure
47
n) reductionse values usind 12% W) aiod of 2.1 sec
us bearing dusing a bilinW) are plotte
nd for desiuch as isolatntly, the be
n an accepta3.15 will n
ratio using ing a bilinear
are plotted toc are marked
isplacementnear model wed together f
ign purposetor period anearing displaable range. never reach
isolation sysr model with
ogether for cd in the plot.
t relation undwith differentfor comparis
s, Figure 3nd Qd. The inacement dem
For exampthe force le
stem under h different Qd
omparison.
der the NRC t Qd (5% W, son.
3.15 is usefnfluence of mands are eple, the lineevel below
d
ful in these
easily e that 0.1g.

48
Alternatively, the line for an isolator period of 2.0 sec indicates that a force demand of 0.2g is anticipated for any Qd value selected, but the selected Qd will significantly influence the bearing displacement demand.
3.5.3 Comparison of Responses for Different K0
The parameter used to study the initial isolator stiffness was the post-yield stiffness ratio, α. This ratio can capture the intended parameter since at the same post-yield stiffness or isolation period, different post-yield ratios produce different initial stiffness. Four values were considered in this comparison study: 0.1%, 1%, 5% and 10%. For each post-yield stiffness ratio, Qd was kept constant at 7.5% of the weight on the bearing.
The displacement spectra are shown in Figure 3.16. The amplitude of the peak displacement demand is the same as the results presented in Section 3.5.2. A 2.1-sec isolation period results in a median displacement demand around 15.24 cm (6 in.), and the 84th-percentile demand is around 0.25 m (10 in.). The influence of initial stiffness on peak displacement demand is negligible when the isolation period is small. A small isolation period is due to a large post-yield stiffness, which in turn produces a relatively large initial stiffness for all values of α considered. This produced indistinguishable results for low isolation periods. When the isolation period is larger, observable differences on the displacement demand occur; see Figure 3.16. Larger initial stiffness results in smaller displacement demands. However, in the isolation period range of interest—namely the 2-sec range—no significant difference was observed.
There is negligible difference in terms of force demands among isolators with different initial stiffness, see the force spectrum in Figure 3.17. The force demand is dependent on the isolation period. Since Qd in this comparison was the same for all four cases, the difference of force demand comes from the post-yield stiffness and displacement demand. However, at a given isolator period, the post-yield stiffness is identical, and any increase in force demand is a consequence of the variation in displacement demand produced by the initial stiffness. Therefore, insignificant influence by α is expected—and observed—in terms of force demand.
The force reduction factor was produced by comparing these results with a fixed-base case. The results are shown in Figure 3.18. The impact of α on the force reduction factor had only modest influence for isolator periods greater than 3 sec. The force-displacement demand relationship is shown in Figure 3.19. From this figure, the initial stiffness only has an effect on the displacement demand and almost no influence on force demand, as was observed in Figure 3.17. For a given displacement demand, a different initial stiffness will not produce different force responses. However, for a given force demand, a different initial stiffness will produce different bearing displacement demands.

Figu
re 3.16 Mh1is
Median and 8azard. Respo%, 5%, and 1
solator perio
4th-percentileonse values 10%) are plotd of 2.1 sec
49
e isolator disusing a bilintted togetherare marked i
splacement snear model wr for comparin the plot.
spectra undewith differentrison. Values
er the NRC t α (0.1%, s at the

Figu
re 3.17 MN(0th
Median and 8NRC hazard. R0.1%, 1%, 5%he isolator pe
4th-percentileResponse va
%, and 10%) aeriod of 2.1 s
50
e isolated malues using aare plotted tosec are mark
ass acceleraa bilinear moogether for cked in the plo
ation spectraodel with diffcomparison. ot.
a under the ferent α Values at

Figu
Figu
re 3.18 MRap
re 3.19 Mth(0
Median force Response val
nd 10%) are eriod of 2.1 s
Median force he NRC haza0.1%, 1%, 5%
Force
(acceleratiolues using a plotted togesec are mark
(acceleratioard. Respons%, and 10%) a
51
n) reductionbilinear mod
ether for comked in the plo
n) versus bese values usiare plotted to
ratio using del with diffe
mparison. Vaot.
earing displaing a bilinearogether for c
the NRC hazerent α (0.1%lues at the is
acement relatr model withcomparison.
zard. %, 1%, 5%, solator
tion under h different α

52
3.6 CONCLUSION AND SUMMARY
This section presented the results of a parametric study conducted using a simplified analysis model with a rigid mass representing the superstructure of the PGSFR NPP. The effect of key isolator design parameters on the peak response of the supported mass was investigated. Bi-directional time-history analyses were conducted using NRC and EUR hazards. With this preliminary analysis, some key conclusions have been drawn:
The two bearing models considered, a bilinear model and a Bouc–Wen model, have almost identical responses for the rigid mass superstructure model. The roundedness of the Bouc–Wen model did not impact peak displacement or acceleration demands.
Regarding the two hazards considered, the NRC response was around six times larger than the EUR in terms of displacement demand and twice as large in terms of force demand. While the two hazards were scaled to the same 0.3g PGA, these results reflect the larger demands imposed by the NRC hazard spectra.
Under the NRC hazard scaled to 0.3g PGA, the median bearing displacement demand was approximately 15.24 cm (6 in.), with force demands around 0.2g. The force reduction factor when compared to a fixed-base case is around 2.5 for a 2.1-sec isolation system.
The response of the isolated structure is mainly influenced by the isolation period (post-yield stiffness). A large isolation period (smaller post-yield stiffness) will reduce force demands but induce larger displacement demands as a tradeoff. The initial stiffness of the bearing had little effect on the response in this simplified rigid-mass model.
Larger characteristic strength Qd, or equivalently larger bearing yield force Fy, will decrease the isolator displacement demand but not significantly affect the force demand.
The initial stiffness of the bearing did not produce significant variation in the force demands or the displacement demands in the likely period range of interest.
53
4 DYNAMIC ANALYSIS OF A SEISMICALLY ISOLATED PGSFR SUBJECTED TO EARTHQUAKE EXCITATION
4.1 INTRODUCTION
Chapter 3 presented the results of parametric analyses carried out using a rigid-mass model that represented the upper reactor and auxiliary building. That simplified model restrained rocking of the plant about any horizontal axis and rotation about a vertical axis. As such, it was possible to model the plant as being supported on a single isolator unit that represents the whole isolation system. Although some key conclusions were drawn from parametric study on the simplified model, a more refined model of the PGSFR is needed to capture fully the three-dimensional dynamic response characteristics of the facility.
In this section, a more refined model representing the PGSFR RCB, auxiliary building (AUX), and base mat is considered. While the model is more refined than the rigid block model used in Chapter 3, it was still based on a simplified lumped-mass “stick” representation when modeling upper plant buildings. Given the lack of current details regarding the plant design, and the evolving configuration and properties of the superstructure, this model is believed to be appropriate for the type of preliminary investigations being carried at this stage of the study. The superstructure is supported on an isolation system consisting of 152 LRBs. The overall model was developed in OpenSees. In addition to a model of the isolated PGSFR, a fixed-base model was developed and analyzed for comparison purposes. Parametric studies were conducted using time-history analysis methods considering three components of earthquake excitation. The results of these parametric studies are described in this chapter.
4.2 DEVELOPMENT OF A REFINED 3D MODEL IN OPENSEES
A more refined lumped-mass stick model was developed in OpenSees to study the dynamic behavior of the plant superstructure in terms of isolator displacements and floor response spectra, as well as to assess overturning response including possible tension and uplift of the bearings, and torsional effects in the isolation system associated with the stiffness and mass eccentricity of the current design. The same stick model with some minor modifications is also being used for aircraft impact analyses discussed in Chapter 5.

4.2.1 P
The refinto a commin these a
Trepresentgeneral aPGSFR ifrom therectangulwest andthe RCBoutside d
OE&C is tperiod ofand AUXdevelopecharacter
Plant Gener
ned model comon base manalyses, and
The first sticts the RCB. arrangement is shown in e drawings, lar in plan w
d south–west B is located diameter of th
Other generalthe overall pf 2.1 sec, anX between ed, and its ristics.
Figure
ral Descrip
onsists of twat, which is d the bearing
ck in the suThe model drawings pFigure 4.2, the AUX w
with a maximcorners hav26.25 m (8he RCB is 3
l data of theplant weight
nd a range of3.5–5 Hz. dynamic be
4.1 Pers
ption and G
wo sticks withsupported b
gs are conne
uperstructuregeometry wrovided by Kand the elev
wraps arounmum dimensve small cuto6.1 ft) from0 m (98.4 ft
e preliminaryt of 151,897f estimated sDespite theehavior tun
spective and
54
Geometry
h lumped may 152 LRBs
ected to a fix
e model repas developeKEPCO E&vation view nd the RCBsion of 77 mouts of 7.5 m
m the outside).
y PGSFR pla7 tonf (334,8superstructu
e limited amned to matc
schematic v
asses at majs. Soil under xed base.
presents the d based on d
&C; see Figuis shown in
B; the perimm (252 ft) m (24.6 ft) e of the eas
ant design th875 kip), th
ure fundamenmount of dach the prov
view of PGSF
or floor elevr the plant wa
AUX and dimensions
ure 4.1. The n Figure 4.3
meter of the 59.5 m (19
7.5 m (24.6 st wall of th
hat was prove targeted ental frequenata, the anavided weigh
FR power pla
vations connas not consid
the second from prelimplan view o
3. As can beAUX is al
95 ft). The nft). The cen
he AUX, an
vided by KEeffective isolncies for the alysis modelht and frequ
ant.
nected dered
stick minary of the e seen lmost
north–nter of nd the
EPCO lation RCB
l was uency

Fig
Tdirectionaircraft iresponse m (59 in.purposeswill occuThereforcommon the seism
Eis embed(78.74 in(98.43 ft)
gure 4.2
The geometryn but asymmmpact analyduring seism
.). A gap of , it was assuur between e, the two base mat; th
mically isolat
Elevations ofdded and locn.). For mod). The RCB
Plan view of
y of the plametric in eaysis (AIA) dmic excitatiounknown siz
umed that ththe two plasticks that rhus, dynamited models b
f major floorcated 8 m (26eling purpossticks out of
f preliminary
ant is such tast–west dirediscussed in on. The RC ze separates
he gap is sufant superstrurepresent thc interaction
but not the fi
rs are called6.25 ft) beloses, it was af the AUX an
55
y PGSFR gen
that the oveection. ThisChapter 5.
wall thickne the RCB frfficiently laructures durinhe RCB andn between thxed-base mo
d out in Figuow ground. Tassumed thatnd is 39.4 m
neral arrange
erall layout s is an impIt may also
ess for both rom the AUXrge such thang ground s
d AUX are he two superodels.
ure 4.3. The The thicknest the roof of
m (129.22 ft)
ement with d
is symmetriportant consio have an efthe AUX an
X. For modeat no impact shaking andonly conne
rstructures is
top of the css of the RCf the AUX istall.
dimensions.
ic in north–ideration foffect on torsnd the RCB ieling and ana
and/or pound aircraft imcted throughs only possib
ommon baseC base mat iss located at
south or the sional is 1.5 alysis nding
mpact. h the ble in
e mat s 2 m 30 m

Figu
4.2.2 M
The strencommon
R
R
re 4.3 Ed
Material and
ngth, stiffnebase mat wa
RC material:
Streng
Elasti
Shear
Poisso
Weigh
Rigid materia
Streng
Elasti
Shear
Elevation viewimensions.
d Damping
ess, and weias selected w
gth: 27.6 MP
c Modulus:
Modulus: 1
on’s Ratio: 0
ht Density: 2
al:
gth: 27.6 MP
c Modulus:
Modulus: 1
w of prelimin
g Propertie
ght density with the follo
Pa (4 ksi)
24,856 MPa
0,356 MPa (
0.2
23.56 kN/m3
Pa (4 ksi)
24,856 GPa
0,356 GPa (
56
nary PGSFR
es
of the RC uowing prope
a (3605 ksi)
(1502 ksi)
3 (150 pcf)
(3,604,997
(1,502,082 k
general arra
used to moderties:
ksi)
ksi)
angement wit
del the RCB
th
B, AUX, an
nd the

57
Poisson’s Ratio: 0.2
Weight Density: 0.0 kN/m3 (0 pcf)
Damping was assigned as stiffness proportional damping with the following values:
RCB: 5% anchored at 4.3 Hz
AUX: 7 % anchored at 5.4 Hz
Base Mat: 7 % anchored at 7.0 Hz
Less damping was assigned to the RCB than the AUX because it was assumed that the RCB is a prestressed RC structure, while the AUX is assumed to be constructed from regular RC.
4.2.3 Analysis Model
In the analysis model shown in Figure 4.4, the left shorter stick represents the AUX and the right taller stick represents the RCB. The origin of the coordinate system for the analysis model is located at the center of the RCB at ground elevation. Beam–column frame elements were used to model the two portions of the lumped-mass plant superstructure. The common base slab was modeled using shell elements; therefore, it had distributed weight and mass properties. Beneath the base mat, 152 elastomeric bearing elements were defined to model the isolation system. The FE mesh of the base mat was created in such a way that it consisted of 152 nodes and isolator elements that were connected to each one of these nodes. The other end of the isolator elements was fixed directly to the ground, which means that isolator pedestals and soil were not included in the analysis model and possible soil–structure interaction (SSI) effects were not considered in this preliminary study.
In order to connect the two lumped-mass sticks to the base mat and to correctly transfer axial forces, shear forces, and overturning moments, several additional frame elements were created and assigned to the analysis model. For the RCB, a weightless frame element was defined with stiffness properties that corresponded to the walls of the RCB, which was assigned along the circumference of the RCB. These RCB-wall elements were then connected to the base mat, and rigid elements were then used to radially connect the RCB stick to the RCB-wall elements. Similarly, for the AUX, a weightless AUX-wall element was defined and assigned to the perimeter of the AUX. Diagonal rigid elements were then defined to connect the AUX stick to the AUX-wall elements, which were connected to the base mat. Hence, the weightless wall elements, which act as imbedded beams in the shell element base mat, provided a means to accurately connect the simplified superstructure sticks to the mat; they also accounted for the stiffening effect of the base mat along wall lines. The numbering of nodes and elements for the two lumped-mass sticks is shown in the bottom subfigure of Figure 4.4. Vertical node locations correspond to the elevations called out in the elevation view of Figure 4.3.
Frame-element section properties are summarized in Table 4.1. As shown in Figure 4.5, the RCB section was assigned over the entire height of the RCB stick; similarly, the AUX section was assigned over the entire height of the AUX stick; therefore, stiffness properties were uniform along the height. RCB-wall elements were assigned at the base mat elevation around the circumference of the RCB superstructure, and AUX-wall elements were assigned at the base mat

elevationconnect tthe rigid
Tin.) and u
n around thetogether the material def
The shell elemused the RC
Figure 4
e perimeter odifferent pa
finition, whic
ments used material to
4.4 3D vi
of the AUXarts of the mch is 1000 ti
to model thdetermine th
iew, plan vie
58
X superstructmodel were aimes stiffer t
e base mat hheir distribut
w, and eleva
ture. The remassigned RIGthan the typi
had an assigted weight an
ation view of
maining framGID sectionical RC mate
gned thickneand mass pro
f analysis mo
me elementsn properties uerial.
ess of 2 m (7operties.
odel.
s that using
78.74

Section
RCB
AUX
RCB-Wa
AUX-Wa
RIGID
Figu
Tstudy are(47,348 thereforeother hanthe massmasses aabsence the slab was then151,897 7492 ton
Fwere accthe RCBper lengt53.89 kip
n A (in
208,
620,7
all 103,3
all 76,6
100,0
re 4.5 Sa
The initial pre given in Tkip). It is n
e, the weightnd, masses a density ( =
assigned to thof any moreself-weight
n assumed thtonf (334,8f (16,516 kip
inally, the wcounted for a elements, t
th was 0.046p/in. and the
Table 4.1
n.2) Iz
169 3.28
773 8.54
368 2.64
641 1.07
000 1.00
Section propeuxiliary build
roperties of tTable 4.2. Thnot possiblet of the baseand mass mo= 2.2483e-0he nodes of te detailed daplus additiohat the reac75 kip). Bap), which wa
weight and tas distributedhe distribute
68 kip sec2/indistributed m
Frame e
(in.4)
851E10 3
460E11 5
440E10 2
780E10 2
000E10 1
erty definitioding frame e
the LRB isohe weight o
e in OpenSee mat was aoments of in
07 kip sec2/inthe two supeata about bunal dead loa
ctor makes used on this as assigned t
the mass cond frame-elemed weight pen.2. For the Amass per len
59
element sect
Iy (in.4)
3.2851E10
5.7516E11
2.9985E07
2.2232E07
.0000E10
ons for the relements (kip
olators beforf the 2 m (7
ees to assigassigned as vnertia of then.4) assignederstructure stuilding and cad of all majup the differassumption
to node 1002
ntributions oment properter length waAUX elemenngth was 0.1
tion propertie
Ay (in.2)
104,276
358,050
86,140
63,868
100,000
eactor contaip, in.)
re they were78.74 in.) th
gn distributevertical forc
e base mat wd to the shelticks are sumcomponent wjor floors wrence to rea
n, the estima2.2 at elevat
of the RCB ties on the twas 18.07 kipnts, the distr396 kip sec2
es (in.).
Az (in.2
104,276
276,672
86,140
63,868
100,000
inment build
e modified fohick base med weight toces to the 15were directlyll elements. mmarized inweights, it w
was 31.41 kNach the totalated weight tion 7.3 m (2
and AUX cowo superstru
p/in. and the ributed weig2/in.2.
) J (in
6 6.5702
2 1.0353
0 1.1740
8 8.6384
0 1.0000
ding and
for the parammat is 21,477o shell elem52 nodes. Oy calculated The weight
n Table 4.3. Iwas assumedN/m3 (200 pcl plant weigof the react
287.5 in.).
ontainment ucture sticksdistributed
ht per length
n.4)
2E10
3E12
0E08
4E07
0E10
metric 7 tonf ments; On the
from ts and In the d that cf). It ght of tor is
walls s. For mass
h was

60
Table 4.2 Initial lead-rubber bearing element properties (kip, in.).
Direction
Linear Nonlinear
Stiffness Damping Stiffness Yield
strength Post-yield stiffness
ratio
X 73,656.00 90.70 - - -
Y 51.24 11.27 3070.36 226.98 7.82E-03
Z 51.24 11.27 3070.36 226.98 7.82E-03
XX 1.00 0.00 - - -
YY 1.00 0.00 - - -
ZZ 1.00 0.00 - - -
Table 4.3 Nodal weight and mass assignments (kip, in.).
Node W mx my mz mxx myy mzz
1001 4,993 12.931 12.931 12.931 0 0 2,254,900
1002.1 4,993 12.931 12.931 12.931 0 0 2,254,900
1002.2 16,516 42.778 42.778 42.778 6,151,200 6,151,200 701,510
1003 4,993 12.931 12.931 12.931 0 0 2,254,900
1007 4,868 12.608 12.608 12.608 0 0 2,198,500
2001 27,366 70.880 70.880 70.880 0 0 86,694,000
2002 27,366 70.880 70.880 70.880 0 0 86,694,000
2003 27,366 70.880 70.880 70.880 0 0 86,694,000
2004 27,366 70.880 70.880 70.880 0 0 86,694,000
2005 27,366 70.880 70.880 70.880 0 0 86,694,000
4.2.4 Dead Load and Eigenvalue Analysis Results
Figure 4.6 depicts the plan distribution of vertical reactions. The distribution due to dead load is concentrated around the perimeter and around the RCB. This distribution is not ideal and likely a consequence of rigid elements used to distribute loads from the building into the base mat. The independence of lateral and axial forces in analytical bearing models used means this distribution does not invalidate analysis results.
Eigen-frequencies and mode shapes of the fixed-base model are provided in Table 4.4 and Figure 4.7, respectively. The primary mode corresponds to translation of the RCB at a

frequencyprimary m4.8. Thetranslatiorotation a
y of 4.3 Hzmode in the
e frequency onal mode iabout the ver
Figure 4
. This freque isolated mo
of this moin the perpertical axis w
4.6 Axia
Table 4.4
Mode
1
2
3
4
5
6
7
8
9
10
11
12
uency shifts odel correspode is 0.47 endicular di
with a frequen
l load distrib
Eigen-fr
F (Hz)
4.284
4.284
5.010
5.732
10.599
10.599
11.188
12.103
12.635
14.646
16.744
19.493
61
to 3.6 Hz inponds to tran
Hz or a 2irection. Thncy of 0.67 H
bution in isol
requencies o
Bldg. Comp.
RCB
RCB
AUX
AUX
RCB
RCB
AUX
AUX
RCB
AUX
AUX
RCB
n the isolatenslation at th2.1-sec peri
he third modHz or a 1.5-s
lators under
of fixed-base
Direct
H2 transl
H1 transl
H2 transl
H1 transl
H2 transl
H1 transl
V rotat
V transla
V transla
H2 transl
H1 transl
V rotat
ed model; sehe isolation iod, and code of the issec period.
dead-load c
model.
ion
lation
lation
lation
lation
lation
lation
tion
ation
ation
lation
lation
tion
ee Table 4.5layer; see Fincides withsolated mod
case.
. The Figure h the del is

MoMo
F
Table
de 1 (RCB) de 5
Figure 4.7
4.5 Eig
Mode
1
2
3
4
5
6
7
8
9
10
11
12
Selected m
gen-frequenc
F (Hz)
0.472
0.475
0.668
3.580
3.695
7.384
8.197
8.836
9.729
11.145
11.636
16.245
62
mode shapes
cies of the se
Bldg. Comp.
ISO
ISO
ISO
RCB
RCB
RCB/AUX
RCB/AUX
ISO
RCB
RCB/AUX
RCB/AUX
RCB/AUX
ModMod
s of fixed-bas
eismically is
Direct
H2 transl
H1 transl
V rotat
H2 transl
H1 transl
H2 transl
H1 transl
V transla
V transla
H2 transl
H1 transl
V rotat
de 3 (AUX) de 10
se model.
solated mode
ion
lation
lation
tion
lation
lation
lation
lation
ation
ation
lation
lation
tion
el.
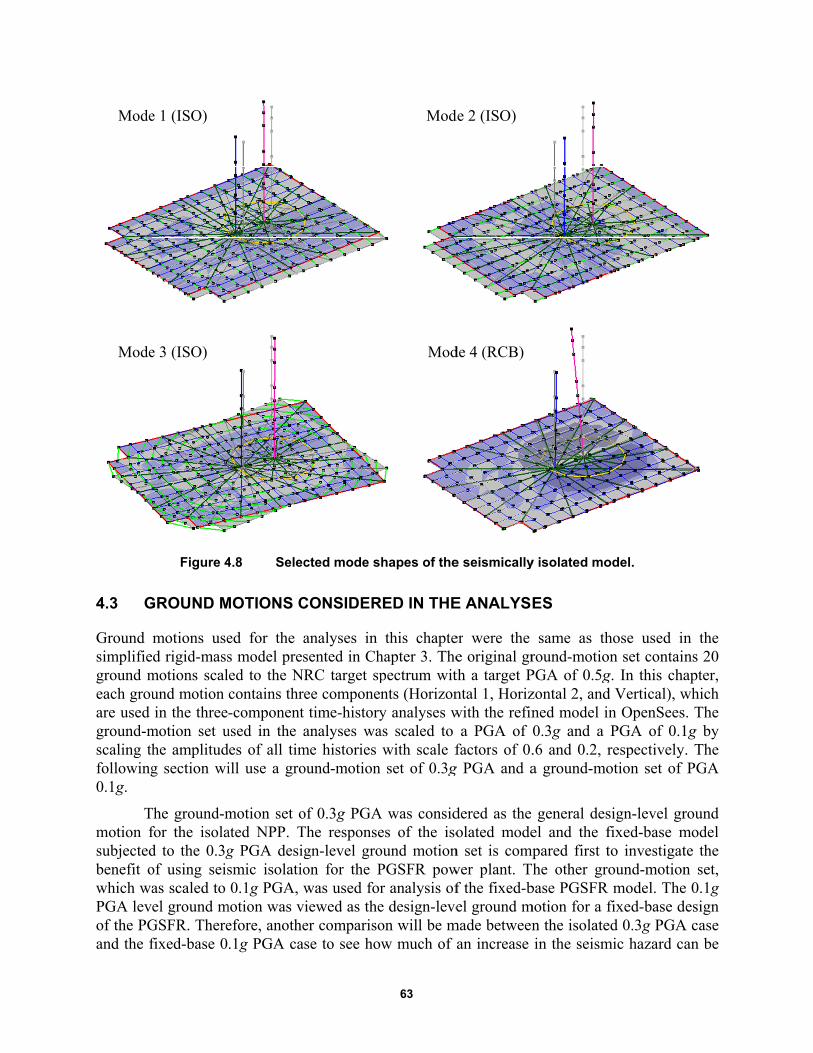
4.3 G
Ground simplifieground meach grouare used ground-mscaling thfollowing0.1g.
Tmotion fsubjectedbenefit owhich waPGA levof the PGand the f
Mode
Mode
Figure 4
GROUND M
motions used rigid-mass
motions scalund motion in the three
motion set uhe amplitudg section wi
The ground-mfor the isolad to the 0.3gof using seisas scaled to el ground m
GSFR. Therefixed-base 0
e 1 (ISO)
e 3 (ISO)
4.8 Selec
MOTIONS C
ed for the as model presed to the NRcontains thre-component
used in the ades of all timill use a gro
motion set oated NPP. Tg PGA desigsmic isolatio0.1g PGA, w
motion was vefore, anothe.1g PGA ca
cted mode s
CONSIDER
analyses in sented in ChRC target spee componetime-history
analyses wame histories ound-motion
of 0.3g PGAThe responsegn-level groon for the Pwas used foriewed as theer comparisose to see ho
63
hapes of the
RED IN THE
this chaptehapter 3. Thepectrum witnts (Horizony analyses was scaled to with scale f
n set of 0.3g
A was consides of the isoound motionPGSFR powr analysis ofe design-leveon will be mw much of
Mod
Mod
e seismically
E ANALYS
er were the e original grth a target Pntal 1, Horizwith the refin
a PGA of factors of 0.
g PGA and a
dered as the olated mode
n set is compwer plant. Tf the fixed-bel ground m
made betweenan increase
de 2 (ISO)
de 4 (RCB)
y isolated mo
ES
same as thround-motioPGA of 0.5gzontal 2, andned model i0.3g and a .6 and 0.2, ra ground-mo
general desel and the f
mpared first the other gro
base PGSFR motion for a f
n the isolatein the seism
odel.
hose used inon set containg. In this chad Vertical), wn OpenSeesPGA of 0.1respectivelyotion set of
sign-level grfixed-base mto investigatound-motionmodel. The
fixed-base ded 0.3g PGAmic hazard ca
n the ns 20 apter, which s. The 1g by . The PGA
round model te the n set, e 0.1g design A case
an be

64
achieved for the design-level ground motion by using seismic isolation; see Section 3.3 for additional information on selecting ground-motion time histories and the construction of the NRC RG1.60 target spectra.
4.4 PARAMETRIC STUDY SUMMARY
The study compares the seismic response of the fixed-base PGSFR and the base-isolated PGSFR. Per Section 4.3, two seismic conditions were used in the comparison. The two comparisons are performed for different reasons. The purpose of comparing the base-isolated case subjected to the 0.3g PGA ground-motion set with the fixed-base case subjected to the same ground-motion set is to investigate the benefits obtained from seismic isolation. The purpose of comparing the base-isolated case with 0.3g PGA and the fixed-base case with 0.1g PGA is to examine how much the seismic hazard can be increased by using isolation while maintaining acceptable plant superstructure response levels and safety margins. Similar to the previous chapter, different parameters of the isolators are being studied in this chapter but are applied to the refined model in OpenSees instead of the rigid-mass model.
The parameters considered here for the isolators are the initial stiffness (Kinitial), the post-yield stiffness or the post-yield period (Tiso), and the yield force (Fy) or the characteristic strength of the bearing. The detailed summary of each case considered in this parametric study is shown in Table 4.6.
Table 4.6 Summary of analysis cases used in the parametric study.
Seismic Input
Initial stiffness (Kinitial)
Isolation period (Tiso)
Bearing yield force (Fy)
Parameter considered
Fixed-base
NRC set with PGA of 0.1g
NA NA NA
NRC set with PGA of 0.3g
NA NA NA
Base-Isolated
NRC set with PGA of 0.3g
5 Kpostyield 3 sec 10% W Different
Kinitial 10 Kpostyield 3 sec 10% W
100 Kpostyield 3 sec 10% W
10 Kpostyield 2 sec 10% W
Different Tiso 10 Kpostyield 3 sec 10% W
10 Kpostyield 4 sec 10% W
10 Kpostyield 3 sec 5% W
Different Fy 10 Kpostyield 3 sec 10% W
10 Kpostyield 3 sec 15% W
10 Kpostyield 3 sec 20% W

65
4.4.1 Comparison of Different Kinitial
Because of the relatively low value of PGA selected for the design-basis earthquake (SSE), the isolator deformations are expected to be small. In a preliminary run using the refined model and a representative 0.3g record, the peak bearing response amplitude is around 50 mm (2 in.) for Tiso = 3 sec, Fy = 0.1 W, and Kinitial = 10 Kpostyield. During this response, the bearing deformed into the post-yield range only a few times; in most of the cycles, and the bearing remained in the elastic range; therefore, the isolator and structural response may depend significantly on the initial stiffness of the isolator. Thus, in the first part of this parametric study, the post-yield stiffness of the isolator is fixed at Tiso equals 3 sec, and Fy is fixed at 10% W. To show the importance of this parameter, three different initial stiffness values were considered and the responses compared. The initial stiffnesses used here are characterized by the ratio of the post-yield stiffness. The post-yield stiffness was held constant, and the initial stiffness was assumed to be 5, 10, and 100 times stiffer. The reason to choose the ratio of Kinitial to post-yield stiffness instead of a real value of the initial stiffness (which is mainly based on the area of a particular lead plug), is to obtain a more intuitive sense on the value of the initial stiffness used. The post-yield stiffness is a common design-oriented parameter considered in bearing design. The most common ratio used in practice is around 10%. The actual values of the initial stiffness are 827, 1655, and 16,550 MPa (120, 240, and 2400 kips/in.) for each bearing.
4.4.2 Comparison of Different Tiso
As discussed in Chapter 3, the isolation period Tiso, which is based on the post-yield stiffness of the isolator, is the most important parameter considered in the design of a seismic isolation system since it influences both the displacement demands of the isolators and the forces transferred to the superstructure. However, because of the small deformations that the isolators in the refined model underwent when subjected to the SSE, the effectiveness of Tiso on the response may not be as large as for the simplified rigid-mass model discussed in Chapter 3.
In this part of the parametric study, a Tiso of 2 sec, 3 sec, and 4 sec were evaluated and compared, while the isolator yield force Fy was kept at 10% of weight on bearing, and the initial stiffness was kept at 10 times the post-yield stiffness. When studying different post-yield stiffnesses, the initial stiffness values need to be kept unchanged. Therefore, by changing the post-yield stiffness ratio, different post-yield periods can be achieved for the same initial stiffness.
4.4.3 Comparison of Different Fy
The yield force of the isolator is another parameter considered in this series of parameter studies. Per Chapter 3, it was found that Fy has a fairly large influence on the displacement demand but has only a minor effect on the force demand for the simplified isolated rigid-mass case. However, because of the overall smaller bearing deformations, Fy has a more pronounced effect on the superstructure response in this case. The total shear force that propagates up into the superstructure from the bearing is the yield force plus the increase of force due to the post-yield stiffness of the bearing. Since the isolator deformation is small, the contribution from the second part is negligible; therefore, any change of the force demand in the superstructure is directly

66
related to Fy. More detailed results and a discussion of this behavior will follow later in this chapter.
In this section, different isolator yield forces were considered and compared, with Fy equal to 5%, 10%, 15%, and 20% of the initial gravity load on the bearing. As mentioned earlier, the LRB isolator elements used in these studies do not account for any vertical–horizontal coupling effects in terms of forces and bearing kinematics. Hence, changes in the vertical force in the isolators due to vertical excitation and rocking during the response history analyses do not affect the shear behavior of the isolators. The other two parameters are kept unchanged. The post-yield period was kept at 3 sec, and the initial stiffness was kept at 10 times the post-yield stiffness, which is 1655 MPa (240 kips/in.).
4.5 ANALYSIS RESULTS AND DISCUSSION
Selected results will be shown below and accompanied by an in-depth discussion. With the refined analysis model, horizontal floor response spectra and vertical floor response spectra of each floor level for both the RCB and AUX were generated and compared. Drift response of the RCB and AUX along their height were also analyzed. Isolator hysteresis loops and displacement orbits were captured for all of the 152 bearings supporting the plant superstructure. The corner bearing and center bearing are shown and compared in detail.
The described response quantities were analyzed and discussed for the NRC ground-motion set, which contains 20 ground motion histories either scaled to 0.3g PGA or 0.1g PGA. The results shown in this section for the RCB and the AUX are median response quantities as well as 84th-percentile response quantities (which are one standard deviation above the median).
For each of the plots showing response results, peak absolute values over the entire response history are reported; however, plots illustrating isolator responses show the entire response history. Since the ground-motion input is three-directional, horizontal response quantities were calculated by taking the norm of the response values of the two horizontal directions at each time step.
For each of the plots, fixed-base cases for a PGA of 0.1g are represented by black dashed lines, fixed-base cases for a PGA of 0.3g are shown as black solid lines, and different base-isolated cases for a PGA of 0.3g are represents by colored lines.
4.5.1 Results for Different Kinitial
A comparison of different Kinitial values was carried out since a reasonable initial stiffness value for the isolators is needed for subsequent parameter studies. As an insightful response quantity for the design of NPPs, floor acceleration spectra are compared first. The horizontal floor spectra of the RCB are shown in Figure 4.9. The RCB model has seven floors, and the floor acceleration spectra in the horizontal direction for the first floor, fourth floor, and the roof are shown in Figure 4.9. As previously noted, the spectral acceleration value corresponds to the norm of the two horizontal directions; therefore, for the spectral acceleration at the largest frequency in the graph, the fixed-base peak floor acceleration is not 0.3g because the norm of the two scaled components is larger than 0.3g.

67
Comparing the floor spectra of each floor, from the ground floor to the top floor, a pronounced amplification of the spectral accelerations can be observed as the floor level increases. The largest peak in each spectrum corresponds to the fundamental mode of the RCB of the fixed-base model at 4.3 Hz. The peak spectral acceleration at the fixed-base fundamental frequency is amplified from 1.2g to almost 5g, whereas the peak floor acceleration at large frequencies increases less from 0.5g for the ground level to 1g for the roof level. These large amplifications are reasonable around the fundamental frequency of the fixed-base case since the fundamental mode shape increases with height and is largest at the top. However, when considering the fundamental isolation mode, which is represented by the small spectral acceleration peak at around 0.6 Hz, the peak is not amplified much from the ground floor to the roof. This is due to the fundamental isolation mode shape being nearly constant along the height.
In a comparison between the base-isolated cases and the fixed-base cases for the horizontal floor acceleration spectra of the RCB, the base-isolated case for the 0.3g PGA design-level ground motion set generates similar spectral acceleration amplitudes as the fixed-base design subjected to the 0.1g PGA ground-motion set. Hence, the isolated PGSFR NPP can sustain design-hazard levels that are approximately three times larger than what is possible for the fixed-base plant. However, even though the overall spectral acceleration amplitudes are similar, the frequency content of the floor spectra is changed. The response for the isolated plant is larger for certain parts of the frequency range as compared to the 0.1g PGA fixed-base case, especially around the fundamental isolation frequency. Note that most of the equipment will not be sensitive to long-period motion except for possible sloshing of free-liquid surfaces. This difference may not influence much the design of the plant superstructure and equipment, but it needs further investigation. A comparison of the same 0.3g PGA fixed-base case with the base-isolated case clearly demonstrates the great benefit obtained by using seismic isolation technology as can be seen by comparing the colored lines with the black solid line in Figure 4.9 for each floor level. The reduction in spectral accelerations is approximately by a factor of 3 for the base floor and slightly smaller as the floor level increases.
When comparing floor spectra for each of the base-isolated cases with different bearing initial stiffnesses, it is clear that a small initial stiffness produces better results than a large initial stiffness. A distinct change of the spectral acceleration peak at the fundamental isolation frequency can be seen in the acceleration spectra for all floor levels. For a smaller initial stiffness of the isolator, the effective stiffness of the isolator is also reduced, and the spectral acceleration peaks corresponding to the effective isolator frequencies are shifted to lower frequencies. For higher floor levels, significant amplification of the spectral acceleration peaks occurred around the fundamental frequency of the RCB for cases with large isolator initial stiffness. Higher-mode peaks in the floor response spectra were also more amplified for cases with the larger isolator initial stiffness.

Figure 4.9 Madc
Median horizond roof of thifferent initiaompared.
ontal floor ache reactor coal stiffness a
68
cceleration sontainment band fixed-bas
spectra for fibuilding. Basse cases with
rst floor, foue-isolated cah different P
urth floor, ases with GA are

Figu
Aeffective fundamenamplificaThe relatisolator i
Fpost-yielisolation to use afrequencyresonanc
Ffloor levpercentilless thandifferencdeformatvariabilit
TamplificaRCB. Thspectral CompareAUX are
re 4.10 84rest
As demonstraisolator fr
ntal frequenation of the tively small bnitial stiffne
or subsequed stiffness isystem unde
a smaller, my of the isoe effects.
igure 4.10 svel of the Re response a
n the 1.5 facce between ttions are smty of the resp
The AUX hations of thehe benefit oacceleration
ed to the flooe generally
4th-percentileeactor contatiffness and
ated, for larrequency shncy of the floor accele
bearing defoess had on th
ent studies, thnstead of therwent fairlymore typicaolation syste
shows the 8RCB. Compand the med
ctor obtainedthe median a
maller, i.e., tponse was sm
horizontal fle response af using isola
n amplitudesor acceleratismaller, esp
e horizontal inment buildfixed-base c
rge bearing ihifted to laRCB. This
eration specormations sehe floor accel
he initial stifhe much largy small deforl isolator inem from the
84th-percentiparing the sdian responsd from the sand the 84th
the bearing maller.
floor acceleralong the heators with ss are higherion spectra opecially at t
69
floor accelerding. Base-iscases with di
initial stiffnarger freques lack of frctra around teen at the givleration spec
ffness of theger initial strmations at tnitial stiffnee lowest fre
le horizontaspectral accse, the amplisimplified anh-perentile vresponded m
ration specteight were omall initial for the casof the RCB,the fundame
ration spectrsolated casesifferent PGA
ess the specencies and frequency sethe fundameven hazard lctra.
e bearing watiffness initiathe 0.3g PGAess to betteequency of
al floor acceeleration amification facnalyses usinvalues is smamore often i
tra are shoobserved, simstiffness is
se with a la, spectral accental frequen
ra for first flos with differe
A are compar
ctral accelereventually
eparation caental frequenevel intensif
as selected toally consideA hazard lev
er separate the superstr
eleration spemplitudes bector is aroung the rigid-maller becausin its elastic
own in Figmilar to thedemonstrate
arge isolatorceleration amncy for the
oor of the ent initial ed.
ation peak aapproached
aused signifncy of the Rfied the effec
o be 10 timeered. Becausvel, it is desithe fundam
ructures to a
ectra at the etween the nd 1.25, whimass modele typical bec range, thu
gure 4.11. Le behavior oed once agar initial stiffmplitudes fofixed-base
at the d the ficant RCB. ct the
es the se the irable
mental avoid
first-84th-
ich is . The
earing us the
Large of the ain as fness. or the case.

70
Unlike the spectral accelerations of the RCB, the peak around the fundamental frequency of the AUX is suppressed instead of amplified.
This is due to the change of modal characteristics of the isolated structure from the original fixed-base structure. For the fixed-base case, the first vibration mode frequency corresponding to the deformation of the RCB is around 4 Hz. This is consistent with the results shown in Figure 4.9 and Figure 4.10, where the fixed-base response spectra peak is around 4 Hz, which is the fundamental frequency of the RCB. When isolated, the vibration mode frequency corresponding to the deformation of the RCB is also around 4 Hz; therefore, in Figure 4.9 and Figure 4.10, for the floor spectra of the isolated model, the second peak is still predominant, which is also around 4 Hz as fixed-base case.
Because the mode corresponding to the movement of the AUX is around 5 Hz, the peak of floor acceleration spectra for the fixed base is around 5 Hz. However, given the interaction between the base mat and the two sticks in the model, the mode corresponding to the movement of the AUX in the isolated model has shifted; Therefore, the floor spectra response of the isolated AUX has a shifted peak compared to the fixed-base model.
In terms of the peak floor acceleration response value, the PGA of 0.5g for ground level can be reduced to around 0.2g by choosing smaller initial stiffness of bearings, and a response reduction factor around 2.5 can be achieved. Overall, considering floor spectra for frequencies larger than 1 Hz (which we are considering critical in the design of a NPP), the response reduction using seismic isolation is more pronounced for the AUX comparing to the RCB.
In addition to the horizontal spectra, the vertical floor acceleration spectra were also investigated; see Figure 4.12. A comparison between different floors demonstrates that the amplification effect of the vertical ground motion is not as large as the horizontal ground motion. The peak value of the acceleration spectrum increased from 1.0g at the base up to 1.8g at the roof, which is approximately double.
In terms of the amplitude of vertical acceleration compared to the horizontal acceleration, the vertical acceleration is around one-half. Comparing the base-isolated case and the fixed-base case, amplification is expected for the base-isolated case because the vertical stiffness of the bearing is included. Based on modal analysis of the fixed-base model, the original vertical mode frequency of the RCB was around 12 Hz. Including the isolation plane and the vertical stiffness of the isolation system, the new vertical mode frequency becomes around 9.7 Hz; note the shift in peak in Figure 4.12. The amplitude of the new peak is larger than the original peak, around 50% higher in amplitude.

Figure 4.11 Mrofi
Median horizooof of the AUxed-base ca
ontal floor acUX. Base-isoses with diff
71
cceleration slated cases w
ferent PGA a
spectra for fiwith differen
are compared
rst floor, thirnt initial stiffnd.
rd floor, and ness and

72
The response is identical if we compare the vertical acceleration responses of the bearings with the different initial stiffness. Since the different parameters used in the bearing model only affect the horizontal behavior of bearing, the vertical characteristics of bearing are not affected by the horizontal parameters; therefore, the response is not influenced. The response of vertical floor spectrum for the AUX is similar and is not shown here.
Besides the response of floor spectrum, the force or drift demands were evaluated for the RCB and the AUX. The maximum story drift value of each floor during the time history was recorded, and the median response for each story is shown in Figure 4.13. The floor level or the story level is defined based on the discretization of the model representing the RCB and AUX. The story may not represent the real story of the facility especially for the RCB, but it will give a general view on the distribution of drift deformation along height for both buildings.
For the RCB, comparing the drift responses of the isolated model and fixed-base model for the 0.3g PGA hazard the response is almost the same, with the isolated reactor drift demand slightly smaller. Comparing the isolated model to the fixed-base case evaluated at the 0.1g PGA hazard, drift demands of the latter are much smaller. Since the isolator deformation is fairly small, the benefits of using base isolation are not quite obvious in terms of the force or drift demands. Since the seismic load is small, the force demand at the base of the superstructure is almost the same as the fixed base.
When investigating the drift response of the AUX, which is shown in the second subplot in Figure 4.13, the drift demand of the base-isolated case is much smaller than the fixed base for the 0.3g PGA hazard; the response is almost the same compared to a fixed-base case for the 0.1g PGA hazard. This difference in the drift response between the isolated RCB and AUX is consistent with the results shown in the floor spectra. The response reduction effect by using seismic isolation is not very evident because of the small deformation imposed on the isolator. However, the effect of dominate vibration frequency shift due to interaction of AUX, RCB and base mat suppressed the original peak response in the fixed-base AUX. Therefore, compared to the RCB which only obtains response reduction from the effect of base isolation, the response is much smaller for both drift scenarios for AUX.
A comparison between the drift responses of isolated systems with different initial stiffness demonstrates that the larger initial stiffness will result in a larger drift demand. For the system with bearing initial stiffness—5 and 10 times the post-yield stiffness—the responses are identical since the difference between the two stiffness (120 kips/in. and 240 kips/in., respectively) is relatively small. For the other case, corresponding to an initial bearing stiffness of 2400 kips/in., the drift is much larger. Overall, however, the drift demand, on the order of 0.02%, is fairly small. Even though the response may show some minor trends or differences between different isolator parameter values considered or even between the fixed-base case and base-isolated case, drift response might not control the design of this stiff upper structure. The 84th-percentile drift response is shown in Figure 4.14. From the plot, the maximum drift response is in the order of 0.03%; therefore, even for one standard deviation above the median-level design ground motion, drift response is still very small since upper-structure is fairly stiff this case.

Figure 4.12 Mrodc
Median verticoof of the reaifferent initiaompared.
cal floor acceactor containal stiffness a
73
eleration spenment buildiand fixed-bas
ectra for first ng. Base-iso
se cases with
t floor, fourtholated cases h different P
h floor, and with GA are

Figure 4.13 Mbb
Median maximuildings. Basase cases w
mum story dse-isolated c
with different
74
rifts for reaccases with dPGA are com
ctor containmifferent initiampared.
ment and auxal stiffness a
xiliary and fixed-

Figu
Amat. Theof the baof verticanorthweshysteresiFigure 4.
Nstrength Althoughbearing y
re 4.14 84bb
As discussede difference ise mat, but nal-horizontalst corner andis response a.16, respectiv
Note that forof bearings
h they are kyielding stre
4th-percentileuildings. Basase cases w
d previously,in the responnot due to axl coupling ofd the other loand displacevely.
r this part oare kept the
kept the samength is use
e maximum sse-isolated c
with different
, the isolationses for the xial load difff isolator anocated at theement orbit i
f parametrice same for t
me for differed instead o
75
story drifts fcases with dPGA are com
on plan conbearings at ferentials indalytical mod
e center of thin horizontal
c study, the the differentrent initial sof the bearin
for reactor coifferent initiampared.
sisted of 15different locduced by ovdels. The twohe base mat, l direction a
post-yieldint initial horistiffnesses ang character
ontainment aal stiffness a
52 isolators cations may verturning beo bearings, owill be inve
are shown in
ng stiffness izontal stiffnas shown in ristic force
and auxiliaryand fixed-
beneath the be due to to
ecause of theone located aestigated. Ben Figure 4.15
and the yienesses consid
Figure 4.15as a compa
y
base orsion e lack at the
earing 5 and
elding dered 5, the arison

parametedifferent determinresult in with an iother twoimpact w
Figu
er; thereforecases are a
ned by the cha lower cha
initial stiffneo cases. The
with bearings
re 4.15 Susy
, the bearinactually diffeharacteristic aracteristic fess five timee same issue s of different
Southwest Bender NRC PGystem with d
ng hysteresisferent. Becau
force insteaforce. As shes the post-yis relevant
t initial stiffn
earing H1 dirGA 0.3g groudifferent initi
76
s characterisuse the thickad of the yiehown in Figyielding stiffwhen discusnesses.
rection hysteund-motion tal stiffnesse
stic strengthkness of hyelding force,gure 4.15, thffness is sligssing the res
eresis loop atime-history
es are shown
h or the loopysteresis loop, a lower inihe hysteresisghtly thinner sults of Chap
and displacemnumber 9. T
n together.
p thicknessep of a beariitial stiffnesss loop of be
compared tpter 5 for air
ment orbit The isolation
es for ing is s will earing to the rcraft

Figu
Fsmall, onaround tisolation isolators with smaorbit. Thwhich is
Cresponsealmost idthe respo
re 4.16 CNsy
rom the bean the order othe median
systems is with differe
aller initial she one with approximate
Compared to, but, in gedentical. Theonse of the i
Center BearinNRC PGA 0.3g
ystem with d
aring horizoof 10.2 cm (response amalmost the sent initial ststiffness haslarge initial
ely half of th
o the center neral the reerefore, no ssolators in th
ng H1 directiog ground-mo
different initi
ontal hystere(4 in). The rmong all thsame for thetiffnesses, ths a larger dil stiffness hhe displacem
bearing, theesponses wesignificant tohe whole iso
77
on hysteresiotion time-hial stiffnesse
esis itself, thresponse of he 20-grounde three casehe hysteresiisplacement has an isolatment of the ot
e corner beaere almost thorsion effectolation plane
is loop and distory numbees are shown
he displacemisolator subjd-motions. Ts considereds behavior iresponse as
tor displacemther two cas
aring had a he same. Tht is expectede are similar
displacemener 9. The ison together.
ment of the jected to groThe force dd: around 0.is not the sas shown in ment aroundses considere
slightly larghe displacemd, and it canr. The isolat
nt orbit underlation
isolator is round-motiondeveloped in.15g. Clearlyame; the bethe displaced 5.1 cm (2ed.
ger displacement orbits n be assumedtors moved i
r
rather n 9 is n the y, for earing ement 2 in.),
ement were
d that in the

78
same direction and in phase. Since the distribution of the gravity load was assumed uniform for the whole isolation plane, the effect of different vertical loads on the bearings was not considered.
Based on results of the refined model developed in OpenSees to determine the effect of initial bearing stiffnesses on seismic response, some preliminary conclusions can be drawn. Some of the conclusions and findings associated with general effect of seismic isolation are not only for this specific comparison; they pertain to all the parameter studies conducted in this chapter and are summarized below:
1. Under design-level seismic loading considered, the isolator displacement is small for the archetype isolated PGSFR, and the effectiveness of seismic isolation is not pronounced, especially for the RCB.
2. The response of horizontal floor spectrum of the base-isolated case under the 0.3g PGA hazard is almost the same as the fixed-base case under 0.1g PGA hazard.
3. Horizontal floor spectra were largely reduced when using seismic isolation, especially for the high-frequency range compared to fixed-base case under 0.3g PGA hazard, even though the isolator deformation was small.
4. Vertical floor spectra responses were not reduced by using seismic isolation, and the response is not affected by the initial stiffness of the isolator.
5. The initial stiffness of the isolation affected the response of the isolated structure; a larger initial stiffness produced large floor response spectra and drift demand, but smaller bearing displacement demand.
6. The response reduction with base-isolation was much more significant for the AUX than for the RCB. The change of modal frequency of AUX further separated the upper plant frequency and isolation frequency. The change is due to the interaction of the RCB and base mat with the AUX.
7. Isolators at different locations behaved almost identically, and no torsion effect was observed in the base mat.
4.5.3 Results for Different Tiso
Based on the general conclusions outlined in the previous section regarding initial isolator stiffness, this section will focus on the difference in response when comparing the post-yield stiffness or period of the isolator. The three isolator periods considered were 2, 3, and 4 sec.
Responses of horizontal floor spectrum are shown in Figure 4.17. The amplitude of response is consistent with that obtained under different initial stiffnesses. First, as shown in Figure 4.17 for the first peak at around 2.5 sec on the spectrum, there is no shift of the location of the peak response among the different cases with different isolation periods; therefore, the effective period of the isolation system is not influenced by the post-yield stiffness and is dependent on the different initial stiffness. This conclusion is intuitive since the displacement of the isolator is small the initial stiffness contributes more to the response. Slight differences can be seen for the amplitude of the peak response, whereby a smaller post-yield period results in a larger response; however, the difference in the response of the floor spectrum is negligible,

79
especially for the high-frequency response. The different isolation period only affects the floor spectrum of the first peak and has no effect on the high-frequency response.
As demonstrated earlier regarding the amplification of the response from the base to the top, the scale comparing the fixed-base case and base-isolated case is similar for different isolation periods. The floor spectrum for the AUX when using seismic isolation resulted in an almost five-fold reduction; see Figure 4.18. It is clear in this figure that the peak response on the original fixed-base floor spectrum is suppressed using base isolation. This is especially true for the top floor response, where the isolated response is better than the fixed-base response under 0.1g PGA hazard; the performance in response to design-level ground motion is far superior when using seismic isolation. Despite the larger response in smaller frequency ranges because of the isolation period, most of the equipment is in the range larger than 1 Hz. Thus, the effectiveness of using base isolation is fairly good.
Because the vertical response spectrum is not dependent on the horizontal property of the bearing, it will not be discussed. This parametric study considered the properties for the horizontal behavior of the bearings; therefore, the vertical response acceleration spectrum is the same for all cases. Due to the vertical stiffness of the isolators, the floor spectrum was amplified slightly when using seismic isolation compared to the original fixed-base case.
The drift response is shown in Figure 4.19, which is almost identical to the drift response shown in Figure 4.13; thus, similar conclusions can be drawn. The effectiveness on reducing drift demand or shear demand (since the relation of shear and drift are the same in elastic range) is small for the RCB. The drift is almost the same when comparing the base-isolated case and fixed-base case for the RCB. For the AUX, the effect is much improved. The base-isolated cases under PGA 0.3g ground motion have drift demands even smaller than the fixed-base case under the 0.1g ground motion.
A comparison between the drift response of different post-yield stiffnesses or isolation period does not show much difference. The separation for different cases on the plot indicates larger isolation period results in a smaller drift response. The 3- and 4-sec responses are almost the same, which differs from the 2-sec case.

Figure 4.17 Mawm
Median horizond top floors
with different motion set an
ontal floor acs of the reactisolation pe
nd fixed-base
80
cceleration stor containm
eriod and fixee under PGA
spectrum forment buildinged-base case
A 0.1g motion
r first floor, fog. Base-isolae under PGAn set are com
ourth floor, ated cases A 0.3g NRC mpared.

Figure 4.18 Mflisfi
Median horizooors of the a
solation perioxed-base un
ontal floor acauxiliary builod and fixed
nder PGA 0.1
81
cceleration slding. Base-i-base case ug motion set
spectrum forisolated caseunder PGA 0t are compar
r first, third, aes with differ
0.3g NRC mored.
and top rent
otion set and

82
Next, bearing response is considered with respect to ground-motion 4, which is the largest ground motion considered in the set. The bearing hysteresis and displacement orbit is shown in Figure 4.20 and Figure 4.21. For ground-motion 4, bearing displacement around 25.4 cm (10 in.) is expected.
A comparison between the bearing response of different isolation periods demonstrates that the displacement demand is similar; however, the force demand is quite different. The isolator with 2-sec isolation period exhibited up to a 0.25g maximum horizontal force while the 3- and 4-sec isolation periods had around a 0.15g peak value, which is consistent with the drift responses for these three cases. Note that for the isolator with a 2-sec period, there was a large cycle recorded in the positive H1 direction. This may due to the interaction of bi-directional motions or the change of previous cycle response. A comparison between the corner bearing and the center bearing shows that the responses are identical; therefore, the movement of the whole floor mat is almost purely translational, with all the isolators moving together in the same phase.
Figure 4.22, which shows the top floor spectrum of the RCB subjected to ground-motion 4, indicates that the difference in isolator responses due to different post-yield stiffness is obvious when the isolator displacement is large. Comparing with Figure 4.17, where there is almost no difference in responses for different isolation periods, since the isolator displacement is fairly small. In Figure 4.22 the red line which indicates the response with isolation period as 2 secs is more separated from the other two cases. This indicates the larger displacement the bearing undergoes the more important the post-yield stiffness is on the response.
From simplified analysis results in chapter 3, the post-yield stiffness is an important parameter considered in design. However, in this case, the effect of isolation period has an unexpectedly small influence on the response because isolator displacement is small. Some key conclusions obtained from this section are summarized below:
1. In terms of the floor spectrum, the post-yield stiffness will affect the amplitude of the peak response at the isolation period. Larger periods will result in smaller responses. Variations between the post-yield stiffness did not influence the horizontal floor spectrum responses at high frequency.
2. The larger the isolator displacement, the greater the dependence will be on different isolation periods. With the small isolator displacement in this study, the dependence is weak.
3. In terms of AUX and RCB drift responses, smaller isolation periods will result in smaller drift responses. But since the overall drift demand is fairly small, the difference can be negligible.

Figu
re 4.19 Maau
Median maximnd auxiliary nd fixed-basnder PGA 0.
mum drift resbuilding. Ba
se case unde1g motion se
83
sponses for ase-isolated cer PGA 0.3g Net are compa
the reactor ccases with dNRC motion ared.
containmentdifferent isola
set and fixe
t building ation period d-base
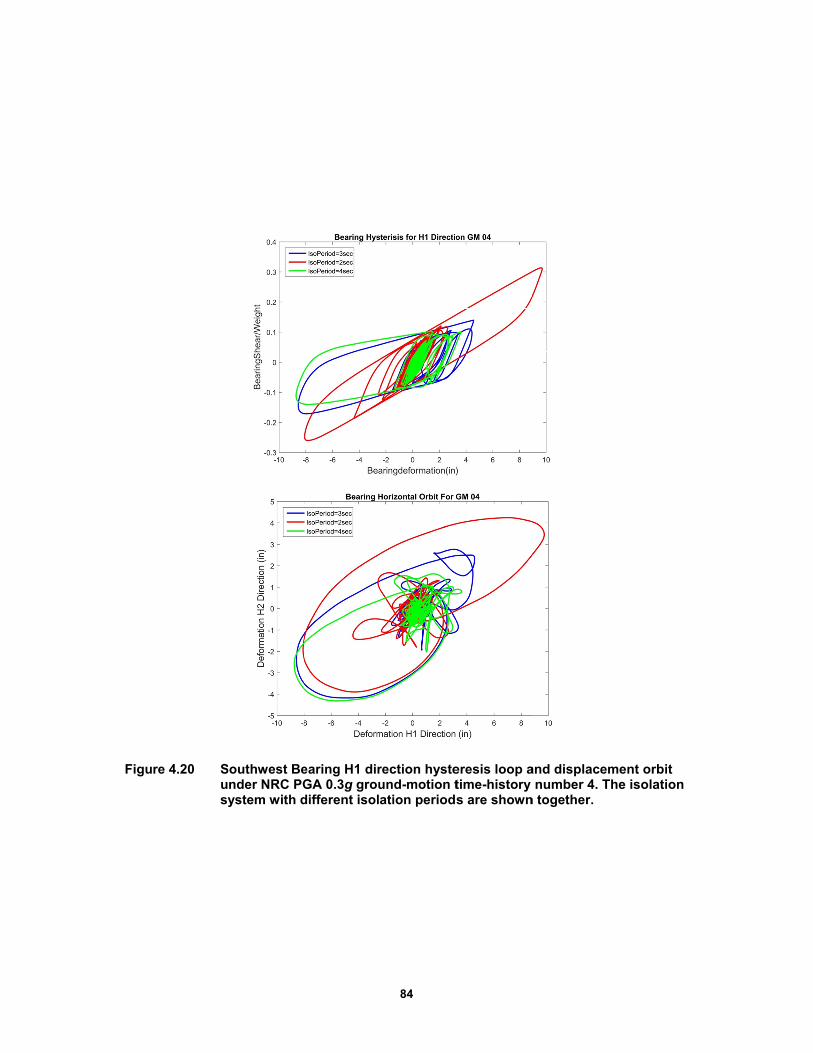
Figu
re 4.20 Susy
Southwest Bender NRC PGystem with d
earing H1 dirGA 0.3g groudifferent isola
84
rection hysteund-motion tation periods
eresis loop atime-history s are shown
and displacemnumber 4. T
n together.
ment orbit The isolation

Figure 4.21 Susy
Southwest Bender NRC PGystem with d
earing H1 dirGA 0.3g groudifferent isola
85
rection hysteund motion tation periods
eresis loop atime-history s are shown
and displacemnumber 4. T
n together.
ment orbit The isolation

Figu
4.5.4 R
Finally, wforces arebearing ithat the displacem
Ffirst peakyielding the peak bearing, t
Wcorresponfrequencydifferent discussed
Inamplitudfrequencyamplitudof these tforce. Thmode, budifferent
re 4.22 Hcisb
Results for
we investigae set as 5%, is small, Fy conclusions ment demand
irst, we studk of the flooforces affecof the isolatthe peak is a
When the ynds to the iy remain unyield force
d previously
n previous sdes of highery content. W
de differencetwo paramet
herefore, withut the responinitial stiffn
Horizontal floontainment b
solation perioase under 0.
Different F
ate the effec10%, 15%, is expected reached in
d of the bear
dy the floor or spectrum ct the behavition mode isa factor of 3
yield forces isolation monchanged. Th cases. The and is differ
section, wher frequency
While there ie is observedters has littlehout changin
nse differs signesses, which
oor acceleratbuilding is sod and fixed.1g is compa
Fy
ct of differeand 20% of to be the mChapter 3 d
ring and alm
spectrum shfor differen
ior of the isos well separahigher than
become laode on floorhe second p
effect is sirent from th
en comparingcontents on
is a shift of d. For the twe effect on thng the stiffngnificantly ih can be seen
86
ion spectrumhown. Base--base case u
ared. The res
ent yield forf the weight omost importa
determined most no effect
hown in Figunt yielding foolator signifated. If the ythe case for
arger, the r spectrum ieak on the rimilar to thee responses
g responses n the floor sf dominant frwo cases con
he stiffness ess, the peakin the peak an in Figure 4
m for top floo-isolated casunder 0.3g Nsponse is for
rces on bearon the bearin
ant parametethat that Fy
t on force de
ure 4.23. Noforces of theficantly in thyield force isa yield forc
amplitude oincreases. Hresponse spee response oof different
under diffespectrum ar
frequency ofnsidering diffof the systemk location is amplitude in 4.23 and Fig
or of the reacses with diffe
NRC motion sr ground-mot
ring performng. Since theer influenciny has only aemand.
ote the great e bearing. Sihe small disps equal to 20e equal to 5%
of the firstHowever, resectrum collaof different initial stiffn
erent isolatorre affected rf the low freferent Tiso anm but does anot changedcontrast to t
gure 4.17.
ctor erent set and fixedtion 4.
mance. The e displaceme
ng response. a minor effe
difference iince the diffplacement r0% weight o%.
t peak respsponses at hapses togetheisolation pe
ness of bearin
r initial stiffrather than lequency peand Fy, the chaffect the isod for the isolthe response
d
yield ent of Note
ect on
in the ferent range, on the
ponse higher er for eriods ng.
fness, lower
ak, no hange olator lation e with

87
An investigation of second peak responses on the floor spectrum reveals that for all cases, the second peak location (corresponding to the model frequency of the RCB in the isolated system) remained unchanged. However, since a different initial stiffness shifts the location of the first peak, with a larger initial stiffness, the distance between the first peak and second peak is closer, i.e., the isolation period is not well separated for the original fixed-base period. This causes base isolation to be ineffective, and the response of the original fixed-base mode remains higher. The amplitude of floor spectrum for those cases with different initial stiffnesses for the second peak is much larger for a larger initial stiffness compared to smaller one.
Variations of Tiso and Fy did not affect the original RCB mode, nor did they shift the isolation period. Therefore, the response other than the isolation mode remained unchanged. The only differences for these cases are the amplitude in the floor response spectra at the isolation mode. For the AUX, the response is shown in Figure 4.24 and similar conclusions can be drawn.
Because the peak of the fixed-base AUX mode on floor spectrums is suppressed, the peak response of the floor spectrum is controlled by the isolation mode. For the RCB, the peak response of floor spectrum is controlled by the peak of the RCB mode, which lies in the frequency range of most of the equipment. In the case of increasing floor levels, responses at higher frequency range is increasing since the upper-structure modes starts to contribute to responses. The vertical floor acceleration spectrum will not be discussed again since changing isolator horizontal design parameters do not affect vertical responses.
The drift response along the height of the RCB and the AUX is shown in Figure 4.25. In general, the amplitude of drift response is similar for different cases regardless of the initial stiffness, post-yield period, or the yield force of the bearing. The relative amplitude relation between the base-isolated cases and the two fixed-base cases are similar.
For different yield forces of the bearing, a smaller Fy results in smaller drifts since drift is mostly affected by the isolator force. When the displacement is small, the bearing yield force is the most effective way to change the isolator force. Considering the small amplitude of the drift responses, the response may already be controlled through other design considerations.
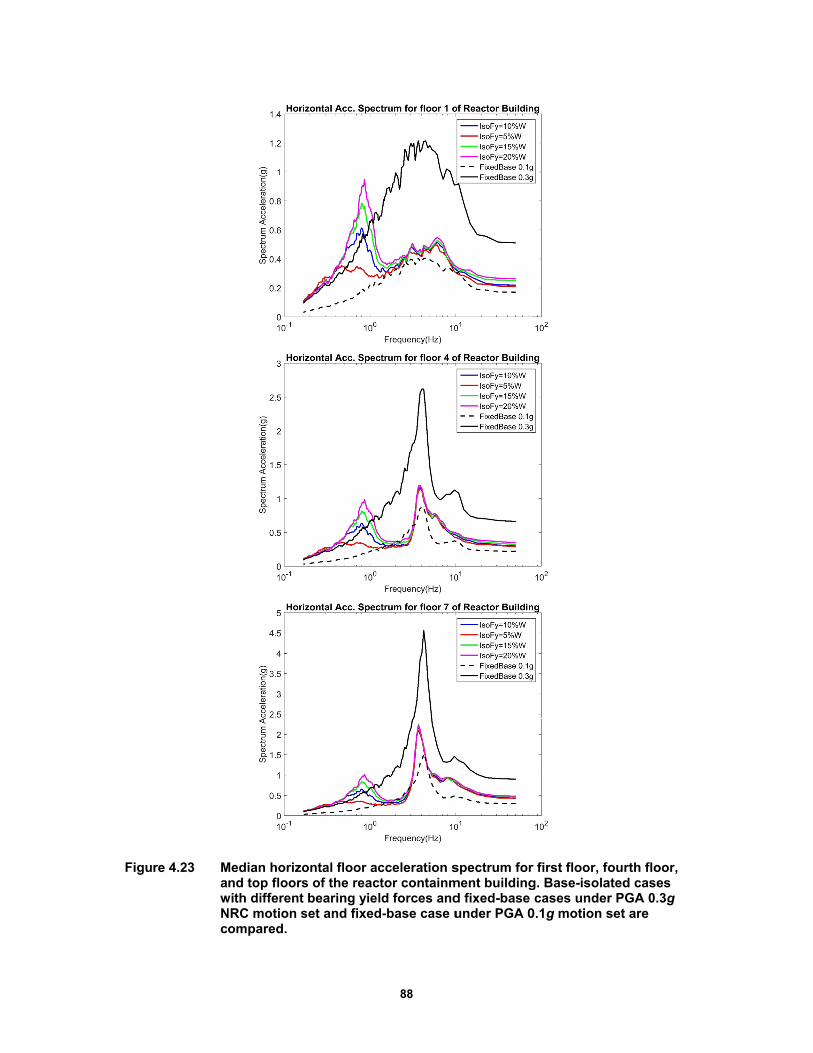
Figure 4.23 MawNc
Median horizond top floors
with different NRC motion s
ompared.
ontal floor acs of the reactbearing yiel
set and fixed
88
cceleration stor containmd forces and
d-base case u
spectrum forment buildingd fixed-base under PGA 0
r first floor, fog. Base-isolacases under
0.1g motion s
ourth floor, ated cases r PGA 0.3g set are
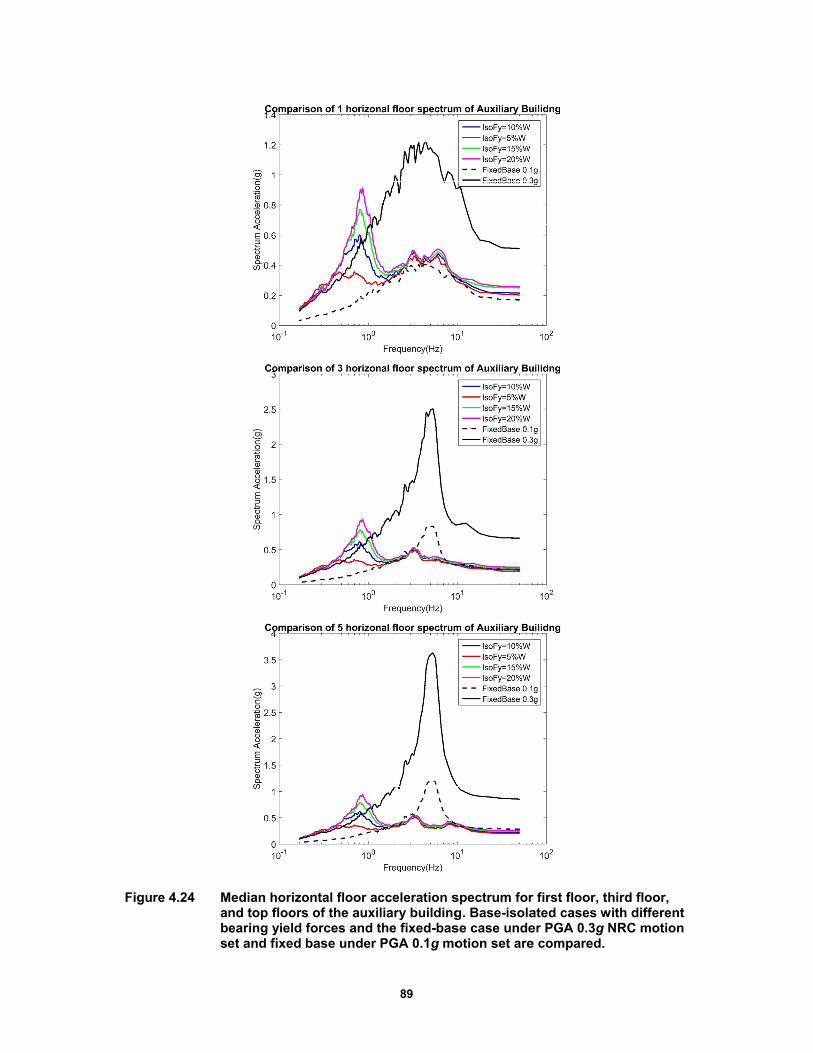
Figure 4.24 Mabse
Median horizond top floorsearing yield et and fixed
ontal floor acs of the auxilforces and tbase under
89
cceleration sliary buildingthe fixed-basPGA 0.1g mo
spectrum forg. Base-isolase case undeotion set are
r first floor, thated cases wer PGA 0.3g Ne compared.
hird floor, with different NRC motion

Figu
TFigure 4these figuwill resutime histothe beariunderwenmotion ti
Fhorizontabearing iFigure 4yielding
re 4.25 Maau
The response.27 togetherures is groun
ult in a largeory, the threing remainednt a large diime history.
rom the dispal responsesis not obviou.26 and Figstrengths of
Median maximuxiliary buildnd fixed-basnder PGA 0.
e of the cornr with the dind-motion 1er displacemee bearings wd elastic unsplacement
placement ors are similaus, but sligh
gure 4.27. Af the bearing
mum drift resding. Base-isse case unde1g motion se
er bearing aisplacement 9. Clearly, f
ment responswith the largeder several for one cycl
rbit of the bear. The diffehtly larger diAlthough theg, those case
90
sponses for solated caseer PGA 0.3g Net are compa
and the centeorbit. The
from the hysse of the beaest yield forccycles. The
le, which ma
earing, the oerence betwisplacementse post-yield es with high
reactor contes with differeNRC motion ared.
er bearings aground mot
steresis respoaring. For thces had muc
e bearing coay correspon
orbit is almosween the cors are observstiffness is
her bearing y
tainment buient bearing yset and fixe
are shown intion used foronses, the smhis particula
ch smaller diorrespondingnd to the pul
st 45, indicarner bearing
ved in the cokept the sa
yielding forc
lding and yield forces d-base case
n Figure 4.26r the responmaller yield ar ground-misplacementsg to a 5% wlse in the gro
ating that theg and the corner bearingame for diffces (indicate
6 and nse in force
motion s, and
weight ound-
e two center g, see ferent ed by

the blue, a lower experiencpost-yieleffect of the BoucInterestinpost-yiel
Figu
purple, and yielding forced such smding stiffnedifferent be
c-Wen modengly, those bding stiffnes
re 4.26 CNsy
green lines)rce (indicate
mall deformass. Although
earing strengel used, the
bearings actuss. This phen
Center BearinNRC PGA 0.3g
ystem with d
) show a muced by the reations that thh this part gths with thee secant stifually show anomenon als
ng H1 directiog ground-mo
different yield
91
ch higher seed line). Thhey lie in theof the parame same initiaffness will ba horizontal sso occurs in t
on hysteresiotion time-hid strengths a
ecant stiffneshose bearinge transition rmetric studyal and post-ybe different stiffness behthe aircraft-i
is loop and distory numbeare shown to
ss comparinggs with largerange from iy aimed at yielding stif
under smahavior betweimpact analy
displacemener 19. The isoogether.
g to the casee yielding finitial stiffneinvestigatin
ffness, becaull displacem
een the initiaysis in Chapt
nt orbit underolation
e with forces ess to g the
use of ments. al and ter 5.
r

Figu
Oforces of
re 4.27 Suis
Observations f bearing are
For thdifferethe isoaffect differe
Southwest Bender NRC PG
solation syst
and concluas follows:
he response oent bearing yolation modeis larger tha
ent initial sti
earing H1 dirGA 0.3g groutem with diffe
usions draw
of horizontalyielding force. A larger yan the other tiffness and i
92
rection hysteund-motion terent yield s
wn from the
l floor pseudces will onlyyield force retwo parametsolation peri
eresis loop atime-history trengths are
parametric
do-acceleratiy affect the results in a lartric study caiods.
and displacemnumber 19.
e shown toge
study on d
ion spectrumresponse amprger respons
ases when co
ment orbit The
ether.
different yie
m, plitude at se. The omparing
elding

93
Different bearing yield forces will not affect the high-frequency responses on the horizontal floor spectrum.
The drift response is similar when using isolators with different Fy. With a larger Fy, the drift response will be slightly larger.
The bearing displacement demand will be much smaller when a larger Fy is used.
4.6 CONCLUSION AND SUMMARY
This chapter described the results of a parametric study for different bearing properties including initial stiffness, post-yield period, and yielding force using the refined model developed in OpenSees. Floor acceleration spectrum, drift response, and bearing response were investigated to determine the sensitivity of the response to each of the parameters and the efficiency of the isolation system. Some key conclusions were drawn:
Under the ground-motion level of 0.1g PGA, the fixed-base model response was similar to an isolated model evaluated under the ground-motion level of 0.3g PGA. This means the design-level ground motion can be increased by a factor of 3 using the isolation system investigated. However, the isolation system requires a site-specific design, and an isolated NPP designed for a higher PGA cannot be indiscriminately relocated since the isolation system must be appropriately tailored.
The AUX received the most significant benefit from seismic isolation as observed through floor response spectra. The peak value was reduced by a factor of 2 on the top of the upper mat for both the RCB and AUX. On the top of the AUX, the floor spectrum peak was reduced by a factor of 8, and the RCB response was reduced by a factor of 5.
Vertical acceleration responses were amplified when seismic isolation was used as compared to the fixed-base model because of the introduced vertical flexibility of the bearing. Once isolated, the original fixed-base mode of the AUX was shifted by interaction with the RCB and isolation system. The original peak in the floor spectrum of the fixed-base AUX was suppressed as the isolated mode became predominant. Initial stiffness of the bearing had an impact on the horizontal floor spectrum. Larger initial stiffness produced a larger response and excited the RCB response in the upper floor. Slightly larger drift and smaller bearing displacement response was expected for bearings with a larger initial stiffness.
The post-yield period has less influence on the response than other parameters. Bearing yield force had a significant impact on the floor response spectrum; a larger yield force resulted in a larger response but much smaller bearing displacement demand. The drift response for both the RCB and AUX were small, which should benefit the elastic design of these structures.
Overall, a seismically isolated structure will perform much better compared to a fixed-base structure. For the isolated PGSFR considered in this study, because the displacement demand was small under the design-level earthquake, the effectiveness of seismic isolation was not as beneficial as a seismic isolation system with reduced yield force and larger displacement demand.

94
95
5 DYNAMIC ANALYSIS OF A SEISMICALLY ISOLATED PGSFR SUBJECTED TO AIRCRAFT IMPACT
5.1 INTRODUCTION
It is now generally accepted that the effects of deliberate crashes of large commercial aircraft should be considered in the design of critical facilities such as NPPs. Most of the current regulatory guides for the design of NPPs now incorporate analysis and design requirements to assess or mitigate the effects of a large commercial aircraft impact.
For instance, the U.S. NRC stipulates in Title 10 CFR Part 50.150 that an applicant for a license to construct and operate a NPP
“…shall perform a design-specific assessment of the effects on the facility of the impact of a large, commercial aircraft. Using realistic analyses, the applicant shall identify and incorporate into the design those design features and functional capabilities to show that, with reduced use of operator actions:
The reactor core remains cooled, or the containment remains intact
Spent fuel cooling or spent fuel pool integrity is maintained”
The U.S. NRC further stipulates that the assessment “must be based on the beyond-design-basis impact of a large, commercial aircraft used for long-distance flights in the United States, with aviation fuel loading typically used in such flights, and an impact speed and angle of impact considering the ability of both experienced and inexperienced pilots to control a large, commercial aircraft at the low altitude representative of a NPP’s low profile.”
The Nuclear Energy Institute has also published a methodology for evaluation of aircraft impact on new NPPs [NIE 2009]. Its recommendations differ, and, in some cases, are less conservative than mandated by the U.S. NRC.
For a traditional fixed-base design, considerable research and development has been done to strengthen and detail the containment structure and other critical structural features of the nuclear island necessary to achieve these goals [Riera 1968, Riera 1980, Riera 1982, Chadmail 1985; Sugano et al. 1993, Arros and Doumbalski 2007, Wilt and Chowdhury 2011, Lee et al. 2013, and Sadique et al. 2013]. These have had an effect on plant design, including strengthening and toughening of the containment structure and other portions of the nuclear island to prevent

96
local penetration or perforation, separation of safety critical internal systems and components from structural elements that might undergo large deformations during aircraft impact, and the protection of systems and components from the high accelerations that might be associated with impact. Other recent studies have focused on special issues of analysis including the accelerations imposed on components due to impact [Andronov et al. 2010], and the effect of different refinements to the numerical modeling of the response to aircraft impact [Bignon and Riera 1980; Abbas et al. 1996; and Siefert and Henkel 2014]. A recent comprehensive review of analyses and tests related to aircraft impact, and computer programs used in such analyses is available [Jiang and Chorzepa 2014].
With the consideration of seismic isolation for nuclear facilities, attention has begun to focus on the effect of aircraft impact on isolated facilities [Kulak and Yoo 2003; Blandford et al. 2009; and Noh and Kim 2012]. Kulak and Yoo [2003] considered a simple single-degree-of-freedom model of a supported rigid mass on HDRBs intended to be representative of the horizontal isolation systems used for the STAR-LM or KALIMER fast reactors. The dampers were modeled as equivalent linear springs, giving the plant a frequency of 0.5 Hz and an equivalent viscous damping ratio of 12%. Aircraft impacts included a Boeing-720 traveling at 100 m/sec and a Boeing-747 traveling at 150 m/sec. The impact loading on the plant was obtained by simplifying results derived using the methodology suggested by Riera [1968]. The results showed that even for the heavier and faster Boeing-747, the bearing displacements were limited to about 29 cm (11.4 in.), which corresponds to a shear strain of about 90% for the isolation bearings considered. This was very similar to the shear strains expected during the SSE and well within the deformation capacity of the bearing (about 300%).
Blandford et al. [2009] investigated the case of a simplified elastic two-degree-of-freedom lumped mass stick model supported on a base-isolated raft foundation. The facility was intended to be representative of a relatively light small modular reactor. The frequency of the plant in its fixed-base configuration was set to 3 Hz. Total isolated weights ranging from 20,000 to 100,000 metric tons (44,000 to 220,000 kips) were considered. The properties of the bearings were held fixed in a way that a plant having a total weight of 50,000 metric tons (110,000 kips) would have an effective isolated frequency of 0.5 sec. Considering the variation of plant weights, the overall effective frequencies of the plant were 0.3, 0.5 and 0.75 Hz. The bearings in this study were assumed to have an effective viscous damping ratio of 10%. The superstructure was assumed to have 5% viscous damping. Aircrafts considered included a Boeing-747-400 weighing 397 metric tons (875 kips) with an impact velocity of 201 m/sec and a Boeing-737-900 weighing 85.3 metric tons (188 kips) with a velocity of 180 m/sec. Principles of dynamic similitude were used to modify a force loading history for these planes based on histories developed by Riera [1968] for a smaller and lighter Boeing-707-320. The findings of this study indicated that high accelerations, large internal forces, and high bearing lateral displacements would develop for light plants. For heavier plants, the accelerations and bearing displacements were more reasonable even for the faster and heavier Boeing-747. Since this study focused on light-weight small modular reactors, the study then focused on the design of external latticed frames that were uncoupled from the main plant as a means of avoiding aircraft impact.
Noh and Kim [2012] analyzed a detailed FE model of a fictitious pressurized water RCB considering fixed-base and isolated conditions, subjected to an impact by a Boeing-767-400. They also utilized the force response-history analysis method developed by Riera. The FE model incorporated yielding of the concrete containment. For conservatism, the authors assumed that

97
the 400 isolation bearings had no damping and had a stiffness that resulted in a fundamental frequency for the isolated NPP of 0.5 Hz. They indicated that the local effect (strains) of the aircraft impact on the wall at the impact location was nearly the same for the cases with and without the isolation system.
Thus, it appears that although for heavier NPPs, the global dynamic response may be of a similar order of magnitude as considered in seismic analysis, the studies to date that consider aircraft impact have been limited in scope. The structural models have been complex, but the superstructure has been represented by very simple rigid body or reduced degree-of-freedom elastic stick models. In addition, aircraft impact where the direction of impact does not go through the center-of-mass of the structure may induce torsional response of the isolated plant that can increase isolator displacement demands at the corners of the raft foundation.
This chapter modifies the refined 3D lumped-mass stick model of the PGSFR developed for seismic response analysis in Chapter 4 to simulate behavior under aircraft impact. The response for two modern commercial planes impacting the PGSFR at different locations are investigated for fixed-base and isolated plant conditions. A parametric study is undertaken to assess the effect of effective isolation period, initial isolator stiffness and isolator strength on bearing displacements, hysteresis loops, floor accelerations, floor response spectra, story drifts, and floor rotations. The response is examined for the AUX as well as the RCB, considering different aircraft types and impact locations. In all cases, the structures above the isolation plane are assumed to remain elastic, and the flexibility and energy-dissipation capabilities of the supporting soil are not considered.
5.2 STUDY BACKGROUND
5.2.1 Force Loading Function for Aircraft Impact
The impulse load due to an aircraft impacting a structure is a complicated function of (a) the mass, stiffness, and strength distribution along the aircraft, its velocity at impact; (b) the material, strength, and detailing of the structure at the point of impact. The global stiffness of the structure and its dynamic interaction with the aircraft during impact are also expected to influence response. Analyses to account for these and other factors are possible but time consuming to model and execute, and require detailed information about the plane and structure that are typically not yet available during the schematic design process. Thus, for these preliminary studies, a simplified force loading function initially proposed by Riera [1968] will be used.
The loading function proposed by Riera is widely used in the analysis of aircraft impact; however, the loading function developed by Riera only considers the impact of a Boeing-707-320, which was the largest commercial plane at the time of publication. Current planes, such as a Boeing-747, 767, or 777, are heavier, wider, and longer than the Boeing-707-320 that Riera considered. Furthermore, Riera’s loading function is based on an impact velocity corresponding to a controlled takeoff or landing condition, rather than a malicious high-speed collision. As a result, velocities corresponding to cruising or higher speeds should be considered. Blandford et al. [2009] demonstrated that concepts of dynamic similitude could be used to adjust Riera’s linearized force loading functions to correspond to planes of different length and mass, and traveling at different velocities.

Chistories Boeing-7when impfunction relative aexerted bthe 747-4representplanes trthese impof an isoother airc
Taddition perimeteradditiona
Figu
Considering tfor a Boei
737-900 is cpact occurs.for a Boein
amplitudes oby the Boein400 represents a lower boraveling fastpact force lo
olated PGSFcraft types.
The analysis of rigid linr of the buial recorders t
re 5.1 FhTB
the scaling mng-737-900
cruising at 1The resultin
ng-707-320 iof loading inng-747 is mnts an upperound. Higherer (or slowe
oading functFR and provi
model usednks extendinildings wherto help study
orce loadingistories for ahe forcing fu
Blandford et a
method propand Boeing
80 m/sec anng force timin Figure 5.n this figure,
much larger tr bound of imr and lower er). Howevetions allow fide insight i
d here is idenng from the re the planey the dynam
g functions foa Boeing-747unction for aal. [2009]).
98
posed by Blag-747-400 wnd that the Be histories a1 (from Bla, it can be ohan those fompacts consimpact force
er, for the pufor investigainto the nee
ntical to thatlumped ma
es will be aic response o
or aircraft im7-400 and Boa Boeing-707
andford et awere develoBoeing-747-are shown aloandford et alobserved thaor the Boeinidered in thies can be imurpose of thation of the bd for more
at developed ass stick moassumed to of the PGSF
mpact analysoeing-737-907-320 is show
al. [2009], fooped. It is a400 is cruisong with thel. [2009]). B
at the peak fong-737 or Bis study, and
magined for hhis preliminabasic aspectrefined anal
in Chapter odels to theimpact, and
FR during air
sis. Impact lo0 are used in
wn for referen
orce loadingassumed thasing at 201 me original loa
By comparinforce and imoeing-707. Td the Boeingheavier (or liary investigats of the resplyses consid
4, except foe location ond the additiorcraft impac
oading n this study. nce (after
g time at the m/sec ading
ng the mpulse
Thus, g-737 ighter) ation, ponse dering
or the n the on of t.

99
5.3 AIRCRAFT IMPACT CASES
The study conducted in this chapter considers the following aircraft impact loading scenarios:
Two different aircrafts
Three different locations of impact
For each loading scenario, the fixed-base and seismically isolated structures were analyzed. For the isolated PGSFR, the study includes nine different isolator characteristics, due to variation of the following bearing parameters:
Initial isolator stiffness
Post-yield isolator tangent stiffness
Isolator strength at initial yield
More information on these variations is presented below. In the following discussion, “scenario” is used to describe the aircraft loading condition, and “case” is used to represent a specific structure with specific parameters subjected to a specific loading scenario.
5.3.1 Impact Force Loading Scenarios
As discussed above, the two loading functions considered in this report are shown in Figure 5.1. In principle, the location of impact can be anywhere on the periphery of the plant. Furthermore, impact need not occur with a path perpendicular to the contacting surface. For these studies, it was assumed that impact occurred perpendicular to the surface on which impact occurs. This is consistent with the assumptions used by Riera to derive the force functions.
Three locations were selected for the aircraft-impact analysis; all of them occurring on the AUX as it has a greater exposed surface. Because of the layout and geometry of the different building components of the PGSFR, it is very difficult for an airplane to impact the RCB directly. For the fixed-base models, the perfect rigidity of the supporting soil means that the reactor containment structure will not vibrate as a result of the impact: only the auxiliary structure will move in this scenario. Both will move in the base-isolated case, as they are supported on the common raft foundation on top of the isolation system.
The three impact locations selected were at mid-height of the AUX, i.e., about 25 m (82 ft) above ground. The impact sites are shown in Figure 5.2. In the traverse direction, the structure is relatively symmetric; therefore, impact along longitudinal direction (H1) is imposed along the central axis of the building. This condition is not expected to induce significant torsional response. Two additional impacts are oriented in the H2 (traverse) direction. The RCB is not symmetrically placed within the building in longitudinal direction. As such, an impact by a plane flying in the global H2 (traverse) direction is likely to induce torsion about a vertical axis. To investigate this, two impact locations were considered; see Figure 5.2 These are roughly at the one-third point of the building.
For all three impact-loading locations, both planes were considered. Therefore, six different aircraft impact loading scenarios were analyzed in this study. For these six scenarios,

several vnext.
Figu
5.3.2 P
For eachseismicalisolator cbearing systematlocation a
variations of
re 5.2 LTisa
Parametric
h of the baslly isolated characteristicinitial stiffically variedare listed be
Impac
Impac
Impac
Impac
Impac
Impac
f bearing pr
ocation and wo types of
s along the lolong the tran
Study Cas
ic impact lostructure w
cs was consifness, post-yd for each low:
ct Scenario 1
ct Scenario 2
ct Scenario 3
ct Scenario 4
ct Scenario 5
ct Scenario 5
roperties wer
direction coaircraft wereongitudinal ansverse axis
ses
oading scenawere analyze
idered. Similyield tangenimpact scen
1: Loading lo
2: Loading lo
3: Loading lo
4: Loading lo
5: Loading lo
5: Loading lo
100
re considere
onsidered fore consideredaxis of the st.
arios describd. For the slar to the annt stiffnessnario. The
ocation 1 for
ocation 2 for
ocation 3 for
ocation 1 for
ocation 2 for
ocation 3 for
ed for the is
r the impact d for each loctructure, and
bed above, seismically
nalyses discu, and initiasix combin
r Boeing-737
r Boeing-737
r Boeing-737
r Boeing-747
r Boeing-747
r Boeing-747
solated PGS
loading in thcation. The Hd the H2 dire
the fixed-baisolated PG
ussed in Chapal yield fo
nations of p
7
7
7
7
7
7
SFR as desc
his study. H1 direction ction is
ase structureGSFR, a rang
pters 3 and 4orce levels plane and im
cribed
e and ge of 4, the were
mpact

101
The details of the parametric study cases are shown in Table 5.1. The values used for each of the bearing properties are the same as previously used in Chapters 3 and 4 for the seismic evaluation of the PGSFR.
Table 5.1 Summary of analysis cases and loading scenarios considered in the parametric study.
Structures AIA loading scenarios Initial
stiffness (Kinitial)
Isolation period (Tiso)
Bearing yield force (Fy)
Primary isolator
parameter considered
Fixed Base 3 locations,
2 planes each NA NA NA NA
Base Isolated
3 locations, 2 planes each
5 Kpostyield 3 sec 10% W
Kinitial 10 Kpostyield 3 sec 10% W
100 Kpostyield 3 sec 10% W
10 Kpostyield 2 sec 10% W
Tiso 10 Kpostyield 3 sec 10% W
10 Kpostyield 4 sec 10% W
10 Kpostyield 3 sec 5% W
Fy 10 Kpostyield 3 sec 10% W
10 Kpostyield 3 sec 15% W
10 Kpostyield 3 sec 20% W
5.4 ANALYSIS RESULTS AND DISCUSSION
Similar to the analysis results presented in Chapter 4, results in terms of the three parameters
(Kinitial, Tiso, and Fy) are presented. For each key bearing parameter, results are discussed for the various loading scenarios as well as for the fixed-base cases. Since the aircraft impacts are either in the H1 or H2 directions, the response results are evaluated separately in the H1 and H2 directions. Response quantities presented include:
1. Floor accelerations and floor response spectra in the AUX and RCB
2. Maximum drift demands in the AUX and RCB
3. The peak angle of rotation about a vertical axis for each floor for the AUX and RCB
4. Bearing displacement demands
5. Bearing hysteresis loops for individual bearings at the corners of the base mat.
102
5.4.1 Responses Considering Different Kinitial
Responses of the study on different bearing initial stiffness are discussed next. The values considered for initial stiffness are summarized in Table 5.1. Tiso and Fy were kept constant for all of the cases presented in this section.
Note that the displacement demands on the isolation system were quite small for this scenario (see Section 5.4.4.1); none of the bearings reached a shear force equal to the nominal Fy value, and some only reached half or less of this value. Nonetheless, the use of Bouc–Wen hysteretic models for the bearings resulted in signification nonlinear hysteretic behavior even for low-amplitude excursions. However, for these low levels of response, the behavior was dominated by the initial “elastic” loading stiffness of the bearings. Thus, the value of Kinitial had a significant influence on the behavior of the PGSFR (and other loading scenarios); note that the behavior of the Bouc–Wen hysteretic models may not be well calibrated to actual bearing properties for this level of excitation, and the model has several well-known difficulties (e.g., ratcheting under asymmetric loading conditions) in simulating cyclic behavior in the nominally elastic range.
5.4.1.1 Response of Auxiliary Building: Scenario 1
The first loading scenario considered was for the Boeing-737 impacting the AUX at location 1, on the left side of the building in the H2 direction; see Figure 5.2. Because the loading direction was in the H2 direction, torsional response was expected. Results show that the acceleration response in the H1 direction was insignificant. The peak pseudo-acceleration in the horizontal floor spectrum at the fifth floor of the AUX, which is the floor level at which impact occurred, was only 4 10-5g; see Figure 5.3. Similar results were observed for all other Scenario 1 loading cases. As a result, only results parallel to the loading direction will be presented below.
The corresponding floor spectra for the AUX in the H2 direction is shown in Figure 5.4 for the second, fifth, and sixth (top) floors. Comparing the response spectra in Figure 5.4 and the peak total acceleration responses over the height in Figure 5.5, the fixed-base case had total accelerations that tended to increase linearly with elevation. For the base-isolated case, the peak total accelerations were similar to the fixed-base case. Figure 5.5 shows that the case with a very stiff initial stiffness resulted in somewhat lower floor accelerations in the upper levels. Since the isolation system moved during the impact, the lower floors had higher accelerations than did the fixed-base case.
The portion of the plant above the isolation plane responded nearly as a rigid body, and all floors had nearly the same peak floor total acceleration. Again, the case with a very stiff initial stiffness had somewhat lower accelerations; for the isolated model, the response was almost uniform along the height.
From Figure 5.4, it can be seen that pseudo-accelerations in the high-frequency range followed the trend shown by the peak floor total acceleration. Between 5–10 Hz, the isolated systems had higher pseudo-accelerations at the second floor than the fixed-base structure, especially in the case of the bearings with very high initial stiffness values. This is again likely due to the nearly rigid body movement of the isolated structure; it is expected that the lower floors will move more than in the fixed-base case. At the fifth and sixth floors, the isolated systems all tended to have similar spectral pseudo-acceleration values between 5–10 Hz; these
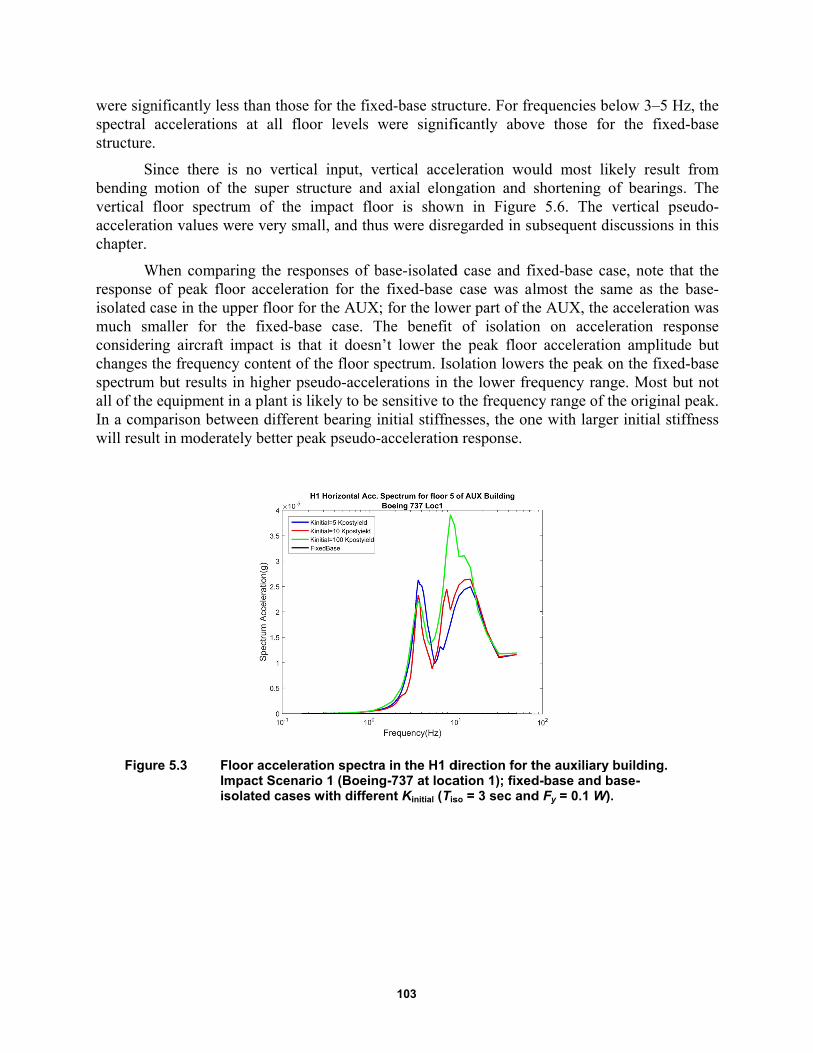
were signspectral structure
Sbending vertical acceleratchapter.
Wresponse isolated cmuch smconsiderichanges tspectrumall of theIn a comwill resul
Figu
nificantly lesacceleration.
ince there imotion of tfloor spectr
tion values w
When compaof peak flo
case in the umaller for ting aircraft the frequenc
m but results e equipment
mparison betwlt in modera
re 5.3 FImis
ss than thosens at all flo
is no verticthe super strum of the were very sm
aring the resoor acceleratupper floor fothe fixed-baimpact is th
cy content oin higher p
in a plant is ween differetely better p
loor accelerampact Scenasolated cases
e for the fixeoor levels w
cal input, vetructure andimpact flo
mall, and thu
sponses of btion for the
for the AUX;ase case. That it doesnf the floor spseudo-accelelikely to be
ent bearing ieak pseudo-
ation spectraario 1 (Boeings with differe
103
ed-base strucwere signifi
ertical acceld axial elongor is shown
us were disre
base-isolatedfixed-base
; for the lowThe benefit n’t lower thepectrum. Isoerations in tsensitive to
initial stiffne-acceleration
a in the H1 dg-737 at locaent Kinitial (Tis
cture. For fricantly abov
leration wougation and n in Figureegarded in su
d case and ficase was al
wer part of thof isolation
e peak floorolation lowethe lower frethe frequenc
esses, the onn response.
direction for tation 1); fixedso = 3 sec and
requencies bve those fo
uld most lishortening
e 5.6. The ubsequent d
fixed-base calmost the sa
he AUX, the n on accelr acceleratiors the peak oequency rancy range of tne with large
the auxiliaryd-base and bd Fy = 0.1 W)
elow 3–5 Hzor the fixed
kely result of bearings.vertical pse
discussions in
ase, note thaame as the accelerationleration respon amplitudon the fixed
nge. Most buthe original er initial stif
y building. base-).
z, the d-base
from . The eudo-n this
at the base-n was ponse
de but d-base ut not peak. ffness

Figure 5.4 FImis
.
loor accelerampact Scenasolated cases
ation spectraario 1 (Boeings with differe
104
a in the H2 dg-737 at locaent Kinitial (Tis
direction for tation 1); fixedso = 3 sec and
the auxiliaryd-base and bd Fy = 0.1 W)
y building. base-).

Figu
Figu
.
re 5.5 Plo3
re 5.6 V1 d
.
Peak floor accocation 1); fix
sec and Fy =
Vertical floor (Boeing-737ifferent Kinitia
celerations axed-base and= 0.1 W).
acceleration7 at location al (Tiso = 3 sec
105
along heightd base-isola
n spectra for 1); fixed-basc and Fy = 0.
. Impact Sceated cases w
auxiliary buse and base-1 W).
enario 1 (Boeith different
uilding. Impac-isolated cas
eing-737 at Kinitial (Tiso =
ct Scenario ses with

106
The peak story drift response for Impact Scenario 1 is shown in Figure 5.7. As shown in the plot, the amplitude of the maximum drift response is very small: on the order of 0.01% for all cases considered. In a comparison between the base-isolated case and the fixed-base case, the base-isolated case had significantly smaller drift, especially in the lower stories. Note that drift response of the fixed-base case was larger at the lower part of the building and smaller on the top, whereas for the base-isolated cases, the lower part of the building had smaller drift responses. The difference of the drift shape was due to the movement of the base mat. A smaller initial stiffness had a better drift response when comparing different base-isolated cases. This trend is different compared to floor accelerations and floor response spectra, where the isolated systems respond more severely in the lower stories.
Since the loading for this scenario is eccentric with respect to the center-of- stiffness of the structure, the rotation of each floor and the twist within the AUX were investigated. The total rotation angle of each floor is shown in Figure 5.8. The rotation of each floor increased continuously with elevation for the fixed-base building, i.e., the floor rotation was larger on the top; however, the amplitude of twisting was small, with the maximum rotation at the top being less than 0.002.
In comparison, the base-isolated cases had much higher floor rotation, e.g., the total rotation of the roof for the bearings with the smallest Kinitial value was nearly 0.05; however, the rotation of the base mat was nearly the same as that at the top floor for the base-isolated cases. This is because of the significant rotation of base mat about the vertical axis. Because the fixed-base model cannot rotate at the base and the buildings are torsionally stiff, only small twisting occurs. For the base-isolated cases, all the floors above the base have nearly the same rotation; Figure 5.8. Thus, the AUX and the base mat rotate as a nearly rigid block. As a result, the relative twist that occurred within the elevated portion of the AUX was smaller than that experienced by the fixed-base structure.
The rotation reached 0.03 for the baseline model with Kinitial = 10 Kpostyield and was uniformly distributed along the height. Note that the twist that occurred between floors was smaller for all of the isolated structures shown than for the fixed-base structure. In all cases, the twist that developed as a result of Impact Scenario 1 was rather small. A comparison between bearings with different initial stiffness showed a large difference of the floor rotation about the vertical axis. Because the vertical rotation is governed by the torsional resistance of the isolation plane, this is mainly influenced by the shear stiffness of the isolator. Therefore, a larger bearing initial stiffness will result in smaller rotations of the base mat and thus of the supported super-structure.

Figu
Figu
re 5.7 P1)a
re 5.8 Mlo3
Peak story dr); fixed-basend Fy = 0.1 W
Maximum flooocation 1); fix
sec and Fy =
rifts along hee and base-isW).
or rotations axed-base and= 0.1 W).
107
eight. Impactsolated cases
along heightd base-isola
t Scenario 1 s with differe
t. Impact Sceated cases w
(Boeing-737ent Kinitial (Tis
enario 1 (Boeith different
at location so = 3 sec
eing-737 at Kinitial (Tiso =

108
5.4.1.2 Response of Reactor Containment Building: Scenario 1
The RCB is separated from the AUX above the base mat by a gap. Therefore, for the fixed-base model, assuming the gap between the AUX and the RCB is sufficient to avoid pounding as a result of aircraft impact, theoretically, the RCB will be undisturbed. However, in a real structure, vibration of the ground will transmit forces to the RCB. For the base-isolated case, because the RCB and the AUX share a common isolated base mat, the movement and the rotation of the base mat result in movement of the RCB. Consequently, the isolated RCB will also vibrate when an aircraft impacts the AUX.
The floor spectra for the RCB are shown in Figure 5.9. Floor spectra in the H2 direction are shown for the first floor, fourth floor, and top floor of the RCB. The peak absolute floor accelerations for the RCB along the height are shown in Figure 5.10.
The acceleration response at the base is the same as the base response of the AUX since they sit on the same base mat. The peak acceleration response is nearly constant up until the fifth floor, at which point the accelerations increase sharply with height. In fact, the peak accelerations are larger for the RCB than for the AUX. The peak pseudo-acceleration in the floor spectra for the upper-most floor is nearly 1g, which is about 40% larger than the peak spectral acceleration in the AUX that bears the brunt of the impact. This behavior is different than the anticipated rigid body response of the structure. It is likely that modes in the RCB and AUX interact through the isolated mat, and that the impulsive excitation caused by the yielding/unloading of the isolators triggers response of certain modes in the RCB. Note: although the isolators considered in this scenario all have Tiso = 3 sec, the low level of response in the isolators means that behavior is dominated entirely by the value of Kinitial. Thus, the bearings in this scenario are likely to transmit more high-frequency vibrations into the supported superstructure than what is typically associated with relatively long-period isolators. This can be seen by the localized peaks in the floor spectra near 2.5 Hz and 8 Hz, where the bearing model with higher initial stiffness resulted in higher floor response spectra for all frequencies above about 2 Hz. However, the initially stiff bearing had lower spectral accelerations for frequencies less than 2 Hz.
The drift response is shown in Figure 5.11. In general, the amplitude of the peak story drift is small, on the order of 0.01%. The drift response of the RCB is uniform along the height, and the amplitude is larger than the drift of the AUX. As noted for the AUX, the bearings with large initial stiffness resulted in larger drift; see the green line in Figure 5.11. This is because the bearings with higher initial stiffness develop greater shear forces, which are transmitted upward into the superstructures, which in turn, develop larger drifts.
Since some torsion occurred about a vertical axis in the base mat, the isolators that were located on the four corners of the base mat responded differently; see plots in Figure 5.12 where they are plotted in the same relative location as their placement shown in Figure 5.2. In Figure 5.12, both the hysteresis loops and the horizontal displacement orbits of the four bearings are shown and compared for the different isolator initial stiffnesses. The peak lateral displacements of the bearings were relatively small; for the most flexible bearing, the displacement was less than 50 mm (2 in.), and for the bearings with the highest initial stiffness, it was less than about 10 mm (0.4 in.).

109
From the first two sets of hysteresis loop plots, it can be seen that none of the bearings reached the nominal yield strength of 0.1 W. Thus, their behavior was dominated by Kinitial. Note that the Bouc–Wen model results in some nonlinearity for the bearings that absorbs energy during the impact. The bearings with larger initial stiffness developed smaller lateral displacements and higher shear forces. The bearing displacement was on the order of 25.4–51.8 mm (1–2 in.), which is a similar value as the demand under seismic loading.
The loading of location 1 is in the H2 direction; however, because of rotation of the base mat, isolators not only moved in the H2 direction, but in the H1 direction as well. The bearing displacement amplitude in the H1 direction was nearly half of the amplitude in the H2 direction for the corner bearings shown. As illustrated in the displacement orbit plots in Figure 5.12, it can be imagined from the orientation of the orbits at each corner that the movement of the bearings was heavily influenced by the clockwise rotation of the base mat.

Figure 5.9 Fdb
loor accelerairection. Impase-isolated
ation spectrapact Scenario cases with d
110
a for reactor o 1 (Boeing-7different Kinit
r containmen737 at locatiotial (Tiso = 3 se
nt building inon 1): fixed-bec and Fy = 0
n the H2 base and 0.1 W).

Figu
Figu
re 5.10 PImis
re 5.11 PImis
Peak floor accmpact Scenasolated cases
Peak story drmpact Scenasolated cases
celerations aario 1 (Boeings with differe
rifts along heario 1 (Boeings with differe
111
along height g-737 at locaent Kinitial (Tis
eight for the g-737 at locaent Kinitial (Tis
of the reactoation 1): fixedso = 3 sec and
reactor contation 1): fixedso = 3 sec and
or containmd-base and bd Fy = 0.1 W)
tainment buid-base and bd Fy = 0.1 W)
ent buildingbase-).
lding. base-).
.

Figure 5.12 Hois
Hysteresis loof the base m
solated cases
ops and dispmat. Impact S
s with differe
112
placement orcenario 1 (Bent Kinitial (Tis
rbits for beaoeing-737 at
so = 3 sec and
rings at the ft location 1):d Fy = 0.1 W)
four corners base-
).
s

113
5.4.1.3 Response of Auxiliary Building: Scenario 4
Impact Scenario 4 was the same as Scenario 1, but the impact was due to the heavier and faster-moving Boeing-747 (instead of the Boeing-737). A comparison between the two scenarios will provide insight regarding the effect of the amplitude of the impulse loads on the dynamic response. Some of the results for this case are similar to those already noted for Scenario 1, and thus they will not be discussed again. This section focuses on the differences of response between Impact Scenarios 1 and 4. Here, the bearings will have much larger displacement demands, reaching more than 30 cm (12 in.) in the H2 direction for the bearings with the smallest Kinitial. All of the bearings developed shear demands in excess of Fy.
Floor response spectra for the AUX are shown in Figure 5.13. The peak total floor accelerations over the height of the AUX are shown in Figure 5.14. These figures can be compared to Figure 5.4 and Figure 5.5 for Impact Scenario 1. Note that the peak floor total accelerations (Figure 5.14) increased linearly with height for the fixed-base building as they did for Impact Scenario 1, but the peak accelerations increased from about 0.24g to nearly 1g. The trends for the base-isolated case differ significantly. Rather than being similar to the fixed-base case near the top of the building and higher than the fixed-base case near the bottom of the structure (as was the case for Impact Scenario 1), the total accelerations were nearly constant for the full height. This is consistent with an almost rigid structure on flexible seismic isolators. The accelerations decreased by nearly a factor of two at the top of the structure. As a result of the rigid-body-like motion of the isolated PGSFR, the accelerations increased at the base to about 0.6g for all of the Kinitial values. Thus, once the impact loading becomes severe enough, the sensitivity to Kinitial decreases. As shown in Figure 5.14, the case with the highest initial stiffness tended to develop floor accelerations that are consistently slightly smaller than those for softer bearings.
The floor response spectra for levels 5 and 6 for all base-isolated cases (near the impact location) show substantially reduced pseudo-accelerations for frequencies higher than about 2.5 Hz; see Figure 5.13. For floor 5, where the impact occurred, the peak pseudo-acceleration was reduced by a factor of nearly 5 when employing seismic isolation; the spectral accelerations became greater than for the fixed-base case at lower frequencies that approached the frequency of the isolation system. These trends are similar to what might be expected in a traditional isolated structure.
For the response spectra for the first floor shown in Figure 5.13, the pseudo-accelerations for the base-isolated case were higher as compared to the fixed-base case for nearly all frequencies. For a building subjected to large earthquake ground accelerations, the in-structure floor accelerations would be expected to be smaller than the ground acceleration. But for the impact loading case, the ground does not accelerate (based on the assumptions made in this study); therefore, the rigid body motion of the isolated superstructure tended to amplify the accelerations in the lower stories compared to a fixed-base structure. At the peak in the spectra between 5–6 Hz, isolation was still effective in reducing the worst of the pseudo-acceleration peaks. Even though the spectral accelerations were not reduced significantly when compared to the fixed-base case, they were comparable to the spectra at other levels for the isolated structure. Thus, demands on components and equipment in the isolated building were nearly uniform over the height of the AUX.

Figure 5.13 FImis
.
loor accelerampact Scenasolated cases
ation spectraario 4 (Boeings with differe
114
a in the auxilg-747 at locaent Kinitial (Tis
liary buildingation 1): fixedso = 3 sec; Fy
g in the H2 dd-base and b
y = 0.1 W).
direction. base-

Figu
Infrequencthis low-regardles
Aacceleratdominatevery lowresponse increasedaccelerat
Timpact othe floor fixed-basisolated cwere largat the boisolated tended toand Figubase isoldecreases
RdiscussedAUX for
re 5.14 PSw
nterestingly,ies lower tha-frequency rss of the valu
A comparisotion-related red by the Ki
w response land under
d disproportitions in the i
The drift respf a Boeing-7response an
se cases remcases, they wger for the fittom story, tcases. As n
o have slighture 5.15, as ation becoms.
Rotation of ed for Scenarr the base-iso
Peak floor accScenario 4 (Bwith different
the value ofan about 2.5range. In thue of Kinitial.
n between tresponse of nitial selectedlevels. More
high rates ionately as tsolated syste
ponse of the747 versus and the relativ
mained unchawere all on tixed-base cathe drifts in
noted for Imtly larger inthe impulse
mes more app
ach floor durio 1, the roolated cases.
celerations aBoeing-747 at
Kinitial (Tiso =
f Kinitial has a Hz. A large
he higher fr
the results ithe isolated
d and the moe work is n
of loadinghe impulse iems are far l
e AUX is sa Boeing-737ve response anged. Drift the order of
ase, especiallthe fixed-ba
mpact Scenarn-structure ste associated parent, and t
ue to Impact tation of the. On the othe
115
along height t location 1):3 sec and Fy
a significant er initial stiffrequency ran
in Figure 5.PGSFR is c
odeling of thneeded to img. Note thatincreased wiess sensitive
hown in Fig7 (Figure 5.7amplitude bresponses re
f 0.03% and ly away fromase structurerio 1, the betory drifts. Awith aircraf
the sensitivi
Scenario 4 ie floors waser hand, the r
of the auxili: fixed-base a
Fy = 0.1 W).
t influence offness producnge, the res
13 and Figucomplex, larhe hysteretic
mprove beart for the fixith heavier ae to increase
gure 5.15. T7) is almost
between diffemained smaless than 0.
m the impace were 2.5 tiearings withAs can be seft impact inity of the res
is shown in s highly unifrotation for
iary buildingand base-iso
n floor specced smaller ssponse was
ure 5.4 demrgely becausc behavior oring models xed-base caand faster mes in impulse
The drift res5 times larg
ferent base-isall for all cas02% at the b
cted floor levmes larger t
h the higheseen by compncreases, thesponse to K
Figure 5.16 form along the fixed-ba
g. Impact olated cases
tra for only spectral valualmost iden
monstrate thase the responof the bearin
in this rangase, accelera
moving planee magnitudes
sponse undeger. The shasolated caseses. For the base. Story vel. For examthan for the st initial stifparing Figure effectivene
Kinitial substan
for the AUXthe height o
ase case incre
those ues in ntical
at the nse is ngs at ge of ations s; the s.
er the ape of s and base-drifts mple, base-
ffness re 5.7 ess of ntially
X. As of the eased

from the smaller. the superbetween rotation osmall.
Figu
Figu
bottom to thRecall that trstructures w0.15–0.3, w
occurred at t
re 5.15 P1)a
re 5.16 Mlo3
he top; howthe superstru
were not conwhich is notthe isolation
Peak story dr): fixed-basend Fy = 0.1 W
Maximum flooocation 1): fix
sec and Fy =
wever, the amucture was a
nducted. For t insignificaplane, and h
rifts along hee and base-isW).
or rotations axed-base and= 0.1 W).
116
mplitude of rassumed to rthe three ba
ant. Howeverhence the in
eight. Impactsolated cases
along heightd base-isola
rotation of thremain elastase-isolated r, as noted p-structure tw
t Scenario 4 s with differe
t. Impact Sceated cases w
he fixed-bastic and checcases, the fpreviously,
wisting of the
(Boeing-747ent Kinitial (Tis
enario 4 (Boeith different
se case was mcks of yieldinfloor rotationnearly all oe AUX was
at location so = 3 sec
eing-747 at Kinitial (Tiso =
much ng of n was f this quite
117
In a comparison between different base-isolated cases, larger initial bearing stiffness will result in a small rotation response. The amplitude of floor rotations was almost 8 times larger for the base-isolated cases under impact of a Boeing-747 compared to a Boeing-737. Thus, additional work may be useful in identifying different distributions of bearing types and properties to help mitigate torsional response. Also, the efficacy of adding supplement energy-dissipation devices to help resist torsion, or the use of bearing systems that may be more resistant to torsion, should be investigated.
5.4.1.4 Response of Reactor Containment Building: Scenario 4
The response of the RCB under the Aircraft Impact Scenario 4 is described below. Given previous discussions, the behavior trends examined earlier will not be revisited. Plots of the floor response spectra and floor total accelerations for Impact Scenario 4 are shown in Figure 5.17 and Figure 5.18. These may be compared to Figure 5.9 and Figure 5.10 for Impact Scenario 1. As was the case with Impact Scenario 1, the isolated RCB vibrated significantly, unlike the idealized fixed-base power plant. The total accelerations at the base increased from about 0.16g for the smaller Boeing-737 to about 0.5g for the larger Boeing-747. In both cases, accelerations in the upper three levels increased substantially. For the top floor level accelerations increased from about 0.35g for the Boeing-737 to about 1g for the Boing-747 .
Considering the floor response spectra, there was very little variation among the floor spectra for different values of Kinitial for frequencies greater than about 2 Hz. Below that frequency, there was a systematic increase of spectral amplitudes relative to the fixed-base case. Spectra for each Kinitial were higher than others at a particular frequency. Again, as seen for other response quantities (except for base rotation), the increase in the peak of the pseudo-acceleration floor spectra was only on the order of 2, even though it was on the order of a factor of 5 for the fixed-base AUX when considering the heavier and faster Boeing-747.
The trends regarding floor rotation of the RCB were the same as shown for the AUX. The magnitude of rotation was highly amplified due to the rotation of the isolation plane. The rotation of floors increased significantly for the Boeing-747 compared to the Boeing-737. The floor rotation of the RCB was almost the same compared to the floor rotation of the AUX. Both rotations were nearly constant over the height, indicating a nearly rigid body motion of the upper part of the structure.
The hysteresis loops and displacement orbits for isolators at the four corners of the PGSFR under Impact Scenario 4 are shown in Figure 5.20. The bearing displacement demand in the impact direction was about 30 cm (12 in). For the perpendicular direction, the peak bearing displacement demand was about half that value. These displacements are about 5 to 6 times those for Impact Scenario 1. The hysteresis loops for the heavier and faster Boeing-747 appear more like those expected for an isolation bearing. This was not the case for Impact Scenario 1, where the bearings did not reach their nominal yield value.
The effect of torsion on the bearing behavior was far more pronounced for Impact Scenario 4 than for Scenario 1. This can be seen in the displacement orbits shown in Figure 5.20. The two bearings on the left side of the plot, corresponding to the side of the building hit by the aircraft, were displaced far more than those on the right side. The direction of principal movement of the bearings was again skewed relative to the H2 impact direction. This is suggestive of an initial clockwise torsional movement of the plant. The bearings on the left side

118
of the model moved more in the H2 direction than in the H1 direction, but the opposite was true for the two bearings on the right side of the building; see Figure 5.2.
The displacement demand of the isolator reached 30.5 cm (12 in.) for the smallest value of Kinitial. Peak displacements were about 60% of these values for the stiffest values of Kinitial considered. For the SSE level seismic events considered in Chapters 3 and 4, isolator demands were smaller. The seismic displacement demands on the bearings will be larger if recommendations currently being developed in the U.S. NRC regulatory guideline for seismically isolated structures will be followed in the future. In this case, the bearing capacities might be expected to be on the order of 1.67 1.6 (or 2.67 times) larger than the median SSE displacement demands. This increased displacement capacity for seismic design considering beyond-design-basis earthquake events will help the PGSFR mitigate beyond-design basis aircraft impacts.

Figure 5.17 Fdb
loor accelerairection. Impase-isolated
ation spectrapact Scenario cases with d
119
a for the reaco 4 (Boeing-7different Kinit
ctor containm747 at locatiotial (Tiso = 3 se
ment buildinon 1): fixed-bec and Fy = 0
ng in the H2 base and 0.1 W).

Figu
Figu
re 5.18 Plo3
re 5.19 PImis
Peak floor accocation 1): fix
sec and Fy =
Peak floor rotmpact Scenasolated cases
celerations axed-base and= 0.1 W).
tations alongario 4 (Boeings with differe
120
along heightd base-isola
g height for tg-747 at locaent Kinitial (Tis
. Impact Sceated cases w
the reactor cation 1): fixedso = 3 sec and
enario 4 (Boeith different
containment d-base and bd Fy = 0.1 W)
eing-747 at Kinitial (Tiso =
building. base-).

Figure 5.20 Hois
Hysteresis loof the base m
solated cases
ops and dispmat. Impact S
s with differe
121
placement orcenario 4 (Bent Kinitial (Tis
rbits for beaoeing-747 at
so = 3 sec and
rings at the ft location 1):d Fy = 0.1 W)
four corners base-
).
s

122
5.4.1.5 Conclusions Regarding the Effect of Different Kinitial
In terms of acceleration and drift, the primary response appears to have occurred in the direction of the impact loading. However, given the significant torsional response of the structure, some reduced response perpendicular to the direction of impact may occur locally. Further study is needed to better assess this response, considering likely locations of critical equipment and components.
For the AUX, the floor acceleration spectra due to aircraft impact were larger at the top of the building and smaller at the lower part for the fixed-base case, but almost uniform for the base-isolated case. This is mostly true for large impulses that represent stiff structures above the isolation plane moving as a nearly rigid body. The value of Kinitial had a small or secondary importance on the horizontal accelerations that developed due to impact, especially for the heavier and faster Boeing-747.
The reduction of floor spectrum amplitudes for cases using base isolation was more pronounced for larger impact loading scenarios. The reduction of the peak value in the floor spectrum was around 5 considering the larger impact of the Boeing-747.
In-structure story drift values were generally small. This study assumed the structure above the isolation plane remained elastic.
Because of the eccentricity of the loading for Impact Scenarios 1 and 4, it was expected that rotation of the building and the base mat would occur. For the fixed-base model, minor torsion was observed with the twist of the AUX from the base to the top. For the base-isolated case, rotation of the whole AUX occurred as a result of rotation of the isolated base mat about a vertical axis. Rotations as large as 0.2 were computed for Impact Scenario 4, with the lowest of the Kinitial values considered. Larger values of Kinitial effectively reduced the rotations.
Since the RCB is not attached to the AUX, for the fixed-base case, no response was observed due to impact loading on the AUX. However, for the base-isolated case, the RCB shares the same isolated mat foundation as the AUX, and the RCB vibrated considerably as a result of aircraft impact. For the base-isolated case, the RCB had greater floor response spectra in comparison to the AUX. There was a large amplification of accelerations above floor 4 in the RCB. This was assumed to be associated with the relatively light and flexible structure used in this region of the plant.
The rotation of the RCB appears to be primarily a result of the rotation of the underlying isolated mat foundation. It is assumed that when the aircraft impact occurs eccentrically, the isolated mat foundation will rotate significantly, and the bearings will move not only in the direction of the aircraft impact but also in the orthogonal direction. In reality, the principal direction of motion is skewed to the principal directions of the building, corresponding to the relative significance of the torsional and translational movement of the isolation plane. For the cases studied herein, the bearing displacement perpendicular to the direction of impact was around 50% of that occurring in the direction of the impact.
For the smaller impact loading, the isolator displacement demand was around 5 cm (2 in.), which is similar to the demand for the design-level earthquake (SSE) loading. For larger impact loading due to the faster and heavier Boeing-747, the displacement demand reached about 30 cm (12 in.). This is much larger than the displacement demand at the SSE; therefore, the design of

123
the isolator should take into account the response under aircraft impact. With a larger Kinitial, the bearing displacement demand can be cut in half. Other methods to reduce the torsional and translational response of the PGSFR were mentioned and should be investigated in future studies.
5.4.2 Responses Considering Different Tiso
Selected results comparing the effect of different isolation periods Tiso on the response to aircraft impact are discussed below. Impact Scenarios 2 and 5 are considered as follows:
Impact scenario 2: Loading location 2 for a Boeing-737
Impact scenario 5: Loading location 2 for a Boeing-747
The discussion in this section focuses on the response differences due to three isolation periods (Tiso = 2, 3, and 4 sec) and the difference of responses because of the change of loading location. For these case studies, Kinitial = 10 Kpostyield and Fy = 0.10 W remain constant. Observations determined in previous sections will not be repeated.
The second loading case is similar to the first loading case; however, the second loading location is closer to the centroid of the RCB, thereby nearer to the overall center-of-mass of the PGSFR. This scenario considers the smaller of the two aircrafts. As presented earlier, the bearing response is relatively small, with the peak forces not exceeding about 70% of the nominal yield strength, and the peak displacement being less than 3.5 cm (1.5 in). When compared to scenario 1, there was far less torsional response for impact location 2.
5.4.2.1 Response of Auxiliary Building: Scenario 2
The general trends in the floor response spectra for Impact Scenario 2 are similar to those for Impact Scenario 1, as can be seen by comparing Figure 5.4 and Figure 5.21. The peak total accelerations developed at each floor are similar, as can be seen by comparing Figure 5.5 and Figure 5.22. The amplitude and trends for the total acceleration response is very similar. A comparison of the response spectra for different Tiso shows little difference. The three base-isolated cases have almost identical responses. The reason that Tiso does not have more influence on the plant and bearing behavior is that the responses for this impact scenario are not sufficient to raise the forces in the bearings to Fy or above. As such, changing the slope of the post-yield force-displacement relationship has little (essentially no) effect on response.
Unlike seismic loading, the aircraft impact loading does not have many loading cycles. The isolator will stay in the initial stiffness range for most of the cycles. Therefore, the responses of bearings with different post-yield stiffness are almost the same since the behavior is mainly influenced by the initial stiffness. Because of the use of the Bouc-–Wen isolator model, the value of Fy has only a very small effect on the shape of the hysteresis loops prior to reaching Fy.
The peak accelerations for impact Scenarios 1 and 2 were nearly identical. The primary difference between these two scenarios was that the eccentricity of Scenario 2 was much smaller, and its sign was opposite to that of Scenario 1.

124
The drift responses shown in Figure 5.23 were very small as before for the Boeing-737. In these cases drift does not depend on the post-yield stiffness of the bearing. The amplitude of drift was about the same as for impact Scenario 1.
Rotation of the AUX is shown in Figure 5.24. The trends are very similar to those for Impact Scenario 1, except that the rotations were slightly less for Impact Scenario 2. For example, for Impact Scenario 1, a representative rotation was about 0.033 but only about 0.025 for Impact Scenario 2. Since the impact force history is the same for both cases, the difference is due to the reduced eccentricity of impact location 2. A comparison of Figure 5.8 and Figure 5.24 shows that the torsional response is much less sensitive to Tiso than to the initial elastic stiffness.
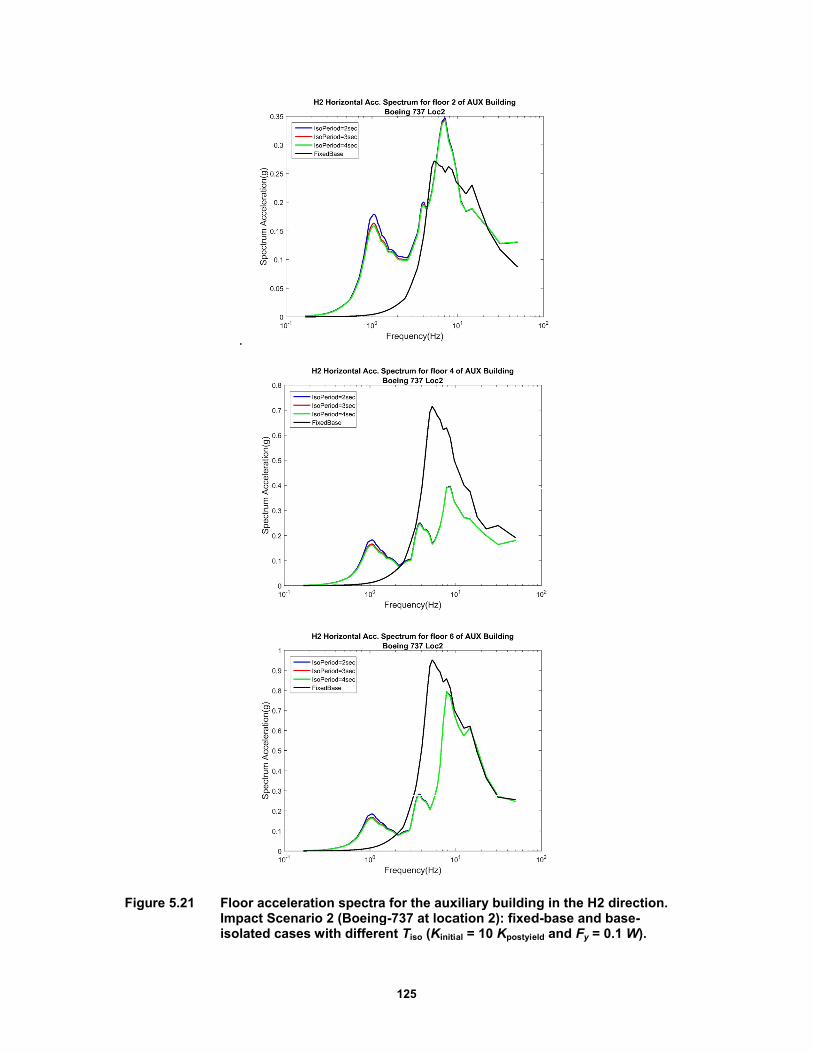
Figure 5.21 FImis
.
loor accelerampact Scenasolated cases
ation spectraario 2 (Boeings with differe
125
a for the auxg-737 at locaent Tiso (Kinitia
xiliary buildination 2): fixedal = 10 Kpostyie
ng in the H2 d-base and beld and Fy = 0
direction. base-0.1 W).

Figu
Figu
.
re 5.22 PSw
re 5.23 P(Bd
Peak floor accScenario 2 (Bwith different
Peak story drBoeing-737 aifferent Tiso (
celerations aBoeing-737 at
Tiso (Kinitial =
rifts along heat location 2)(Kinitial = 10 K
126
along height t location 2):10 Kpostyield a
eight for the a): fixed-base
Kpostyield and F
for the auxi: fixed-base aand Fy = 0.1
auxiliary buiand base-is
Fy = 0.1 W).
liary buildingand base-isoW).
ilding. Impacsolated cases
g. Impact olated cases
ct Scenario 2s with
2
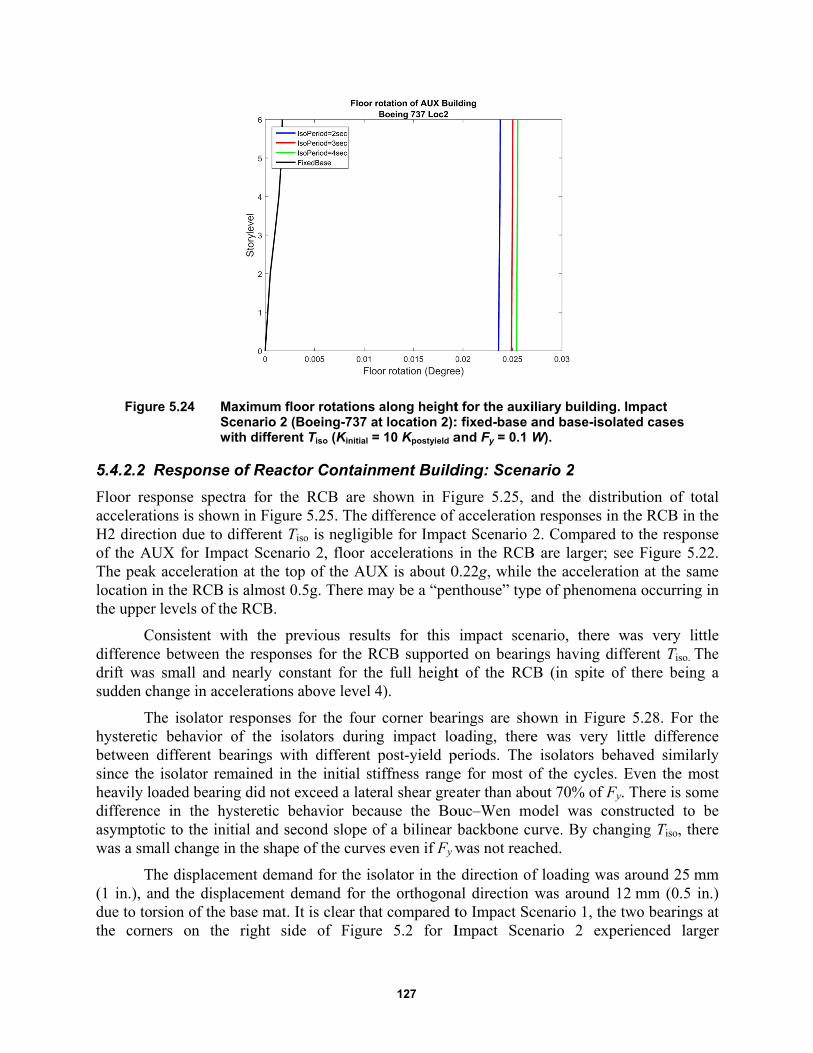
Figu
5.4.2.2
Floor resacceleratH2 direcof the AUThe peaklocation ithe upper
Cdifferencdrift wassudden c
Thystereticbetween since theheavily lodifferencasymptotwas a sm
T(1 in.), adue to tothe corn
re 5.24 MSw
Response
sponse spections is showtion due to dUX for Impk acceleratioin the RCB r levels of th
Consistent wce between ts small and hange in acc
The isolator c behavior different be
e isolator remoaded bearin
ce in the hytic to the ini
mall change in
The displacemand the displrsion of the
ners on the
Maximum flooScenario 2 (Bwith different
e of Reacto
ctra for the wn in Figure different Tiso
pact Scenarioon at the topis almost 0.5
he RCB.
with the prethe responsenearly cons
celerations a
responses foof the isola
earings withmained in thng did not exysteretic behitial and secn the shape o
ment demanlacement debase mat. It
e right side
or rotations aBoeing-737 at
Tiso (Kinitial =
or Containm
RCB are sh5.25. The di
o is negligibo 2, floor ac
p of the AUX5g. There m
evious resultes for the RCstant for theabove level 4
for the four ators duringh different phe initial stixceed a laterhavior becaond slope oof the curve
nd for the isoemand for tht is clear thate of Figure
127
along heightt location 2):10 Kpostyield a
ment Build
hown in Figifference of
ble for Impacccelerations X is about 0ay be a “pen
ts for this CB supportee full height4).
corner bearg impact lopost-yield piffness rangeral shear greause the Bof a bilinear s even if Fy w
olator in the he orthogonat compared te 5.2 for I
t for the auxi: fixed-base aand Fy = 0.1
ding: Scena
gure 5.25, aaccelerationct Scenario in the RCB
0.22g, while nthouse” typ
impact scened on bearint of the RC
rings are shooading, thereperiods. The e for most oater than abo
ouc–Wen mobackbone cuwas not reac
direction ofal direction to Impact ScImpact Scen
iliary buildinand base-isoW).
ario 2
and the distn responses i2. Compare
B are larger; the accelera
pe of phenom
nario, therengs having dB (in spite
own in Figue was very isolators bof the cyclesout 70% of Fodel was curve. By chached.
f loading wawas around
cenario 1, thnario 2 ex
g. Impact olated cases
tribution of in the RCB id to the respsee Figure
ation at the mena occurri
e was very different Tiso
of there be
ure 5.28. Folittle differ
behaved sims. Even the Fy. There is onstructed tanging Tiso,
as around 25d 12 mm (0.5he two bearinxperienced l
f total in the ponse 5.22. same
ing in
little o. The ing a
or the rence
milarly most some to be there
5 mm 5 in.) ngs at larger

128
displacements compared to the two bearings on the left side. This differs from the trend observed under Impact Scenario 1. Because the loading is to the right side of the AUX, the displacements in the right-hand side bearings were larger since they are nearer to the impact on the side where torsion tended to increase displacement demands.
The rotation direction under Loading Case 2 was opposite to that of Loading Case 1, as illustrated by the displacement orbits of the bearings. The rotation was counter-clockwise instead of clockwise like in Loading Case 1 since the loading location was to the right of the center of rotation. This resulted in the skewed direction of the principle direction of motion of the bearing displacement orbits. The skew is consistent with a rotation of the plant about a vertical axis.

Figure 5.25 Finb=
loor acceleran the H2 direase and bas0.1 W).
ation responction. Impace-isolated ca
129
nse spectra fct Scenario 2ases with dif
for the reacto2 (Boeing-737fferent Tiso (K
or containme7 at location Kinitial = 10 Kp
ent building 2): fixed-
ostyield and Fyy

Figu
Figu
re 5.26 Pbb
re 5.27 PImis
Peak floor accuilding. Impaase-isolated
Peak story drmpact Scenasolated cases
celerations aact Scenario cases with d
rifts along heario 2 (Boeings with differe
130
along height o 2 (Boeing-7different Tiso
eight for the g-737 at locaent Tiso (Kinitia
for the reac737 at locatioo (Kinitial = 10 K
reactor contation 2): fixedal = 10 Kpostyie
ctor containmon 2): fixed-bKpostyield and
tainment buid-base and beld and Fy = 0
ment base and
Fy = 0.1 W).
lding. base-0.1 W).

Figure 5.28 Hois
Hysteresis loof the base m
solated cases
ops and dispmat. Impact S
s with differe
131
placement orcenario 2 (Bent Tiso (Kinitia
rbits for beaoeing-737 atal = 10 Kpostyie
rings at the ft location 2):eld and Fy = 0
four corners base-
0.1 W).
s

132
5.4.2.3 Response of Auxiliary Building: Scenario 5
Impact Scenario 5 is discussed in this section. The impact location is the same as for Impact Scenario 2, but with the larger and faster Boeing-747 instead of the Boeing-737. As was observed for Impact Scenario 4, the impact of the larger and faster plane resulted in lateral displacements in some of the bearings in excess of 255 mm (10 in.) and forces far in excess of Fy.
The floor acceleration response spectra for the AUX are shown in Figure 5.29. The associated distribution of total accelerations with height is shown in Figure 5.30. The total accelerations were very similar to those computed for Impact Scenario 4. There is virtually no difference between the accelerations and acceleration spectra for the different Tiso values used in the analyses except in the lowest level shown at frequencies less than 2 Hz. At this location, a smaller post-yield period had a slightly larger response.
Response of floor peak acceleration is shown in Figure 5.30. Comparing the responses between Impact Scenario 5 and Impact Scenario 2, the amplification of responses due to the larger plane was similar when comparing Impact Scenario 4 to Impact Scenario 1. There was no difference in acceleration response of the AUX comparing Impact Scenarios 2 and 1 as long as the loading function and direction were the same. The floor acceleration response was the same for the AUX for all the normal impacts with the same loading function. The drift response is not shown because the response was similar to Impact Scenario 4 and the response value was small.
The rotation response of the AUX is shown in Figure 5.31. Compared to the rotation response of AUX under Impact Scenario 4, the response under Impact Scenario 5 is smaller. The response for the same case, which has a 3-sec isolation period and initial stiffness 10 times the post-yield stiffness, is around 0.18 for Impact Scenario 5 but around 0.23 for Scenario 4. The difference is due to the change in the distance of the loading location to the center-of-mass and stiffness, because these are not uniformly distributed along the H1 direction and the RCB is not centered in the layout of the AUX.
A comparison of responses with different isolation periods demonstrates that the difference shown in Figure 5.31 is more noticeable compared to the response shown in Figure 5.24 for Impact Scenario 2, which involved the impact of a smaller and slower plane. Since the loading impulse was larger for Impact Scenario 5, the post-yield stiffness was affected, resulting in different displacement demands of the bearings for different cases; therefore, the rotation of the base mat, which depends on the movement of the bearings, will be different. The post-yield period for smaller bearings will result in a smaller rotation response of the AUX.
5.4.2.4 Response of Reactor Containment Building: Scenario 5
The floor acceleration spectra for the RCB are shown in Figure 5.32. As demonstrated earlier, there is virtually no difference between base-isolated cases with different isolator post-yield periods. Comparing spectral acceleration values against the response spectra for Impact Scenario 4 in Figure 5.17, the values for Impact Scenario 5 are much larger. The peak amplitudes of the spectra were almost twice those when considering the Boeing-747 impacts at location 2 instead of location 1. As discussed previously, the floor accelerations of the AUX, which received the impact directly, were not sensitive to whether impact occurred at location 1 or 2. The RCB was sensitive to the location of the impact on the AUX due to the movement of the base mat.

133
The same conclusion can be drawn from the response of peak floor acceleration; see Figure 5.34. When compared to the peak floor acceleration due to Impact Scenario 4, the responses were larger.
The floor rotation of the RCB was the same as the floor rotation of the AUX. A smaller rotation was obtained compared to Impact Scenario 4 where the loading location was further from the center-of-mass. The bearing displacement orbit and the hysteresis loops for this loading case are shown in Figure 5.35. First, the displacement demand for the isolator was around 250 mm (10 in.) in the H2 direction and 120 mm (5 in.) in the H1 direction. The displacement of the bearing is similar to Impact Scenario 4. However, since the impact loading was at the right side of the AUX, the center of rotation was located at the left side of the impact location. The right two bearings experienced much larger displacements compared to the left two bearings since the distance to the center of rotation of the two right-side bearings was larger than the two left-side bearings.
The direction of rotation of the displacement orbit was counter-clockwise. It is clear that the displacement demand was affected by the isolation period as shown in the second plot in Figure 5.35. The displacement demand can be reduced to around 120 mm (5 in.) by using an isolation period of 2 sec instead of 4 sec. In general, the bearing displacement demand due to Boeing-747 impact was larger than the demand from seismic analysis under design-level earthquake. Therefore, when considering the design of the isolator, the displacement capacity might be controlled by aircraft impact loading.

Figure 5.29 FImis
.
loor accelerampact Scenasolated cases
ation spectraario 5 (Boeings with differe
134
a for auxiliarg-747 at locaent Tiso (Kinitia
ry building ination 2): fixedal = 10 Kpostyie
n the H2 dired-base and beld and Fy = 0
ction. base-0.1 W).

Figu
Figu
re 5.30 PSw
re 5.31 MSw
Peak floor accScenario 5 (Bwith different
Maximum flooScenario 5 (Bwith different
celerations aBoeing-747 at
Tiso (Kinitial =
or rotations aBoeing-747 at
Tiso (Kinitial =
135
along height t location 2):10 Kpostyield a
along heightt location 2):10 Kpostyield a
for the auxi: fixed-base aand Fy = 0.1
t for the auxi: fixed-base aand Fy = 0.1
liary buildingand base-isoW).
iliary buildinand base-isoW).
g. Impact olated cases
g. Impact olated cases

Figure 5.32 Fdb
loor accelerairection. Impase-isolated
ation spectrapact Scenario cases with d
136
a for the reaco 5 (Boeing-7different Tiso
ctor containm747 at locatio
o (Kinitial = 10;
ment buildinon 2): fixed-b Kpostyield and
ng in the H2 base and
d Fy = 0.1 W)..

Figu
Figu
re 5.33 Pbb
re 5.34 Mbb
Peak floor accuilding. Impaase-isolated
Maximum floouilding. Impaase-isolated
celerations aact Scenario cases with d
or rotations aact Scenario cases with d
137
along height o 5 (Boeing-7different Tiso
along heighto 5 (Boeing-7different Tiso
for the reac747 at locatioo (Kinitial = 10 K
t for the reac747 at locatioo (Kinitial = 10 K
ctor containmon 2): fixed-bKpostyield and
ctor containmon 2): fixed-bKpostyield and
ment base and
Fy = 0.1 W).
ment base and
Fy = 0.1 W).

Figu
re 5.35 Hois
Hysteresis loof the base m
solated cases
ops and dispmat. Impact S
s with differe
138
placement orcenario 5 (Bent Tiso (Kinitia
rbits for beaoeing-747 atal = 10 Kpostyie
rings at the ft location 2);eld and Fy = 0
four corners base-
0.1 W).
s

139
5.4.2.5 Conclusions Regarding the Effect of Different Tiso
Varying Tiso did not significantly affect the acceleration response but slightly influenced the rotation of the base slab about a vertical axis during larger impact loading. A smaller Tiso resulted in smaller rotation response. The floor acceleration responses of the AUX for different loading locations were the same as long as the loading direction and function were the same. Under Impact Scenario 2 and 5, where the loading location was near to the center-of-mass, the system experienced smaller rotation of the isolation plane than for Impact Scenarios 1 and 4, where the impact location was relatively far from the center-of-mass.
The floor acceleration response of the RCB was larger for Impact Scenario 5. Because there was less eccentricity of the impulse with respect to the center-of-mass, less of the energy of the impact was directed to the torsional response of the system and more was directed to translational movement of the system.
Displacement demands on the isolators were similar when comparing Impact Scenarios 1 and 2, and 4 and 5. Under larger impact due to the Boeing-747, the displacement demand in the H1 and H2 directions were 120 mm (5 in.) and 250 mm (10 in.), respectively.
The rotation of the base mat was clockwise for Impact Scenario 1 and counter-clockwise for Impact Scenario 2. The isolators near the loading location experienced larger displacement compared to the isolators far from the loading location.
5.4.3 Responses Considering Different Fy
In the previous two sections, the responses of Loading Scenarios 1 and 4 (corresponding to loading location 1) and responses of loading scenarios 2 and 5 (corresponding to loading location 2) were discussed. This section discusses loading scenarios 3 and 6 (corresponding to loading location 3). These loading cases correspond to:
Impact Scenario 3: Impact location 3 for Boeing-737
Impact Scenario 6: Impact location 3 for Boeing-747
Both of these scenarios were oriented in the longitudinal H1 direction of the PGSFR and acted through the center-of-mass of the system. Since the impact load was directed through the center-of-mass and the structure is symmetric in that direction, no torsional response was expected. For the lighter Boeing-737, very little response was expected for this excitation. Therefore, only Impact Scenario 6 will be discussed in detail.
5.4.3.1 Response of Auxiliary Building: Scenario 6
Since the force time history for Impact Scenario 6 is applied through the center-of-mass in the H1 direction, the acceleration response only occurred in the H1 direction. The amplitude of the computed floor spectrum and magnitudes of the total floor accelerations was very similar to the other two loading cases of the impact of a Boeing-747, which can be seen by comparing Figure 5.36 with Figure 5.13 and Figure 5.29, and Figure 5.34 with Figure 5.14 and Figure 5.30. The

140
reduction in response is larger in higher floors when using base isolation; the response of the fixed-base model was large.
For bearings with different yield forces, the difference of the acceleration related response was not significant. The only difference in the floor spectrum was near the frequency of the isolation mode: the larger the bearing yield force, the larger the acceleration response.
Floor peak accelerations are shown in Figure 5.37. The acceleration response of the AUX was nearly constant over height for the isolated structure and varied linearly with height for the fixed-base case. The amplitude of the acceleration was similar for Impact Scenarios 4 and 5 despite the location of the impacts being different.
The drift response is not shown here as the values are small and similar to results presented earlier. The main difference was that due to the impact loads being applied in a plane of symmetry, no torsional response was observed.
5.4.3.2 Response of Reactor Containment Building: Scenario 6
The acceleration floor spectrum and floor accelerations for the RCB are shown in Figure 5.38 and Figure 5.39. Compared to the response of the AUX, the floor spectrum of the RCB is larger, almost twice the response values of AUX. Minor differences can be seen for isolators with different yield forces. Isolators with large yield strengths resulted in a slightly larger peak acceleration response. As shown in Figure 5.39, the difference between different bearing yield forces in terms of peak floor acceleration was negligible, and the amplitude of responses was larger than the peak floor acceleration of the AUX.
For the response of the corner isolators shown in Figure 5.40, only the H1 direction hysteresis is shown since there is no response in the H2 direction. For the bearing hysteresis in the H1 direction, all of the isolators exhibited the same behavior because they moved in phase. The displacement demand of the isolator depends on the bearing yield force; with a smaller yield force, the displacement demand will be larger. Overall the displacement demand was around 127 mm (5 in.), which is similar to the response determined from seismic analysis.
A comparison between the isolator displacement and the other loading cases including torsion effects shows that although the loading function is the same, the bearing displacement demand was significantly smaller without the torsional response. The bearing displacement orbit is shown in the second plot in Figure 5.40. Clearly, only translation in the H1 direction is recorded for the isolator movement since there is no torsion to introduce the movement in the H2 direction.

Figure 5.36 FImis
.
loor accelerampact Scenasolated cases
ation spectraario 6 (Boeings with differe
141
a for the auxg-747 at locaent Fy (Kinitial
xiliary buildination 3): fixed= 10 Kpostyield
ng in the H1 d-base and b
d and Tiso = 3
direction. base-3 sec).

Figu
re 5.37 PImis
Peak floor accmpact Scenasolated cases
celeration reario 6 (Boeings with differe
142
esponses alog-747 at locaent Fy (Kinitial
ong height ofation 3): fixed= 10 Kpostyield
f the auxiliard-base and b
d and Tiso = 3
ry building. base-3 sec).

Figure 5.38 Fdb
loor accelerairection. Impase-isolated
ation spectrapact Scenario cases with d
143
a for the reaco 6 (Boeing-7different Fy (
ctor containm747 at locatio(Kinitial = 10 K
ment buildinon 3): fixed-b
Kpostyield and T
ng in the H1 base and
Tiso = 3 sec).

Figu
re 5.39 PImis
Peak floor accmpact Scenasolated cases
celeration alario 6 (Boeings with differe
144
ong height og-747 at locaent Fy (Kinitial
of the reactoation 3): fixed= 10 Kpostyield
r containmed-base and b
d and Tiso = 3
nt building. base-3 sec).

Figu
re 5.40 Hthb
Hysteretic loohe PGSFR. Imase-isolated
ops and dispmpact Scena cases with d
145
placement orario 6 (Boeingdifferent Fy (
rbits for the fg-747 at loca(Kinitial = 10 K
four corner bation 3): fixe
Kpostyield and T
bearings in d-base and
Tiso = 3 sec).

146
5.4.3.3 Conclusions Regarding the Effect of Different Fy
This part of the parametric study considered the effect of different bearing yield strengths. Only Impact Scenario 6 was examined, where no torsional response developed.
The floor acceleration spectrum for the AUX and the RCB were similar compared to the response under the other loading cases with the same loading function.
The response of the RCB was larger than the AUX even without evidence of torsion.
The dependence of response on different isolator yield forces was small for the acceleration response of the two buildings even though the smaller yield force of bearing resulted in larger bearing displacement demands. The peak bearing displacement demand was around 127 mm (5 in.). This is larger than that required to withstand the SSE.
5.5 SENSITIVITY OF RESPONSES TO IMPACT LOADING CONDITIONS
The response of isolated PGSFR due to aircraft impact under different loading conditions was investigated, with a particular focus on the response due to different aircraft speeds and different loading-function shapes.
5.5.1 Sensitivity of Responses to Change of Impact Velocity
First, the response of the base-isolated PGSFR model under aircraft impact of a Boeing-747-400 at different flying speeds was investigated and the results compared. For the different loading cases considered, the aircraft weight and length were kept the same but with different impact velocity; the cruising speeds were varied from 20% to 110%. Using the same scale method based on Riera’s loading function, the force scale and time scale were calculated. The resulting loading force curves are shown in Figure 5.41 for all cases considered.
As shown in Figure 5.41, the plane lengths were the same, but because the speeds at impact were different for each case, the loading durations varied. Note that the loading function for aircraft impact of a Boeing-747 used previously assumed the speed was 100% of the cruising speed. The impact location considered in this part of analysis is location 1 shown in Figure 5.2. The response of the isolated PGSFR under each of the aircraft impact loading scenarios was determined and the maximum response shown for each case. The response was normalized by the absolute response value at 100% cruising speed. The vertical axis of the plot shows the ratio between the response at a specific impact velocity compared to the response of the standard case of impact at 100% of cruising speed. The horizontal axis indicates different impact velocities.
The response of maximum drift and rotation of the AUX and the RCB are shown in Figure 5.42 through Figure 5.43. Note that the increase of the response was between linear and quadratic, with a linear increase as the impact velocity increased. Note that the response investigated here in Figure 5.42 and Figure 5.43 is the response for the AUX and RCB. Since the dominant frequencies of this response are similar to the fundamental frequency of the building, ~10 Hz in the model, it cannot be treated as an impulse even though the loading duration due to

aircraft iforces depattern wamplitud
Figu
Figu
impact is shetermined frwith linear ide of force, a
re 5.41 Lw
re 5.42 Mmre
hort. The resrom structurincreasing v
a quadratic in
oading functwith different
(a)
Maximum drifmaximum drifesponse of t
sponses ampral dynamicsvelocity; thencrease patte
tions used foimpact spee
ft ratios undeft response ohe reactor co
147
plitudes are s. The scalinrefore, since
ern occurs.
or aircraft imeds.
er different iof the auxiliaontainment b
dependent ng of the foe the respon
mpact analys
mpact velocary building abuilding.
on the amporce increasense is more
is due to Bo
(b)
cities of aircrand (b) maxi
litude of loaes in a quad
e sensitive t
eing-747-400
raft: (a) imum drift
ading dratic to the
0

Figu
TAUX forresponseresponse range incresponse quadratic
Tdominantthe isolaloading. loading mgeneratinvelocity more sen
Tpattern wimpulse bof the veincrease range.
Tamplitudincrease since themuch lar
re 5.43 M(aro
The responser different frs were consat different
creased almoat the freq
c pattern.
The reason t frequency
ation dominaTherefore,
momentum ng loading fuscale. There
nsitive to the
The floor accwith linearlybecause it iselocity scalepattern is ex
The isolator mde and the re
of the bearine response orger compar
(a)
Maximum rotaa) maximum otation respo
e of the maxfrequency raidered here.t frequency ost linearly;quency rang
for the diffand the aircant period rin this caseinstead of tunctions for efore, it incr momentum
celeration aty increasing s insensitive e because oxpected and
maximum diesponse ampng displacemof the isolatred to the l
ation responrotation resp
onse of the r
ximum flooanges are sh From the rranges. Pea see the red
ges of RCB
fference is tcraft loadingrange the aie, the responthe amplituddifferent im
reases linearm, shows a lin
t the superstvelocity. G
to the loadinof its sensitid observed fo
isplacement plitude ratioment responstion displaceoading dura
148
nses under dponse of thereactor conta
or acceleratioown in Figuesults shown
ak floor acced line in Fig and AUX
the differeng frequency oircraft loadinnse amplitude of loadin
mpact speedsrly with risinnearly increa
tructure freqGiven that itng momentuivity to the for the peak
response is o are plottedse was almoement is senation of airc
different impae auxiliary buainment build
on spectrumure 5.44 andn, the increaeleration aro
gure 5.44 anfundamenta
nt relative sor duration. ng can be
ude is sensitng force. In s, the momenng velocitiesasing pattern
quency ranget cannot ch
um, the respoforce amplfloor accele
shown in Fid together inost linear witnsitive to thcraft impact
(b)
act velocitiesuilding and (bding.
m value of td Figure 5.4ase rate wasound the iso
nd Figure 5.4al frequency
scale betweSince the pcharacterizetive to the athe scaling
ntum scale is, and the ren.
e shows a qaracterize thonse was scaitude; there
eration in th
igure 5.45. Tn Figure 5.4th increasing
he isolation t: this is con
s of aircraft: b) maximum
the RCB an45. The top s different foolation frequ45. Note thay increased
een the resperiod is larg
ed as an imamplitude osystem use
is the same aesponse, whi
quadratic inche loading aaled as the sqfore, a quad
he high-frequ
The real resp45. Note thag impact velperiod, whinsistent with
m
nd the floor
or the uency at the
in a
ponse ger, at
mpulse of the ed for as the ich is
crease as an quare dratic uency
ponse at the locity ich is h the

previous increases
Figu
Figu
conclusion.s linearly wit
re 5.44 Mcvebc
re 5.45 M(ad
. The responth increasing
(a)
Maximum topontainment belocities: (a)uilding and (ontainment b
(a)
Maximum isoa) real displaisplacement
nse is moreg impact velo
p floor horizobuilding and) maximum to(b) maximumbuilding.
lator displacacement respt amplitude r
149
e sensitive toocity.
ontal accelerad the auxiliaryop floor acce
m top floor ac
cement respoponse amplitrelative to 10
o the mome
ration spectry building uneleration specceleration s
onses at difftude and (b) 0% cruising
entum of the
(b)
um value fornder differenectrum of thespectrum of
(b)
ferent impactnormalized speed.
e loading, w
r the reactor nt impact e auxiliary the reactor
t velocities:
which

5.5.2
This partfunctionsfunction representloading-floading comparedloading sto a real loading s
BconsidereSimilarlyfunctions
TmaximumFirst, theinvestigathese figu
Figu
Sensitivity
t of study ins were cons
for the Boted by the refunction shaforce shaped to the origshapes were
aircraft loashape on the
Besides the ed, which hay, the force s remained th
The responsem value of the response oated as showures was the
re 5.46 Dlo
y of Respo
nvestigated dstructed so toeing-747 aed line in Figapes—numbes, respectivginal aircraft
the same. Nading functio
response.
three loadinad the same amplitudes
he same as t
of the isolahe responsef the maxim
wn in Figuree real respon
Different loadoading funct
onses to C
different loathat they haat cruising gure 5.46. Ters 5 and 6vely. The aft loading funNote that theon; they are
ng functionsloading shawere adjust
the original t
ated PGSFR s discussed
mum drift ane 5.47 and Fse amplitude
ding-functionions had the
150
hange of L
ading-functioad the same speed corre
Then, with th6—were conareas undernnction, indice rectangular
used in thi
s described,apes as the fted so that tthree.
under each and compar
nd rotation rFigure 5.48. e and not the
n shapes cone same mome
Loading-Fu
on shapes; s total momeesponded tohe same duranstructed wneath the fcating that thr and triangls part of stu
, another thfirst three buthe moment
of the scenared for differresponse of t
Note that the normalized
nsidered in thentum value
unction Sh
see Figure 5entum. The o loading sation of load
with rectanguforce curve he momentule loading dudy to exam
hree loadingut twice the tums for the
arios was detrent loadingthe AUX anhe response
d response ra
his section. Ae.
hapes
5.46. The loaoriginal loa
shape numbding, anotheular and tri
were the um of these do not corresmine the effe
g functions loading duraese three loa
termined, ang-function shnd the RCB e characterizatio.
All the
ading ading er 4, r two angle same three
spond ect of
were ation. ading
nd the hapes.
were zed in

Figu
Figu
TmomentuHoweverrelative lfor theselarger thaloading slarger tha
re 5.47 Mmre
re 5.48 Mmro
The responseums are the sr, if we comploading forcee two are thean loading sshape 5, whan Scenario
(a)
Maximum drifmaximum drifesponse of t
(a)
Maximum rotamaximum rotaotation respo
e shown in Fsame for all pare the relae amplitude e same. For shape 6, whihich was rec
4, which w
ft response uft response ohe reactor co
ation responation respononse of the r
Figure 5.47 cases, the re
ative responsof the six loexample, th
ich had a tritangular in
was larger tha
151
under differeof the auxiliaontainment b
nse under difnse of the aureactor conta
and Figure esponses arese amplitudeoading functhe maximumangular loadshape, and tan loading S
ent loading-fary building abuilding.
fferent loadinuxiliary buildainment build
5.48 indicate different foe among the tions, it is clm loading foding-functiothe responseScenario 5.
(b)
unction shapand (b) maxi
(b)
ng-function sing and (b) mding.
tes that althor different losix loading lear that the orce for loadn shape, ande for loadingIf the loadin
pes: (a) imum drift
shapes: (a) maximum
ough the loaoading functscenarios anrelative rela
ding shape 4d was largerg scenario 6ng function
ading tions.
nd the ations 4 was r than 6 was has a

152
higher maximum loading force, then the response of the AUX and the RCB is larger. This is consistent with the previous conclusion, i.e., the responses of the AUX and the RCB are sensitive to the force amplitude. Although we had the same momentum for different loading-function shapes, because the force amplitudes were different, the responses in the high-frequency range were different.
The responses of the floor acceleration for the RCB and the AUX are shown in Figure 5.49. Per the previous part of the study of different impact velocities, the response at the isolation dominant period should be sensitive to the loading momentum, and the responses at the superstructure frequency range should be sensitive to the force amplitude. As shown in Figure 5.49, the floor acceleration response at the isolation period—represented by the red line—changed only slightly for different loading-function shapes since all the loading scenarios had the same loading momentum. However, for floor accelerations in the superstructure frequency range—represented by the blue and black lines—the responses varied considerably for different loading-function shapes. The relative response amplitudes for each loading shape was the same as the relative loading force amplitudes since the response at this high-frequency range is more sensitive to the loading force.
Finally, maximum isolator displacements are shown in Figure 5.50. It is clear that for loading shapes 4, 5, and 6, the amplitudes of the response are almost the same, while for the first three loading shapes the response is slightly different. Note that for loading shapes 1, 2, and 3, the loading duration is doubled and around 0.6 sec; the impulse effect is much smaller since the loading duration is approaching the effective fundamental period of the isolator. Therefore, the responses of the isolator displacement for these three loading scenarios tended to be more sensitive to the amplitude of force. For loading shapes 4, 5, and 6, the loading duration was twice as short; therefore, the loading was more like an impulse to the isolation system as the response for the isolator displacement is more sensitive to the loading momentum. Therefore, the response amplitudes of the maximum isolator displacement of loading scenarios 4, 5, and 6 were similar since the momentum of different loading shapes were the same.

Figu
Figu
5.5.3 S
For this under difimpactinfunctions
Bthe force
re 5.49 Mcfuare
re 5.50 Mfu
Summary o
part of analfferent aircrag at differes.
Based on Rie amplitude o
(a)
Maximum topontainment bunction shapuxiliary buildeactor conta
Maximum isounction shap
of the Sens
lysis, the stuaft impact lont speeds w
era’s theory,of the resulti
p floor horizobuilding andpes: (a) maxiding and (b) inment build
lator displacpes.
sitivity Stud
udy focusedoading condiwere conside
if the impaing loading f
153
ontal accelerad the auxiliarymum top flomaximum to
ding.
cement respo
dy
d on the maxitions. The lered togethe
ct velocity ofunction sho
ration spectry building un
oor acceleratop floor acce
onses under
ximum resploading conder with diff
of the aircraould increase
(b)
um value fornder differenion spectrum
eleration spe
r different loa
ponse of the ditions for aferent shape
aft is linearlye at a quadra
r the reactor nt loading-m of the ectrum of the
ading-
isolated PGa Boeing-747es of the loa
y increasing,atic rate whil
e
GSFR 7-400 ading
, then le the

154
total momentum of the loading increases at a linear rate. Since the loading duration is short, the response with the fundamental frequency around the isolation period, such as the total isolator displacement and the floor spectrum at the isolation dominant frequency range, will be sensitive to the momentum of the loading, and the loading can be treated as an impulse. However, the response with fundamental frequencies around the superstructure period, such as the responses of the RCB and the AUX above the isolation plane, amplitudes are sensitive to the maximum loading force since the loading cannot be treated as an impulse.
For the linearly increasing aircraft impact velocities, the isolator displacement and floor acceleration spectrum at the isolation period increased linearly, while the floor accelerations at the high-frequency range increased more or less at a quadratic rate. For different loading-function shapes with same loading momentum, the response of the isolator displacement and the floor acceleration spectrum at the isolation period range remained similar, while the amplitudes of the responses of auxiliary and RCB changed according to the maximum force amplitudes of the loading functions.
5.6 RESPONSE COMPARISON BETWEEN THE AIRCRAFT IMPACT ANALYSIS AND SEISMIC ANALYSIS
Responses under aircraft impact are compared in this section with results for seismic excitations under PGA 0.3g events. Comparisons were made in terms of the peak drift response, floor acceleration response, and the isolator deformation response. Both the fixed-base and the base-isolated cases were included in the comparison. For the base-isolated case, the fundamental parameter combinations used are: Tiso = 3 sec, Fy = 10% W, and Kinitial/Kpostyield = 10. In this section, only aircraft impact load scenarios 1 and 4 (which correspond to a Boeing-737-900 impact and a Boeing-747-400 impact both in the H2 direction) were compared with the median response under seismic event for the PGA set at 0.3g.
For the fixed-base case where the aircraft impacts with the AUX, there was no effect on the RCB in the simplified model; the base was assumed to be completely rigid. The response of the AUX in the H2 direction under the Boeing-737 impact and the dynamic response under PGA 0.3g seismic excitation were compared. The drift responses for these conditions are shown in Figure 5.51, where the response under aircraft impact of a Boeing-737 was about one-third of that under a PGA of 0.3g.
In terms of the floor acceleration spectra, it is clear that the response under aircraft impact of Boeing-737 was small compared to the seismic event considered here, as shown in Figure 5.52. The shapes of the floor spectra are similar for the two loading cases, but the spectral ordinates for the AIA were smaller than for the seismic loading case. For the base-isolated case, the RCB drifts and floor spectra are compared in Figure 5.53 and Figure 5.54. Since aircraft impact on AUX also triggered a response of the RCB, one can see significant response in the RCB compared to the fixed-base case. Nonetheless, the overall response in the RCB under aircraft loading is smaller than for the seismic response (PGA 0.3g). For the AUX (Figure 5.55 and Figure 5.56), the story drifts near the floor where the aircraft impact occurred were slightly larger than the maximum drift response obtained from seismic condition. For the floor acceleration response in the high-frequency range, the aircraft impact loading was similar

155
compared to the seismic response. At the lower frequency range, the response was much smaller compared to the seismic response.
The largest isolator displacement for the aircraft impact loading is around 38 mm (1.5 in); for the seismic analysis, the median bearing displacement demand was 107 mm (4.2 in). Therefore, for the aircraft impact of the smaller-sized plane, the bearing size considered in the seismic design is adequate.
Aircraft load scenario 4 corresponds to the impact of a Boeing-747 in the H2 direction. The response to this impact is compared to the response to a seismic event having a PGA of 0.3g. Both fixed-base and base-isolated cases were considered. The maximum drift response is shown in Figure 5.57 for the fixed-base AUX. For the larger and faster aircraft, drift response was larger than the response to seismic excitation, although the overall drift response for both cases was relatively small.
For the floor acceleration response, the peak of the floor spectra lies around the AUX’s fundamental frequency. The floor spectra for the AIA and seismic analyses are almost the same; however, because of the very short duration of the impact loading, the floor spectrum for the aircraft impact is much smaller in the low-frequency range than the seismic excitation; see Figure 5.58.
For the base-isolated cases, the RCB responses are compared in Figure 5.59 and Figure 5.60. Even if the aircraft does not directly impact the RCB, the drift response due to aircraft impact is still larger than for the seismic response. For the floor pseudo-acceleration response spectrum, the RCB has a smaller response due to aircraft impact than for seismic excitation in the low-frequency range (near the isolation period). The opposite is true in the higher frequency ranges; see Figure 5.60. For the AUX, aircraft impact also results in much higher floor acceleration responses in the higher frequency range but a smaller response at the lower frequency range; see Figure 5.62. The drift response due to the Boeing-747 aircraft impact is larger in comparison to the seismic response; see Figure 5.61.
The largest isolator displacement for the aircraft loading Case 4 is around 280 mm (11 in.), while the median bearing displacement demand for the seismic analysis is 107 mm (4.2 in.). Therefore, the demand from aircraft impact is much larger than the seismic demand. Thus, the design of the isolator is governed by the AIA for this specific case. Note: beyond DBE excitations might result in larger seismic isolator demands. These were not considered herein.

Figu
re 5.51 FSP
loor peak drScenario 1 (BPGA 0.3g eve
rift responsesBoeing-737 atent; response
156
s along heigt location 1) es are for the
ght for the auand seismice fixed-base
uxiliary buildc condition u
case.
ing. Impact nder the

Figu
re 5.52 F(Bre
loor acceleraBoeing-737 aesponses are
ation spectraat Location 1e for the fixe
157
a for the aux) and seismi
ed-base case
xiliary buildinic condition
e.
ng. Impact Scunder PGA 0
cenario 1 0.3g event;

Figu
re 5.53 Fbc(F
loor peak druilding. Impaondition undFy = 10% W, K
rift responsesact Scenarioder PGA 0.3gKinitial = 10 Kp
158
s along heigo 1 (Boeing-7g event; resppostyield, and T
ght for the rea737 at locatioponses are foTiso = 3 sec).
actor containon 1) and seior the base-is
nment smic solated casee

Figu
re 5.54 FS01
loor acceleraScenario 1 (B
.3g event; re0 Kpostyield, an
ation spectraBoeing-737 atesponses arend Tiso = 3 se
159
a for the react location 1) e for the baseec).
ctor containmand seismice-isolated ca
ment buildinc condition uase (Fy = 10%
ng. Impact nder PGA
% W, Kinitial =

Figu
re 5.55 FS01
loor peak drScenario 1 (B
.3g event; re0 Kpostyield, an
rift responseBoeing-737 aesponses arend Tiso = 3 se
160
es along heigat location 1e for the basec).
ght for the a1) and seismse-isolated c
auxiliary builmic conditioncase (Fy = 10
lding. Impacn under PGA0% W, Kinitial =
ct A =

Figu
re 5.56 F(Brea
loor acceleraBoeing-737 aesponses arend Tiso = 3 se
ation spectraat location 1)e for the basec).
161
a for the aux) and seismicse-isolated ca
xiliary buildinc condition uase (Fy = 10%
ng. Impact Scunder PGA 0% W, Kinitial =
cenario 1 0.3g event;
10 Kpostyield,

Figu
re 5.57 FS0
loor peak drScenario 4 (B
.3g event; re
rift responsesBoeing-747 atesponses are
162
s along heigt location 1) e for the fixed
ght for the auand seismicd-base case
uxiliary buildc condition u.
ing. Impact nder PGA

Figu
re 5.58 F(Bre
loor acceleraBoeing-747 aesponses are
ation spectraat location 1)e for the fixe
163
a for the aux) and seismiced-base case
xiliary buildinc condition ue.
ng. Impact Scunder PGA 0
cenario 4 0.3g event;

Figu
re 5.59 Fbc(F
loor peak druilding. Impaondition undFy = 10% W, K
rift responsesact Scenarioder PGA 0.3gKinitial = 10 Kp
164
s along heigo 4 (Boeing-7g event; resppostyield, and T
ght for the rea747 at locatioponses are foTiso = 3 sec).
actor containon 1) and seior the base-is
nment smic solated casee

Figu
re 5.60 FS01
loor acceleraScenario 4 (B
.3g event; re0 Kpostyield, an
ation spectraBoeing-747 atesponses arend Tiso = 3 se
165
a for the react location 1) e for the baseec).
ctor containmand seismice-isolated ca
ment buildinc condition uase (Fy = 10%
ng. Impact nder PGA
% W, Kinitial =

Figu
re 5.61 FS01
loor peak drScenario 4 (B
.3g event; re0 Kpostyield, an
rift responsesBoeing-747 atesponses arend Tiso = 3 se
166
s along heigt location 1) e for the baseec).
ght for the auand seismice-isolated ca
uxiliary buildc condition uase (Fy = 10%
ing. Impact nder PGA
% W, Kinitial =

Figu
re 5.62 F(Brea
loor acceleraBoeing-747 aesponses arend Tiso = 3 se
ation spectraat location 1)e for the basec).
167
a for the aux) and seismicse-isolated ca
xiliary buildinc condition uase (Fy = 10%
ng. Impact Scunder PGA 0% W, Kinitial =
cenario 4 0.3g event;
10 Kpostyield,
168
5.7 SUMMARY OF OBSERVATIONS AND CONCLUSIONS
In this chapter, a preliminary and simplified AIA was conducted using a fixed-base and base-isolated model of the PGSFR. Three impact locations were considered. At these locations two simplified force functions were imposed to simulate the impact of Boeing-737 and Boeing-747 planes flying at their cruising velocities. For the isolated condition, several different sets of isolation bearings were considered to explore the effect of a range of initial (elastic) bearing stiffnesses, post-yield stiffness, and the bearing yield strength. The numerical model consisted of two elastic, lumped-mass “stick” models representing the RCB and the surrounding AUX, where the RCB was idealized as being significantly offset from the center of the AUX. Detailed modeling at the location of impact was not included.
In terms of the global response of the PGSFR, the NPP is able to resist aircraft impact when the structure is seismically isolated. For the impact scenarios considered, peak bearing displacements ranged from 25 mm (1 in.) to about 300 mm (12 in.). While these beyond-design-basis events were beyond the demands posed by the postulated SSE, bearing technology exists to easily achieve these displacement demands. Moreover, current regulatory trends and considerations of subsequent siting of the PGSFR in locations of higher seismic hazard would suggest that bearing capacities greater than the median SSE demands should be provided.
The results illustrate some interesting behavior of the seismically isolated PGSFR when impacted by a large commercial aircraft. In terms of in-structure accelerations that might adversely affect sensitive equipment and components, it appears that for impact scenarios involving fast-moving heavy aircraft, the peak accelerations in the isolated AUX were significantly reduced in the upper levels and at levels where impact occurred. However, since the isolated structure tends to move as a rigid block, the lower levels in the plant also experienced roughly the same accelerations. For a conventional fixed-base facility, the floor accelerations tended to be high at the roof and zero at the base. In the isolated PGSFR, the accelerations in the AUX were nearly uniform over the height of the structure, being lower at the top and higher at the bottom compared to the fixed-base design. The isolation system was particularly effective in reducing the peaks in floor spectra that may occur near the fundamental frequency of the structure. The peaks of response spectra at upper floors of the AUX were reduced by factors up to and including five compared to the fixed-base structure.
Impact by lighter and slower moving aircraft resulted in behavior far more complex: the bearing displacements were generally quite low, and the bearings responded in what might be considered the nominal elastic range of behavior. Thus, the effectiveness of the isolation system was controlled by the initial elastic stiffness of the bearings. Nonetheless, the design of the system is likely to be controlled by the impact of heavy, fast-moving aircraft.
In the case of an idealized rigid foundation for the fixed-base PGSFR, a plane impacting the surrounding AUX did not result in any vibration of the RCB; however, because in the base-isolated PGSFR the AUX and RCB were supported on a common, seismically isolated, raft foundation, the RCB vibrated as a result of the aircraft impact with the AUX. In fact, the accelerations developed in the RCB were often significantly larger than in the AUX. This counterintuitive behavior seems to be a result of the dynamics of the current model of the RCB, which is characterized by high mass in its lower levels and a lighter and more flexible shell structure above the fourth level. As a result, the upper levels tended to amplify the acceleration

169
responses considerably in a manner reminiscent of a “penthouse” effect. Thus, some special design consideration may be desirable in the design of the RCB.
Drifts and other distortions of the structures above the mat level were relatively small. Significant internal forces may result, but at this point the general layouts and structural details of the PGSFR are not known well enough to justify more detailed analyses than presented herein. Note that the asymmetry of the PGSFR and the eccentricity of several of the impact scenarios resulted in substantial torsional response of the plant. These torsional movements doubled the isolator demands in some cases. Thus, various approaches for mitigating torsion by increasing the resistance of the isolation plane to torsional motion should be explored.
There is a disproportionate increase in the response of the fixed-base structure for increases in the aircraft’s weight or velocity. The isolated system was much more effective at mitigating these increases than the fixed-base structure. The isolation system was relatively effective in limiting the growth of accelerations, drifts, and other in-structure actions. That said, bearing displacements and torsional deformations may become quite large.
Some more specific observations and findings in this chapter are:
The floor accelerations in the isolated PGSFR due to aircraft impact from Boeing-747 are similar to those resulting from the response under the design-level earthquake.
There is a large difference in response between the impact from a Boeing-737 and a Boeing-747. The response to impact of the Boeing-747 was almost five times larger than the response to impact of the Boeing-737.
Offset of the impact relative to the center-of-resistance of the PGSFR introduces torsional response. It is expected that the rotation for base-isolated case is on the order of 0.2.

170

171
6 SUMMARY AND RECOMMENDATIONS FOR FUTURE RESEARCH
6.1 SUMMARY
This report presents the results of a preliminary investigation of the feasibility of seismically isolating the Prototype Gen-IV Sodium Cooled Fast Reactor (PGSFR) being designed by KEPCO Engineering and Construction Company, Inc. A series of analytical studies were carried out to assess the dynamic response of simplified models of the PGSFR to SSE-level seismic events and aircraft impacts.
The literature review in Chapter 2 discussed the work done to date that has been carried out globally to move various types of fast reactors from being theoretical concepts to commercial production facilities. The special features of fast reactors, which typically include complex equipment that is delicate and heavy, and operate at high temperatures, raise safety concerns in the event of an earthquake. For that reason, nearly all of the literature suggests that fast reactor facilities be seismically isolated.
Based on the literature, seismic isolation of these facilities is indeed feasible and desirable. However, there is no consensus currently on the best approach to seismically isolate these structures, and engineering details of how certain technical issues can be resolved for a particular plant design are not publicly available. Some designs propose isolation for the horizontal components of motion only. Other designs address the vertical components of ground motion through the use of isolator subassemblies that provide 3D isolation capabilities, or by providing separate mechanisms for horizontal and vertical isolation. There is no general agreement on the optimum type of isolator devices to be used or on the mechanical properties of the devices selected. Similarly, only a few studies have addressed regulatory concerns, including consideration of beyond-design-basis seismic events and aircraft impact.
Two relatively simple but comprehensive computational studies were undertaken to facilitate this assessment. Since few general arrangement details are currently available, the numerical models used in these studies were simplified to provide as much information as possible about the general effects of seismic isolation on the PGSFR. In keeping with the preliminary nature of this investigation, SSI effects were disregarded, the superstructure was assumed to remain elastic.
As reported in Chapter 3, a rigid body representative of the estimated weight of the PGSFR was used as part of a large parametric study that examined the effect of a wide variation

172
of isolator properties on seismic response. For strong and stiff structures supported on seismic isolators, the supported structure tends to respond as a rigid body. This approximation is reasonable for studies focused on the global response of the isolation system. As such, a wide range of bearing properties was investigated. These studies indicate that a wide range of seismic isolation systems is likely to be practicable for SSE-level events. Although isolator displacements for SSE events of the type considered do not require large displacement capacities and are capable of reducing seismic demands by a large amount, there are tradeoffs: weaker or softer isolators result in higher lateral displacements of the bearings, while stronger and stiffer bearings result in higher forces transmitted to the superstructure.
With that background, the second set of analyses was carried out (see Chapter 4) based on a refined, yet simplified numerical model of the PGSFR. The model consisted of traditional lumped-mass stick models for the RCB and AUX. These were developed based on current information available about the general layout of the PGSFR. The two models were in turn supported on a mat foundation. This foundation was supported on a distributed set of seismic isolators or rigidly attached to the ground (the fixed-base condition). Comparisons were made between the fixed-base model and models having an informed set of bearing modeling parameters based on the rigid body analyses of Chapter 3. These parameters represented the initial loading “elastic” stiffness, the effective yield strength, and post-yield stiffness of the bearing. Results were evaluated in terms of bearing response, the peak story drifts, peak total accelerations, floor response spectra, and peak floor level rotations about a vertical axis. Results were examined separately for the RCB and AUX.
It was found that including seismic isolation lowered substantially the seismic demands at the SSE level. The predicted demands on the seismic isolators were well within the capabilities of current isolator technologies. Story drifts and floor level accelerations were generally reduced, sometimes substantially, by the many isolation systems considered. Torsional response of the eccentric layout of the superstructure was significant. It was noted that the initial stiffness of the bearings was very important as recommended values aligned with the natural frequency of the supported structure. Fine-tuning of bearing properties, and perhaps modification of the plant layout, can optimize performance. Comparisons of floor response spectra (and other response parameters) for the isolated plant at the SSE-level excitation, with the fixed-base plant at the OBE level of excitation, indicated that in many cases isolation was able to achieve OBE-like performance when the plant was subjected to an earthquake three times larger than the OBE. Note: this was not always the case, and fine tuning of the isolation design is needed considering the specific SSCs of concern in the facility. The maximum responses for each case considered in the parametric analysis presented in Chapter 4 are summarized in Table 6.1.

173
Table 6.1(a) Summary of results of seismic analysis for different cases.*
Parameters considered Max. drift (%)
Floor acceleration spectrum (Unit: g)
Reactor containment building
MF MF MF TF TF TF
Tiso (sec) Kinitial/ Kposty. Fy/W Rec. Bld. Aux. Bld. Iso (0.5–2 Hz) Rec (4.5–10 Hz) Aux (11–13 Hz) Iso (0.5–2 Hz) Rec (4.5–10 Hz) Aux (11–13Hz)
3 5 10% 0.022 0.008 0.57 0.81 0.42 0.58 1.16 0.72 3 10 10% 0.022 0.008 0.64 0.82 0.44 0.65 1.18 0.79 3 100 10% 0.026 0.009 0.75 0.85 0.57 0.90 1.31 1.03 2 10 10% 0.023 0.009 0.75 0.82 0.45 0.77 1.19 0.78 3 10 10% 0.022 0.008 0.64 0.82 0.44 0.65 1.18 0.79 4 10 10% 0.022 0.007 0.61 0.82 0.44 0.62 1.18 0.79 3 10 5% 0.019 0.006 0.35 0.79 0.41 0.36 1.15 0.74 3 10 10% 0.022 0.008 0.64 0.82 0.44 0.65 1.18 0.79 3 10 15% 0.022 0.009 0.82 0.83 0.46 0.84 1.20 0.81 3 10 20% 0.024 0.011 0.99 0.84 0.48 1.02 1.21 0.81
Fixed-base PGA 0.1g 0.009 0.010 0.37 0.61 0.36 0.40 1.13 0.45 Fixed-base PGA 0.3g 0.028 0.031 1.10 1.84 1.08 1.20 3.40 1.36
Table 6.1(b) Summary on results of seismic analysis for different cases [continuation of Table 6.1(a)].*
Parameters considered
Floor acceleration spectrum (Unit: g)
Bearing disp. [mm (in.)]
Auxiliary building
BF BF BF MF MF MF TF TF TF
Tiso (sec)
Kinitial/ Kposty.
Fy/W Iso (0.5–2
Hz) Rec (4.5–10
Hz) Aux (11–13
Hz) Iso (0.5–2
Hz) Rec (4.5–10
Hz) Aux (11–13
Hz) Iso (0.5–2
Hz) Rec (4.5–10
Hz) Aux (11–13
Hz)
3 5 10% 0.56 0.51 0.30 0.56 0.38 0.29 0.56 0.39 0.35 151(5.96) 3 10 10% 0.61 0.52 0.31 0.61 0.37 0.29 0.62 0.38 0.35 107(4.20) 3 100 10% 0.64 0.76 0.49 0.69 0.42 0.37 0.72 0.57 0.44 65(2.56) 2 10 10% 0.72 0.53 0.33 0.72 0.39 0.30 0.73 0.42 0.34 101(3.99) 3 10 10% 0.61 0.52 0.31 0.61 0.37 0.29 0.62 0.38 0.35 107(4.20) 4 10 10% 0.59 0.51 0.32 0.59 0.37 0.29 0.59 0.39 0.35 113(4.47) 3 10 5% 0.35 0.50 0.29 0.36 0.36 0.27 0.36 0.38 0.34 133(5.23) 3 10 10% 0.61 0.52 0.31 0.61 0.37 0.29 0.62 0.38 0.35 107(4.20) 3 10 15% 0.79 0.53 0.32 0.78 0.39 0.30 0.79 0.42 0.35 97(3.84) 3 10 20% 0.95 0.55 0.34 0.93 0.40 0.31 0.95 0.44 0.37 92(3.61)
Fixed-base PGA 0.1g 0.33 0.39 0.31 0.35 0.84 0.29 0.36 1.21 0.34 NA Fixed-base PGA 0.3g 1.00 1.18 0.92 1.06 2.51 0.88 1.09 3.63 1.03 NA
*MF = middle floor, TF = top floor, BF = base floor, Rec.Bld. = reactor containment building, Aux.Bld. = auxiliary building; Iso (0.5 Hz–2 Hz) = isolation frequency range, Rec (4.5 Hz–10 Hz) = reactor containment building frequency range; and Au (11 Hz–13 Hz) = auxiliary building frequency range.

174
Recommendations on selecting specific bearing properties were made based on the results for the seismic event level considered. For the initial bearing stiffness, a smaller value will reduce the horizontal floor acceleration spectrum at all frequency ranges. Smaller values of the post-yield stiffness and the bearing strength will reduce significantly the floor spectrum at the isolation predominate frequency range (0.5–2 Hz), but it will have little effect on the response at other frequency ranges; therefore, for seismic considerations, smaller initial stiffness, smaller bearing strength, and larger isolation period are desired as long as the resulting bearing displacement is acceptable. Since the seismic input considered in the study is fairly small, the selection of smaller parameters for the isolator will result in a reasonable bearing displacement demand.
An issue of recent regulatory concern has been the effect of aircraft impact. Few studies have been made of the effects of aircraft impact on any type of structures. While considerable work has been undertaken to analyze and design nuclear facilities to resist aircraft impact, it is prudent to carefully identify any special or new issues introduced by seismically isolating a nuclear facility such as the PGSFR. A series of numerical studies similar to those undertaken in Chapter 5 was done to assess the effect of aircraft impact on the seismically isolated PGSFR. In this preliminary study, two different planes and three impact locations were considered. As in Chapter 5, several combinations of bearing characteristics were considered, including one having different initial stiffness, yield strength, and post-yield tangent stiffness. As shown in Chapter 5, although the demands on the isolators due to the aircraft impact scenarios considered were modest, they were larger in some cases than seismic demands at the SSE level. Nonetheless, the bearing displacement demands predicted were well within the capabilities of modern bearings. Generally, no major problems were identified in this study.
Some interesting observations regarding aircraft impact on an isolated PGSFR include: (1) that for lighter, and slower moving aircraft, the response is likely to remain in the elastic range of isolator behavior, so that the initial elastic stiffness of the bearing is a more important consideration than it is for large seismic excitations; (2) the isolated plant moves as a nearly rigid body, so while the accelerations in the upper parts of the AUX are significantly reduced by isolation, accelerations in the lower part of the plant increased compared to the fixed-base PGSFR. In terms of aircraft impact, the RCB was largely shielded by the surrounding AUX and ideally would not vibrate at all if the impact occurred on the AUX. However, since the isolation system considered herein placed the RCB and AUX on a common isolated base mat, an aircraft striking the AUX would trigger strong vibrations in the RCB. Typically, the global responses of the superstructure are within the range developed under the SSE motions, so aircraft impact may not control the design. Further study is needed on this topic.
Another observation regarding aircraft impact is that off-center strikes may result in significant torsional global response of the plant. These deformations were seen to double the demands on some of the isolators. Thus, studies to assess methods to help the isolation layer resist torsional movement are desired. Although off-center aircraft impact by a heavy, fast moving aircraft was seen to lead to bearing displacements significantly larger than demands for the SSE, it is expected that aircraft impact bearing displacements may not control the design if procedures like those being considered by the U.S. NRC are followed that require isolation bearings to be able to withstand with high confidence a beyond-design-basis earthquakes without hitting a hard stop. Thus, it seems that the PGSFR concept lends itself to seismic isolation, but

175
continued investigations related to the specifics of the plant design and underlying technological basis are needed.
The responses for the different cases considered for the aircraft impact analyses in Chapter 5 are summarized in Table 6.2–Table 6.7. By comparing responses for different bearing properties, recommendations for bearing selection can be made relative to aircraft impact. Smaller initial stiffness, larger isolation period, and lower bearing strength will result in smaller floor acceleration spectrum for the AUX but will have little effect on the RCB—although large bearing displacement demand and rotational response will be expected. Since the bearing displacement demand under impact of a Boeing-747 considered herein is larger than the demand from seismic consideration, displacement capacity of isolator in design is controlled by aircraft impact response. In closing, in terms of either a seismic event or aircraft impact, as long as the resulting bearing displacement under the aircraft-impact evaluation is smaller than the allowable displacement capacity of bearing, a smaller initial stiffness, lower strength, and larger post-yield isolation period are recommended.

176
Table 6.2(a) Summary of results of aircraft impact analysis of Boeing-737 impact at location 1.*
Parameters considered Max. drift (%) Max. rotation
()
Floor acceleration spectrum (Unit: g)
Reactor containment building
MF MF MF TF TF TF
Tiso (sec) Kinitial/ Kposty. Fy/W Rec. Bld. Aux. Bld. Rec. Bld. Aux. Bld.
Iso (0.5–2 Hz) Rec (4.5–10 Hz) Aux (11–13 Hz) Iso (0.5–2 Hz) Rec (4.5–10 Hz) Aux (11–13Hz)
3 5 10% 0.009 0.008 0.044 0.045 0.14 0.34 0.30 0.14 0.81 0.64
3 10 10% 0.009 0.008 0.033 0.033 0.17 0.35 0.31 0.17 0.81 0.64
3 100 10% 0.012 0.009 0.010 0.010 0.18 0.42 0.38 0.25 0.94 0.70
2 10 10% 0.009 0.008 0.031 0.032 0.18 0.35 0.31 0.19 0.81 0.64
3 10 10% 0.009 0.008 0.033 0.033 0.17 0.35 0.31 0.17 0.81 0.64
4 10 10% 0.009 0.008 0.033 0.034 0.16 0.35 0.31 0.17 0.81 0.64
3 10 5% 0.009 0.008 0.038 0.038 0.13 0.34 0.31 0.14 0.81 0.64
3 10 10% 0.009 0.008 0.033 0.033 0.17 0.35 0.31 0.17 0.81 0.64
3 10 15% 0.009 0.008 0.031 0.032 0.19 0.35 0.31 0.20 0.81 0.64
3 10 20% 0.009 0.008 0.030 0.031 0.20 0.35 0.32 0.22 0.81 0.64
Fixed base 0.000 0.010 0.000 0.002 0.00 0.00 0.00 0.00 0.00 0.00
Table 6.2(b) Summary of results of aircraft impact analysis of Boeing-737 impact at location 1.*
Parameters considered
Floor acceleration spectrum (Unit: g)
Bearing disp. [mm (in.)]
Auxiliary building
BF BF BF MF MF MF TF TF TF
Tiso (sec) Kinitial/ Kposty.
Fy/W Iso (0.5–2
Hz) Rec (4.5–10
Hz) Aux (11–13
Hz) Iso (0.5–2
Hz) Rec (4.5–10
Hz) Aux (11–13
Hz) Iso (0.5–2
Hz) Rec (4.5–10
Hz) Aux (11–13
Hz)
3 5 10% 0.13 0.52 0.38 0.13 0.27 0.24 0.12 0.46 0.30 51(2.02) 3 10 10% 0.15 0.53 0.38 0.15 0.28 0.23 0.15 0.46 0.31 38(1.51) 3 100 10% 0.09 0.56 0.40 0.13 0.35 0.28 0.15 0.42 0.33 12(0.49) 2 10 10% 0.17 0.53 0.38 0.15 0.28 0.23 0.15 0.46 0.31 36(1.43) 3 10 10% 0.15 0.53 0.38 0.15 0.28 0.23 0.15 0.46 0.31 38(1.51) 4 10 10% 0.15 0.53 0.38 0.14 0.28 0.23 0.14 0.46 0.31 39(1.54) 3 10 5% 0.12 0.52 0.38 0.13 0.27 0.23 0.13 0.46 0.31 44(1.75) 3 10 10% 0.15 0.53 0.38 0.15 0.28 0.23 0.15 0.46 0.31 38(1.51) 3 10 15% 0.17 0.53 0.38 0.16 0.28 0.23 0.16 0.46 0.31 36(1.43) 3 10 20% 0.19 0.53 0.38 0.16 0.28 0.23 0.16 0.46 0.31 35(1.38)
Fixed base 0.00 0.00 0.00 0.04 0.51 0.38 0.07 0.82 0.45 NA
*MF = middle floor, TF = top floor, BF = base floor, Rec.Bld. = reactor containment building, Aux.Bld. = auxiliary building; Iso (0.5 Hz–2 Hz) = isolation frequency range, Rec (4.5 Hz–10 Hz) = reactor containment building frequency range; and Au (11 Hz–13 Hz) = auxiliary building frequency range.

177
Table 6.3(a) Summary of results of aircraft impact analysis of Boeing-737 impact at location 2.*
Parameters considered Max. drift (%) Max. rotation ()
Floor acceleration spectrum (Unit: g)
Reactor containment building
MF MF MF TF TF TF
Tiso (sec) Kinitial/ Kposty. Fy/W Rec. Bld. Aux. Bld. Rec. Bld. Aux. Bld. Iso (0.5–2 Hz) Rec (4.5–10 Hz) Aux (11–13 Hz) Iso (0.5–2 Hz) Rec (4.5–10 Hz) Aux (11–13Hz)
3 5 10% 0.018 0.008 0.036 0.036 0.26 0.36 0.30 0.35 1.09 0.70
3 10 10% 0.019 0.008 0.025 0.025 0.28 0.38 0.32 0.38 1.10 0.72
3 100 10% 0.018 0.009 0.008 0.008 0.22 0.52 0.32 0.30 1.11 0.80
2 10 10% 0.019 0.008 0.024 0.024 0.29 0.39 0.33 0.39 1.11 0.73
3 10 10% 0.019 0.008 0.025 0.025 0.28 0.38 0.32 0.38 1.10 0.72
4 10 10% 0.019 0.008 0.025 0.026 0.28 0.38 0.32 0.37 1.10 0.72
3 10 5% 0.018 0.008 0.030 0.030 0.27 0.37 0.31 0.36 1.09 0.71
3 10 10% 0.019 0.008 0.025 0.025 0.28 0.38 0.32 0.38 1.10 0.72
3 10 15% 0.019 0.008 0.024 0.024 0.29 0.39 0.33 0.39 1.11 0.73
3 10 20% 0.020 0.008 0.023 0.023 0.30 0.39 0.33 0.39 1.12 0.73
Fixed base 0.000 0.010 0.000 0.002 0.00 0.00 0.00 0.00 0.00 0.00
Table 6.3(b) Summary of results of aircraft impact analysis of Boeing-737 impact at location 2.*
Parameters considered
Floor acceleration spectrum (Unit: g)
Bearing disp. [mm (in.)]
Auxiliary building
BF BF BF MF MF MF TF TF TF
Tiso (sec) Kinitial/
Kpostyield. Fy/W
Iso (0.5–2 Hz)
Rec (4.5–10 Hz)
Aux (11–13 Hz)
Iso (0.5–2 Hz)
Rec (4.5–10 Hz)
Aux (11–13 Hz)
Iso (0.5–2 Hz)
Rec (4.5–10 Hz)
Aux (11–13 Hz)
3 5 10% 0.16 0.64 0.36 0.14 0.24 0.21 0.14 0.54 0.35 48(1.88) 3 10 10% 0.17 0.65 0.37 0.17 0.25 0.21 0.17 0.55 0.36 35(1.36) 3 100 10% 0.12 0.63 0.43 0.14 0.32 0.26 0.15 0.45 0.36 11(0.45) 2 10 10% 0.18 0.65 0.38 0.18 0.25 0.21 0.18 0.55 0.36 33(1.29) 3 10 10% 0.17 0.65 0.37 0.17 0.25 0.21 0.17 0.55 0.36 35(1.36) 4 10 10% 0.17 0.65 0.37 0.16 0.25 0.21 0.16 0.55 0.36 35(1.39) 3 10 5% 0.16 0.64 0.36 0.13 0.25 0.21 0.13 0.54 0.35 40(1.59) 3 10 10% 0.17 0.65 0.37 0.17 0.25 0.21 0.17 0.55 0.36 35(1.36) 3 10 15% 0.19 0.65 0.38 0.18 0.25 0.21 0.19 0.55 0.36 33(1.28) 3 10 20% 0.20 0.65 0.38 0.20 0.25 0.21 0.20 0.55 0.36 31(1.24)
Fixed base 0.00 0.00 0.00 0.04 0.51 0.38 0.07 0.82 0.45 NA
*MF = middle floor, TF = top floor, BF = base floor, Rec.Bld. = reactor b containment building, Aux.Bld. = auxiliary building; Iso (0.5 Hz–2 Hz) = isolation frequency range, Rec (4.5 Hz–10 Hz) = reactor containment building frequency range; and Au (11 Hz–13 Hz) = auxiliary building frequency range.

178
Table 6.4(a) Summary of results of aircraft impact analysis of Boeing-737 impact at location 3.*
Parameters considered
Max. drift (%) Max. rotation ()
Floor acceleration spectrum (Unit: g)
Reactor containment building
MF MF MF TF TF TF
Tiso (sec) Kinitial/ Kpostyield. Fy/W Rec. Bld.
Aux. Bld.
Rec. Bld.
Aux. Bld. Iso (0.5–2 Hz) Rec (4.5–10 Hz) Aux (11–13 Hz) Iso (0.5–2 Hz) Rec (4.5–10 Hz) Aux (11–13Hz)
3 5 10% 0.011 0.006 0.000 0.000 0.18 0.44 0.41 0.24 0.94 0.73
3 10 10% 0.012 0.007 0.000 0.000 0.20 0.45 0.42 0.27 0.95 0.75
3 100 10% 0.013 0.007 0.000 0.000 0.18 0.48 0.38 0.25 0.93 0.75
2 10 10% 0.012 0.007 0.000 0.000 0.21 0.46 0.43 0.27 0.96 0.75
3 10 10% 0.012 0.007 0.000 0.000 0.20 0.45 0.42 0.27 0.95 0.75
4 10 10% 0.012 0.007 0.000 0.000 0.20 0.45 0.42 0.26 0.95 0.74
3 10 5% 0.012 0.006 0.000 0.000 0.19 0.45 0.41 0.25 0.95 0.74
3 10 10% 0.012 0.007 0.000 0.000 0.20 0.45 0.42 0.27 0.95 0.75
3 10 15% 0.012 0.007 0.000 0.000 0.21 0.46 0.43 0.27 0.96 0.75
3 10 20% 0.012 0.007 0.000 0.000 0.21 0.46 0.43 0.27 0.96 0.75
Fixed base 0.000 0.008 0.000 0.000 0.00 0.00 0.00 0.00 0.00 0.00
Table 6.4(b) Summary of results of aircraft impact analysis of Boeing-737 impact at location 3.*
Parameters considered
Floor acceleration spectrum (Unit: g)
Bearing disp. [mm (in.)]
Auxiliary building
BF BF BF MF MF MF TF TF TF
Tiso (sec) Kinitial/
Kpostyield. Fy/W
Iso (0.5–2 Hz)
Rec (4.5–10 Hz)
Aux (11–13 Hz)
Iso (0.5–2 Hz)
Rec (4.5–10 Hz)
Aux (11–13 Hz)
Iso (0.5–2 Hz)
Rec (4.5–10 Hz)
Aux (11–13 Hz)
3 5 10% 0.14 0.52 0.40 0.14 0.26 0.22 0.14 0.43 0.32 21(0.84) 3 10 10% 0.16 0.53 0.41 0.16 0.27 0.23 0.16 0.44 0.33 16(0.61) 3 100 10% 0.10 0.49 0.42 0.13 0.33 0.29 0.14 0.38 0.34 5(0.20) 2 10 10% 0.17 0.53 0.41 0.18 0.27 0.23 0.18 0.44 0.33 15(0.59) 3 10 10% 0.16 0.53 0.41 0.16 0.27 0.23 0.16 0.44 0.33 16(0.61) 4 10 10% 0.15 0.53 0.41 0.16 0.27 0.23 0.16 0.44 0.33 16(0.62) 3 10 5% 0.12 0.53 0.40 0.12 0.26 0.22 0.12 0.43 0.32 18(0.69) 3 10 10% 0.16 0.53 0.41 0.16 0.27 0.23 0.16 0.44 0.33 16(0.61) 3 10 15% 0.18 0.53 0.41 0.18 0.27 0.23 0.18 0.44 0.33 15(0.59) 3 10 20% 0.19 0.53 0.41 0.20 0.27 0.23 0.20 0.44 0.33 15(0.57)
Fixed base 0.00 0.00 0.00 0.03 0.55 0.39 0.06 0.87 0.51 NA
*MF = middle floor, TF = top floor, BF = base floor, Rec.Bld. = reactor containment building, Aux.Bld. = auxiliary building; Iso (0.5 Hz–2 Hz) = isolation frequency range, Rec (4.5 Hz–10 Hz) = reactor containment building frequency range; and Au (11 Hz–13 Hz) = auxiliary building frequency range.

179
Table 6.5(a) Summary of results of aircraft impact analysis of Boeing-747 impact at location 1.*
Parameters considered
Max. drift (%) Max. rotation ()
Floor acceleration spectrum (Unit: g)
Reactor containment building
MF MF MF TF TF TF
Tiso (sec) Kinitial/ Kpostyield. Fy/W Rec. Bld.
Aux. Bld.
Rec. Bld.
Aux. Bld. Iso (0.5–2 Hz) Rec (4.5–10 Hz) Aux (11–13 Hz) Iso (0.5–2 Hz) Rec (4.5–10 Hz) Aux (11–13Hz)
3 5 10% 0.032 0.031 0.285 0.285 0.38 0.94 0.93 0.51 2.31 1.71
3 10 10% 0.031 0.032 0.239 0.240 0.38 0.95 0.94 0.53 2.31 1.72
3 100 10% 0.030 0.032 0.157 0.157 0.42 0.97 0.93 0.56 2.23 1.64
2 10 10% 0.031 0.032 0.197 0.198 0.47 0.97 0.95 0.56 2.31 1.72
3 10 10% 0.031 0.032 0.239 0.240 0.38 0.95 0.94 0.53 2.31 1.72
4 10 10% 0.032 0.032 0.264 0.265 0.37 0.94 0.93 0.52 2.30 1.71
3 10 5% 0.032 0.031 0.308 0.308 0.36 0.94 0.92 0.51 2.31 1.71
3 10 10% 0.031 0.032 0.239 0.240 0.38 0.95 0.94 0.53 2.31 1.72
3 10 15% 0.031 0.032 0.210 0.211 0.50 0.96 0.95 0.55 2.31 1.72
3 10 20% 0.031 0.032 0.192 0.193 0.58 0.97 0.96 0.62 2.31 1.72
Fixed Base 0.000 0.049 0.000 0.006 0.00 0.00 0.00 0.00 0.00 0.00
Table 6.5(b) Summary of results of aircraft impact analysis of Boeing-747 impact at location 1.*
Parameters considered
Floor acceleration spectrum (Unit: g)
Bearing disp. [mm
(in.)]
Auxiliary building
BF BF BF MF MF MF TF TF TF
Tiso (sec) Kinitial/
Kpostyield. Fy/W
Iso (0.5–2 Hz)
Rec (4.5–10 Hz)
Aux (11–13 Hz)
Iso (0.5–2 Hz)
Rec (4.5–10 Hz)
Aux (11–13 Hz)
Iso (0.5–2 Hz)
Rec (4.5–10 Hz)
Aux (11–13 Hz)
3 5 10% 0.37 1.40 1.03 0.50 0.82 0.80 0.48 1.17 0.77 337(13.27) 3 10 10% 0.36 1.42 1.03 0.50 0.84 0.79 0.49 1.17 0.76 288(11.32) 3 100 10% 0.30 1.38 1.00 0.45 0.87 0.78 0.44 1.11 0.73 195(7.69) 2 10 10% 0.44 1.43 1.03 0.57 0.88 0.78 0.55 1.22 0.80 233(9.18) 3 10 10% 0.36 1.42 1.03 0.50 0.84 0.79 0.49 1.17 0.76 288(11.32) 4 10 10% 0.35 1.40 1.03 0.47 0.83 0.79 0.45 1.15 0.76 319(12.54) 3 10 5% 0.24 1.39 1.03 0.46 0.81 0.80 0.45 1.15 0.78 366(14.40) 3 10 10% 0.36 1.42 1.03 0.50 0.84 0.79 0.49 1.17 0.76 288(11.32) 3 10 15% 0.47 1.43 1.03 0.53 0.87 0.78 0.52 1.20 0.78 251(9.87) 3 10 20% 0.354 1.44 1.03 0.57 0.89 0.77 0.56 1.21 0.80 229(9.01)
Fixed base 0.00 0.00 0.00 0.18 2.66 1.33 0.31 4.31 1.75 NA
*MF = middle floor, TF = top floor, BF = base floor, Rec.Bld. = reactor containment building, Aux.Bld. = auxiliary building; Iso (0.5 Hz–2 Hz) = isolation frequency range, Rec (4.5 Hz–10 Hz) = reactor containment building frequency range; and Au (11 Hz–13 Hz) = auxiliary building frequency range.

180
Table 6.6(a) Summary of results of aircraft impact analysis of Boeing-747 impact at location 2.*
Parameters considered
Max. drift (%) Max. rotation ()
Floor acceleration spectrum (Unit: g)
Reactor containment building
MF MF MF TF TF TF
Tiso (sec) Kinitial/ Kpostyield. Fy/W Rec. Bld.
Aux. Bld.
Rec. Bld.
Aux. Bld. Iso (0.5–2 Hz) Rec (4.5–10 Hz) Aux (11–13 Hz) Iso (0.5–2 Hz) Rec (4.5–10 Hz) Aux (11–13Hz)
3 5 10% 0.032 0.031 0.285 0.285 0.38 0.94 0.93 0.51 2.31 1.71
3 10 10% 0.031 0.032 0.239 0.240 0.38 0.95 0.94 0.53 2.31 1.72
3 100 10% 0.030 0.032 0.157 0.157 0.42 0.97 0.93 0.56 2.23 1.64
2 10 10% 0.031 0.032 0.197 0.198 0.47 0.97 0.95 0.56 2.31 1.72
3 10 10% 0.031 0.032 0.239 0.240 0.38 0.95 0.94 0.53 2.31 1.72
4 10 10% 0.032 0.032 0.264 0.265 0.37 0.94 0.93 0.52 2.30 1.71
3 10 5% 0.032 0.031 0.308 0.308 0.36 0.94 0.92 0.51 2.31 1.71
3 10 10% 0.031 0.032 0.239 0.240 0.38 0.95 0.94 0.53 2.31 1.72
3 10 15% 0.031 0.032 0.210 0.211 0.50 0.96 0.95 0.55 2.31 1.72
3 10 20% 0.031 0.032 0.192 0.193 0.58 0.97 0.96 0.62 2.31 1.72
Fixed Base 0.000 0.049 0.000 0.006 0.00 0.00 0.00 0.00 0.00 0.00
Table 6.6(b) Summary of results of aircraft impact analysis of Boeing-747 impact at location 2.*
Parameters considered
Floor acceleration spectrum (Unit: g)
Bearing disp. [mm (in.)]
Auxiliary building
BF BF BF MF MF MF TF TF TF
Tiso (sec) Kinitial/
Kpostyield Fy/W
Iso (0.5–2 Hz)
Rec (4.5–10 Hz)
Aux (11–13 Hz)
Iso (0.5–2 Hz)
Rec (4.5–10 Hz)
Aux (11–13 Hz)
Iso (0.5–2 Hz)
Rec (4.5–10 Hz)
Aux (11–13 Hz)
3 5 10% 0.61 1.91 1.02 0.40 0.79 0.72 0.40 1.28 0.83 310(12.20) 3 10 10% 0.60 1.89 1.04 0.39 0.82 0.71 0.39 1.27 0.81 264(10.40) 3 100 10% 0.52 1.76 1.04 0.37 0.87 0.70 0.35 1.16 0.81 177(6.98) 2 10 10% 0.68 1.93 1.07 0.48 0.84 0.71 0.48 1.29 0.83 215(8.45) 3 10 10% 0.60 1.89 1.04 0.39 0.82 0.71 0.39 1.27 0.81 264(10.40) 4 10 10% 0.57 1.87 1.02 0.38 0.81 0.71 0.38 1.26 0.82 287(11.32) 3 10 5% 0.56 1.87 1.02 0.35 0.79 0.72 0.34 1.27 0.84 332(13.08) 3 10 10% 0.60 1.89 1.04 0.39 0.82 0.71 0.39 1.27 0.81 264(10.40) 3 10 15% 0.64 1.90 1.06 0.49 0.83 0.71 0.49 1.27 0.82 232(9.11) 3 10 20% 0.66 1.91 1.08 0.57 0.85 0.70 0.57 1.28 0.83 209(8.25)
Fixed Base 0.00 0.00 0.00 0.18 2.66 1.33 0.31 4.31 1.75 NA
*MF = middle floor, TF = top floor, BF = base floor, Rec.Bld. = reactor containment building, Aux.Bld. = auxiliary building; Iso (0.5 Hz–2 Hz) = isolation frequency range, Rec (4.5 Hz–10 Hz) = reactor containment building frequency range; and Au (11 Hz–13 Hz) = auxiliary building frequency range.

181
Table 6.7(a) Summary of results of aircraft impact analysis of Boeing-747 impact at location 3.*
Parameters considered
Max. drift (%) Max. rotation ()
Floor acceleration spectrum (Unit: g)
Reactor containment building
MF MF MF TF TF TF
Tiso (sec) Kinitial/ Kpostyield. Fy/W Rec. Bld.
Aux. Bld.
Rec. Bld.
Aux. Bld. Iso (0.5–2 Hz) Rec (4.5–10 Hz) Aux (11–13 Hz) Iso (0.5–2 Hz) Rec (4.5–10 Hz) Aux (11–13Hz)
3 5 10% 0.038 0.024 0.000 0.000 0.71 1.24 1.23 0.95 2.78 1.84
3 10 10% 0.040 0.025 0.000 0.000 0.72 1.26 1.25 0.96 2.79 1.87
3 100 10% 0.040 0.026 0.000 0.000 0.64 1.29 1.24 0.86 2.80 1.85
2 10 10% 0.042 0.025 0.000 0.000 0.78 1.29 1.28 1.02 2.82 1.90
3 10 10% 0.040 0.025 0.000 0.000 0.72 1.26 1.25 0.96 2.79 1.87
4 10 10% 0.039 0.025 0.000 0.000 0.70 1.25 1.24 0.94 2.78 1.86
3 10 5% 0.038 0.024 0.000 0.000 0.67 1.23 1.21 0.90 2.76 1.83
3 10 10% 0.040 0.025 0.000 0.000 0.72 1.26 1.25 0.96 2.79 1.87
3 10 15% 0.041 0.025 0.000 0.000 0.76 1.28 1.27 1.00 2.81 1.89
3 10 20% 0.043 0.025 0.000 0.000 0.79 1.29 1.29 1.03 2.83 1.91
Fixed Base 0.000 0.041 0.000 0.000 0.00 0.00 0.00 0.00 0.00 0.00
Table 6.7(b) Summary of results of aircraft impact analysis of Boeing-747 impact at location 3.*
Parameters considered
Floor acceleration spectrum (Unit: g)
Bearing disp. [mm
(in.)]
Auxiliary building
BF BF BF MF MF MF TF TF TF
Tiso (sec) Kinitial/
Kpostyield. Fy/W
Iso (0.5–2 Hz)
Rec (4.5–10 Hz)
Aux (11–13 Hz)
Iso (0.5–2 Hz)
Rec (4.5–10 Hz)
Aux (11–13 Hz)
Iso (0.5–2 Hz)
Rec (4.5–10 Hz)
Aux (11–13 Hz)
3 5 10% 0.46 1.25 1.02 0.44 0.80 0.76 0.43 0.95 0.86 133(5.22) 3 10 10% 0.47 1.27 1.04 0.45 0.81 0.74 0.44 0.96 0.88 108(4.26) 3 100 10% 0.42 1.29 1.08 0.42 0.85 0.70 0.41 1.00 0.90 59(2.32) 2 10 10% 0.52 1.29 1.05 0.50 0.85 0.74 0.49 0.99 0.90 95(3.74) 3 10 10% 0.47 1.27 1.04 0.45 0.81 0.74 0.44 0.96 0.88 108(4.26) 4 10 10% 0.45 1.26 1.03 0.43 0.81 0.74 0.42 0.95 0.87 114(4.49) 3 10 5% 0.42 1.24 1.01 0.40 0.78 0.75 0.39 0.94 0.85 138(5.44) 3 10 10% 0.47 1.27 1.04 0.45 0.81 0.74 0.44 0.96 0.88 108(4.26) 3 10 15% 0.50 1.28 1.05 0.48 0.83 0.74 0.49 0.98 0.89 98(3.84) 3 10 20% 0.54 1.29 1.06 0.55 0.85 0.73 0.56 0.99 0.91 91(3.58)
Fixed Base 0.00 0.00 0.00 0.14 2.51 1.27 0.24 4.04 1.81 NA
*MF = middle floor, TF = top floor, BF = base floor, Rec.Bld. = reactor containment building, Aux.Bld. = auxiliary building; Iso (0.5 Hz–2 Hz) = isolation frequency range, Rec (4.5 Hz–10 Hz) = reactor containment building frequency range; and Au (11 Hz–13 Hz) = auxiliary building frequency range..

182
6.2 RECOMMENDATIONS FOR FUTURE RESEARCH
To design a cost-effective and efficient design for the PGSFR with the desired margin of safety, additional research and development is needed. Both simple and more refined studies are recommended. An extension of the simple studies presented herein will help identify optimal isolation strategies in terms of geometry, location, type of isolation system, etc., for the PGSFR. More refined studies and analytical models will help fine tune design strategies and develop simplified design and analysis methods. More detailed performance-based design studies can identify the economic as well as performance benefits of various design alternatives, and formal probabilistic risk assessments would be useful in obtaining licensing approval from regulatory agencies. Some specific recommendations are offered below for future research.
The studies presented herein and nearly all of the literature on fast reactors has been based on rigid-base conditions without consideration of soil. This is likely conservative in terms of the demands on the isolation system and response of the superstructure. But as shown previously in studies by the UC Berkeley research team, embedment and SSI can substantially reduce the demands on a fixed-base and seismically isolated plant. Thus, SSI for many sites of interest may reduce the demands sufficiently that seismic isolation may not be necessary. However, when considering a beyond-design-basis event, seismic isolation is likely still quite beneficial. Prior studies have shown that the sensitivities of response to soil conditions are greatly reduced by using seismic isolation. This is an important motivation for using seismic isolation when the plant design is being considered at many sites with different seismic hazard and soil conditions. Given the sensitivity of the PGSFR to seismic motions, SSI analyses should be an integral part of any research plan.
Because many of the systems and components used in a sodium-cooled fast reactor have not been tested under earthquake or other dynamic conditions, analyses and tests to develop data that can be used validate analytical models and develop fragility models may be desirable, in particular, assessing the dynamic behavior of thin walled vessels and piping systems at elevated temperatures.
Currently, little information is available about the expected performance of various SSCs and suitable acceptance criteria. This report presented comparisons between the response of a fixed-base plant versus a comparable base-isolated plant to several different scenarios. Although such results are useful, this approach is very limited since the facility is in its preliminary design phase. That said, incorporating isolation in the design phase can be used to avoid problems and issues that may be difficult to overcome with a fixed-base plant.
Thus, work to identify quantitative performance goals and acceptance criteria are essential. In the U.S., non-nuclear buildings designed according to performance-based design procedures permitted by current building codes need to develop a basis of design. Such a document would be useful in developing efficient and effective isolation strategies for the PGSFR. This effort might simply be a review of the seismic design component of a Preliminary Safety Information Document (PSID).

183
6.2.1 Seismic Hazard Characterization
These preliminary studies have been based on a large set of three-component ground-motion records spectrally matched to the US NRC RegGuide 1.60 spectrum anchored to a PGA of 0.3g. Although these studies provided useful information, it is not clear whether this is the appropriate SSE spectrum for use with the PGSFR; several other earthquake conditions should be evaluated, i.e., as a licensing strategy is developed, a particular SSE spectrum for design may be developed. This might result in a different spectral shape, one that is more appropriate for anticipated locations of the PGSFR or anchored at a different PGA.
Similarly, other spectra representative of different hazard levels should be considered. Two other levels should be considered as a minimum. The first of these would be for a beyond-design-basis seismic event. The U.S. NRC is developing guidance on the selection of extended ground-motion response spectra for defining such events, but Korea and other countries where the PGSFR might be located may require different definitions. The U.S. NRC is likely to require a probabilistic estimate of the peak bearing displacement; therefore, studies using spectrum compatible motions and appropriately selected motions considering the median target spectrum and the expected dispersion of spectral ordinates about the median should be studied to quantify bearing displacement capacities.
Although seismic isolation is very effective for high levels of seismic excitation, strong and stiff isolators may not be very effective at lower levels of excitation. Thus, studies may be warranted that consider earthquake excitations representative of an OBE. These are not likely to affect the safety of the NPP, but studies based on these motions might help avoid the need to stop a plant for inspection; i.e., the OBE event might be raised if floor spectra and stresses in components and systems are small enough.
For all hazard levels, it is likely that the vertical component of motion is very important. These motions will be critical in assessing the need for vertical isolation of the PGSFR. The traditional U.S. NRC RegGuide 1.60 anchors the vertical target spectrum to two-thirds of the horizontal spectrum. Recent research at PEER and elsewhere indicates that the two-thirds value is perhaps too conservative for many sites located at moderate to long distances from many earthquakes. Thus, some studies of selecting and modifying ground motions to represent the vertical component of motion are desired.
6.2.2 Aircraft Impact Characterization and Parametric Studies
This report described two simplified models that were developed to simulate force time histories representative of impacts by Boeing-737 and 747 aircraft. These models were adapted considering dynamic similitude considerations based on a much lighter and slower Boeing-707 developed by Riera [1968]. The variation observed in parametric studies and importance of this loading scenario suggests that improved force time histories are needed. In particular, the Boeing-747 aircraft considered in this study is not the largest plane flying today, and our assumption of the plane flying at its cruising velocity is not the most conservative assumption. Aircraft impact models are available from various regulatory agencies and industry associations, and the models used should be consistent with those standards. Understandably, these models are not publicly available.

184
In addition, Riera’s models are based on a number of simplifying assumptions. For this study, one of the key assumptions was the rigidity of the structure being struck by the aircraft. With an isolated structure, this assumption is no longer entirely valid. Some literature exists related to the use uncoupled analyses based on determining a force time history resulting from an aircraft impacting a rigid surface and the response of a stiff system to that force time history; however, the adequacy of this uncoupled analysis for a stiff nuclear facility on isolators is not well studied. Thus, validity of the Riera approach compared to more realistic coupled FE and other analyses that consider the physical impact of the plane with an isolated structure would be desirable.
Because of the movement of the structure during the impact of the aircraft, it may be desirable to conduct local penetration and perforation analysis for the region of impact. The duration of load on the structure and the energy absorption by the isolation system may alter the local damage condition expected for a fixed-base plant.
Parallel efforts with those outlined above would be useful to extend the work begun in this report. This would include as appropriate studies related to:
The accuracy of the Riera force model when isolator movement is significant.
Examine rate dependency effects on bearings since the rate of movement associated with aircraft impact may be much higher than considered for seismic loading. There may be a need for additional testing to identify appropriate bearing properties.
Any beneficial effects associated with energy dissipation due to SSI and local damage at the impact location.
Practical methods of estimating twist about a vertical axis and methods to avoid large torsional movements in the case of off-center impacts. This might include placing stronger LRBs around the perimeter of the structure, and more flexible or NR bearings in the center of the structure. Similarly, various types of dampers can be place on the perimeter. In some instances, pantograph mechanisms have been used (in Japan) to reduce torsional response of the isolation layer. Friction pendulum bearings have been shown to be particularly good at reducing torsional motion of the isolation layer. From the results presented herein, it would seem that reducing the mass and stiffness eccentricities of the superstructure would help reduce but not eliminate these motions as well.
Configuration studies to develop countermeasures to mitigate the effects of aircraft impact, e.g., structural design configurations of the draft chimney, addition of sacrificial elements, and strengthening or toughening of components, etc.
6.2.3 Improved Numerical Modeling of PGSFR
As noted at the beginning of this section, it is desirable to carry out both simplified and refined analysis of the PGSFR. Simplified models can be useful for various conceptual, schematic, or

185
preliminary design studies. Thus, the models used in this study should be validated based on other more refined models used by KEPCO E&C’s engineering staff and improved where needed. In particular, some anomalies noted in this study should be addressed. For example, the top levels of the RCB were seen to amplify greatly accelerations and floor spectrum, especially in the case of aircraft impact. The models may be inadequate or the mechanical properties of these regions of the structure may promote “penthouse” resonance behavior, and design modifications or different isolator properties could be used to mitigate these types of responses. Simplified modes that allow rapid modeling of various issues are desired. Thus, the current lumped mass, the stick models used herein should be refined.
Recent trends in seismic analysis of nuclear facilities focus on the use of more realistic FE models as they produce realistic predictions of response and provide much more information about the local dynamic behavior of the structure. As such, it would be useful to develop one or more detailed FE models of the PGSFR to assess differences between the simplified “stick” and FE models. The models should be able to account for cracking of concrete elements, thermal effects, and various heavy equipment items attached to the structure. In such models, issues of modeling viscous damping, especially in isolated configurations, require study.
6.2.4 Improved Modeling of Isolation Bearings and Isolation Systems
Current work by KEPCO, UC Berkeley, and other engineers aims at improving the cogency of numerical models for isolation bearings. These models tend to be simple and are used for large numbers of runs by engineering designers. To assess the adequacy of these simplified design models, and to develop research data to substantiate the behavior of a nuclear facility under severe loading conditions, more refined models are needed. For the PGSFR project, only the types of bearings relevant to the project need to be assessed and improved when necessary.
This work should include a range of activities, including:
Calibrate models currently available or newly developed with the appropriate experimental data considering various ranges of behavior (small as well as large deformations). For many of the analyses undertaken in this project, the bearing displacement demands were quite small compared to typical cases, and it is not certain that the behavior exhibited by isolators in these analyses were as realistic as desired.
Because of the sensitivity of isolation bearings to axial load and of sodium-cooled fast reactors and associated components and equipment to vertical excitations, it is desirable to assess and improve the modeling capabilities of isolators of interest to combined horizontal and vertical loading, especially to vertical excitations and transient vertical loads. As noted in previous tests, isolators are highly nonlinear and somewhat inelastic under vertical loading. Similarly, geometric nonlinearities serve to couple horizontal and vertical responses of the supported system when vertical loads are applied. These models will be important for seismic and aircraft impact analyses.

186
For all types of elastomeric bearings, analytical models should be evaluated to assure that they represent the behavior of the bearings as they approach their stability limits under vertical loading.
Assess and improve the rate dependency of models, especially with regards to loading rates associated with aircraft impact.
Assess and improve as necessary the ability of bearings to represent behavior under elevated temperatures related to the energy dissipated during inelastic cyclic loading.
Modeling of hardening behavior in LRBs and other bearings. The hardening that occurs in many elastomeric bearings and friction pendulum bearings as they approach their displacement capacity may be an effective method of slowing the superstructure prior to impact with a hard-stop mechanism. This needs to be modeled accurately to assess its stopping capabilities but also the forces and accelerations transmitted by the bearing up into the superstructure.
Modeling of hard and/or soft stops. The U.S. NRC is considering requiring hard stops for NPPs. Currently these are not required for conventional building structures. A hard stop can transfer a substantial load to the structure, resulting in local damage at the impact location but also transferring significant forces and accelerations to the superstructure. Thus, realistic modeling of effective hard stops or softer stops that more gradually slow a structure prior to impact is a priority.
Consideration of special models for bearings that allow vertical isolation. Special efforts are needed to model elastomeric bearings where thicker rubber sheets are used to decrease the vertical stiffness of the bearing, thereby providing a form of vertical isolation to the supported structure. Since most fast reactors have considered the use of vertical isolation, realistic numerical models are needed.
Consider hybrid systems that provide isolation in vertical direction. As noted in the literature survey, many different types of systems have attempted to provide both vertical and horizontal isolation. In some cases, a hybrid approach is taken where conventional isolation bearings are used to provide isolation in the horizontal direction, and isolation in the vertical direction is achieved by a set of hydraulic, air or metallic springs (and dampers). The ability to model such hybrid systems may be useful in studies that consider vertical isolation.
Develop methods to model systems that can restrain rocking motions of vertically isolated structures. Unless it is possible to isolate a structure or component from the elevation of its center-of-mass, a vertically isolated structure may have significant rocking motion. To allow vertical and horizontal movement of the isolated structure and prevent rocking motion requires complex mechanical or hydraulic anti-rocking systems. Very few

187
efforts have been made to model such systems, and additional work will be needed if this type of system is used.
Conduct a test program to confirm models. Quasi-static, hybrid, and shaking table tests may be useful to validate numerical models used and demonstrate the effectiveness of any new isolation concepts developed.
6.2.5 Parametric Investigations for Isolation Systems
Even in cases like those considered here, where seismic isolation is only provided to protect against horizontal components of motion, additional research and development studies are desirable. For instance:
Studies to assess the implications of different isolator layouts and different numbers of isolators on cost and performance.
Studies comparing simple and refined isolator models in order to develop an understanding of the importance of different bearing properties on system performance, and to develop useful design simplifications and guides.
Studies comparing simplified lump-mass stick models to various FE models having different resolution and properties.
Studies assessing the effect of various ground motion, isolator, and structural characteristics on the vertical response of the PGSFR based on refined FE models.
Studies that examine differences in seismic performance under OBE, SSE, and beyond design-basis events and other levels of hazard. From the perspective of evolving regulatory requirements, information on the dispersion of responses under beyond design-basis events is needed.
Studies to investigate the effects of soft or hard stops and different gap sizes. The focus would be to develop economical and effective methods of achieving safety goals, i.e., can a larger gap be more cost-effective than using a soft or hard stop?
Studies that fine tune bearing design or alter the properties of the structure to best match performance criteria.
Ideally, these studies will be undertaken in such a way that SSI effects can be assessed and compared to fixed-base cases. Soil–structure interaction, including embedment effects, may have a significant effect on the response of heavy and stiff structures.
Studies similar to those reported herein are needed for three-dimensional isolation systems, but additional studies are needed related to:
Use of softer vertical elastomeric bearings.
Use of separate systems that isolate the whole plant, but use hybrid bearings or a separate system for horizontal and vertical isolation.

188
The effect of hard and soft stops on systems with vertical isolation. A sudden stop may cause the structure to pitch suddenly, resulting in tension or uplift in the bearings.
In some designs, although a complete horizontal isolation system is provided for the entire plant, portions of the plant are isolated. In other designs, only localized isolation is provided in a fixed-base NPP. These may be quite useful strategies for the PGSFR. Thus, additional studies should explore:
Horizontal isolation of whole structure plus local vertical isolation.
A fixed-base plant with local horizontal or horizontal and vertical isolation of equipment and a small region of plant.
6.3 General Recommendations
A wide variety of risk-based and performance oriented studies will help to identify what aspects of the structural design contribute most to the response and its uncertainties, and the economic tradeoffs associated with alternative designs. Thus, research related to several topics is recommended.
Sensitivity analyses to identify parameters used in modeling the isolated and fixed-base system that most influence performance and uncertainties to aid in devising design strategies for improving performance.
Cost-benefit analysis: the expert panel strongly advised conducting a simplified cost-benefit study early in the project. Investigations of expected construction and repair costs, and downtime associated with post-event inspection, design, permitting, and repair. To provide a basis for comparison, it would be ideal to repeat the parametric studies done above for cases where the structure is assumed to be fixed to the ground.
In addition to considerable expertise related to seismic, structural, and geotechnical engineering, the development of the PGSFR may benefit from advice and research related to nuclear and safety engineering.
Several other types of studies may be useful, including:
Development of step-by-step design and analysis examples, workshops and short courses, and videos to help train design engineers about seismic isolation, computational modeling and nonlinear analysis, performance-based design, etc.
Simplified design-oriented studies to seismically isolate emergency operations buildings and other structures associated with the PGSFR power station.

189
REFERENCES
Abbas H., Paul D.K., Godbole P.N., Nayak G.C. (1996). Aircraft crash upon outer containment of nuclear power
plant, Nucl. Eng. Des., 160: 13–50.
Aiken I.D., Kelly J.M., Tajirian F.F. (1989). Mechanics of low shape factor elastomeric seismic isolation bearings,
Report No. UCB/EERC-89/13, Earthquake Engineering Research Center, University of California, Berkeley,
CA.
Andonov A., Apostolov K., Stefanov D., Kostov M. (2010). Parametric study on the floor response spectra and the
damage potential of aircraft impact induced vibratory loading, J. Disaster Res., 5(4): 417–425.
Aoto K., Uto N., Sakamoto Y., Ito T., Toda M., Kotake S. (2012). Design study and R&D progress on Japan
Sodium-Cooled Fast Reactor, Nucl. Sci. Tech., 48(4): 463–471.
Arros J., Doumbalski N. (2007). Analysis of aircraft impact to concrete structures, Nucl. Eng. Des., 237 (12): 1241–
1249.
Berglund C.R., Tippets E.F., Salerno N.L. (1988). PRISM: A safe, economic, and testable liquid-metal fast breeder
reactor plant, ANS Topic Meeting on Safety of Next Generation Power Reactors, Seattle, WA.
Bignon P.G., Riera J.D. (1980). Verification of methods of analysis for soft missile impact problems, Nucl. Eng.
Des., 60: 311–326.
Blandford E., Keldrauk E., Laufer M., Mieler M., Wei J., Stojadinovic B., Peterson P.F. (2009). Advanced seismic
base isolation methods for modular reactors, Report UCBTH-09-004, Departments of Civil and Environmental
Engineering and Nuclear Engineering, University of California, Berkeley, CA, 132 pgs.
Chadmail J.F. (1985). Equivalent loading due to airplane impact taking into account the nonlinearities of impacted
reinforced concrete buildings, Nucl. Eng. Des., 85: 47–57.
De Grandis S., Forni M., De Bruyn D., Cardini S. (2011). Seismic isolation of Gen IV lead-cooled reactors,
Proceedings, SMiRT 21, New Delhi, India.
Derham C.J., Kelly J.M., Thomas A.G. (1985). Nonlinear natural rubber bearings for seismic isolation, Nucl. Eng.
Des., 84(3): 417–428.
European Utilities (2012). European Utility Requirements (EUR) for LWR Nuclear Power Plants, Volume 2,
Generic Nuclear Island requirement.
Etoh M., Kamishima Y., Okamura S., Watanabe O., Ohyama K., Kotake S., Negishi K., Kamide H., Sakamoto Y.
(2009). Conceptual design study of JSFR (2), Proceedings, FR09, Kyoto, Japan.
Forni M., De Grandis S. (2012). Seismic-initiated events risk mitigation in lead-cooled reactors: the SILER Project,
Proceedings, 15th World Conference on Earthquake Engineering, Lisbon, Portugal.
Forni M., Poggianti A., Dusi A. (2012). Seismic isolation of nuclear power plants, Proceedings, 15th World
Conference on Earthquake Engineering, Lisbon, Portugal.
Gibert R.J., Martelli A. (1989). Seismic analysis of liquid metal fast breeder reactors, Report, International Atomic
Energy Agency, Vienna, Austria.
Gluekler E.L., Tajirian F.F., Kelly J.M. (1988) Seismic isolation for a modular liquid metal reactor concept
(PRISM), In: IANS Topical Meetings on Safety of Next Generation Power Reactors, Seattle, WA.
Gyorey G.L., Hardy R.W., Magee P.M. (1992). Safety and licensing of the PRISM liquid metal cooled reactor,
Nucl. Eng. Des., (2): 181–189.
Hahn D., Kim Y., Lee C., Kim S., Lee S., Lee Y., Kim B., Jeong H. (2007). Conceptual design of the sodium-cooled
fast reactor Kalimer-600, Nucl. Eng. Tech., 39(3): 193–206.
Hahn D., Min J.B. Kim I.Y., Kim C.Y., Cho M. (1995). Technical Committee Meeting on Conceptual Designs of
Advanced Fast Reactors, Kalpakkam, India.

190
Hara H., Hosoya T., Negishi K., Kotake S., Suzuki L. (2009). Conceptual design study of JSFR (4), Proceedings,
FR09, Kyoto, Japan.
Ichikawa K., Shimoji K., Xu Y., Tsujita Y., Sato M., Sakai T., Kotake S. (2009). Conceptual design study of JSFR
(3), Proceedings, FR09, Kyoto, Japan.
Inaba S., Anabukl T., Shirai K., Yabana S., Kitamura S. (2009). Shaking table tests with large test specimens of
seismically isolated FBR plants, Part 2: Damage test of reinforced concrete wall structure. Proceedings, ASME
Pressure Vessels and Piping Division Conference (PVP 2009), PVP2009-77603, Prague, Czech Republic.
JEAG (2000). Design Guideline of Seismic Isolation Systems for Nuclear Power Plants, Japan Electric Association,
JEAG 4614-2000 (in Japanese).
Jeon S., Jin B.M., Kim Y.J. (2012). Assessment of the fire resistance of a nuclear power plant subjected to a large
commercial aircraft crash, Nucl. Eng. Des., 247: 11–22.
Jiang H., Chorzepa M.G. (2014). Aircraft impact analysis of nuclear safety-related concrete structures: A review,
Eng. Fail. Anal., 46: 118–133.
Johnson A.R., Golan S., Guenther E. (1988). SAFR, an economic, inherently safe liquid metal reactor, Nucl. Eng.
Des., 109(1-2): 87–95.
Kageyama M., Somaki T., Hino H., Umeki, K. (2002). Development of cable reinforced 3-dimensional base
isolation air spring, Proceedings, ASME 2002 Pressure Vessels and Piping Division Conference (PVP 2002),
Vancouver, B.C., Canada.
Kajii S., Sawa N., Kunitake N., Umeki, K. (2002) Three dimensional seismic isolation system using hydraulic
cylinder, Proceedings, ASME 2002 Pressure Vessels and Piping Division Conference (PVP 2002), Vancouver,
B.C., Canada.
Kammerer A.M., Whittaker A.S., Constantinou M.C. (2013). Technical Considerations for Seismic Isolation of
Nuclear Facilities (DRAFT). Office Nuclear Regulatory Research Division of Engineering, U.S. Nuclear
Regulatory Commission, Washington, D.C.
Kashiwazaki A., Shimada T., Fujiwaka T., Umeki K. (2000a). Feasibility tests on a three-dimensional base isolation
system incorporating hydraulic mechanism, Proceedings, ASME 2002 Pressure Vessels and Piping Division
Conference (PVP 2002), Vancouver, B.C., Canada.
Kato A. Moro S. Morishita M., Fujita T., Midorikawa S. (2003). A development program of three-dimensional
seismic isolation for advanced reactor systems in Japan, Proceedings, SMiRT 17, Prague, Czech Republic.
Kato M., Watanabe Y., Kato A. (1991). Study on the seismic base-isolated reactor building for demonstration FBR
Plant in Japan, Proceedings, SMiRT 11, Tokyo, Japan.
Kato M., Watanabe Y., Kato A., Suhara J., Shirahana K., Fukushima Y., Murazumi Y., Yoneda G. (1995a). Design
study of the seismic-isolated reactor building of demonstration FBR plant in Japan, Proceedings, SMiRT 13,
Porto Alegre, Brazil.
Kato M., Watanabe Y., Kato A., Tomora H., Shirahama K., Somaki T. (1995b). Study on ultimate behavior and
fragility of seismic isolated FBR plant in Japan, Proceedings, SMiRT 13, Porto Alegre, Brazil.
Kelly J.M., Aiken I.D., Tajirian F.F. (1990). Mechanics of high shape factor elastomeric seismic isolation bearings,
Report No. UCB/EERC-90/01, Earthquake Engineering Research Center, University of California, Berkeley,
CA.
Kelly J.M., Aiken I.D., Clark P.W. (1997). Experimental testing of reduced-scale seismic isolation bearings for
nuclear application, seismic isolation, passive energy dissipation and active control of seismic vibration of
structures, Proceedings, International Post-SMiRT Conference Seminar, Taormina, Sicily, Italy.
Kelly J.M., Konstantinidis D. (2011). Mechanics of Rubber Bearings for Seismic and Vibration Isolation, John
Wiley & Sons, Ltd., Chichester, U.K., 240 pgs.
191
Kitamura S., Morishita M., Yabana S., Hirata K., Umeki K. (2009). Shaking table tests with large test specimens of
seismically isolated FBR plants Part 1: response behavior of test specimen under design ground motions,
Proceedings, ASME Pressure Vessels and Piping Division Conference, Prague, Czech Republic, PVP2009-
77614.
Kulak F.R., Yoo B. (2003). Effects of aircraft impact on a seismically isolated reactor building, Proceedings, SMiRT
17, Prague, Czech Republic, Paper WHJKP01-4, 6 pgs.
Kwant W., Boardman C.E. (1992) PRISM-liquid metal cooled reactor plant design and performance, Nucl. Eng.
Des., 136(1-2): 111–120.
Lee K.L., Han S.E., Hong J.W. (2013). Analysis of impact of large commercial aircraft on a prestressed containment
building, Nucl. Eng. Des., 265: 431–449.
Lu X., Lin K., Cen C., Xu Z., Lin L. (2015). Comparing different fidelity models for the impact analysis of large
commercial aircrafts on a containment building, J. Eng. Failure Anal., 57: 254–269.
Mazda T., Shiojiri H., Oka Y., Fujita T., Seki M. (1989). Testing on large-scale seismic isolation elements,
Proceedings, SMIRT-10, Vol. K2, Anaheim, CA.
Naeim F., Kelly J.M. (1999). Design of Seismic Isolated Structures: From Theory to Practice, John Wiley & Sons,
Inc., Chichester, U.K., 304 pgs.
Nakamura K., Ogiso S., Suzuk M., Umeki K. (2000). Development of double metal bellows air pressure spring with
lead rubber bearing type 3-dimensional seismic isolator, ASME, Proceedings, Pressure Vessels and Piping
Conference, Seismic Engineering, Vol. 1, New York, NY.
Noh S.H., Kim H.U. (2012). Aircraft impact assessment for a base-isolated nuclear power plant structure, World
Congress on Advances in Civil, Environmental, and Materials Research (ACEM’ 12), Seoul, Korea, pp 1092–
1095.
NEI (2009) NEI 07-13: Methodology for Performing Aircraft Impact Assessments for New Plant Designs (rev.7),
Nuclear Energy Institute, Washington D.C
Ogura M., Okubo Y., Ito T., Toda M., Kobayashi S., Ohki S., Okubo T., Mizuno T., Kotake S. (2009). Conceptual
design study of JSFR (1)-Overview and core concept, FR09, Kyoto, Japan.
Okamura S., Kamishima Y., Negishi K., Sakamoto Y., Kitamura S., Kotake S. (2011). Seismic isolation design for
JSFR, Nucl. Sci. Tech., 48(4): 688–692.
Oldenkamp R.D., Brunings J.E., Hren R. (1988). Update-Sodium Fast Reactor (SAFR) concept, Proceedings,
American Power Conference, Vol.50, 1988.
Riera J.D. (1968). On the stress analysis of structures subjected to aircraft impact forces, Nucl. Eng. Des., 8(4): 415–
426.
Riera J.D. (1980). A critical reappraisal of nuclear power plant safety against accidental aircraft impact, Nucl. Eng.
Des., 57: 193–206.
Riera J.D. (1982). An approach to evaluate the design load time history for normal engine impact taking into
account the crash-velocity distribution, Nucl. Eng. Des., 71: 311–316.
Riera J.D. (1989). Penetration, scabbing and perforation of concrete structures hit by solid missiles, Nucl. Eng. Des.,
115: 121–131.
Riera J.D., Zorn N., Schueller G. (1982). An approach to evaluate the design load time history for normal engine
impact taking into account the crash-velocity distribution, Nucl. Eng. Des., 71: 311–316.
Sadique M.R., Iqbal M.A., Bhargava P. (2013). Nuclear containment structure subjected to commercial and fighter
aircraft crash, Nucl. Eng. Des., 260: 30–46.
Salerno L.N., Berglund R.C., Gyorey G.L., Tippets E.F., Tschamper M.P. (1988). PRISM concept, Modular LMR
reactors, Nucl. Eng. Des., 109(1-2): 79–86.

192
Sawada Y., Shiojiri H., Kurihara C., Maeno Y., Aoyagi S., Shimizu H., Goto T., Shibata, H., Fujita T., Kitagawa Y.,
Shigeta M., Takabayashi K. (1989). Seismic isolation test program, Transactions, 10th International
Conference on Structural Mechanics in Reactor Technology, Los Angeles, CA
Schellenberg A., Baker J., Mahin S.A., Sitar N. (2014). Investigation of seismic isolation technology applied to the
APR 1400 nuclear power plant: Selection of ground motions, Vol. 2, Project Report to KEPCO E&C, Pacific
Earthquake Engineering Research Center, University of California, Berkeley, CA.
Shiojiri H. (1991). CRIEPI test program for seismic isolation of the FBR, Nuclear Engineering and Design, 127:
393–407.
Shiojiri H., Mazada T., Kasai H., Kanda J.N., Kubo T., Madokoro M., Shimomura T., Kawamura Y., Nojima O.,
Kawai N. (1989) Comparison of seismic isolation concepts for FBR, Proceedings, SMiRT 10, Anaheim, CA.
Siefert A., Henkel F.O. (2014). Nonlinear analysis of commercial aircraft impact on a reactor building—comparison
between integral and decoupled crash simulation, Nucl. Eng. Des., 269: 130–135.
Sugano T., Tsubota H., Kasai Y., Koshika N., Orui S., von Riesemann W.A., Bickel D.C., Parks M. (1993a). Full-
scale aircraft impact test for evaluation of impact force, Nucl. Eng. Des., 140(3): 373–385.
Sugano T., Tsubota, H., Kasai Y., Koshika N., Ohnuma H., von Riesemann W.A., Bickel D.C. Parks M.B. (1993b).
Local damage to reinforced concrete structures caused by impact of aircraft engine missiles: Part 1. Test
program, method and results, Nucl. Eng. Des., 140: 387–405.
Suhara J., Tamura T., Okada Y., Umeki K. (2000). Development of three dimensional seismic isolation device with
laminated rubber bearing and rolling seal type air spring, ASME, Proceedings, Pressure Vessels and Piping
Conference, Seismic Engineering, Vol. 1, New York, NY.
Tajirian F.F., Gluekler E.L., Chen W.P., Canoga P., Kelly J.M. (1992). Qualification of high damping seismic
isolation bearings for the ALMR, International Working Group on Fast Reactors, Vienna, Austria, pp 164–176.
Tajirian F.F., Kelly J.M. (1988). Testing of seismic isolation bearings for advanced liquid metal reactor PRISM,
ASME, Proceedings, Seismic, Shock, and Vibration Isolation, PVP 147: 95–99, Pittsburg, PA.
Tajirian F.F., Kelly J.M., Aiken I.D. (1990). Seismic isolation for advanced nuclear power stations, Earthq. Spectra,
6(2): 371–401.
Tajirian F.F., Patel M.R. (1993). Response of seismic isolated facilities, a parametric study of the ALMR,
Proceedings, SMiRT 12, Stuttgart, Germany.
Tajirian F.F., Schrag M.R. (1987). Conceptual design of seismic isolation for the PRISM liquid metal reactor,
Proceedings, SMiRT 9, Lausanne, Switzerland.
Tang Y., Grandy C., Seidensticker R. (2011). Seismic isolation for advanced fast reactors, Nucl. Tech., 173: 135–
152.
Ueta M., Inagaki T., Shibata Y., Tarutani K., Okada K. (1995). The development of demonstration fast breeder
reactor (DFBR), Proceedings, SMiRT 13, Porto Alegre, Brazil.
U.S. NRC (2014). Regulatory Guide 1.208, A Performance-Based Approach to Define the Site-Specific Earthquake
Ground Motion, U.S. Nuclear Regulatory Commission, Washington, DC.
Watanabe Y., Kato A., Somaki T., Umeki K., Sato N. (2000b). Shaking table test and analysis on base isolated FBR
plant model with high damping rubber bearing, Proceedings, 12th World Conference on Earthquake
Engineering, Auckland, New Zealand.
Wilt T., Chowdhury A., Cox P.A. (2011). Response of reinforced concrete structures to aircraft crash impact,
Contract NRC−02−07−006, SouthWest Research Institute, San Antonio, TX.
Wong J., Zhou Z., Mahin S.A. (2013) Seismic isolation of nuclear power plants, EPRI Report 3002000561, Palo
Alto, CA.
Yabana S., Kanazawa K., Nagata S., Kitamura S., Sano T. (2009). Shaking table tests with large test specimens of
seismically isolated FBR Plants. Part 3: Ultimate behavior of upper structure and rubber bearings, Proceedings,
2009 ASME Pressure Vessels and Piping Division Conference (PVP 2009), PVP2009-77229, Prague, Czech.

193
Yoo B., Kulak F.R. (2002), Application of seismic isolation to the Star-LM Reactor, Proceedings, ICONE 10,
Arlington, VA.
Yoo B., Lee J.-H., Koo G.-H. (1995). Effects of high damping rubber bearing on seismic response of superstructure
in base isolated system, Proceedings, SMiRT 13, Porto Alegre, Brazil
Yoo B., Lee J.-H., Koo G.-H. (1997). Study of reduced-scale model test results of high damping and lead laminated
rubber bearings for liquid metal reactor, KAERI/TR-539/95 (in Korean).
Yoo B., Lee J.-H., Koo G.-H., Lee H.-Y., Kim, J.-B. (2000) Seismic base isolation technologies for Korea advanced
liquid metal reactor, Nucl. Eng. Des., 199: 125–142.

194

195
PEER REPORTS
PEER reports are available as a free PDF download from https://peer.berkeley.edu/peer-reports. Printed hard copies of PEER reports can be ordered directly from our printer by following the instructions also available at https://peer.berkeley.edu/peer-reports. For other related questions about the PEER Report Series, contact the Pacific Earthquake Engineering Research Center, 325 Davis Hall; Mail Code 1792, Berkeley, CA 94720. Tel.: (510) 642-3437; and Email: [email protected].
PEER 2017/10 Development of Time Histories for IEEE693 Testing and Analysis (including Seismically Isolated Equipment). Shakhzod M. Takhirov, Eric Fujisaki, Leon Kempner, Michael Riley, and Brian Low. December 2017.
PEER 2017/09 “”R” Package for Computation of Earthquake Ground-Motion Response Spectra. Pengfei Wang, Jonathan P. Stewart, Yousef Bozorgnia, David M. Boore, and Tadahiro Kishida. December 2017.
PEER 2017/08 Influence of Kinematic SSI on Foundation Input Motions for Bridges on Deep Foundations. Benjamin J. Turner, Scott J. Brandenberg, and Jonathan P. Stewart. November 2017.
PEER 2017/07 A Nonlinear Kinetic Model for Multi-Stage Friction Pendulum Systems. Paul L. Drazin and Sanjay Govindjee, September 2017.
PEER 2017/06 Guidelines for Performance-Based Seismic Design of Tall Buildings, Version 2.02. TBI Working Group led by co-chairs Ron Hamburger and Jack Moehle: Jack Baker, Jonathan Bray, C.B. Crouse, Greg Deierlein, John Hooper, Marshall Lew, Joe Maffei, Stephen Mahin, James Malley, Farzad Naeim, Jonathan Stewart, and John Wallace. May 2017.
PEER 2017/05 Recommendations for Ergodic Nonlinear Site Amplification in Central and Eastern North America. Youssef M.A. Hashash, Joseph A. Harmon, Okan Ilhan, Grace A. Parker, and Jonathan P. Stewart. March 2017.
PEER 2017/04 Expert Panel Recommendations for Ergodic Site Amplification in Central and Eastern North America. Jonathan P. Stewart, Grace A Parker, Joseph P. Harmon, Gail M. Atkinson, David M. Boore, Robert B. Darragh, Walter J. Silva, and Youssef M.A. Hashash. March 2017.
PEER 2017/03 NGA-East Ground-Motion Models for the U.S. Geological Survey National Seismic Hazard Maps. Christine A. Goulet, Yousef Bozorgnia, Nicolas Kuehn, Linda Al Atik, Robert R. Youngs, Robert W. Graves, and Gail M. Atkinson. March 2017.
PEER 2017/02 U.S.–New Zealand–Japan Workshop: Liquefaction-Induced Ground Movements Effects, University of California, Berkeley, California, 2–4 November 2016. Jonathan D. Bray, Ross W. Boulanger, Misko Cubrinovski, Kohji Tokimatsu, Steven L. Kramer, Thomas O’Rourke, Ellen Rathje, Russell A. Green, Peter K. Robinson, and Christine Z. Beyzaei. March 2017.
PEER 2017/01 2016 PEER Annual Report. Khalid M. Mosalam, Amarnath Kasalanati, and Grace Kang. March 2017.
PEER 2016/10 Performance-Based Robust Nonlinear Seismic Analysis with Application to Reinforced Concrete Bridge Systems. Xiao Ling and Khalid M. Mosalam. December 2016.
PEER 2016/08 Resilience of Critical Structures, Infrastructure, and Communities. Gian Paolo Cimellaro, Ali Zamani-Noori, Omar Kamouh, Vesna Terzic, and Stephen A. Mahin. December 2016.
PEER 2016/07 Hybrid Simulation Theory for a Classical Nonlinear Dynamical System. Paul L. Drazin and Sanjay Govindjee. September 2016.
PEER 2016/06 California Earthquake Early Warning System Benefit Study. Laurie A. Johnson, Sharyl Rabinovici, Grace S. Kang, and Stephen A. Mahin. July 2016.
PEER 2016/05 Ground-Motion Prediction Equations for Arias Intensity Consistent with the NGA-West2 Ground-Motion Models. Charlotte Abrahamson, Hao-Jun Michael Shi, and Brian Yang. July 2016.
PEER 2016/04 The MW 6.0 South Napa Earthquake of August 24, 2014: A Wake-Up Call for Renewed Investment in Seismic Resilience Across California. Prepared for the California Seismic Safety Commission, Laurie A. Johnson and Stephen A. Mahin. May 2016.
PEER 2016/03 Simulation Confidence in Tsunami-Driven Overland Flow. Patrick Lynett. May 2016.
PEER 2016/02 Semi-Automated Procedure for Windowing time Series and Computing Fourier Amplitude Spectra for the NGA-West2 Database. Tadahiro Kishida, Olga-Joan Ktenidou, Robert B. Darragh, and Walter J. Silva. May 2016.
PEER 2016/01 A Methodology for the Estimation of Kappa () from Large Datasets: Example Application to Rock Sites in the NGA-East Database and Implications on Design Motions. Olga-Joan Ktenidou, Norman A. Abrahamson, Robert B. Darragh, and Walter J. Silva. April 2016.

196
PEER 2015/13 Self-Centering Precast Concrete Dual-Steel-Shell Columns for Accelerated Bridge Construction: Seismic Performance, Analysis, and Design. Gabriele Guerrini, José I. Restrepo, Athanassios Vervelidis, and Milena Massari. December 2015.
PEER 2015/12 Shear-Flexure Interaction Modeling for Reinforced Concrete Structural Walls and Columns under Reversed Cyclic Loading. Kristijan Kolozvari, Kutay Orakcal, and John Wallace. December 2015.
PEER 2015/11 Selection and Scaling of Ground Motions for Nonlinear Response History Analysis of Buildings in Performance-Based Earthquake Engineering. N. Simon Kwong and Anil K. Chopra. December 2015.
PEER 2015/10 Structural Behavior of Column-Bent Cap Beam-Box Girder Systems in Reinforced Concrete Bridges Subjected to Gravity and Seismic Loads. Part II: Hybrid Simulation and Post-Test Analysis. Mohamed A. Moustafa and Khalid M. Mosalam. November 2015.
PEER 2015/09 Structural Behavior of Column-Bent Cap Beam-Box Girder Systems in Reinforced Concrete Bridges Subjected to Gravity and Seismic Loads. Part I: Pre-Test Analysis and Quasi-Static Experiments. Mohamed A. Moustafa and Khalid M. Mosalam. September 2015.
PEER 2015/08 NGA-East: Adjustments to Median Ground-Motion Models for Center and Eastern North America. August 2015.
PEER 2015/07 NGA-East: Ground-Motion Standard-Deviation Models for Central and Eastern North America. Linda Al Atik. June 2015.
PEER 2015/06 Adjusting Ground-Motion Intensity Measures to a Reference Site for which VS30 = 3000 m/sec. David M. Boore. May 2015.
PEER 2015/05 Hybrid Simulation of Seismic Isolation Systems Applied to an APR-1400 Nuclear Power Plant. Andreas H. Schellenberg, Alireza Sarebanha, Matthew J. Schoettler, Gilberto Mosqueda, Gianmario Benzoni, and Stephen A. Mahin. April 2015.
PEER 2015/04 NGA-East: Median Ground-Motion Models for the Central and Eastern North America Region. April 2015.
PEER 2015/03 Single Series Solution for the Rectangular Fiber-Reinforced Elastomeric Isolator Compression Modulus. James M. Kelly and Niel C. Van Engelen. March 2015.
PEER 2015/02 A Full-Scale, Single-Column Bridge Bent Tested by Shake-Table Excitation. Matthew J. Schoettler, José I. Restrepo, Gabriele Guerrini, David E. Duck, and Francesco Carrea. March 2015.
PEER 2015/01 Concrete Column Blind Prediction Contest 2010: Outcomes and Observations. Vesna Terzic, Matthew J. Schoettler, José I. Restrepo, and Stephen A Mahin. March 2015.
PEER 2014/20 Stochastic Modeling and Simulation of Near-Fault Ground Motions for Performance-Based Earthquake Engineering. Mayssa Dabaghi and Armen Der Kiureghian. December 2014.
PEER 2014/19 Seismic Response of a Hybrid Fiber-Reinforced Concrete Bridge Column Detailed for Accelerated Bridge Construction. Wilson Nguyen, William Trono, Marios Panagiotou, and Claudia P. Ostertag. December 2014.
PEER 2014/18 Three-Dimensional Beam-Truss Model for Reinforced Concrete Walls and Slabs Subjected to Cyclic Static or Dynamic Loading. Yuan Lu, Marios Panagiotou, and Ioannis Koutromanos. December 2014.
PEER 2014/17 PEER NGA-East Database. Christine A. Goulet, Tadahiro Kishida, Timothy D. Ancheta, Chris H. Cramer, Robert B. Darragh, Walter J. Silva, Youssef M.A. Hashash, Joseph Harmon, Jonathan P. Stewart, Katie E. Wooddell, and Robert R. Youngs. October 2014.
PEER 2014/16 Guidelines for Performing Hazard-Consistent One-Dimensional Ground Response Analysis for Ground Motion Prediction. Jonathan P. Stewart, Kioumars Afshari, and Youssef M.A. Hashash. October 2014.
PEER 2014/15 NGA-East Regionalization Report: Comparison of Four Crustal Regions within Central and Eastern North America using Waveform Modeling and 5%-Damped Pseudo-Spectral Acceleration Response. Jennifer Dreiling, Marius P. Isken, Walter D. Mooney, Martin C. Chapman, and Richard W. Godbee. October 2014.
PEER 2014/14 Scaling Relations between Seismic Moment and Rupture Area of Earthquakes in Stable Continental Regions. Paul Somerville. August 2014.
PEER 2014/13 PEER Preliminary Notes and Observations on the August 24, 2014, South Napa Earthquake. Grace S. Kang and Stephen A. Mahin, Editors. September 2014.
PEER 2014/12 Reference-Rock Site Conditions for Central and Eastern North America: Part II – Attenuation (Kappa) Definition. Kenneth W. Campbell, Youssef M.A. Hashash, Byungmin Kim, Albert R. Kottke, Ellen M. Rathje, Walter J. Silva, and Jonathan P. Stewart. August 2014.
PEER 2014/11 Reference-Rock Site Conditions for Central and Eastern North America: Part I - Velocity Definition. Youssef M.A. Hashash, Albert R. Kottke, Jonathan P. Stewart, Kenneth W. Campbell, Byungmin Kim, Ellen M. Rathje, Walter J. Silva, Sissy Nikolaou, and Cheryl Moss. August 2014.

197
PEER 2014/10 Evaluation of Collapse and Non-Collapse of Parallel Bridges Affected by Liquefaction and Lateral Spreading. Benjamin Turner, Scott J. Brandenberg, and Jonathan P. Stewart. August 2014.
PEER 2014/09 PEER Arizona Strong-Motion Database and GMPEs Evaluation. Tadahiro Kishida, Robert E. Kayen, Olga-Joan Ktenidou, Walter J. Silva, Robert B. Darragh, and Jennie Watson-Lamprey. June 2014.
PEER 2014/08 Unbonded Pretensioned Bridge Columns with Rocking Detail. Jeffrey A. Schaefer, Bryan Kennedy, Marc O. Eberhard, and John F. Stanton. June 2014.
PEER 2014/07 Northridge 20 Symposium Summary Report: Impacts, Outcomes, and Next Steps. May 2014.
PEER 2014/06 Report of the Tenth Planning Meeting of NEES/E-Defense Collaborative Research on Earthquake Engineering. December 2013.
PEER 2014/05 Seismic Velocity Site Characterization of Thirty-One Chilean Seismometer Stations by Spectral Analysis of Surface Wave Dispersion. Robert Kayen, Brad D. Carkin, Skye Corbet, Camilo Pinilla, Allan Ng, Edward Gorbis, and Christine Truong. April 2014.
PEER 2014/04 Effect of Vertical Acceleration on Shear Strength of Reinforced Concrete Columns. Hyerin Lee and Khalid M. Mosalam. April 2014.
PEER 2014/03 Retest of Thirty-Year-Old Neoprene Isolation Bearings. James M. Kelly and Niel C. Van Engelen. March 2014.
PEER 2014/02 Theoretical Development of Hybrid Simulation Applied to Plate Structures. Ahmed A. Bakhaty, Khalid M. Mosalam, and Sanjay Govindjee. January 2014.
PEER 2014/01 Performance-Based Seismic Assessment of Skewed Bridges. Peyman Kaviani, Farzin Zareian, and Ertugrul Taciroglu. January 2014.
PEER 2013/26 Urban Earthquake Engineering. Proceedings of the U.S.-Iran Seismic Workshop. December 2013.
PEER 2013/25 Earthquake Engineering for Resilient Communities: 2013 PEER Internship Program Research Report Collection. Heidi Tremayne (Editor), Stephen A. Mahin (Editor), Jorge Archbold Monterossa, Matt Brosman, Shelly Dean, Katherine deLaveaga, Curtis Fong, Donovan Holder, Rakeeb Khan, Elizabeth Jachens, David Lam, Daniela Martinez Lopez, Mara Minner, Geffen Oren, Julia Pavicic, Melissa Quinonez, Lorena Rodriguez, Sean Salazar, Kelli Slaven, Vivian Steyert, Jenny Taing, and Salvador Tena. December 2013.
PEER 2013/24 NGA-West2 Ground Motion Prediction Equations for Vertical Ground Motions. September 2013.
PEER 2013/23 Coordinated Planning and Preparedness for Fire Following Major Earthquakes. Charles Scawthorn. November 2013.
PEER 2013/22 GEM-PEER Task 3 Project: Selection of a Global Set of Ground Motion Prediction Equations. Jonathan P. Stewart, John Douglas, Mohammad B. Javanbarg, Carola Di Alessandro, Yousef Bozorgnia, Norman A. Abrahamson, David M. Boore, Kenneth W. Campbell, Elise Delavaud, Mustafa Erdik, and Peter J. Stafford. December 2013.
PEER 2013/21 Seismic Design and Performance of Bridges with Columns on Rocking Foundations. Grigorios Antonellis and Marios Panagiotou. September 2013.
PEER 2013/20 Experimental and Analytical Studies on the Seismic Behavior of Conventional and Hybrid Braced Frames. Jiun-Wei Lai and Stephen A. Mahin. September 2013.
PEER 2013/19 Toward Resilient Communities: A Performance-Based Engineering Framework for Design and Evaluation of the Built Environment. Michael William Mieler, Bozidar Stojadinovic, Robert J. Budnitz, Stephen A. Mahin, and Mary C. Comerio. September 2013.
PEER 2013/18 Identification of Site Parameters that Improve Predictions of Site Amplification. Ellen M. Rathje and Sara Navidi. July 2013.
PEER 2013/17 Response Spectrum Analysis of Concrete Gravity Dams Including Dam-Water-Foundation Interaction. Arnkjell Løkke and Anil K. Chopra. July 2013.
PEER 2013/16 Effect of Hoop Reinforcement Spacing on the Cyclic Response of Large Reinforced Concrete Special Moment Frame Beams. Marios Panagiotou, Tea Visnjic, Grigorios Antonellis, Panagiotis Galanis, and Jack P. Moehle. June 2013.
PEER 2013/15 A Probabilistic Framework to Include the Effects of Near-Fault Directivity in Seismic Hazard Assessment. Shrey Kumar Shahi, Jack W. Baker. October 2013.
PEER 2013/14 Hanging-Wall Scaling using Finite-Fault Simulations. Jennifer L. Donahue and Norman A. Abrahamson. September 2013.
PEER 2013/13 Semi-Empirical Nonlinear Site Amplification and its Application in NEHRP Site Factors. Jonathan P. Stewart and Emel Seyhan. November 2013.

198
PEER 2013/12 Nonlinear Horizontal Site Response for the NGA-West2 Project. Ronnie Kamai, Norman A. Abramson, Walter J. Silva. May 2013.
PEER 2013/11 Epistemic Uncertainty for NGA-West2 Models. Linda Al Atik and Robert R. Youngs. May 2013.
PEER 2013/10 NGA-West 2 Models for Ground-Motion Directionality. Shrey K. Shahi and Jack W. Baker. May 2013.
PEER 2013/09 Final Report of the NGA-West2 Directivity Working Group. Paul Spudich, Jeffrey R. Bayless, Jack W. Baker, Brian S.J. Chiou, Badie Rowshandel, Shrey Shahi, and Paul Somerville. May 2013.
PEER 2013/08 NGA-West2 Model for Estimating Average Horizontal Values of Pseudo-Absolute Spectral Accelerations Generated by Crustal Earthquakes. I. M. Idriss. May 2013.
PEER 2013/07 Update of the Chiou and Youngs NGA Ground Motion Model for Average Horizontal Component of Peak Ground Motion and Response Spectra. Brian Chiou and Robert Youngs. May 2013.
PEER 2013/06 NGA-West2 Campbell-Bozorgnia Ground Motion Model for the Horizontal Components of PGA, PGV, and 5%-Damped Elastic Pseudo-Acceleration Response Spectra for Periods Ranging from 0.01 to 10 sec. Kenneth W. Campbell and Yousef Bozorgnia. May 2013.
PEER 2013/05 NGA-West 2 Equations for Predicting Response Spectral Accelerations for Shallow Crustal Earthquakes. David M. Boore, Jonathan P. Stewart, Emel Seyhan, and Gail M. Atkinson. May 2013.
PEER 2013/04 Update of the AS08 Ground-Motion Prediction Equations Based on the NGA-West2 Data Set. Norman Abrahamson, Walter Silva, and Ronnie Kamai. May 2013.
PEER 2013/03 PEER NGA-West2 Database. Timothy D. Ancheta, Robert B. Darragh, Jonathan P. Stewart, Emel Seyhan, Walter J. Silva, Brian S.J. Chiou, Katie E. Wooddell, Robert W. Graves, Albert R. Kottke, David M. Boore, Tadahiro Kishida, and Jennifer L. Donahue. May 2013.
PEER 2013/02 Hybrid Simulation of the Seismic Response of Squat Reinforced Concrete Shear Walls. Catherine A. Whyte and Bozidar Stojadinovic. May 2013.
PEER 2013/01 Housing Recovery in Chile: A Qualitative Mid-program Review. Mary C. Comerio. February 2013.
PEER 2012/08 Guidelines for Estimation of Shear Wave Velocity. Bernard R. Wair, Jason T. DeJong, and Thomas Shantz. December 2012.
PEER 2012/07 Earthquake Engineering for Resilient Communities: 2012 PEER Internship Program Research Report Collection. Heidi Tremayne (Editor), Stephen A. Mahin (Editor), Collin Anderson, Dustin Cook, Michael Erceg, Carlos Esparza, Jose Jimenez, Dorian Krausz, Andrew Lo, Stephanie Lopez, Nicole McCurdy, Paul Shipman, Alexander Strum, Eduardo Vega. December 2012.
PEER 2012/06 Fragilities for Precarious Rocks at Yucca Mountain. Matthew D. Purvance, Rasool Anooshehpoor, and James N. Brune. December 2012.
PEER 2012/05 Development of Simplified Analysis Procedure for Piles in Laterally Spreading Layered Soils. Christopher R. McGann, Pedro Arduino, and Peter Mackenzie–Helnwein. December 2012.
PEER 2012/04 Unbonded Pre-Tensioned Columns for Bridges in Seismic Regions. Phillip M. Davis, Todd M. Janes, Marc O. Eberhard, and John F. Stanton. December 2012.
PEER 2012/03 Experimental and Analytical Studies on Reinforced Concrete Buildings with Seismically Vulnerable Beam-Column Joints. Sangjoon Park and Khalid M. Mosalam. October 2012.
PEER 2012/02 Seismic Performance of Reinforced Concrete Bridges Allowed to Uplift during Multi-Directional Excitation. Andres Oscar Espinoza and Stephen A. Mahin. July 2012.
PEER 2012/01 Spectral Damping Scaling Factors for Shallow Crustal Earthquakes in Active Tectonic Regions. Sanaz Rezaeian, Yousef Bozorgnia, I. M. Idriss, Kenneth Campbell, Norman Abrahamson, and Walter Silva. July 2012.
PEER 2011/10 Earthquake Engineering for Resilient Communities: 2011 PEER Internship Program Research Report Collection. Heidi Faison and Stephen A. Mahin, Editors. December 2011.
PEER 2011/09 Calibration of Semi-Stochastic Procedure for Simulating High-Frequency Ground Motions. Jonathan P. Stewart, Emel Seyhan, and Robert W. Graves. December 2011.
PEER 2011/08 Water Supply in regard to Fire Following Earthquake. Charles Scawthorn. November 2011.
PEER 2011/07 Seismic Risk Management in Urban Areas. Proceedings of a U.S.-Iran-Turkey Seismic Workshop. September 2011.
PEER 2011/06 The Use of Base Isolation Systems to Achieve Complex Seismic Performance Objectives. Troy A. Morgan and Stephen A. Mahin. July 2011.

199
PEER 2011/05 Case Studies of the Seismic Performance of Tall Buildings Designed by Alternative Means. Task 12 Report for the Tall Buildings Initiative. Jack Moehle, Yousef Bozorgnia, Nirmal Jayaram, Pierson Jones, Mohsen Rahnama, Nilesh Shome, Zeynep Tuna, John Wallace, Tony Yang, and Farzin Zareian. July 2011.
PEER 2011/04 Recommended Design Practice for Pile Foundations in Laterally Spreading Ground. Scott A. Ashford, Ross W. Boulanger, and Scott J. Brandenberg. June 2011.
PEER 2011/03 New Ground Motion Selection Procedures and Selected Motions for the PEER Transportation Research Program. Jack W. Baker, Ting Lin, Shrey K. Shahi, and Nirmal Jayaram. March 2011.
PEER 2011/02 A Bayesian Network Methodology for Infrastructure Seismic Risk Assessment and Decision Support. Michelle T. Bensi, Armen Der Kiureghian, and Daniel Straub. March 2011.
PEER 2011/01 Demand Fragility Surfaces for Bridges in Liquefied and Laterally Spreading Ground. Scott J. Brandenberg, Jian Zhang, Pirooz Kashighandi, Yili Huo, and Minxing Zhao. March 2011.
PEER 2010/05 Guidelines for Performance-Based Seismic Design of Tall Buildings. Developed by the Tall Buildings Initiative. November 2010.
PEER 2010/04 Application Guide for the Design of Flexible and Rigid Bus Connections between Substation Equipment Subjected to Earthquakes. Jean-Bernard Dastous and Armen Der Kiureghian. September 2010.
PEER 2010/03 Shear Wave Velocity as a Statistical Function of Standard Penetration Test Resistance and Vertical Effective Stress at Caltrans Bridge Sites. Scott J. Brandenberg, Naresh Bellana, and Thomas Shantz. June 2010.
PEER 2010/02 Stochastic Modeling and Simulation of Ground Motions for Performance-Based Earthquake Engineering. Sanaz Rezaeian and Armen Der Kiureghian. June 2010.
PEER 2010/01 Structural Response and Cost Characterization of Bridge Construction Using Seismic Performance Enhancement Strategies. Ady Aviram, Božidar Stojadinović, Gustavo J. Parra-Montesinos, and Kevin R. Mackie. March 2010.
PEER 2009/03 The Integration of Experimental and Simulation Data in the Study of Reinforced Concrete Bridge Systems Including Soil-Foundation-Structure Interaction. Matthew Dryden and Gregory L. Fenves. November 2009.
PEER 2009/02 Improving Earthquake Mitigation through Innovations and Applications in Seismic Science, Engineering, Communication, and Response. Proceedings of a U.S.-Iran Seismic Workshop. October 2009.
PEER 2009/01 Evaluation of Ground Motion Selection and Modification Methods: Predicting Median Interstory Drift Response of Buildings. Curt B. Haselton, Editor. June 2009.
PEER 2008/10 Technical Manual for Strata. Albert R. Kottke and Ellen M. Rathje. February 2009.
PEER 2008/09 NGA Model for Average Horizontal Component of Peak Ground Motion and Response Spectra. Brian S.-J. Chiou and Robert R. Youngs. November 2008.
PEER 2008/08 Toward Earthquake-Resistant Design of Concentrically Braced Steel Structures. Patxi Uriz and Stephen A. Mahin. November 2008.
PEER 2008/07 Using OpenSees for Performance-Based Evaluation of Bridges on Liquefiable Soils. Stephen L. Kramer, Pedro Arduino, and HyungSuk Shin. November 2008.
PEER 2008/06 Shaking Table Tests and Numerical Investigation of Self-Centering Reinforced Concrete Bridge Columns. Hyung IL Jeong, Junichi Sakai, and Stephen A. Mahin. September 2008.
PEER 2008/05 Performance-Based Earthquake Engineering Design Evaluation Procedure for Bridge Foundations Undergoing Liquefaction-Induced Lateral Ground Displacement. Christian A. Ledezma and Jonathan D. Bray. August 2008.
PEER 2008/04 Benchmarking of Nonlinear Geotechnical Ground Response Analysis Procedures. Jonathan P. Stewart, Annie On-Lei Kwok, Youssef M. A. Hashash, Neven Matasovic, Robert Pyke, Zhiliang Wang, and Zhaohui Yang. August 2008.
PEER 2008/03 Guidelines for Nonlinear Analysis of Bridge Structures in California. Ady Aviram, Kevin R. Mackie, and Božidar Stojadinović. August 2008.
PEER 2008/02 Treatment of Uncertainties in Seismic-Risk Analysis of Transportation Systems. Evangelos Stergiou and Anne S. Kiremidjian. July 2008.
PEER 2008/01 Seismic Performance Objectives for Tall Buildings. William T. Holmes, Charles Kircher, William Petak, and Nabih Youssef. August 2008.
PEER 2007/12 An Assessment to Benchmark the Seismic Performance of a Code-Conforming Reinforced Concrete Moment-Frame Building. Curt Haselton, Christine A. Goulet, Judith Mitrani-Reiser, James L. Beck, Gregory G. Deierlein, Keith A. Porter, Jonathan P. Stewart, and Ertugrul Taciroglu. August 2008.

200
PEER 2007/11 Bar Buckling in Reinforced Concrete Bridge Columns. Wayne A. Brown, Dawn E. Lehman, and John F. Stanton. February 2008.
PEER 2007/10 Computational Modeling of Progressive Collapse in Reinforced Concrete Frame Structures. Mohamed M. Talaat and Khalid M. Mosalam. May 2008.
PEER 2007/09 Integrated Probabilistic Performance-Based Evaluation of Benchmark Reinforced Concrete Bridges. Kevin R. Mackie, John-Michael Wong, and Božidar Stojadinović. January 2008.
PEER 2007/08 Assessing Seismic Collapse Safety of Modern Reinforced Concrete Moment-Frame Buildings. Curt B. Haselton and Gregory G. Deierlein. February 2008.
PEER 2007/07 Performance Modeling Strategies for Modern Reinforced Concrete Bridge Columns. Michael P. Berry and Marc O. Eberhard. April 2008.
PEER 2007/06 Development of Improved Procedures for Seismic Design of Buried and Partially Buried Structures. Linda Al Atik and Nicholas Sitar. June 2007.
PEER 2007/05 Uncertainty and Correlation in Seismic Risk Assessment of Transportation Systems. Renee G. Lee and Anne S. Kiremidjian. July 2007.
PEER 2007/04 Numerical Models for Analysis and Performance-Based Design of Shallow Foundations Subjected to Seismic Loading. Sivapalan Gajan, Tara C. Hutchinson, Bruce L. Kutter, Prishati Raychowdhury, José A. Ugalde, and Jonathan P. Stewart. May 2008.
PEER 2007/03 Beam-Column Element Model Calibrated for Predicting Flexural Response Leading to Global Collapse of RC Frame Buildings. Curt B. Haselton, Abbie B. Liel, Sarah Taylor Lange, and Gregory G. Deierlein. May 2008.
PEER 2007/02 Campbell-Bozorgnia NGA Ground Motion Relations for the Geometric Mean Horizontal Component of Peak and Spectral Ground Motion Parameters. Kenneth W. Campbell and Yousef Bozorgnia. May 2007.
PEER 2007/01 Boore-Atkinson NGA Ground Motion Relations for the Geometric Mean Horizontal Component of Peak and Spectral Ground Motion Parameters. David M. Boore and Gail M. Atkinson. May 2007.
PEER 2006/12 Societal Implications of Performance-Based Earthquake Engineering. Peter J. May. May 2007.
PEER 2006/11 Probabilistic Seismic Demand Analysis Using Advanced Ground Motion Intensity Measures, Attenuation Relationships, and Near-Fault Effects. Polsak Tothong and C. Allin Cornell. March 2007.
PEER 2006/10 Application of the PEER PBEE Methodology to the I-880 Viaduct. Sashi Kunnath. February 2007.
PEER 2006/09 Quantifying Economic Losses from Travel Forgone Following a Large Metropolitan Earthquake. James Moore, Sungbin Cho, Yue Yue Fan, and Stuart Werner. November 2006.
PEER 2006/08 Vector-Valued Ground Motion Intensity Measures for Probabilistic Seismic Demand Analysis. Jack W. Baker and C. Allin Cornell. October 2006.
PEER 2006/07 Analytical Modeling of Reinforced Concrete Walls for Predicting Flexural and Coupled–Shear-Flexural Responses. Kutay Orakcal, Leonardo M. Massone, and John W. Wallace. October 2006.
PEER 2006/06 Nonlinear Analysis of a Soil-Drilled Pier System under Static and Dynamic Axial Loading. Gang Wang and Nicholas Sitar. November 2006.
PEER 2006/05 Advanced Seismic Assessment Guidelines. Paolo Bazzurro, C. Allin Cornell, Charles Menun, Maziar Motahari, and Nicolas Luco. September 2006.
PEER 2006/04 Probabilistic Seismic Evaluation of Reinforced Concrete Structural Components and Systems. Tae Hyung Lee and Khalid M. Mosalam. August 2006.
PEER 2006/03 Performance of Lifelines Subjected to Lateral Spreading. Scott A. Ashford and Teerawut Juirnarongrit. July 2006.
PEER 2006/02 Pacific Earthquake Engineering Research Center Highway Demonstration Project. Anne Kiremidjian, James Moore, Yue Yue Fan, Nesrin Basoz, Ozgur Yazali, and Meredith Williams. April 2006.
PEER 2006/01 Bracing Berkeley. A Guide to Seismic Safety on the UC Berkeley Campus. Mary C. Comerio, Stephen Tobriner, and Ariane Fehrenkamp. January 2006.
PEER 2005/17 Earthquake Simulation Tests on Reducing Residual Displacements of Reinforced Concrete Bridges. Junichi Sakai, Stephen A Mahin, and Andres Espinoza. December 2005.
PEER 2005/16 Seismic Response and Reliability of Electrical Substation Equipment and Systems. Junho Song, Armen Der Kiureghian, and Jerome L. Sackman. April 2006.
201
PEER 2005/15 CPT-Based Probabilistic Assessment of Seismic Soil Liquefaction Initiation. R. E. S. Moss, R. B. Seed, R. E. Kayen, J. P. Stewart, and A. Der Kiureghian. April 2006.
PEER 2005/14 Workshop on Modeling of Nonlinear Cyclic Load-Deformation Behavior of Shallow Foundations. Bruce L. Kutter, Geoffrey Martin, Tara Hutchinson, Chad Harden, Sivapalan Gajan, and Justin Phalen. March 2006.
PEER 2005/13 Stochastic Characterization and Decision Bases under Time-Dependent Aftershock Risk in Performance-Based Earthquake Engineering. Gee Liek Yeo and C. Allin Cornell. July 2005.
PEER 2005/12 PEER Testbed Study on a Laboratory Building: Exercising Seismic Performance Assessment. Mary C. Comerio, Editor. November 2005.
PEER 2005/11 Van Nuys Hotel Building Testbed Report: Exercising Seismic Performance Assessment. Helmut Krawinkler, Editor. October 2005.
PEER 2005/10 First NEES/E-Defense Workshop on Collapse Simulation of Reinforced Concrete Building Structures. September 2005.
PEER 2005/09 Test Applications of Advanced Seismic Assessment Guidelines. Joe Maffei, Karl Telleen, Danya Mohr, William Holmes, and Yuki Nakayama. August 2006.
PEER 2005/08 Damage Accumulation in Lightly Confined Reinforced Concrete Bridge Columns. R. Tyler Ranf, Jared M. Nelson, Zach Price, Marc O. Eberhard, and John F. Stanton. April 2006.
PEER 2005/07 Experimental and Analytical Studies on the Seismic Response of Freestanding and Anchored Laboratory Equipment. Dimitrios Konstantinidis and Nicos Makris. January 2005.
PEER 2005/06 Global Collapse of Frame Structures under Seismic Excitations. Luis F. Ibarra and Helmut Krawinkler. September 2005.
PEER 2005//05 Performance Characterization of Bench- and Shelf-Mounted Equipment. Samit Ray Chaudhuri and Tara C. Hutchinson. May 2006.
PEER 2005/04 Numerical Modeling of the Nonlinear Cyclic Response of Shallow Foundations. Chad Harden, Tara Hutchinson, Geoffrey R. Martin, and Bruce L. Kutter. August 2005.
PEER 2005/03 A Taxonomy of Building Components for Performance-Based Earthquake Engineering. Keith A. Porter. September 2005.
PEER 2005/02 Fragility Basis for California Highway Overpass Bridge Seismic Decision Making. Kevin R. Mackie and Božidar Stojadinović. June 2005.
PEER 2005/01 Empirical Characterization of Site Conditions on Strong Ground Motion. Jonathan P. Stewart, Yoojoong Choi, and Robert W. Graves. June 2005.
PEER 2004/09 Electrical Substation Equipment Interaction: Experimental Rigid Conductor Studies. Christopher Stearns and André Filiatrault. February 2005.
PEER 2004/08 Seismic Qualification and Fragility Testing of Line Break 550-kV Disconnect Switches. Shakhzod M. Takhirov, Gregory L. Fenves, and Eric Fujisaki. January 2005.
PEER 2004/07 Ground Motions for Earthquake Simulator Qualification of Electrical Substation Equipment. Shakhzod M. Takhirov, Gregory L. Fenves, Eric Fujisaki, and Don Clyde. January 2005.
PEER 2004/06 Performance-Based Regulation and Regulatory Regimes. Peter J. May and Chris Koski. September 2004.
PEER 2004/05 Performance-Based Seismic Design Concepts and Implementation: Proceedings of an International Workshop. Peter Fajfar and Helmut Krawinkler, Editors. September 2004.
PEER 2004/04 Seismic Performance of an Instrumented Tilt-up Wall Building. James C. Anderson and Vitelmo V. Bertero. July 2004.
PEER 2004/03 Evaluation and Application of Concrete Tilt-up Assessment Methodologies. Timothy Graf and James O. Malley. October 2004.
PEER 2004/02 Analytical Investigations of New Methods for Reducing Residual Displacements of Reinforced Concrete Bridge Columns. Junichi Sakai and Stephen A. Mahin. August 2004.
PEER 2004/01 Seismic Performance of Masonry Buildings and Design Implications. Kerri Anne Taeko Tokoro, James C. Anderson, and Vitelmo V. Bertero. February 2004.
PEER 2003/18 Performance Models for Flexural Damage in Reinforced Concrete Columns. Michael Berry and Marc Eberhard. August 2003.

202
PEER 2003/17 Predicting Earthquake Damage in Older Reinforced Concrete Beam-Column Joints. Catherine Pagni and Laura Lowes. October 2004.
PEER 2003/16 Seismic Demands for Performance-Based Design of Bridges. Kevin Mackie and Božidar Stojadinović. August 2003.
PEER 2003/15 Seismic Demands for Nondeteriorating Frame Structures and Their Dependence on Ground Motions. Ricardo Antonio Medina and Helmut Krawinkler. May 2004.
PEER 2003/14 Finite Element Reliability and Sensitivity Methods for Performance-Based Earthquake Engineering. Terje Haukaas and Armen Der Kiureghian. April 2004.
PEER 2003/13 Effects of Connection Hysteretic Degradation on the Seismic Behavior of Steel Moment-Resisting Frames. Janise E. Rodgers and Stephen A. Mahin. March 2004.
PEER 2003/12 Implementation Manual for the Seismic Protection of Laboratory Contents: Format and Case Studies. William T. Holmes and Mary C. Comerio. October 2003.
PEER 2003/11 Fifth U.S.-Japan Workshop on Performance-Based Earthquake Engineering Methodology for Reinforced Concrete Building Structures. February 2004.
PEER 2003/10 A Beam-Column Joint Model for Simulating the Earthquake Response of Reinforced Concrete Frames. Laura N. Lowes, Nilanjan Mitra, and Arash Altoontash. February 2004.
PEER 2003/09 Sequencing Repairs after an Earthquake: An Economic Approach. Marco Casari and Simon J. Wilkie. April 2004.
PEER 2003/08 A Technical Framework for Probability-Based Demand and Capacity Factor Design (DCFD) Seismic Formats. Fatemeh Jalayer and C. Allin Cornell. November 2003.
PEER 2003/07 Uncertainty Specification and Propagation for Loss Estimation Using FOSM Methods. Jack W. Baker and C. Allin Cornell. September 2003.
PEER 2003/06 Performance of Circular Reinforced Concrete Bridge Columns under Bidirectional Earthquake Loading. Mahmoud M. Hachem, Stephen A. Mahin, and Jack P. Moehle. February 2003.
PEER 2003/05 Response Assessment for Building-Specific Loss Estimation. Eduardo Miranda and Shahram Taghavi. September 2003.
PEER 2003/04 Experimental Assessment of Columns with Short Lap Splices Subjected to Cyclic Loads. Murat Melek, John W. Wallace, and Joel Conte. April 2003.
PEER 2003/03 Probabilistic Response Assessment for Building-Specific Loss Estimation. Eduardo Miranda and Hesameddin Aslani. September 2003.
PEER 2003/02 Software Framework for Collaborative Development of Nonlinear Dynamic Analysis Program. Jun Peng and Kincho H. Law. September 2003.
PEER 2003/01 Shake Table Tests and Analytical Studies on the Gravity Load Collapse of Reinforced Concrete Frames. Kenneth John Elwood and Jack P. Moehle. November 2003.
PEER 2002/24 Performance of Beam to Column Bridge Joints Subjected to a Large Velocity Pulse. Natalie Gibson, André Filiatrault, and Scott A. Ashford. April 2002.
PEER 2002/23 Effects of Large Velocity Pulses on Reinforced Concrete Bridge Columns. Greg L. Orozco and Scott A. Ashford. April 2002.
PEER 2002/22 Characterization of Large Velocity Pulses for Laboratory Testing. Kenneth E. Cox and Scott A. Ashford. April 2002.
PEER 2002/21 Fourth U.S.-Japan Workshop on Performance-Based Earthquake Engineering Methodology for Reinforced Concrete Building Structures. December 2002.
PEER 2002/20 Barriers to Adoption and Implementation of PBEE Innovations. Peter J. May. August 2002.
PEER 2002/19 Economic-Engineered Integrated Models for Earthquakes: Socioeconomic Impacts. Peter Gordon, James E. Moore II, and Harry W. Richardson. July 2002.
PEER 2002/18 Assessment of Reinforced Concrete Building Exterior Joints with Substandard Details. Chris P. Pantelides, Jon Hansen, Justin Nadauld, and Lawrence D. Reaveley. May 2002.
PEER 2002/17 Structural Characterization and Seismic Response Analysis of a Highway Overcrossing Equipped with Elastomeric Bearings and Fluid Dampers: A Case Study. Nicos Makris and Jian Zhang. November 2002.
PEER 2002/16 Estimation of Uncertainty in Geotechnical Properties for Performance-Based Earthquake Engineering. Allen L. Jones, Steven L. Kramer, and Pedro Arduino. December 2002.

203
PEER 2002/15 Seismic Behavior of Bridge Columns Subjected to Various Loading Patterns. Asadollah Esmaeily-Gh. and Yan Xiao. December 2002.
PEER 2002/14 Inelastic Seismic Response of Extended Pile Shaft Supported Bridge Structures. T.C. Hutchinson, R.W. Boulanger, Y.H. Chai, and I.M. Idriss. December 2002.
PEER 2002/13 Probabilistic Models and Fragility Estimates for Bridge Components and Systems. Paolo Gardoni, Armen Der Kiureghian, and Khalid M. Mosalam. June 2002.
PEER 2002/12 Effects of Fault Dip and Slip Rake on Near-Source Ground Motions: Why Chi-Chi Was a Relatively Mild M7.6 Earthquake. Brad T. Aagaard, John F. Hall, and Thomas H. Heaton. December 2002.
PEER 2002/11 Analytical and Experimental Study of Fiber-Reinforced Strip Isolators. James M. Kelly and Shakhzod M. Takhirov. September 2002.
PEER 2002/10 Centrifuge Modeling of Settlement and Lateral Spreading with Comparisons to Numerical Analyses. Sivapalan Gajan and Bruce L. Kutter. January 2003.
PEER 2002/09 Documentation and Analysis of Field Case Histories of Seismic Compression during the 1994 Northridge, California, Earthquake. Jonathan P. Stewart, Patrick M. Smith, Daniel H. Whang, and Jonathan D. Bray. October 2002.
PEER 2002/08 Component Testing, Stability Analysis and Characterization of Buckling-Restrained Unbonded BracesTM. Cameron Black, Nicos Makris, and Ian Aiken. September 2002.
PEER 2002/07 Seismic Performance of Pile-Wharf Connections. Charles W. Roeder, Robert Graff, Jennifer Soderstrom, and Jun Han Yoo. December 2001.
PEER 2002/06 The Use of Benefit-Cost Analysis for Evaluation of Performance-Based Earthquake Engineering Decisions. Richard O. Zerbe and Anthony Falit-Baiamonte. September 2001.
PEER 2002/05 Guidelines, Specifications, and Seismic Performance Characterization of Nonstructural Building Components and Equipment. André Filiatrault, Constantin Christopoulos, and Christopher Stearns. September 2001.
PEER 2002/04 Consortium of Organizations for Strong-Motion Observation Systems and the Pacific Earthquake Engineering Research Center Lifelines Program: Invited Workshop on Archiving and Web Dissemination of Geotechnical Data, 4–5 October 2001. September 2002.
PEER 2002/03 Investigation of Sensitivity of Building Loss Estimates to Major Uncertain Variables for the Van Nuys Testbed. Keith A. Porter, James L. Beck, and Rustem V. Shaikhutdinov. August 2002.
PEER 2002/02 The Third U.S.-Japan Workshop on Performance-Based Earthquake Engineering Methodology for Reinforced Concrete Building Structures. July 2002.
PEER 2002/01 Nonstructural Loss Estimation: The UC Berkeley Case Study. Mary C. Comerio and John C. Stallmeyer. December 2001.
PEER 2001/16 Statistics of SDF-System Estimate of Roof Displacement for Pushover Analysis of Buildings. Anil K. Chopra, Rakesh K. Goel, and Chatpan Chintanapakdee. December 2001.
PEER 2001/15 Damage to Bridges during the 2001 Nisqually Earthquake. R. Tyler Ranf, Marc O. Eberhard, and Michael P. Berry. November 2001.
PEER 2001/14 Rocking Response of Equipment Anchored to a Base Foundation. Nicos Makris and Cameron J. Black. September 2001.
PEER 2001/13 Modeling Soil Liquefaction Hazards for Performance-Based Earthquake Engineering. Steven L. Kramer and Ahmed-W. Elgamal. February 2001.
PEER 2001/12 Development of Geotechnical Capabilities in OpenSees. Boris Jeremić. September 2001.
PEER 2001/11 Analytical and Experimental Study of Fiber-Reinforced Elastomeric Isolators. James M. Kelly and Shakhzod M. Takhirov. September 2001.
PEER 2001/10 Amplification Factors for Spectral Acceleration in Active Regions. Jonathan P. Stewart, Andrew H. Liu, Yoojoong Choi, and Mehmet B. Baturay. December 2001.
PEER 2001/09 Ground Motion Evaluation Procedures for Performance-Based Design. Jonathan P. Stewart, Shyh-Jeng Chiou, Jonathan D. Bray, Robert W. Graves, Paul G. Somerville, and Norman A. Abrahamson. September 2001.
PEER 2001/08 Experimental and Computational Evaluation of Reinforced Concrete Bridge Beam-Column Connections for Seismic Performance. Clay J. Naito, Jack P. Moehle, and Khalid M. Mosalam. November 2001.
PEER 2001/07 The Rocking Spectrum and the Shortcomings of Design Guidelines. Nicos Makris and Dimitrios Konstantinidis. August 2001.

204
PEER 2001/06 Development of an Electrical Substation Equipment Performance Database for Evaluation of Equipment Fragilities. Thalia Agnanos. April 1999.
PEER 2001/05 Stiffness Analysis of Fiber-Reinforced Elastomeric Isolators. Hsiang-Chuan Tsai and James M. Kelly. May 2001.
PEER 2001/04 Organizational and Societal Considerations for Performance-Based Earthquake Engineering. Peter J. May. April 2001.
PEER 2001/03 A Modal Pushover Analysis Procedure to Estimate Seismic Demands for Buildings: Theory and Preliminary Evaluation. Anil K. Chopra and Rakesh K. Goel. January 2001.
PEER 2001/02 Seismic Response Analysis of Highway Overcrossings Including Soil-Structure Interaction. Jian Zhang and Nicos Makris. March 2001.
PEER 2001/01 Experimental Study of Large Seismic Steel Beam-to-Column Connections. Egor P. Popov and Shakhzod M. Takhirov. November 2000.
PEER 2000/10 The Second U.S.-Japan Workshop on Performance-Based Earthquake Engineering Methodology for Reinforced Concrete Building Structures. March 2000.
PEER 2000/09 Structural Engineering Reconnaissance of the August 17, 1999 Earthquake: Kocaeli (Izmit), Turkey. Halil Sezen, Kenneth J. Elwood, Andrew S. Whittaker, Khalid Mosalam, John J. Wallace, and John F. Stanton. December 2000.
PEER 2000/08 Behavior of Reinforced Concrete Bridge Columns Having Varying Aspect Ratios and Varying Lengths of Confinement. Anthony J. Calderone, Dawn E. Lehman, and Jack P. Moehle. January 2001.
PEER 2000/07 Cover-Plate and Flange-Plate Reinforced Steel Moment-Resisting Connections. Taejin Kim, Andrew S. Whittaker, Amir S. Gilani, Vitelmo V. Bertero, and Shakhzod M. Takhirov. September 2000.
PEER 2000/06 Seismic Evaluation and Analysis of 230-kV Disconnect Switches. Amir S. J. Gilani, Andrew S. Whittaker, Gregory L. Fenves, Chun-Hao Chen, Henry Ho, and Eric Fujisaki. July 2000.
PEER 2000/05 Performance-Based Evaluation of Exterior Reinforced Concrete Building Joints for Seismic Excitation. Chandra Clyde, Chris P. Pantelides, and Lawrence D. Reaveley. July 2000.
PEER 2000/04 An Evaluation of Seismic Energy Demand: An Attenuation Approach. Chung-Che Chou and Chia-Ming Uang. July 1999.
PEER 2000/03 Framing Earthquake Retrofitting Decisions: The Case of Hillside Homes in Los Angeles. Detlof von Winterfeldt, Nels Roselund, and Alicia Kitsuse. March 2000.
PEER 2000/02 U.S.-Japan Workshop on the Effects of Near-Field Earthquake Shaking. Andrew Whittaker, Editor. July 2000.
PEER 2000/01 Further Studies on Seismic Interaction in Interconnected Electrical Substation Equipment. Armen Der Kiureghian, Kee-Jeung Hong, and Jerome L. Sackman. November 1999.
PEER 1999/14 Seismic Evaluation and Retrofit of 230-kV Porcelain Transformer Bushings. Amir S. Gilani, Andrew S. Whittaker, Gregory L. Fenves, and Eric Fujisaki. December 1999.
PEER 1999/13 Building Vulnerability Studies: Modeling and Evaluation of Tilt-up and Steel Reinforced Concrete Buildings. John W. Wallace, Jonathan P. Stewart, and Andrew S. Whittaker, Editors. December 1999.
PEER 1999/12 Rehabilitation of Nonductile RC Frame Building Using Encasement Plates and Energy-Dissipating Devices. Mehrdad Sasani, Vitelmo V. Bertero, James C. Anderson. December 1999.
PEER 1999/11 Performance Evaluation Database for Concrete Bridge Components and Systems under Simulated Seismic Loads. Yael D. Hose and Frieder Seible. November 1999.
PEER 1999/10 U.S.-Japan Workshop on Performance-Based Earthquake Engineering Methodology for Reinforced Concrete Building Structures. December 1999.
PEER 1999/09 Performance Improvement of Long Period Building Structures Subjected to Severe Pulse-Type Ground Motions. James C. Anderson, Vitelmo V. Bertero, and Raul Bertero. October 1999.
PEER 1999/08 Envelopes for Seismic Response Vectors. Charles Menun and Armen Der Kiureghian. July 1999.
PEER 1999/07 Documentation of Strengths and Weaknesses of Current Computer Analysis Methods for Seismic Performance of Reinforced Concrete Members. William F. Cofer. November 1999.
PEER 1999/06 Rocking Response and Overturning of Anchored Equipment under Seismic Excitations. Nicos Makris and Jian Zhang. November 1999.
PEER 1999/05 Seismic Evaluation of 550 kV Porcelain Transformer Bushings. Amir S. Gilani, Andrew S. Whittaker, Gregory L. Fenves, and Eric Fujisaki. October 1999.

205
PEER 1999/04 Adoption and Enforcement of Earthquake Risk-Reduction Measures. Peter J. May, Raymond J. Burby, T. Jens Feeley, and Robert Wood. August 1999.
PEER 1999/03 Task 3 Characterization of Site Response General Site Categories. Adrian Rodriguez-Marek, Jonathan D. Bray and Norman Abrahamson. February 1999.
PEER 1999/02 Capacity-Demand-Diagram Methods for Estimating Seismic Deformation of Inelastic Structures: SDF Systems. Anil K. Chopra and Rakesh Goel. April 1999.
PEER 1999/01 Interaction in Interconnected Electrical Substation Equipment Subjected to Earthquake Ground Motions. Armen Der Kiureghian, Jerome L. Sackman, and Kee-Jeung Hong. February 1999.
PEER 1998/08 Behavior and Failure Analysis of a Multiple-Frame Highway Bridge in the 1994 Northridge Earthquake. Gregory L. Fenves and Michael Ellery. December 1998.
PEER 1998/07 Empirical Evaluation of Inertial Soil-Structure Interaction Effects. Jonathan P. Stewart, Raymond B. Seed, and Gregory L. Fenves. November 1998.
PEER 1998/06 Effect of Damping Mechanisms on the Response of Seismic Isolated Structures. Nicos Makris and Shih-Po Chang. November 1998.
PEER 1998/05 Rocking Response and Overturning of Equipment under Horizontal Pulse-Type Motions. Nicos Makris and Yiannis Roussos. October 1998.
PEER 1998/04 Pacific Earthquake Engineering Research Invitational Workshop Proceedings, May 14–15, 1998: Defining the Links between Planning, Policy Analysis, Economics and Earthquake Engineering. Mary Comerio and Peter Gordon. September 1998.
PEER 1998/03 Repair/Upgrade Procedures for Welded Beam to Column Connections. James C. Anderson and Xiaojing Duan. May 1998.
PEER 1998/02 Seismic Evaluation of 196 kV Porcelain Transformer Bushings. Amir S. Gilani, Juan W. Chavez, Gregory L. Fenves, and Andrew S. Whittaker. May 1998.
PEER 1998/01 Seismic Performance of Well-Confined Concrete Bridge Columns. Dawn E. Lehman and Jack P. Moehle. December 2000.

206
PEER REPORTS: ONE HUNDRED SERIES
PEER 2012/103 Performance-Based Seismic Demand Assessment of Concentrically Braced Steel Frame Buildings. Chui-Hsin Chen and Stephen A. Mahin. December 2012.
PEER 2012/102 Procedure to Restart an Interrupted Hybrid Simulation: Addendum to PEER Report 2010/103. Vesna Terzic and Bozidar Stojadinovic. October 2012.
PEER 2012/101 Mechanics of Fiber Reinforced Bearings. James M. Kelly and Andrea Calabrese. February 2012.
PEER 2011/107 Nonlinear Site Response and Seismic Compression at Vertical Array Strongly Shaken by 2007 Niigata-ken Chuetsu-oki Earthquake. Eric Yee, Jonathan P. Stewart, and Kohji Tokimatsu. December 2011.
PEER 2011/106 Self Compacting Hybrid Fiber Reinforced Concrete Composites for Bridge Columns. Pardeep Kumar, Gabriel Jen, William Trono, Marios Panagiotou, and Claudia Ostertag. September 2011.
PEER 2011/105 Stochastic Dynamic Analysis of Bridges Subjected to Spacially Varying Ground Motions. Katerina Konakli and Armen Der Kiureghian. August 2011.
PEER 2011/104 Design and Instrumentation of the 2010 E-Defense Four-Story Reinforced Concrete and Post-Tensioned Concrete Buildings. Takuya Nagae, Kenichi Tahara, Taizo Matsumori, Hitoshi Shiohara, Toshimi Kabeyasawa, Susumu Kono, Minehiro Nishiyama (Japanese Research Team) and John Wallace, Wassim Ghannoum, Jack Moehle, Richard Sause, Wesley Keller, Zeynep Tuna (U.S. Research Team). June 2011.
PEER 2011/103 In-Situ Monitoring of the Force Output of Fluid Dampers: Experimental Investigation. Dimitrios Konstantinidis, James M. Kelly, and Nicos Makris. April 2011.
PEER 2011/102 Ground-Motion Prediction Equations 1964–2010. John Douglas. April 2011.
PEER 2011/101 Report of the Eighth Planning Meeting of NEES/E-Defense Collaborative Research on Earthquake Engineering. Convened by the Hyogo Earthquake Engineering Research Center (NIED), NEES Consortium, Inc. February 2011.
PEER 2010/111 Modeling and Acceptance Criteria for Seismic Design and Analysis of Tall Buildings. Task 7 Report for the Tall Buildings Initiative - Published jointly by the Applied Technology Council. October 2010.
PEER 2010/110 Seismic Performance Assessment and Probabilistic Repair Cost Analysis of Precast Concrete Cladding Systems for Multistory Buildlings. Jeffrey P. Hunt and Božidar Stojadinovic. November 2010.
PEER 2010/109 Report of the Seventh Joint Planning Meeting of NEES/E-Defense Collaboration on Earthquake Engineering. Held at the E-Defense, Miki, and Shin-Kobe, Japan, September 18–19, 2009. August 2010.
PEER 2010/108 Probabilistic Tsunami Hazard in California. Hong Kie Thio, Paul Somerville, and Jascha Polet, preparers. October 2010.
PEER 2010/107 Performance and Reliability of Exposed Column Base Plate Connections for Steel Moment-Resisting Frames. Ady Aviram, Božidar Stojadinovic, and Armen Der Kiureghian. August 2010.
PEER 2010/106 Verification of Probabilistic Seismic Hazard Analysis Computer Programs. Patricia Thomas, Ivan Wong, and Norman Abrahamson. May 2010.
PEER 2010/105 Structural Engineering Reconnaissance of the April 6, 2009, Abruzzo, Italy, Earthquake, and Lessons Learned. M. Selim Günay and Khalid M. Mosalam. April 2010.
PEER 2010/104 Simulating the Inelastic Seismic Behavior of Steel Braced Frames, Including the Effects of Low-Cycle Fatigue. Yuli Huang and Stephen A. Mahin. April 2010.
PEER 2010/103 Post-Earthquake Traffic Capacity of Modern Bridges in California. Vesna Terzic and Božidar Stojadinović. March 2010.
PEER 2010/102 Analysis of Cumulative Absolute Velocity (CAV) and JMA Instrumental Seismic Intensity (IJMA) Using the PEER–NGA Strong Motion Database. Kenneth W. Campbell and Yousef Bozorgnia. February 2010.
PEER 2010/101 Rocking Response of Bridges on Shallow Foundations. Jose A. Ugalde, Bruce L. Kutter, and Boris Jeremic. April 2010.
PEER 2009/109 Simulation and Performance-Based Earthquake Engineering Assessment of Self-Centering Post-Tensioned Concrete Bridge Systems. Won K. Lee and Sarah L. Billington. December 2009.
PEER 2009/108 PEER Lifelines Geotechnical Virtual Data Center. J. Carl Stepp, Daniel J. Ponti, Loren L. Turner, Jennifer N. Swift, Sean Devlin, Yang Zhu, Jean Benoit, and John Bobbitt. September 2009.

207
PEER 2009/107 Experimental and Computational Evaluation of Current and Innovative In-Span Hinge Details in Reinforced Concrete Box-Girder Bridges: Part 2: Post-Test Analysis and Design Recommendations. Matias A. Hube and Khalid M. Mosalam. December 2009.
PEER 2009/106 Shear Strength Models of Exterior Beam-Column Joints without Transverse Reinforcement. Sangjoon Park and Khalid M. Mosalam. November 2009.
PEER 2009/105 Reduced Uncertainty of Ground Motion Prediction Equations through Bayesian Variance Analysis. Robb Eric S. Moss. November 2009.
PEER 2009/104 Advanced Implementation of Hybrid Simulation. Andreas H. Schellenberg, Stephen A. Mahin, Gregory L. Fenves. November 2009.
PEER 2009/103 Performance Evaluation of Innovative Steel Braced Frames. T. Y. Yang, Jack P. Moehle, and Božidar Stojadinovic. August 2009.
PEER 2009/102 Reinvestigation of Liquefaction and Nonliquefaction Case Histories from the 1976 Tangshan Earthquake. Robb Eric Moss, Robert E. Kayen, Liyuan Tong, Songyu Liu, Guojun Cai, and Jiaer Wu. August 2009.
PEER 2009/101 Report of the First Joint Planning Meeting for the Second Phase of NEES/E-Defense Collaborative Research on Earthquake Engineering. Stephen A. Mahin et al. July 2009.
PEER 2008/104 Experimental and Analytical Study of the Seismic Performance of Retaining Structures. Linda Al Atik and Nicholas Sitar. January 2009.
PEER 2008/103 Experimental and Computational Evaluation of Current and Innovative In-Span Hinge Details in Reinforced Concrete Box-Girder Bridges. Part 1: Experimental Findings and Pre-Test Analysis. Matias A. Hube and Khalid M. Mosalam. January 2009.
PEER 2008/102 Modeling of Unreinforced Masonry Infill Walls Considering In-Plane and Out-of-Plane Interaction. Stephen Kadysiewski and Khalid M. Mosalam. January 2009.
PEER 2008/101 Seismic Performance Objectives for Tall Buildings. William T. Holmes, Charles Kircher, William Petak, and Nabih Youssef. August 2008.
PEER 2007/101 Generalized Hybrid Simulation Framework for Structural Systems Subjected to Seismic Loading. Tarek Elkhoraibi and Khalid M. Mosalam. July 2007.
PEER 2007/100 Seismic Evaluation of Reinforced Concrete Buildings Including Effects of Masonry Infill Walls. Alidad Hashemi and Khalid M. Mosalam. July 2007.

208

The Pacifi c Earthquake Engineering Research Center (PEER) is a multi-institutional research and education center with headquarters at the University of California, Berkeley. Investigators from over 20 universities, several consulting companies, and researchers at various state and federal government agencies contribute to research programs focused on performance-based earthquake engineering.
These research programs aim to identify and reduce the risks from major earthquakes to life safety and to the economy by including research in a wide variety of disciplines including structural and geotechnical engineering, geology/seismology, lifelines, transportation, architecture, economics, risk management, and public policy.
PEER is supported by federal, state, local, and regional agencies, together with industry partners.
PEER Core Institutions
University of California, Berkeley (Lead Institution)California Institute of Technology
Oregon State UniversityStanford University
University of California, DavisUniversity of California, Irvine
University of California, Los AngelesUniversity of California, San Diego
University of Nevada, RenoUniversity of Southern California
University of Washington
PEER reports can be ordered at https://peer.berkeley.edu/peer-reports or by contacting
Pacifi c Earthquake Engineering Research CenterUniversity of California, Berkeley325 Davis Hall, Mail Code 1792
Berkeley, CA 94720-1792Tel: 510-642-3437
Email: [email protected]
ISSN 1547-0587X