Fisheries sector refrigeration systems in Pacific Island countries
Upload
khangminh22Category
view
0download
0
Henrike Seidel & Padma N. Lal
IUCN Oceania July 2010
corresponding author, [email protected]
Economic value of the Pacific Ocean to the Pacific Island Countries and
Territories
IUCN Oceania
2 | I U C N O c e a n i a

3 | I U C N O c e a n i a
Table of Contents List of Figures .................................................................................................................................................... 5
List of Tables ...................................................................................................................................................... 5
List of Boxes ....................................................................................................................................................... 5
Acronyms ............................................................................................................................................................ 6
Executive summary ......................................................................................................................................... 7
1. Introduction ............................................................................................................................................. 14
2. Pacific Ocean and Pacific Island economies .................................................................................. 18
3. Methodology ............................................................................................................................................. 20
4. Importance of Pacific Ocean-based activities to PICT economies ........................................ 22
4.1 Tourism & recreational activities ................................................................................................................ 24
4.2 Fishing sector ....................................................................................................................................................... 30
4.2.1 Oceanic tuna fishing ....................................................................................................................................... 30
4.2.2 Coastal fishing .................................................................................................................................................. 34
4.2.2.1 Coastal fishing and mariculture ....................................................................................................... 35
4.2.2.2 Coastal subsistence fishing ................................................................................................................ 41
4.3 Shipping .................................................................................................................................................................. 44
4.4 Mining in marine waters ................................................................................................................................. 46
4.4.1 Coastal mining ............................................................................................................................................ 46
4.4.2 Seabed mining ............................................................................................................................................. 48
5. Total Economic Value of Pacific Ocean sub-ecosystems ........................................................... 50
5.1 Coastal sub-ecosystems ................................................................................................................................... 51
6. Implications of business as usual ..................................................................................................... 57
6.2 Management implications of ‘business as usual’ ................................................................................. 57
6.2 Cost implications of ‘business as usual’ practices ............................................................................... 59
6.2.1 Habitat destruction, overfishing and exploitation ..................................................................... 60
6.2.2 Pollution ...................................................................................................................................................... 61
6.2.3 Climate change & sea level rise.......................................................................................................... 62
6.2.4 Other livelihood costs under ‘business as usual’ ........................................................................ 64

4 | I U C N O c e a n i a
7. Governance of the Pacific Ocean – PICTs and beyond ............................................................... 65
References ....................................................................................................................................................... 69
Appendices ...................................................................................................................................................... 73
Appendix I: Tourist arrivals to PICT between 1990 and 2008 ............................................................... 73
Appendix II: Merchant shipping and fleet in the PICTs ............................................................................. 74
Appendix III: Ratification status of MEAs in PICs ....................................................................................... 75
Appendix IV: Ratification status of environmental conventions in PICs .......................................... 75

List of Figures
Figure 1. The PICTs and their Exclusive Economic Zones ........................................................................................... 14
Figure 2. Connectivity between ocean health and economic wealth ....................................................................... 16
Figure 3. Ocean and coastal uses within the PICT region ............................................................................................. 23
Figure 4. Ocean-based activities can be dependent or independent of ocean health ........................................ 23
Figure 5. International tourism expenditure ...................................................................................................................... 26
Figure 6. Annual total and per unit population tourist arrivals .................................................................................. 27
Figure 7. Changes in subsistence catch levels between 1990 until 2007 ............................................................... 43
Figure 8. Port charges in selected PIC................................................................................................................................... 45
List of Tables
Table I. PICTs and their geographical properties ............................................................................................................. 18
Table II. PICTs, populations, and economies ...................................................................................................................... 19
Table III. GVP of ocean-based sub-sectors to PICTs ........................................................................................................ 23
Table IV. Economic scale and contribution of the tourism industry to PICT (in 2008 constant prices) .. 25
Table V. Visitor arrivals to SPTO member countries between 1990 and 2008 ................................................... 28
Table VI. Industry and economy employment and economic contribution .......................................................... 29
Table VII. Economic contribution from fishing sector ................................................................................................... 30
Table VIII. Offshore tuna fishing production and catch values in 2007 ................................................................. 32
Table IX. Access fees received in PICTs in 2007 ............................................................................................................... 33
Table X. Coastal commercial fishing production & mariculture ................................................................................. 37
Table XI. Subsistence fishing in the PICT ............................................................................................................................. 42
Table XII. Trading routes and shipping companies in the PIC region ...................................................................... 44
Table XIII. Diversity in economic value of goods and services supported by mangroves .............................. 50
Table XIV. Coral reef and mangrove areas in PICTs ................................................................................................. 51
Table XV. Ecosystem goods and services (in NPV) of coral reefs in PICT ............................................................. 53
Table XVI. Nominal Values of Ecosystem goods and services of mangroves in PICT ...................................... 54
Table XVII. Net benefits of coral reef related tourism in PICTs .................................................................................. 56
List of Boxes
Box 1. Marine aquarium trade in PICTs ................................................................................................................................ 39
Box 2. Annual per capita fish consumption in PICT ........................................................................................................ 41
Box 3. Subsistence contribution of total coastal fishing production in % ............................................................. 41
Box 4. CTI and Micronesia Challenge ..................................................................................................................................... 66

6 | I U C N O c e a n i a
Acronyms
ADB Asian Development Bank
AOSIS
CBD
CITES
CMS
Alliance of Small Island States
Convention on International Trade in Endangered Species
Convention on Migratory Species
Convention on Biological Diversity
CNMI Commonwealth of Northern Mariana Islands
CPI Consumer Price Index
DWFV Distant Water Fishing Vessel
EEZ Exclusive Economic Zone
EIS Entry Insurance System
FSM
FFA
Federal States of Micronesia
Forum Fisheries Agency
ft Foot
GDP Gross Development Product
GVP Gross Value of Product
HIES
ITPGR
IUCN
LDC
Household income and expenditure survey
International Treaty on Plant Genetic Resources
International Union for the Conservation of Nature
Least Developed Country
MEA Multilateral Environmental Agreement
mt Metric ton (equivalent to one tonne)
NGO
NVP
Non Governmental Organisation
Net Value of Product
PIC Pacific Island Countries
PICT Pacific Island Countries & Territories
PIROP
IWC
PIROP
Pacific Islands Regional Ocean Policy
International Whaling Commission
Pacific Island Region Ocean Policy
PNG Papua New Guinea
SIDS Small Island Developing State(s)
SOPAC Pacific Islands Applied Geoscience Commission
SPC Secretariat of the Pacific Community
SPTO South Pacific Tourism Organisation
TEU Twenty-foot equivalent unit
TEV Total Economic Value
UNCLOS
UNWTO
United Nation World Tourism Organisation
United Nations Convention on the Law of the Sea

7 | I U C N O c e a n i a
Executive summary
In recent years economic arguments have been used increasingly as a policy and advocacy tool to
demonstrate society’s dependence on healthy and functioning ecosystems and the economic
consequences of losses thereof. Very few such studies have been carried out for the Pacific Ocean
despite it being the largest ecosystem in the world, covering almost half the globe’s sea surface. The
same holds true for the 22 Pacific Island countries and territories (PICTs) that govern approximately
a third of this vast ocean. More critically for the PICTs, good baseline information about the economic
values of key sectors dependent on the Pacific Ocean is not readily available, let alone measures of
the economic cost on natural Pacific Ocean ecosystems under ‘business as usual’ scenarios.
For the 10 million Pacific islanders, the Pacific Ocean is their major economic, social, and cultural
lifeline. Its coastal and marine environments sustain a multitude of important activities that fuel local,
national, and international economies and provide livelihoods and food security for millions of
islanders. Despite the importance of a healthy Pacific Ocean, evidence is mounting that this unique
ecosystem is in peril from anthropogenic threats such as overfishing, habitat destruction, pollution,
and probably the most severe threat of all, climate change and resulting rising sea level (Center for
Ocean Solution 2009). Today, Pacific people already whiteness a loss of wellbeing due to
unsustainable use of ocean goods and services.
While current threats to the Pacific Ocean have been identified and acknowledged, the challenge
remains to gain political buy-in from Pacific leaders to opt for more sustainable solutions in the
future. There is an urgent need to provide information to decision-makers that it make economic
sense to avoid the costs that arise from environmental degradation and to continue being able to
profit from ocean resources.
The purpose of this report is to provide an overview of the known economic contributions of sectors
associated with the Pacific Ocean within the PICTs boundaries. Due to the difficulties in obtaining
consistent sets of economic value measures, in this report gross value product measure has generally
been used together with employment figures. Economic value estimates provided in this report
reflect empirical data that could be accessed from published literature, national, and regional
statistics and secondary data from national governments, NGOs, and independent consultants. Global,
regional, and national databases were consulted for values on national statistics to ensure a
consistent approach to estimation. This study has revealed that there are many data gaps and
information challenges, which will require targeted primary research using a consistent methodology
and value measures across the region. It is thus but a first step towards understanding the economic
contribution of the oceans resources to the economies of the PICTs, as well as the economic value of
healthy Pacific Oceans.

8 | I U C N O c e a n i a
Results
Key economic activities of the PICTs reliant on the Pacific Ocean include subsistence and commercial
coastal fisheries and industrial offshore fisheries, marine tourism, shipping and mining, and marine
research and education. Consistent empirical information is mainly available for fishing and tourism
sectors. Information on other sectors is either unavailable or limited at best. As a result it is not
possible to provide an estimate for the total value of the contribution of the Pacific Ocean to the
economies of the PICTs, without detailed primary research.
Ocean-health dependent activities: Tourism and fishing
The Pacific Ocean-based fishing and tourism sectors in the region are estimated to provide US$ 3.3
billion to the national economies in the PICTs, or more than 10 % of the regional GDP (Table I). They
are both highly reliant on a healthy and functioning Pacific Ocean.
Table I: Economic contribution of tourism and fishing to the economies of the PICTs
Ocean health dependant sector Gross Value of Product (GVP)* As % of regional GDP
Tourism 2.27 billion 7.2%
Fishing 1.04 billion 3.3%
Total 3.32 billion
10.5%
Source: Section 4 of this report
The Pacific Ocean plays a disproportionately critical role in the wellbeing of the Pacific, producing
much needed income, employment as well as for food security (Table II).
Table II: PICTs employment in tourism and fisheries
Ocean health dependant sector Nr of Pacific islanders formally employed
As % of regional employment
Tourism 188,155 5.8%
Fishing* 48,949 1.5%
Total 207,155 6.4%
Source: Section 4 of this report; *also includes employment from post-harvest activities
Tourism
The Pacific way of life but first and foremost the scenic beauty of the Islands’ coastal and marine
environments attracted more than three million tourists to the Pacific island region in 2008, almost
comparable to the number of locals, if Papua New Guinea is excluded from the equation. Since
tourism in the Pacific is largely based on its natural assets, the Pacific Ocean is assumed to be the
main basis of the tourism sector. Tourists spent about US$2.3 billion dollars, contributing 7 % to the
regional GDP. International tourism receipt data, which includes in-country expenditures, is reported

9 | I U C N O c e a n i a
to be $4.3 billion. Tourism also generates the largest level of employment, contributing 188,500 job
or 6 % of formal employment, with countries such as the Cook Islands reporting almost 60% of the
workforce (see Table 7 in the text for more detail).
Fishing
Fishing plays a major role in generating revenue, export earnings, and provides food security for local
communities. The total gross value product of the domestic fishing sector, including the access fees
and other charges associated with foreign fishing is estimated to be $1.2 billion or 3.7% of regional
GDP (Table III).
Table III: Economic value (GVP) of fishing in the PICTs
Ocean health dependant activities Gross Value of Product (GVP)* As % of regional GDP
Locally-based tuna fishing 596,800,000 1.9%
Access fees 78,800,000 0.2%
Commercial inshore fishery 165,700,000 0.5%
Mariculture 145,000,000 0.5%
Subsistence fishing 200,366,961 0.6%
Total 1,186,666,961 3.7%
*GVP in constant US$ at 2007 market prices ** household participation
The total domestic fishing production in the PICTs, including the subsistence fisheries and
mariculture operations, is the most important sub sector, with a value of US$ 1.1 billion in 2007. In
addition, the PICTs received US$78.5 million in access fees and other charges from foreign fishing
vessels, giving a total fishing sector value of US$1.2 billion. Subsistence fishery plays a central role in
Pacific island lifestyles and food production. Roughly half to two thirds of national households engage
in subsistence fishery, estimated to be about US$200 million. If the value of foreign industrial tuna
catches were to be included, the economic value of fish harvests within the Pacific island EEZs would
be worth about US$4.3 billion.
Ocean-health independent activities: Shipping and mining
In addition to tourism and fishing that strongly depend on ocean health, the Pacific and its coastal
areas are also used for shipping and coastal mining, and are explored for potential deep sea mining
for minerals and fossil fuels. These activities are not dependant on a healthy ocean but they do
nonetheless affect the state of the ocean. Economic value of these activities are either unavailable or
incomplete.
Deep sea mining for minerals could occur in 12 PICTs that have confirmed the presence of mineral
deposits, while another five countries have confirmed offshore fossil fuel occurrence. The GVP could

10 | I U C N O c e a n i a
be in the region of several billion US$, exceeding national GDP several fold. Reported values for
coastal mining for aggregates and sand in countries such as Kiribati, Fiji, and the Cook Islands are in
the area of US$ 150,000 to US$ 700,000 annually.
The GVP of shipping is very difficult to estimate as disaggregated data for the region is not available.
PICTs generate money through port charges and other fees but trade of goods and transport of
passengers without the shipping industry is unthinkable in the region due to the enormous cost of
air fright fares. The economic value of the shipping industry to PICTs is therefore much higher than
the sum of charges and fees earned, although such activities also produce externality costs through
the destruction of habitats and pollution which are not captured in the market values of mining
products.
Economic values of coastal ecosystems
The ocean and its coastal areas have strongly shaped and still influence Pacific island culture and
spiritual identity. Healthy coastal areas such as coral reefs, mangrove forests, seagrass meadows, and
associated ecosystems are their foundation.. They provide indirect use values to human well being,
including biodiversity, protection against natural disasters, and climate regulations. Limited studies
have estimated total (net) economic values (TEV) associated with the direct, indirect and non use
benefits of coastal habitats in the PICT, though estimates vary considerably from study to study due
to different methodologies used. Direct use values from tourism and fishing as ocean-health
dependant activities are interdependent with coastal and offshore ecosystems. Extrapolating
estimates from available Pacific case studies an annual TEV for coral reefs and mangroves is
estimated to be about an US$ 3.8 billion and US$ 3.9 billion respectively for the entire PICT region
(Table IV). These estimates included indirect and non-use value of US$ 1.6 billion per year for
mangroves and an indirect and non-use use values for coral reefs of US$ 1.3 billion annually from
coastal protection, biodiversity, and amenities. The remaining benefits stem from direct use values
such as fishing and tourism and must not be added to the GVP of both sectors mentioned above to
avoid double-counting.
Table IV: Total economic value of Pacific Ocean sub-ecosystems to PICTs
Sub-ecosystems
TEV TEV / km2 / yr Direct use value Indirect & non-
use values Comment
Coral Reef
3.78 billion
73,300
2.05 billion
1.29 billion
From costal protection, amenities, biodiversity; fisheries in constant US$ 2008 prices (see Table 15)
Mangroves
3.86 billion
546,100
2.29 billion
1.57 billion
From costal protection, amenities, biodiversity; fisheries in current prices (see Table 17)
Source: see Section 5 of this report; values in current US$.

11 | I U C N O c e a n i a
In considering the economic worth of the Pacific Ocean to the PICTs, it is emphasised that one cannot
combine these TEV with the earlier gross values of the activities based on Pacific Ocean, because the
two value measures are different, quite apart from the problem of double accounting. The TEV
measures net economic benefits of the goods and services supported by ecosystems, where as gross
values of products from the other sectors reflect the gross values of products and services, excluding
the input costs. Also some of the direct use values included in the TEV may also have been captured in
the gross value estimates reported earlier, as is the case for whale watching.
Business as usual – implications for the PICTs
If ’business as usual’ of overexploitation, pollution, and destruction were to prevail in addition to
predicted climate change effects, Pacific island economies face the prospect of becoming non-viable.
The Pacific Rim and overseas economies will also suffer from the resulting loss of tuna stocks and a
decline in the tourism industry since key players are often foreign nationals and large multinational
corporations. However, the largest cost by far will be borne by the people of the Pacific islands
themselves whose livelihoods, cultural identity, and security wold be at stake.
These costs of inaction arising through ‘business as usual’ approach are difficult to estimate in the
absence of good baseline information. As mentioned above, little is known about the economic value
of goods and services of the Pacific Ocean and there is a common lack of understanding about the
incremental change in economic value as the health of the Pacific Ocean changes. The importance of
the Pacific Ocean to the economies of the PICTs does however suggest that any further deterioration
of its state of health could have a significant impact on the economic well being of Pacific Islanders,
primarily of those reliant on the tourism and fisheries sectors that depend on healthy ecosystems.
Even if the drivers of environmental and climate change were to result in 1% change in the economic
activities, the PICTs economy and livelihoods would be significantly impacted, as reflected in the
foregone values of goods and services associated with various ecosystems.
A few available case studies show that expected costs of climate change to national economies will be
in the area of US$ 7 billion over the next 20 years (Table V). Additionally, costs of several hundred
million dollars will be caused through increased natural disasters, coral bleaching, loss of mangroves
and resulting needs to provide for artificial coastal protection. The costs presented in Table are
indications of the magnitude only because the values are highly interdependent, as are the dynamics
between these major environmental threat and climate change.

12 | I U C N O c e a n i a
Table V: Cost estimates (loss in economic values) from environmental threats
Theme Costs Comment Source
Habitat destruction (coastal protection)
US$ 88-373 million Building & maintaining seawalls; Majuro Atoll, Marshall Island over 25 years
McKenzie et al. 2005
Overfishing (subsistence)
US$ 66.6 million Importing protein equivalent for subsistence communities from 5 PICs; annually
World Bank 2000
Pollution (watershed, liquid and solid waste)
US$ 11.3 million
Solid waste pollution Palau; watershed pollution in Cook Islands; solid & liquid waste in Tonga; liquid waste in Tuvalu; annually
(Hajkowicz, Tellames et al. 2005; Hajkowicz 2006; Lal, Saloa et al. 2006; Lal and Takau 2006)
Pollution (Oil spills) up to several hundred million US$
Indicative; total costs (De Poorter, Darby et al. 2009)
Climate change (economic development)
ca. US$ 7 billion Melanesia and Polynesia; in late 1990s value over 20 years
Hoegh-Guldberg et al. 2000
Climate change (natural disasters)
US$ 2.8 billion Costs of natural disasters during 1990s
Bettencourt et al. 2006
Climate change (Coral bleaching)
US$ 7.6 billion NPV over 50 years at 3% discount rate
Cesar et al. 2003
Climate change (Mangrove loss)
US$25-470 million In Melanesia, NPV Lal et al. 2009
Source: from Section 5 of this report; all values in current US$
Way forward
To address key environmental threats facing the countries and the region as a whole in an effective and
timely fashion, increased political will and collaboration between and within countries at all
governance levels is urgently needed. The PICTs and Pacific Rim countries need to agree to develop and
implement coordinated multidimensional, partnership-based, and multi-pronged actions across the
Pacific Ocean that would also mobilise public support. Such a process needs to be supported by robust
information about economic values and arguments regarding the ‘cost of inaction’ in appealing to the
conscience of decision-makers and the hearts and minds of the leaders of the Pacific region that urgent
action is needed now and into the future. This review, however, highlights that this is not going to be
easy, at least in the PICTs, as even basic information about the economic value of the Pacific Ocean to
the PICT is not readily available and would require significant effort to collect primary information.
Therefore, as a first step towards any Pacific Ocean-wide response to the environmental threats,
primary research using consistent methodology needs to be undertaken to develop baseline
information on the economic contribution of key activities associated with the Pacific Ocean in the
PICTs and other sub-regions. In addition, targeted economic valuation of goods and services associated
with key ecosystems in the Pacific is also warranted if evidence based policy advice is to be provided in
relations to the economic costs of business as usual on ecosystems.

13 | I U C N O c e a n i a
Ultimately, it will be the responsibility of the Leaders of the Pacific nations, the politicians and
governments, and all key stakeholders including the public at large, to take this information and act for
the sustainability of the Pacific Ocean, even if it may mean moving beyond the traditional comfort zones.

14 | I U C N O c e a n i a
1. Introduction
The Pacific Ocean is the largest feature of our planet occupying 180 million km2 orroughly half of the
Earth’s sea surface and more than a third of the Earth’s surface (Figure 1). It contains complex
ecosystems and provides many direct and indirect goods and services, supporting a diverse range of
economic activities of the 54 Pacific Rim and Island Countries, ranging from subsistence and
commercial coastal fisheries and industrial offshore fisheries, coastal and marine tourism, defence,
shipping and mining, to marine research and education. Further, the Pacific Ocean contributes to
global climate regulation, provides atmospheric oxygen, and its circulation dynamics of ocean
currents make our planet inhabitable. Coastal areas provide protection and a large proportion of the
population’s protein requirements. No matter where people live on this earth, they directly or
indirectly benefit from the Pacific Ocean’s goods and services.
Figure 1. The PICTs and their Exclusive Economic Zones
Despite these benefits, evidence is mounting to suggest that this unique ecosystem is in peril from
anthropogenic threats. The recently published Pacific Ocean Synthesis Report and the Scientific
Consensus Statement (Center for Ocean Solutions 2009a, 2000b) have summarised what is
scientifically known about the biggest threats to the Pacific Ocean as a whole:
15 | I U C N O c e a n i a
Habitat Destruction – productive marine and coastal habitats are being lost to destructive
fishing practices, inappropriate coastal development for aquaculture, tourism or agriculture.
Over fishing / harvesting – Unsustainable resource use reduces fish stocks throughout the
Pacific, limiting fish catches and threatening a critical food source.
Pollution – Pollutants from sewage, fertilizer runoff from agricultural lands, plastics and
other trash, shipping waste, toxic dumping and oil spills, runoff from streets and land,
combine to create one of the most critical classes of ocean threats – threatening human health
and ocean life.
Climate Change – Carbon dioxide discharged to the atmosphere is both altering seawater
chemistry resulting in ocean acidification and causing the ocean to warm leading to sea level
rise, stronger storms, changing rain patterns, and coral bleaching.
Further, although invasive species can be categorised under both pollution and habitat destruction,
the large research gaps in understanding its pervasiveness coupled with its potential devastating
effects warrant drawing special attention to it.
For the Pacific island region specifically, the report classified the following threats as having severe
impacts: commercial, artisanal, and subsistence overfishing, sea surface temperature increase, and
land-based sedimentation. Pollution from solid wastes, nutrients and chemicals and habitat
destruction were identified as additional threats along with potentially serious yet not quantified
impacts from invasive species introduced through shipping. Within the different sub-ecosystems
there are often competing uses that may negatively affect one another, as well as the sustainability of
the ecosystem itself. The overarching effects of climate change and resulting sea level rise exacerbate
these threats and compound matters for all. The nature of ultimate outcomes though remains unclear
as these would be a function of the complex interaction of drivers, causes, and effects as well as
management responses
Ocean-based activities and their threats are spatially and temporally connected within and beyond
the region. Shipping, the tuna fishery and tourism are operating on a regional scale. The threats they
cause are therefore also regional; e.g. the introduction of invasive species through shipping traffic
and ship-borne pollution such as oil spills, industrial and solid waste pollution, and the over-
exploitation of migratory tuna stocks. Future habitat destruction through seabed mining due to
unknown interactions of adjacent ecosystems may also occur. These threats that result from
unsustainable use of ocean goods and services will result in the loss of wellbeing of Pacific islanders
and Pacific island economies.
. Ocean health can only be maintained or achieved if urgent action towards sustainable region-wide
use is taken.

16 | I U C N O c e a n i a
Figure 2 illustrates the connectedness of ocean-based economies to ocean ecosystems. The
consequences of unregulated use will lead to the demise of both the natural and the economic system.
The ocean-based activities, while providing revenues and income for Pacific societies, cannot be
sustained at current production rates. Unsustainable and unregulated use puts the ocean systems at
risk which has strong negative impact on economic activities that rely on functioning ocean systems.
Ocean health is therefore inextricably linked to ocean wealth as are the people who depend on and
value the use of the resources. Ocean health can only be maintained or achieved if urgent action
towards sustainable region-wide use is taken.
Figure 2. Connectivity between ocean health and economic wealth
Source: Authors of this report
In the PICTS, a multitude of initiatives and projects are underway that address environmental issues
related to the Pacific Ocean at various governance levels, often focussing on fisheries management,
climate change and alternative livelihoods (Pratt and Govan 2010). Activities under various regional
instruments, such as the Pacific Plan, the Action Strategy for Nature Conservation in the Pacific
Islands, the Pacific Islands Framework for Action on Climate Change, the Pacific Islands Regional
Ocean Policy, and the Invasive Species Strategy for the Pacific address aspects of the management of
the Pacific Ocean and contribute to environmental conservation in the region. Nonetheless, such
efforts often remain piecemeal and repetitive of other projects or they fail to address threats at
appropriate scales and governance levels.
IUCN in its Pacific 2020 Challenge has called for a long-term commitment of political leaders, the
public sector, and Pacific communities to work together in facing these severe issues on the health
and status of the Pacific Ocean and to ensure improved ocean governance and the sustainable use and
Sustain-able use
Business as usual
Providing ecosystem goods & services
Threats to national & local economies, livelihoods & wellbeing
• Habitat destruction • Overfishing &
exploitation • Pollution • Climate change
Ocean-based revenues & employment
Ocean
Wealth
Ocean in danger
Economy in danger
Ocean Health

17 | I U C N O c e a n i a
management of ocean resources. To support this call, economic information can play an important
role, as recently experienced in relation to climate change and biodiversity conservation fields. The
Stern review on the Economic costs of climate change (Stern 2007) helped to increase attention by
global leaders about the costs of inaction. Stern et al. estimated that failing investments into the
prevention of the worst climate change effects would result in a catastrophic market failure of up to
20% reduction in global GDP. Other recent reports that produced significant impacts are the Cost of
policy inaction (COPI) report (Braat, Brink et al. 2008) and the ongoing IUCN spearheaded report on
The economics of ecosystems and biodiversity (TEEB) (Sukhdev 2008).
To convince leaders from the Pacific Rim countries and PICTS that urgent action is required to halt
this trend, information about benefits of the Pacific Ocean, and economic losses from ocean
degradation, needs to be provided to facilitate sustainable decision making. However, not much is
known about the total economic value (TEV) of coastal and marine activities associated with the
Pacific Ocean. Only a handful of studies have examined the economic contribution of the ocean
resources to national economies. California’s direct ocean economy, for example, is estimated to be
US$22.1 billion, or 1.5 % of the Californian GDP, generating 369,444 jobs (National Oceans Economics
Program 2009). Pacific Ocean associated economy in Australia (except Western Australia), is
reported to be about A$21.9 billion (The Allen Consulting Group 2004). These reports provide
estimates of the value of the marine sectors that depended directly on the ocean resources, including
fisheries/ aquaculture, shipping, marine tourism, and oil and gas mining. Such economic estimates do
not, however, reflect the indirect and non-market benefits derived from the ocean resources, which
can be considerably higher than the direct market values (Kildow and McIlgorm 2010). Such
aggregate information is not available for the PICTs.
The purpose of this report is to provide an overview of the known economic contributions of sectors
associated with the Pacific Ocean within the PICT boundaries. This report, based on published and
grey literature, provides some empirical information supporting the call for action by Pacific Leaders
to better manage the Pacific Ocean. It is but a first step towards understanding the economic
contribution of the oceans resources to the economies in the region, even while acknowledging that
there are many data gaps and information challenges in the region. To provide an ecological
perspective, the report also presents an overview of the total economic values of goods and services
associated with the use of ecosystems, such as coral reefs and mangroves in the PICTs.
The report is organised as follows: Section 2 provides an overview of the Pacific peoples and their
economies, followed by a discussion in Section 3 of the approach used to determine economic value
of the Pacific Ocean to the PICTs. Gross economic value estimates of economic activities associated
with the Pacific Ocean are provided in Section 4 followed by the presentation in Section 5 of the total

18 | I U C N O c e a n i a
economic (net) values of sub-ecosystems of the Pacific Ocean. Section 6 provides a discussion of the
cost and management implication of ‘business as usual’, followed by some concluding remarks.
2. Pacific Ocean and Pacific Island economies
The Pacific Ocean is home to 22 PICTs and athe major economic and social lifeline for the people of
the Pacific. These 17 states and 5 overseas territories comprise 200 high islands and 2,500 low lying
islands and coral atolls. Due to their wide geographical range the PICTs encompass approximately
28% of global exclusive economic zones (EEZ) which include some of the most productive tuna
fisheries in the Western and Central Pacific Ocean (WCPO) (Gillett, 2005). Rich cultural diversity and
the “Pacific way of life“ attract millions of tourists each year that together with revenues from the
fisheries sector sustain local and national economies, provide employment, and livelihoods.
Additionally, fishing for subsistence purposes largely prevails and provides the major source of
protein in most PICTs.
The PICTs encompass 55 times more water than land mass, or 310 times more if Papua New Guinea
(PNG) ,which makes up 85% of the total regional land mass (Table I), is excluded from the statistics.
Of the nearly 10 million people in the region 6.6 million live in PNG (Table II). Additionally, with the
exception of PNG, almost 100% of these people live within a 100 km corridor from the coast
(Martinez, Intralawan et al. 2007). These statistics emphasise the paramount importance of the
Pacific Ocean to the Pacific Islanders and have great implications on economies and daily lives.
Table I. PICTs and their geographical properties
Country or territory Land area
[km2] Sea area / EEZ [km2]
Ratio of sea to land area
Island type
American Samoa (US) 199 390,000 1,960 High islands
CNMI (US) 457 1,823,000 3,989 High islands
Cook Islands 237 1,830,000 7,722 High islands & atolls
Fiji 18,272 1,290,000 71 High island with a few minor atolls
French Polynesia (Fr) 3,521 5,030,000 1,429 High islands
FSM 701 2,980,000 4,251 High islands & atolls
Guam (US) 541 218,000 403 Uplifted ophiolite
Kiribati 811 3,550,000 4,377 Predominantly atolls
Marshall Islands 181 2,131,000 11,773 Atolls
Nauru 21 320,000 15,238 Raised coral island
New Caledonia (Fr) 18,576 1,740,000 94 High island
Niue 259 390,000 1,506 Raised coral island
Palau 444 629,000 1,417 High islands & atolls
Pitcairn Islands (UK) 5 800,000 160,000 Atolls
PNG 462,840 3,120,000 7 High island with a few small atolls
Samoa 2,935 120,000 41 High islands
Solomon Islands 28,370 1,340,000 47 High island with a few atolls
Tokelau (NZ) 12 290,000 24,167 Atolls

19 | I U C N O c e a n i a
Tonga 650 700,000 1,077 High island with a few small atolls
Tuvalu 26 900,000 34,615 Atolls
Vanuatu 12,190 680,000 56 High island with a few small atolls
Wallis and Futuna (Fr) 142 300,000 2,113 High islands
TOTAL 551,390 30,571,000 55 / 310* -
Source: SPC 2008 (land & sea area); Clarke 2005 (Island type); *without PNG
If the current population growth rate of 1.9% on average is maintained, PICT population will double
by 2050, further increasing pressure on their limited natural resources, particularly in some of the
resource limited small islands.
The PICTs share many economic characteristics and issues. They comprise many small islands
spread across a vast ocean mass and are geographically isolated from major global markets. The
Pacific island countries fall into what UNDP classifies as developing or least developed countries
(LCD) categories. Countries such as Fiji and Tonga belong to the developing country category
whereas Kiribati, Samoa, the Solomon Islands, Vanuatu, and Tuvalu belong to the LDC. Although the
countries differ in the depth and balance of challenges, similar development challenges nonetheless
apply across the region.
Pacific island economies are mostly based on primary industries characterised by narrow productive
sectors (Duncan and Nakagawa 2009). Most are particularly dependent on coastal and marine
resources for food and nutrition, as well as for export based income. Given the growing taste for
western goods and luxuries, they are increasingly reliant on imported goods which are mainly
transported across the ocean on large container ships. The islands are also generally characterised by
low gross domestic product (GDP) per capita (Table II). Having the developing country status, the
PICTs are also largely dependent on foreign aid y to support their development efforts. Such factors
also make PICTs highly vulnerable to external economic and environmental shocks. The Pacific small
island developing states (SIDS) are regarded as amongst the most vulnerable group to climate change
(IPCC 2007). This is compounded by weak institutional and human capacity which poses additional
challenge for sustainable management and resource use in conjunction with increasing demographic
and economic pressures.
Table II. PICTs, populations, and economies
Country or territory Population (2009
estimate)
Labour force
Year of estimate
National GDP [US$]
(Latest statistics)
Per capita GDP [US$]
Year of estimate
American Samoa 65,113 17,395 2006 558,800,000 8,582 2005
CNMI 63,112 35,216 2005 948,659,000 15,031 2005
Cook Islands 15,636 5,928 2001 207,257,175 13,255 2008
Fiji 843,888 298,974 2007 2,761,599,459 3,272 2007
French Polynesia 265,654 95,258 2007 5,640,452,000 21,232 2004
FSM 110,899 29,175 2000 245,336,000 2,212 2008
Guam 182,207 54,980 2002 3,700,000,000 20,307 2005
Kiribati 98,989 34,715 2005 133,929,336 1,353 2008

20 | I U C N O c e a n i a
Marshall Islands 54,065 10,141 1999 158,435,340 2,930 2008
Nauru 9,771 2,603 2006 21,475,715 2,198 2008
New Caledonia 250,612 80,685 2004 7,129,623,000 28,449 2004
Niue 1,514 755 2006 10,006,000 6,609 2003
Palau 20,397 9,777 2005 180,715,700 8,860 2008
Pitcairn Islands 50* n.a. n.a. n.a. n.a. n.a.
PNG 6,609,755 2,344,734 2000 7,982,845,016 1,208 2008
Samoa 182,578 53,928 2006 534,432,771 2,927 2008
Solomon Islands 535,007 57,472 1999 529,076,518 989 2008
Tokelau 1,167 375 2006 n.a. n.a. n.a.
Tonga 103,023 35,290 2006 278,230,159 2,701 2008
Tuvalu 11,093 3,237 2002 17,514,000 1,579 2002
Vanuatu 238,903 75,110 1999 507,428,884 2,124 2007
Wallis and Futuna 14,183 3,104 2003 187,500,000 13,221 2005
TOTAL 9,677,616 3,248,852 - 31,545,816,072 3,279 -
Source: GDP in current prices (Asian Development Bank 2009)& (SPC 2008); population & labour force (SPC 2009)
3. Methodology
Generally, standard measures used for reporting on economic activities include measures of
production, output GDP, value added, and employment (Kildow and McIlgorm 2010). In this study,
direct production values associated with the different economic sub-sectors are reported together
with the direct employment measures. This was done for all PICTs where consistent sets of
information were available. This study is mainly based on national and regional statistics and
secondary data from national governments, NGOs, and independent consultants. Global, regional, and
national databases were consulted for values on national statistics to ensure a consistent approach to
estimation. Additional information was obtained from peer-reviewed journal articles. Reported
economic value information from published literature is the main source of the estimates provided in
this report. Only a limited set of economic values could be aggregated across countries due to data
issues discussed below. In addition, the total economic values (TEV) associated with ecosystem
goods and services are reported separately to provide an ecosystem perspective. Nonetheless, the
caution should be be heeded that these two different sets of economic values – the gross value
product values associated with the ocean based sectors and the TEV estimates of ecosystems –
cannot be aggregated as they represent two different types of value estimates. The former is a gross
value estimate while the latter is a net value measure as described in the report.
Gross economic values
These are usually based on total production values generated from extractive activities, such as
commercial fishing, aquaculture, and coastal mining. In the case of subsistence fishing, gross value
products are also provided using market price of fish as a proxy measure for the economic value
associated with subsistence consumption. In the case of the tourism sector, a similar measure, but

21 | I U C N O c e a n i a
gross expenditure value, is reported as a proxy for the value. Gross value product (GVP) measures
are often used to explain the relative importance of an activity in the national economy, measured in
terms of gross domestic product (GDP). GDP is commonly measured in terms of the total market
value of all final goods and services produced in a country in a given year, equal to total consumption,
investment, and government spending, plus the value of exports minus the value of imports. It is
noted that GVP/ GDP measures normally do not include non-market benefits associated with the use
of the resources, nor do they reflect the real price of unsustainable uses. Nonetheless it is one
information set that is consistently available across sectors as well as between countries.
Net economic values
While gross economic values give an indication of the relative importance of these activities to the
national economy, they are not the relevant economic measures to use to answer questions such as:
What is the economic value (benefit) of protecting the Pacific Ocean? What is the economic value
(loss) from further degrading the coastal habitats, such as mangroves and coral reefs? What is
the economic value (benefit) of restoring a degraded ecosystem?
To answer such questions, the appropriate measure to use is the total (net) economic value (TEV) of
uses of, and change in the uses of goods and services supported by the Pacific Ocean. Such values are
derived from net benefits to consumers (consumer surplus) and producers (producer surplus) from
the flow of market and non-marketed goods and services derived from direct and indirect use and
non-uses. Marketed goods may include, for example, commercially harvested fish. On the other hand,
non-marketed goods may include the subsistence fishery and/or coastal protection. Direct values
may include, for example, commercial and subsistence fisheries, while indirect use values refer to the
enjoyment derived indirectly from for example seeing ocean-based nature programmes on television.
Economists define value in terms of utility. Utility is a metric of satisfaction that a person derives
from consuming a good or service or taking part in an activity. Utility is typically measured by a
person’s willingness to pay for the good, service or activity or their willingness to accept
compensation to surrender it. Such economic measures are normally derived using peoples’ revealed
preferences in a market place through surveys through avoided costs (Lal 1990; Costanza, Perez-
Maqueo et al. 2008), replacement cost measures (see Boyer and Polasky 2004) and productivity
measure (Lal 1990; see http://noep.mbari.org/nonmarket/methodologies.asp, accessed 6/6/2010).
It is important to note that the TEV of an ecosystem is a measure of the flow of the goods and services
and not the total stock value of the habitat (Godden 2010). This willingness to pay or to accept values
have rarely been determined in the Pacific. Estimation is theoretically possible for all goods and
services and is practically possible for several. Alternatively, existing market data can be used to as
proxies to determine the economic values of many of the goods and services either directly or
indirectly. Accordingly, available data has been collected where reported.

22 | I U C N O c e a n i a
Reported values were converted to constant 2008 values using CPI indices calculated from national
inflation rates of consumer prices (see ADB; https://sdbs.adb.org/sdbs/index.jsp, accessed
10/2009). National CPI values, rather than individual sector CPI values, were chosen because
national CPI values are commonly reported figures and displays highest level of homogeneity
between countries. Where relevant, values in foreign currency were converted to US$ after CPI
conversion using the ADB average-of-year exchange rates. Where CPI index for 2007- 2008 was not
available, 2007 figures are reported.
Data challenges
A few key challenges were faced in producing this overview. These included inconsistency in the
reported use of terms and value measures, confusion between gross and net economic value
measures, as well as irregularities in data coverage. National statistics in the PICT region are often
subject to the effects of limited human and financial capacity and major changes over time.
Contributing factors are, for example, high turn-over of staff, political instability, short-term import of
foreign labour force, and natural disasters. As a result national statistics are often incomplete,
outdated or inconsistent, which makes country comparisons challenging. Definitions of national
statistics also differ between countries, for example, on what comprises formal employment or how
certain economic sectors are treated, such as whether fisheries is treated on its own or included with
agriculture. Consistent time series data is largely lacking, making it difficult, if not impossible, to
extrapolate into the future and to develop scenarios according to different development and
management models.
4. Importance of Pacific Ocean-based activities to PICT
economies
PICTs have a long cultural and subsistence association with the sea. Their island economies are
particularly dependent on coastal and ocean resources that are used beyond the PICT region. The
Pacific Ocean and its coastal habitats such as coral reef and mangrove systems are the main life
support to Pacific Islanders providing food, income, and shelter.
Ocean based activities in the Pacific include subsistence and commercial inshore fishing, offshore
tuna fishing, tourism, coastal mining of aggregates and shipping (Figure 3).

23 | I U C N O c e a n i a
Figure 3. Ocean and coastal uses within the PICT region
Source: Paula Holland (pers comm.. July 2010)
Available empirical information suggests commercial and subsistence fisheries and tourism
generated a combined estimated GVP of more than US$ 3.46 billion annually to PICTs. This
contributes 11% to regional GDP.
Table III. GVP of ocean-based sub-sectors to PICTs
Ocean-based revenues Gross Value of Product
(GVP)* As % of regional GDP
International tourism expenditures US$ 2.27 billion 7.2%
Locally-based tuna fishing US$ 596.8 million 2.0%
Access fees US$ 78.5 million 0.2%
Mariculture US$ 145 million 0.5%
Commercial inshore fishery US$ 165.7 million 0.5%
Subsistence fishing US$ 200.4 million 0.6%
Coastal mining n.a. n.a.
Deep-sea mining n.a. n.a.
Shipping n.a. n.a.
Total US$ 3.46 billion 10.9% *in constant US$ at 2007 market prices; tourism in constant US$ at 2008 market prices. n.a. not available
There are also ocean-based activities, such as coastal mining, shipping, and potential deep-sea mining
for minerals and hydrocarbons (Figure 4) that affect the health of the ocean ecosystems posing
threats and economic costs to other ocean-health dependant activities if they are not rigorously
regulated and controlled Figure 4.
Figure 4. Ocean-based activities can be dependent or independent of ocean health
Aggregates
Subsistence and commercial fisheries
Coastal defences
Recreation, culture and tourism Shipping
Defence
Deep sea minerals
Benthos
Offshore tuna fisheries

24 | I U C N O c e a n i a
Source: Authors of this report.
4.1 Tourism & recreational activities
The region’s tropical, exotic appeal, its culture and its way of life, attract millions of tourists but
mostly visitors come because of the scenic beauty of the islands’ coastal and marine environment.
Spending time on the beach, boating, game fishing, scuba diving and snorkelling, and spotting marine
mega-fauna are some of the most popular reasons for the tourists showing the importance of an
undisturbed environment to the success of the tourism industry. Therefore, in this report tourism
revenues (or tourism expenditures in country) are used as a proxy to show economic benefits of
goods and services provided by the Pacific Ocean to the PICTs.
Economic contribution
Tourism is the biggest economic sector in the Pacific island region. It is also an important contributor
of foreign exchange receipts1 besides often being the most important export earner. A total of US$ 4.3
billion was made in international tourism receipts (Table IV).
1 Foreign exchange earnings or international tourism receipts is the money earned by a destination country from inbound tourism
resulting from expenditure made by visitors from abroad, on lodging, food and drinks, fuel, transport in the country, entertainment,
shopping, etc.

Table IV. Economic scale and contribution of the tourism industry to PICT (in 2008 constant prices)
Country or territory Visitor arrivals per head of population
per capita expenditure
[US$]
Total expenditure
[US$]
as % GDP contribution
Int. tourism receipts [US$]
as % GDP contribution
Industry employment
as % of total labour force
American Samoa 30,268 0.46 n.a. n.a. n.a. n.a. n.a. n.a. n.a.
CNMI 385,000 6.10 841 400,000,000 n.a. 771,819,420 69% n.a. n.a.
Cook Islands 94,152 6.02 1,062 88,509,239 44.1% 105,133,191 50.0% 3,500 59.0%
Fiji 582,602 0.69 965 489,467,114 18.0% 718,091,539 27.7% 33,000 8.6%
French Polynesia 196,496 0.74 3,272 693,297,835 8.9% 933,770,760 13.9% 15,000 15.7%
FSM 19,136 0.17 339 6,484,710 2.6% 17,548,387 7.2% n.a. n.a.
Guam 1,225,000* 6.72 n.a. n.a. n.a. 1,131,427,550* n.a. 5,140 9.3%
Kiribati 3,871 0.04 533 1,587,294 1.3% 3,682,850 4.8% 600 2.3%
Marshall Islands 6,959 0.13 475 1,710,000 2.2% 8,481,422 4.8% n.a. n.a.
Nauru n.a. n.a. n.a. n.a. n.a. n.a. n.a. n.a. n.a.
New Caledonia 103,672 0.41 2,303 229,200,000 6.9% 258,000,000 3.6% 3,640 4.5%
Niue 4750 3.14 600 1,560,126** 13.0% 1,190,579 10.0% 80 10.6%
Palau 83,114 4.07 2,612 2,511,076 1.5% 104,093,449 57.5% n.a. n.a.
Pitcairn Islands n.a. n.a. n.a. n.a. n.a. n.a. n.a. n.a. n.a.
PNG 114,182 0.02 2,651 156,510,714** 3.2% 3,353,125 0.1% 104,000 4.4%
Samoa 121,578 0.67 729 71,405,600 14.9% 106,998,109 20.2% 10,755 20.3%
Solomon Islands 16,264 0.03 2,981 17,914,646** 4.3% 10,105,718 2.2% 3,000 1.70%
Tokelau n.a. n.a. n.a. n.a. n.a. n.a. n.a. n.a. n.a.
Tonga 49,400 0.48 739 30,404,214** 11.0% 16,435,152 5.8% 1,300 3.9%
Tuvalu 1,130 0.10 476 528,528 3.3% n.a. n.a. 40 1.2%
Vanuatu 90,675 0.38 1,373 83,200,710 22.4% 118,653,482 26.2% 8,100 13.20%
Wallis and Futuna n.a. n.a. n.a. n.a. n.a. n.a. n.a. n.a. n.a.
TOTAL 3,128,249 2,274,291,807 4,308,784,734 188,155
Regional Average 0.3/1*** 1,214 7.2% 13.6% 5.8%
Source: (Milne 2005; UNWTO 2005; UNWTO 2006; World Resource Institute 2007), National Statistics. Values in italics are in most recent current market prices.
*Guam statistics include military personnel arrivals and their expenditures.
**Higher values of international tourism receipts than tourist expenditures could be due to the use of different definitions and methodology. n.a. not available

26 | I U C N O c e a n i a
Half of the value stems from total tourism expenditure in-country which amounted to almost US$ 2.3
billion according to latest statistics (see references listed under Table IV). Total tourist expenditure is
highest in French Polynesia and Fiji, the percent contribution to national GDP is however highest in
the Cook Islands and the Commonwealth of Northern Mariana Islands (CNMI) with 44% and 42%
respectively (Figure 5).
The average per capita tourism expenditure is highest in French Polynesia and New Caledonia as well
as in PNG and the Solomon Islands. While the French territories are known for up-market tourism,
high visitor expenditures in PNG and the Solomon Islands are possibly due to an underdeveloped
tourism industry and very high costs in transport/carriers.
The economic contribution of visitors to national value statistics are often incomplete due to the lack
of developed satellite tourism accounting systems, different survey methodology, inconsistent
approaches, and differences in definitions across countries. The values therefore need to be
interpreted cautiously.
Figure 5. International tourism expenditure
Contribution to national GDP [%]
0 10 20 30 40 50
Int.
to
uri
sm
exp
en
ditu
res [
mill
ion U
S$
]
0
10
20
30
100
200
300
400
500
600
700
CNMI
Cook Is
Fiji
French Pol
New Cal
PNG
Samoa
Solomon Is
Tonga
Vanuatu
FSM
NiuePalau
Source: Milne 2005, National statistics
27 | I U C N O c e a n i a
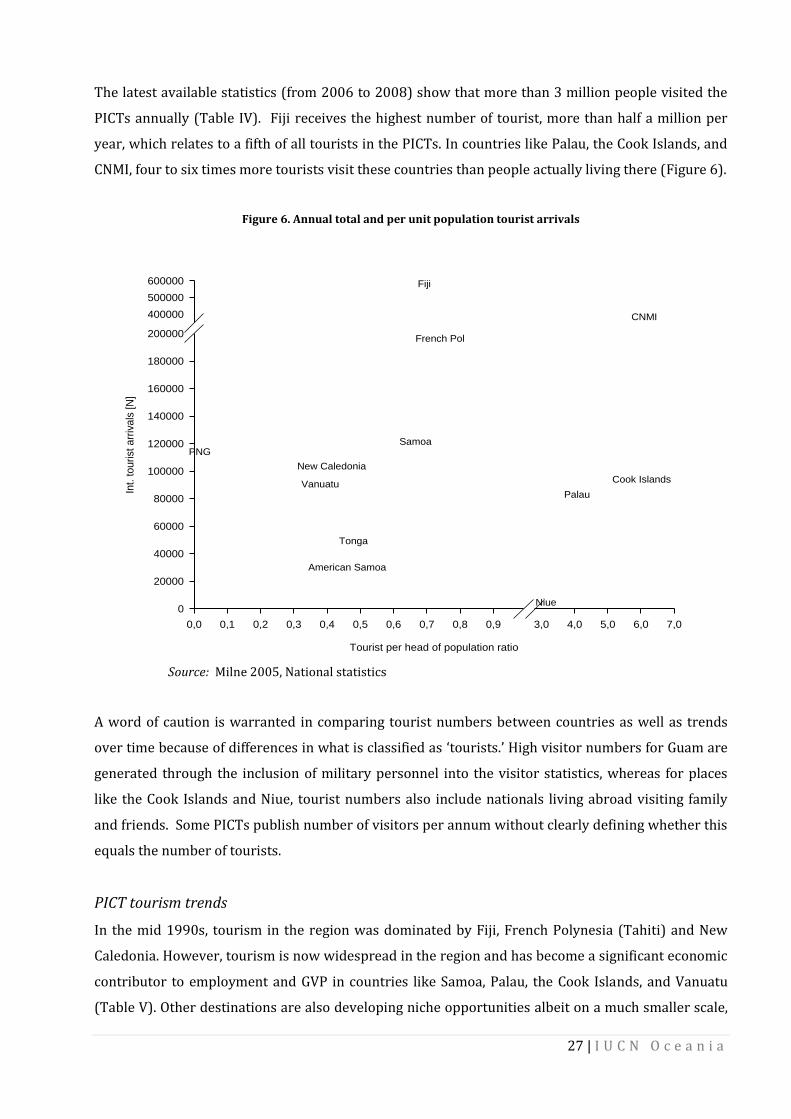
The latest available statistics (from 2006 to 2008) show that more than 3 million people visited the
PICTs annually (Table IV). Fiji receives the highest number of tourist, more than half a million per
year, which relates to a fifth of all tourists in the PICTs. In countries like Palau, the Cook Islands, and
CNMI, four to six times more tourists visit these countries than people actually living there (Figure 6).
Figure 6. Annual total and per unit population tourist arrivals
Tourist per head of population ratio
0,0 0,1 0,2 0,3 0,4 0,5 0,6 0,7 0,8 0,9 3,0 4,0 5,0 6,0 7,0
Int.
touri
st
arr
ivals
[N
]
0
20000
40000
60000
80000
100000
120000
140000
160000
180000
200000
400000
500000
600000
American Samoa
CNMI
Cook Islands
Fiji
French Pol
New Caledonia
Niue
Palau
PNGSamoa
Tonga
Vanuatu
Source: Milne 2005, National statistics
A word of caution is warranted in comparing tourist numbers between countries as well as trends
over time because of differences in what is classified as ‘tourists.’ High visitor numbers for Guam are
generated through the inclusion of military personnel into the visitor statistics, whereas for places
like the Cook Islands and Niue, tourist numbers also include nationals living abroad visiting family
and friends. Some PICTs publish number of visitors per annum without clearly defining whether this
equals the number of tourists.
PICT tourism trends
In the mid 1990s, tourism in the region was dominated by Fiji, French Polynesia (Tahiti) and New
Caledonia. However, tourism is now widespread in the region and has become a significant economic
contributor to employment and GVP in countries like Samoa, Palau, the Cook Islands, and Vanuatu
(Table V). Other destinations are also developing niche opportunities albeit on a much smaller scale,

28 | I U C N O c e a n i a
such as Niue, where visitor arrivals increased from 1,000 to 4,750 over 18 years. Thjs change,
however, needs to be treated with caution because of uncertainties in the data and change in the
definition of what comprises visitor arrivals. Tourism in SPTO member countries has more than
doubled over the time span with an average increase in visitor arrivals of 133% (for additional visitor
arrival statistics refer to Appendix I). However, one needs to be careful to conclude from an increase
in tourist numbers to an increase in GVP of the tourism sector. For example, Fiji has seen an increase
between 2003 and 2008 in the total numbers of tourist arrivals of 26 %, while the total earnings have
decreased from FJ$ 819 million to FJ$ 651 million (US$ 514 million to US$ 408) in 2008 market
prices which corresponds to a 20% loss (Fiji Ministry of Finance and Planning 2008). This can be
explained through the popularity of the backpacking industry which has introduced tourists with
lower expenditure patterns.
Table V. Visitor arrivals to SPTO member countries between 1990 and 2008
PICT 1990 1995 2000 2005 2008 % change between
1990 and 2008
Cook Islands 34,000 48,000 73,000 88,405 94,184 177
Fiji 279,000 318,000 294,000 549,911 582,602 109
French Polynesia 132,000 172,000 252,000 208,067 196,496 49
Kiribati 3,000 4,000 5,000 4,137 3,871 29
New Caledonia 87,000 86,000 110,000 100,412 103,672 19
Niue 1,000 2,000 2,000 2,793 4,750 375
PNG 41,000 42,000 58,000 69,251 114,182 178
Samoa 48,000 68,000 88,000 101,807 121,578 153
Solomon Islands 9,000 12,000 n.a. 12,533 16,264 81
Tonga 21,000 29,000 35,000 41,862 49,400 135
Vanuatu 35,000 44,000 58,000 62,082 90,654 159
TOTAL 691.990 826.995 975.000 1.241.260 1.377.653 133% average
Source: Milne 2005; SPTO (South Pacific Tourism Organization)
Despite positive trends in the tourism sector, the industry is highly sensitive to external shocks and
has suffered from the recent financial crisis and increases in international fuel prices; particularly in
the North Pacific US states and territories of Hawaii, Guam, and the Northern Marianas (Saipan).
Visitors to the South Pacific nonetheless continued to grow at a moderate 3% growth rate in 2008,
probably due to an earlier recovery of Australia from the financial crisis which is the main source
market for South Pacific tourism (Allcock 2006).
Marine-based eco-tourism is becoming increasingly popular in the region and plays an important role
in providing alternative livelihood options particularly for coastal communities. In Fiji, the Waitabu
conservation area, a village-run snorkelling operation in a locally managed marine reserve, generated

29 | I U C N O c e a n i a
FJ$40,000 over a period of 6 years for the community’s 20 households (Sykes and Reddy 2007).
Although growing in popularity, these micro-operations still make up a minute fraction of the sector.
Whale and dolphin watching-based ecotourism has become a popular tourist attraction in the region
and commercial whale watching operations are found in 14 countries, especially in those areas where
breeding grounds exist, such as the Cook Islands and Tonga. In 2005, more than 110,000 visitors took
part in tourism operations to watch whales and dolphins, an almost ten-fold increase from seven
years earlier turning cetacean watching into a multi-million dollar industry (O'Connor 2008).
Tourism benefits could be higher if leakage of profits out of the country were reduced; many of the
particularly large tourist ventures are foreign owned and operated (Allcock 2006). Furthermore, high
leakage occurs through the high import content of tourists’ consumption bundle as a result of a
narrow production base in most PICTs and preferences. Benefits could also be better sustained if
negative impacts on cultural and heritage values of communities and the fragile natural
environments could be kept to a minimum, and other negative effects are contained, such as
increased waste, as discussed later in the report.
Employment
Tourism is a highly labour-intensive industry with formal employment ranging from 36,000 to
213,000 people employed (Milne 2005). The wide range reflects the uncertainty of these statistics.
Additionally, it is not known whether this reflects full time, part time of or both kinds of employment.
The highest percent of formal employment in tourism is in the Cook Islands with an estimated 60%,
followed by Samoa and French Polynesia with 20% and 16% respectively. The tourism industry also
provides many flow-on benefits for other sectors in terms of revenue and employment (see Table VI)
with GDP contribution and employment being roughly three times higher for the entire economy
than just for the tourism industry.
Table VI. Industry and economy employment and economic contribution
PICT Industry
employment as % of total labour force
Economy employment
as % of total labour
force
Industry GDP
as % GDP contribution
Economy GDP
as % GDP contribution
Fiji 33,000 8.6% 91,000 23.5% 317,000,000 8.9% 911,900,000 25.6%
Kiribati 600 2.3% 2,300 8.3% 2,000,000 2.8% 7,000,000 10.1%
Solomon Is 3,000 1.7% 11,000 6.1% 14,000,000 2.1% 48,700,000 7.4%
Tonga 1,300 3.9% 3,500 10.5% 14,000,000 4.4% 39,100,000 12.2%
Vanuatu 8,100 13.2% 21,000 33.6% 81,000,000 14.3% 212,800,000 37.5%
Source: (WTTC 2009a; 2009b; 2009c; 2009d; 2009e)
30 | I U C N O c e a n i a
The tourism sector has the potential for large increases in employment in many Pacific island
countries, as it has proven to be internationally competitive. A big part of the projected 20% increase
in Fiji’s formal employment sector between 2004 and 2015 is attributable to the tourism industry
(UNESCAP 2008). Again, statistics vary significantly between sources since national statistics define
employment differently. Also, many jobs are part-time or seasonal. Statistics on total industry
employment in Kiribati range from 1% to 23% and from 4% to 21 % in Vanuatu for the year 2005
(Milne 2005).
4.2 Fishing sector
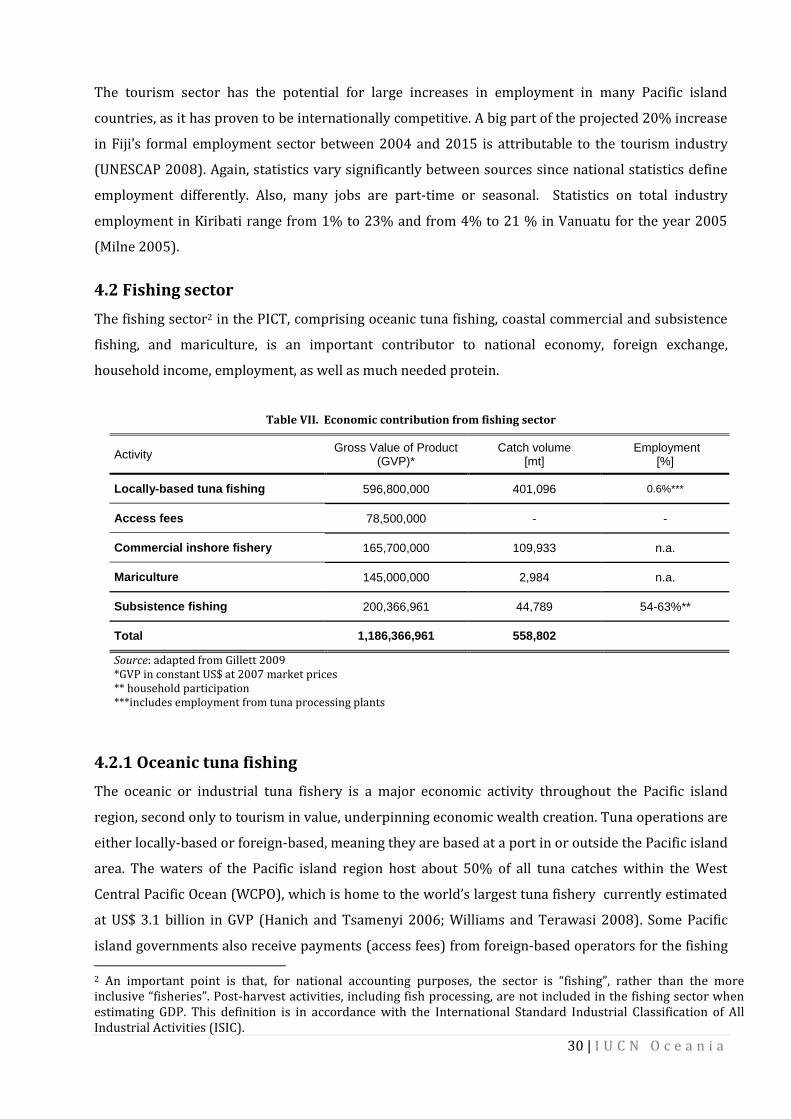
The fishing sector2 in the PICT, comprising oceanic tuna fishing, coastal commercial and subsistence
fishing, and mariculture, is an important contributor to national economy, foreign exchange,
household income, employment, as well as much needed protein.
Table VII. Economic contribution from fishing sector
Activity Gross Value of Product
(GVP)* Catch volume
[mt] Employment
[%]
Locally-based tuna fishing 596,800,000 401,096 0.6%***
Access fees 78,500,000 - -
Commercial inshore fishery 165,700,000 109,933 n.a.
Mariculture 145,000,000 2,984 n.a.
Subsistence fishing 200,366,961 44,789 54-63%**
Total 1,186,366,961 558,802
Source: adapted from Gillett 2009 *GVP in constant US$ at 2007 market prices ** household participation ***includes employment from tuna processing plants
4.2.1 Oceanic tuna fishing
The oceanic or industrial tuna fishery is a major economic activity throughout the Pacific island
region, second only to tourism in value, underpinning economic wealth creation. Tuna operations are
either locally-based or foreign-based, meaning they are based at a port in or outside the Pacific island
area. The waters of the Pacific island region host about 50% of all tuna catches within the West
Central Pacific Ocean (WCPO), which is home to the world’s largest tuna fishery currently estimated
at US$ 3.1 billion in GVP (Hanich and Tsamenyi 2006; Williams and Terawasi 2008). Some Pacific
island governments also receive payments (access fees) from foreign-based operators for the fishing
2 An important point is that, for national accounting purposes, the sector is “fishing”, rather than the more inclusive “fisheries”. Post-harvest activities, including fish processing, are not included in the fishing sector when estimating GDP. This definition is in accordance with the International Standard Industrial Classification of All Industrial Activities (ISIC).

31 | I U C N O c e a n i a
rights to their EEZs. The only other economically noteworthy industrial fishery is shrimp trawling in
PNG which reported an export of 600 mt worth US$ 4 million in 2004 (Gillett 2007).
GVP and catch volumes
Local and foreign-based operators generated tuna yields worth US$ 1.68 billion in GVP in 2007,
catching 1.27 million mt of Skipjack, Yellowfin tuna, Bigeye, and Bluefin tuna within PICT waters
(Table VIII). This is an overall increase in catch levels of 210% from 1999 when the catch was
reported to be 600,000 mt and valued at US$ 657 million (Gillett and Lightfoot 2001). Most of the
tuna is caught within the EEZs of PNG, Kiribati, the Federated States of Micronesia, the Solomon
Islands, the Marshall Islands, and Nauru.
Foreign nations’ distant water fishing vessels (DWFV) obtain the highest volume of tuna from the
Pacific EEZ, catching almost two times more than what is caught by locally-based fleet. The most
prominent foreign fishing nations in number of DWFV are Japan, Taipei, Korea, China, the United
States and the Philippines. In 2007, these nations and others caught 865.000 mt worth more than
US$1 billion in Pacific island EEZs, which corresponds to 3.4% of regional GDP. In 2000, 919 vessels
registered within the FFA register were foreign-flagged and which had obtained fishing rights to
Pacific EEZ(s) by paying access fees to the respective governments. Tuna is therefore a commonly
used economic good from which many Pacific Rim countries profit.
In order to increase their share of the value of tuna caught from their national waters, several
countries have introduced other forms of licensing, including access arrangements to favour PIC
involvement and onshore investment into the tuna fishing such as in PNG, the Cook Islands, and Fiji.
This is one of the factors which lead to an increase of 341% in catch volume by locally-based fleet
over the last ten years (FFA 2009). This also coincided with a general increase of catches within the
WCPO region of almost 150%.
The locally-based industrial tuna fleet, comprising 327 active vessels from 13 out of 22 PICTs, landed
more than 400,000 mt in 2007, or about a third of the total tuna harvested from the Pacific EEZ,
valued at almost US$ 600 million. This contributes an average of 2% to the region’s GDP (Gillett
2009)3. The biggest economic impact of the locally-based tuna fishing is in the Marshall Islands and
Niue where the GVP make up more than half and a fifth respectively of total national GDP.
3 The Forum Fisheries Agency Forum Fisheries Agency (2009). Economic Outlook and Prospects for the Tuna Fisheries. FFA Ministerial forum fisheries commitee fifth meeting. Alofi, Niue. gives a slightly higher production estimate of 467,000 mt.

32 | I U C N O c e a n i a
However, not all locally-based enterprises have provided a stable or additional contribution to the
national economies. Many locally-based fleet have displayed a boom-and-bust-cycle, as happened in
the Cook Islands (Barclay and Cartright 2007). Further, many of the locally-based vessels are still
foreign owned and operated, though data to differentiate these from the nationally reported statistics
are difficult to obtain.
Table VIII. Offshore tuna fishing production and catch values in 2007
Production [mt] Value [US$] As % of GDP
PICT Locally-Based
Foreign-Based
Locally-Based Foreign-Based Locally-Based
American Samoa 6,632 0 14,135,083 0 2.5%
CNMI 0 0 0 0 0.0%
Cook Islands 3,939 0 5,772,059 0 2.7%
Fiji 13,744 492 29,293,750 527,500 1.1%
French Polynesia 6,308 0 28,247,299 0 0.5%
FSM 16,222 143,315 23,908,377 177,195,590 10.1%
Guam 0 0 0 0 0.0%
Kiribati 0 163,215 0 197,051,374 0.0%
Marshall Islands 63,569 12,727 81,210,390 19,572,712 54.3%
Nauru 0 69,236 0 80,001,361 0.0%
New Caledonia 2,122 0 8,563,218 0 0.1%
Niue 640 0 1,844,118 0 18.4%
Palau 3,030 1,464 13,779,656 4,947,496 8.4%
Pitcairn Islands 0 0 0 0 0.0%
PNG 256,397 327,471 345,976,228 386,361,944 5.5%
Samoa 3,755 25 8,362,836 49,300 1.5%
Solomon Islands 23,619 98,023 32,662,077 153,548,868 7.6%
Tokelau 0 318 0 397,415 0.0%
Tonga 1,119 0 3,081,498 0 1.2%
Tuvalu 0 35,541 0 40,924,370* 0.0%
Vanuatu 0 12,858 0 26,003,657 0.0%
Wallis and Futuna 0 0 0 0 0.0%
Total 401,096 864,685 596,836,589 1,086,581,587 1.9%
Source: adapted from Gillett 2009; *GDP contribution calculated from 2007 GDP values (ADB, SPC), Tuvalu in 2002 current market price
Net economic benefits from access fees
Access fees represent a large part of the direct economic benefits derived by Pacific countries from
foreign fishing vessels fishing in their EEZs. Other direct gross benefits include the revenue earned
from the supply of fuel, food, maintenance, and other services expenditure etc, as well as associated
employment.

33 | I U C N O c e a n i a
The access fees paid to the 15 PICTs by foreign-based operators amounted to a total of US$ 78.5
million in 2007 (US$ 85 million in 2008$) which on average is about 4.7% aggregate regional GVP of
tuna caught in the Pacific EEZs. The importance of access fees to national economies though show a
large variation between countries, ranging from 0.01% GDP in Fiji to almost 24% of the national GDP
in Nauru (Table IX).
Access fees play an important role in the government’s ability to provide its services to the country,
as some governments in the region rely on access fees as an important income source for government
expenditures. In Kiribati, for example, access fees contribute more than 40% to the national revenue
(Table IX). In nominal terms, total access fees have not changed significantly since 1999, when they
amounted to US$60–$70 million (US$ 81 to 96 million in 2008$) (Gillett and Lightfoot 2001; Gillett
2009). The Kiribati Ministry of Finance has received US$ 25 million to US$ 27 million annually
between 2001 and 2007 in access fees and other charges. Such tuna based access fees in countries
such as Kiribati and Tuvalu exceed all other export earnings.
Table IX. Access fees received in PICTs in 2007
PICT Access fees [US$] As % of GDP As % of government
revenue
American Samoa 0 - -
CNMI 0 - -
Cook Islands 262,000 0.1% 0.4%
Fiji 256,985 0.01% 0.03%
French Polynesia 0 - -
FSM 14,757,221 6.3% 10.2%
Guam 0 - -
Kiribati 21,361,214 16.8% 41.7%
Marshall Islands 1,953,644 1.3% 5.4%
Nauru 5,147,899 24.3%* 17.2%
New Caledonia 0 - -
Niue 263,983 2.6%* 2.3%
Palau 1,121,281 0.7% 3.2%
Pitcairn Islands 0 - -
PNG 14,966,216 0.2% 0.6%
Samoa 256,985 0.05% 0.15%
Solomon Islands 11,764,705 2.7% 4.8%
Tokelau 1,478,676 n.a. 11.2%
Tonga 132,206 0.1% 0.2%
Tuvalu 3,445,378 19.7%* 11.3%
Vanuatu 1,359,700 0.3% 6%
Wallis and Futuna 0 - -
Total 78,528,093 - -
Source: adapted from Gillett 2009; in 2007 market prices; GDP contribution calculated
34 | I U C N O c e a n i a
*The percent contribution of access fees to GDP should be lower than the percent contribution to government revenue. This is an anomaly that needs to be explores further.
Employment in the fisheries sector4
Tuna fishing is an important employment generator in the islands though most people are employed
in post-harvest activities. About 1,170 Pacific islanders were reported to be formally employed on
tuna vessels as well as another 11,000 job in tuna processing plants in 2008 within the Forum Fishing
Agency (FFA) region (Gillett 2008). In addition, approximately 6,300 people worked in shore-based
tuna processing facilities in the French territories and American Samoa. Of these, 5000 people
worked at the Pago Pago tuna cannery in American Samoa, which represents 27% of formal
employment of the territory. Thus more than 18,500 people region-wide are currently estimated to
find direct employment in the tuna industry (Forum Fisheries Agency 2009). Additionally, wages
earned by Pacific seafarers on foreign ships often exceed local salaries. In Kiribati, remittances from
sea farers support many households and contribute to the national economy. The presented statistics
have to be interpreted cautiously due to a range of issues; for example sources of information on
fisheries employment range from informal estimates to structured surveys. Definitions differ
between countries and studies on what is categorised as employment, inconsistency is observed
across countries on how to deal with fish processing and data quality issues are common or data
credibility is hard to determine.
Other flow-on benefits
There are other flow-on benefits of the foreign and locally-based tuna fleet operating out in the
region. These include the multiplier effects of other dependent activities that supply, for example,
other inputs such as fuel, and food, and port charges. The economic values of such contributions are
though not known. Other revenues arise through flow-on benefits such as providing services etc to
the fleet, but also from post-harvest activities such as tuna processing. In American Samoa, literally
100% of all exports comprise fishing products, canned tuna, pet food, and fish meal from the cannery
in Pago Pago. The export value of these products was about US$ 439 million in 2007 which was
almost 80% of national GDP.
4.2.2 Coastal fishing
Coastal waters underpin valuable commercial and subsistence fishing with an estimated annual GVP
of US$ 366 million, and provide employment, household income, and food for the Pacific island
people. With the emerging mariculture businesses this number increases to over half a billion US$
annually (Gillett 2009).
4 The fisheries sector is defined here to also include post-harvest activities such as processing of tuna.

35 | I U C N O c e a n i a
4.2.2.1 Coastal fishing and mariculture
Coastal commercial fishing is carried out in lagoon, reef, deep-slope or shallow sea areas. It also
includes fish caught from small vessels in the open sea adjacent to islands. Most of these operations
are relatively small scale. Coastal fishing contributes significantly to local economies, which in some
coral atoll nations and territories is the most important economic activity and source of employment
for communities and households. Mariculture of some marine species is emerging as a new industry,
which currently contributes significantly towards export earnings; mariculture is though practices in
a limited number of countries. Ornamental finfish, invertebrates, coral, and live rock are also being
harvested for the marine aquarium trade. A small proportion of reef fish is also traded in the life reef
food fish trade.
Coastal fishing
Coastal commercial fishing has produced a total of 44,700 mt in the region with a value of US$ 165.8
million in 2007, contributing on average 0.5% to regional GDP (see

36 | I U C N O c e a n i a
Table X). There is though a large variation between countries. On the one end of the spectrum are the
Tokelauans, who do not engage in commercial coastal fishing and the population relies on 100%
subsistence activities. On the other hand, the contribution of coastal fishing to national GDP is highest
in Kiribati with 15%. In terms of catch level and value it is highest in Fiji with an estimated 9,500 mt
annually.

37 | I U C N O c e a n i a
Table X. Coastal commercial fishing production & mariculture
Production
Value [US$] As % to national GDP
PICT Coastal
commercial [mt]
Mariculture [kg]
Mariculture [pieces]
Farmed species
Coastal commercial
Mariculture Coastal
commercial Mariculture
American Samoa
35 0 0 - 166,000 0 0.0% 0.0%
CNMI 231 10,909 0 Shrimps 950,000 192,000 0.1% 0.0%
Cook Islands 133 1,320 189,783 Black pearl &
giant clam 1,029,412 2,212,421 0.5% 1.0%
Fiji 9,500 80,000 48,100
Black pearls, brackish
water prawns, seaweed
33,750,000 936,070 1.2% 0.0%
French Polynesia
4,002 54,500 0 Black pearls,
penaeid shrimp
23,004,598 123,708,046 0.4% 2.3%
FSM 2,800 0 16,000 Giant clams, black pearls
7,560,000 80,000 3.2% 0.0%
Guam 44 12,000 0 Shrimps
(from ponds) 195,000 345,000 0.0% 0.0%
Kiribati 7,000 139,000 100 Black pearls,
seaweed 18,487,395 66,063 14.5% 0.1%
Marshall Islands 950 0 25,000 Giant clams, black pearls
2,900,000 130,000 1.9% 0.1%
Nauru 200 8 0 - 840,336 0 4.0% 0.0%
New Caledonia 1,350 1,931 0
Penaeid shrimps, oysters,
freshwater crustaceans*
8,689,655 16,594,253 0.1% 0.2%
Niue 10 0 0 -- 58,824 0 0.6% 0.0%
Palau 865 0 3,100 Giant clams 2,843,000 45,600 1.7% 0.0%
Pitcairn Islands 5 0 0 - 37,500 0 n.a. 0.0%
PNG 5,700 5,000 0 Prawns 27,027,027 59,015 0.4% 0.0%
Samoa 4,129 0 0 - 19,557,592 0 3.6% 0.0%
Solomon Islands
3,250 165,000 8,202
Coral, seaweed, post larval
capture
3,307,190 40,654 0.8% 0.0%
Tokelau 0 0 0 0 0 0.0% 0.0%
Tonga 3,700 0 12,334 Giant clams, black pearls
11,287,129 18,317 4.4% 0.0%
Tuvalu 226 0 0 - 616,526 0 3.5% 0.0%
Vanuatu 538 18,000 2,589 Giant clams, coral, marine
shrimp 2,176,923 746,124 0.4% 0.1%
Wallis & Futuna 121 0 0 - 1,206,897 0 0.0% 0.0%
Total 44,789 487,668 305,208 - 165,691,004 145,173,563 0.5% 0.2%
Regional mean 2,036 - - - 7,531,409 6,598,798 - -
Source: adapted from Gillett 2009
The degree of commercialisation varies across countries. Many fishermen are largely engaged in
artisanal fishing, going out on day trips without a strong organisation of fishing activities. Increasing
western influence and the introduction of the cash economy has led to increasing demand for money.

38 | I U C N O c e a n i a
Access to modern fishing equipment and motorised fibreglass boats have greatly increased catches
and have led to local overfishing (e.g. Newton et al 2007). In some regions, a bigger proportion of the
catch is already being sold rather than consumed locally. The transition is more pronounced in urban
areas close to market outlets whereas in rural areas non-market based subsistence fishing prevails
(Kronen, Sauni et al. 2006).
Surveys on the participation in the commercial small scale fishing aren’t always readily available. In
Fiji, an estimated 2,137 people work as full time fishermen (Hand, Davis et al. 2005). This number is
most likely conservative because often fish is sold at roadside markets from unlicensed fisherman. An
additional 3,000 people work as suppliers, processors, vendors and in the Fishing Department. In
other countries such as Kiribati, FSM and Tuvalu numbers do not exceed a few hundred (refer to
Gillett 2009).
Mariculture
Mariculture has developed over recent years in some PICTs and is now estimated to be valued at
about US$ 145 million annually. Several invertebrates such as the pearl oyster, penaeid shrimps,
prawns, giant clams, seaweed and coral have been cultured (see

39 | I U C N O c e a n i a
Table X). In the mid 1990s, pearl oyster culture in French Polynesia and the Cook Islands made up
98% of all mariculture operations (Adams, Bell et al. 2001). Particularly the farming of the blacklip
pearl oyster (Pinctada margaritifera) for black pearl
production in French Polynesia has developed into
one of the major export earners making up 97% of
all exports in the country. Despite a considerable
decline in value from a record U$ 252 million in
2000 to US$ 123.7 million in 2007, French Polynesia
is still the biggest producer world-wide and 7,000
people find direct and indirect employment (Berthe
and Prou 2007; Gillett 2009). Operations of black
pearl culturing are also carried out in Fiji and the
Cook Islands. However, it should be noted that
mariculture is the most subsidised fisheries sub-
sector with the result that apparent benefits can
actually turn into a liability. Additionally, in 2007 95.5% of the GVP from mariculture were generated
in the two French territories which are much more developed than the rest of the PICT. It is therefore
questionable whether mariculture will be a viable economic activity for most PICTs.
Aquarium live fish and non-fish trade
The marine aquarium or ornamental trade based on ornamental finfish, coral and other sea products,
such as live rock, had its modest start in the 1970s but has expanded to at least 12 PICTs with 40
companies (see Box 1) supplying to markets mainly in Asia, Europe and the United States (Kinch and
Teitelbaum 2008). The estimated wholesale value from these countries ranges between US$ 40-60
million per year. The market share for ornamental fish in the PICT region lies around 10-15% of the
global trade and is valued at US$ 30 million, while comparative numbers for live rock5 are 80% and
US$ 18 million (pers. comm. Being Yeeting, Senior Fishing Scientist at SPC). This generates annual
revenues for involved PICT in the range of US$ 30-40 million. It is further estimated that the
extraction of wild harvested organisms provides employment for about 1000 people, often
community members, and 1,472 households (Kinch and Teitelbaum 2008). In Fiji, the biggest
supplier from the region, aquarium trade operators employed about 600 mainly community
members (Lindsay, Ledua et al. 2004) who derived a gross income of FJ$1.4 million or US$ 828,000
(Lal and Cerelala 2005). However, the industry has been criticised for unsustainable behaviour and
5 Mariculture is the production from the farming of marine organisms including fish, molluscs, crustaceans, and marine plants. Farming implies some sort of intervention in the rearing process to enhance production.
Box 1. Marine aquarium trade in PICTs
PICT Nr of
households involved
Nr of companies
Cook Islands 10 1
Fiji 600 5
French Polynesia 10 3
FSM 20 1
Kiribati 200 12
Marshall Islands 50 5
New Caledonia 2 2
Palau 30 1
PNG 50 1
Solomon Islands 250 2
Tonga 150 4
Vanuatu 100 3
12 1,472 40
Source: adapted from (Kinch and Teitelbaum 2008)

40 | I U C N O c e a n i a
reef destruction (Yeeting and Pakoa 2005). Furthermore, management issues arise partially due to a
lack in scientific data on the status of stocks.
Some companies have ventured into the culturing of ornamental species of coral and live rock. Giant
clams are exclusively cultured due to a CITES ban in commercial trading of live harvested pieces;
some species of hard corals are also banned under CITES6. Culture of live coral and live rock has also
been promoted as a substitute for coral harvested from the wild, because of concerns about the
sustainability of the wild fishing. Two financial viability studies, carried out in Fiji and the Solomon
Islands (Lal and Cerelala 2005; Lal and Kinch 2005), though suggest that only at certain production
levels are mariculture based live coral and live rock operations more profitable than those based on
wild fishing, due to high transportation costs. Additionally, the trade is sensitive to external shocks
which are mirrored in demand. For a regional review on financial viability of the ornamental trade
refer to (Lindsay, Ledua et al. 2004).
6 CITES Appendix II, refer to www.cites.org

41 | I U C N O c e a n i a
4.2.2.2 Coastal subsistence fishing
Coastal or inshore fishing for home consumption plays a vital role in Pacific islanders’ lifestyles and
provides food security throughout the PICT (Bell, Kronen et al. 2009). Typically, 10 to 20 times more
people fish for subsistence than for commercial purposes despite increased commercialisation of
coastal fishing supporting mainly urban dwellers. Marine resources are one of the most vital sources
of dietary protein with the average annual per capita
consumption of 50 kg reef fish (Box 2) being significantly higher
than the global average. This is particularly the case in countries
with limited possibilities for agriculture, particularly atolls and
low lying island states where land is limited and communities
rely on the coastal waters for food supply. It has to be
mentioned however, that the values presented in Box 2 are
conservative and have been generated through household
income and expenditure surveys (HIES) which are suspected to
underestimate fish consumption in the Pacific (Gillett 2009).
Gillett and Lightfoot (2001) for example present a much higher
range of 72-207 kg annual per capita consumption for Kiribati.
Values of subsistence catch are often not
readily available for an entire nation but
are usually based on localised socio-
economic case studies. Again, HIES have
provided some useful estimates of
subsistence catches which are however
believed to be lower than actual catches.
Gillett (2009) has compiled those values
together with re-estimations of
socioeconomic surveys recently
undertaken by Secretariat to the Pacific
Community (SPC) under the PROCFISH
project (www.spc.int). In 2007, total
estimates of subsistence catch levels
Box 2. Annual per capita fish
consumption in PICT
Tuvalu 110.7 kg
Samoa 87.4 kg
Niue 79.3 kg
French Polynesia 70.3 kg
FSM 69.3 kg
Kiribati 62.2 kg
Nauru 55.8 kg
Cook Islands 34.9 kg
New Caledonia 33.4 kg
Palau 33.4 kg
Solomon Islands 33.0 kg
Fiji 20.7 kg
Tonga 20.3 kg
Vanuatu 20.3 kg
PNG 13.0 kg
Average 50 kg
Source: adapted from
(Bell, Kronen et al. 2009)
Source: adapted from Gillett 2009
Box 3. Subsistence contribution of total coastal fishing
production in %

42 | I U C N O c e a n i a
were 110,000 mt valued at US$ 200.4 million using a shadow value7. This contributes 0.6% to
regional GDP. Not surprisingly, PNG and Fiji, with large populations, produced the highest amount of
subsistence fishery. On the other hand, the greatest importance of subsistence fishing lies in coral
atoll island nations, such as in Tokelau and Kiribati. Kiribati’s subsistence catches are estimated to be
worth US$ 28.6 million which would correspond to 22.5% of national GDP. In 15 PICTs, coastal
subsistence catch is still greater than coastal commercial fishing (Box 3). The values range from
100% in Tokelau to 35% in Tonga (
Table XI) with an average of 70% retained for home consumption. In most PICTs a large proportion
of subsistence fish is caught by women using nets to fish from the beach or to glean for invertebrates
(Vunisea 1997) and thus providing food security in their communities.
Table XI. Subsistence fishing in the PICT
PICT Catch volume
[mt] Catch value
[US$]* % GDP
contribution % of coastal
fishing
American Samoa 120 478,000 0.1% 77%
CNMI 220 631,700 0.1% 49%
Cook Islands 267 1,250,000 0.6% 67%
Fiji 17,400 33,812,500 1.2% 65%
French Polynesia 2,880 13,208,276 0.2% 42%
FSM 9,800 15,732,000 6.7% 78%
Guam 70 217,000 0.0% 61%
Kiribati 13,700 28,571,429 22.5% 66%
Marshall Islands 2,800 4,312,000 2.9% 75%
Nauru 450 661,345 3.1% 69%
New Caledonia 3,500 15,770,115 0.2% 72%
Niue 140 617,647 6.2% 93%
Palau 1,250 2,511,000 1.5% 59%
Pitcairn Islands 7 36,765 n.a. 58%
PNG 30,000 35,472,973 0.6% 84%
Samoa 4,495 14,903,842 2.7% 52%
Solomon Islands 15,000 10,980,392 2.6% 82%
Tokelau 375 711,397 n.a. 100%
Tonga 2,800 6,182,178 2.4% 43%
Tuvalu 989 2,232,686 12.7% 81%
Vanuatu 2,830 5,740,385 1.1% 84%
Wallis & Futuna 840 6,333,333 3.4% 87%
Total 109,933 200,366,961 - -
Average (country) 4,997 9,107,589 0.6% 71%
Source: adapted from Gillett 2009
* in current 2007 market prices
7 For simplicity, Gillett (2009) considered the catches from recreational fishing as production for home consumption and therefore as a component of subsistence fisheries.
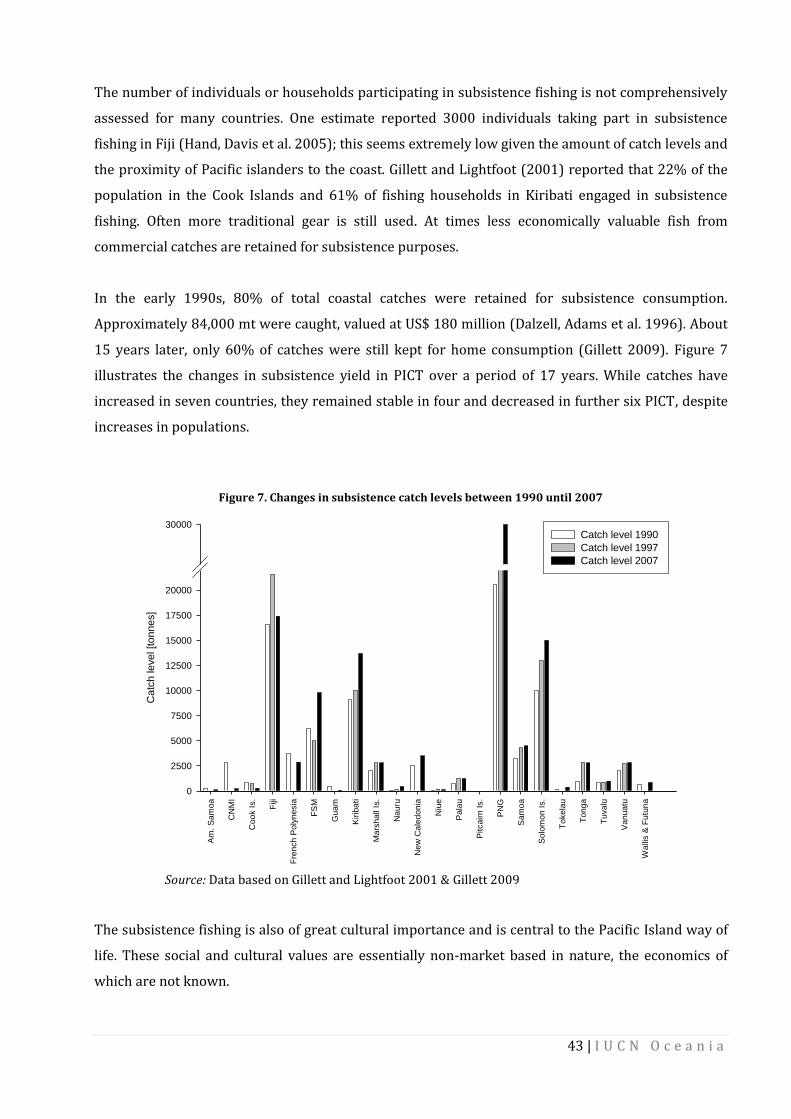
43 | I U C N O c e a n i a
The number of individuals or households participating in subsistence fishing is not comprehensively
assessed for many countries. One estimate reported 3000 individuals taking part in subsistence
fishing in Fiji (Hand, Davis et al. 2005); this seems extremely low given the amount of catch levels and
the proximity of Pacific islanders to the coast. Gillett and Lightfoot (2001) reported that 22% of the
population in the Cook Islands and 61% of fishing households in Kiribati engaged in subsistence
fishing. Often more traditional gear is still used. At times less economically valuable fish from
commercial catches are retained for subsistence purposes.
In the early 1990s, 80% of total coastal catches were retained for subsistence consumption.
Approximately 84,000 mt were caught, valued at US$ 180 million (Dalzell, Adams et al. 1996). About
15 years later, only 60% of catches were still kept for home consumption (Gillett 2009). Figure 7
illustrates the changes in subsistence yield in PICT over a period of 17 years. While catches have
increased in seven countries, they remained stable in four and decreased in further six PICT, despite
increases in populations.
Figure 7. Changes in subsistence catch levels between 1990 until 2007
PICT
Am
. S
am
oa
CN
MI
Co
ok I
s.
Fiji
Fre
nch
Po
lyn
esia
FS
M
Gu
am
Kir
iba
ti
Ma
rsh
all
Is.
Na
uru
Ne
w C
ale
do
nia
Niu
e
Pa
lau
Pitca
irn
Is.
PN
G
Sa
mo
a
So
lom
on
Is.
To
ke
lau
To
ng
a
Tu
va
lu
Va
nu
atu
Wa
llis &
Fu
tun
a
Catc
h le
ve
l [to
nne
s]
0
2500
5000
7500
10000
12500
15000
17500
20000
30000Catch level 1990
Catch level 1997
Catch level 2007
Source: Data based on Gillett and Lightfoot 2001 & Gillett 2009
The subsistence fishing is also of great cultural importance and is central to the Pacific Island way of
life. These social and cultural values are essentially non-market based in nature, the economics of
which are not known.

44 | I U C N O c e a n i a
4.3 Shipping
The economic value associated with shipping is poorly understood, although shipping is the main
lifeline in the Pacific, effectively transporting passengers and imported goods and exporting
domestically produced commodities.
Shipping in the islands is either domestic, international (between Pacific islands and between PICTS
and the outside world), or transit (without calling at a port). The shipping sector can be further
disaggregated into passenger transport, cruise shipping, military shipping, and merchant shipping of
goods for trade (import, export). Although today most foreign visitors arrive by planes, local
passenger transport is often possible only via shipping between islands and to more remote
locations. Movement of military fleet is generally small, except in the North Pacific waters where their
contribution to the local economy and employment is large. Recreational sailing on private yachts
also generates revenues for port authorities, and local economies through purchase of supplies and
services.
Despite the importance of the shipping sector to the local economy, in terms of various port fees and
other charges, limited published empirical information is readily available. In addition, little
disaggregated information exists on the shipping sector, or it is difficult to access because of the data
is maintained on the basis of “commercial in confidence”. Some anecdotal information though does
give an indication of the relative importance of merchant shipping to national economies.
Contribution to national economies
The major provider for shipping services in the PIC region is the regionally owned Pacific Forum Line
(PFL). It connects the islands with Australia and New Zealand. The number of merchant ships
operated in the region ranges from one in Samoa to 1,049 in the Marshall Islands (see Appendix II),
the third biggest merchant fleet in the world. However, approx. 89% of these fleet are foreign owned
(Meyrick and Associates 2007). Main trade routes are with Australia and New Zealand and Asia due
to their proximity to the South Pacific and the equatorial west Pacific respectively (see Table XII).
Table XII. Trading routes and shipping companies in the PIC region
Trade regions Nr of trading routes
and port calls
Nr of
companies
Australia & New Zealand 17 11
Asia and around-the-world 6 11
North America 2 4
Europe 1 1
Source: adapted from (ADB 2007)

45 | I U C N O c e a n i a
The FSM have set up an entry insurance system (EIS) based 5-year license that allows foreign ships to
clear port, requires a payment of US$5,000 per year per vessel and is linked to bond payments of
US$75,000 to US$1 million dependant on the size of the ship (Howes and Morris 2008). In Fiji port
tariffs are US$250 per twenty-foot equivalent unit (TEU)8, or with average size of 200 to 250 TEU per
ship value of US$50,000 to 62,500 per ship-visit9. Port fees, which comprise general, facility and
service tariffs, though vary greatly between countries (see Figure 8).
Figure 8. Port charges in selected PIC
Source: adapted from (Howes and Morris 2008)
Indirect benefits from the Pacific Ocean –training of seamen
A Pacific network of 12 maritime training institutions across the region supplies skilled seafarers for
the international shipping sector, creating jobs for many islanders. In 2003, an estimated 4,000
seamen10 trained in the Pacific were employed on international ships, remitting roughly US$19
million in foreign exchange earnings to their home countries (Commonwealth of Australia 2006).
Often internationally employed Pacific seamen earned higher wages relative to their national
counterparts, and remittances made up to 25% of national GNP in some countries.
Kiribati and Tuvalu in particular have invested in the training of seafarers, supplying a large number
of seamen to international shipping companies. In Tuvalu 542 men or about 15% of the country’s
male population was working as seafarers for international companies in 2006. These activities
injected remittances of US$4 million (US$4.1 million in constant 2008 prices) into local Tuvaluan
8 Standard unit for containers (20ft x 7.9ft x 8.5ft)
9 Pers. comm. Kailesh Kumar, PFL manager
10 Part of this figure are likely to be seamen who work on commercial fishing vessels

46 | I U C N O c e a n i a
economies (CIA 2009). Every seafarer has provided an average of US$ 7,380 per year to their family,
which is more than 4.5 times the average national per capita GDP value. In Kiribati comparable
figures are even higher. Remittances totalled US$ 12 million in 2008 (ADB 2009). Partly, this might be
due to Kiribati people earning relatively high wages of US$ 1,000 per month due to their
internationally recognised training. This is four times higher than seamen from Vanuatu where those
frameworks are currently not in place (SPC 2006). Seafaring can keep local unemployment down and
ameliorate local living standards through remittances. Such wages allow many families to avoid
migration to urban centres in search for paid employment. There are, however, also a range of social
impacts of seafarer training industry associated with the pacific Oceans, including the effects of
separation of male members from their families and sexually transmitted diseases (SPC 2006).
Other employment benefits from shipping include those related to land-based facilities such as ship
refuelling, shipbuilding and repair, and port services. However, no information is readily available for
this kind of employment.
4.4 Mining in marine waters
Mining activities in the Pacific region comprise extraction of aggregates in inshore coastal water and
deep sea mineral exploration. Coastal areas provide an important, albeit small but growing, source of
aggregates for local development. On the other hand, deep sea mining is not a major activity in the
region but shows growing interest both in terms of revenue and employment. Mining is also a source
of concerns because of their potential negative impacts on offshore and coastal ecosystems through
pollution, habitat destruction, and impacts on commercially exploited fish stocks (Morgan, Odunton
et al. 1999; Halfar and Fujita 2007; Danovaro, Gambi et al. 2008).
4.4.1 Coastal mining
Coastal mining of sand and aggregates and dredging of coral reefs is a common activity in PICT,
particularly in Kiribati, Fiji, FSM, Marshall Islands, Samoa, Tonga and Tuvalu providing an important
source of building material or as landfill. Coral sand and limestone is also used for cement
manufacturing and is often preferred over river gravel or quarry mining due to its lower prices and
easy accessibility (Colbert 2000). Aggregate mining of carbonate sand, coral rubble, gravel, rocks,
shells, and other reef materials occurs on the beach or in shallow waters seldom exceeding 25 m
depths (Tuqiri 2001). With increasing population and growth in tourism the demand for such
aggregates is expected to increase over time.

47 | I U C N O c e a n i a
The economic value of coastal mining is difficult to estimate because of poor information. Official
records on aggregate or sand production supply and demand are often incomplete or non existent.
This makes any estimation of the economic benefits of aggregate mining at a national or region level
challenging. Available information do give an idea of the economic value of coastal mining activities
in the Pacific islands, particularly when one considers employment generated locally and that in the
absence of local mining, much of the material may be imported from other countries.
In Fiji, for example, coral sand was mined in the 1990s at Laucala Bay at the rate of about 70,000
m3/yr as a major ingredient for cement production; the aggregate was valued at FJD$ 1 million or
US$ 693,000 per year (Howorth 1997). In 2006, production for limestone was 215,000 mt and an
additional 300,000 m3 of sand and gravel were mined (U.S. Geological Survey 2006)11 providing paid
work for 3,222 people (Fiji Islands Bureau of Statistics 2008). In the Marshall Islands, the aggregate
mining and quarrying industry accounted for an average gross value of 0.3% of total GDP, or
approximately US$300,000 per year between 1991 and 2001 (McKenzie, Woodruff et al. 2006). In
Tongatapu, Tonga, beach sand sold at US$10 per m3 made a domestic industry of annually
US$150,000 (Howorth 1997).
Mining is often small-scale in character and done manually by households but companies also mine
industrially using dredges and other machinery. On Majuro Atoll, almost 70% of the surveyed
households collected aggregates for domestic uses and sale. Additional commercial demand was
supplied by two companies (McKenzie, Woodruff et al. 2006). On Funafuti Atoll in Tuvalu, every
second household was engaged in small-scale aggregate mining mainly for private construction with
extractions being carried out from every few years to several times a week (Ambroz 2009). The
overall reliance on this activity for household income is still very low; less than 1% of the households
sell aggregates with a net gain of US$ 1.7 per 20kg bag of aggregates (Ambroz 2009). However, the
coastal aggregates play an important role in meeting the housing needs of the locals.
In Kiribati, approximately 70,000 m3 are being mined from coastal areas for housing (Greer
Consulting Services 2007). Outsiders have to gain consent from traditional landowners in addition to
a US$ 1.5 royalty per m3 and a 3-months licence (US$ 27) which accounted to US$ 2,550 in 2005.
However, a small proportion of aggregate mining, about 2%, is done by outsiders and therefore
attract little overall royalties.
11 Information on coral sand production was too incomplete for estimation. An unknown proportion of the sand and gravel production was
mined from river beds or quarries

48 | I U C N O c e a n i a
4.4.2 Seabed mining
Deep-sea or seabed mining is currently not a major activity in the region, although prospecting of
mineral deposits and hydrocarbons could potentially be one of the most lucrative emerging ocean-
based activities in the future. The next global metal rush, according to a recent peer-reviewed article,
will concentrate on the seafloor targeting many EEZs and extended continental shelves of many PICs
(Gleason 2008). Deep-sea minerals are of three types: manganese nodules, cobalt-rich manganese
crusts or polymetallic sulphite deposits (Colbert 2000). Additionally, hydrocarbons (petroleum &
gas) have been discovered in the region (Erry, Johnston et al. 2000). Seabed mining could provide
higher grades of minerals along with a smaller footprint (reduced production of overburden/ waste)
compared to land-based operations and limited social disturbance (Smith, Nautilus scientist).
Scale and economic potential of seabed mining
Confirmed mineral occurrence, mainly manganese nodules, exists within the EEZ of the following
countries: PNG, Tonga, Solomon Islands, Vanuatu, Samoa, Fiji, Kiribati, Tuvalu, FSM, Marshall Islands,
Palau, Cook Islands. Clearly for Fiji, Federated States of Micronesia, Palau, Papua New Guinea,
Solomon Islands, Tonga, and Vanuatu, the potential for seabed mining is now becoming a new and
rapidly emerging economic opportunity. For others, in particular Cook Islands, Marshall Islands and
Kiribati, interest in manganese nodules and cobalt rich crusts remain. Ten years ago, first indications
were made about the potentially high gold content of PIC polymetallic sulphide deposits with an
extracted value potentially as high as US$ 2,000 per m2 which have led to increased foreign
investments (World Bank 2000).
Hydrocarbons have further been investigated in Fiji, Solomon Islands, Tonga, and Vanuatu whereas
commercial production has started in PNG (Howorth 1997). An evaluation of Fiji's petroleum
potential in the early 1990s had identified over twenty prospects which could contain oil and gas in
Bligh Water Basin and Bau Waters Basin. It was estimated that if oil were to be present, each
prospect could contain reserves in the order of 300 million barrels of oil (Energy Current 2009).
Government revenues, in the form of royalty and corporate tax, from only one such oil field were
reported to be in the order of US$ 5.8 billion over twenty years (or US$ 1.4 billion discounted), which
could have major impacts on the national economy of Fiji (Rodd 1993). Additionally, a recent
discovery of mineral resources at thermal vents associated with the EEZ of Fiji has attracted many
investors who are interested in further explorations.
The economic potential of offshore minerals in the PICs is believed to be significant but the actual
dollar value can only be estimated once the mineral resource/reserve is confirmed. The excavation of

49 | I U C N O c e a n i a
offshore minerals is extremely costly and capacity intensive, currently only allowing foreign investors
to explore and mine in the region.
Pacific island government revenue from the mining industry will be received from royalty and
corporation tax and other payments associated with the extraction of a “zero-value” or to date
“unutilised” resource base. Mining operations can also contribute to the creation of additional
permanent jobs and skills transfer as well as new capital investment into infrastructure including
power, water, as well as port and road facilities. Therefore, the region would need to attract
investment in the offshore mining industry that will enable mining companies to undertake extensive
marine mineral exploration to determine their potential economic value and feasibility. Seabed
explorations are currently underway in search for oil, gas and minerals such as manganese nodules
(SOPAC 2009). To date, two companies are commercially investing in the region, Nautilus Minerals
and Neptune Mining, though there is growing interest expressed by f a number of possible investors.
The most advanced exploration in the region is the ongoing Solwara Seabed Massive Sulphide
prospect in the Manus Basin within PNG's territorial waters. The exploration company Nautilus
is working towards mineral production by 2012. It is the first company worldwide to venture into
offshore mining of massive sulphide systems, a potential source of high-grade copper, gold, zinc and
silver (Lipton 2008).
Some PICs have also logged their extended seabed claims to the International Seabed Authority (ISA)
during the first half of 2009 to claim resource ownership beyond national EEZs. The extension of the
coastal shelves under the UN Convention of the Law of the Sea (UNCLOS) may gain considerable
resources to national economies. Those extended “legal” continental shelves (ELCS) have high
potential in manganese nodules and crusts, oil, gas, and gas hydrates. Estimates value the resource
potential within ELCS worldwide at US$ 11.93 trillion (at 2001 raw commodity prices excluding
operational and other costs) (Murton 2001). However, interest will depend on world market prices
and demand. Swamping of market price would result in instant losses making PICs again vulnerable
to outside dynamics. Environmental effects of such mining activities are also unknown, although
communities have raised many concerns and scientific research shows that environmental threats of
seabed mining may in fact be manifold, depending on the scale and nature of mining activities.
Environmental regulations pertaining to deep sea mining is almost non existent in the region, with a
few exceptions such as the Cooks Islands.

50 | I U C N O c e a n i a
5. Total Economic Value of Pacific Ocean sub-ecosystems
Limited detailed economic studies suggest a total economic value of the Pacific Ocean sub-ecosystems
to be well over several billion US dollars, as discussed below. TEV for coral reefs from five PICTs (2 at
provincial level) is estimated to be about US$ 758 million annually and US$ 250 million for
mangroves from three PICTs (see Table XV and Table XVI). From these studies a regional TEV of
more than US$ 7.6 billion from coral reefs and mangroves was calculated. This value is a conservative
estimation of the true economic values since it is based on only a handful of studies of TEV of coral
reefs and mangrove forests and swamps in only a limited number of countries. Therefore, it is only
presented here to provide an idea of the magnitude of the TEV of these systems. Additionally, values
are much higher for those countries where studies only estimated parts of the national sub-
ecosystem area. Values for other sub-ecosystems such as seagrass beds, estuaries, sandy and rocky
shores, and beach systems as well as deep sea resources are not available for the region. All of the
economic activities mentioned in Section 4, except shipping and mining, are directly or indirectly
dependant on these healthy coastal and/or adjacent offshore ecosystems; shipping and mining
activities are likely to also produce negative impact on the functioning of the other subsystems, even
if their market benefits may be considerably high.
Ocean sub-ecosystems generate many goods and services directly valued by people. As seen in
Section 4, these include fisheries products consumed as food, mining products used in construction,
and non-consumptive uses of healthy reefs and other habitats valued by tourists. They also provide
many ecosystem services that sustain ecological processes such as protection against erosion and
carbon sequestration (Table XIII).
Table XIII. Diversity in economic value of goods and services supported by mangroves
in selected countries (US$/ha/yr)
Fiji Indonesia Philippines
Kosrae (FSM)
Thailand
Forestry 6 67 251 178
140–1,059*
Fisheries 100 117 60 461 8–63**
Biodiversity 15
Erosion 3 2,990
Nutrient filter (human waste treatment)
2,600
Carbon sequestration 86
Total 2,706 102 311 426–640 3,206–4,112
Source: Lal 2003 *Includes non-timber products plus coastal fishery ** Offshore fisheries

51 | I U C N O c e a n i a
Table XIV. Coral reef and mangrove areas in
PICTs
PICT Reef area
[km2] Mangrove area [km2]
American Samoa 67 57
CNMI 102 7
Cook Islands 212 0
Fiji 10020 385
French Polynesia 3000 0
FSM 3172 86
Guam 183 0,94
Kiribati 1967 n.a.
Marshall Islands 1995 n.a.
Nauru 10 1
New Caledonia 4573 456
Niue 15 n.a.
Palau 709 n.a.
Pitcairn Islands 39 0
PNG 13840 5399
Samoa 200 7
Solomon Islands* 5750 642
Tokelau 97 n.a.
Tonga 3587 10
Tuvalu 872 n.a.
Vanuatu 708 16
Wallis and Futuna 425 n.a.
Total 51,543 7,067
Source: Mangrove area (Spalding, Ravilious et al. 2001) Coral reef area (Andréfouët, Chauvin et al.)
Source: adapted from
(Bell, Kronen et al. 2009)
The services provided by healthy ecosystems are
not directly markets and therefore information
on their value in monetary terms does not
readily exist.
5.1 Coastal sub-ecosystems
Economic valuation studies of coastal sub-
ecosystems are limited, with the majority
focusing on national level direct and indirect
uses of coral reefs and or mangrove ecosystems.
Pacific-wide value of subsystems, let alone total
value of the PICTs are poorly understood. Only a
handful of regional estimates are available and
these are equally based on a range of
methodologies, and value measures.
Regional TEV
A wide ranging TEV have been reported in the
literature, largely because of different
methodologies used, and approximation made in the light of poor baseline information. Cesar et al.
(2003) estimated a net present value (NPV) of the Pacific (excluding the USA and Australia) coral
reefs to be US$ 2.08 billion12, including US$ 751.000 million from non-market values such as coastal
protection and biodiversity value. Using primary data reported in Tables 16 and 17, TEV of coral
reefs is estimated to be US$ 3.8 billion per year, including about US$ 1.3 billion were contributed
from indirect or non-use values. These results are similar to Cesar et al (2003). Similarly the TEV of
PICT mangrove forests is with US$ 3.9 billion annually the same as for coral reefs.
National level TEV of sub-ecosystems
Country specific economic valuation information on ocean based subsystem is also very limited,
providing a wide range of value estimates, sometimes only valuing a certain area, island or province
of the national ecosystem. Where these are available estimates reflect often only a subset of use
and/or non-use values (Table 13). Such variations in values considered and different approaches
used make it difficult to derive an aggregate economic value of the sub-ecosystems in the PICT. The
12 Note that these values also capture some fot eh direct market values associated with ecotourism
52 | I U C N O c e a n i a
following economic value information is provided to only give an idea of the range in values that have
been estimated, and approaches used.
The TEV of coral reefs and mangroves, for example, in Fiji, was estimated, at US$ 439.2 million
annually at 1994 prices (Sisto 2000) of this US$ 229 million was attributed to recreational uses of
reefs, beaches, and lagoons. This estimate was, however, not based on primary information from Fiji
but on global mean estimates by Costanza et al. (1997) multiplied by coastal ecosystem area from Fiji.
Coastal resources in Palau were estimated at US$ 41.4 million annually relating to 25% of national
GDP (World Bank 2004, unpublished cited from (Thomas 2007). In Samoa tourism based net
economic value was estimated to be US$ 947,000 with a TEV or benefit associated with all terrestrial
and marine resource to the residents of Samoa of US$12 million (Mohd-Shahwahid and McNally
2001). If values of global benefits generated by these resources, particularly on climate regulation
services, nutrient cycling, and biological control were incorporated, the TEV raises to US$ 137 million
annually.
The TEV of coral reefs ranges from US$ 5 million in American Samoa to more than US$ 137 million in
Guam (Table XV). The annual value per km2 is again lowest in American Samoa and 28 times higher in
the Moorea Atoll, French Polynesia. Table XVI shows the few available values for ecosystem goods
and services for mangroves in the region.

53 | I U C N O c e a n i a
Table XV. Ecosystem goods and services (in NPV) of coral reefs in PICT
PICT or location TEV of coral
reefs/yr
As % of
GDP TEV per km
2/yr Direct use value
Indirect & non-use value
Indirect & non-use value per
km2/yr
Comments Method used Reference
American Samoa* 5,093,000 1.2% 76,015** 3,814,000 1,279,000 19,090 From fishing; diving/snorkelling; shoreline protection
Contingent valuation method + GIS-based economic model
(Spurgeon, Roxburgh et al. 2004)
Saipan*** (CNMI) 68,520,518 6.4% 896,279 -
10,083,137 50,019,978 18,500,540 640,157
For coral reefs and adjacent habitat tourism, coastal protection, diving, snorkelling, fisheries, amenities, research (biodiversity)
Household survey, Discrete choice experiment, Total Economic Value Calculation, Spatial analysis, Sustainable financing
(van Beukering, Haider et al. 2006)
Fiji 439,200,000 28% 43,832** 229,492,521 209,282,266 20,886
From recreational uses of reefs, beaches, lagoons and coastal protection (In 1994 market prices!)
Based on secondary literature on global mean values (e.g. Costanza et al. 1997)
Sisto 2000
Moorea Atoll*** (French Polynesia)
107,742,799 1.5% 2,154,900
65,938,593
41,804,206
836,084
For reefs & lagoons from tourism & recreation, coastal protection, aesthetics, biodiversity, subsistence
Willingness to pay (WTP) method used
(Charles 2005)
Guam 137,827,077 3.4% 753,153** 116,173,177 21,653,901 118,323
For coral reefs and adjacent habitat tourism, coastal protection, diving, snorkelling, fisheries, amenities, research (biodiversity)
Household survey, Discrete choice experiment, Total Economic Value Calculation, Spatial analysis, Sustainable financing
van Beukering et al. 2007
Total 758.383.395 - - 465.438.269 292.519.103 - - Case study values added together
-
TEV per km2/yr 73.282 - - 44.975 28.266 - -
Total value divided by total mangrove area from case studies (458 km2)
Total value for
PICTs 3.777.150.741 - - 2.318.128.952 1.456.899.973 - -
TEV per km2/yr multiplied by total PICT reef area (7,067 km2)
-
Values in constant US$ at 2008 market prices; values in italics are in current US$ market prices. * The TEV is $10.057 million if the value of the mangroves conservation to the US public at large is considered. **Unit value per km2/yr calculated from values given in Table XIV. ***Reef area for Saipan: 28.9 km2; reef and lagoon area for Moorea: 50 km2

54 | I U C N O c e a n i a
Table XVI. Nominal Values of Ecosystem goods and services of mangroves in PICT
PICT or location Annual TEV of
mangroves % of GDP
per km2/yr
Direct use value
Indirect & non-use
value
Indirect & non-use value per km
2/yr
Comments Method Ref
American Samoa*
754,000* 0.2% 13,228** 213,000 573,000 10,053
Subsistence & artisanal fishing, shoreline protection, cultural & social value
Contingent valuation method + GIS-based economic model
Spurgeon et al, 2006
Fiji**** 140,616,889 9% 178,961** 71,715,433 68,901,456 178,959 (in 1994 market prices)
Benefit Transfer Sisto 1997
Fiji 247,375,999 21% 642,535** 147,257,999 100,100,000** 260,000
From commercial and subsistence fishery and fuelwood production; nutrient filtration (in 1994 market prices)
Survey Based Production Lal 1990, Lal 2003
Kosrae (FSM) 1,666,000- 2,260,000
1% 106,658
- 144,686** 666,000 - 1,000,000
1,000,000 - 1,260,000
64,020- 80,666**
WTP for protection of mangroves for fish, fuel, wood, crabs & future existence value (in 1996 market prices). NB Lal 1990b reported only direct use value
Contingent valuation method (Naylor and Drew 1998); Production Method (Lal 1989)
Naylor and Drew 1998; Lal 1991
Palau**** - - - 1,800,000 n.a. ?? ?? World Bank 2004 (unpublished cited in Thomas 2007)
Malekula Island (Vanuatu)****
- - - 130,000 n.a.
From fuelwood, fence posts, building material and food in Vanuatu's main mangrove area
Production method
Vanuatu Environment Unit (2007) using Lal 1990 data
Total 250.092.999 - - 148.321.999 101.803.000 - - Case study values added together
TEV per
km2/yr 546.055 - - 323.847 222.277 - -
Total value divided by total mangrove area from case studies (458 km2)
-
Total value
for PICT 3.858.967.741 - - 2.288.627.879 1.570.833.627 - -
TEV per km2/yr multiplied by total PICT reef area (7,067 km2)
-
In constant US$ 2008 market prices; values in italics in US$ current market prices. * The TEV is $1.4 million if the value of the mangroves conservation to the US public at large is considered. **Unit value per km2/yr calculated from values given in Table XIV. ***Mangrove area for Kosrae: 16 km2. ****Values excluded from calculation

55 | I U C N O c e a n i a
The variations in the total economic values presented in the previous tables reflect many different
factors, including the quality and location of the ecosystem and its varying degree of human uses,
benefits and activities. Generally the higher the use values derived from an ecosystem, the higher the
monetary values, as has been documented in Indonesia, where TEV of reefs ranges from US$ 829 in
low population density areas (reliant on alternative agriculture for their livelihood) to US$ 1 million
per km2 where tourism is the main activity (Cesar 1996).
Similar variations in use and non-use values associated with mangrove sub-ecosystems have been
reported in the region. In American Samoa TEV of US$ 13,000 per km2 was estimated based on
contingent valuation by Spurgeon et al. 2004 whereas in Fiji, Lal (1990) reported the average TEV of
US$ 195,000 per km2 using survey based production valuation of mangrove dependent fisheries and
forestry products harvested for commercial purposes and average subsistence values.
Indirect use values
In addition to direct use values, coastal ecosystems, as mentioned above, also provide indirect use
and non-use values. For example, coastal protection by mangroves and coral reefs was estimates in
American Samoa, CNMI and Guam to respectively be US$447,000, US$8.2 million and US$8.4 million
respectively. Biodiversity was valued at US$779,000 in Guam and US$2 million in American Samoa.
Additional values such as amenities from reefs were worth US$9.6 million in Guam, US$3 million in
CNMI and the aesthetic value of reefs in Moorea Lagoon, French Polynesia was valued at US$25
million annually. If ecosystem services were included, Lal (1990) reported a TEV of US$ 643,000 per
km2, or a TEV of mangroves of US$ 247 million annually in Fiji.
Non-use values of coral reefs account for a third of the TEV in American Samoa and Saipan but non-
use values make up three quarters of the TEV of mangroves in American Samoa. These non-use
values accrue due to potential future uses and benefits (option value), or benefits for future
generations (bequest value) or simply from the knowledge that reefs and mangroves continue to
exist (existence value). These values also reflect social, cultural, and historical significance of these
sub-ecosystems to Pacific islanders.
Direct use values
Available data from the region suggests that marine ecotourism is often the most valued use of coral
reefs, ranging from about US$ 947,000 in Samoa (Mohd-Shahwahid and McNally 2001) to US$140
million in Fiji (Sisto 2000) (Table XVII). In Guam and French Polynesia, ecotourism represented 60%
and 75% of coral reef TEV. The high net economic value of coral reef-based ecotourism is in part due
to increasingly popular scuba diving. That activity alone has contributed, for example an annual value
of US$ 10.5 million in Guam and US$6.5 million in Saipan, CNMI (11% and 15% of TEV of

56 | I U C N O c e a n i a
recreational coral reef-based activities) (van Beukering, Haider et al. 2006; van Beukering, Haider et
al. 2007).
Table XVII. Net benefits of coral reef related tourism in PICTs
PICT Value [US$]* Comments Year Reference
CNMI 47.4 million Reef-associated tourism on Saipan (70% of TEV of coral reef)
2006 van Beukering, Haider et al. 2006)
Fiji 140 million Reef related tourism 1994 Sisto 2000
French Polynesia 63.4 million
Recreational value of Moorea atoll (60% of TEV of reef value)
2006 Charles 2005
Guam 114.4 million Reef associated tourism (75% of reef TEV)
2005 van Beukering, Haider et al. 2007
Samoa 946,900 Recreational value of marine resources (international & domestic visitors)
2001 Mohd-Shahwahid and McNally 2001
*In constant US$ 2008 market prices; values in italics in current market prices
Other ecosystem values: Cetacean watching-based ecotourism
Other specialised use values associated with the Pacific Ocean include enjoying what nature has to
provide such as whale watching. Whale and dolphin watching has become a popular tourist
attraction in the PIC region and commercial whale watching operations are found in 14 countries;
mainly those were breeding grounds exist, including Samoa and Tonga. In 2005 more than 110,000
visitors took part in tourism operations to watch whales and dolphins, an almost ten-fold increase
from seven years earlier (O'Connor 2008). The economic contribution of such activities is often
included in the tourism statistics. However, the non-market values of enjoyment are not captured
there. The total economic value of whale watching in the Pacific islands region in 2005 was estimated
to be about US$ 21 million, which was over 200 fold more than US$ 1.2 million in 1998 (O'Connor
2008).
In conclusion, information about TEV associated with Pacific Ocean ecosystems to the PICTs is very
limited and incomplete. More targeted assessment is required to understand the importance of direct
and indirect and market and non-market values of the Pacific Ocean to the PICTs.
57 | I U C N O c e a n i a
6. Implications of ‘business as usual’ approach
The Scientific Consensus Statement (Center for Ocean Solution 2009) noted that “the best science
indicates that over the next century we can expect to see dramatic declines in the health of the Pacific
Ocean, its ecosystems, and the people that rely on this shared resources, unless concerted and prompt
action to address known threats is taken.” These key environmental threats to Pacific ecosystems, as
noted earlier, from land-based and marine-associated activities are pollution, habitat destruction,
overfishing and exploitation, and climate change (Center for Ocean Solution 2009). Additionally,
invasive species are seen as potential severe threat. These threats are caused by a range of activities,
agriculture, industry, urban development, mining, shipping, but also ocean-health dependent
activities such as tourism and fishing that cause damage through over-exploitive, unregulated or
insufficiently managed behaviour.
These activities and their damaging effects are rarely linear. They are inter-linked and can cause
multiple and multidimensional threats to marine ecosystems and dependant economies at various
temporal and spatial scales. Discharge of ballast water from shipping carries around 7,000 species
per day can not only cause localised pollution and significant disruptions of local ecosystem, it can
also threaten fisheries (De Poorter, Darby et al. 2009). Climate change as the overarching threat is
expected to increase overall vulnerability of the environmental and economic system. While small-
scale subsistence activities are likely less harmful than commercial activities, their cumulative impact
can still be significant but is often not adequately acknowledged or addressed in national policy or
management plans.
6.2 Management implications of ‘business as usual’ approach
The scientific assessment of the business as usual scenarios reported in the Ocean Solutions report
assume that the recent trend of pollution, overfishing and exploitation, habitat destruction and
looming climate change will continue despite ongoing management efforts at the national and
regional levels, some guided by various international and regional instruments. Throughout the
region, countries have committed to various international and regional agreements, and have
adopted various national legislative frameworks that guide the use and management of ocean
resources. The ratification status of each of these treaties and regional policies by independent states
in the Pacific Islands region is summarised in Appendix 3 and 4.
Many Pacific island countries have developed their National Environmental Management Policy and
Strategy, and sector specific legislations to guide their sustainable environmental management efforts
including effective governance of their ocean resources and ecosystems. There is also much
legislation that provides the framework for land based and other activities that also affect the health

58 | I U C N O c e a n i a
of the Pacific Ocean. In most cases, however, the policies and strategies have not adequately addressed
the issues concerning their oceans development challenges including management and conservation of
biodiversity, controlling issues of fishing licenses, waste and marine pollution control, to name a few
(see for example, http://www.sprep.org/publication/pub_detail.asp?id=759http://www.sprep.org/
publication/pub_detail.asp?id=759). As a result, a number of countries have recently begun to review
their existing policies and strategies to make them more comprehensive and adaptive to contemporary
environmental challenges and priorities (Clarke, Miller et al. 2008).
In the light of the significant challenges faced by resource and capacity constraints, the Pacific
Leaders have also endorsed a Pacific Islands Regional Ocean’s Policy (PIROP). The purpose of the
PIROP is to guide the regional effort “....to achieve responsible ocean governance [for a] healthy ocean
that sustains the livelihoods and aspirations of Pacific Island communities”. The policy defines ocean to
broadly include “waters of the ocean, the living and non-living elements within, the seabed beneath and
the ocean-atmosphere and ocean-island interfaces.” Its implementation framework is defined in a
compendium document called, the Pacific Islands Regional Ocean Framework for Integrated Strategic
Action (PIROF-ISA), outlining the following key principles and associated strategies: a) improving our
understanding of the Ocean, b) sustainably developing and managing the use of the Ocean resources,
c) maintaining the health of the ocean, d) promoting the useful use of the ocean, and e) creating
partnerships and promoting cooperation.
The list of such instruments, declaration and frameworks, commitments, and approaches to the
management of the Pacific Ocean at both the national and regional level is long, as is the list of
project-based activities undertaken by international and regional NGOs, regional intergovernmental
organisations and bilateral and multilateral development partners. Again, while some have produced
certain positive outcomes, the key issues persist while goals remain largely unmet. Partially, this is
due to the inconsistency of the level and scope of existing ocean governance instruments within
country and across the region that, where they exist, lack coherence. Often existing laws are, as
mentioned earlier, outdated and ineffective. Further, international, regional and national institutions
and organisations often fail in building human and institutional capacity or providing long-term
effective support to island nations. Many countries also lack the human capacity and financial
resources to implement, manage, and enforce environmental laws, policies, and activities within the
existing Pacific Islands oceans governance framework (Chasek 2010). In part, this is due to a clear
lack of political will of Pacific Island leaders to address environmental and oceans governance issues
while prioritising national economic development goals (FAO 2004; Chape 2006). As a result many
coastal and ocean governance and management activities are in conflict with each other and are
ineffective, endangering both the marine and human population.

59 | I U C N O c e a n i a
In summary, the existing multitude of national, regional, and international agreements, and policies
have not shown desired successes. In the meantime, management failure and increased economic
exploitation of the regions’ resources continue to incur further costs and resulting losses for local,
national, and regional economies along with additional societal costs such as cultural losses and
malnutrition.
6.2 Cost implications of ‘business as usual’ practices
If urgent action is not taken to improve the governance of the Pacific Ocean across all levels, the
economic costs associated with ‘business as usual’ approach will be large, affecting the livelihoods of
the people of the PICTs and the Pacific Rim countries as well as the world at large.
The extent of the loss in value is difficult to project because no studies to our knowledge have
explicitly addressed this question empirically for the Pacific Ocean as a whole or within the PICTs
boundaries. Also, technical cause and effect understanding is limited about incremental changes in
ocean health on the ecosystem and directly and indirectly dependent economic activities.
Furthermore, the economic value of any decrease in such activities will be influenced by the change
in market price of the goods and services supported by a healthy Pacific Ocean. Nonetheless, the
decrease in wellbeing would be large under ‘business as usual’ scenarios. The extent of damages
would depend on the continued path of uses and the effectiveness of current and future management
regimes.
Generally speaking, the PICTs would expect to find a decrease in gross and net13 economic values of
activities associated with the Pacific Ocean discussed in Section 4 and 5 if recent trends of habitat
destruction, overexploitation, and pollution were to continue. Overexploitation and destruction of
habitats as well as pollution would also cause a decline in the net economic values associated with
direct use values (McKenzie, Woodruff et al. 2006). The flow-on effects of habitat destruction can
also be large because such practices can impact on other economic activities indirectly associated
with these ecosystems.
Some specific case studies carried out in the region discussed below do exemplify some of the
expected costs of inaction if we fail to act immediately to mitigate these threats with effective and
timely management actions.
13 Assuming the returns are consumed today and not banked.

60 | I U C N O c e a n i a
6.2.1 Habitat destruction, overfishing and exploitation
As mentioned earlier, productive coastal and marine habitats are lost to poor agricultural land use,
coastal mining, and inappropriate coastal development, for example for housing and tourism
purposes. Such practices cause erosion and inundation and put communities at risk, for example, of
increased flooding and exposure to cyclones. Damages to infrastructure, residential areas and coastal
protection occur and can produce substantial costs in repairs and maintenance. Habitat destruction
reduces coastal ecosystem health and impairs local productivity causing reduced fisheries yields and
therefore insecure food supply and reduced income for coastal communities. While a destroyed
habitat leaves less “room” for fish populations, several fishing methods are destructive of the habitat.
For example, the cost of ‘inaction’ on blast fishing has been estimated at US$ 3.8 billion in Indonesia
over the last 25 years (Cesar, Burke et al. 2003). Although this fishing method is not as wide-spread
in the Pacific islands it does occur locally along with other harmful practices such as the use of fish
poison or beating corals to scare out fish. Local overfishing is witnessed in most PICTs, particularly
where population and market participation have increased (Bell, Kronen et al. 2009). Limiting fish
species below a threshold can cause ecological shifts, further reducing biodiversity and productivity.
Similarly, the over-exploitation of tuna and the by-catch from the tuna fishery further reduces fish
stocks, again with severe cost consequences and economic losses to PICTs.
As discussed in Section 5, the economically most valued coral reefs are those that are used
extensively for tourism purposes. With the decline in healthy reefs, their market or scarcity value will
accelerate while local livelihoods are sinking. The monetary incentive may encourage some
traditional land owners to sell out use rights to foreign investors leaving them with even fewer
resources to make a living.
While there are few cost estimates available for habitat destruction and over-exploitation,
detrimental effects of coastal mining have been well documented (Howorth 1997). While small-scale
household mining per se appears to be harmless it can have cumulative effects if not managed. In
their study on the ‘true’ economic costs of aggregate mining McKenzie et al. (2006) put forth the
dilemma that the resulting coastal damage meant that the public had to bear the increased risk of
coastal erosion, flooding or respond by replacing coastal protection by artificial means such as
through sea walls. These latter costs were estimated to be between US$ 88-373 million over 25 years
in Majuro Atoll, Marshall Islands if current erosion patterns would persist, the cost of protection
against coastal erosion in the Majuro Atoll was estimated to be approximately US$236 million. In
Kiribati, costs of building seawalls to counter erosion result in several million US$ with another US$
100,000 in annual maintenance cost (Greer Consulting Services 2007). Increasingly, replanting
mangroves as natural solution for coastal protection is carried out; however annual mangrove

61 | I U C N O c e a n i a
rehabilitation costs can be quite high and range from US$ 225 to as high as US$ 216,000 per ha
(Gilman, Lavieren et al. 2006).
Another severe form of habitat destruction and over-exploitation could arise from deep-sea mining
activities. Currently, while the effects of deep-sea or offshore mining are poorly understood, scientists
predict that deep sea mining processes could potentially endanger and alter habitats and life forms in
the surrounding sea water column and may even place threats to coastal biodiversity (Howorth
1997; Morgan, Odunton et al. 1999; Roberts, Aguilar et al. 2005; Danovaro, Gambi et al. 2008). As
such, this activity would not only pollute and destroy habitat, it could also pose additional threats to
ecosystem functionality and fish stocks. The contaminated, warm, sediment and nutrient-loaded
bottom water may cause algal blooms and threatening commercial fishing. These effects are likely to
influence not only jurisdictional waters but also damage ecosystems and the food-chain within the
economic zones of other nations (Halfar and Fujita 2007).
6.2.2 Pollution
Pollution in the PICT seems to develop into an omnipresent threat. Nutrient and sediment pollution
from agriculture, sewage, logging and urban runoff along with plastic marine debris, watershed and
solid waste disposal, toxic dumping and oil spills are an increasing threat to PICTs. These forms of
pollution can create dead zones, algal blooms, and acidic areas, alter the basic ecosystem structure,
pose human health risks, and stress economies. While much of the pollution is land-based, e.g.
through increased production of litter and effluents, it can also be ship-borne, or can stem from
mining activities.
Two economic valuation studies estimated the market costs or gross benefits that would be avoided
in the absence of watershed pollution in the Cook Islands (Hajkowicz 2006) and solid waste pollution
in Palau (Hajkowicz, Tellames et al. 2005). In the Cook Islands, costs were estimated to be NZ$ 7.4
million or US$ 5.8 million in 2008 prices, accounting for 3.1% of national GDP. Most of the costs were
generated through losses in tourism, healthcare and illness costs and the provision of bottled water
and public water filters as well as the loss in coastal fish stocks. Solid waste pollution in Palau,
estimated at US$ 1.9 million annually (best estimate, US$ 2.3 million in 2008 prices) accounts for
1.6% of national GDP with similar cost causes: losses in tourism, healthcare and illness costs,
operation of dump sides and losses in fisheries yields. In both cases the biggest costs would accrue to
tourism; however tourism particularly big resort type businesses often produce increased solid
waste and watershed pollution which can negatively impact coastal habitats and have negative
impacts on the industry itself. Solid waste in Tonga causes annual costs of US$ 2.7 million (in 2005$)
whereas total economic costs of poor human waste management to Tuvaluan nationals was

62 | I U C N O c e a n i a
estimated to be at least US$ 262,000 to US$495,000 a year (Lal, Saloa et al. 2006; Lal and Takau
2006).
Shipping can be a major source of pollution through the introduction of invasive species. It is
estimated that 7,000 invasive species, such as invertebrates or algae, are introduced daily via a series
of vectors but foremost by extensive global and regional shipping activities. These organisms get
trapped through bio-fouling (attachment of organisms on the hull of a ship) and ballast water
(carried and expelled at the port of destination). A recent IUCN report on marine invasive species
indicates that today’s trade and shipping industry is moving more organisms around the world via
ballast water in one month, than we used to in an entire century (De Poorter, Darby et al. 2009). The
economic costs of such impacts are though not known. However, estimates of the best documented
case of the invasive zebra mussel, a European freshwater species, caused cost of controlling of US$
10 billion over ten years to North America (De Poorter, Darby et al. 2009).
Oil spills can cause not only severe environmental but also economic damage. While large scale oils
spills have not been experienced in the Pacific, there are through small scale oils pollution, the costs
of which are not known in the region. Global experience though suggests that the clean-up costs can
cause billions of dollars, often with unknown or continuing detrimental effects on the affected
ecosystems. The most expensive oil spill, the Exxon Valdez before Alaska in 1989 generated cleanup
costs in the region of US$2.5 billion and total costs (including fines, penalties and claims settlements)
estimated at US$9.5 billion (International Maritime Organization 2008). The average container ship
travels about eight times around the world, consuming large amounts of fossil fuels and their
inevitable impact on resources, air quality and production of waste and green house gases (National
Geographic 2009).
6.2.3 Climate change & sea level rise
In the face of climate change, resulting sea level rise, (sea) temperature warming and ocean
acidification, entire island populations and coastal as well as marine ecosystems are threatened. We
are already beginning to changes in ocean circulation and abrupt shifts in precipitation patterns
(Busuioc, Chen et al. 2007; Herr and Galland 2009). The warming temperatures and change in ocean
and atmospheric currents can create massive dead zones and can change distribution of reef fish as
well as migration patterns of tuna and marine mammals. Ocean acidification and temperature
warming can lead to severe coral bleaching and reduced calcium accretion of reef organisms and
certain plankton. Climate change is pervasive, a global, overarching threat that will influence all
aspects of our lives, economically, politically, and socially. It is one of the biggest challenges that
people face all around the world, while Pacific Islanders are expected to suffer strongly despite

63 | I U C N O c e a n i a
having contributed little to nothing to current CO2 levels. Nevertheless, the costs will be carried by
everyone, the public and industry alike.
As coastal communities begin to witness changes and increasing flooding causing salt water intrusion
of fresh water lenses, destruction of crops and properties one of the adaptation strategies proposed is
the resettlement of an entire country such as Tuvalu. Resettlement because of rising sea level has so
far only happened in the Cataret Islands in PNG where 300 people were moved to the mainland in
2004. The direct and indirect costs of resettlement but also the social challenges and losses in
cultural values and identities coupled with potential land rights issues and lacking resources for
relocated communities are serious problems and have not been adequately assessed to date.
Economic costs of climate change
Economic cost estimates of climate change on marine resources in the Pacific are currently
unavailable. However, a range of studies have looked at several aspects such as declining coral reef
productivity or the costs of increased disasters, such as increased rate of hurricanes and their
associated costs. Many of those costs are attributable not just to climate change but also to the
cumulative sum of threats such as habitat destruction, pollution and over-exploitation that have
already weakened our ecosystems leaving them more vulnerable to climate change.
Hoegh-Guldberg et al. (2000) estimated a worst case scenario for Melanesian nations of economic
losses to be between 15% and 20% of national GDP or, in absolute terms, about US$ 1.9 to US$ 2.5
billion in late-1990s dollars. This would result from comparison with expected uninterrupted growth
over the next 20 years in the absence of climate-change impacts. For Polynesia and Micronesia,
estimates were higher, between 40% to 50%, or US$ 4 to US$ 5 billion respectively due to the
absence of an undeveloped resource base which could curb some of the economic losses.
Increased natural disasters such as hurricanes, droughts, storm surges, and floods have caused losses
of US$ 6.2 billion to PICTs during the 1950-2008 in 2008 US$ (Hay 2008). Cyclone Heta in 2004
caused total estimated costs of US$ 31.8 million in 2008 prices; more than US$ 3 million were due to
losses in coastal fisheries. Cyclone Ami caused total damages of almost US$ 80 million in 2008 prices
in Fiji in 2003. The list of destructive cyclones, associated floods, and tsunamis in the Pacific island
region is long. While such weather events occur naturally, their frequency and intensity is predicted
to increase along with the damage costs (Bettencourt et al. 2006). More recently, the one-in-fifty year
weather event in Fiji caused at least US$ 15 million due flooding of the low lying sugar belt areas,
including reclaimed mangrove lands, (Lal 2010) plus an additional US$ 188 million in the coastal
towns and peri urban areas of Nadi and Ba (Ambroz 2009; Holland 2009).

64 | I U C N O c e a n i a
Sea temperature warming will put great pressure ono coral reefs and may lead to severe bleaching
events. The total NPV of cost of severe coral bleaching in the Pacific (excluding Hawai’i) has been
estimated at US$ 7.6 billion, calculated over a 50-year time horizon with a 3% discount rate (Cesar,
Burke et al. 2003). The loss and destruction of coral reefs will lead to low productivity of associated
fisheries, impact on adjacent ecosystems and potentially lead to system collapse. Also, the wide range
of economic activities associated with healthy reefs will suffer.
Tuna are migratory fish with a home range of several thousand km. Seasons and climate influence
their whereabouts as well as extreme whether events such as the ENSO. Through climate change,
stocks are predicted to change their distribution patterns in moving east-wards out of many Pacific
Island EEZs into international waters that are open access. This will cause great economic deficits to
PICTs. Coastal fish populations are also expected to be greatly impacted, particularly those that
depend on healthy coral reefs for food or shelter. These changes may not be immediately apparent,
but result in slow, long-term (decadal) declines in yields as resilience and productivity are gradually
eroded (Gillett 2009).
Not only coral reefs and associated fauna are vulnerable to climate change, mangrove ecosystems will
be likewise affected. While mangroves generally have the ability to migrate land-wards to mitigate
potential sea-level rise, in many places infrastructure is now blocking the way. Lal, Kinch et al. (2009)
estimate that by 2100 525,000 ha will be irrevocably lost due to sea-level rise which would incur
costs of US$ 25 million to US$ 470 million. Furthermore, mangrove destruction can release large
quantities of stored carbon and exacerbate global warming trends (Kauppi, R. Sedjo et al. 2001).
6.2.4 Other livelihood costs under ‘business as usual’
Business as usual approach will also incur costs other than just financial or economic. Continued loss
of habitats, pollution, and overharvesting will also result in insecure food supply and malnutrition for
coastal communities. A recent study by Bell et al. (2009) has concluded that 16 of 22 PICT will not be
able to meet the forecasted national demand of fish in 2030 required to meet recommended per
capita fish consumption, or to maintain current consumption. Localised overfishing (Newton, Côté et
al. 2007) and increasing demand influence fish production negatively and thus availability of much
needed protein. Other drivers of change, such as economic and fisheries development, governance
and political stability issues as well as climate change, can be expected to add to this negative trend.
Increased vulnerability to climate change-related storm surges and cyclones will incur further costs
to coastal communities. While the physical damage to infrastructure can be expressed in monetary
terms, a measure for hardship or hunger stretches beyond what we can easily capture in dollar

65 | I U C N O c e a n i a
values. A recent study in Fiji demonstrates that with climate related disasters, such as floods, one in
two families affected by the 2009 floods fell below the basic poverty line; having to choose between
providing food or paying for transport to send their children to school was a resulting social issue
(Lal 2010).
As noted earlier, subsistence fishery is crucial part of Pacific Islanders’ lives. But it is more than a
lifestyle; in its absence, PICT communities would have to spend millions of dollars (, e.g. US$ 18
million in Kiribati and US$ 14.7 million), annually to import foods of equivalent protein content
causing severe dietary, cultural, and economic challenges (World Bank 2000). Socio-economic studies
(e.g. Scourse and Wilkins 2009) already show that local diets are changing and increasingly include
imported and processed food like tinned tuna and dishes made from flour and sugar also because an
increased portion of the catch is being sold.
The decline in coastal fish stocks is aggravated through habitat destruction of coral reefs and
mangroves, which in return is also caused through destructive fishing methods. Dwindling stocks and
few coral reefs or mangrove forests left will increase their demand and therefore market value or
scarcity value. This will not only mean that communities will have less resources available while
growing in population, it may also encourage some to sell out too many fishing rights accelerating
coastal overfishing.
Despite such concerns, a recent study by the United Nations Environment Programme – World
Conservation Monitoring Centre (Corrigan, 2009) suggests that in comparison to other regions of the
world “the Pacific is relatively healthy”. While this may be true, proactive actions on the part of PICT
can help curb the decline and continue to generate economic benefits for their people and the global
community at large.
7. Governance of the Pacific Ocean – PICTs and beyond
For the Pacific islanders to sustain their lifestyles and livelihoods, and sustain the wider economic
benefits to the global community at large, particular attention needs to be paid to addressing the
importance as well as the potential costs of inaction against the key threats to the health of the Pacific
Ocean and associated coastal and deep sea sub ecosystems.
While some of these threats originate within countries – population pressures, over fishing, habitat
destruction, coastal mining, and land based pollution – others, such as shipping and climate change cut
across national borders. Furthermore, key players in tourism and offshore fisheries are mostly foreign
nationals and large multinational corporations in deep-sea mining explorations even if they occur

66 | I U C N O c e a n i a
within PICT jurisdiction. Their actions need to be better regulated and controlled, if the Pacific Island
countries and territories are to achieve sustainable development.
Realising the wider geographical dimension of many of the threats to the Pacific Ocean, and the need to
take a broader spatial approach, several “oceanscape” level efforts have recently been initiated,
including the Coral Triangle Initiative (www.cti-secretariat.net/about-cti/about-cti accessed on
6.4.2010) and the Micronesian Challenge (http//www.micronesiachallenge.org, accessed on 6.4.2010)
see Box 4. Additionally, the Kiribati government in 2009 called for the Pacific Oceanscape initiative to
focus on integrated marine and terrestrial protected area development, conservation and sustainable
development (http://www.marinenz.org.nz/documents/pacific_oceanscape.pdf, accessed on
28.06.2010).
Most recently, the Pacific Islands Leaders approved a concept for a Pacific Oceanscape and have called
for the development of a framework to build on the Pacific Islands Regional Ocean Policy (PIROP) as a
priority area for attention under the Pacific Plan. The PIROP and its Integrated Strategic Action Plan, as
seen earlier, cover a broad range of issues related to ocean management, all of which are still highly
relevant today and require attention for implementation. A stock take of progress of PIROP
implementation highlighted significant progress has been made in most areas. However this progress
was not attributed to the concerted implementation of PIROP, but more as a result of the work
programmes of respective regional organisations and direction from their governing councils. The lack
of a strong integrated governance and dedicated partnership mechanism to facilitate a coordinated and
holistic approach to the implementation of PIROP was acknowledged as a significant contributing factor
to this ad hoc implementation of the policy.
Many of the threats to the Pacific Ocean, as well as the capacity required to effectively address these
threats, come from countries outside the scope of PIROP and the Framework for Pacific Oceanscape. To
Box 4. CTI and Micronesia Challenge
The Coral Triangle Initiative (CTI) with PNG and the Solomon Islands as PIC partners, is aiming to conserve the coral
triangle, place of highest global marine biodiversity, against common threats like over-fishing, destructive fishing
methods, sedimentation and climate change effects by attracting high-level political commitments and implementation by
governments and support from private sector, international agencies and civil society. Processes are developed for the
development and implementation of Regional Action Plans under the CTI.
The Micronesia Challenge including the Federated States of Micronesia, the Republic of the Marshall Islands, the
Republic of Palau, Guam, and the Commonwealth of the Northern Marianas Islands aims to preserve the natural
resources against severe threats of climate change, deforestation, unsustainable fishing and invasive species by
effectively conserving at least 30% of the near-shore marine resources and 20% of the terrestrial resources across
Micronesia by 2020. Key approaches are to secure continues sources of funding while each jurisdiction is developing
their own strategies for implementation focusing on protected area management.
67 | I U C N O c e a n i a
this end, the importance of engaging and building partnerships with these entities has recently been
emphasised (Pacific Islands Forum Secretariat 2010). The need to organise a trans-Pacific response to
address key threats to the Pacific Ocean has taken on an even greater urgency in the face of climate
change. This is also consistent with the concept of the Pacific Ocean 2020 Challenge which calls for urgent
and unified action by the Pacific governments and communities to address the Pacific Oceans
environmental threats in a decisive manner.
Way Forward
The Scientific Consensus Statement on the Pacific Ocean Synthesis have attracted 400 signatures from
scientists and experts. While this has been important in raising the profile of the issues about the health
of the Pacific Ocean, the more critical challenge is to obtain commitment from Leaders from the Pacific
Rim and Island nations to act urgently and collectively in addressing the threats. Those who control
public purses need urgently to adopt a governance framework that focuses on the Pacific Ocean as a
whole and adopt a governance system that transcends sovereign boundaries, jurisdictions, and
mandates. There is an urgent need for Leaders to agree to develop and implement coordinated
multidimensional, partnership-based, and multi-pronged actions across the Pacific Ocean. Ocean-wide
action is required to strengthen the governance over the Pacific Ocean across all levels, national,
regional, and across all Pacific Rim and PICT.
In mobilising high level political support, several recent experiences in dealing with global and regional
issues, such as climate change, the PRIOP implementation, Coral Triangle Initiative, and the
Micronesian Challenge, have highlighted many lessons. Included among them are 1) the importance of
adopting a stakeholder based political process supported by technically robust information in getting
political buy-in, and 2) broad-based ownership of the process as well as the solutions.
The proposed Pacific Ocean 2020 Challenge is, as a first step, focussing on getting the political buy-ins
for taking a Pacific Ocean-wide approach to tackling the challenges across all governance levels. This
process needs to be supported by robust information. The Stern Report, and developments following
the release of the report - debate and seriousness about climate change mitigation and adaptation
strategies - have particularly highlighted the role and relevance of translating scientific information into
economic values and arguments regarding the ‘cost of inaction’ in appealing to the conscience of
decision-makers. Similarly, TEEB report has generated discussion and debate and focussed peoples
attention on the economic benefits draw attention to the global economic benefits of biodiversity, to
highlight the growing costs of biodiversity loss and ecosystem degradation, and to draw together
expertise from the fields of science, economics and policy to enable practical actions moving forward.
Similar types of approaches would be required if the hearts and minds of the Leaders of the PICT and

68 | I U C N O c e a n i a
the Pacific Rim Countries are to be won over and convinced about the need for urgent action. The next
step is to identify the economic costs to the Pacific, and to the world, if the current trend in declining
Pacific Ocean conditions continues. This calls for a compelling body of evidence on the economic costs
of inaction and the benefits of investing in improved management of the Pacific Ocean. This review has,
however, demonstrated that this is not going to be easy, as even the most basic of the information about
the economic value of the Pacific Oceans to the PICTs is not readily available. Where information is
accessible, these are either incomplete, reflect different definitions of economic values or require
extensive further analysis.
Similarly, to identify strategic points of intervention, it is critical to understand the current governance
arrangements in the Pacific Rim countries and PICTs, and strengths of current regional and
international governance instruments that guide and support national efforts. This needs to be done
systematically to identify priority actions to move onto a sustainable path.
In conclusion, an effort needs to be made to engage with PICT and the Pacific Rim Countries at a
political level, while a parallel program of work needs to help produce a “Stern like” report on the
Pacific Ocean, “Pacific Ocean Report - The Cost of Inaction”. The Report will provide empirical
information supporting the call for action and the basis for policy briefs and advocacy materials, to
better manage the Pacific Ocean. Secondly, a review of the national, sub-regional and Pacific Ocean-
wide review of current management of economic activities, ecosystems, and the Ocean ecosystem as
a whole is required. Ultimately it will be upto the leaders of the Pacific nations, their politicians and
governments, and all key stakeholders including the public at large, to take this information and act
for the sustainability of the Pacific Ocean.

69 | I U C N O c e a n i a
References
Adams, T., J. Bell, et al. (2001). Current status of aquaculture in the Pacific Islands. Aquaculture in the Third Millennium Technical Proceedings of the Conference on Aquaculture in the Third Millennium, Bangkok, Thailand, NACA, Bangkok and FAO, Rome.
ADB (2007). Ocean voyages - Shipping in the Pacific. Pacific Studies Series. Manila, ADB: 148. ADB (2009). Kiribati social and economic report 2008. Pacific Studies Series. Manilla, ADB. Allcock, A. (2006). Pacific 2020 Background Paper: Tourism, Commonwealth of Australia. Ambroz, A. (2009). Economic Costs of January 2009 Ba Floods. SOPAC Technical Report 425. Suva, Fiji, SOPAC. Ambroz, A. (2009). Tuvalu technical report: Household aggregate mining on Funafuti, SOPAC Project Report
132, SOPAC. Andréfouët, S., C. Chauvin, et al. (in Press). Atlas: Pacific Ocean Coral Reefs. Millenium Coral Reef Mapping
Project Pacific. Noumea. Asian Development Bank. (2009). "Key Indicators for Asia and the Pacific 2009." from www.adb.org/statistics. Barclay, K. and I. Cartright (2007). Capturing wealth from tuna: case studies from the Pacific, ANU E press, Asia
Pacific Press. Bell, J. D., M. Kronen, et al. (2009). "Planning the use of fish for food security in the Pacific." Marine Policy 33(1):
64-76. Berthe, F. C. J. and J. Prou (2007). The French Polynesian experience. Rome, FAO : 120 p, In : M. G. Bondad-
Reantaso, S. E. McGladdery & F. C. Berthe. Pearl oyster health managment : a manual FAO Fisheries Technical Paper. Nr 503, .
Boyer, T. and S. Polasky (2004). "Valuing urban wetlands: a review of nonmarket valuation studies." Wetlands 24: 744-755.
Braat, L., P. t. Brink, et al. (2008). COPI: The cost of policy inaction in monetary terms. L. Braat and P. t. Brink. Busuioc, A., A. Chen, et al. (2007). Regional Climate Projections. Chapter 11. In: Climate Change 2007: Synthesis
Report. Geneva, Switzerland, Contribution of Working Groups I, II and III to the Fourth Assessment Report of the Intergovernmental Panel on Climate Change, IPCC.
Center for Ocean Solution (2009). Ecosystems and People of the Pacific Ocean - Threats and Opportunities for Action: A Scientific Consensus Statement, The Woods Institute for the Environment at Stanford University.
Center for Ocean Solution (2009). Pacific Ocean Synthesis, The Woods Institute for the Environment at Stanford University.
Cesar, H. (1996). Economic analysis of Indonesian coral reefs. Cesar, H., L. Burke, et al. (2003). The economics of worldwide coral reef degradation. Cesar Environmental
Economics Consulting. Arnheim, The Netherlands. Chape, S. (2006). Review of Environmental Issues in the Pacific Region and the Role of the Pacific Regional
Environment Programme. Workshop and symposium on Collaboration for sustainable development of the Pacific Islands: Towards effective e-learning systems on environment, 27-28 February 2006. Okinawa, Japan.
Chasek, P. S. (2010). Confronting environmental treaty implementation challenges in the Pacific Islands. Pacific Islands Policy 6. Honolulu, East West Centre: 52.
CIA. (2009). "CIA World Factbook." Retrieved 10/06/2009, 2009, from https://www.cia.gov/library/publications/the-world-factbook/geos/KR.html.
Clarke, P., I. Miller, et al. (2008). South Pacific Regional Environmental Law Capacity Building Project. Scoping Report. Gland, Switzerland, IUCN: 24.
Clarke, P., I. Miller, et al. (2008). South Pacific Regional Environmental Law Capacity Building Project. Scoping Report. Gland, Switzerland, IUCN: 24.
Colbert, D. (2000). Cities, seas, and storms - managing change in Pacific island economies. Washington DC, USA, The International Bank for Reconstruction and Development/ The World Bank. Vol. 3.
Commonwealth of Australia (2006). Pacific 2020 - Challenges and opportunities for growth. Costanza, R., O. Perez-Maqueo, et al. (2008). "The value of coastal wetlands for hurricane protection. ." Ambio
37: 241-248. Dalzell, P., T. Adams, et al. (1996). Coastal Fisheries in the Pacific Islands. In: Oceanography and marine biology:
an annual review, 34, 395-531, UCL press.

70 | I U C N O c e a n i a
Danovaro, R., C. Gambi, et al. (2008). "Exponential decline of deep-sea ecosystem functioning linked to benthic biodiversity loss." Current Biology 18(1): 1-8.
De Poorter, M., C. Darby, et al. (2009). Marine Menace - Alien invasive species in the marine environment. Gland, Switzerland, IUCN: 30.
Duncan, R. and H. Nakagawa (2009). Obstacles to economic growth in six Pacific Island Countries, The World Bank: 67.
Energy Current. (2009). "Houston firm looks to Fiji for offshore oil exploration." from http://www.energycurrent.com/index.php?id=2&storyid=18995.
Erry, B., P. Johnston, et al. (2000). Seabed mining: A technical review, Greenpeace Research Laboratories Technical Note 24/2000.
FAO (2004). Report of the Workshop on the Implementation of the 1995 FAO Code of Conduct for Responsible Fisheries in the Pacific Islands: A Call to Action. Nadi, Fiji, 27-31 October 2003. FAO Fisheries Report. No 731. Rome, Food and Agriculture Organisation of the United Nations: 151.
Fiji Islands Bureau of Statistics (2008). Facts and figures. Suva, Fij. Fiji Ministry of Finance and Planning (2008). Tourism projection Fiji '03-'08 Economic and Fiscal Update:
Supplement to the 2009 Budget Address, November 2008, Suva. Forum Fisheries Agency (2009). Economic Outlook and Prospects for the Tuna Fisheries. FFA Ministerial forum
fisheries commitee fifth meeting. Alofi, Niue. Gillett, R. (2007). A short history of industrial fishing in the Pacific Islands. Bangkok, FAO. Gillett, R. (2008). A Study of Tuna Industry Development Aspirations of FFA Member Countries. Honiara, Forum
Fisheries Agency: 70. Gillett, R. (2009). The contribution of fisheries to Pacific island countries and territories. Pacific Studies Series,
draft report prepared for the Asian Development Bank, World Bank, Forum Fisheries Agency, Secretariat of the Pacific Community, and the Australian Agency for International Development, 362 p.
Gillett, R. (2009). Some Thoughts on the Interface between Fisheries and Household Income and Expenditure Surveys in the Pacific Islands. Workshop on Using HIES and Censuses in Fisheries Management, Secretariat of the Pacific Community, Noumea: 5.
Gillett, R. and C. Lightfoot (2001). The contribution of fisheries to the economies of Pacific Island Countries. Pacific Studies Series. Manila, ADB: 242pp.
Gilman, E., H. V. Lavieren, et al. (2006). Pacific Island Mangroves in a Changing Climate and Rising Sea. Nairobi, Kenya, UNEP Regional Seas Reports and Studies No. 179, United Nations Environment Programme, Regional Seas Programme.
Gleason, W. M. (2008). "Companies explore seafloor in advance of next metal rush." Mining Engeneering 60(4): 14-17.
Godden, D. (2010). Valuing Ecosystem Services: a critical review. 54th Annual Conference, Australian Agricultural and Resource Economics Society. Adelaide.
Greer Consulting Services (2007). Kiribati Technical Report: Economic analysis of aggregate mining on Tarawa, SOPAC.
Hajkowicz, S. (2006). "Cost scenarios for coastal water pollution in a small island nation: A case study from the Cook Islands." Coastal Management 34(4): 369-386.
Hajkowicz, S., K. Tellames, et al. (2005). The costs of solid waste pollution to Palau. A Consultancy Report to the Office of Environmental Response and Coordination of the Republic of Palau. Brisbane, Australia, CSIRO Sustainable Ecosystems.
Halfar, J. and R. M. Fujita (2007). "Ecology: Danger of Deep-Sea Mining." Science 316(5827): 987-. Hand, T., D. Davis, et al. (2005). Republic of the Fiji Islands: Fisheries Sector Review Manila, Asian Development
Bank: 95. Hand, T., D. Davis, et al. (2005). Republic of the Fiji Islands: Fisheries Sector Review. Technical Assistance
Consultant’s Report, Asian Development Bank: 95. Hanich, Q. and M. Tsamenyi (2006). EEZs, distant water fishing nations and the Pacific SIDS: Who really gets all
the fish? . Sharing the fish conference. Perth, Western Australian Department of Fisheries. Hay, J. E. (2008). Preparedness, planning and prevention: Assessment of national and regional efforts to reduce
natural disaster and climate change risks in the Pacific. A report prepared for the World Bank, GFDRR, The World Bank.
Herr, D. and G. R. Galland (2009). The Ocean and Climate Change. Tools and Guidelines for Action. Gland, Switzerland, 72pp, IUCN.
Hoegh-Guldberg, O., H. Hoegh-Guldberg, et al. (2000). Pacific in Peril - Biological, Economic and Social Impacts of Climate Change on Pacific Coral Reefs, Greenpeace Australia.
Holland, P. (2009). Economic Costs of January 2009 Nadi Floods. SOPAC Technical Report 426. Suva, Fiji, SOPAC.
Howes, S. and M. Morris (2008). Pacific Economic Survey 2008. Canberra, Commonwealth of Australia.

71 | I U C N O c e a n i a
Howorth, R. (1997). Review of non-living resources and threats in the Pacific region. Suva, Fiji, SOPAC Technical Report 247, SOPAC.
International Maritime Organization (2008). International Shipping and World Trade - Facts and figures. Kauppi, P., R. Sedjo, et al. (2001). Technological and economic potential of options to enhance, maintain, and
manage biological carbon reservoirs and geo-engineering. Chapter 4. IN: Intergovernmental Panel on Climate Change. Climate Change 2001: Mitigation. Geneva, A report of Working Group III of the Intergovernmental Panel on Climate Change.
Kinch, J. and A. Teitelbaum (2008). Proceedings of the Sub-regional Workshop on the Marine Ornamental Trade in the Pacific, Noumea, New Caledonia, SPC Aquaculture Technical Papers.
Kronen, M., S. Sauni, et al. (2006). "Reef and Lagoon Fish Prices: The Transition fromTraditional to Cash-Based Economic Systems-CaseStudies from the Pacific Islands." American Fisheries Society Symposium 587-604.
Lal, N. P., K. Saloa, et al. (2006). Economics of liquid waste management in Funafuti, Tuvalu. IWP-Pacific Technical Report No. 36, International Waters Project, SPREP.
Lal, P. and A. Cerelala (2005). Financial and economic analysis of wild harvest and cultured live coral and live rock in Fiji Suva, FSPI.
Lal, P. and J. Kinch (2005). Financial assessment of the marine trade of corals in Solomon Islands. Suva, A report prepared for FSPI, SPREP and the Government of the Solomon Islands.
Lal, P., J. Kinch, et al. (2009). Review of economic and livelihood impacts of climate change in Melanesia: Adaptation startegies and institutional and human capacity development.
Lal, P. and L. Takau (2006). Economic costs of waste in Tonga IWP-Pacific Technical Report. Apia, IWP-Tonga; SPREP; Pacific Islands Forum Secretariat: 57p.
Lal, P. N. (1990). Conservation or conversion of mangroves in Fiji - an ecological economic analysis. Occasional Paper. Honolulu, Environment and Policy Institute, East West Centre. 11: 108.
Lal, P. N. (2010). "Vulnerability to natural disasters: an economic analysis of the impact of the 2009 floods on the Fijian sugar belt." Pacific Economic Bulletin in press.
Lindsay, S. R., E. Ledua, et al. (2004). Regional assessment of the commercial viability for marine ornamental aquaculture within the Pacific Islands (giant clam, hard and soft coral, finfish, live rock and marine shrimp). Noumea, New Caledonia, Secretariat of the Pacific Community.
Lipton, I. (2008). Mineral Resource Estimate Solwara 1 Project, Bismarck Sea, Papua New Guinea, Prepared for Nautilus Minerals Inc. Golder Associates Pty Ltd.
Martinez, M. L., A. Intralawan, et al. (2007). "The coasts of our world: Ecological, economic and social importance." Ecological Economics 63(2-3): 254-272.
McKenzie, E., A. Woodruff, et al. (2006). Economic assessment of the true costs of aggregate mining in the Majuro Atoll Republic of the Marshall Islands. SOPAC Technical Report Suva, SOPAC: 71p.
Meyrick and Associates (2007). Regional: Pacific Regional Transport Analysis, ADB Technical Assistance Consultant’s Report.
Milne, S. (2005). The Economic Impact of Tourism in SPTO Member Countries prepared for the South Pacific Tourism Organisation, Tourismworx Ltd & New Zealand Tourism Research Institute.
Morgan, C. L., N. A. Odunton, et al. (1999). Synthesis of Environmental Impacts of Deep Seabed Mining. Marine Georesources & Geotechnology, Taylor & Francis Ltd. 17: 307-356.
Murton, B. J. (2001). "A global review of non-living resources on the extended continental shelf " Brazilian Journal of Geophysics 18(3): 281-306.
National Oceans Economics Program (2009). State of the U.S. Ocean and Coastal Economies: Coastal and Ocean Economic Summaries of the Coastal States.
Newton, K., I. M. Côté, et al. (2007). "Current and Future Sustainability of Island Coral Reef Fisheries." Current Biology 17(7): 655-658.
O'Connor, S. (2008). Pacific IslandsWhaleWatch Tourism - A RegionWide Review of Activity. E. L. Associates, IFAW.
O'Connor, S. (2008). Whale Watching Tourism in the Kingdom of Tonga - Whale and Dolphin Watching in the Pacific Islands Region Phase 2: Country Case Study, IFAW.
Pacific Islands Forum Secretariat (2010). Update of progress made in the development of the Framework for Pacific Oceanscape. P. P. A. C. (PPAC). Suva, Fiji. PIFS (10) PPAC - 15.1: 3.
Pratt, C. and H. Govan (2010). Our Sea of Islands - Our Livelihoods - Our Oceania Framework for a Pacific Oceanscape. Suva, Pacific Islands Forum Secretariat: 13.
Roberts, S., R. Aguilar, et al. (2005). Deep sea life: On the Edge of the Abyss, Oceana. Rodd, J. (1993). New petroleum potential in Fiji and initiatives to attract oil companies to invest in exploration.
SOPAC Miscellaneous Report 145. Suva, Fiji, Prepared for: South Pacific Applied Geoscience Commission (SOPAC) Hydrocarbon Program, Fiji Project: FJ.21.
Scourse, A. and C. Wilkins (2009). "Impacts of modernisation on traditional food resource management and food security on Eauripik atoll, Federated States of Micronesia." Food Security 1: 169–176.

72 | I U C N O c e a n i a
SOPAC. (2009). "SOPAC member countries make their submissions to the United Nations for extended seabed territories." Retrieved 25/08/2009, from http://www.sopac.org/tiki-index.php?page=Extended+Continental+S.
Spalding, M. D., C. Ravilious, et al. (2001). World Atlas of Coral Reefs. Prepared at the UNEP World Conservation Monitoring Centre. University of California Press,Berkeley,USA.
SPC. (2006). "Regional Maritime Programme - Strategic directions." Retrieved 22.7.2009, 2009, from http://www.spc.int/maritime/index.php?option=com_content&task=view&id=14&Itemid=34.
SPC. (2009). "PRISM - Pacific regional information system." Retrieved 15/06/2009, from http://www.spc.int/prism/.
Stern, N. (2007). The economics of climate change - The Stern review. London, United Kingdom, HM Treasury Office.
Sukhdev, P. (2008). The economics of ecosystems and biodiversity (TEEB) - an interim report, European Union. Sykes, H. and C. Reddy (2007). Waitabu Marine Park biological and economic report 2005, 2006 and 2007.
Waitabu Village, Taveuni Island, Fiji, Resort Support. The Allen Consulting Group (2004). The economic contribution of Australia's marine industries. Canberra,
Report to the National Oceans Office. Thomas, L. (2007). Money grows on trees - Valuing and Sustaining Natural Resources in Pacific Island
Countries. Report Prepared for TNC, PIFS and SPREP TNC Pacific Island Countries Report No 3/07. Tuqiri, S. (2001). Overview of an ocean policy for the Pacific islands. Suva, Council of Regional Organisations in
the Pacific, Maritime Sector Working Group, Secretariat of the Pacific Community. U.S. Geological Survey (2006). Fiji minerals yearbook, U.S. Department of the Interior. UNESCAP (2008). Economic and social policies to address labour market trends in Pacific island developing
countries and territories Bangkok, Special Body on Pacific Island Developing Countries. UNWTO (2005). Tourism receipts, UNWTO. UNWTO (2006). Tourism market trends, 2006 Edition, Annex, World Tourism Organization. van Beukering, P., W. Haider, et al. (2006). The economic value of the coral reefs of Saipan, Commonwealth of
the Northern Mariana Islands. Washington, DC, NOAA: 153pp. van Beukering, P. J. H., W. Haider, et al. (2007). The economic value of Guam’s coral reefs, University of Guam
Marine Laboratory, Technical Report 100. Vanuatu Environment Unit (2007). Socioeconomic study of the Crab Bay villages of Central Malekula, Vanuatu,
Volume 1: Overview. IWP-Pacific Technical Report No. 46. Apia, Samoa, International Waters Project, SPREP.
Vunisea, A. (1997). "Women’s fishing participation in Fiji." SPC Women-in-Fisheries Information Bulletin 1: 10-13.
Williams, P. and P. Terawasi (2008). Overview of tuna fisheries in the Western and Central Pacific Ocean - including economic conditions - 2007 Western and Central Pacific Fisheries Comission - Scientific Committee 4th regular session. Port Moresby, Papua New Guinea.
World Bank (2000). Cities, Seas and Storms- Managing Change in Pacific Island Economies: Vol. 3: Managing the use of the ocean. Washington, D.C., Papua New Guinea and Pacific Islands Country Unit. The World Bank. IV, Adapting to Climate Change.
World Resource Institute. (2007). "Earth Trends: The environmental information portal." Retrieved 01/11/2009, from http://earthtrends.wri.org/searchable_db/index.php?theme=5.
WTTC (2009). Travel and tourism economic impact 2009 - Fiji. London, World Tourism and Travel Council. WTTC (2009). Travel and tourism economic impact 2009 - Kiribati. London, World Tourism and Travel Council. WTTC (2009). Travel and tourism economic impact 2009 - Solomon Islands. London, World Tourism and
Travel Council. WTTC (2009). Travel and tourism economic impact 2009 - Tonga. London, World Tourism and Travel Council. WTTC (2009). Travel and tourism economic impact 2009 - Vanuatu. London, World Tourism and Travel
Council. Yeeting, B. and K. Pakoa (2005). "The management challenges of Vanuatu’s developing marine aquarium fish
trade." SPC Live Reef Fish Information Bulletin 13: 30-31.

73 | I U C N O c e a n i a
Appendices
Appendix I: Tourist arrivals to PICT between 1990 and 2008
PICT 1990 1995 2000 2004 2005 2006 2007 2008
CNMI 426,000 669,000 517,000 n.a. 498000 435,000 n.a. n.a.
Cook Islands 34,000 48,000 73,000 83,333 88,405 92,082 97,019 94,184
Fiji 279,000 318,000 294,000 502,765 549,911 545,168 539,255 582,602
French Polynesia 132,000 172,000 252,000 211,893 208,067 221,549 218,241 196,496
Guam 780,000 1,362,000 1,287,000 n.a. 1,228 1,212 n.a. n.a.
Kiribati 3,000 4,000 5,000 3,404 4,137 4,406 4,709 3,871
Marshall Is 5,000 6,000 5,000 n.a. n.a. 6,000 n.a. n.a.
New Caledonia 87,000 86,000 110,000 99,515 100,412 102,198 103,363 103,672
Niue 1,000 2,000 2,000 2,558 2,793 3,008 3,463 4,750
Palau 33,000 53,000 58,000 n.a. 86,000 86,000 n.a. n.a.
PNG 41,000 42,000 58,000 59,013 69,251 77,731 104,122 114,182
Samoa 48,000 68,000 88,000 98,155 101,807 115,882 122,250 121,578
Solomon Islands 9,000 12,000 n.a. 11,116 12,533 11,482 13,748 16,264
Tonga 21,000 29,000 35,000 41,208 41,862 39,451 46,040 49,400
Tuvalu 1,000 1,000 1,000 n.a. n.a. n.a. n.a. n.a.
Vanuatu 35,000 44,000 58,000 61,454 62,082 68,179 81,345 90,654
Total 1,936,990 2,917,995 2,843,000 1,174,414 1826488 1,809,348 1,333,555 1,377,653

74 | I U C N O c e a n i a
Appendix II: Merchant shipping and fleet in the PICTs
PICT Ports/
Terminals
Merchant marine [Nr of ships]
Capacity of merchant fleet
[mt]
Nr of foreign owned ships
Export of merchandise*
[US$] Ship types
American Samoa 1 n.a. n.a. n.a. n.a. n.a.
CNMI 2 n.a. n.a. n.a. n.a. n.a.
Cooks 1 26 n.a. 17 12,878,328 cargo 14, chemical tanker 1,
petroleum tanker 1, refrigerated cargo 8, roll on/roll off 2
Fiji 2 9 23,000 1 823,280,844 passenger 3, passenger/cargo
4, roll on/roll off 2
French Polynesia 1 15 n.a. 2 172.874.984 cargo 6, passenger 2,
passenger/cargo 5, refrigerated cargo 1, roll on/roll off 1
FSM 1 3 9,000 n.a. n.a. cargo 1, passenger/cargo 2
Guam 1 n.a. n.a. n.a. 64,098,893 n.a.
Kiribati 1 43 4,000 31 30,524,889 bulk carrier 2, cargo 18,
chemical tanker 3, petroleum tanker 6, refrigerated cargo 14
Marshall 1 1,049 15,167 990 n.a.
barge carrier 1, bulk carrier 284, cargo 71, carrier 1, chemical
tanker 191, combination ore/oil 4, container 188, liquefied gas
47, passenger 5, passenger/cargo 1, petroleum tanker 221, refrigerated cargo
13, roll on/roll off 14, specialized tanker 2, vehicle carrier 6
Nauru 1 n.a. n.a. n.a. n.a. n.a.
New Cal 1 2 n.a. n.a. n.a. cargo 1, passenger/cargo 1
(2008)
Niue none n.a. n.a. n.a. n.a. n.a.
Palau 1 n.a. n.a. n.a. n.a. n.a.
Pitcairn 1 n.a. n.a. n.a. n.a. n.a.
PNG 5 21 73,000 6 2,858,324,842 bulk carrier 2, cargo 17,
petroleum tanker 2
Samoa 1 1 10,000 1 19,904,000 cargo 1
Solomon 3 n.a. 7,000 n.a. 165,597,566 n.a.
Tokelau 1 n.a. n.a. n.a. n.a. n.a.
Tonga 1 13 170,000 4 n.a. bulk carrier 1, cargo 8, carrier 1, liquefied gas 1, passenger/cargo
1, refrigerated cargo 1
Tuvalu 1 80 61,000 63 n.a.
bulk carrier 7, cargo 30, chemical tanker 14, container 2, passenger 2, passenger/cargo
1, petroleum tanker 22, refrigerated cargo 1, specialized
tanker 1
Vanuatu 3 54 1,618,000 54 44,973,357 bulk carrier 1, cargo 8, carrier 1, liquefied gas 1, passenger/cargo
1, refrigerated cargo 1
Wallis/Futuna 2 8 n.a. 8 n.a. chemical tanker 2, passenger 6
Source: CIA factsheet 2008 & ESCAP 2005 (capacity) *free on board (fob) at 2008 constant market prices

75 | I U C N O c e a n i a
Appendix III: Ratification status of MEAs in PICs
Country IWC Ramsar WHC CITES CMS UNCLOS CBD ITPGR
Cook Islands - - - - -
Fiji - -
Kiribati - -
Marshall Islands - - s
FSM - - - - -
Nauru - - - - -
Niue - - - - -
Palau - -
PNG - -
Samoa - -
Solomon Islands - - -
Tonga - - - -
Tuvalu - - - - -
Vanuatu - - - -
Source: (Clarke, Miller et al. 2008); Key: = signed and ratified; s = signed but not ratified
Appendix IV: Ratification status of environmental conventions in PICs
Country Apia
Convention
SPFF
Convention
Noumea
Convention
Protocol 1
Dumping
Protocol 2
Emergencies Waigani PIROP
Cook Islands
Fiji
Kiribati
Marshall
Islands
FSM
Nauru s
Niue
Palau s s s s
PNG s
Samoa
Solomon
Islands
Tonga
Tuvalu s s s
Vanuatu s
Source: (Clarke, Miller et al. 2008); Key: = signed and ratified; s = signed but not ratified
Copyright © 2022 FDOKUMEN