Contents - The Pacific Community
252
-
Upload
khangminh22 -
Category
Documents
-
view
1 -
download
0
Transcript of Contents - The Pacific Community


ii
Contents PREFACE .................................................................................................................................. v
FOREWORD ............................................................................................................................ vi
SUMMARY OF MAIN INDICATORS .................................................................................. vii
EXECUTIVE SUMMARY ....................................................................................................... x
MAP OF VANUATU .............................................................................................................. xv
1. INTRODUCTION ................................................................................................................. 1
1.1 Geographic setting ........................................................................................................... 1
1.2 Background to report ....................................................................................................... 1
2. POPULATION SIZE, TREND, DISTRIBUTION, STRUCTURE and URBANIZATION 2
2.1 Population size and trend ................................................................................................. 2
2.2 Population distribution ..................................................................................................... 6
2.3 Population density ............................................................................................................ 7
2.4 Population structure ......................................................................................................... 9
2.5 Urbanization ................................................................................................................... 18
2.5.1 Urban growth .......................................................................................................... 19
2.5.2 Process of urbanization ........................................................................................... 20
2.5.3 Degree of urbanization ............................................................................................ 20
2.5.4 Tempo of urbanization ............................................................................................ 22
3. DEMOGRAPHIC COMPONENTS .................................................................................... 24
3.1 Fertility ........................................................................................................................... 24
3.1.1 National estimates ................................................................................................... 24
3.1.2 Sub national estimates............................................................................................. 32
3.1.3 Proximate determinants of fertility ......................................................................... 34
3.2 Mortality ........................................................................................................................ 40
3.2.1 National level estimates .......................................................................................... 40
3.2.2 Sub national estimates............................................................................................. 53
3.2.3 Proximate determinants of mortality ...................................................................... 58
3.3 Migration........................................................................................................................ 61
3.3.1 Internal migration .................................................................................................... 61
3.3.2 International migration ............................................................................................ 68
4. SOCIAL CHARACTERISTICS .......................................................................................... 70
4.1 Marital status .................................................................................................................. 70
4.2 Religion .......................................................................................................................... 76
4.3 Ethnic origin................................................................................................................... 78
4.4 Health ............................................................................................................................. 80

iii
4.4.1 Disability ................................................................................................................. 80
4.4.2 Smoking and drinking habits .................................................................................. 84
4.5 Educational characteristics ............................................................................................. 89
4.5.1 School enrollment ................................................................................................... 89
4.5.2 Educational attainment ............................................................................................ 93
4.5.3 Literacy and language ability .................................................................................. 95
4.6 Internet use ................................................................................................................... 100
4.7 Labour market activity ................................................................................................. 101
4.7.1 Introduction ........................................................................................................... 101
4.7.2 Economic activity ................................................................................................. 103
4.7.3 Labour force participation rate, employment–population ratio, and unemployment rate.................................................................................................................................. 108
4.7.4 Employment status ................................................................................................ 117
4.7.5 Employed population by industry group ............................................................... 118
4.7.6 Employed population by occupational group ....................................................... 120
4.7.7 Population working overseas ................................................................................ 122
5. HOUSEHOLD CHARACTERISTICS .............................................................................. 124
5.1 Household size ............................................................................................................. 124
5.2 Household composition ............................................................................................... 127
5.3 Household language ..................................................................................................... 127
5.4 Household income ....................................................................................................... 128
5.5 Amenities and capital goods ........................................................................................ 130
5.5.1 Private households by housing and land tenure .................................................... 130
5.5.2 Private households by living quarters ................................................................... 131
5.5.3 Private households by age of dwelling ................................................................. 132
5.5.4 Private households by number of rooms ............................................................... 133
5.5.5 Private households by construction material used for dwelling ........................... 134
5.5.6 Private households by water source for drinking and washing ............................. 136
5.5.7 Private households by main energy source for lighting and cooking ................... 138
5.5.8 Private households by main toilet facility ............................................................. 139
5.5.9 Private households by means of communication .................................................. 140
5.5.10 Private households by main means of waste disposal ........................................ 142
5.5.11 Private households involved in agricultural cash crop and fisheries activities ... 143
5.5.12 Private households owning or raising livestock .................................................. 147
5.5.13 Private households and availability of various household items ........................ 150
5.6 Household bednets ....................................................................................................... 159
6. POPULATION PROJECTIONS ....................................................................................... 160

iv
6.1 National projections ..................................................................................................... 160
6.2 Sub-national projections .............................................................................................. 176
7. IMPLICATIONS OF DEMOGRAPHIC TRENDS .......................................................... 186
7.1 Population dynamics .................................................................................................... 186
7.1.1 Growth rate ........................................................................................................... 186
7.1.2 Fertility .................................................................................................................. 186
7.1.3 Mortality ............................................................................................................... 187
7.1.4 Internal migration .................................................................................................. 187
7.1.5 International migration .......................................................................................... 188
7.1.6 Population projections .......................................................................................... 188
7.2 Crosscutting issues ....................................................................................................... 189
7.2.1 Vital statistics ........................................................................................................ 189
7.2.2 The environment ................................................................................................... 189
7.2.3 Households ............................................................................................................ 190
7.2.4 Health services and well-being ............................................................................. 190
7.2.5 Disabilities ............................................................................................................ 192
7.2.6 Education .............................................................................................................. 192
7.2.7 Economic activity and labour market ................................................................... 193
7.2.8 Communication and internet use .......................................................................... 194
7.2.9 Good governance .................................................................................................. 194
GLOSSARY .......................................................................................................................... 195
APPENDICES ....................................................................................................................... 197


Honorable Moana Carcasses CalosilMinister of Finance and Economic ManagementRepublic of VanuatuMay, 2011

vii
SUMMARY OF MAIN INDICATORS
Indicator Vanuatu Urban Rural Torba Sanma Penama Malampa Shefa Tafea
Total population 234,023 57,195 176,828 9,359 45,855 30,819 36,727 78,723 32,540 Males 119,091 29,618 89,473 4,727 23,623 15,543 18,446 40,550 16,202 Females 114,932 27,577 87,355 4,632 22,232 15,276 18,281 38,173 16,338
Average annual population growth 2.3 3.5 1.9 1.9 2.4 1.5 1.2 3.7 1.1
people/km2) 19 11 11 26 13 52 20
Urbanization Urban population 57,195 - - - 13,156 - - 44,039 -
Per cent urban (%) 24.4 - - - 28.7 - - 55.9 -
Urban growth rate (%) 3.5 - - - 2.0 - - 4.1 -
Households Number of private households 47,373 11,606 35,767 1,766 9,213 6,620 7,991 15,930 5,853
Average household size (number of people per household) 4.8 4.8 4.8 5.2 4.8 4.5 4.5 4.8 5.5
Number of institutions 209 73 136 11 66 26 23 76 7
Population structure Number of children (<15 years) 90,973 18,065 72,908 3,987 18,376 12,739 14,675 26,092 15,104
Youth population (15-24 years) 45,423 13,646 31,777 1,728 9,058 5,339 6,210 17,734 5,354
Population aged 25-59 years 83,821 23,380 60,441 3,063 16,071 10,377 12,958 31,082 10,270
Older population (60 years and 13,806 2,104 11,702 581 2,350 2,364 2,884 3,815 1,812
Median age 20.5 22.8 19.5 18.7 19.6 19.3 20.4 22.6 17.1
Dependency ratio (15-59) 81 54 92 95 82 96 92 61 108
Sex ratio 104 107 102 102 106 102 101 106 99
Mean age at first marriage (SMAM) 23.9 24.8 23.6 24.0 23.5 23.7 24.4 24.4 22.9 Males 25.5 26.4 25.0 25.5 25.1 25.6 25.9 25.9 23.9 Females 22.5 23.0 22.2 22.7 22.1 21.9 23.1 22.8 22.1
Labour force Employed population (number) 42,295 18,016 24,279 716 7,596 4,887 4,710 22,091 2,295 Males 25,916 10,883 15,033 498 4,833 2,913 2,920 13,302 1,450 Females 16,379 7,133 9,246 218 2,763 1,974 1,790 8,789 845
Subsistence workers (number) 41,877 1,996 39,881 2,977 9,788 6,695 8,274 6,090 8,053 Males 21,942 1,131 20,811 1,479 4,979 3,361 4,321 3,569 4,233 Females 19,935 865 19,070 1,498 4,809 3,334 3,953 2,521 3,820
Unemployed (number) 4,518 2,798 1,720 7 791 67 312 2,516 825 Males 2,301 1,363 938 6 415 35 154 1,246 445 Females 2,217 1,435 782 1 376 32 158 1,270 380
Labour force participation rate 70.9 61.5 74.4 77.1 73.0 79.6 75.6 63.7 72.3 Males 80.4 70.4 84.3 86.2 81.3 86.3 87.2 73.5 84.1 Females 61.4 52.3 64.8 68.4 64.5 73.0 64.7 53.5 61.6
Employment–population ratio 30.3 47.1 24.0 13.7 28.5 28.0 21.8 43.0 13.2 Males 37.2 55.5 30.1 19.5 35.8 33.7 27.9 50.7 17.7 Females 23.4 38.2 18.0 8.1 21.1 22.4 16.0 34.9 9.3
Unemployment rate (%) 4.6 11.9 2.3 0.2 4.1 0.5 1.9 7.7 6.6 Males 4.1 9.9 2.2 0.3 3.8 0.5 1.7 6.5 6.4 Females 5.2 14.7 2.4 0.1 4.4 0.5 2.2 9.4 6.8

viii
SUMMARY OF MAIN INDICATORS (continued)
Indicator Vanuatu Urban Rural Torba Sanma Penama Malampa Shefa Tafea
Education School enrolment rates of 6–13 year-olds (%) 85.9 90.8 84.8 84.5 86.5 86.8 91.0 88.5 75.8 Males 85.7 90.8 84.6 82.9 86.5 86.4 90.9 88.3 75.5 Females 86.2 90.7 85.2 86.4 86.6 87.1 91.2 88.7 76.1
Proportion (%) of population aged 15 and older with: No education (never been to 16 5 20 25 16 19 13 8 39 Males 14 4 18 21 15 16 12 7 35 Females 18 5 22 29 17 21 14 9 42 Primary education 48 36 53 57 50 53 62 43 38 Males 48 35 53 59 51 53 61 42 40 Females 48 38 52 56 50 52 62 44 35 Secondary education 25 43 18 12 24 21 18 35 14 Males 26 44 19 12 24 22 19 35 15 Females 24 43 17 12 23 20 16 34 13 Tertiary education 4 7 2 1 3 2 2 6 2 Males 4 8 3 1 3 3 2 7 2 Females 3 6 2 1 2 2 2 5 1 Vocational/professional 1 2 1 0 1 1 1 2 1 Males 1 2 1 1 1 1 1 2 1 Females 1 2 1 0 1 0 0 1 1
Literacy rate (15+) 84.8 97.7 80.5 75.1 84.6 81.8 86.0 95.0 63.9 Males 85.7 97.8 81.6 76.5 85.1 83.6 86.3 95.2 66.3 Females 83.9 97.6 79.4 73.8 84.0 80.1 85.7 94.8 61.6
Literacy rate (15-24) 92.1 99.2 89.0 82.5 93.0 88.8 94.3 97.8 76.0 Males 91.6 99.1 88.2 79.7 91.9 87.5 93.0 97.4 77.1 Females 92.7 99.3 89.7 85.2 94.0 90.2 95.6 98.3 75.1
Language ability (as % of population 5 years and older) English 64 82 58 56 63 61 57 79 42 French 37 50 32 20 37 33 38 42 30 Bislama 74 89 68 65 73 69 75 86 48 Other (local) language 50 65 45 32 44 64 33 64 37
Internet use (as % of population 15 years and older) Total 6.7 16.3 3.0 0.7 3.5 3.2 1.8 13.6 2.3 Males 7.3 17.2 3.4 0.5 3.8 3.6 2.0 14.4 2.9 Females 6.0 15.3 2.7 0.8 3.1 2.9 1.5 12.7 1.8
Disability (number of people) Blindness 397 61 336 16 91 60 77 106 47 Males 207 33 174 5 47 37 40 50 28 Females 190 28 162 11 44 23 37 56 19
Deafness 504 62 442 24 94 79 91 127 89 Males 284 33 251 9 52 48 59 65 51 Females 220 29 191 15 42 31 32 62 38
Lameness 1,010 219 791 25 102 149 180 357 197 Males 479 93 386 10 53 67 91 156 102 Females 531 126 405 15 49 82 89 201 95
Senile and/or amnesic 810 146 664 13 85 88 205 241 178 Males 408 75 333 4 46 44 106 111 97 Females 402 71 331 9 39 44 99 130 81

ix
SUMMARY OF MAIN INDICATORS (continued)
Indicator Vanuatu Urban Rural Torba Sanma Penama Malampa Shefa Tafea
Fertility Total Fertility Rate (TFR) 4.1 3.2 4.4 4.5 4.2 4.7 4.2 3.4 5.2 Teenage Fertility Rate (ASFR, 15-19) 66 40 77 116 78 68 74 50 67 Average number of children ever born to women aged 45-49 4.4 3.5 4.7 5.1 4.9 4.8 4.6 3.6 5.2 General Fertility Rate (GFR) 126 101 136 143 130 141 126 106 160 Child-Woman Ratio (CWR) 574 438 628 637 589 661 592 467 740 Mean age at childbearing of mothers (in years) 29.3 29.7 29.2 28.4 29.3 29.2 29.0 29.2 30.2 Mean age at childbearing of fathers (in years) 32.3 33.1 31.9 31.2 32.4 32.9 31.8 32.3 31.9 Annual number of births, 2009 7,335 1,670 5,666 313 1,472 977 1,096 2,298 1,179 Crude Birth Rate (CBR) 31.3 29.2 32.0 33.4 32.1 31.7 29.8 29.2 36.2
Mortality Proportion of children ever born still alive (%) 96.6 97.8 96.3 95.9 96.4 96.4 96.4 97.4 96.1 Males 96.4 97.6 96.1 95.8 96.2 96.1 96.3 97.2 96.0 Females 96.8 98.0 96.5 96.0 96.6 96.6 96.4 97.7 96.2
Proportion of population 60 years and older widowed (%) 18.1 9.7 19.6 27.9 13.7 24.4 18.5 14.6 19.4 Males 9.6 5.4 10.4 15.3 8.2 11.9 9.7 8.1 9.7 Females 27.4 15.4 29.3 42.0 21.1 37.1 27.7 21.7 28.4
Proportion of population orphaned Fathers dead 25.0 23.8 25.4 24.1 23.2 28.0 27.1 24.9 22.9 Mothers dead 19.3 17.7 19.9 19.0 18.6 21.0 21.5 18.9 17.5
Infant mortality rate (IMR) 21 18 22 17 22 27 20 17 30 Males 22 19 23 15 24 24 24 22 24 Females 19 17 21 19 20 29 16 12 36
Child mortality 4 3 4 3 4 6 4 3 8 Males 4 3 4 2 5 5 5 4 5 Females 3 2 4 3 3 7 2 1 10
Under-five mortality 24 20 26 19 26 32 23 19 37 Males 26 22 27 17 29 29 29 26 29 Females 22 19 25 22 23 36 18 13 46
Life expectancy at age 20 (e20) 53.4 54.6 52.8 51.4 53.5 52.0 53.1 53.8 53.8 Males 52.1 54.1 51.1 49.5 52.5 49.3 51.9 52.8 51.8 Females 54.7 55.2 54.5 53.3 54.5 54.7 54.3 54.7 55.8
Life expectancy at birth (e0) 71.1 72.7 70.3 69.2 71.1 68.9 70.9 71.8 70.6 Males 69.6 72.1 68.4 67.2 69.8 66.2 69.2 70.4 69.1 Females 72.7 73.5 72.3 71.2 72.4 71.7 72.6 73.4 72.1
Estimated annual number of deaths, 1,260 196 1,064 58 211 239 251 338 163 Crude death rate (CDR) 5.4 3.4 6.0 6.2 4.6 7.8 6.8 4.3 5.0
Migration Annual net migrants 0 - - -60 0 -260 -400 1,370 -650 Annual net migration rate 0.0 - - -0.6 0.0 -0.8 -1.0 1.6 -1.9

x
EXECUTIVE SUMMARY
The aim of this report is to provide an analysis of the 2009 Vanuatu population census data with a strong emphasis on demographic trends, patterns and levels. The 2009 census determined that the total population was 234,023. This compares with 186,678 people in 1999, and represents an increase of 25.4% or 47,345 people. This population increase represents an average annual growth rate of 2.3%, or an increase of 4,733 people per year. The 2009 census enumerated 119,091 males and 114,932 females, representing a sex ratio of 104 males per 100 females. The urban population was 57,195 people (24.4% of the total population), and includes the towns of Luganville in Sanma with 13,156 people, and Port Vila in the Shefa province with 44,039 people. The average population density for Vanuatu was 19 people/km². This varies widely between provinces. For example, Shefa had 52 people/km², while Torba and Sanma had only 11people/km². The census counted 47,373 private households with 228,883 household members, which represents 4.8 people per household on average. More than 10% (25,451) of all people that live in private households live in households with 10 or more people. The 2009 census data show a net flow of people towards Shefa province from all other provinces during the 5-year period 2004–2009. However, the provinces Penama and Malampa lost the most people due to internal migration. Vanuatu has a young population with a median age of 20.5 years. More than one-third (39%) of the population was younger than 15 years of age, and only 6% were 60 years and older. The age dependency ratio was calculated using the 15–59 year-old age group as the “working age population”. For every 100 people of working age, 81 were in the age dependent category. The number of births was estimated at 7,335 in 2009. This accounts for a crude birth rate (CBR) of 31.3 per 1000. The total fertility rate (TFR) — the average number of births per woman — declined from about 4.6 in 1999 to about 4.1 in 2009. Based on census data for the number of children ever born and still alive, the infant mortality rate (IMR) was estimated at 21; 22 for males and 19 for females. This estimate is lower than the

xi
1999 levels when the IMR was 27 and 26 for males and females – and is thus an improvement in infant mortality rates. Based on the 2009 census data, life expectancies at birth were estimated to be 69.6 and 72.7 years for males and females, respectively, representing an increase compared to 1999 when it was 65.6 and 69.0 years for males and females. Based on the derived life tables, a crude death rate (CDR) of 5.4 per 1,000 was calculated, which were approximately 1,260 deaths in 2009. The estimated mortality indicators show more positive mortality indicators for females than for males, with females expected to live, on average, about three years longer than males. Internal migration during the five year period 2004-2009 was primarily directed towards Shefa province and specifically to the capital Port Vila. The largest numbers of migrants came from Tafea, Malampa and Penama. Net international migration is estimated to be negligible during the intercensal period 1999–2009. Women marry at a younger age than men. The average age at marriage was 25.5 and 22.5 years for males and females, respectively. The Presbyterian religion is with 28% of the total population, the most dominant in Vanuatu. The Anglican is the second largest, with 15%, followed by Seventh Day Adventist (SDA) and the Roman Catholic Church, each representing 12% of the Vanuatu population. The 2009 census questionnaire included a question on smoking and drinking habits of the population aged 15 and older. It was found that 25% of the population smoked cigarettes; 45% of males and 4% of females. The age group that most likely smokes is 20–39 year-olds. In general, more than half of all males aged 20–39 smoke, while only about 5% of females. Furthermore, it was found that 10% of the population drinks alcohol; 17% of males and 3% are females. The age group that most likely consumed alcohols is 20–34 year-olds. In general, about one quarter of all males aged 20–34 drink alcohol, while less than 5% of females. The proportion of the population consuming kava is much larger than that smoking or drinking alcohol. Almost one third of the population consumed kava; 53% of males and 8% of females. The age group that most likely consumed kava is 25–49 year-olds. In general, about two thirds of all males aged 25–49 drink kava, compared to about 10% of females. Data on disabilities indicate that about 12% of the total population reported a disability. The proportion of the population with a disability increases with age, and there is very little difference

xii
in the proportion of males and females with a disability. While about 6% of children younger than 5 years of age had a disability, it was more than half of the population at age 60 years and older. Of those who reported disabilities, about 1,000 people could not walk at all, 800 people reportedly could not remember or concentrate, another 500 were deaf, and 400 people were blind. School enrolment data show that 86% of children in the age group 6–13 years (compulsory school age) were enrolled in schools with female school enrollment rates slightly higher than male enrollment rates. However, school enrollment rates declined rapidly after the age of 13, and about 25% of 14 year-olds were not attending school. After the age of 16, male school enrollment rates were higher than female enrollment rates. In general, enrollment rates were significantly higher in the urban than the rural areas. Data on educational level completed indicate that in 2009, about half of the population 15 years and older had only a primary level education. About one quarter had a secondary level education, and almost 4% of the population aged 15 and older had a tertiary level education. Sixteen per cent had never been to school or only attended preschool. Educational levels were significantly higher of the population in the urban area than in rural areas, and educational levels of males were higher than females. Almost everyone (98%) older than 5 years of age living in the urban areas was literate. This compares to only 80% of the population 5 years and older in rural areas. Literacy rates were slightly higher for males than females. Literacy in Bislama was, with 74% of the population, the highest followed by English (64%), and French (37%). Half of the population is literate in a language other than Bislama, English or French. Literacy was measured by a respondent’s ability to read and write a simple sentence in any language. Literacy rates were over 90% for the population aged 10-34, then it gradually declines after that, and is less than 70% of the population at age 65 years and older. The literacy rate of 15–25 year-olds was 92% and 93% for males and females, respectively. The main language spoken in private households was a local language (63%), 34% speak Bislama, 2% English, and 1% French. The internet was used by 7% of the population aged 15 years and older; this was 16% in the urban areas and only 3% in the rural areas. Although a high percentage (71%) of Vanuatu’s population aged 15 and older was economically active, only a relatively small proportion (30%) received a regular paid income; this group consisted of 37% males and 23% females. Subsistence work — such as growing or gathering produce or fishing to feed families — was the main activity of 32% of Vanuatu’s males and 28% females aged 15 and older. About 39% of the population in rural areas was subsistence workers compared with 5% in the urban centre.

xiii
Only about 4,500 people were categorised as being unemployed, resulting in an unemployment rate of 4.6%; 4.1% for males and 5.2% for females. The unemployment rates are 12% and 2% in the urban and rural areas respectively. Fifty one people did not work because of poor weather conditions, or because they could not afford the transportation costs to work. In addition, 897 people did not work and did not look for work, because they believed that no work was available. Using the international definition of unemployment, these people were not classified as unemployed because they did not look for work and did not indicate that they were available for work. However, if all of these people were included in the unemployed category, the unemployment rate would increase to 5.5%. If subsistence workers were included as part of the unemployed — on the grounds that these people would look for work if they believed cash work was available in their labour market community — the total unemployment level would increase to 46,395 people, or an unemployment rate of 47% (43% for males and 51% for females, and 20% for the urban area and 55% in rural areas). While this assumption would not apply to all individuals in this group, it would likely apply to a proportion of them. Depending on the assumptions a user of these data may wish to use, the resulting unemployment rate would fall somewhere between 4.6% and 47%. The main source of household income was, with 46% of all households, the sale of fish, crops, or handicrafts. However, this was 60% of all rural households compared to only 3% of urban households, where 81% of all households’ main income was wages and/or salary. Only 18% of rural household’s main source of income came from wages and/or salary. Only 11% of urban household were involved in marine fishing activities; this was 39% of rural households. Freshwater fishing activities were carried out by 4% and 21% of urban and rural households respectively. While 81% of all rural households were involved in growing cash crops, only 17% of urban households grow cash crops. Compared to rural households, where 80% of households raised chickens, 57% raised pigs and 39% cattle, only a small proportion of urban households raised any livestock. Regarding the availability of household items, a higher proportion of households in urban areas (compared to rural households) used items such as motor vehicles, gas stoves, fridge or freezer, TV, radio, and computers, as well as DVD decks. However, there are some items more commonly used in rural than in urban areas such as canoes and generators. While 91% of urban households had at least one mobile phone compared to 71% in rural areas, there were 9% of urban households and 2% of rural households that had an internet connection. Information on tenure reveals that 81% of all households owned their dwelling outright, while 12% rented their dwelling, and another 6% resided in their dwelling rent-free. More than 90% of

xiv
households in the rural areas owned their dwelling, while 39% of urban households rented their dwelling. Forty-six per cent of all households obtained their drinking water as piped water. The second most important source was a tank (34%). However, private piped water was only used by a significant proportion of households in the urban areas. Otherwise, 14% of all rural households obtained their water from a river, lake or spring. The most frequently recorded toilet facility used by 47% of all private households was a pit latrine, while 21% of all households used a flush toilet; this percentage was 65% in the urban areas and only 6% in the rural areas. The main source of lighting in Vanuatu was a kerosene lamp, used by an average of 48% of all households, although this percentage was only 6% in the urban areas, compared to 62% in the rural areas. Eighty per cent of urban households were connected to the electricity main grid. This was only 11% of the rural households. The main energy source for cooking for 85% of all households was wood and/or coconut shells. It was almost universally used by the rural households and by slight more than half of the urban households, where 40% use gas as the main energy source for cooking. About 52% of all households dispose of their waste by burning it. In the urban areas two in three households dispose their waste using the authorized waste collection. With respect to the use of insecticide treated bednets, 76% of all households had at least one bednet available; this was 88% of rural households compared to only 38% of urban households. According to population projections prepared for this report, Vanuatu’s population in 2030 will increase to about 370 thousand people, and to 483 thousand in 2050. The population will age, with a decreasing proportion of young people aged 15 and younger, and an increase in people aged 60 and older. The working age population (aged 15–59) will be almost twice as high in 2030 compared to 2009, and will comprise of about 300 thousand people in 2050. The school age population aged 6-13 years will increase from its current level of 40 thousand to 60 thousand. Analysis of census data provides timely and accurate information about demographic trends, patterns and levels. Through census data analysis, governments acquire comprehensive and consistent information about their country’s population structure, population processes and socio-economic characteristics. The population data provided in this report can be an effective tool for planning and policy-making. As policies are aimed at achieving goals in the future, knowledge about future population trends is required. Understanding and anticipating population changes enables development planners to formulate effective programmes in areas as diverse as health, education, environment, poverty reduction, social progress, and economic growth.

xv
MAP OF VANUATU

1
1. INTRODUCTION This report provides an analysis of the Vanuatu 2009 census data and, where data are available, presents comparisons with census data from earlier censuses.
1.1 Geographic setting Vanuatu consists of six provinces: Torba, Sanma, Penama, Malampa, Shefa, and Tafea, spread over an area of 612,300 km² in the South Pacific with a total land area of 12,281 km², stretching from Hiu Island up north to Mathew and Hunter Islands down south. It includes 83 main islands, of which, about 63 are permanently inhabited. Port Vila, the capital, is located on the island of Efate (province of Shefa) which is the most populous island although Santo Island is the biggest island in terms of land area, and is located in Sanma province. Port Vila is 1,288 km due south east of Honiara, Solomon Islands; 1,071 km west of Suva, Fiji; and 2,394 km east of Cairns, Australia (see map).
1.2 Background to report This report is a collaborative effort between the Vanuatu National Statistics Office (VNSO) and the Statistics for Development Programme of the Secretariat of the Pacific Community (SPC). For this purpose, Mr. Andreas Demmke visited the VNSO in Port Vila from 7 March 2011–15 April 2011. Mr Simil Johnson, Vanuatu's Government Statistician, reviewed and commented on the final draft of this report. The report is based on data collected during the population census enumeration, with 16 November 2009 being census day. The detailed tabulations of the 2009 census report are published in ‘2009 National Population and Housing Census, Basic Tables Report, Volume 1, Vanuatu National Statistics Office, Port Vila, Vanuatu (2011). The main purpose of this report is to:
provide a general overview of the vast amount of detailed information that is available from the 2009 census enumerations;
generate interest, curiosity, and a desire for more detailed information, especially for Vanuatu decision-makers and the general public; and
enhance the decision-making process by policy-makers.
Data users are encouraged to contact either the VNSO or SPC for further information. Vanuatu National Statistics Office Private Mail Bag 9019 Port Vila Vanuatu Telephone: +678 22110 or 22111 E:mail: [email protected] http://www.vnso.gov.vu
Statistics for Development Programme Secretariat of the Pacific Community (SPC) BP D5, 98848 Noumea Cedex New Caledonia Telephone: +687 26 20 00 Email: Stats&[email protected] http://www.spc.int/sdp/

2
2. POPULATION SIZE, TREND, DISTRIBUTION, STRUCTURE and URBANIZATION
2.1 Population size and trend The size, growth, and trend of the Vanuatu population are important considerations in the planning process. Urban areas and areas of high population density need to be understood in order to analyze the population data in terms of its demographic dynamics. The total enumerated population of Vanuatu stood at 234,023 in 2009. This is an increase of 47,345 people since the 1999 population census. Figures 1-3 show the population trend from 1967-2009.
Figure 1: Total population size, Vanuatu: 1967–2009
It can be seen from Figure 1 that the population has continuously increased and tripled in size from 78 thousand in 1967 reaching to 234 thousand people in 2009. Population change for the urban and rural and the 6 provinces of Vanuatu all show an increase in population size as presented in Figures 2 and 3. In all these areas the population continues to grow although with various growth rates. Shefa and Sanma province, where the urban centers of Port Vila and Luganville are located, had the fastest population increase.
78
111
142
187
234
0
50
100
150
200
250
1967 1979 1989 1999 2009
Nu
mb
er o
f peo
ple
Th
ou
san
ds
Census year

3
Figure 2: Total Population size by urban rural residence, Vanuatu: 1967–2009
Figure 3: Population size by province, Vanuatu: 1967–2009
8 16
26
40
57
70
95
117
147
177
0
20
40
60
80
100
120
140
160
180
200
1967 1979 1989 1999 2009
Thou
sand
s
Urban Rural
Popu
lati
onSi
ze
Census year
0
10
20
30
40
50
60
70
80
90
Torba Sanma Penama Malampa Shefa Tafea
Popu
lati
on si
ze
Thou
sand
s
Province
1967 1979 1989 1999 2009

4
The fertility, mortality and migration are the three demographic processes that continuously affect the population composition. A closed population, which is a population not affected by migration, experiences change only in the form of natural increase; only births and deaths, affect the population size. However, population growth is usually also shaped by migration. Between the inter-censual periods 1989-1999 the population growth rate was 2.6 percent that declined to 2.3 percent for the period 1999-2009 as shown on Table 1. Despite declining growth rates the population continued to increase faster (Figs.4 and 5). While the average annual population increase during the period 1989-1999 was 4,212 people with a 2.6% growth rate, it increased to 4,729 people annually during the period 1999-2009 despite a lower growth rate of only 2.3%. There were lower growth rates in all provinces during the period 1999-2009 compared to the period 1989-1999, except for Shefa province which recorded a growth rate of 3.7% in 1999-2009 compared to 3.4% growth during 1989-1999. Shefa province had the highest growth rate of all provinces (Fig.6 and Table 1) – a clear sign of internal migration flows towards Shefa and the capital Port Vila. With a 2.3% growth rate, the population of Vanuatu would double in 31 years. Doubling time is an indication about future population size if assuming that the current population growth rate remains constant over time. In such a case, the population would reach 468 thousand people in the year 2040. In that situation, Tafea and Malampa will have their populations doubling in 60 years. Shefa would have the lowest doubling time of just 19 years caused by its growing urban area of Port Vila.
Table 1: Population size, growth rate and doubling time by place of residence, Vanuatu:
1989, 1999 and 2009
1Shefa and Sanma include the urban areas of Port Vila and Luganville
1989 1999 2009 1989-1999 1999-2009 1989-1999 1999-2009 1989-1999 1999-2009 1999 2009
Vanuatu 142,419 186,678 234,023 4,212 4,729 3.0 2.5 2.6 2.3 27 31
Urban 25,870 40,094 57,195 1,354 1,708 5.2 4.3 4.2 3.5 17 20Rural 116,549 146,584 176,828 2,859 3,021 2.5 2.1 2.2 1.9 32 37
Torba 5,985 7,757 9,359 169 160 2.8 2.1 2.5 1.9 28 37
Sanma1 25,542 36,084 45,855 1,003 976 3.9 2.7 3.3 2.4 21 29Penama 22,281 26,646 30,819 415 417 1.9 1.6 1.7 1.5 41 48Malampa 28,174 32,705 36,727 431 402 1.5 1.2 1.4 1.2 49 60
Shefa1 38,023 54,439 78,723 1,562 2,426 4.1 4.5 3.4 3.7 20 19Tafea 22,414 29,047 32,540 631 349 2.8 1.2 2.5 1.1 28 62
(in %) Annual growth rateDoubling
TimeTotal population size
RegionPopulation change
(in numbers)

5
Figure 4: Population change, average annual increase in numbers, Vanuatu: 1967–2009
Figure 5: Average annual population growth rate (%), Vanuatu: 1967–2009
2,857 3,014
4,212
4,729
0
500
1,000
1,500
2,000
2,500
3,000
3,500
4,000
4,500
5,000
1967-1979 1979-1989 1989-1999 1999-2009
Num
ber o
f peo
ple
Intercensal period
3.1
2.42.6
2.3
0.0
0.5
1.0
1.5
2.0
2.5
3.0
3.5
1967-1979 1979-1989 1989-1999 1999-2009
%
Intercensal period

6
Figure 6: Average annual population growth rate (%) by province, Vanuatu: 2009
2.2 Population distribution Information obtained on the place of enumeration was used to describe the distribution of population. Figure 7 displays the proportion of Vanuatu population by province. In 2009, Shefa province had the biggest share of Vanuatu’s population, comprising 34% of the total population. This represents an increase from 1999 when only 29% people had lived there. Hosting the country’s capital urban center is the main reason for this bigger population share in Shefa. Sanma province had the second highest proportion of the total population. In Sanma the second largest urban centre of Vanuatu is located (Luganville).
2.31.9
2.4
1.51.2
3.7
1.1
0.0
0.5
1.0
1.5
2.0
2.5
3.0
3.5
4.0
Vanuatu Torba Sanma Penama Malampa Shefa Tafea
Ave
rage
ann
ual g
row
th ra
te (%
)

7
Figure 7: Population distribution by province (%), Vanuatu: 2009
2.3 Population density Vanuatu has a total land area of 12,281km2. According to the 2009 census, the average population density for Vanuatu was 19 people/km2 an increase from 15 people/km2 in 1999 (Table 2). Population density varied widely throughout the provinces in Vanuatu. Shefa province is the most densely populated due to urbanization. Having just over 50 people/km2 the density represents an increase from 1999 when it had 36 people per square km. Sanma and Malampa both have low densities despite having high populations because of large land areas. Table 2: Population density (number of people/km2) by province, Vanuatu: 1999 and 2009
4%
19%
13%
16%
34%
14%
Torba
Sanma
Penama
Malampa
Shefa
Tafea
1989 1999 2009 1989 1999 2009
Vanuatu 12,281 142,419 186,678 234,023 12 15 19
Torba 867 5,985 7,757 9,359 7 9 11
Sanma 4,262 25,542 36,084 45,860 6 8 11
Penama 1,204 22,281 26,646 30,819 19 22 26
Malampa 2,808 28,174 32,705 36,724 10 12 13
Shefa 1,507 38,023 54,439 78,721 25 36 52
Tafea 1,632 22,414 29,047 32,540 14 18 20
Population DensityProvince
Land area
(km2 )
Total Population

8
Information on the above crude population density has been used to calculate a summary measure - the Gini Concentration (or coefficient) Ratio1 - which indicates how evenly or unevenly the population is distributed over the entire territory of Vanuatu. If the population were evenly distributed in Vanuatu, a given proportion of the country’s area would have the same proportion of its population; that is, 20 percent of Vanuatu’s area would have 20 percent of the population. In reality, a country’s population is never evenly distributed over the land surface area, hence, the cumulative proportion of land area and population will differ one from the other. The Gini Coefficient Ratio can be used to analyze the historical population concentration in Vanuatu as a whole or the population concentration in each province. The higher the value of the index, the higher is the concentration of the population within the specified areas of the country. The ratio can range from 0 to 1, or sometimes multiplied by 100 to range between 0 and 100. A low Gini coefficient indicates a more equal distribution, with 0 corresponding to complete equality, while higher Gini coefficients indicate more unequal distribution, with 1 corresponding to complete inequality. This index is affected by the size of the areas used in the calculation (Table 3-4).
Table 3: Rank of Crude Population Densities by province and Gini Concentration ratio at the Vanuatu 1999 Census
Table 4: Rank of Crude Population Densities by province and Gini Concentration ratio at the Vanuatu 2009 Census
1From Wikipedia, the free encyclopedia: The Gini coefficient is a measure of statistical dispersion developed by the Italian statistician and sociologist Corrado Gini and published in his 1912 paper "Variability and Mutability". The Gini coefficient is a measure of the inequality of a distribution, a value of 0 expressing total equality and a value of 1 maximal inequality.
Area ai Population pi Density |pi-ai|
(km²) 2009 (per k㎡) Area ai Pop Pi Area Ai Pop Pi ai(pi+1) ai+1(pi) =abs(pi-ai)
Vanuatu 12,281 186,678 15
1 Sanma 4,262 36,084 8 4,262 36,084 34.7 19.3 815 807 31,822 2 Torba 867 7,757 9 5,129 43,841 41.8 23.5 1,713 1,518 38,712 3 Malampa 2,808 32,705 12 7,938 76,546 64.6 41.0 3,656 3,195 68,608 4 Tafea 1,632 29,047 18 9,570 105,593 77.9 56.6 5,520 4,962 96,023 5 Penama 1,204 26,646 22 10,774 132,239 87.7 70.8 8,773 7,084 121,465 6 Shefa 1,507 54,439 36 12,281 186,678 100.0 100.0 20,476 17,566 174,397
0.29
cumulative products
Gini Concentration:
Rank Provincecumulative cumulative %
Area ai Population pi Density |pi-ai|
(km²) 2009 (per k㎡) Area ai Pop Pi Area Ai Pop Pi ai(pi+1) ai+1(pi) =abs(pi-ai)
Vanuatu 12,281 234,023 19
1 Sanma 4,262 45,855 11 4,262 45,855 34.7 19.6 819 818 41,593 2 Torba 867 9,359 11 5,129 55,214 41.8 23.6 1,641 1,525 50,085 3 Malampa 2,808 36,727 13 7,938 91,941 64.6 39.3 3,438 3,061 84,003 4 Tafea 1,632 32,540 20 9,570 124,481 77.9 53.2 5,171 4,666 114,911 5 Penama 1,204 30,819 26 10,774 155,300 87.7 66.4 8,773 6,636 144,526 6 Shefa 1,507 78,723 52 12,281 234,023 100.0 100.0 19,841 16,707 221,742
0.31
Rankcumulative products
Provincecumulative cumulative %
Gini Concentration:

9
Although it is a useful measure for certain purposes, this index of population concentration must be interpreted with caution. If for example, provinces could be defined in such a way that all uninhabited land areas were excluded, then all inhabited land areas would have high population densities, and the index value would be close to its maximum.
Figure 8: Lorenz curve for measuring population concentration in Vanuatu, 2009
As can be seen by the Lorenz graph there is uneven distribution of land in Vanuatu (Fig.8). With a Gini concentration ratio of 0.31 in 2009, Vanuatu is two thirds away from reaching total equality. This is an increase from the 0.29 Gini concentration ratio in 1999.
2.4 Population structure The enumerated 2009 resident population consisted of 119,091 males and 114,932 females. Males out-numbered females by 4,157, resulting in a sex ratio of 104, which means that there were 104 males per 100 females. However, sex ratios varied by province as can be seen in Figure 9. A sex ratio of 100 means that there are equal numbers of males and females while a sex ratio lower than 100 means there are more females than males and a sex ratio higher than 100 meaning more males than females. Figure 9 shows there were significantly more males than females in Vanuatu and in all provinces except Tafea, which had more females than males.
0
20
40
60
80
100
0 20 40 60 80 100
Popu
lati
on (
%)
Area (%)

10
Figure 9: Sex ratios by province, Vanuatu: 2009
A population’s age-sex structure may be considered as a map of its demographic history. Persons of the same age constitute a cohort of people who were born during the same year (or period); they have been exposed to similar historical events and conditions. The age-sex structure of the whole population at a given moment may be viewed as an aggregation of cohorts born in different years. A graphic representation of the age structure of the population such as an “age pyramid” shows the different surviving cohorts of people of each sex in Vanuatu. A population pyramid shows the number of males and females in five-year age groups (Fig.11) or single years (Figs.10, and Figs.12 to 17), starting with the youngest age group at the bottom, and increasing with age towards the top of the pyramid. The number of males is depicted to the left and the number of females to the right of the pyramid’s center. The shaded area in Figure 11 shows the population count of the 1999 census, while the thickly outlined area shows the population count of the 2009 census.
Vanu
atu
Torb
a
Sanm
a
Pena
ma
Mal
ampa
Shef
a
Tafe
a
90
95
100
105
110
Sex
rati
o (n
umbe
r of m
ales
per
100
fem
ales
)
Province

11
Figure 10: Population pyramid by single years, Vanuatu: 2009
Figure 11: Population pyramid by 5-year age groups, Vanuatu: 1999 and 2009
4,000 3,500 3,000 2,500 2,000 1,500 1,000 500 0 500 1,000 1,500 2,000 2,500 3,000 3,500 4,000
0
5
10
15
20
25
30
35
40
45
50
55
60
65
70
75
80
85
90+
Number of people
Age
Males Females
20,000 16,000 12,000 8,000 4,000 0 4,000 8,000 12,000 16,000 20,000
0- 4
5- 9
10-14
15-19
20-24
25-29
30-34
35-39
40-44
45-49
50-54
55-59
60-64
65-69
70-74
75-79
80+
Number of people
Age
gro
up
Males Females
1999 (shaded area) & 2009 (outlined)

12
At first sight, Vanuatu’s population pyramid (Fig.11) has the distinct features of a classical pyramid: it has a wide base, meaning that a large percentage of people are in the younger age groups, with increasingly narrow bars towards the top of the pyramid, representing decreasing age groups at older ages2. The pyramids of Malampa, Penama, Tafea and Torba have a very similar shape, characterized by the extreme narrow bars at roughly ages 20-34. It is evident that these provinces are losing people aged 20-34 years as they migrate into the urban centers in search for employment, education and for other reasons. Shefa’s population pyramid presents a very different picture compared to the other provinces. It shows a high number of people aged 15-25 years. As stated above, internal migration flows directed particularly into Port Vila town explain the high number of people at that age group. Port Vila, being the gateway to modernization and globalization, presents opportunities that people look for. Opportunities in employment, better services for health and education, and appropriate infrastructure will encourage more people to migrate and use them.
Figure 12: Population pyramid by single years, Torba: 2009
2 For a discussion on the accuracy of age reporting, and calculation of age accuracy indices, please refer to Appendix 1
200 150 100 50 0 50 100 150 200
0
5
10
15
20
25
30
35
40
45
50
55
60
65
70
75
80
85
90+
Number of people
Age
Males Females
13
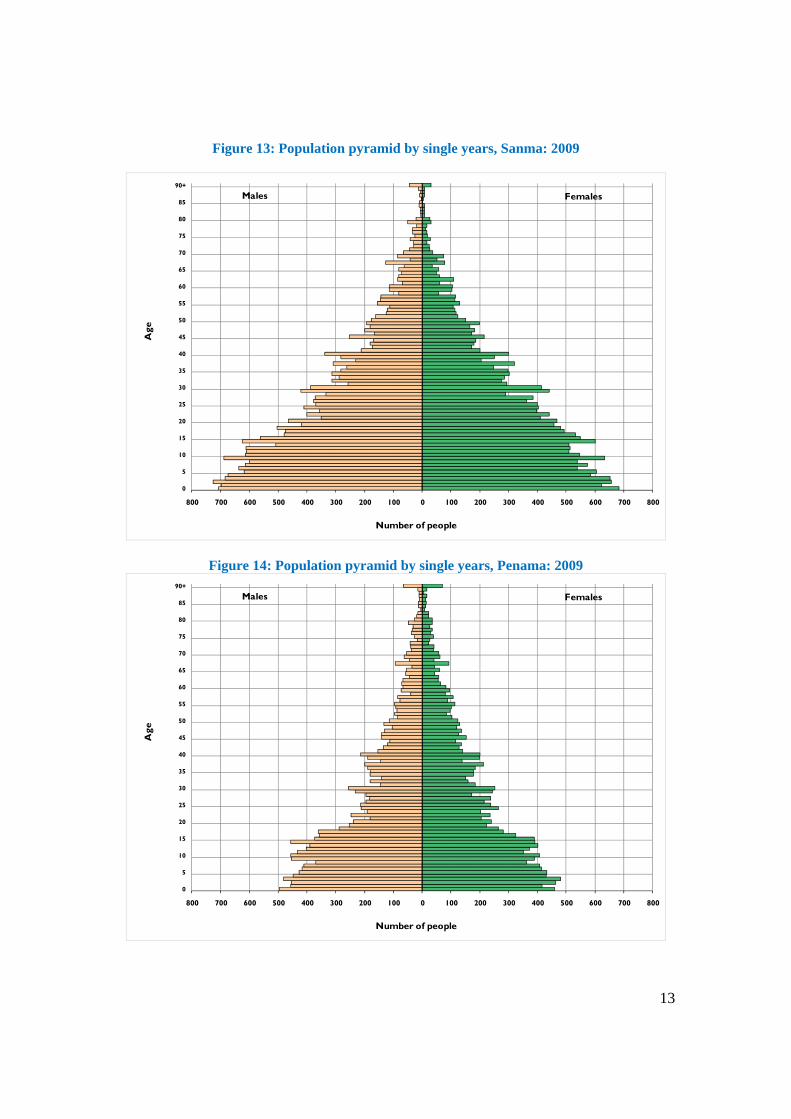
Figure 13: Population pyramid by single years, Sanma: 2009
Figure 14: Population pyramid by single years, Penama: 2009
800 700 600 500 400 300 200 100 0 100 200 300 400 500 600 700 800
0
5
10
15
20
25
30
35
40
45
50
55
60
65
70
75
80
85
90+
Number of people
Age
Males Females
800 700 600 500 400 300 200 100 0 100 200 300 400 500 600 700 800
0
5
10
15
20
25
30
35
40
45
50
55
60
65
70
75
80
85
90+
Number of people
Age
Males Females

14
Figure 15: Population pyramid by single years, Malampa: 2009
Figure 16: Population pyramid by single years, Shefa: 2009
800 700 600 500 400 300 200 100 0 100 200 300 400 500 600 700 800
0
5
10
15
20
25
30
35
40
45
50
55
60
65
70
75
80
85
90+
Number of people
Age
Males Females
1,500 1,200 900 600 300 0 300 600 900 1,200 1,500
0
5
10
15
20
25
30
35
40
45
50
55
60
65
70
75
80
85
90+
Number of people
Age
Males Females
15
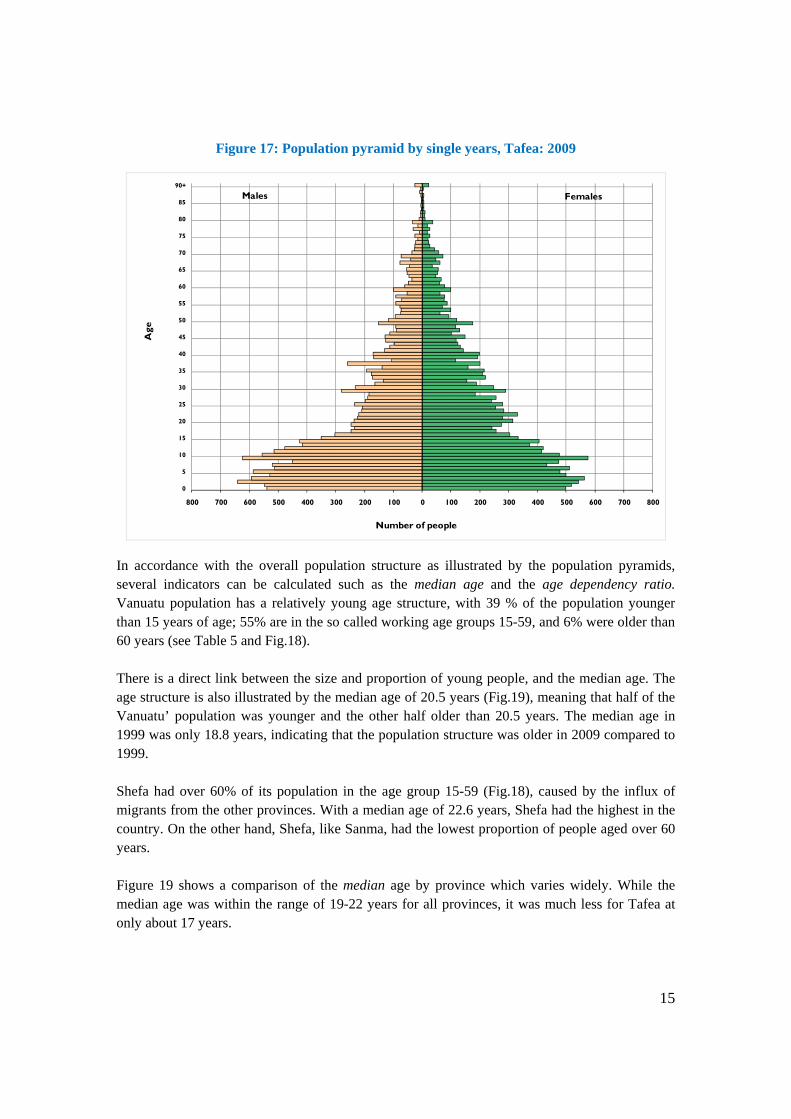
Figure 17: Population pyramid by single years, Tafea: 2009
In accordance with the overall population structure as illustrated by the population pyramids, several indicators can be calculated such as the median age and the age dependency ratio. Vanuatu population has a relatively young age structure, with 39 % of the population younger than 15 years of age; 55% are in the so called working age groups 15-59, and 6% were older than 60 years (see Table 5 and Fig.18). There is a direct link between the size and proportion of young people, and the median age. The age structure is also illustrated by the median age of 20.5 years (Fig.19), meaning that half of the Vanuatu’ population was younger and the other half older than 20.5 years. The median age in 1999 was only 18.8 years, indicating that the population structure was older in 2009 compared to 1999. Shefa had over 60% of its population in the age group 15-59 (Fig.18), caused by the influx of migrants from the other provinces. With a median age of 22.6 years, Shefa had the highest in the country. On the other hand, Shefa, like Sanma, had the lowest proportion of people aged over 60 years. Figure 19 shows a comparison of the median age by province which varies widely. While the median age was within the range of 19-22 years for all provinces, it was much less for Tafea at only about 17 years.
800 700 600 500 400 300 200 100 0 100 200 300 400 500 600 700 800
0
5
10
15
20
25
30
35
40
45
50
55
60
65
70
75
80
85
90+
Number of people
Age
Males Females

16
Table 5: Population distribution by broad age group, dependency ratio, median age, and sex ratio, Vanuatu: 1999 and 2009
Figure 18: Population by broad age groups (in %) by province, Vanuatu: 2009
0–14 15–24 25–59 60+
1999 43 18 34 5 91 18.8 105
2009 39 19 36 6 81 20.5 104
1999 47 17 30 6 111 16.8 103
2009 43 18 33 6 95 18.7 102
1999 44 19 33 4 90 18.0 107
2009 40 20 35 5 82 19.6 106
1999 43 18 32 7 100 18.5 106
2009 41 17 34 8 96 19.3 102
1999 42 18 33 7 96 18.9 104
2009 40 17 35 8 92 20.4 101
1999 39 19 38 4 75 20.9 107
2009 33 23 39 5 61 22.6 106
1999 48 17 31 5 112 16.4 101
2009 46 16 32 6 108 17.1 99
Shefa
Tafea
Torba
Vanuatu
Malampa
Penama
Sanma
Sex ratio (males per
100 females)Province Year
Proportion of population by broad age group (in %)
Age dependency ratio (15–59)
Median age
(years)
39 43 40 41 4033
46
55 51 55 51 52 62
48
6 6 5 8 8 5 6
0
10
20
30
40
50
60
70
80
90
100
Vanuatu Torba Sanma Penama Malampa Shefa Tafea
%
Province60+ 15-59 0–14

17
Figure 19: Population by median age and province, Vanuatu: 2009
A common way to describe a population’s age structure is via the age dependency ratio, which compares the dependent component of a country’s population with its economically productive component. This is conventionally expressed as the ratio of young people (0–14 years) plus the old (60+ years), to the working age population (15–59 years) as shown in Figure 20. In 2009, Vanuatu had a dependency ratio of 81, meaning that for every 100 people of working age, 81 people were in the age dependent category. The higher the dependency ratio, the higher the number of people that needs to be cared for by the working age population. The dependency ratio has decreased since the 1999 census when it was 91. Based on the population structure of the different provincial populations, the age dependency ratios of the different provinces vary accordingly. The most favorable dependency ratio can be found in Shefa with only 61 dependent people per 100 people of working age. Dependency ratios were much higher in Tafea, Penama and Torba. Tafea registered the highest dependant population of 108 meaning there were more people of the old and young ages than people in the working age groups. Looking at its broad age group Tafea has the highest number of people in the age group 0-14 compared to the other provinces and also the least number of people in the working age group (15-59) paving the way for a higher dependant population. For detailed information on population trends and age structure of the different provinces please refer to Appendix 27.
Vanu
atu
Torb
a
Sanm
a
Pena
ma
Mal
ampa
Shef
a
Tafe
a
0
5
10
15
20
25
Med
ian
age
Province

18
Figure 20: Population by age dependency ratio and province, Vanuatu: 2009
2.5 Urbanization According to Pranati Datta 3 ’s paper on urbanization in India, urbanization is an index of transformation from traditional rural economies to a modern industrial one. Davis Kingsley describes it as a progressive concentration of population in urban areas and it is a process through which a nation passes as they evolve from agrarian to industrial society (in Pranati Datta, 2006). Urbanization occurs as a result of people’s choice of wanting to reside in the urban areas. More people are changing residence from rural to urban areas, and increasing proportions of these people are selecting large cities and towns. These events produce two aspects of urbanization whose measurements should be differentiated ‐ an increase in the proportion of people selecting urban areas of residence and natural increase in cities and towns.
3 Pranati Datta, 2006, Urbanization in India, pg.2 [online]
Vanu
atu
Torb
a
Sanm
a
Pena
ma
Mal
ampa
Shef
a
Tafe
a
0
20
40
60
80
100
120
Age
dep
ende
ncy
ratio
Province

19
2.5.1 Urban growth Despite declining growth rates (Fig. 21) the population continues to increase (Fig. 22). While the average annual population increase during the period 1989-1999 was 1,354 people with a 4.2% growth rate, it increased to 1,708 people annually during the period 1999-2009 despite a lower growth rate of only 3.5%.
Figure 21: Urban average annual population growth rate (%), Vanuatu: 1967–2009
Figure 22: Urban population change, average annual increase in numbers, Vanuatu: 1967–
2009
6.1
4.8
4.2
3.5
0.0
1.0
2.0
3.0
4.0
5.0
6.0
7.0
1967-1979 1979-1989 1989-1999 1999-2009
%
Intercensal period
688
975
1,354
1,708
0
200
400
600
800
1,000
1,200
1,400
1,600
1,800
1967-1979 1979-1989 1989-1999 1999-2009
Num
ber o
f peo
ple
Intercensal period

20
2.5.2 Process of urbanization Kingsley mentions three stages in the process of urbanization. Stage one is characterized by a rural traditional society with predominance in agriculture and dispersed pattern of settlements. Stage two refers to an acceleration stage where basic restructuring of the economy and investments in social overhead capitals including transportation and communication take place. In addition the proportion of urban population gradually increases from 25% to 40%, 50%, 60% and so on. The third stage is when urban population exceeds 70% or more. At this stage the level of urbanization remains more or less the same or constant and the rate of growth of the urban population and total population becomes similar. Since the year 1967 the Vanuatu population and the urban population have been increasing. Given an increase from 8 thousand people in 1967 to 57 thousand people in 2009, Vanuatu’s urban centers gained 49 thousand people since 1967. Figure 23 illustrates this comparison and trend.
Figure 23: Process of urbanization, Vanuatu: 1967-2009
2.5.3 Degree of urbanization The degree or level of urbanization is defined as the relative number of people who live in urban areas4. Several indices have been drawn to measure particular aspects of degree of urbanization at a given time. These measures are percent urban [UP/TP*100], percent rural [RP/TP*100] and the urban/rural ratio [UP/RP*100].
4 Pranati Datta, 2006, Urbanization in India, pg.5 [online]
78
111
142
187
234
816
2640
5770
95
117
147
177
0
50
100
150
200
250
1967 1979 1989 1999 2009
Popu
lati
ons
in
Thou
sand
s
Censual Year
Total Population
Urban Population
Rural Population

21
Table 6: Degree/level of urbanization, Vanuatu: 1967-2009
The trend shown in Table 6 and Figure 24 is that urbanization is constantly increasing. Since 1967, the share of the urban population increased by more than ten percent. Obviously as the proportion of the urban population increases the proportion of the rural population must decrease at the same time. Based on the three stages of urbanization described by Kingsley, Vanuatu would be ranked in the first stage, because the proportion of urban is still less than 25%. In addition, Vanuatu’s rural traditional society is still characterized by predominance in agriculture and a dispersed pattern of settlements.
Figure 24: Process of urbanization, Vanuatu: 2009
Census Percent Percent Urban/RuralYear Total (TP) Urban (UP) Rural (RP) Rural Urban Ratio1967 77,988 7,772 70,216 90.0 10.0 11.071979 111,251 15,784 95,467 85.8 14.2 16.531989 142,419 25,870 116,549 81.8 18.2 22.201999 186,678 40,094 146,584 78.5 21.5 27.352009 234,023 57,195 176,828 75.6 24.4 32.34
Population
0
10
20
30
40
50
60
70
80
90
100
1967 1979 1989 1999 2009
perc
ent r
ural
/urb
an a
nd u
rban
/rur
al ra
tio
Censual Year
Percent Rural Percent Urban Urban/Rural Ratio

22
2.5.4 Tempo of urbanization The tempo of urbanization refers to the speed of urbanization and measures the change in the level of urbanization by analyzing changes in the indices used for measuring the degree of urbanization. The measurement of urbanization tempo indicates the pace at which a specific area is urbanizing. If a degree of urbanization in a country or province is known for two or more dates, the tempo is measured by the annual change in the index used for measuring the level of urbanization. Although potentially useful, this procedure of measuring the tempo may require some caution depending on the index used for measuring the level of urbanization.
Table 7: Tempo of urbanization, Vanuatu: 1967-2009
One quick index for measuring the tempo of urbanization is the difference between the annual population growth rates of urban and rural areas. For example, in Vanuatu the annual population growth rates during the most recent census period (1999‐2009) for urban and rural areas were 3.5 percent and 1.9 percent, respectively; the urbanization tempo is 1.6 percent per year (Table 2.7). The other index for measuring the tempo of urbanization is by using the “urban/rural ratio”. It is also related to the difference between the two mentioned rates (annual population growth rates of urban and rural areas). If the urban/rural ratio is known for more than one date, the annual exponential growth rate of the urban/rural ratio is also the difference between the urban and rural annual population growth rates. For Vanuatu, in 2009, the annual exponential growth rate of “urban/rural population ratio” is 1.6, which is equal to the difference between the urban population growth rate of 3.5 percent and rural population growth rate of 1.9 percent. According to Pranati Datta5, the main advantage of using this method compared to others for measuring tempo of urbanization is that it does not drop to zero when the country approaches the 100 percent level of urbanization; however it does regress toward the growth rate of the urban population. Measuring the tempo of urbanization, not only makes sense for determining how fast one area is growing in relation to the other, but is also related to the indices for measuring the level of urbanization. Thus by using the urban/rural ratio we can be sure to have an appropriate measuring index.
5 Pranati Datta, 2006, Urbanization in India, pg.9 [online]
Census Percent urban Percent Rural urban/rural ratio Year Total Urban Rural growth rate growth rate growth rate
1967-1979 3.1 6.1 2.6 3.0 -0.4 3.51979-1989 2.4 4.8 1.9 2.4 -0.5 2.91989-1999 2.6 4.2 2.2 1.6 -0.4 2.01999-2009 2.3 3.5 1.9 1.3 -0.4 1.6
Population Growth Rate

23
Figure 25: Annual growth rate of “Urban/Rural Ratio” measuring the tempo of urbanization, Vanuatu: 1967-2009
Figure 25 presents the trend of annual growth rates relating to the “urban/rural ratio” during the period 1967‐2009. It shows the declining pace of urbanization in Vanuatu. One reason for this decline could be related to the timing of the population censuses. The 1989, 1999 and 2009 censuses were conducted at the time of school holidays, when most urban residents (parents and children) may have returned to “home islands” for Christmas and school holidays. Another reason is maintaining the same Enumeration Areas (EA) overtime may contribute to the decline. Some EA’s that are currently still classified as rural should probably be classified as urban since these areas are showing characteristics of urban sprawl.
3.5
2.9
2.0
1.6
0.0
0.5
1.0
1.5
2.0
2.5
3.0
3.5
4.0
1967-1979 1979-1989 1989-1999 1999-2009
Gro
wth
rate
Census Period
urban/rural ratio growth rate

24
3. DEMOGRAPHIC COMPONENTS
3.1 Fertility
3.1.1 National estimates In order to determine the level and pattern of fertility in Vanuatu, women 15 years of age and older were asked the following questions:
how many children they had born alive; and when was their last child born.
The total number of children born alive to 71,486 women aged 15 and older was 189,333; 98,638 males and 90,695 females (Table 8). The average number of children born alive to all women (average parity) was 2.6 children per woman.
Table 8: Female population aged 15 and older by number of children ever born alive, Vanuatu: 2009
Average parity increases with the age of women. While women aged 15–19 had only very few children, women aged 45–49 had 4.4 children, and women older than 70 had on average 5 children. The average parities of women over 49 years of age is also called the completed fertility rate, a cohort measure demonstrating how many children a certain cohort of women who have completed their childbearing actually produced during those years. Figure 26 shows a comparison of the reported average number of children ever born of the last three censuses. A fertility decline is apparent as the average number of children per woman at every age declined from one census to the next. While the average number of children of women aged 45-49 years was 5.5 in 1989, it declined to 4.8 and 4.4 in 1999 and 2009.
Total
15–19 11,855 600 544 1,144 0.1 0.0 0.1
20–24 11,126 5,120 4,745 9,865 0.5 0.4 0.9
25–29 9,291 9,209 8,423 17,632 1.0 0.9 1.9
30–34 7,903 12,072 11,064 23,136 1.5 1.4 2.9
35–39 7,095 13,405 12,385 25,790 1.9 1.7 3.6
40–44 5,709 12,227 11,234 23,461 2.1 2.0 4.1
45–49 5,175 11,807 11,056 22,863 2.3 2.1 4.4
50–54 3,626 8,746 7,970 16,716 2.4 2.2 4.6
55–59 3,102 7,941 7,322 15,263 2.6 2.4 4.9
60–64 2,127 5,583 5,075 10,658 2.6 2.4 5.0
65–69 1,772 4,912 4,386 9,298 2.8 2.5 5.2
70+ 2,705 7,016 6,491 13,507 2.6 2.4 5.0
Total 71,486 98,638 90,695 189,333 1.4 1.3 2.6
children ever born
Average number of
children ever bornAge of women
Number of women
Males Females Total Males Females
Number of

25
Figure 26: Female population aged 15-49 by average number of children ever born alive, Vanuatu: 1989, 1999, and 2009
The census also included questions on whether mother’s children lived in her household or elsewhere, or whether they have died (Fig.27). The proportion of children living in their mother’s household decreased with the age of the mother, because as children grow older they leave their parents’ home and form their own household.
0.0
0.5
1.0
1.5
2.0
2.5
3.0
3.5
4.0
4.5
5.0
5.5
6.0
15–19 20–24 25–29 30–34 35–39 40–44 45–49
Num
ber o
f chi
ldre
n ev
er b
orn
Age of women
1989 1999 2009

26
Figure 27: Proportion of children ever born by age of mother and whether living in the same household as their mother, Vanuatu: 2009
From the question on date of birth of the last born child, the number of births per year or period can be calculated (Table 9).
Table 9: Reported number of births during the one-year period before the census (17 November 2008 – 16 November 2009) by age group of women, Vanuatu: 2009
ASFR = Age-Specific Fertility Rate TFR = Total Fertility Rate
15–19 11,855 516 0.044
20–24 11,126 2003 0.180
25–29 9,291 1763 0.190
30–34 7,903 1155 0.146
35–39 7,095 692 0.098
40–44 5,709 257 0.045
45–49 5,175 79 0.015
Total 58,154 6,465 TFR = 3.6
Age group of women
Number of women
ASFR*Number of children
0%
10%
20%
30%
40%
50%
60%
70%
80%
90%
100%
15 - 19 20 - 24 25 - 29 30 - 34 35 - 39 40 - 44 45 - 49 50 - 54 55 - 59 60 - 64 65 - 69 70+
Proportion of children ever born (%)
Age group of mother
in mother's household elsewhere children dead

27
Responses from women during the 2009 census indicated that 6,465 children were born during the one-year period prior to the census, between November 2008 and November 2009 (Table 9). However, this count compares with 7,105 children younger than one year of age enumerated during the census. This mismatch of counts suggests that a sizeable number of women did not report the birth of their child during the year prior to the census, or did not accurately report the exact date of birth of their children. Unfortunately, the number of registered deaths (from Vanuatu’s vital registration system) is not available, and a comparison of census data is not possible. Figure 28 shows a comparison of the above data of the last 3 censuses. Again it can be seen that the fertility level of women of all ages declined since 1989. Fertility levels have especially decreased of women aged 25-39 years, while fertility levels of women aged 15-19, and 45-49 have only marginally changed.
Figure 28: Reported age-specific-fertility-rates (ASFR), Vanuatu: 1989, 1999, 2009
In order to estimate Vanuatu’s fertility level, this analysis relies on indirect estimation techniques. First, the own-children method was applied to the census data, which is a procedure deriving ASFRs for a 10- or 15-year period from a special census tabulation of children classified by age, and age of mother, both ages being given in single years at the time of the census. Age of mother can be determined only for those children who are enumerated in the same household as their
0
50
100
150
200
250
300
15–19 20–24 25–29 30–34 35–39 40–44 45–49
ASF
R(N
umbe
r of b
irth
s per
100
0 w
omen
)
Age group of women
1989 1999 2009

28
mother (i.e. who are “own children” of a woman present in some enumerated household, hence the name of the method). The results of the own-children method were kindly prepared and provided Mr. Michael Levin of the Harvard University Center for Population and Development Studies. Secondly two variants of the P/F-Ratio method were applied, using census data on the number of children ever born by age of women, and the number of children born during the year prior to the census by age of women as reported in the census. The demographic indicator most commonly used to describe a country’s fertility situation is called the total fertility rate (TFR). This measure is an indication of the average number of children a woman gives birth to during her reproductive life (from ages 15–49 years). It is calculated from the number of live births by age of women in a given year — the age-specific fertility rates (ASFRs). Fertility estimates derived using the own-children method from the 2009 censuses show two distinct periods; the period 1995-2000 with a fertility level (TFR) of well above 4, and the period 2001-2009 when the level has remained constant of the 8-year period at a level of about 4 children per woman (Fig.29).
Figure 29: Estimates of TFR based on "own-children method", Vanuatu: 1995–2009
Source: Michael Levin, Harvard University Center for Population and Development Studies
0
1
2
3
4
5
6
1995 1996 1997 1998 1999 2000 2001 2002 2003 2004 2005 2006 2007 2008 2009
TFR
(ave
rage
num
ber o
f chi
ldre
n pe
r wom
an)
Year

29
Results of the own-children method were compared with estimates derived by applying the Arriaga6 method — which measures fertility based on data in one or two points in time. The difference between both methods is that the method using two points in time assumes changing (declining) fertility, while the method using only one point in time assumes constant fertility. The software MORTPAK 4.1, procedure FERTPF (from the United Nations) was used (Apps.2 to 4). Table 10 compares the estimated fertility levels derived by the different methods.
Table 10: Comparison of TFR estimates derived by various methods, Vanuatu: 1999 and 2009
11999 estimates refer to 3-year period 1998-2000 and estimate for 2009 refers to period 2007-9 2using adjustment factors of women aged 20-29 3 using adjustment factors of women aged 25-34 *using average of age group 20-39 of 2+2 points based on ASFR and CEB Since the own-children estimates show that fertility levels remained relatively constant during the period 2001-2009 (Fig.29), the underlying assumptions of the Arriaga method using two points in time of changing fertility does not comply with the Vanuatu demographic situation, and therefore its results should be rejected. On the other hand, the estimated TFRs derived by the own-children method and the Arriaga method using only one point in time which assumes constant fertility, show consistent results. Furthermore the Trussel P/F Ratio method (App.5-6) as well as the Relational Gompertz method (App.7) confirms values produced by the own-children method.
6 Many censuses and surveys include questions related specifically to fertility, for example, the numbers of children women have ever had, and whether they had a birth in the year preceding the inquiry. The method seeks to adjust the level of observed age-specific fertility rates, which are assumed to represent the true age pattern of fertility, to agree with the level of fertility indicated by the average parities (average number of children ever born) of women in age groups under 30 or 35, which are assumed to be accurate. During successful application of this method, the age pattern of the period fertility rates is combined with the level implied by the average parities of younger women to derive a set of fertility rates that is generally more reliable than either of its constituent parts. Responses to such questions can be used to estimate fertility indirectly. Some techniques for doing this include the parity/fertility (P/F) ratio method developed by Brass, based on the average number of children ever born to women in five-year age groups, and women’s age pattern of fertility derived from births in the year preceding the census or survey; and the Arriaga technique, which is similar to the P/F ratio method but links data for more than one date. While the Brass P/F ratio method assumes constant fertility in the past, the Arriaga method does not.
YearOwn-children
method¹
Arriaga Method, using 1 point in
time²
Arriaga Method, using 2 points in time: 1999
and 2009²
Trussell P/F Ratio Technique³
Relational Gompertz method*
1999 4.6 4.7 4.4 4.7 4.6
2009 4.1 4.1 3.8 4.1 4.1

30
According to these estimates the TFR in and around 2009 was 4.1, only about half a child lower than 10 years ago in 1999 when the TFR was about 4.6. This is a very moderate fertility decline during the intercensal period 1999-2009. The following analysis is based on results derived by the own-children method, as it produces the most detailed information on levels and trend of fertility in Vanuatu by geographic and socio-economic background information of women of the 15-year period before the 2009 census. The estimated fertility levels by age group of mother (Fig.30) again shows that the fertility levels of women of all ages decreased since the 1990s, but changed very little since the beginning of the new millennium. Women aged 20-29 produced the most children with about 200 children per 1000 women in that age group. The so-called teenage fertility rate, the number of children of women aged 15-19 years, was 66, which means that 66 children were born per 1000 women aged 15-19.
Figure 30: Estimated and adjusted age-specific fertility rates (ASFRs), Vanuatu: 1995 to 2009
Source: Michael Levin, Harvard University Center for Population and Development Studies The number of births by age of women, and therefore the total number of births during the one-year period around the 2009 census can be calculated by multiplying the adjusted ASFR by the
66
0
50
100
150
200
250
15-19 20-24 25-29 30-34 35-39 40-44 45-49
ASF
R (N
umbe
r of b
irth
s per
100
0 w
omen
)
Age group of women
2007-2009 2001-2003 1995-1997

31
enumerated number of women by age group in the census, and summing the number of births by the age group of women (Table 11).
Table 11: Estimated age-specific fertility rate (ASFR), annual number of births, total fertility rate (TFR), and mean age at childbearing (MAC), Vanuatu: 2009
*Adjusted ASFRs are based on estimates derived using the own-children method of the period
2007-2009 #Mean age at childbearing
The estimated number of births of 7,335 in 2009 seems consistent with the enumerated population aged younger than one year of age of 7,105 children. Finally the national crude birth rate (CBR) can then be calculated by dividing the estimated number of births (7,335) by the total 2009 census population (234,023), multiplied by 1,000.
CBR = 7,335/234,023 x 1,000 = 31.3 (there were 31 births/1,000 population)
Age group of women Number of women Estimated ASFREstimated number of births (ASFR x number of women)
15-19 11,855 0.0656 778
20-24 11,126 0.1979 2,202
25-29 9,291 0.2014 1,871
30-34 7,903 0.1656 1,309
35-39 7,095 0.1066 756
40-44 5,709 0.0538 307
45-49 5,175 0.0217 112
Total 58,154 7,335
TFR 4.1 children per woman
MAC# 29.3 years

32
3.1.2 Sub national estimates This section contains some fertility estimates by urban-rural distinction, and by province. All estimates are based on results derived through application of the own-children method. The summary of main indicators in the front of the report summarizes various fertility indicators by place of residence. Not surprisingly, the fertility level in the urban areas was lower than in the rural areas. Furthermore, the province Tafea and Penama had, with 5.2 and 4.7 children per woman, the highest fertility of all provinces, and Shefa with the location of the capital Port Vila has the lowest TFR of 3.4 (Fig.31).
Figure 31: TFR by place of residence, Vanuatu: 2007-2009
Source: Michael Levin, Harvard University Center for Population and Development Studies
Figures 32-33 show the fertility trend throughout the period 1995-2009 by urban-rural residence and by province. Interestingly the fertility level in the urban areas and the province of Shefa where the capital Port Vila is located, show a slightly increasing trend since 2001-2003. An explanation could be the migration of ‘high fertility’ rural women to the urban centers.
Furthermore, Figure 34 presents the adolescent (or teenage) fertility rate – the number of births per 1000 women aged 15-19. The rate was, with 40 much lower in the urban than the rural areas (77), and it is the highest in the province of Torba, where the teenage fertility is, with 116 births per 1000 women aged 15-19, very high.
3.2
4.4 4.54.2
4.7
4.2
3.4
5.2
4.1
0
1
2
3
4
5
6
Urban Rural Torba Sanma Penama Malampa Shefa Tafea
TFR
Vanuatu national average

33
Figure 32: Fertility trend by urban-rural residence, Vanuatu: 1995-2009
Source: Michael Levin, Harvard University Center for Population and Development Studies
Figure 33: Fertility trend by province, Vanuatu: 1995-2009
Source: Michael Levin, Harvard University Center for Population and Development Studies
0
1
2
3
4
5
6
7
2007-9 2004-6 2001-3 1998-00 1995-97
TFR
Year
Vanuatu Urban Rural
0
1
2
3
4
5
6
7
2007-9 2004-6 2001-3 1998-00 1995-97
TFR
Year
Vanuatu Torba Sanma Penama Malampa Shefa Tafea

34
Figure 34: Adolescent fertility rate (number of births per 1000 women aged 15-19 years), Vanuatu: 2007-2009
Source: Michael Levin, Harvard University Center for Population and Development Studies
3.1.3 Proximate determinants of fertility This section does not attempt to provide a comprehensive analysis of variables that determine the level of fertility in Vanuatu. It merely touches on some aspects of it, mainly the educational levels of females. It hopefully encourages research into a more detailed analysis of the proximate determinates of Vanuatu’s fertility levels and trends. Comparing the fertility levels of women with the level of educational attainment shows a very straight forward and clear trend: the higher the level of women’s education, the lower the number children per woman (Fig.35). The importance of education is furthermore illustrated by plotting the data of TFR and literacy rates of women aged 15 years and older by place of residence (Fig.36). Literacy is measured as the proportion of the population who are able to read and write a simple sentence. The coefficient of determination (R2) or correlation coefficient is with 0.914 very high, meaning that 91.4% of the variation of the two variables can be explained by the value of each variable: places with high literacy rate show a low TFR.
40
77
116
78
6874
50
6766
0
20
40
60
80
100
120
Urban Rural Torba Sanma Penama Malampa Shefa Tafea
Ado
lesc
ent f
erti
lity
rate
(n
umbe
r of b
irth
s pe
r 100
0 w
omen
age
d 15
-19)
Vanuatu national average

35
Equally high correlations were found when comparing the proportion of women without education and women with secondary education to data of women by fertility level. Data show that the higher the proportion of women without education, the higher the level of fertility, and vice versa: the higher the proportion of women with secondary education, the lower the level of fertility (Figs.37-38). Figure 39 shows the correlation between the proportion of women employed (the female employment-population ratio) and fertility levels by place of residence. Data show that the higher the proportion of females employed, the lower the level of fertility. Finally data also show a correlation between the levels of fertility and mortality (Figs.40-41). There seems to be a positive correlation between the level of fertility (TFR), and the infant mortality rate (IMR): the higher the TFR, the higher the IMR. Similarly is the correlation between the TFR and life expectancy at birth (e)) of females: the higher the average number of children per woman, (TFR), the shorter is a woman’s life span (e0). However, please note that other intermediate factors can influence the degree of correlation shown in the graphs such as the age structure of the population, age at marriage, traditional values, religious affiliation, labor market, access and availability of contraceptives and reproductive health services etc.

36
Figure 35: Fertility level (TFR) by educational attainment, Vanuatu: 2009
Source: Michael Levin, Harvard University Center for Population and Development Studies
4.6
4.03.6
3.4
4.1
0
1
2
3
4
5
Less than Primary School Finished Primary School Secondary School University entrance and above
TFR
Vanuatu national average

37
Figure 36: Total fertility rate (TFR) and proportion of women aged 15 years and older literate by place of residence, Vanuatu: 2009
Figure 37: Total fertility rate (TFR) and proportion of women aged 15 years and older without education (never been to school) by place of residence, Vanuatu: 2009
Vanuatu
Urban
Rural
Malampa
PenamaSanma
Shefa
Tafea
Torba
R² = 0.914
0
10
20
30
40
50
60
70
80
90
100
3 4 5 6
Lier
acy
rate
(%)
TFR
Vanuatu
Urban
Rural
Malampa
Penama
Sanma
Shefa
Tafea
Torba
R² = 0.8609
0
5
10
15
20
25
30
35
40
45
50
3 4 5 6
Prop
orti
on o
f fem
ales
aag
ed 1
5 ye
ars a
nd o
lder
nev
er b
een
to sc
hool
(%)
TFR

38
Figure 38: Total fertility rate (TFR) and proportion of women aged 15 years and older with secondary education by place of residence, Vanuatu: 2009
Figure 39: Total fertility rate (TFR) and female employment-population ratio by place of residence, Vanuatu: 2009
Vanuatu
Urban
RuralMalampa
Penama
Sanma
Shefa
TafeaTorba
R² = 0.7867
0
5
10
15
20
25
30
35
40
45
50
3 4 5 6
Prop
orti
on o
f fem
ales
wit
h se
cond
ary
educ
atio
n (%
)
TFR
Vanuatu
Urban
Rural
Malampa
Penama
Sanma
Shefa
TafeaTorba
R² = 0.7562
0
5
10
15
20
25
30
35
40
45
3 4 5 6
Empl
oym
ent-
popu
lati
on ra
tio o
f fem
ales
(%)
TFR

39
Figure 40: Total fertility rate (TFR) and Infant mortality rate (IMR) by place of residence, Vanuatu: 2009
Figure 41: Total fertility rate (TFR) and life expectancy at birth of females by place of residence, Vanuatu: 2009
Vanuatu
Urban
Rural
Malampa
Penama
Sanma
Shefa
Tafea
Torba
R² = 0.6326
0
5
10
15
20
25
30
35
3 4 5 6
IMR
TFR
Vanuatu
Urban
Rural
Malampa
Penama
Sanma
Shefa
Tafea
Torba
R² = 0.6386
71.0
71.5
72.0
72.5
73.0
73.5
74.0
3 4 5 6
Life
exp
ecta
ncy
at b
irth
of f
emal
es (i
n ye
ars)
TFR

40
3.2 Mortality The questions relating to mortality in the 2009 census were:
how many live births a woman has ever had, and how many of those born were still alive and/or had died;
whether a respondent’s mother and father was still alive (orphanhood); whether a respondent’s marital status was "widowed" (widowhood); and whether any residents of the household died during the last 12 months prior to the
census.
3.2.1 National level estimates Based on the reported number of deaths by age and sex derived from the household question on number of deaths of household residents who died during the last 12 months before the census, 998 persons had died during the year before the census; 624 males, and 374 females (Table 12).
Table 12: Number of deaths of household residents during the 12 months preceding the census by age and sex, Vanuatu: 2009
Both the Brass Growth Balance Equation Method7and the Preston-Coale Method8 were applied to the collected data, and it appears that the reported number of household deaths is significantly underreported. If these data were directly used to calculate a life table (by for example using the
7 Population Analysis Spreadsheets (PAS), procedure GRBAL, US Census Bureau, Washington, USA 8 Population Analysis Spreadsheets (PAS), procedure PRECOA, US Census Bureau, Washington, USA
Age group Total Males Females0 258 152 106 1 - 4 65 42 23 5 - 9 24 13 11 10 - 14 19 13 6 15 - 19 20 10 10 20 - 24 31 22 9 25 - 29 21 11 10 30 - 34 23 10 13 35 - 39 29 19 10 40 - 44 37 21 16 45 - 49 40 28 12 50 - 54 52 34 18 55 - 59 58 42 16 60 - 64 64 40 24 65 - 69 54 35 19 70+ 203 132 71 Total 998 624 374

41
PAS procedure LTPOPDTH) life expectancy at birth for males and females would calculate at 76.1 and 93.7 years, which is obviously much too high. Interestingly the reported number of infant deaths (population younger than 1 year) seems considerably overstated, probably due to age misreporting, or coding errors. On the other hand, male and female IMRs would calculate at about 39 and 31 per 1000 for males and females, which seem too high. However, the data on reported household deaths by age and sex was used to determine which of the different Coale-Demeny and United Nations model life tables compares best to the empirical Vanuatu mortality pattern using MORTPAK’s procedure COMPAR. The assumption was made that possible under-registration of deaths is not age specific and therefore does not affect the overall pattern of mortality. It was found that the West pattern of the Coale-Demeny model life tables resembles most closely the empirical mortality pattern of the Vanuatu population. Early age mortality From all children that were ever born to women aged 15 and older (189,333), 96.6% (182,885) were still alive, and 6,448 children had died (Table 13). The proportion of surviving females was higher than that of males (Table 14). While 96.7% of all female children ever born were still alive, only 95.5% of all male children had survived. The proportion of surviving children decreases with the age of mothers (Table 14 and Fig.42). While 98.2% of all children that were ever born to women now aged 20–24 were still alive, only 97.4% of children born to women now aged 45–49 were still alive, and only 88% of children born to women now aged 75 and older remained alive. This general trend is explained by the fact that as the age of mothers increases, so does the age of her children; the proportion of birth cohorts that have died rises with an increase in the age of mothers.

42
Table 13: Female population aged 15 and older by number of children ever born, number of children dead, and number of children still alive, Vanuatu: 2009
Table 14: Female population aged 15 and older by proportion of children ever born and still alive, and proportion now dead, Vanuatu: 2009
Total Males Females Total Males Females Total Males Females 15 - 19 11,855 1,144 600 544 32 20 12 1,112 580 532 20 - 24 11,126 9,865 5,120 4,745 213 116 97 9,652 5,004 4,648 25 - 29 9,291 17,632 9,209 8,423 344 197 147 17,288 9,012 8,276 30 - 34 7,903 23,136 12,072 11,064 466 253 213 22,670 11,819 10,851 35 - 39 7,095 25,790 13,405 12,385 587 322 265 25,203 13,083 12,120 40 - 44 5,709 23,461 12,227 11,234 599 329 270 22,862 11,898 10,964 45 - 49 5,175 22,863 11,807 11,056 635 343 292 22,228 11,464 10,764 50 - 54 3,626 16,716 8,746 7,970 592 300 292 16,124 8,446 7,678 55 - 59 3,102 15,263 7,941 7,322 658 357 301 14,605 7,584 7,021 60 - 64 2,127 10,658 5,583 5,075 591 307 284 10,067 5,276 4,791 65 - 69 1,772 9,298 4,912 4,386 630 382 248 8,668 4,530 4,138 70+ 2,705 13,507 7,016 6,491 1,101 605 496 12,406 6,411 5,995
Total 71,486 189,333 98,638 90,695 6,448 3,531 2,917 182,885 95,107 87,778
Total number of
women
Total number of children ever born alive
Total number of children dead Total number of children still
alive Age of women
Total Males Females Total Males Females 15 - 19 11,855 97.2 96.7 97.8 2.8 3.3 2.2 20 - 24 11,126 97.8 97.7 98.0 2.2 2.3 2.0 25 - 29 9,291 98.0 97.9 98.3 2.0 2.1 1.7 30 - 34 7,903 98.0 97.9 98.1 2.0 2.1 1.9 35 - 39 7,095 97.7 97.6 97.9 2.3 2.4 2.1 40 - 44 5,709 97.4 97.3 97.6 2.6 2.7 2.4 45 - 49 5,175 97.2 97.1 97.4 2.8 2.9 2.6 50 - 54 3,626 96.5 96.6 96.3 3.5 3.4 3.7 55 - 59 3,102 95.7 95.5 95.9 4.3 4.5 4.1 60 - 64 2,127 94.5 94.5 94.4 5.5 5.5 5.6 65 - 69 1,772 93.2 92.2 94.3 6.8 7.8 5.7 70+ 2,705 91.8 91.4 92.4 8.2 8.6 7.6
Total 71,486 96.6 96.4 96.8 3.4 3.6 3.2
Age of women
Total number of
women
Proportion of children ever born still alive (%)
Proportion of children ever born now dead (%)

43
Figure 42: Proportion of children ever born and still alive by age of mother, Vanuatu: 2009
A comparison of data on children ever born and still alive from the 1989, 1999 and 2009 census data (Fig.43) show continues improvements in the survival of children of women of all age groups. Especially the proportion of children of older women, who themselves are older children at the time of the respective censuses, have significantly increased, which points to a general improvement in the (child) mortality levels.
86.0
88.0
90.0
92.0
94.0
96.0
98.0
100.0
15 - 19 20 - 24 25 - 29 30 - 34 35 - 39 40 - 44 45 - 49 50 - 54 55 - 59 60 - 64 65 - 69 70+
Prop
orti
on o
f chi
uldr
en e
ver b
orn
still
aliv
e (%
)
Age group of mother
Males Females
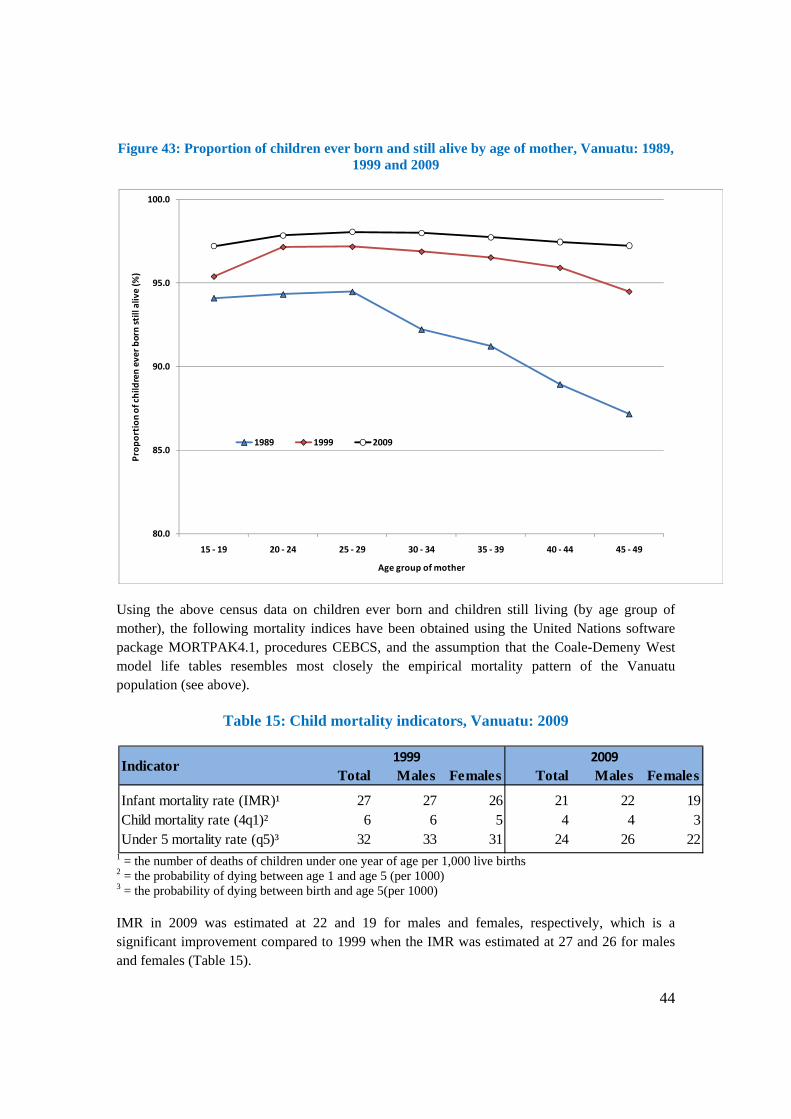
44
Figure 43: Proportion of children ever born and still alive by age of mother, Vanuatu: 1989, 1999 and 2009
Using the above census data on children ever born and children still living (by age group of mother), the following mortality indices have been obtained using the United Nations software package MORTPAK4.1, procedures CEBCS, and the assumption that the Coale-Demeny West model life tables resembles most closely the empirical mortality pattern of the Vanuatu population (see above).
Table 15: Child mortality indicators, Vanuatu: 2009
1 = the number of deaths of children under one year of age per 1,000 live births 2 = the probability of dying between age 1 and age 5 (per 1000) 3 = the probability of dying between birth and age 5(per 1000) IMR in 2009 was estimated at 22 and 19 for males and females, respectively, which is a significant improvement compared to 1999 when the IMR was estimated at 27 and 26 for males and females (Table 15).
80.0
85.0
90.0
95.0
100.0
15 - 19 20 - 24 25 - 29 30 - 34 35 - 39 40 - 44 45 - 49
Prop
orti
on o
f chi
ldre
n ev
er b
orn
still
aliv
e (%
)
Age group of mother
1989 1999 2009
Total Males Females Total Males Females
Infant mortality rate (IMR)¹ 27 27 26 21 22 19Child mortality rate (4q1)² 6 6 5 4 4 3Under 5 mortality rate (q5)³ 32 33 31 24 26 22
Indicator1999 2009

45
Child mortality, the probability of dying between age 1 and age 5, was estimated at 4 male deaths and 3 female deaths per 1,000 people of that age in 2009. Under 5 mortality, the probability of dying between birth and age 5, was estimated at 26 and 22 for males and females, respectively per 1,000 people in 2009. Adult mortality Adult mortality levels can be estimated from responses to the question
- whether a respondent’s mother or father was still alive (orphanhood), and - whether a respondent’s marital status was "widowed" (widowhood).
Orphanhood From Table 17 and Figure 44 it can be seen that the number and proportion of respondent’s mother still alive is higher than that of fathers. There are 2 explanations for it:
1. females (mothers) usually live longer lives than males (fathers); and 2. fathers are usually older than mothers, because of their age difference at marriage. In
chapter 4, section on marital status, it was calculated that the average age at marriage (SMAM) is about 25.5 and 22.5 years for males and females respectively; an age difference of 3 years between spouses.
The data on orphanhood were used to calculate adult mortality rates, specifically the life expectancy at age 20 (Table 16). The software package MORTPAK, procedure ORPHAN, was used to calculate the adult mortality rates. Please note that the mean age at childbearing (MAC), a required data input for this method, was calculated from the adjusted ASFR produced by the own-children method. The MAC-value for males was adjusted by the age difference of the calculated SMAMs.
Table 16: Life expectancy at age 20, using the orphanhood method, MORTPAK's procedure ORPHAN, Vanuatu: 2009
Males Females Total
Life expectancy at age 20 (e20) 52.1 54.7 53.4

46
Table 17: Population* by 5 year age group and whether biological father or mother is still alive, Vanuatu: 2009
*refers to population living in private households only
Figure 44: Proportion of respondent’s father or mother still alive, Vanuatu: 2009
Yes No Yes No0 - 4 33,083 32,725 358 32,867 216 5 - 9 29,476 28,900 576 29,037 439 10 - 14 26,682 25,744 938 26,100 582 15 - 19 21,734 20,310 1,424 20,803 931 20 - 24 21,229 18,676 2,553 19,707 1,522 25 - 29 18,245 14,768 3,477 16,113 2,132 30 - 34 15,586 10,927 4,659 12,695 2,891 35 - 39 14,016 8,126 5,890 10,132 3,884 40 - 44 11,423 4,845 6,578 6,907 4,516 45 - 49 10,144 3,130 7,014 4,893 5,251 50 - 54 7,245 1,535 5,710 2,464 4,781 55 - 59 6,314 834 5,480 1,493 4,821 60 - 64 4,284 378 3,906 564 3,720 65 - 69 3,790 292 3,498 367 3,423 70+ 5,632 439 5,193 460 5,172 Total 228,883 171,629 57,254 184,602 44,281
Age group Number of
respondents Father still alive Mother still alive
0.0
10.0
20.0
30.0
40.0
50.0
60.0
70.0
80.0
90.0
100.0
0 - 4 5 - 9 10 - 14 15 - 19 20 - 24 25 - 29 30 - 34 35 - 39 40 - 44 45 - 49 50 - 54 55 - 59 60 - 64 65 - 69 70+
%
Age group of respondent
Mother Father

47
Widowhood From Table 18 and Figure 45 it can be seen that the number and proportion of females widowed is higher than that of males. There are 2 explanations for it:
1. females usually live longer lives than males (her spouse); and 2. males are usually older than females, because of their age difference at marriage, as
described above (orphanhood). An attempt was made to use the data on widowhood to calculate adult mortality rates, specifically the life expectancy at age 20, by applying the software package MORTPAK, procedure WIDOW. Unfortunately, the data do not allow the calculation of female values, because the proportion of male widowers is too small to calculate any reasonable indicators. There are 2 explanations for this:
1. males did incorrectly state their marital status; and 2. a high proportion of males who lost their spouse remarried, and although widowed once,
is tabulated as ‘married’.
Table 18: Population 15 years and older by sex and widowed, Vanuatu: 2009
Total Males Females Total Males Females15 - 19 23,882 12,027 11,855 22 3 19 20 - 24 21,541 10,415 11,126 63 6 57 25 - 29 18,415 9,124 9,291 85 13 72 30 - 34 15,693 7,790 7,903 99 22 77 35 - 39 14,171 7,076 7,095 170 28 142 40 - 44 11,523 5,814 5,709 210 35 175 45 - 49 10,241 5,066 5,175 297 52 245 50 - 54 7,415 3,789 3,626 368 71 297 55 - 59 6,363 3,261 3,102 438 96 342 60 - 64 4,319 2,192 2,127 477 102 375 65 - 69 3,826 2,054 1,772 582 173 409 70+ 5,661 2,956 2,705 1,442 416 1,026 Total 143,050 71,564 71,486 4,253 1,017 3,236
Total WidowedAge group

48
Figure 45: Proportion of population 15 years and older by sex and widowed, Vanuatu: 2009
Nevertheless, the data on marital status (widowhood) provides interesting and valuable insights into mortality differentials between males and females, as the large difference in widowed males and females points to lower mortality rates (higher life expectancies) for females than males. However, since the widowhood method cannot be applied to both males and females, it was decided to rely on the orphanhood method to calculate consistent data for males and females, i.e. using the same method for both sexes.
Complete life table
In order to construct a complete life table for males and females, the estimated child and adult mortality indicators need to be combined (Table 19). As mentioned above, it was decided to use the adult mortality indicators produced by the orphanhood method as the final adult mortality estimates together with the child mortality estimates as presented above. Once again, the UN software package MORTPAK, procedure COMBIN, was used to calculate a complete life table for males and females. The following inputs were used:
0
5
10
15
20
25
30
35
40
45
50
15 - 19 20 - 24 25 - 29 30 - 34 35 - 39 40 - 44 45 - 49 50 - 54 55 - 59 60 - 64 65 - 69 70+
Prop
orti
on w
idow
ed (%
)
Age group
Males Females
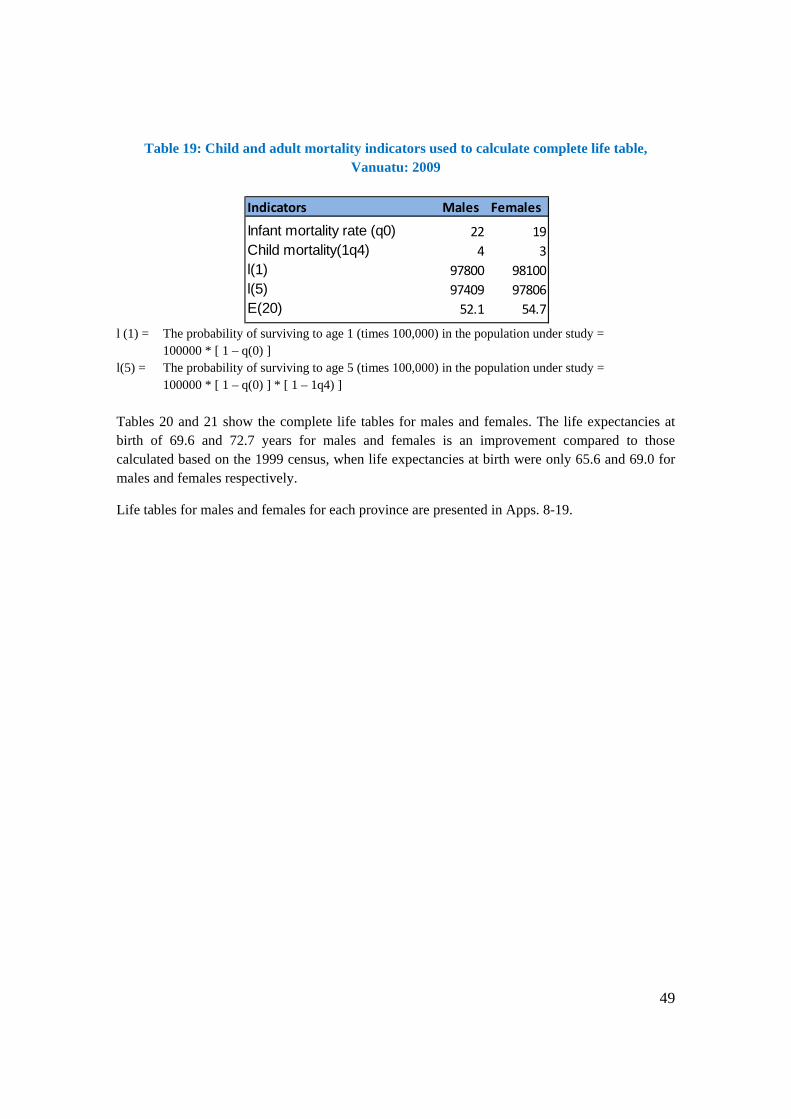
49
Table 19: Child and adult mortality indicators used to calculate complete life table, Vanuatu: 2009
l (1) = The probability of surviving to age 1 (times 100,000) in the population under study =
100000 * [ 1 – q(0) ] l(5) = The probability of surviving to age 5 (times 100,000) in the population under study =
100000 * [ 1 – q(0) ] * [ 1 – 1q4) ]
Tables 20 and 21 show the complete life tables for males and females. The life expectancies at birth of 69.6 and 72.7 years for males and females is an improvement compared to those calculated based on the 1999 census, when life expectancies at birth were only 65.6 and 69.0 for males and females respectively.
Life tables for males and females for each province are presented in Apps. 8-19.
Indicators Males Females
Infant mortality rate (q0) 22 19Child mortality(1q4) 4 3l(1) 97800 98100l(5) 97409 97806E(20) 52.1 54.7

50
Table 20: Abridged life table for Vanuatu males: 2009
Note: Highlighted are the input values as displayed in Table 15, as well as the life expectancy at birth (e0)
Table 21: Abridged life table for Vanuatu females: 2009
Note: Highlighted are the input values as displayed in Table 15, as well as the life expectancy at birth (e0)
Age m(x,n) q(x,n) l(x) d(x,n) L(x,n) S(x,n) T(x) e(x)0 0.0224 0.0220 100,000 2,200 98,033 0.9766 6,958,969 69.6 1 0.0010 0.0040 97,800 391 390,256 0.9958 6,860,936 70.2 5 0.0006 0.0032 97,409 315 486,257 0.9970 6,470,680 66.4
10 0.0006 0.0028 97,094 269 484,796 0.9961 5,984,423 61.6 15 0.0011 0.0055 96,825 534 482,893 0.9935 5,499,627 56.8 20 0.0014 0.0072 96,291 689 479,768 0.9928 5,016,734 52.1 25 0.0014 0.0072 95,602 687 476,309 0.9924 4,536,966 47.5 30 0.0016 0.0081 94,915 770 472,709 0.9909 4,060,656 42.8 35 0.0021 0.0105 94,145 987 468,389 0.9873 3,587,947 38.1 40 0.0031 0.0155 93,158 1,448 462,428 0.9801 3,119,559 33.5 45 0.0051 0.0251 91,710 2,303 453,232 0.9679 2,657,130 29.0 50 0.0082 0.0403 89,407 3,603 438,697 0.9482 2,203,898 24.7 55 0.0134 0.0652 85,804 5,594 415,992 0.9180 1,765,201 20.6 60 0.0213 0.1015 80,210 8,144 381,900 0.8732 1,349,209 16.8 65 0.0339 0.1569 72,067 11,309 333,472 0.8050 967,309 13.4 70 0.0545 0.2407 60,758 14,627 268,450 0.7058 633,837 10.4 75 0.0875 0.3594 46,131 16,577 189,464 0.4815 365,387 7.9 80 0.1680 ... 29,554 29,554 175,923 ... 175,923 6.0
Age m(x,n) q(x,n) l(x) d(x,n) L(x,n) S(x,n) T(x) e(x)0 0.0193 0.0190 100,000 1,900 98,285 0.9800 7,271,729 72.7 1 0.0008 0.0030 98,100 294 391,693 0.9972 7,173,444 73.1 5 0.0003 0.0017 97,806 165 488,618 0.9984 6,781,751 69.3
10 0.0003 0.0014 97,641 140 487,857 0.9980 6,293,133 64.5 15 0.0006 0.0028 97,501 273 486,884 0.9965 5,805,275 59.5 20 0.0008 0.0040 97,229 391 485,193 0.9960 5,318,392 54.7 25 0.0008 0.0039 96,838 377 483,253 0.9959 4,833,199 49.9 30 0.0009 0.0044 96,461 423 481,282 0.9950 4,349,946 45.1 35 0.0012 0.0058 96,038 561 478,875 0.9926 3,868,664 40.3 40 0.0019 0.0093 95,477 890 475,353 0.9874 3,389,789 35.5 45 0.0034 0.0167 94,587 1,582 469,346 0.9777 2,914,436 30.8 50 0.0059 0.0289 93,005 2,691 458,896 0.9611 2,445,090 26.3 55 0.0104 0.0507 90,314 4,575 441,052 0.9348 1,986,195 22.0 60 0.0171 0.0822 85,739 7,046 412,302 0.8948 1,545,143 18.0 65 0.0283 0.1328 78,693 10,452 368,920 0.8314 1,132,840 14.4 70 0.0470 0.2114 68,240 14,428 306,737 0.7373 763,920 11.2 75 0.0774 0.3251 53,812 17,496 226,163 0.5053 457,183 8.5 80 0.1572 ... 36,316 36,316 231,020 ... 231,020 6.4

51
Brief explanation of a life table (Tables 20 and 21)
A life table is used to simulate the lifetime mortality experience of a population. It does so by taking that population’s age-specific death rates and applying them to a hypothetical population of 100,000 people born at the same time. For each year on the life table, death inevitably thins the hypothetical population’s ranks until, in the bottom row of statistics, even the oldest people die. Column “m(x,n)” shows the proportion of each age group dying in each age interval. These data are based on the observed mortality experience of a population. Column “l(x)” shows the number of people alive at the beginning of each age interval, starting with 100,000 at birth. Column “d(x,n)” shows the number who would die within each age interval. Column “L(x,n)” shows the total number of person-years that would be lived within each age interval. Column “T(x)” shows the total number of years of life to be shared by the population in the age interval and in all subsequent intervals. This measure takes into account the frequency of deaths that will occur in this and all subsequent intervals. As age increases and the population shrinks, the total person-years that the survivors have to live necessarily diminish. Life expectancy is shown in Column “e(x)” — the average number of years remaining for a person at a given age interval. The first value in column “e(x)” represents life expectancy at birth. The first value in column “q(x,n)” is an approximation of the infant mortality rate (IMR). The second value in column “q(x,n)” is an approximation of the child mortality rate. m(x,n) = age-specific death rate q(x,n) = the probability of dying between two exact ages l(x) = the number of survivors at exact age x d(x,n) = the number of deaths between two exact ages, x and x+n L(x,n) = the number of person-years that would be lived within the indicated age interval (x and x+n) by the cohort of 100,000 births assumed. S(x,n) = probability of surviving between two exact ages, x and x+n T(x) = total number of person-years that would be lived after the beginning of the indicated age interval by the cohort of 100,000 births assumed. e(x) = expectation of life from age x

52
Finally the annual number of deaths by age and sex can be calculated by multiplying the age-specific-death rates – the m(x) values in column 2 of tables – by the male and female population size of each respective age group. The results are displayed in Table 22.
Table 22: Estimated number of deaths, and crude death rates (CDR) based on life table's age-specific-death rates [m(x)] and enumerated population size, Vanuatu: 2009
CDR: crude death rate
The crude death rate (CDR) is calculated as follows:
CDR = 1,260 / 234,023 x 1,000 = 5.4 (5 deaths per 1,000 population in 2009)
Males Females Total Males Females Males Females Total0 3,731 3,374 7,105 0.0224 0.0193 84 65 149 1 - 4 13,579 12,683 26,262 0.0010 0.0008 14 10 23 5 - 9 15,455 14,230 29,685 0.0006 0.0003 10 5 15 10 - 14 14,762 13,159 27,921 0.0006 0.0003 8 4 12 15 - 19 12,027 11,855 23,882 0.0011 0.0006 13 7 20 20 - 24 10,415 11,126 21,541 0.0014 0.0008 15 9 24 25 - 29 9,124 9,291 18,415 0.0014 0.0008 13 7 20 30 - 34 7,790 7,903 15,693 0.0016 0.0009 13 7 20 35 - 39 7,076 7,095 14,171 0.0021 0.0012 15 8 23 40 - 44 5,814 5,709 11,523 0.0031 0.0019 18 11 29 45 - 49 5,066 5,175 10,241 0.0051 0.0034 26 17 43 50 - 54 3,789 3,626 7,415 0.0082 0.0059 31 21 52 55 - 59 3,261 3,102 6,363 0.0134 0.0104 44 32 76 60 - 64 2,192 2,127 4,319 0.0213 0.0171 47 36 83 65 - 69 2,054 1,772 3,826 0.0339 0.0283 70 50 120 70 - 74 1,085 983 2,068 0.0545 0.0470 59 46 105 75 - 79 941 799 1,740 0.0875 0.0774 82 62 144 80+ 930 923 1,853 0.1680 0.1572 156 145 301 Total 119,091 114,932 234,023 718 543 1,260 CDR* 6.0 4.7 5.4
Age group
Estimated number of deathsm(x,n)Population size

53
Table 23: General mortality indicators, Vanuatu: 2009
The above mortality indicators clearly show more positive mortality indicators for females than for males, with females living longer, on average about three years longer, than males (Table 23). The findings are supported by the following data:
the proportion of surviving female children was higher than males (Fig.42); more mothers than fathers survive to older ages (Fig.44); and the proportion of widowed females was considerably higher than that of widowed males
(Fig.45), indicating earlier death of male spouses.
3.2.2 Sub national estimates This section contains some mortality estimates by urban-rural distinction, and by province. All estimates are based on results derived through application of the same data and methodology as those used deriving the national estimates (data on children ever born and still alive, and on orphanhood – father/mother still alive). A general observation is that all mortality indicators show better values in the urban than the rural areas, and that females are in general better off than males, although there are some exceptions to the general trend which is shown below. The summary of main indicators in front of the report summarizes various mortality indicators by sex and place of residence, and figures show the results visually. Children of mothers living in urban areas and/or the province of Shefa have a higher probability of survival than children of women living in rural areas (Fig.46). Compared to the national average, children of mothers living in Torba or Tafea had the lowest probability of survival. A higher proportion of female children ever born have survived than male children. Of the population aged 60 years and older, almost 3 times more females (27.4%) were widowed than males (9.6%). The proportion males and females 60 years and older who are widowed was the highest in the province of Torba followed by Penama (Fig. 47). The proportions widowed were considerably higher in the rural than the urban areas. However, when interpreting the results it needs to be mentioned that males are usually older than their spouses, in Vanuatu by about 3 years. Figure 48 shows the proportions of the population orphaned, which means that either their biological father or mother had died. On average a quarter of the population responded that their father had died, compared to 19% of their mothers. Clearly mothers survive to older ages than
Indicator Males Females Total
Life expectancy at birth, E(0) 69.6 72.7 71.1
Crude death rate (CDR) 6.0 4.7 5.4

54
fathers. However, as mentioned before, fathers are usually older than mothers, because of their age difference at marriage. In general, the proportion of the population orphaned was higher in the rural than urban areas, and it was particularly high in Penama and Malampa. Fortunately one of the most important mortality indicators, the infant mortality rate (IMR) has decreased since the last census in 1999, and stands at 22 and 19 infant deaths per 1000 live births for males and females respectively (Fig.49). In general the IMR of males is higher than that of females, with the exceptions of the provinces Torba, Penama, and Tafea. These are also the provinces with the highest IMR in general. Infant mortality rates are significantly lower in the urban than the rural areas. One likely important factor is the better accessibility of (reproductive) health services. Figures 50 and 51 show the life expectancies at age 20 (e20) and life expectancy at birth (e0). The pattern of both indicators is very similar. In general females live on average 3 years longer than males. Life expectancies in the rural areas are considerably lower than in the urban areas, where the difference between male and female life expectancies is much lower than in the rural areas. The lowest life expectancies were calculated for Penama and Torba. Life tables for males and females for each province are presented in Apps.8-19.
Figure 46: Proportion of children ever born and still alive by sex and place of residence,
Vanuatu: 2009
96.496.8
90
91
92
93
94
95
96
97
98
99
100
Urban Rural Torba Sanma Penama Malampa Shefa Tafea
Prop
orti
on o
f chi
ldre
n ev
er b
orn
still
aliv
e (%
)
Males Females National average-Males National average-Females

55
Figure 47: Proportion of population 60 years and older widowed by sex and place of residence, Vanuatu: 2009
Figure 48: Proportion of population with father or mother dead (orphaned) by place of residence, Vanuatu: 2009
9.6
27.4
0
5
10
15
20
25
30
35
40
45
50
Urban Rural Torba Sanma Penama Malampa Shefa Tafea
Prop
orti
on o
f pop
ulat
ion
60+
wid
owed
(%)
Males Females National average-Males National average-Females
25.0
19.3
0
5
10
15
20
25
30
Urban Rural Torba Sanma Penama Malampa Shefa Tafea
Prop
orti
on o
f pop
ulat
ion
wit
h fa
ther
or m
othe
r dea
d (%
)
Father Mother National average-Father National average-Mother

56
Figure 49: Infant mortality rate (IMR) by sex and place of residence, Vanuatu: 2009
Figure 50: Life expectancy at age 20 (e20) by sex and place of residence, Vanuatu: 2009
22
19
0
5
10
15
20
25
30
35
40
Urban Rural Torba Sanma Penama Malampa Shefa Tafea
IMR
Males Females National average-Females National average-Males
52.1
54.7
40
45
50
55
60
Urban Rural Torba Sanma Penama Malampa Shefa Tafea
Life
exp
ecta
ncy
at a
ge 2
0 (e
20) (
in y
ears
)
Males Females National average-Males National average-Females

57
Figure 51: Life expectancy at birth (e0) by sex and place of residence, Vanuatu: 2009
69.6
72.7
50
55
60
65
70
75
Urban Rural Torba Sanma Penama Malampa Shefa Tafea
Life
exp
ecta
ncy
at b
irth
(e0)
(in
year
s)
Males Females National average-Males National average-Females

58
3.2.3 Proximate determinants of mortality This section does not attempt to provide a comprehensive analysis of variables that determine the level of mortality in Vanuatu. It merely provides some observations of possible correlations of variables, and hopefully entices research into a more detailed analysis of factors that determine Vanuatu’s mortality levels and trends. The interdependency between the levels of fertility and mortality has been shown in the previous section on fertility (Figs.40-41). Both graphs show that there is a correlation between the level of fertility and mortality: the higher the level of fertility, the higher the level of mortality. Again, the importance of education is highlighted in figures where the correlation between the IMR and life expectancy at birth with various educational indicators is illustrated. The data seem to indicate the following correlations:
- the higher the literacy rate, the lower is the IMR (Fig.52), and the higher is the life expectancy at birth (Fig.53);
- the higher the proportion of the population that has never been to school, the higher the IMR (Fig.54); and
- the higher the proportion of the population with secondary education, the higher the life expectancy at birth (Fig.55).
However, please note that other intermediate factors can influence the degree of correlation shown in the graphs such as the age structure of the population, environmental factors, access and availability of quality health services etc.

59
Figure 52: Infant mortality rate (IMR) and literacy rate of population aged 15 years and older (%) by place of residence, Vanuatu: 2009
Note: R² is 0.84 if the outlier Torba is omitted
Figure 53: Life expectancy at birth (e0) and literacy rate of population aged 15 years and
older (%) by place of residence, Vanuatu: 2009
Vanuatu
Urban
Rural
Malampa
PenamaSanma
Shefa
Tafea
Torba
R² = 0.4827
0
10
20
30
40
50
60
70
80
90
100
16 18 20 22 24 26 28 30 32
Lite
racy
rate
of p
opul
atio
n 15
+ (%
)
IMR
Vanuatu
Urban
Rural
MalampaPenama
Sanma
Shefa
Tafea
Torba
R² = 0.418
0
10
20
30
40
50
60
70
80
90
100
68.5 69.0 69.5 70.0 70.5 71.0 71.5 72.0 72.5 73.0
Lite
racy
rate
of p
opul
atio
n ag
ed 1
5+ (%
)
Life expectancy at birth (e0) (in years)

60
Figure 54: Infant mortality rate (IMR) and proportion of population never been to school (%) by place of residence, Vanuatu: 2009
Note: R² is 0.83 if the outlier Torba is omitted
Figure 55: Life expectancy at birth (e0) and proportion of population 15 years and older
with secondary education (%) by place of residence, Vanuatu: 2009
Vanuatu
Urban
Rural
Malampa
Penama
Sanma
Shefa
Tafea
Torba
R² = 0.5306
0
5
10
15
20
25
30
35
40
45
16 18 20 22 24 26 28 30 32
Prop
orti
on o
f pop
ulat
ion
15+
neve
r bee
n to
scho
ol (%
)
IMR
Vanuatu
Urban
Rural Malampa
PenamaSanma
Shefa
Tafea
Torba
R² = 0.6556
0
5
10
15
20
25
30
35
40
45
50
68.5 69.0 69.5 70.0 70.5 71.0 71.5 72.0 72.5 73.0
Prop
orti
on o
f pop
ulka
tion
15+w
ith
seco
ndar
y ed
ucat
ion
(%)
Life expectancy at birth in years)

61
3.3 Migration
3.3.1 Internal migration Internal migration — the movement of people from one island or region of Vanuatu to another — can be estimated by comparing:
place of usual residence with the place of residence during the census enumeration; and/or
place of residence five years prior to the census with the place of residence during the census enumeration; and/or
place of birth with the place of residence during the census enumeration; and the population size of geographic units from one census count to the next.
Usual place of residence Based on the question regarding place of usual residence, 96% of the total population answered that their place of enumeration was also their place of usual residence, and only about 4% were enumerated at a place different from their usual place of residence (Table 24). Less than 0.2% of the population had their usual place of residence overseas of which most were enumerated in the urban areas of Shefa (Port Vila). Table 24: Total population by place of enumeration and usual place of residence, Vanuatu:
2009
Residence five years prior to the census Based on the question regarding place of residence five years prior to the census (in 2004), 84% of the total population aged 5 and older answered that they had not moved from their current (November 2009) place of residence, 15% (29,000 people) said that they lived elsewhere in Vanuatu, and 1,616 people (0.8%) said that they were overseas 5 years ago (Table 25). Please
in country overseasUrban 57,195 54,354 2,541 300 Rural 176,828 170,981 5,685 162 Torba 9,359 9,133 225 1 Sanma 45,855 43,545 2,240 70 Penama 30,819 29,997 815 7 Malampa 36,727 35,555 1,152 20 Shefa 78,723 75,501 2,868 354 Tafea 32,540 31,604 926 10 Vanuatu 234,023 225,335 8,226 462
Usual place of residencePlace of residence at time of census
Same as place of enumeration
eslsewhere

62
note that ‘elsewhere in Vanuatu’ includes places in the same province as place of enumeration, i.e. people moved inside their own province.
Table 25: Population* 5 years and older by place of enumeration and usual residence five years ago (in 2004), Vanuatu: 2009
*population living in private households
Data on provincial migration are displayed in Table 26. Here movement is measured in terms of changing a province, and excludes movements inside one and the same province. Shefa had a net gain of 158 people from Torba province (247 minus 89), a net gain of 1,371 people from Sanma (2,177 minus 806), a net gain of 1,877 people from Penama (2,194 minus 317), a net gain of 1,784 from Malampa (2,511 minus 727), and a net gain of 631 people from Tafea (1,396 minus 765). Overall Shefa gained 5,821 people from all other provinces during the five-year period prior to the census (Table 26). Torba on the other hand had a net loss of 274 people to all other provinces, Sanma a net loss of 587 people, Penama a net loss of 2,255 people, Malampa lost 2,038, and Tafea had a net loss of 667 people (Table 27 and Fig.56)). Clearly internal migration during the 5-year period 2004-2009 was primarily directed towards Shefa province, and certainly to the capital Port Vila.
in country overseasUrban 49,045 33,023 14,803 1,219 Rural 146,755 132,159 14,197 399 Torba 7,792 6,965 817 10 Sanma 37,617 31,542 5,918 157 Penama 25,362 23,597 1,714 51 Malampa 30,921 28,498 2,397 26 Shefa 67,201 49,538 16,311 1,352 Tafea 26,907 25,042 1,843 22 Vanuatu 195,800 165,182 29,000 1,618
Place of residence at time of census
Usual place of residence 5 years ago Same as place
of enumeration eslsewhere

63
Table 26: Population* 5 years and older by place of enumeration and province of usual residence five years ago (in 2004), Vanuatu: 2009
= non-movers (i.e. those people who did not change their residence during the reference period *population living in private households
Table 27: Interprovincial migration during the five-year period prior to the 2009 census, Vanuatu 2009
Province Torba Shefa TafeaTorba 7,792 7,461 171 33 20 89 8 10Sanma 37,617 265 34,867 712 671 806 139 157Penama 25,362 20 380 24,464 100 317 30 51Malampa 30,921 48 363 132 29,556 727 69 26Shefa 67,201 247 2,177 2,194 2,511 57,324 1,396 1,352Tafea 26,907 15 89 31 75 765 25,910 22Vanuatu 195,800 8,056 38,047 27,566 32,933 60,028 27,552 1,618
Place of residence at time of census
Usual place of residence 5 years ago
Total Sanma Penama OverseasMalampa
Province
Torba 321 595 -274
Sanma 2,593 3,180 -587
Penama 847 3,102 -2,255
Malampa 1,339 3,377 -2,038
Shefa 8,525 2,704 5,821
Tafea 975 1,642 -667
Vanuatu 14,600 14,600 0
In-Migrants Out-Migrants Net Migrants

64
Figure 56: Interprovincial net migration during the five-year period prior to the 2009 census, Vanuatu 2009
Place of birth (lifetime migration) Sixty-six per cent (152,193) of Vanuatu’s population was living at the same place where they were born, 32% (73,741 people) were born in Vanuatu but not at their current (November 2009) place of residence, and just over 1% (2,949 people) of the population was born overseas (Table 28).
Table 28: Population by place of residence and place of birth, Vanuatu: 2009
-274
-587
-2,255
-2,038
5,821
-667
-3,000 -2,000 -1,000 0 1,000 2,000 3,000 4,000 5,000 6,000 7,000
Torba
Sanma
Penama
Malampa
Shefa
Tafea
Number of people
in country overseasUrban 56,061 19,730 34,114 2,217 Rural 172,822 132,463 39,627 732 Torba 9,189 7,260 1,904 25 Sanma 44,287 26,558 17,377 352 Penama 29,926 24,503 5,366 57 Malampa 36,060 28,568 7,440 52 Shefa 77,047 38,100 36,534 2,413 Tafea 32,374 27,204 5,120 50 Vanuatu 228,883 152,193 73,741 2,949
Place of residence at time of census
Place of birth Same as place
of enumeration eslsewhere

65
Almost one quarter (56,146) of the population was born in Shefa province, 20% in Malampa (45,868), almost 18% (40,262) in Sanma, about 16% each in Penama and Tafea, and just over 4% were born in Torba (Table 29). The vast majority of the overseas born population lived in Shefa. It is interesting to note that 34% of the population lives in Shefa today, while only 25% were born there. Overall only two-thirds (51,503) of Shefa’s population was born in Shefa, while more than 90% of the population in Torba, Penama, Malampa, and Tafea were also born there. Only 77% of the 2009 population of Sanma was also born in Sanma. Therefore data on lifetime migration (number of people by place of residence and place of birth) indicate that the direction of internal migration flows was mainly towards Shefa province. Table 29: Population by provincial place of residence in 2009 and province of birth
(lifetime migration), Vanuatu: 2009
= non-movers (i.e. those people who did not change their residence during the reference period Based on the above data, it can be seen that Shefa had a net gain of 18,488 people, mainly from Malampa. The only other province that had a net gain of people was Sanma with 3,673 people, mainly from Malampa and Penama (Table 30 and Fig.57).
Table 30: Interregional lifetime migration, Vanuatu: 2009
Province Torba Shefa TafeaTorba 9,189 8,433 328 177 69 133 24 25Sanma 44,287 1,067 34,257 3,002 3,234 1,864 510 352Penama 29,926 95 597 28,240 473 381 83 57Malampa 36,060 159 780 521 33,054 1,271 223 52Shefa 77,047 579 4,168 5,289 8,785 51,503 4,309 2,413Tafea 32,374 40 132 132 252 993 30,775 50Vanuatu 228,883 10,373 40,262 37,361 45,868 56,146 35,924 2,949
Place of residence at time of census
Usual place of birth
Total Sanma Penama Malampa Overseas
Province
Torba 731 1,940 -1,209
Sanma 9,678 6,005 3,673
Penama 1,629 9,121 -7,492
Malampa 2,954 12,814 -9,860
Shefa 23,131 4,642 18,488
Tafea 1,549 5,149 -3,600
Vanuatu 39,672 39,672 0
In-Migrants Out-Migrants Net Migrants
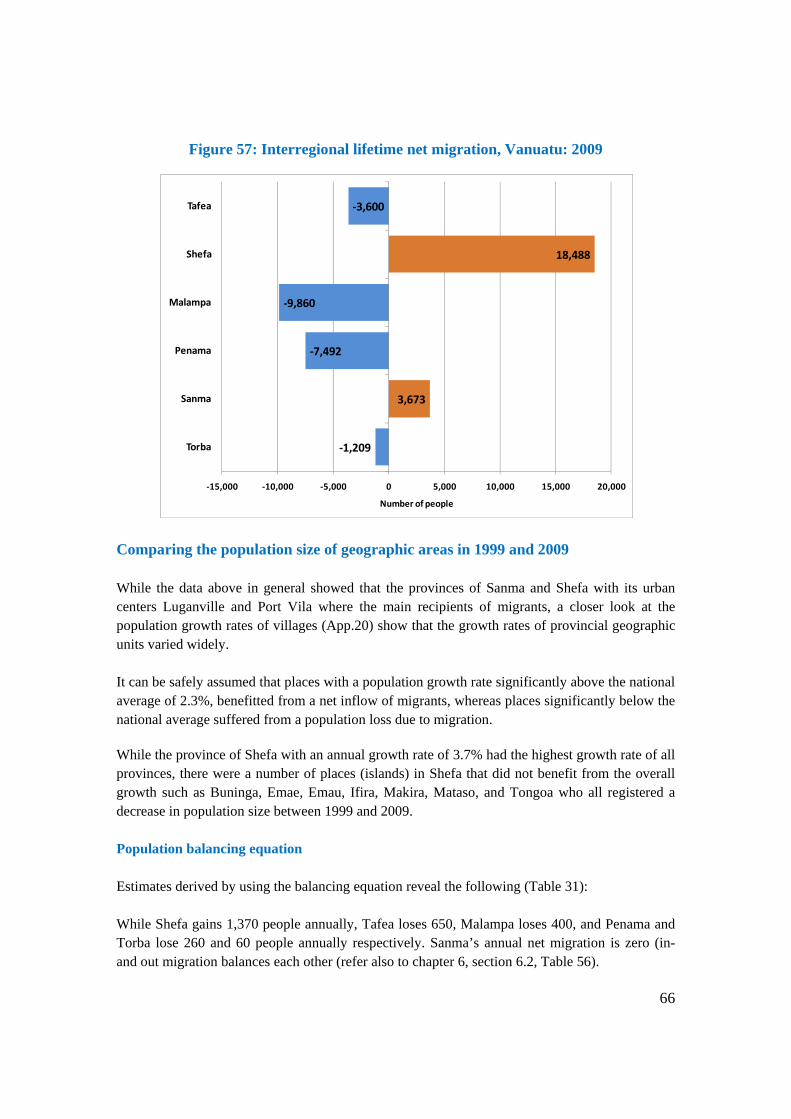
66
Figure 57: Interregional lifetime net migration, Vanuatu: 2009
Comparing the population size of geographic areas in 1999 and 2009 While the data above in general showed that the provinces of Sanma and Shefa with its urban centers Luganville and Port Vila where the main recipients of migrants, a closer look at the population growth rates of villages (App.20) show that the growth rates of provincial geographic units varied widely. It can be safely assumed that places with a population growth rate significantly above the national average of 2.3%, benefitted from a net inflow of migrants, whereas places significantly below the national average suffered from a population loss due to migration. While the province of Shefa with an annual growth rate of 3.7% had the highest growth rate of all provinces, there were a number of places (islands) in Shefa that did not benefit from the overall growth such as Buninga, Emae, Emau, Ifira, Makira, Mataso, and Tongoa who all registered a decrease in population size between 1999 and 2009. Population balancing equation Estimates derived by using the balancing equation reveal the following (Table 31): While Shefa gains 1,370 people annually, Tafea loses 650, Malampa loses 400, and Penama and Torba lose 260 and 60 people annually respectively. Sanma’s annual net migration is zero (in- and out migration balances each other (refer also to chapter 6, section 6.2, Table 56).
-1,209
3,673
-7,492
-9,860
18,488
-3,600
-15,000 -10,000 -5,000 0 5,000 10,000 15,000 20,000
Torba
Sanma
Penama
Malampa
Shefa
Tafea
Number of people

67
In proportion to the population size of each province, the migration rates are as follows: while Shefa gains 1.6% of its population through migration, Tafea loses 1.9% of its population; Malampa loses 1%, Penama 0.8%, and Torba 0.6% annually.
Table 31: Estimates of annual net migration by province, Vanuatu: 2009
Torba Sanma Penama Malampa Shefa Tafea Vanuatu
Annual net migrants -60 0 -260 -400 1,370 -650 0
Annual net migration rate -0.6 0.0 -0.8 -1.0 1.6 -1.9 0.0

68
3.3.2 International migration International migration refers to people who cross national boundaries to move to another country. In addition to this spatial consideration, time also plays a major role in the analysis of migration. People are usually regarded as migrants only after spending a minimum period of time in their country of destination. Usually the minimum time required to qualify as a migrant is half a year in-country, and sometimes even a full year. Someone coming for a short visit is not considered to be a migrant — he or she is considered to be a visitor or tourist. Intent is also of crucial importance, as migration usually involves a change of a person’s permanent residential address in pursuit of employment or educational opportunities. The need to consider time and intent highlights one of the key problems concerning migration. Whether or not a particular person qualifies as a migrant can only be established after a certain period of time, usually at least six months, in order to determine whether the arriving and departing person qualifies as a visitor or migrant. The net impact of migration flows (net migration) is measured as the difference between the number of arrivals (immigrants) and departures (emigrants) during a certain time period. Therefore, if net migration was positive it means that the number of arrivals (immigrants) was higher than the number of departures (emigrants); if net migration was negative, the number of departures (emigrants) was higher than the number of arrivals. The 2009 census included three questions that provide an indication of the level of immigration. Questions were asked about a respondent's:
usual place of residence; residence five years prior to the census; and place of birth.
Regarding respondent’s usual place of residence, only 462 answered that they usually live overseas; all other persons (233,561) had their usual residence in Vanuatu in 2009 (Table 24). Regarding residential address five years prior to the census, 1,618 people (or less than 1%) of the population five years and older answered that they lived overseas (Table 25). Regarding place of birth, 2,949 people (or just over 1% of the population) answered that they were born overseas (Table 28). However, these questions only give an indication on the level of immigration The only indirect method for deriving at a crude indication of Vanuatu’s net migration level would be to apply the balancing equation to the intercensal 1999–2009 population growth rate.
Net migration = Arrivals (immigrants) minus Departures (emigrants)

69
Balancing equation
Population growth = Births minus Deaths plus Net migration Net migration rate can be estimated as Net migration = Population growth minus Births plus Deaths
The intercensal population growth rate was 2.3%, and the estimated CBR and CDR are 31.3 per 1000 and 5.4 per 1000. The derived net migration rate would be:
2.3 – 3.13 + 0.54 = -0.29% However, there are strong indications that the 2009 census suffered from a slight under count in some age groups, as described in more detail in chapter 6, which would adjust the intercensal growth rate to about 2.6%. In this case, the calculated net migration rate would be zero, and no significant international migration had occurred during the intercensal period 1999-2009.

70
4. SOCIAL CHARACTERISTICS
4.1 Marital status During the 2009 census, 50% of males (35,555) and 53% of females (37,704) aged 15 and older were legally married and another 13% of males and females were living in a de facto relationship (Fig.58). The proportion never married (single), were 35% of males (25,255) and 27% of females (19,438). A higher proportion of females (5%) were widowed than males (1%).
Figure 58: Population aged 15 and older by marital status, Vanuatu: 2009
The age at marriage is an important proximate determinant of fertility. Women who marry at an early age often have more children than those marrying later. The higher proportion of young married women compared with men of the same age indicates that women generally marry at younger ages than men (Table 32 and Fig.59). The average age at marriage was 25.5 and 22.5 years for males and females, respectively, and was calculated based on the proportion of those never married/single by age. There were notable differences in the age at marriage between provinces (Fig.61). While the age at marriage was oldest in Malampa and
25,255
35,555
9,049
1,017463 225
19,438
37,704
9,987
3,236
790 3310
5,000
10,000
15,000
20,000
25,000
30,000
35,000
40,000
Never married Legally married Defacto married Widowed Seperated Divorced
Num
ber
of p
eopl
e
Marital status
Males Females

71
Shefa, it was very young in Tafea where the age difference between spouses was the smallest (1.8 years). While only 3% of males were married at ages 15-19, it was almost 12% of females (Table 32 and Figs.60 and 62). At age 20-24 more than half of all women were already married compared with 29% of males. Compared to earlier censuses, the percentage of males and females married at young ages has declined, while the age difference between males and females has slightly increased compared to the 1989 and 1999 censuses. Table 32: Singulate mean age at marriage (SMAM9) and percentage married at young ages
by sex, Vanuatu: 1967, 1979, 1989, 1999, and 2009
9 1983. United Nations. Manual X, indirect techniques for demographic estimation. New York: United Nations. 304 p.
Age differenceMales Females males - females Males Females Males Females
1967 26.6 21.2 5.41979 26.1 22.2 3.9 2.8 10.3 32.1 56.41989 25.2 22.6 2.6 3.4 12.8 30.9 58.01999 25.3 23.0 2.3 2.6 14.0 28.9 59.02009 25.5 22.5 3.0 3.2 11.5 28.6 54.7
Average age at first marriage Percentage ever married by age group (%)
YearSMAM* 15-19 20-24

72
Figure 59: Singulate mean age at marriage (SMAM) by sex, Vanuatu: 1967-2009
Figure 60: Population married at young ages by sex (%), Vanuatu: 1979, 1989, 1999, and 2009
15
20
25
30
1967 1979 1989 1999 2009
Age
Census year
Males Females
0
5
10
15
20
25
30
35
40
45
50
55
60
Males Females Males Females
age 15-19 years age 20-24 years
%
1979 1989 1999 2009

73
Figures 63 and 64 display the proportion of males and females married/never married by age. Clearly these two figures complement each other. When the proportion of the population married at a certain age is low, it is high for the proportion of the population never married at the same age, and vice versa. Furthermore, the proportion of females in a married status is higher than that of males until age 34. Then the proportion of married females is steadily declining because an increasing number of females become widows (Fig.65). The discrepancy between the proportion of widowed males and widowed females, at ages 40 and older, increased continuously (Fig. 65). Between ages 40–45, only 1% of males were widowed, compared with 3% of females. At age 60 and older, only 10% of males were widowed, compared with 27% of females. The higher proportion of widowed females is explained by:
lower female mortality rates, and therefore longer life expectancies of female spouses; and
older age at marriage of males compared with their female partners as expressed in the average age at marriage (SMAM) above.
Therefore, male spouses usually die before their female partners.
Figure 61: Average age at marriage (SMAM) by sex and province, Vanuatu: 2009
25.5
25.1
25.6
25.9 25.9
23.9
22.7
22.1 21.9
23.1
22.8
22.1
25.5
22.5
20
21
22
23
24
25
26
Torba Sanma Penama Malampa Shefa Tafea
SMA
M (i
n ye
ars)
Males Females National average - Males National average - Females

74
Figure 62: Population married at age 15-19 years by sex and province (%), Vanuatu: 2009
Figure 63: Population aged 15 and older by sex and proportion married, Vanuatu: 2009
Note: ‘Married’ include legally married and de facto relationships
0.8
3.3
2.42.8
4.0
2.5
15.8
14.5
10.0 9.8
11.1
9.8
3.2
11.5
0
2
4
6
8
10
12
14
16
18
Torba Sanma Penama Malampa Shefa Tafea
%
Males Females National average - Males National average -Females
0
10
20
30
40
50
60
70
80
90
100
15 - 19 20 - 24 25 - 29 30 - 34 35 - 39 40 - 44 45 - 49 50 - 54 55 - 59 60 - 64 65 - 69 70 - 74 75+
Pro
port
ion
mar
ried
(%
)
Age group
Males Females

75
Figure 64: Population aged 15 and older by sex and proportion never married (single), Vanuatu: 2009
Figure 65: Population aged 15 and older by sex and proportion widowed, Vanuatu: 2009
0
10
20
30
40
50
60
70
80
90
100
15 - 19 20 - 24 25 - 29 30 - 34 35 - 39 40 - 44 45 - 49 50 - 54 55 - 59 60 - 64 65 - 69 70 - 74 75+
Pro
port
ion
neve
r m
arri
ed (
%)
Age group
Males Females
0
5
10
15
20
25
30
35
40
45
50
15 - 19 20 - 24 25 - 29 30 - 34 35 - 39 40 - 44 45 - 49 50 - 54 55 - 59 60 - 64 65 - 69 70 - 74 75+
Pro
port
ion
wid
owed
(%)
Age group
Males Females

76
4.2 Religion The question on religion was not compulsory. Nevertheless, only 0.2% or 484 people refused to respond or did not respond to this question. The Presbyterian Church of Vanuatu (PCV) continued to be the dominant religious denomination in Vanuatu, although its share had decreased from 36% in 1989 to 28% or 65,345 persons in 2009 (Table 33 and Fig.66).
Table 33: Population by religious affiliation, Vanuatu: 1989, 1999 and 2009
Note: ‘Others’ refers to newly formed religions
The next largest group was the Anglican Church with 35,256 members, with a share of 15% of all denominations, followed by the Seventh Day Adventist Church (SDA) and the Catholic Church with a share of 12% each. Other denominations (Church of Christ, Assemblies of God, Neil Thomas Ministry and Customary beliefs) had less than 5% of the population as members and persons with no religion comprised of 1% of the Vanuatu population. The category “Others” comprises of 88 different religions ranging from 1 member to more than 2 thousand members. The compositions of the different religious denominations were markedly different between the provinces (Fig.67). While Penama and especially Torba were dominated by the Anglican Church, the Presbyterian Church was the main religion in Malampa and Shefa. While the Presbyterian Church was also strong in Sanma, this province showed the most diverse mix of religions of all provinces.
Religion 1989 1999 2009Anglican 19,949 25,084 35,256 Presbyterian 50,951 58,540 65,345 Catholic 20,613 24,515 28,933 SDA 11,737 20,068 29,251 Church of Christ 6,745 8,047 10,593 Assemblies of God - 8,040 11,078 Neil Thomas Minsitry - 6,406 7,223 Apostolic - 3,377 5,231 Customary beliefs 6,484 10,365 8,600 No religion 2,437 1,919 2,554 Refuse to answer 5,755 2,374 484 Others 17,748 17,943 29,475
Total 142,419 186,678 234,023
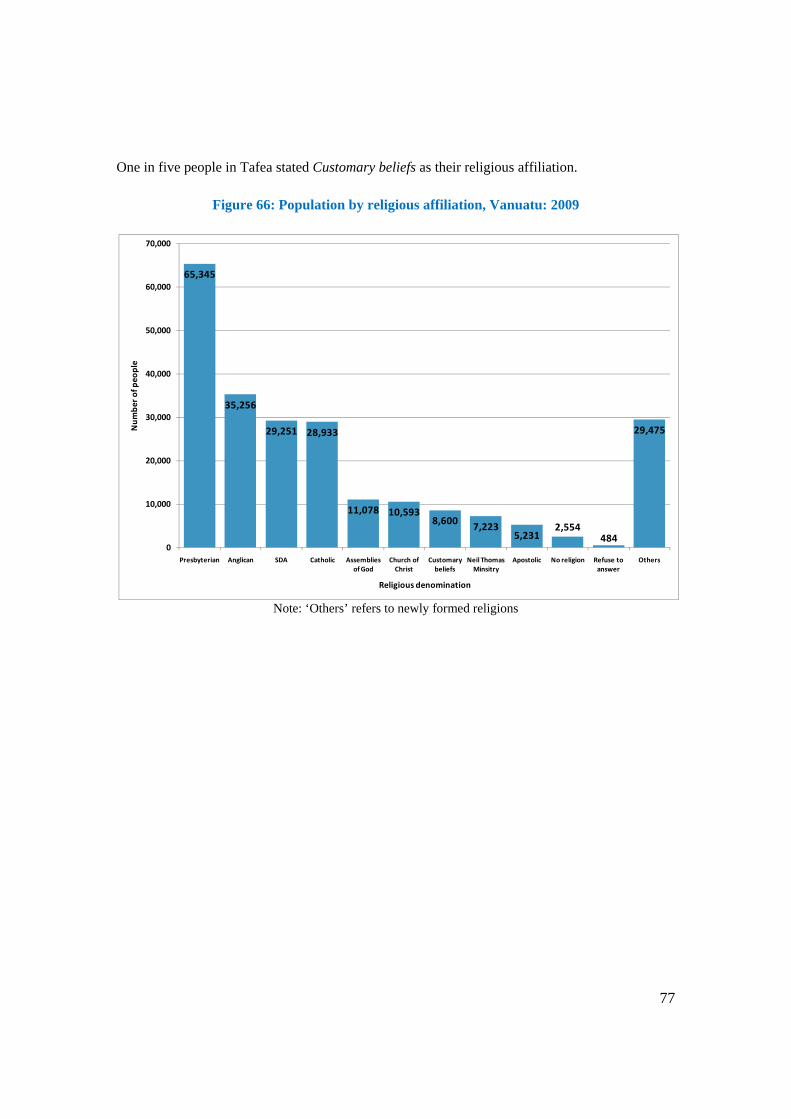
77
One in five people in Tafea stated Customary beliefs as their religious affiliation.
Figure 66: Population by religious affiliation, Vanuatu: 2009
Note: ‘Others’ refers to newly formed religions
65,345
35,256
29,251 28,933
11,078 10,5938,600 7,223
5,2312,554
484
29,475
0
10,000
20,000
30,000
40,000
50,000
60,000
70,000
Presbyterian Anglican SDA Catholic Assemblies of God
Church of Christ
Customary beliefs
Neil Thomas Minsitry
Apostolic No religion Refuse to answer
Others
Num
ber o
f peo
ple
Religious denomination

78
Figure 67: Population by religious affiliation by province, Vanuatu: 2009
Note: ‘Others’ refers to newly formed religions
4.3 Ethnic origin
Based on information on the number of people by ethnic origin, Vanuatu has a very homogenous population composition, with 98% or 223,394 persons being Ni-Vanuatu, 1% or 2,617 persons were Part Ni-Vanuatu and 1% or 2,872 persons were of foreign descent (Table 34 and Figure 68). The largest single groups of foreign descent were of Australian, New Zealander and European origin (1,566), followed by Melanesians other than N-Vanuatu (507), and Asians (496).
0%
10%
20%
30%
40%
50%
60%
70%
80%
90%
100%
TORBA SANMA PENAMA MALAMPA SHEFA TAFEA
Anglican Presbyterian Catholic SDA
Church of Christ Assemblies of God Neil Thomas Minsitry Apostolic
Customary beliefs No religion Refuse to answer Others
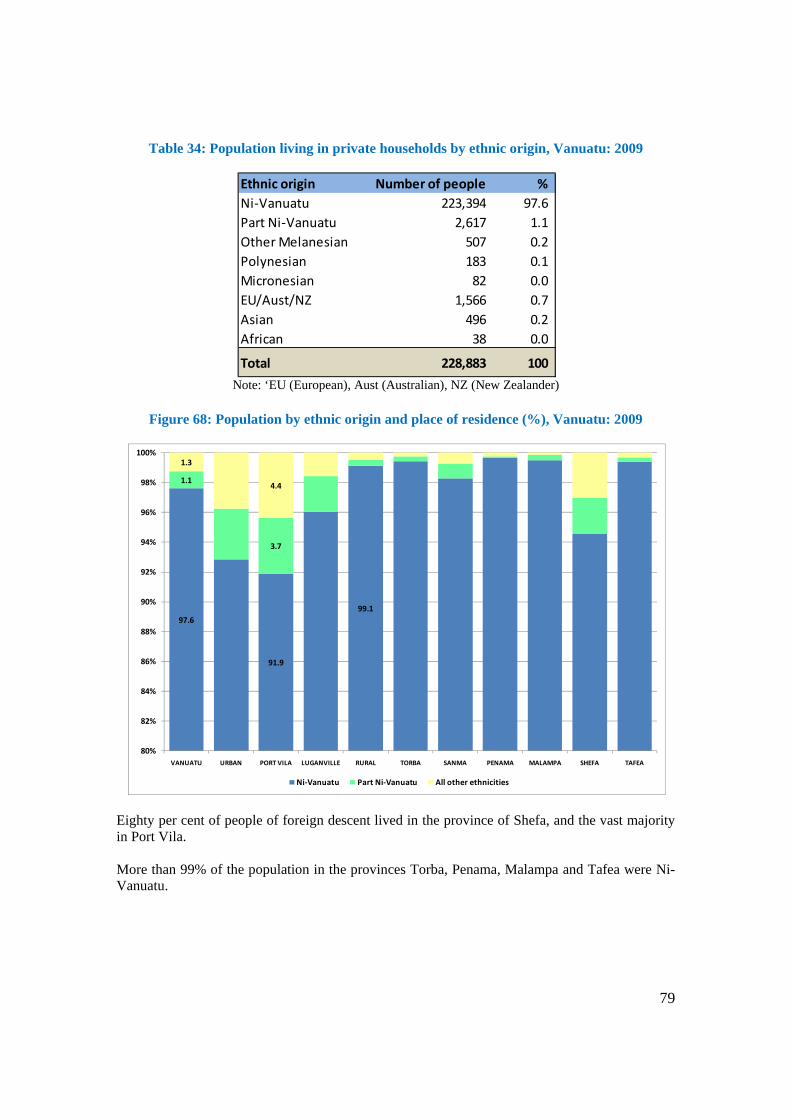
79
Table 34: Population living in private households by ethnic origin, Vanuatu: 2009
Note: ‘EU (European), Aust (Australian), NZ (New Zealander)
Figure 68: Population by ethnic origin and place of residence (%), Vanuatu: 2009
Eighty per cent of people of foreign descent lived in the province of Shefa, and the vast majority in Port Vila. More than 99% of the population in the provinces Torba, Penama, Malampa and Tafea were Ni-Vanuatu.
Ethnic origin Number of people %Ni-Vanuatu 223,394 97.6 Part Ni-Vanuatu 2,617 1.1 Other Melanesian 507 0.2 Polynesian 183 0.1 Micronesian 82 0.0 EU/Aust/NZ 1,566 0.7 Asian 496 0.2 African 38 0.0
Total 228,883 100
97.6
91.9
99.1
1.1
3.7
1.3
4.4
80%
82%
84%
86%
88%
90%
92%
94%
96%
98%
100%
VANUATU URBAN PORT VILA LUGANVILLE RURAL TORBA SANMA PENAMA MALAMPA SHEFA TAFEA
Ni-Vanuatu Part Ni-Vanuatu All other ethnicities

80
4.4 Health
4.4.1 Disability
Vanuatu is a signatory to a United Nations convention to uphold the rights of people with disabilities; and is therefore obliged to:
“Promote, protect and ensure the full and equal enjoyment of all human rights and fundamental freedoms by all persons with disabilities and to promote respect for their inherent dignity.”
For the 2009 Census the VNSO was requested by the Government and stakeholders to collect information on disabilities in Vanuatu. The question on disabilities included in the 2009 Census were whether a person had any difficulties or health problems in seeing, hearing, walking, and/or remember or concentrating – regardless of the severity of the difficulties experienced (Table 35). It was also asked whether a person cannot see, hear, walk or remember or concentrate at all – in other words, whether a person is blind, deaf, lame or senile and/or amnesic (Table 36). Overall, about 12% of the total population reported a disability, and the proportion of females with a disability was slightly higher than that of males. The disability that was most commonly mentioned were difficulties with seeing (17,584 people) followed by difficulties with walking (12,565), remembering and/or concentration (9,259), and hearing (7,827).
Table 35: Population* reporting a disability regardless of the severity of the disability,
Vanuatu: 2009
*Population living in private households
About 1,000 people reported that they could not walk at all (lameness), about 800 people were senile and/or amnesic, another 500 people were deaf, and almost 400 people were blind.
Disability Total Males Females Vision 17,584 8,573 9,011 Hearing 7,827 3,938 3,889 Walking 12,565 5,738 6,827 Remembering or concentrating 9,259 4,284 4,975

81
Table 36: Population* reporting a severe disability, Vanuatu: 2009
*Population living in private households
The proportions of the population with a disability were notably higher in Malampa compared to the national average, and it was lower in Sanma and Tafea (Fig.69).
Figure 69: Proportion of the population by sex and place of residence reporting a disability regardless of the severity of the disability, Vanuatu: 2009
As can be expected, the proportion of the population with a disability increased with age (Figs.70-74). While about 6% of children younger than 5 years of age had a disability, it was below 5% for young people aged 5-24 years. From age 40 and onwards, the proportion of the population with a disability increased continuously. More than half of the population older than 60 years reported a disability (Fig.70). The difficulty that was most commonly mentioned by the older population was vision (Fig.71) and walking (Fig.39).
Disability Total Males Females Blindness 397 207 190 Deafness 504 284 220 Lameness 1,010 479 531 Senile and/or amnesic 810 408 402
12
13
0
2
4
6
8
10
12
14
16
18
20
TORBA SANMA PENAMA MALAMPA SHEFA TAFEA
%
Total Males Females National average-Males National average-Females

82
Figure 70: Proportion of the population by age and sex reporting a disability regardless of the severity of the disability, Vanuatu: 2009
Figure 71: Proportion of the population by age and sex reporting difficulties seeing, Vanuatu: 2009
0
10
20
30
40
50
60
70
80
0 - 4 5 - 9 10 - 14 15 - 19 20 - 24 25 - 29 30 - 34 35 - 39 40 - 44 45 - 49 50 - 54 55 - 59 60 - 64 65 - 69 70+
%
Age group
Males Females
0
10
20
30
40
50
60
70
80
0 - 4 5 - 9 10 - 14 15 - 19 20 - 24 25 - 29 30 - 34 35 - 39 40 - 44 45 - 49 50 - 54 55 - 59 60 - 64 65 - 69 70 - 74 75+
%
Age group
Males Females

83
Figure 72: Proportion of the population by age and sex reporting difficulties hearing, Vanuatu: 2009
Figure 73: Proportion of the population by age and sex reporting difficulties walking, Vanuatu: 2009
0
10
20
30
40
50
60
70
80
0 - 4 5 - 9 10 - 14 15 - 19 20 - 24 25 - 29 30 - 34 35 - 39 40 - 44 45 - 49 50 - 54 55 - 59 60 - 64 65 - 69 70 - 74 75+
%
Age group
Males Females
0
10
20
30
40
50
60
70
80
0 - 4 5 - 9 10 - 14 15 - 19 20 - 24 25 - 29 30 - 34 35 - 39 40 - 44 45 - 49 50 - 54 55 - 59 60 - 64 65 - 69 70 - 74 75+
%
Age group
Males Females

84
Figure 74: Proportion of the population by age and sex reporting difficulties remembering or concentrating, Vanuatu: 2009
4.4.2 Smoking and drinking habits Following a request from the Ministry of Health and other data user groups, the 2009 census questionnaire included several questions on smoking and drinking habits. The questions were particularly aimed at collecting information on a person’s consumption habits with respect to smoking cigarettes or tobacco, and drinking alcohol and/or kava during the week before the census. Questions on the frequency and quantity/volume of the substance consumed were not asked. With respect to smoking cigarettes or tobacco, about 45% of males and 4% of females reported to be smokers (Figs.75 and 76); 17% of males and 3% of females reported to drink alcohol (Figs.77 and 78); and 53% and 8% of males and females drank kava (Figs. 79 and 80). Smoking cigarettes or tobacco The proportion of male smokers was higher in the rural than the urban areas, and the highest in Torba, where more than half of all males smoke. Interestingly, the proportion of female smokers was higher in the urban than the rural areas (Fig.75).
0
10
20
30
40
50
60
70
80
0 - 4 5 - 9 10 - 14 15 - 19 20 - 24 25 - 29 30 - 34 35 - 39 40 - 44 45 - 49 50 - 54 55 - 59 60 - 64 65 - 69 70 - 74 75+
%
Age group
Males Females

85
The highest proportion of male smokers were aged 20-39 years, at which age more than half of all males smoke cigarettes or tobacco. However, the highest prevalence of smoking was among the 25-29 year olds with 60% of smokers. From the age of 30 years the proportion of smokers continuously decreases with increasing age (Fig.76). Female smoking was at a constant low level of about 4% at any age of women, except for a slightly higher rate at age 20-24 years. Drinking alcohol The consumption of alcohol is significantly higher in the urban than the rural areas, although overall the proportion of the population that drinks alcohol is significantly lower than those that smoke or drink kava. The consumption of alcohol is very low in Torba and Penama (Fig.77). The highest proportion of male drinkers was aged 20-34 years, at which age about one-quarter of all males drink alcohol. However, from the age of 30 years the proportion of alcohol drinkers continuously decreases with increasing age (Fig.78). Female drinkers of alcohol was at a constant low level of about 3% at any age of women, except for a slightly higher rate at age 20-29 years. Drinking kava The highest proportion of kava consumption is found in Torba were two-third of all males drink kava and about 20% of females. Kava consumption was also high in Penama. Overall the proportion of male kava drinkers was lower in the urban than the rural areas, but it was the opposite for females; more female kava drinkers were found in the urban than the rural areas (Fig.79). The highest proportion of male kava drinkers were aged 25-39 years, at which age more than two-third of all males drink kava. However, from the age of 40 years the proportion of kava drinkers continuously decreases with increasing age (Fig.80). Female kava drinking peaked at ages 35-49, when slightly more than 10% of women drink kava. From the age of 50 the proportion of female kava drinkers continuously decreases with increasing age. Kava drinking among women was lowest among teenage women and women older than 70 years.

86
Figure 75: Proportion of the population 15 years and older by sex and place of residence who smoke cigarettes or tobacco (%), Vanuatu: 2009
Figure 76: Proportion of the population 15 years and older by age and sex who smoke cigarettes or tobacco (%), Vanuatu: 2009
45
40
10
20
30
40
50
60
70
80
90
100
TORBA SANMA PENAMA MALAMPA SHEFA TAFEA URBAN RURAL
%
Males Females National average-Males National average-Females
0
10
20
30
40
50
60
70
80
90
100
15 - 19 20 - 24 25 - 29 30 - 34 35 - 39 40 - 44 45 - 49 50 - 54 55 - 59 60 - 64 65 - 69 70 - 74 75+
%
Age group
Males Females

87
Figure 77: Proportion of the population 15 years and older by sex and place of residence who drink alcohol (%), Vanuatu: 2009
Figure 78: Proportion of the population 15 years and older by age and sex who drink alcohol (%), Vanuatu: 2009
17
30
10
20
30
40
50
60
70
80
90
100
TORBA SANMA PENAMA MALAMPA SHEFA TAFEA URBAN RURAL
%
Males Females National average-Males National average-Females
0
10
20
30
40
50
60
70
80
90
100
15 - 19 20 - 24 25 - 29 30 - 34 35 - 39 40 - 44 45 - 49 50 - 54 55 - 59 60 - 64 65 - 69 70 - 74 75+
%
Age group
Males Females

88
Figure 79: Proportion of the population 15 years and older by sex and place of residence who drink kava (%), Vanuatu: 2009
Figure 80: Proportion of the population 15 years and older by age and sex who drink kava (%), Vanuatu: 2009
53
8
0
10
20
30
40
50
60
70
80
90
100
TORBA SANMA PENAMA MALAMPA SHEFA TAFEA URBAN RURAL
%
Males Females National average-Males National average-Females
0
10
20
30
40
50
60
70
80
90
100
15 - 19 20 - 24 25 - 29 30 - 34 35 - 39 40 - 44 45 - 49 50 - 54 55 - 59 60 - 64 65 - 69 70 - 74 75+
%
Age group
Males Females

89
4.5 Educational characteristics
The Ministry of Education has made considerable progress towards achieving universal primary education. As a result of broad consultation processes and the SWA (Sector wide approach) used in developing the Vanuatu Education Sector Strategy 2007-2016, the Ministry of Education realigned its priorities towards universal primary education and literacy. Constraints for universal primary education identified during this process were the costs of maintaining the dual education system with separate streams for ‘English’ and ‘French’ as the language of instruction and the need to achieve an integrated system of bilingual schools. A concerted effort with development partners to provide ‘fee free’ primary level education up to Year 6 in Government and Government-assisted schools began in some areas in 2009 and achieved full coverage in 2010. Compulsory primary school contributions have been phased out and replaced by grants paid directly to the schools. This was in direct response to declining primary enrolment rates which were around 95% in 2005 but decreased to 80% in 2008; and subsequent research highlighted rising parental contributions (school fees) as one of the main reasons why enrolment rates were falling. The education system consists of preschool (aged 3 to 5 years), primary (aged 6-13 years or Year 1 to 8) and secondary school (Year 9 to 13 or Year 14 in some French schools). There are still some junior secondary schools offering Years 7 and 8 that will be phased out and absorbed into primary level education.
4.5.1 School enrollment
At the time of the census, 61,931 people of the total enumerated population 5 years and older were enrolled in schools; 32,337 males and 29,594 females. Of these, 58,989 people were enrolled full time and 2,942 were part time enrolled in an educational institution. The distribution of those attending a school by school level is shown in Table 37. This Table excludes students boarding in dormitories.
Table 37: Population* 5 years and older by sex and enrolled in school by school level attending, Vanuatu: 2009
*refers to population living in private households only
School level Total Males FemalesPre school 5,953 3,131 2,822 Primary 42,323 22,317 20,006 Secondary 6,800 3,424 3,376 Tertiary 1,527 791 736 Vocational 413 235 178 Other 332 167 165
Total 57,348 30,065 27,283

90
Three quarters of all students (42,323) were enrolled in primary schools, 12% in secondary schools (6,800) and 10% in Pre schools (5,953). Only 413 students attended a vocational institution.
With respect to the main language spoken at the educational institutions, slightly more than half (51%) of all students attended English speaking schools (29,357), and 23% attended French speaking schools (13,259). Unfortunately about 20% (11,750) of all students did not state or know the main language spoken at their school (Fig. 81). Figure 81: Population* 5 years and older by sex and enrolled in school by main language of
educational institution, Vanuatu: 2009
*refers to population living in private households only
There were insignificant differences between male and female enrollment rates for students aged 5-17. From the age of 18 school enrollment rates for males were slightly higher than females’ (Fig.82). Not at any age were more than 90% of children enrolled in schools, which means that more than 1 in 10 children has never been to school. The highest school enrollment rates were for the 8-11 year olds when almost 90% of children were in school. From the age of 12, school enrollment rates rapidly decrease, and at age 16 years only just over half of children were still in school. Apart from the relatively large proportion of young people that had never been to school of about 5% of all teenagers (Fig.83), it is a worry that even at young ages of 8-12 years children start leaving school, and at age 13 almost 15% of children had already left school (Fig. 84).
29,357
13,259
927 1,861194
11,750
0
5,000
10,000
15,000
20,000
25,000
30,000
English French English and French Local Language Other NS
Num
ber o
f pup
ils
Language

91
With respect to the population aged 6-13 years, 86% were enrolled in school, 6% had already left school, and 8% had never been in school. The percentage distribution is about the same for males and females. However, there were marked differences in school enrollment rates by place of residence (Fig.85). School attendance was significantly higher in the urban (91%) than the rural areas (85%), and Tafea had by far the lowest enrollment rates of the 6-13 year olds. Only three-quarter were enrolled in school, and 20% had never been to school. On the other hand, Malampa had the highest enrollment rates of 6-13 year olds with 91%, and only 4% had never been to school.
Figure 82: Proportion of the population aged 5-24 years by age and sex enrolled in
school (%), Vanuatu: 2009
0
10
20
30
40
50
60
70
80
90
100
5 6 7 8 9 10 11 12 13 14 15 16 17 18 19 20 21 22 23 24
% e
nrol
led
in sc
hool
Age
Total Males Females

92
Figure 83: Proportion of the population aged 5-24 years by age and sex who left school (%), Vanuatu: 2009
Figure 84: Proportion of the population aged 5-24 years by age and sex who have never been to school (%), Vanuatu: 2009
0
10
20
30
40
50
60
70
80
90
100
5 6 7 8 9 10 11 12 13 14 15 16 17 18 19 20 21 22 23 24
left
scho
ol (%
)
Age
Total Males Females
0
10
20
30
40
50
60
70
80
90
100
5 6 7 8 9 10 11 12 13 14 15 16 17 18 19 20 21 22 23 24
neve
r bee
n to
scho
ol (%
)
Age
Total Males Females

93
Figure 85: Proportion of the population aged 6-13 years by sex and school attendance status (%), Vanuatu: 2009
4.5.2 Educational attainment
Based on data on the highest level of education completed, 26% of males and 24% of females 15 years and older responded that they had completed secondary education (Form 3 certificate, Year 10 leaving certificate, Senior secondary certificate or University entrance). About 48 % completed only primary level and 16% of the population 15 years and older had never been to school or only visited preschool; 14% of males and 18% of females. Four per cent of males and three per cent of females had tertiary education (Figs.86 and 87). As can be expected, educational levels were much higher in the urban than the rural areas. The proportion of the population 15 years and older living in the urban areas that completed secondary education was 43% compared to only 18% in rural areas. On the other hand, the proportion of the population with no education (never been to school or only preschool level) was 20% in the rural areas compared to 5% in the urban areas. The proportion of the population with no education was particularly high in Tafea (39%), followed by Torba (25%). Shefa with the urban centre Port Vila had the highest proportion of the population (35%) with secondary education, followed by Sanma with 24%.
85.990.8
84.8 84.5 86.5 86.891.0 88.5
75.8
5.6
5.5
5.6 5.26.2 5.7
5.46.3
3.9
8.53.7
9.6 10.3 7.3 7.53.6 5.2
20.3
0%
10%
20%
30%
40%
50%
60%
70%
80%
90%
100%
VANUATU Urban Rural Torba Sanma Penama Malampa Shefa Tafea
attending school Left school Never been to school

94
Figure 86: Population 15 years and older by sex and highest level of education completed, Vanuatu: 2009
Figure 87: Population 15 years and older by sex, place of residence and highest level of education completed, Vanuatu: 2009
10,337
34,545
18,488
2,924 1,004426
3,840
12,746
34,624
17,023
2,155 576328
4,034
0
5,000
10,000
15,000
20,000
25,000
30,000
35,000
Never been to school
Primary Secondary Tertiary Vocational Others Not stated
Num
ber o
f peo
ple
Educational level
Males Females
16 14 18
5 4 5
20 1822 25 21
29
16 15 17 19 1621
13 12 148 7 9
3935
42
48 4848
36 35 38
5353
5257
5956
50 5150 53
53
5262 61
62
43 4244
3840
35
25 2624
43 4443
18 1917
12 12 12
24 24 23 21 2220 18 19
16
35 3534
14 1513
4 4 3 3
0%
10%
20%
30%
40%
50%
60%
70%
80%
90%
100%
Tota
l
Mal
es
Fem
ales
Tota
l
Mal
es
Fem
ales
Tota
l
Mal
es
Fem
ales
Tota
l
Mal
es
Fem
ales
Tota
l
Mal
es
Fem
ales
Tota
l
Mal
es
Fem
ales
Tota
l
Mal
es
Fem
ales
Tota
l
Mal
es
Fem
ales
Tota
l
Mal
es
Fem
ales
VANUATU Urban Rural Torba Sanma Penama Malampa Shefa Tafea
never been to school Primary Secondary Tertiary Vocational

95
4.5.3 Literacy and language ability
Literacy was measured by a respondent’s ability to read and write a simple sentence in one or more of the following languages: English, French, Bislama, or any other language including local languages. Between ages 10-34 years, slightly more than 90% of the population was literate. From the age of 35 literacy rates gradually decline with increasing age of the population. While only 80% of the population aged 55-59 were literate, it was only 60% of the population 70 years and older (Fig.88). The literacy rate of 15–24 year-olds was 92% and 93% for males and females, respectively (Fig.89) While almost everybody of the 15-24 year olds in the urban areas was literate, it was less than 90% in the rural areas. The provinces of Torba and especially Tafea had significantly lower literacy rates than the national average. Literacy in terms of language abilities are shown in Figures 90-94. Not surprisingly Bislama was most widely spoken by 74% of the population 5 years and older; it was followed by English with 64%, other (local) languages (50%), and French with 37%. Language abilities varied extensively by place of residence. Language abilities in any language were much higher in the urban than the rural areas. Otherwise Bislama was most widely spoken in Shefa, Malampa and Sanma. English was also popular in Shefa, followed by Sanma and Penama, local languages were common in Shefa and Penama, and French speakers were proportionately more widespread in Shefa and Malampa than in other provinces. All languages shared a common feature which is that the proportion of young speakers aged 5-14 was relatively low, the ability to speak any language decreased sharply after the age of 50 years, and language abilities of males – especially older males – was higher than that of females (Figs.91-94).
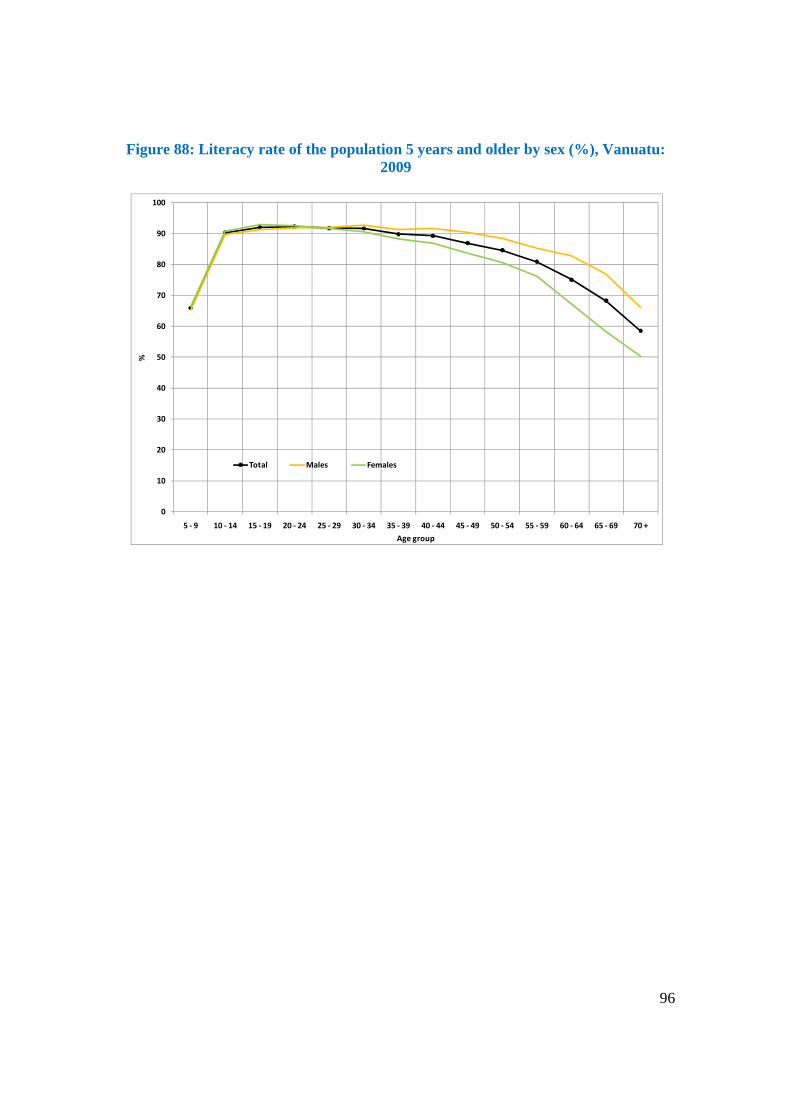
96
Figure 88: Literacy rate of the population 5 years and older by sex (%), Vanuatu: 2009
0
10
20
30
40
50
60
70
80
90
100
5 - 9 10 - 14 15 - 19 20 - 24 25 - 29 30 - 34 35 - 39 40 - 44 45 - 49 50 - 54 55 - 59 60 - 64 65 - 69 70 +
%
Age group
Total Males Females

97
Figure 89: Literacy rate of the population aged 15-24 years by sex and place of residence (%), Vanuatu: 2009
Figure 90: Language ability of the population 5 years and older by sex (%), Vanuatu: 2009
92
93
0
10
20
30
40
50
60
70
80
90
100
Urban Rural Torba Sanma Penama Malampa Shefa Tafea
%
Males Females National average-Males National average-Females
64
37
74
50
0
10
20
30
40
50
60
70
80
90
100
Urban Rural Torba Sanma Penama Malampa Shefa Tafea
%
English French Bislama Other (local) language
National average-English National average-French National average-Bislama National average-Other

98
Figure 91: English language ability of the population 5 years and older by sex (%), Vanuatu: 2009
Figure 92: French language ability of the population 5 years and older by sex (%), Vanuatu: 2009
0
10
20
30
40
50
60
70
80
90
100
5 - 9 10 - 14 15 - 19 20 - 24 25 - 29 30 - 34 35 - 39 40 - 44 45 - 49 50 - 54 55 - 59 60 - 64 65 - 69 70 +
%
Age group
Males Females
0
10
20
30
40
50
60
70
80
90
100
5 - 9 10 - 14 15 - 19 20 - 24 25 - 29 30 - 34 35 - 39 40 - 44 45 - 49 50 - 54 55 - 59 60 - 64 65 - 69 70 +
%
Age group
Males Females
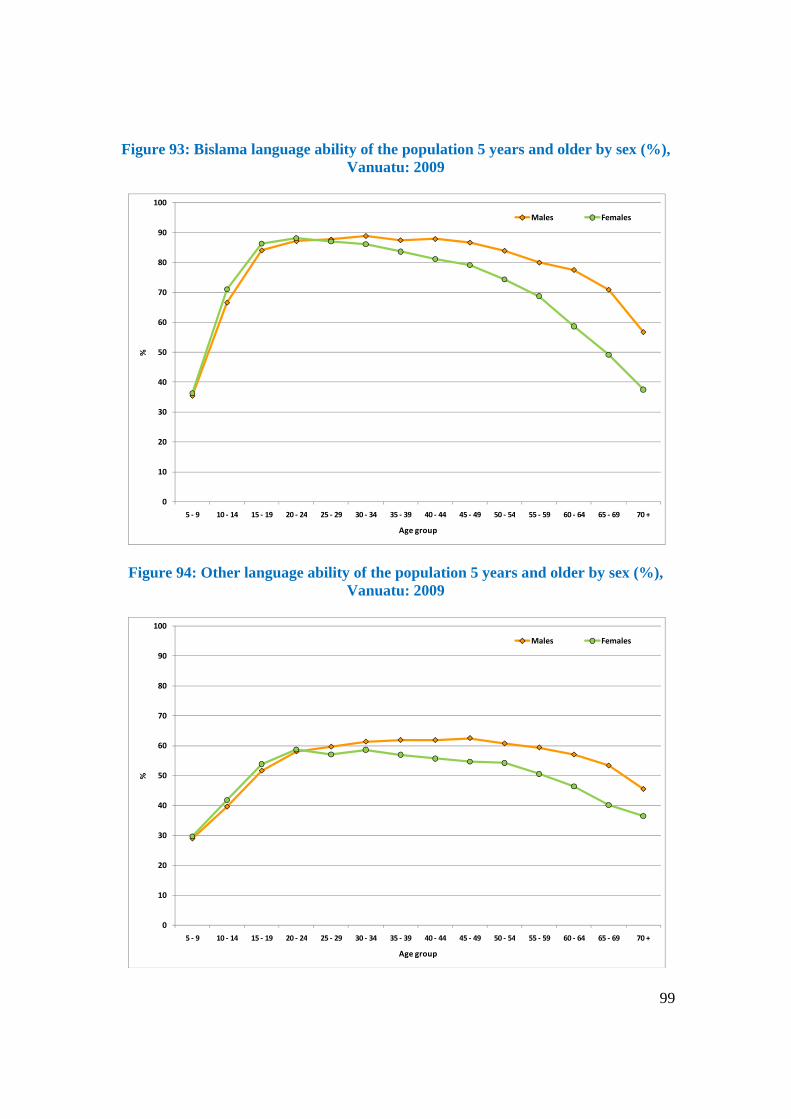
99
Figure 93: Bislama language ability of the population 5 years and older by sex (%), Vanuatu: 2009
Figure 94: Other language ability of the population 5 years and older by sex (%), Vanuatu: 2009
0
10
20
30
40
50
60
70
80
90
100
5 - 9 10 - 14 15 - 19 20 - 24 25 - 29 30 - 34 35 - 39 40 - 44 45 - 49 50 - 54 55 - 59 60 - 64 65 - 69 70 +
%
Age group
Males Females
0
10
20
30
40
50
60
70
80
90
100
5 - 9 10 - 14 15 - 19 20 - 24 25 - 29 30 - 34 35 - 39 40 - 44 45 - 49 50 - 54 55 - 59 60 - 64 65 - 69 70 +
%
Age group
Males Females

100
4.6 Internet use
The 2009 census questionnaire included a question on internet use during the week before the census of the population 15 years and longer. Only 9,290 (6.7%) of all respondents said that they used the internet; 5,063 males and 4,227 females. It was mainly the 20-49 year old population who used the internet, although the highest proportions of users were among the 40-44 year old males and 20-24 year old females (Fig.95). As can be expected, internet use was much more common in the urban areas where 16.3% of the population used the internet compared to 3% of the rural population (Fig. 96). The highest use of the internet was in the province of Shefa where almost 14% used the internet, and the province with the lowest use was Torba, where internet use was less than 1%.
Figure 95: Proportion of the population 15 years and older by sex using the
Internet, Vanuatu: 2009
0
2
4
6
8
10
12
15 - 19 20 - 24 25 - 29 30 - 34 35 - 39 40 - 44 45 - 49 50 - 54 55 - 59 60 - 64 65 - 69 70+
%
Age group of respondent
Males Females

101
Figure 96: Proportion of the population 15 years and older by place of residence using the Internet, Vanuatu: 2009
4.7 Labour market activity
4.7.1 Introduction In Vanuatu, the 2009 census included a question on labour market activity. Enumerators were instructed to ask each respondent aged 15 and over whether they worked during the last week. Work was defined as any activity concerned with providing the necessities of life. It did not matter whether or not the person had a job or was paid for what they did. Based on these criteria, respondents were coded on the questionnaire into the four mutually exclusive categories of:
Work for pay; Work to support the household by producing goods mainly for sale; Work to support the household by producing goods mainly for own consumption; Voluntary work or unpaid family work.
A person who “works for pay” is someone who worked for wages, salary, commission, or had a contract, or was operating a business. The person was either a government or private employee, an employer, or was self-employed. It also includes persons that did “work to support the household by producing goods mainly for sale” performing a variety of tasks such as farming, gardening, fishing or producing handicrafts mainly for sale.
16.3
3.0
0.7
3.5 3.2
1.8
13.6
2.3
6.7
0
2
4
6
8
10
12
14
16
18
20
URBAN RURAL TORBA SANMA PENAMA MALAMPA SHEFA TAFEA
%
National average

102
A person that did “work to support the household by producing goods mainly for own consumption”, performed a variety of tasks such as farming, gardening, fishing or producing handicrafts for their own consumption and are subsequently described as subsistence workers. A person that did “voluntary work” or “unpaid family work” is someone who worked but did not receive a wage, salary, commission, and did not have a contract. The UN publication “Principles and Recommendations for Population and Housing Censuses, Revision 2”, recommends that “persons engaged in economic activities in the form of own-account production of goods for own final use within the same household should be considered to be self-employed.” Certainly, those selling their products should also be classified as employed. According to this definition, all people classified as subsistence workers are considered to be employed. The "non-labor force" category applies to those people who did nothing in the reference week (i.e. the week prior to the census) to provide for themselves or their families or household. This includes people engaged in home duties, who were retired, disabled, students, the unemployed and those who did “not want to work” or did not work because “the weather or transport problems” prevented them from working, or for they did not work for “other” reasons. People classified as unemployed:
did not work in the week prior to the census (other than those who had a job but were not at work during the reference week), but
spent some time looking for work, and were available to work if a job was offered to them.
If the person did not work and did not spend some time looking, or looked for work but was not available for work, they were then classified as economically inactive (not in the labor force). Based on the above, data collected from the Vanuatu census have been assigned to the three categories of:
employed (those that “work for pay” or “work to support the household by producing goods mainly for sale” or “work to support the household by producing goods mainly for own consumption”, and those doing “voluntary work”, or “unpaid family work”);
unemployed (see definition above); not in the labour force (those not employed or unemployed).
Optional definitions of unemployment are also provided below.

103
4.7.2 Economic activity The total labor force of 98,978 people is defined as those being employers (1,369) or self employed (15,920), employees (25,006), those that did unpaid work (10,288), subsistence work (41,877) and the unemployed (4,518) (Figs.97 and 98, and App.21). The paid employed people are defined as those who “work for pay” and “work to support the household by producing goods mainly for sale”. The total number of paid employed people consisted of 42,295 people, 25,916 (61%) males and 16,379 (39%) females. From an urban–rural perspective, 18,016 (43%) of the paid workers were in the urban areas (Port Vila and Luganville), and 24,279 (57%) held paying jobs in rural areas. The non-labor force of 40,664 people is defined as those being full time students (9,008), those engaged in home duties (17,840), the retired (4,480), the disabled (581), and all those who did not work and were not unemployed (did not look for and were not available for work) for various reasons (8,755). From the urban-rural divide (Fig.98) it is apparent that most employees for wage or salary can be found in the urban areas, while the overwhelming majority of subsistence workers live in the rural areas. This pattern is furthermore clearly illustrated by comparing the number of people by labor market activities of the different provinces (Figs.99-104). The only province with more people being employees than people in the substance sector is the province Shefa, with the location of the main urban and administrative center Port Vila. Another general pattern is the fact that there are more males than females in the labor force categories, while there are almost 5-times more females engaged in home duties than males.

104
Figure 97: Population aged 15 and older by sex and labour market activity, Vanuatu: 2009
Figure 98: Population aged 15 and older by region and labour market activity, Vanuatu: 2009
0
5,000
10,000
15,000
20,000
25,000
Employer Self employed Employee for wage/salary
Unpaid worker Subsistence work
Un-employed Full time student
Home duties Retired/Old age Disabled Other*
Num
ber o
f peo
ple
Activity
Males Females
0
5,000
10,000
15,000
20,000
25,000
30,000
35,000
40,000
45,000
Employer Self employed Employee for wage/salary
Unpaid worker Subsistence work
Un-employed Full time student
Home duties Retired/Old age
Disabled Other*
Num
ber o
f peo
ple
Activity
Urban Rural

105
Figure 99: Population aged 15 and older by sex and labour market activity, Torba: 2009
Figure 100: Population aged 15 and older by sex and labour market activity, Sanma: 2009
0
200
400
600
800
1,000
1,200
1,400
1,600
Employer Self employed Employee for wage/salary
Unpaid worker Subsistence work
Unemployed Full time student
Home duties Retired/Old age
Disabled Other*
Num
ber o
f peo
ple
Activity
Males Females
0
1,000
2,000
3,000
4,000
5,000
6,000
Employer Self employed Employee for wage/salary
Unpaid worker Subsistence work
Unemployed Full time student
Home duties Retired/Old age
Disabled Other*
Num
ber o
f peo
ple
Activity
Males Females

106
Figure 101: Population aged 15 and older by sex and labour market activity, Penama: 2009
Figure 102: Population aged 15 and older by sex and labour market activity, Malampa: 2009
0
500
1,000
1,500
2,000
2,500
3,000
3,500
4,000
Employer Self employed Employee for wage/salary
Unpaid worker Subsistence work
Unemployed Full time student
Home duties Retired/Old age
Disabled Other*
Num
ber o
f peo
ple
Activity
Males Females
0
500
1,000
1,500
2,000
2,500
3,000
3,500
4,000
4,500
5,000
Employer Self employed Employee for wage/salary
Unpaid worker Subsistence work
Unemployed Full time student
Home duties Retired/Old age
Disabled Other*
Num
ber o
f peo
ple
Activity
Males Females

107
Figure 103: Population aged 15 and older by sex and labour market activity, Shefa: 2009
Figure 104: Population aged 15 and older by sex and labour market activity, Tafea: 2009
0
1,000
2,000
3,000
4,000
5,000
6,000
7,000
8,000
9,000
10,000
Employer Self employed Employee for wage/salary
Unpaid worker Subsistence work
Unemployed Full time student
Home duties Retired/Old age
Disabled Other*
Num
ber o
f peo
ple
Activity
Males Females
0
500
1,000
1,500
2,000
2,500
3,000
3,500
4,000
4,500
Employer Self employed Employee for wage/salary
Unpaid worker Subsistence work
Unemployed Full time student
Home duties Retired/Old age
Disabled Other*
Num
ber o
f peo
ple
Activity
Males Females

108
4.7.3 Labour force participation rate, employment–population ratio, and unemployment rate
The labour force participation rate (LFPR) is the number of people in the labour force by a given age and sex and/or place of rural–urban residence, divided by the corresponding total population with the same characteristics, multiplied by 100. The employment–population ratio (EPR) is the number of people employed in cash work by a given age and sex and/or place of rural–urban residence, divided by the corresponding total population with the same characteristics, multiplied by 100. The unemployment rate is the number of people unemployed by a given age and sex and/or place of rural–urban residence, divided by the population in the labor force with the same characteristics, multiplied by 100. The LFPR is calculated at 70.9% in Vanuatu in 2009. At the same time the EPR was only 30.3%, and the unemployment rate for Vanuatu was 4.6% (Fig.105-107 and Table 38). The LFPRs were higher for males (80.4) than for females (61.4), so was the employment-population ratio with 37.2 and 23.4 for males and females respectively. The pattern of higher male than female LFPRs and EPRs can be observed in all regions of Vanuatu. From an urban–rural perspective, the LFPR were higher in the rural than urban areas, and the EPR were about twice as high in the urban than the rural areas. Torba was the province with the lowest EPR and Shefa had the highest EPR. The unemployment rates were higher for females than males, and considerably higher in the urban than the rural areas. The lowest unemployment rates were in Torba and Penama, and the highest in Shefa.

109
Figure 105: Population aged 15 and older by sex and labour force participation rate: Vanuatu: 2009
Figure 106: Population aged 15 and older by sex and employment–population ratio: Vanuatu: 2009
70.9
61.5
74.4 77.1
73.0
79.6
75.6
63.7
72.3
80.4
70.4
84.3 86.2
81.3
86.3 87.2
73.5
84.1
61.4
52.3
64.8
68.4
64.5
73.0
64.7
53.5
61.6
0
10
20
30
40
50
60
70
80
90
100
VANUATU Urban Rural Torba Sanma Penama Malampa Shefa Tafea
Labo
ur fo
rce
part
icip
atio
n ra
te (%
)
Place of residence
Total Males Females
30.3
47.1
24.0
13.7
28.5 28.0
21.8
43.0
13.2
37.2
55.5
30.1
19.5
35.8 33.7
27.9
50.7
17.7
23.4
38.2
18.0
8.1
21.1 22.4
16.0
34.9
9.3
0
10
20
30
40
50
60
70
80
90
100
VANUATU Urban Rural Torba Sanma Penama Malampa Shefa Tafea
Empl
oym
ent-
popu
lati
on ra
tio (%
)
Place of residence
Total Males Females

110
Figure 107: Population aged 15 and older by sex and unemployment rate: Vanuatu: 2009
4.6
11.9
2.3
0.2
4.1
0.5
1.9
7.7
6.6
4.1
9.9
2.2
0.3
3.8
0.5 1.7
6.5 6.4
5.2
14.7
2.4
0.1
4.4
0.5
2.2
9.4
6.8
0
1
2
3
4
5
6
7
8
9
10
11
12
13
14
15
VANUATU Urban Rural Torba Sanma Penama Malampa Shefa Tafea
Une
mpl
oym
ent r
ate
(%)
Place of residence
Total Males Females

111
Table 38: Population aged 15 and older by sex, place of residence, labour force participation rate, employment–population ratio, and unemployment rate,
Vanuatu: 2009
a = the unemployed are strictly defined as persons who did not work in the week prior to the census (other than those who had a job but were not at work during the reference week), but spent time looking for work, and were available to work if a job was offered to them. b = the unemployed include people that did not work, but did not look for work because they believed that no work was available, or because of poor weather conditions, or because they could not afford transportation costs or had other problems with transportation to work The LFPR, EPR and unemployment rates by age and sex and urban-rural residence are presented in Figures 108-116. The general pattern is low participation rates for the population 15-19 years when many of the teenagers are still attending school, or struggling to enter the labor market,
a bVanuatu 70.9 30.3 4.6 5.5
Males 80.4 37.2 4.1 5.1
Females 61.4 23.4 5.2 6.0
Urban 61.5 47.1 11.9 13.4
Males 70.4 55.5 9.9 11.5
Females 52.3 38.2 14.7 16.1
Rural 74.4 24.0 2.3 3.0
Males 84.3 30.1 2.2 2.9
Females 64.8 18.0 2.4 3.0
Torba 77.1 13.7 0.2 0.5
Males 86.2 19.5 0.3 0.7
Females 68.4 8.1 0.1 0.3
Sanma 73.0 28.5 4.1 5.0
Males 81.3 35.8 3.8 4.8
Females 64.5 21.1 4.4 5.3
Penama 79.6 28.0 0.5 0.7
Males 86.3 33.7 0.5 0.7
Females 73.0 22.4 0.5 0.7
Malampa 75.6 21.8 1.9 2.1
Males 87.2 27.9 1.7 1.9
Females 64.7 16.0 2.2 2.3
Shefa 63.7 43.0 7.7 9.4
Males 73.5 50.7 6.5 8.2
Females 53.5 34.9 9.4 11.0
Tafea 72.3 13.2 6.6 7.1
Males 84.1 17.7 6.4 7.0
Females 61.6 9.3 6.8 7.3
Unemployment rate
Unemployment rate
Labour force participation rate
Employment-population ratioResidence/Sex

112
before the rates sharply increase. They reach a plateau at ages 30-54, after which the rates gradually decrease. It is interesting to see that a large proportion of the population aged 60 years and older was still in the labour force indicating that many older people keep providing economically for themselves and their household/families.
Not surprisingly, the labour force participation rate and the employment–population ratio were higher for males than for females at all ages. The labour force participation rate for females did not exceed 71% at any age, while that of males was more than 90% at ages 30–49. In terms of the employment–population ratio, almost 50% of all males at aged 30–49 were employed as paid workers. In contrast, the age groups with the highest percentage of females in paid employment never exceeded 30%. The unemployment rates show a very different pattern than the LFPR and EPR with the highest unemployment rate for the young job seekers aged 15-19 years. Unemployment rates rapidly decrease with increasing age. The unemployment rates are considerably higher at all ages in the urban than the rural areas, and they are higher for females than for males.

113
Figure 108: Population aged 15 and older by age, sex and labour force participation rate (LFPR), Vanuatu: 2009
Figure 109: Population aged 15 and older by age, sex and labour force participation rate (LFPR), Urban areas: 2009
0
10
20
30
40
50
60
70
80
90
100
15 - 19 20 - 24 25 - 29 30 - 34 35 - 39 40 - 44 45 - 49 50 - 54 55 - 59 60 - 64 65 - 69 70+
LFPR
(%)
Age group
Total Males Females
0
10
20
30
40
50
60
70
80
90
100
15 - 19 20 - 24 25 - 29 30 - 34 35 - 39 40 - 44 45 - 49 50 - 54 55 - 59 60 - 64 65 - 69 70+
LFPR
(%)
Age group
Total Males Females

114
Figure 110: Population aged 15 and older by age, sex and labour force participation rate (LFPR), Rural areas: 2009
Figure 111: Population aged 15 and older by age, sex and employment–population ratio (EPR), Vanuatu: 2009
0
10
20
30
40
50
60
70
80
90
100
15 - 19 20 - 24 25 - 29 30 - 34 35 - 39 40 - 44 45 - 49 50 - 54 55 - 59 60 - 64 65 - 69 70+
LFPR
(%)
Age group
Total Males Females
0
10
20
30
40
50
60
70
80
90
100
15 - 19 20 - 24 25 - 29 30 - 34 35 - 39 40 - 44 45 - 49 50 - 54 55 - 59 60 - 64 65 - 69 70+
EPR
(%)
Age group
Total Males Females
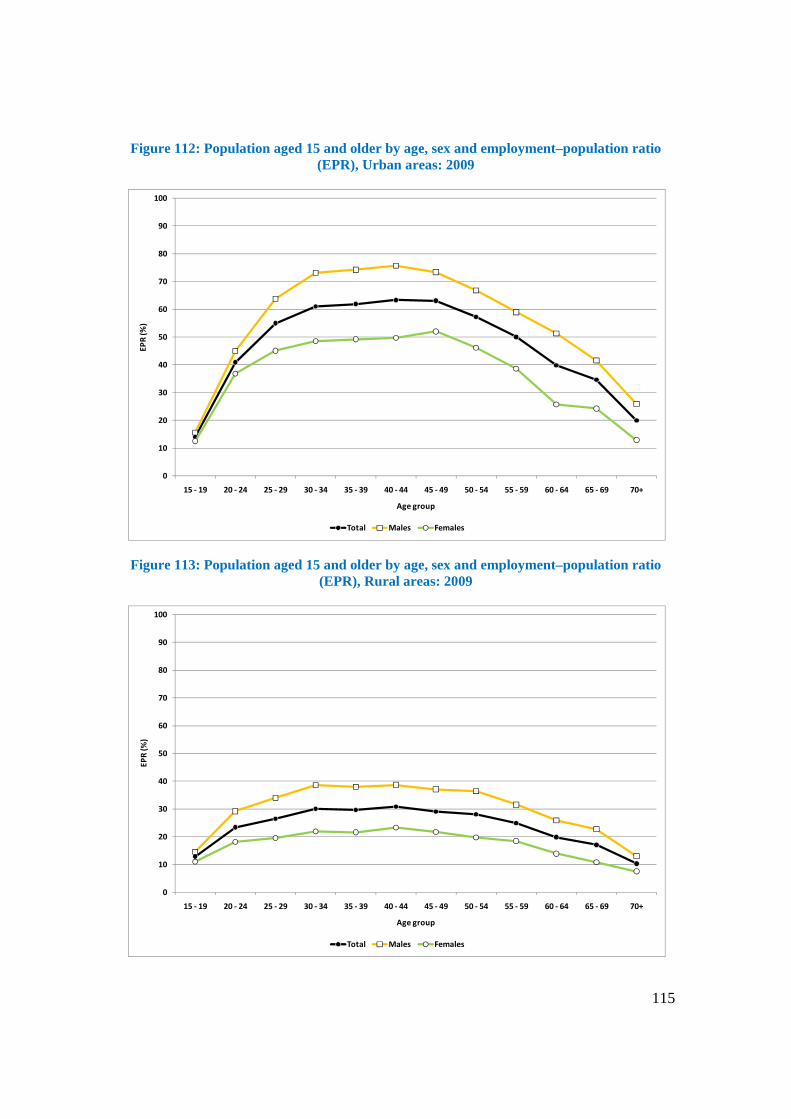
115
Figure 112: Population aged 15 and older by age, sex and employment–population ratio (EPR), Urban areas: 2009
Figure 113: Population aged 15 and older by age, sex and employment–population ratio (EPR), Rural areas: 2009
0
10
20
30
40
50
60
70
80
90
100
15 - 19 20 - 24 25 - 29 30 - 34 35 - 39 40 - 44 45 - 49 50 - 54 55 - 59 60 - 64 65 - 69 70+
EPR
(%)
Age group
Total Males Females
0
10
20
30
40
50
60
70
80
90
100
15 - 19 20 - 24 25 - 29 30 - 34 35 - 39 40 - 44 45 - 49 50 - 54 55 - 59 60 - 64 65 - 69 70+
EPR
(%)
Age group
Total Males Females

116
Figure 114: Population aged 15 and older by age, sex and unemployment rate (%), Vanuatu: 2009
Figure 115: Population aged 15 and older by age, sex and unemployment rate (%), Urban areas: 2009
0
2
4
6
8
10
12
15 - 19 20 - 24 25 - 29 30 - 34 35 - 39 40 - 44 45 - 49 50 - 54 55 - 59 60 - 64 65 - 69 70+
Une
mpl
oym
ent r
ate
(%)
Age group
Total Males Females
0
5
10
15
20
25
30
35
40
15 - 19 20 - 24 25 - 29 30 - 34 35 - 39 40 - 44 45 - 49 50 - 54 55 - 59 60 - 64 65 - 69 70+
Une
mpl
oym
ent r
ate
(%)
Age group
Total Males Females

117
Figure 116: Population aged 15 and older by age, sex and unemployment rate (%), Rural areas: 2009
4.7.4 Employment status About 47% of all people in paid employment were working for a private enterprise (19,886) which is comprised of 18,517 private employees and 1,369 employers. Another 24% produced goods for sale (10,046), 15% were working in the public service (6,489), and 14% were self employed (5,874) (Fig.55).
However, this pattern is very different for the urban and rural areas, and per province. While only 3% of all people in paid employment in the urban areas produced goods for sale, it was 39% in the rural areas. On the other hand, 64% of urban paid workers worked as private employees, it was only 28% in the rural areas.
Almost half of all paid workers in the provinces of Torba, Penama, and Malampa produced goods for sale.
The highest proportion of government employees were found in Torba (26%), and the lowest proportion in Penama with only 12% of all people in paid employment.
The highest proportions of employees in the private sector were found in Shefa (58%) and the lowest proportion with only 10% in Penama. However, 30% of all paid workers there were self employed.
0
5
10
15
20
25
30
35
40
15 - 19 20 - 24 25 - 29 30 - 34 35 - 39 40 - 44 45 - 49 50 - 54 55 - 59 60 - 64 65 - 69 70+
Une
mpl
oym
ent r
ate
(%)
Age group
Total Males Females

118
Figure 117: Population in paid employment by employment status and place of residence, Vanuatu: 2009
4.7.5 Employed population by industry group The vast majority of employed people in Vanuatu were employed in the agriculture, forestry, and fishing sector with 57,191 people and 61% of all employed people. The second and third largest groups were those in wholesale and retail trade, repair of motor vehicles with 7,746 employees, and public administration and defense, compulsory social security with 7,075 workers (Fig.118). While household activities were dominated by females, most of all other industry groups employed more males than females. Comparing the urban-rural areas, the employment situation is completely different; while three-quarter of all employed people in the rural areas were in the agriculture, forestry, and fishing sector (55,816), this was only 7% of all employed people in the urban areas (1,375). On the other hand, while 19% of employed persons in the urban areas were working in wholesale and retail trade, repair of motor vehicles, another 15% in public administration and defense, compulsory social security, and 12% in Construction, the proportions employed in these specific sectors in the rural areas were very small (Fig.119).
15 18 13
26
16 12 14 15
25
44
64
28
17 45
10
17
58 35
3
14
10
16 7
8
30
20
11
19
24
3
39
48
29
47 46
12 17
0%
10%
20%
30%
40%
50%
60%
70%
80%
90%
100%
VANUATU URBAN RURAL TORBA SANMA PENAMA MALAMPA SHEFA TAFEA
Employee - government Employee - private Employer Self employed Producing goods for sale
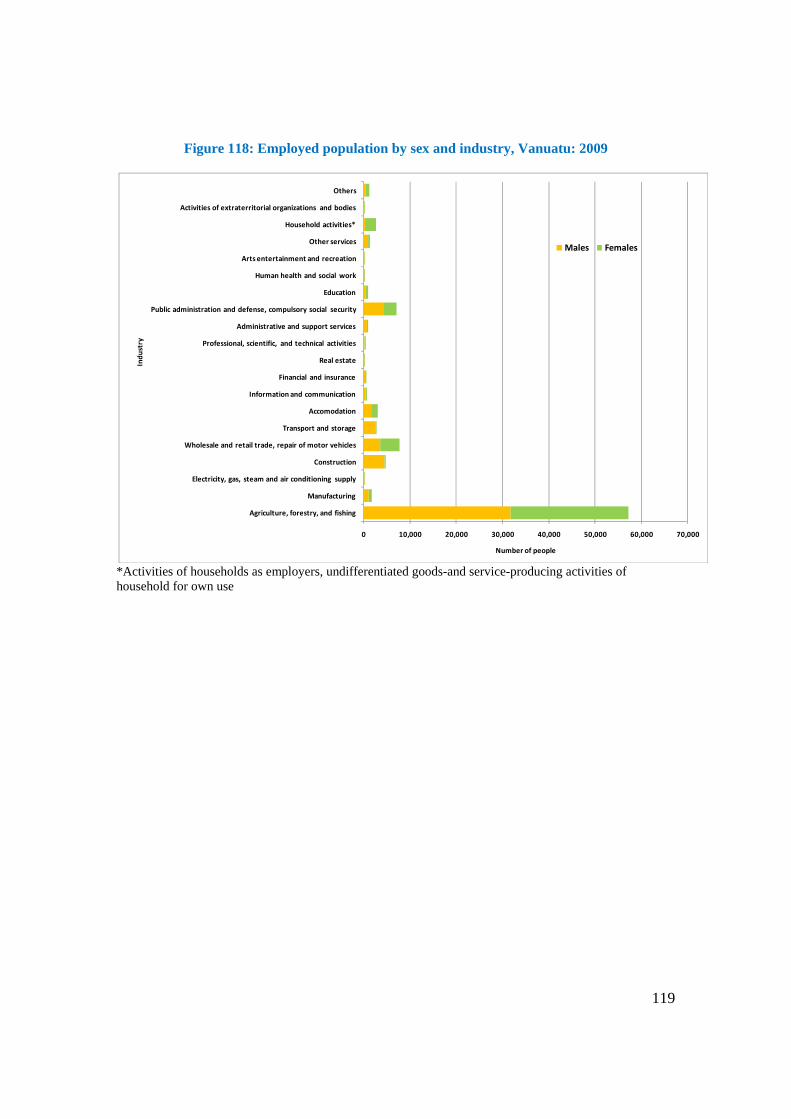
119
Figure 118: Employed population by sex and industry, Vanuatu: 2009
*Activities of households as employers, undifferentiated goods-and service-producing activities of household for own use
0 10,000 20,000 30,000 40,000 50,000 60,000 70,000
Agriculture, forestry, and fishing
Manufacturing
Electricity, gas, steam and air conditioning supply
Construction
Wholesale and retail trade, repair of motor vehicles
Transport and storage
Accomodation
Information and communication
Financial and insurance
Real estate
Professional, scientific, and technical activities
Administrative and support services
Public administration and defense, compulsory social security
Education
Human health and social work
Arts entertainment and recreation
Other services
Household activities*
Activities of extraterritorial organizations and bodies
Others
Number of people
Indu
stry
Males Females

120
Figure 119: Employed population by urban-rural residence and industry, Vanuatu: 2009
4.7.6 Employed population by occupational group The largest numbers of employed workers were in the category of skilled agricultural forestry and fishery workers with 49,769 people or 53% of all employed people (Figs.120-121). The second largest occupational group were with 13% the elementary occupations (12,314), followed with 9% by the service and sales workers (8,172), and with 8% of the craft and related trades workers (7,649). While the elementary occupations, the service and sales workers, and clerks, service workers were dominated by females, all other categories were dominated by males. This was especially so for plant and machine operators and assemblers, as well as the craft and related trades. As with industry, the difference between the urban and rural areas in terms of occupational groups is evident: while two-third of all occupations were skilled agricultural forestry and fishery workers in the rural areas (48,843), there were only 4% in the urban areas (926). On the other hand, while 24% of all occupations in the urban areas were service and sales workers, and another 18% were craft and related trades workers, these categories were small percentage-wise in the rural areas. It is worth noting that 16% of all occupations in the urban areas were professionals and managers compared to just 5% in the rural areas.
7
76
4
12
19
5
8
9
15
5
7
18
5
0%
10%
20%
30%
40%
50%
60%
70%
80%
90%
100%
Urban Rural
All other sectors
Household activities*
Public administration and defense, compulsory social security
Accomodation
Transport and storage
Wholesale and retail trade, repair of motor vehicles
Construction
Manufacturing
Agriculture, forestry, and fishing

121
Figure 120: Employed population by sex and occupation, Vanuatu: 2009
Figure 121: Employed population by place of residence and occupation, Vanuatu: 2009
0 10,000 20,000 30,000 40,000 50,000
Armed forces
Managers
Professionals
Technicians and associate professionals
Clerical support workers
Service and sales workers
Skilled agricultural forestry and fishery workers
Craft and related trades workers
Plant and machine operators and assemblers
Elementary occupations
Number of people
Occ
upat
ion
Females Males
6
10
4
6
8
24
4
4
66
18
5 7
14 13
0%
10%
20%
30%
40%
50%
60%
70%
80%
90%
100%
Urban Rural
Not Stated
Elementary occupations
Plant and machine operators and assemblers
Craft and related trades workers
Skilled agricultural forestry and fishery workers
Service and sales workers
Clerical support workers
Technicians and associate professionals
Professionals
Managers

122
4.7.7 Population working overseas The census included a question on whether a person worked for money overseas during the last 12 months before the census. Almost 6% (7,895) of the population 15 years and older answered yes, 4,430 males and 3,465 females. The numbers of overseas workers were unevenly divided among the different provinces, since about half of all workers were from Shefa province alone. Equal numbers were from Tafea and Sanma (Fig.122). Figure 122: Population 15 years and older who worked overseas during the last 12 months
before the census by place of residence, Vanuatu: 2009
Vanuatu enjoys the benefits of migrant labour with Government agreements with New Zealand and Australia. The most popular country was New Zealand where 86% of all people worked. The New Zealand Recognized Seasonal Employer (RSE) programme began in 2007 with a pilot and larger numbers followed thereafter. The Australian pilot was in 2009. The workers are mostly unskilled and are mainly involved in agricultural work (Fig.123).
126
1,187
521
889
3,974
1,198
TORBA
SANMA
PENAMA
MALAMPA
SHEFA
TAFEA

123
Figure 123: Destination countries of overseas workers (%), Vanuatu: 2009
86%
4%3%
7%
New Zealand
Australia
New Caledonia
Other countries

124
5. HOUSEHOLD CHARACTERISTICS
5.1 Household size The number of (private) households increased from 27 thousand in 1989 to 47 thousand in 2009, an overall increase of more than 20 thousand households (Table 39). In addition, there were 209 non-private dwellings (institutions) in 2009, including accommodations such as hotels and hostels for short-term visitors, as well as hospitals and a prison. The overall average household size decreased from 5.2 to 4.8 people per household between 1989 and 2009. Household growth rates also decreased, from 2.8% to 2.6% between 1989-99 and 1999-2009 (Table 40).
Table 39: Population in private households, number of private households and average household size, by place of residence, Vanuatu: 1989, 1999 and 2009
Table 40: Number of private households and household change, Vanuatu: 1989, 1999 and
2009
1989 1999 2009 1989 1999 2009 1989 1999 2009
VANUATU 142,419 186,678 228,883 27,167 36,415 47,373 5.2 5.1 4.8
URBAN 25,870 40,094 56,016 4,576 8,258 11,606 5.7 4.9 4.8
RURAL 116,549 146,584 172,867 22,591 28,157 35,767 5.2 5.2 4.8
TORBA 5,985 7,757 9,189 1,074 1,339 1,766 5.6 5.8 5.2
SANMA 25,542 36,084 44,287 4,771 6,970 9,213 5.4 5.2 4.8
PENAMA 22,281 26,646 29,926 4,488 5,371 6,620 5.0 5.0 4.5
MALAMPA 28,174 32,705 36,060 5,721 6,483 7,991 4.9 5.0 4.5
SHEFA 38,023 54,439 77,047 6,713 10,888 15,930 5.7 5.0 4.8
TAFEA 22,414 29,047 32,374 4,400 5,364 5,853 5.1 5.4 5.5
Number of people in private households
Number of private household Average Household sizePlace of residence
1989 1999 2009 1989-1999 1999-2009 1989-1999 1999-2009 1989-1999 1999-2009 1999 2009
VANUATU 27,167 36,415 47,373 9,248 10,958 6.5 5.9 2.8 2.6 25.1 26.6
URBAN 4,576 8,258 11,606 3,682 3,348 14.2 8.4 5.6 3.4 12.5 20.6
RURAL 22,591 28,157 35,767 5,566 7,610 4.8 5.2 2.1 2.4 33.4 29.3
TORBA 1,074 1,339 1,766 265 427 4.4 5.5 2.1 2.8 33.4 25.3
SANMA 4,771 6,970 9,213 2,199 2,243 8.6 6.2 3.6 2.8 19.4 25.1
PENAMA 4,488 5,371 6,620 883 1,249 4.0 4.7 1.7 2.1 41.0 33.5
MALAMPA 5,721 6,483 7,991 762 1,508 2.7 4.6 1.2 2.1 58.8 33.5
SHEFA 6,713 10,888 15,930 4,175 5,042 11.0 9.3 4.6 3.8 15.2 18.4
TAFEA 4,400 5,364 5,853 964 489 4.3 1.7 1.9 0.9 37.1 80.3
Doubling TimePlace of residence
Number of private household in numbers Annual Growth Ratein (%)
Household Change

125
Figure 124: Average household size (number of people per household) by place of residence, Vanuatu: 2009
Torba and Tafea province had the highest average household size with 5.2 and 5.5 persons per household respectively. Average household size for Penama and Malampa were the lowest with 4.5 people per household (Fig.124). In 2009, the most common household size was 4, accounting for 17 % of all private households (Table 41 and Fig.125). The highest proportion of people, however, lived in households with 6 people, which accounted for 18 % of all people. Five percent of the population lived in households with 12 or more people, while 1 % of the population lived in single-person households, which accounted for 6% of all households.
4.8 4.8 4.8
5.2
4.84.5 4.5
4.8
5.5
0
1
2
3
4
5
6
VANUATU URBAN RURAL TORBA SANMA PENAMA MALAMPA SHEFA TAFEA
Ave
rage
hou
seho
ld s
ize

126
Table 41: Number of private households by household size and people per household (%), Vanuatu: 2009
Figure 125: Distribution of households and people living in private households by
household size (%), Vanuatu: 2009
Number % Number %1 2,997 6.3 2,997 1.3 2 4,851 10.2 9,702 4.2 3 7,199 15.2 21,597 9.4 4 8,253 17.4 33,012 14.4 5 7,735 16.3 38,675 16.9 6 6,994 14.8 41,964 18.3 7 3,454 7.3 24,178 10.6 8 2,398 5.1 19,184 8.4 9 1,347 2.8 12,123 5.3
10 789 1.7 7,890 3.4 11 491 1.0 5,401 2.4 12 377 0.8 4,524 2.0
13+ 488 1.0 7,636 3.3
Total 47,373 100.0 228,883 100.0
Household size
Private Households People per household size
0
2
4
6
8
10
12
14
16
18
20
1 2 3 4 5 6 7 8 9 10 11 12 13+
Perc
enta
ge
Household Size
% of household % of people

127
5.2 Household composition Data on household composition were established by identifying a head of household who served as a reference person to whom all other people in the household, in terms of family membership, are related (Table 42). Approximately 4 out of 5 heads of household (79%) in Vanuatu were men (37,442) with one-in-five (9,931) of households headed by women. Sons and daughters made up the most household members with 44%. Spouses of head of households comprised of 15% of the total household members. Eight per cent of all household members were other relatives or not related to the head of household. Interestingly there were only 2,427 male spouses recorded in the census, while there were 9,931 female heads of households. Apparently a woman is in most cases only the head of household if she has no spouse, or if he is not present (overseas). Table 42: Population by household composition (relationship to head of household), Vanuatu: 2009
5.3 Household language Sixty-three per cent of all households in Vanuatu spoke local languages and 34% used Bislama as the main spoken language in their households. Only 2% used English and 1% used French as the main spoken languages in their households. (Fig.126) Bislama was more dominant in the urban areas while local languages were more commonly spoken in the rural areas.
Total Male Female Total Male FemaleHead of household 47,373 37,442 9,931 21 32 9 Spouse of head 35,127 2,427 32,700 15 2 29 Son/Daughter 99,710 52,531 47,179 44 45 42 Adopted son/daughter 1,967 995 972 1 1 1 Son in law/daughter in law 2,261 750 1,511 1 1 1 Grandchild 14,261 7,683 6,578 6 7 6 Parent/Parents in law of head 3,396 1,075 2,321 1 1 2 Brother/Sister (including in laws) 6,048 3,371 2,677 3 3 2 Other relatives 17,731 9,393 8,338 8 8 7 Not related/friend 1,009 615 394 0 1 0 Total 228,883 116,282 112,601 100 100 100
in numbers in percentageRelationship

128
Figure 126: Proportion of private households by main language spoken, by place of residence (%), Vanuatu: 2009
5.4 Household income In 2009, 46% of the main source of household income, in Vanuatu, was from the sale of fish or crops or handicrafts. Another 34% of the main household income was from wages or salary, 7% of the household income was from own business activities and 5% household income from other sources. Six percent of all households in Vanuatu do not have any income. When comparing the urban and rural areas for income distribution it is clearly shown in Figure 127 that 81% of all urban households stated that their main source of income was wages or salary and only 18% of all rural household who stated these main sources of income. In contrast, 60% of all rural households stated that their main source of income is from the sale of fish/crops/handicrafts which compares to 3% of urban households. When comparing the household income distribution by province it is evident that the sales of fish/crop/handicraft and wages or salaries were significant contributors in terms of household income (Fig. 128).
63
21
77
86
52
92
74
40
91
34
71
22
14
47
8
25
53
8
2
5
4
2
2
0 10 20 30 40 50 60 70 80 90 100
VANUATU
URBAN
RURAL
TORBA
SANMA
PENAMA
MALAMPA
SHEFA
TAFEA
percentage
Local language Bislama English French Others

129
Figure 127: Proportion of private households by main source of household income and urban and rural residence (%), Vanuatu: 2009
Figure 128: Proportion of private households by main source of household income and by province (%), Vanuatu: 2009
6 4 6
34
81
18
46
3
60
5 6
7 7 7
0
10
20
30
40
50
60
70
80
90
100
VANUATU URBAN RURAL
%
Own business
Others
Sale of fish/crops/ handicrafts
House Rent
Remittances
Land lease
Wages/Salary
No Income
6 7 4 5 10
4 6
34
14
33
12
12
63
14
4
46
61
50
68 60
21
60
5 12 6 7
8 6
7 5 5 7 9 6 9
0
10
20
30
40
50
60
70
80
90
100
VANUATU TORBA SANMA PENAMA MALAMPA SHEFA TAFEA
%
Own business
Others
Sale of fish/crops/ handicraftsHouse Rent
Remittances
Land lease
Wages/Salary
No Income

130
5.5 Amenities and capital goods Please note that the following data for this section are presented as percentages of all private households by place of residence.
5.5.1 Private households by housing and land tenure The majority of households in Vanuatu (81%) owned their dwelling outright (Fig.129), 12% rented their dwelling and 6 % stayed in rent free dwelling. The proportion of households renting was highest in the urban areas with 39%. Shefa province had the highest proportion of people renting (28%) compared to the other provinces. Figure 129: Proportion of private households by place of residence and housing tenure (%),
Vanuatu: 2009
The majority of households in Vanuatu (72%) resided on customary land (Fig.130), 11% lived on occupied land with no informal arrangement and 7% and 6% lived on urban and rural land leases. Forty eight percent of households in the urban areas had urban leases, 18% rural leases, another 18% customary leases and 13% occupied land with informal arrangement. Rural areas had 82% of households living on customary land, 11% occupying land with an informal arrangement and 4% living with rural lease.
12
39
4 4 8 4
28 6
9
4 3
7
3 4
8
81
50
91 92 84
94 92
63
95
0
10
20
30
40
50
60
70
80
90
100
VANUATU URBAN RURAL TORBA SANMA PENAMA MALAMPA SHEFA TAFEA
%
Owned Rent free Rented Others

131
Shefa and Sanma have similar patterns of land tenure distribution because urban areas are part of these two provinces. 130: Proportion of private households by place of residence and land tenure (%), Vanuatu:
2009
5.5.2 Private households by living quarters The majority, 80% of Vanuatu households had living quarters of one family house detached from any other house, 13% of households were one family house attached to one or more houses and 3% of households were living in buildings with 2 or more apartments (Fig.131). Living quarters of one family house attached to one or more houses was much higher in the urban areas (32%) than in the rural areas (7%). Also it was much higher in Shefa province compared to the other provinces.
72
18
82
88
53
91
82
54
93
6
18
4
5
8
15
7
48
14
18
11
13
11
7
17
5
15
12
4
8
0 10 20 30 40 50 60 70 80 90 100
VANUATU
URBAN
RURAL
TORBA
SANMA
PENAMA
MALAMPA
SHEFA
TAFEA
%
Customary Rural Lease Urban Lease Occupy with informal arrangements Others

132
Fig 131: Proportion of private households by place of residence and living quarters (%), Vanuatu: 2009
5.5.3 Private households by age of dwelling The distribution of dwellings by age of dwelling is displayed in Figure 132. It shows that about 40% of all dwellings in Vanuatu were between 1 and 5 years old, 22% between 6 to 9 years, 17% between 10 to 19 years, 13% 20 years or older and 7% were recently built, and were less than 1 year old. Most urban dwellings were 10 years and older while most dwellings in the rural areas were younger than 10 years.
80
56
88 95
87 94
85
64
86
13
32
7 9 11
26
6 7 5
0
10
20
30
40
50
60
70
80
90
100
VANUATU URBAN RURAL TORBA SANMA PENAMA MALAMPA SHEFA TAFEA
%
Others Dwelling attached to a shop or other non-residential building
Lodging house Building with 2 or more households which share a kitchen/toilet
Building with 2 or more apartments One family house attached to one or more houses
One family house detached from any other house

133
Figure 132: Proportion of private households by place of residence and age of dwelling (%), Vanuatu: 2009
5.5.4 Private households by number of rooms The distribution of dwellings by number of rooms is displayed in Figure 133. It shows that the majority (39%) of all dwellings in Vanuatu had 2 rooms, and another 24% had 3 rooms, 18% had 1 room and 12% had 4 rooms. The average number of rooms was about 2.6 rooms per dwelling (Table 43). The average number of rooms was higher in urban than in rural areas, and higher in Shefa than the other provinces.
Table 43: Average number of rooms per dwelling by place of residence, Vanuatu: 2009
13
28
11 11 10 11
25
17
26
15
10
18 17 18
22
6
22
18
23
23
26 26 27
19
12
40
23
44
56
39 42 35 28
65
7 6 7 8 8 7 13
0
10
20
30
40
50
60
70
80
90
100
VANUATU URBAN RURAL TORBA SANMA PENAMA MALAMPA SHEFA TAFEA
%
Less than 1 year 1 to 5 years 6 - 9 years 10 - 19 years 20+ years
VANUATU URBAN RURAL TORBA SANMA PENAMA MALAMPA SHEFA TAFEA
2.6 2.8 2.5 2.0 2.3 2.6 2.5 2.8 2.4
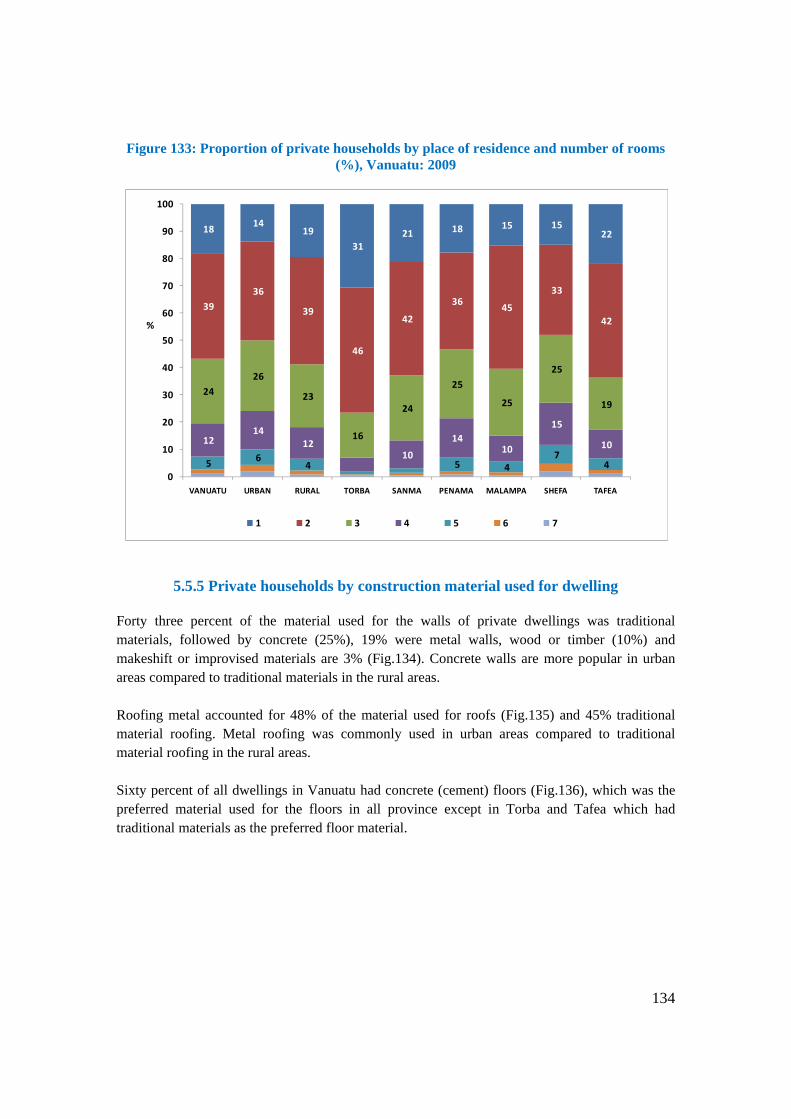
134
Figure 133: Proportion of private households by place of residence and number of rooms (%), Vanuatu: 2009
5.5.5 Private households by construction material used for dwelling Forty three percent of the material used for the walls of private dwellings was traditional materials, followed by concrete (25%), 19% were metal walls, wood or timber (10%) and makeshift or improvised materials are 3% (Fig.134). Concrete walls are more popular in urban areas compared to traditional materials in the rural areas. Roofing metal accounted for 48% of the material used for roofs (Fig.135) and 45% traditional material roofing. Metal roofing was commonly used in urban areas compared to traditional material roofing in the rural areas. Sixty percent of all dwellings in Vanuatu had concrete (cement) floors (Fig.136), which was the preferred material used for the floors in all province except in Torba and Tafea which had traditional materials as the preferred floor material.
5 6 4 5 4
7 4
12 14
12 10
14 10
15
10
24
26
23
16
24
25
25
25
19
39 36
39
46
42
36 45
33
42
18 14 19
31 21 18 15 15
22
0
10
20
30
40
50
60
70
80
90
100
VANUATU URBAN RURAL TORBA SANMA PENAMA MALAMPA SHEFA TAFEA
%
1 2 3 4 5 6 7

135
Figure 134: Proportion of private households by place of residence and main type of material used for the walls of dwellings (%), Vanuatu: 2009
Figure 135: Proportion of private households by place of residence and main type of material used for the roofs of dwellings (%), Vanuatu: 2009
10 13 8
4
21
5 8 8 5
3 5
4 5
19
31
15
5
9
8 6
40
12
25
47
18
9
26
14 18
39
12
43
3
56
80
42
71 64
8
67
0
10
20
30
40
50
60
70
80
90
100
VANUATU URBAN RURAL TORBA SANMA PENAMA MALAMPA SHEFA TAFEA
%
Traditional materials Concrete Metal Makeshift or improvised materials Wood Others
3 3 3 2 2 3 5 2 2 4
45
59 78
51
65
70
10
65
48
91
34
19
43
29 18
85
28
0
10
20
30
40
50
60
70
80
90
100
VANUATU URBAN RURAL TORBA SANMA PENAMA MALAMPA SHEFA TAFEA
%
Metal Traditional materials Makeshift or improvised materials Concrete Wood Others

136
Figure 136: Proportion of private households by place of residence and main type of material used for the floors of dwelling (%), Vanuatu: 2009
5.5.6 Private households by water source for drinking and washing The distribution of Vanuatu dwellings by main source of drinking water is displayed in Figure 137. It shows that the majority of dwellings (27%) used a shared pipe, another 19% used a village tank, 18% used private pipe, 15% used household tanks and 11% used the river or lake or spring. Private piped water was widely used in the urban areas (43%) compared to in the rural areas. The main source of drinking water varies widely between provinces. The distribution of dwellings by main source of washing water is displayed in Figure 138. It shows the great variation by main source of washing water in the provinces.
10 12
29
3
24
3 6
18 6
5
6
8
10 4
4
11
22
29
34
22
21
31
9
46
60
87
51
29
64
49 60
78
24
0
10
20
30
40
50
60
70
80
90
100
VANUATU URBAN RURAL TORBA SANMA PENAMA MALAMPA SHEFA TAFEA
%
Concrete Traditional materials Metal Makeshift or improvised materials Wood Others

137
Figure 137: Proportion of private households by place of residence and main source of drinking water (%), Vanuatu: 2009
Figure 138: Proportion of private households by place of residence and main source of washing water (%), Vanuatu: 2009
18
43
10 12
35
11
27
36
25 21
23
22 25
32
35
4
11
6
15
7
18
20
19
21
17
13 19
5
24 38
20 40
25
10
6
11 14 12 14
7 8
33
0
10
20
30
40
50
60
70
80
90
100
VANUATU URBAN RURAL TORBA SANMA PENAMA MALAMPA SHEFA TAFEA
%
Piped private Piped shared Village standpipe Well - protected Well - unprotected
Household tank Village tank Bottled water River lake spring Others
21
50
12 19
40
10
28
39
25
13
28
19 25
35
30
6
7
7
13 7
15
8
11
13
9
18
9
9
11
10
30
11
20 25
39
23 20
16 8
45
0
10
20
30
40
50
60
70
80
90
100
VANUATU URBAN RURAL TORBA SANMA PENAMA MALAMPA SHEFA TAFEA
%
Piped private Piped shared Village standpipe Well - protected Well - unprotected
Household tank Village tank Sea River lake spring Others

138
5.5.7 Private households by main energy source for lighting and cooking The main source of energy for lighting in Vanuatu was the kerosene lamp used by 48% of all households (Fig.139). A further 28% of all households used electricity - main grid. Not surprisingly the urban areas and Shefa province shared the highest usage of electricity main grid. Torba province had with 37%, the highest number of households using a Coleman lamp as their main energy source of lighting. The main source of energy for cooking was wood/coconut shells and used by 85% of all households in Vanuatu (Fig.140). Thirteen percent of all households used gas. However, gas usage was more dominant in the urban areas and Shefa province compared to the other provinces
where the use of wood/coconut shells was preferred.
Figure 139: Proportion of private households by place of residence and main source of lighting (%), Vanuatu: 2009
28
80
11
26
3 7
61
8
4
4
5 5
3
6
4 5
7
48
6
62
23
53
71
71
25
57
7 9
37
4 19
8
5
5 10 6 7
10
12 19
0
10
20
30
40
50
60
70
80
90
100
VANUATU URBAN RURAL TORBA SANMA PENAMA MALAMPA SHEFA TAFEA
%
Electricity - main grid Own generator Solar Gas Torch
Kerosene lamp Coleman lamp Candles Wood, Coconut Others

139
Figure 140: Proportion of private households by place of residence and main source for cooking (%), Vanuatu: 2009
5.5.8 Private households by main toilet facility
At 37%, the private pit latrine was the main toilet facility used in Vanuatu (Fig.141). Fifteen percent of all household used flushed private toilets, 14% used private VIP10, 10% used pit latrine-shared and 8 used shared VIP toilets. Forty three percent of all urban households used a flush private toilet and 22% households used a shared flush toilet. Rural areas tend to use a private pit latrine, a private VIP and shared pit latrine toilet facility.
10 The ventilated improved pit latrine, or VIP, is a pit toilet with a pipe (vent pipe) fitted to the pit, and a screen (fly screen) at the top outlet of the pipe. VIP latrines are an improvement to overcome the disadvantages of simple pit latrines, i.e. fly and mosquito nuisance and unpleasant odors. The smell is carried upwards by the chimney effect and flies are prevented from leaving the pit and spreading disease. (Wikipedia, the free encyclopedia [online]).
3
85
53
96 99 91
97 98
64
98
3
13
40 31
0
10
20
30
40
50
60
70
80
90
100
VANUATU URBAN RURAL TORBA SANMA PENAMA MALAMPA SHEFA TAFEA
%
Others Gas Charcoal Wood/coconut shells Kerosene Electricity

140
Figure 141: Proportion of private households by place of residence and main type of toilet facility (%), Vanuatu: 2009
5.5.9 Private households by means of communication
Only 4% of all households in the Vanuatu had a landline phone available (Fig.142). However 11% of urban households had a landline phone.
The majority of households in Vanuatu (76%) had access to mobile phones (Fig.143). 91% of urban households owned a mobile phone compared to 71% of rural households. The percentage of households owning a mobile phone in Torba was, with 10%, very low.
The number of households with an internet connection was very low in Vanuatu; only 3% of all households had access to internet (Fig.144). Nine percent of household in urban areas had access to the internet.
15
43
13
32 6
22
17
5
6
5
13
6
6
6
14
6
17 43
17
6
14
8
28
8
7
8
6 8
9
8
15
37
8
46
40 42
68
45
16
40
10 5
12 5 8
20 12
7 11
0
10
20
30
40
50
60
70
80
90
100
VANUATU URBAN RURAL TORBA SANMA PENAMA MALAMPA SHEFA TAFEA
%
None Pit latrine shared Pit latrine
VIP - shared VIP - private Water seal - shared
Water seal - private Flush shared Flush private

141
Figure 142: Proportion of private households by place of residence and availability of a telephone (land-line) (%), Vanuatu: 2009
Figure 143: Proportion of private households by place of residence and availability of a mobile phone (%), Vanuatu: 2009
411
2 39
20
10
20
30
40
50
60
70
80
90
100
VANUATU URBAN RURAL TORBA SANMA PENAMA MALAMPA SHEFA TAFEA
%
Yes No
76
91
71
10
8171 75
87
63
0
10
20
30
40
50
60
70
80
90
100
VANUATU URBAN RURAL TORBA SANMA PENAMA MALAMPA SHEFA TAFEA
%
Yes No

142
Figure 144: Proportion of private households by place of residence and accessibility to the Internet connection (%), Vanuatu: 2009
5.5.10 Private households by main means of waste disposal During the 2009 census, information was collected with respect to how households manage their waste. There were 8 different means of waste disposal in Vanuatu: Authorized waste collection, taken to a central place, burning, recycling, lagoon/ocean/stream, burying, composting and others means of waste disposal. In Vanuatu, 52% of all households burned waste, 18% used authorized waste collection and 12% took waste to a central place (Fig.145). Urban areas had 67% of households who used the authorized waste collection. In contrast, there was very little waste collection in the rural areas. Burning waste was widely used by rural households (61%) as the main means of waste disposal compared to the 24% of urban households. Four percent of all households in Torba used the lagoon or ocean or stream to dispose of waste.
39 8
0
10
20
30
40
50
60
70
80
90
100
VANUATU URBAN RURAL TORBA SANMA PENAMA MALAMPA SHEFA TAFEA
%
Yes No

143
Figure 145: Proportion of private households by place of residence and main mode of waste disposal (%), Vanuatu: 2009
5.5.11 Private households involved in agricultural cash crop and fisheries activities
The 2009 census included several questions on whether the households were engaged in agricultural and fisheries activities.
In general, agricultural cash cropping involvement was more common in the rural areas compared to the urban areas. For Vanuatu, 48% of all households were involved in kava agricultural activity, 50% in coconut, 18% cocoa, 15% vanilla, 13% sandalwood, 3% coffee, 2% pepper and 18% involved in other agricultural cash crop activities.
The province with the highest involvement in kava cultivation was Penama province where 84% of all households were engage in kava agricultural activity (Fig.146). This is in contrast to urban households who had only 3% of its household engaged in kava activity.
Malampa province led the coconut agricultural activity, by having 88% of its household engaged in coconut cultivation (Fig.147). The urban areas again recorded the lowest proportion of households engaged in this activity (4%).
Table 44 shows the engagement of households in other agricultural cash crops such as cocoa, coffee, sandalwood, pepper, vanilla and other crops.
18
67
20
41 12
4
15 23
9
24 18
10
52
24
61
24
55
29
69
41
88
4
6 8
24
8
4
6 6 6 8
5 30
5 17
6 6
0
10
20
30
40
50
60
70
80
90
100
VANUATU URBAN RURAL TORBA SANMA PENAMA MALAMPA SHEFA TAFEA
%
Others Composting Bury
Lagoon/ocean/stream Recycling Burn
Take to central place Authorised waste collection

144
Figure 146: Proportion of private households by place of residence and agricultural activities (%), Kava, Vanuatu: 2009
Figure 147: Proportion of private households by place of residence and agricultural activities (%), Coconut, Vanuatu: 2009
48
3
63
69
53
84
58
14
72
0 10 20 30 40 50 60 70 80 90 100
VANUATU
URBAN
RURAL
TORBA
SANMA
PENAMA
MALAMPA
SHEFA
TAFEA
%
Yes No
50
4
64
71
52
51
88
23
56
0 10 20 30 40 50 60 70 80 90 100
VANUATU
URBAN
RURAL
TORBA
SANMA
PENAMA
MALAMPA
SHEFA
TAFEA
%
Yes No

145
Table 44: Proportion of private households by place of residence and agricultural activity (%), Vanuatu: 2009
Fisheries included two types of fishing activities namely marine fishing and fresh water fishing activity and the census included several questions on whether the households were engaged in fisheries activities for subsistence, sale or both. The data shows that 32% of all households in Vanuatu were engaged in marine fishing; 26% were engaged but only for subsistence and a further 6% of households were engaged in marine fishing for both subsistence and sale purposes (Fig. 148).
Furthermore, 17% of all households in Vanuatu were engaged in fresh water fishing. Of this number, 15% were engaged for subsistence purposes (Fig.149).
Torba province has most of its households (57%) engaged in marine fishing but mainly as subsistence activities (Fig. 148).
Yes No Yes No Yes No Yes No Yes No Yes No
VANUATU 18 82 3 97 13 87 2 98 15 85 18 82
URBAN 0 100 0 100 1 99 0 100 2 98 3 97 RURAL 24 76 4 96 17 83 2 98 19 81 23 77
TORBA 4 96 0 100 5 95 2 98 9 91 11 89 SANMA 20 80 0 100 11 89 3 97 21 79 13 87 PENAMA 18 82 0 100 4 96 2 98 24 76 46 54 MALAMPA 64 36 1 99 11 89 3 97 27 73 10 90 SHEFA 3 97 1 99 6 94 0 100 5 95 15 85 TAFEA 1 99 19 81 54 46 1 99 9 91 17 83
Vanilla Other cropsPlace of residence
SandalwoodCoffeeCocoa Pepper

146
Figure 148: Proportion of private households by place of residence and marine fishing activities (%), Vanuatu: 2009
Figure 149: Proportion of private households by place of residence and fresh water fishing activities (%), Vanuatu: 2009
68
89
61
25
70 68 59
77
62
26
9
31
57
25 24 34
17
32
6 7 17
5 7 6 4 5
0
10
20
30
40
50
60
70
80
90
100
VANUATU URBAN RURAL TORBA SANMA PENAMA MALAMPA SHEFA TAFEA
%
No fishing Subsistence only Sale only Both
83
96
79 78 75 81 77
93
81
15
3
19 17 23 15 21
5
18
2 2 4 2 4
0
10
20
30
40
50
60
70
80
90
100
VANUATU URBAN RURAL TORBA SANMA PENAMA MALAMPA SHEFA TAFEA
%
No fishing Subsistence only Sale only Both

147
5.5.12 Private households owning or raising livestock The following section provides an overview on the number of livestock counted (Table 45), and the proportion of households that raise or own livestock (Figs.150 to 154). In general, livestock such as chickens (64%), pigs (45%) and cattle (29%) were commonly raised by households in Vanuatu, but only a few households raised goats (8%) and horses (3%).
Table 45: Total number of livestock, Vanuatu: 2009
Figure 150: Proportion of private households by place of residence raising pigs (%), Vanuatu: 2009
Place of
residence Pigs Goats Cattle Horses Chickens
VANUATU 108,056 34,086 105,051 5,559 468,779
URBAN 9,236 8,622 7,592 1,076 23,114
RURAL 98,820 25,464 97,459 4,483 445,665
TORBA 2,718 1,152 2,298 65 17,925
SANMA 16,107 8,403 48,116 2,233 99,596
PENAMA 25,279 3,704 11,479 271 110,041
MALAMPA 17,061 1,969 17,705 316 91,404
SHEFA 24,080 13,068 16,169 1,612 90,205
TAFEA 22,811 5,790 9,284 1,062 59,608
Number of livestock
45
5
57 56
40
66
52
22
76
0
10
20
30
40
50
60
70
80
90
100
VANUATU URBAN RURAL TORBA SANMA PENAMA MALAMPA SHEFA TAFEA
%
Yes No

148
Figure 151: Proportion of private households by place of residence raising goats (%), Vanuatu: 2009
Figure 152: Proportion of private households by place of residence raising cattle (%), Vanuatu: 2009
8 2
9 6 3 6 6
23
0
10
20
30
40
50
60
70
80
90
100
VANUATU URBAN RURAL TORBA SANMA PENAMA MALAMPA SHEFA TAFEA
%
Yes No
29
1
39 30
39 35 43
10
42
0
10
20
30
40
50
60
70
80
90
100
VANUATU URBAN RURAL TORBA SANMA PENAMA MALAMPA SHEFA TAFEA
%
Yes No

149
Figure 153: Proportion of private households by place of residence raising horses (%), Vanuatu: 2009
Figure 154: Proportion of private households by place of residence raising chicken (%), Vanuatu: 2009
3 4 9 6
0
10
20
30
40
50
60
70
80
90
100
VANUATU URBAN RURAL TORBA SANMA PENAMA MALAMPA SHEFA TAFEA
%
Yes No
64
14
80 79
67
87 81
32
90
0
10
20
30
40
50
60
70
80
90
100
VANUATU URBAN RURAL TORBA SANMA PENAMA MALAMPA SHEFA TAFEA
%
Yes No

150
5.5.13 Private households and availability of various household items This section briefly summarizes the availability of a variety of household items and appliances. The different sections include a summary table presenting the total number of items by place of residence. Subsequently graphs are added that show the proportion of households by place of residence with at least one item that is in working order. It excludes any items that were broken, borrowed or rented. The graphs therefore are simply divided into two categories: ‘yes’ if the household owns the item or ‘no’ if it does not own the item.
5.5.13.1 Private households and availability of kitchen appliances
In 2009. 27% of all households in Vanuatu had gas stoves; 15% in rural areas and 65% in urban households (Table 46 and Fig. 155). Figure 156 shows that, 13% of all households in Vanuatu had a fridge or freezer; 6% and 37% of rural and urban households had this kitchen appliance.
Table 46: Number of items of cooking appliances by place of residence, Vanuatu: 2009
Place of
Residence Gas stove Fridge/Freezer
VANUATU 14,024 7,670
URBAN 8,024 5,090 RURAL 6,000 2,580
TORBA 104 45 SANMA 2,519 1,179 PENAMA 802 230 MALAMPA 1,086 322 SHEFA 8,945 5,657 TAFEA 568 237
Item

151
Figure 155: Proportion of private households by place of residence and availability of a gas stove (%), Vanuatu: 2009
Figure 156: Proportion of private households by place of residence and availability of a Fridge/Freezer (%), Vanuatu: 2009
27
65
15
5
24
11
12
52
8
0 10 20 30 40 50 60 70 80 90 100
VANUATU
URBAN
RURAL
TORBA
SANMA
PENAMA
MALAMPA
SHEFA
TAFEA
%
Yes No
13
37
6
2
10
3
3
30
3
0 10 20 30 40 50 60 70 80 90 100
VANUATU
URBAN
RURAL
TORBA
SANMA
PENAMA
MALAMPA
SHEFA
TAFEA
%
Yes No

152
5.5.13.2 Private households and availability of entertainment appliances
A minority of households in Vanuatu had the following entertainment appliances; radio (35%), TV (37%), computer (8%) and a DVD player (36%) (Table 47 and Figs. 157 to 160). However, it is a different scenario when comparing urban and rural households as more urban households had access to radio (53%), TV (72%), computer (22%) and DVD players (68%).
Table 47: Number of items of entertainment appliances by place of residence, Vanuatu: 2009
TV Screen Radio Computer DVD Deck
VANUATU 19,583 18,046 4,979 19,963
URBAN 9,354 6,771 3,458 9,050
RURAL 10,229 11,275 1,521 10,913
TORBA 306 384 59 342
SANMA 3,658 3,876 677 3,902
PENAMA 1,359 1,884 154 1,458
MALAMPA 2,055 2,083 177 2,313
SHEFA 10,974 8,702 3,700 10,677
TAFEA 1,231 1,117 212 1,271
ItemPlace of residence

153
Figure 157: Proportion of private households by place of residence and availability of a radio (%), Vanuatu: 2009
Figure 158: Proportion of private households by place of residence and availability of a TV (%), Vanuatu: 2009
35
53
29
20
39
27
24
49
18
0 10 20 30 40 50 60 70 80 90 100
VANUATU
URBAN
RURAL
TORBA
SANMA
PENAMA
MALAMPA
SHEFA
TAFEA
%Yes No
37
72
26
16
36
19
24
61
19
0 10 20 30 40 50 60 70 80 90 100
VANUATU
URBAN
RURAL
TORBA
SANMA
PENAMA
MALAMPA
SHEFA
TAFEA
%
Yes No

154
Figure 159: Proportion of private households by place of residence and availability of a computer (%), Vanuatu: 2009
Figure 160: Proportion of private households by place of residence and availability of a DVD player (%), Vanuatu: 2009
8
22
3
2
5
2
2
17
3
0 10 20 30 40 50 60 70 80 90 100
VANUATU
URBAN
RURAL
TORBA
SANMA
PENAMA
MALAMPA
SHEFA
TAFEA
%Yes No
36
68
26
17
36
20
26
58
19
0 10 20 30 40 50 60 70 80 90 100
VANUATU
URBAN
RURAL
TORBA
SANMA
PENAMA
MALAMPA
SHEFA
TAFEA
%Yes No

155
5.5.13.3 Private households and availability of various means of transport Only a minority of households in Vanuatu had the following means of transport; motor vehicle (7%), motor bike (2%), boat 3%) and canoe (10%). Figures 161 to 164 and Table 48) display these various transportation means by place of residence.
Table 48: Number of transport items by place of residence, Vanuatu: 2009
Figure 161: Proportion of private households by place of residence and availability of a motor vehicle (%), Vanuatu: 2009
Place of
residence Motor vehicle Motorbike Boat Canoe
VANUATU 4,698 1,158 1,601 5,982
URBAN 2,999 423 394 293
RURAL 1,699 735 1,207 5,689
TORBA 9 22 43 646
SANMA 818 198 421 1,051
PENAMA 149 52 131 607
MALAMPA 179 187 252 2,143
SHEFA 3,328 612 600 876
TAFEA 215 87 154 659
Item
7
18
3
7
2
2
15
3
0 10 20 30 40 50 60 70 80 90 100
VANUATU
URBAN
RURAL
TORBA
SANMA
PENAMA
MALAMPA
SHEFA
TAFEA
%
Yes No

156
Figure 162: Proportion of private households by place of residence and availability of a motor bike (%), Vanuatu: 2009
Figure 163: Proportion of private households by place of residence and availability of a boat (%), Vanuatu: 2009
2
2
1
1
1
1
2
2
1
0 10 20 30 40 50 60 70 80 90 100
VANUATU
URBAN
RURAL
TORBA
SANMA
PENAMA
MALAMPA
SHEFA
TAFEA
%
Yes No
3
3
3
2
3
2
2
3
2
0 10 20 30 40 50 60 70 80 90 100
VANUATU
URBAN
RURAL
TORBA
SANMA
PENAMA
MALAMPA
SHEFA
TAFEA
%
Yes No

157
Figure 164: Proportion of private households by place of residence and availability of a canoe (%), Vanuatu: 2009
5.5.13.4 Private households and availability of other appliances
Ownership of household appliances such as generator and lawn mowers was asked in the 2009 population census of which 18% and 10% of households in Vanuatu stated that they have access to both. Table 49 and Figures 165 and 166 display their availability by place of enumeration.
Table 49: Number of other household appliances by place of residence, Vanuatu: 2009
10
2
13
30
9
8
21
4
10
0 10 20 30 40 50 60 70 80 90 100
VANUATU
URBAN
RURAL
TORBA
SANMA
PENAMA
MALAMPA
SHEFA
TAFEA
%
Yes No
VANUATU URBAN RURAL TORBA SANMA PENAMA MALAMPA SHEFA TAFEA
Generator 9,287 1,287 8,000 339 2,049 1,548 1,854 2,671 826
Mower 5,681 2,053 3,628 45 1,142 535 527 2,956 476
ItemPlace of residence
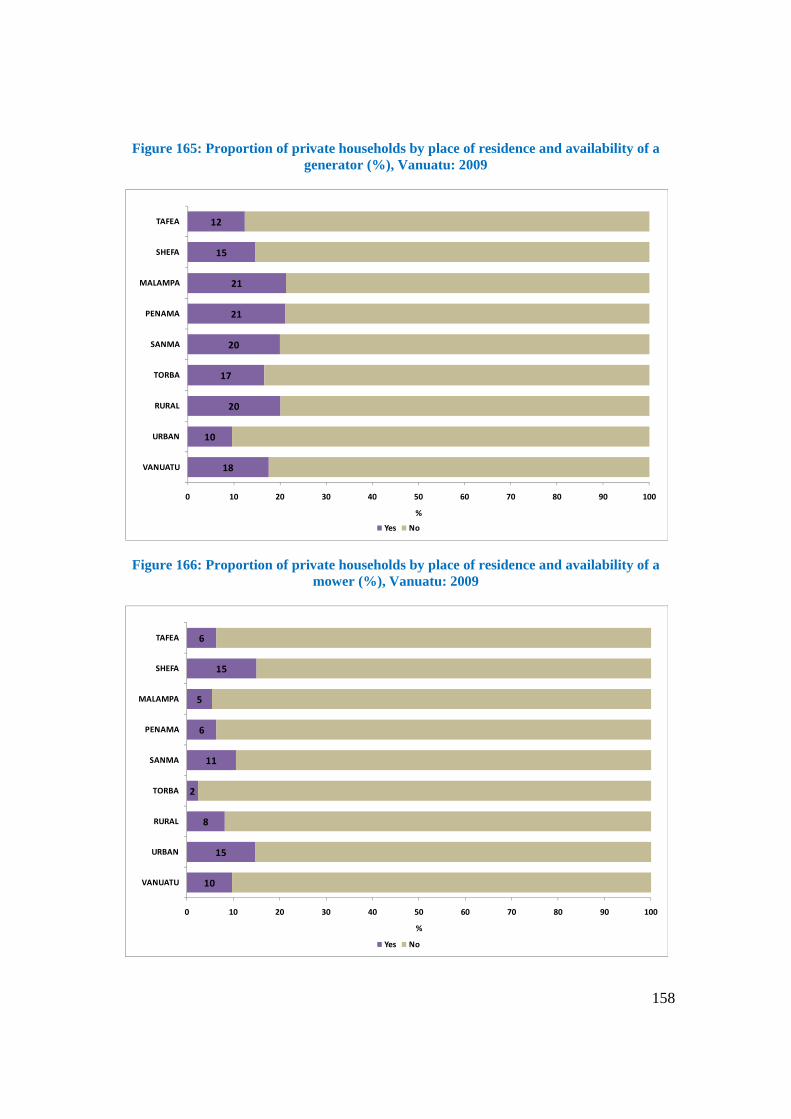
158
Figure 165: Proportion of private households by place of residence and availability of a generator (%), Vanuatu: 2009
Figure 166: Proportion of private households by place of residence and availability of a mower (%), Vanuatu: 2009
18
10
20
17
20
21
21
15
12
0 10 20 30 40 50 60 70 80 90 100
VANUATU
URBAN
RURAL
TORBA
SANMA
PENAMA
MALAMPA
SHEFA
TAFEA
%
Yes No
10
15
8
2
11
6
5
15
6
0 10 20 30 40 50 60 70 80 90 100
VANUATU
URBAN
RURAL
TORBA
SANMA
PENAMA
MALAMPA
SHEFA
TAFEA
%
Yes No

159
5.6 Household bednets The majority of all households in Vanuatu had a bednet (76%) as shown in Figure 167. In total 130,789 bednets were counted in the 2009 census (Table 50). More households in the rural areas (88%) had bednets compared to households in the urban areas (38%).
Table 50: Number of private households by place of residence and availability of bednets, Vanuatu: 2009
Fig. 167: Proportion of private households by place of residence and availability of bednets
(%), Vanuatu: 2009
Place of
Residence Total Yes No
VANUATU 47,373 36,028 11,345 130,789 URBAN 11,606 4,425 7,181 11,526 RURAL 35,767 31,603 4,164 119,263 TORBA 1,766 1,723 43 7,982 SANMA 9,213 7,329 1,884 25,932 PENAMA 6,620 5,870 750 22,622 MALAMPA 7,991 7,336 655 27,346 SHEFA 15,930 8,340 7,590 25,798 TAFEA 5,853 5,430 423 21,109
Households with/without bednets Number of bednets
76
38
8898
8089 92
52
93
0
10
20
30
40
50
60
70
80
90
100
VANUATU URBAN RURAL TORBA SANMA PENAMA MALAMPA SHEFA TAFEA
%
Yes No

160
6. POPULATION PROJECTIONS Timely and accurate information about population trends is in high demand for anyone making decisions in business, research, government and the community. Knowledge about the current size and structure of a country’s population is needed for the formulation and implementation of policies and programmes in almost all areas of public life. As policies are aimed at resolving current issues through the achievement of goals in the future, knowledge about future population trends is required. Activities in areas as diverse as health, environment, poverty reduction, social progress, and economic growth rely on comprehensive and consistent demographic information. The appropriate method to produce population trends is to prepare estimates and projections of population size and structure by age and sex. The starting point for any projection is a reliable and current age–sex distribution of a population. Furthermore, information on recent levels and patterns of fertility, mortality, and migration is needed. The cohort-component method was used to compute the population projections presented in this report. This procedure simulates population changes as a result of changes in the components of growth: fertility, mortality and migration. Based on past information and current levels, assumptions are made about future trends in these components of change. The assumed rates are applied to the age and sex structure of the population in a simulation that takes into account:
the age at which people die is related to their sex and age; women have children; and some people change their place of residence.
The cohort-component method of projecting a population follows each cohort of people of the same age and sex throughout their lifetime, according to their exposure to fertility, mortality and migration11. The key to making meaningful projections lies in the choice of assumptions about future population developments. These assumptions concern possible future birth, death and migration
rates.
6.1 National projections
Projection assumptions As a general guideline, when preparing multiple assumptions about future levels of fertility, mortality and migration, it is advisable to arrive at outcomes that are symmetrical. This means
11 1994. Arriaga E.E. Population analysis with microcomputers, volume I, Presentation of techniques, p. 309–310. US Census Bureau, Department of Commerce, USA.

161
that the level of low and high, or fast and slow, growth assumptions should be equally positioned with respect to the medium level assumption (i.e. above and below). The following demographic inputs were developed for the projections.
Projection period The population projections cover the 45-year period of 2009–2054. Base population Projections are based on the 2009 Vanuatu census age and sex distribution, adjusted to mid-year 2009. The population is further adjusted for suspected under enumeration of the age groups 15-24 for males, and to a lesser degree for females. Table 51 and Figures 168 and 167 show a comparison of the actual 2009 population count, and results of a population projection that used the 1999 population as a starting point (base population), and intercensal fertility and mortality estimates. A comparison of the counted and projected population shows a very good fit in general, with the exceptions of the 15-24 year age groups. While these young people are often the age groups most likely affected by migration (people in search for further education and/or employment opportunities overseas), it seems unlikely that there were that many people who had left Vanuatu during the intercensal period. It was therefore decided to assume that these people must have been missed during the 2009 census count. In addition, the female population aged 30-44 was slightly adjusted for suspected under enumeration. In total the enumerated census population of 234,023 was adjusted by 7,000 to 241,023 people (Table 52). Because the projections should refer to the mid-year of each year of the projection period, the base year population has further been adjusted to a new total of 239,000 for mid-year 2009 (the PAS procedure MOVEPOP has been used to estimate the mid-year population from the November census population) (Table 53).

162
Table 51: Comparison of the projected population with the enumerated population, Vanuatu 2009
Male observed
Female observed
Male projected
Female projected
Males Females Males Females
0-4 17,310 16,057 17,647 16,275 337 218 1.9 1.45-9 15,455 14,230 15,502 14,342 47 112 0.3 0.810-14 14,762 13,159 14,414 13,358 -348 199 -2.4 1.515-19 12,027 11,855 13,979 13,208 1,952 1,353 16.2 11.420-24 10,415 11,126 12,529 11,542 2,114 416 20.3 3.725-29 9,124 9,291 8,995 8,573 -129 -718 -1.4 -7.730-34 7,790 7,903 7,890 8,268 100 365 1.3 4.635-39 7,076 7,095 7,166 7,495 90 400 1.3 5.640-44 5,814 5,709 6,142 6,257 328 548 5.6 9.645-49 5,066 5,175 5,244 5,270 178 95 3.5 1.850-54 3,789 3,626 3,966 3,830 177 204 4.7 5.655-59 3,261 3,102 3,325 3,158 64 56 1.9 1.860-64 2,192 2,127 2,411 2,297 219 170 10.0 8.065-69 2,054 1,772 1,850 1,656 -204 -116 -10.0 -6.570-74 1,085 983 1,107 1,082 22 99 2.0 10.175+ 1,871 1,722 1,326 1,195 -545 -527 -29.1 -30.6Total 119,091 114,932 123,492 117,807 4,401 2,875 3.7 2.5
absolute difference percentage difference2009 Census 2009 ProjectionAge group

163
Figure 168: Comparison of the projected male population with the enumerated male population, Vanuatu 2009
Figure 169: Comparison of the projected female population with the enumerated female population, Vanuatu 2009
0
2,000
4,000
6,000
8,000
10,000
12,000
14,000
16,000
18,000
20,000
0-4 5-9 10-14 15-19 20-24 25-29 30-34 35-39 40-44 45-49 50-54 55-59 60-64 65-69 70-74 75+
Num
ber o
f peo
ple
Age group
Male observed Male projected
0
2,000
4,000
6,000
8,000
10,000
12,000
14,000
16,000
18,000
20,000
0-4 5-9 10-14 15-19 20-24 25-29 30-34 35-39 40-44 45-49 50-54 55-59 60-64 65-69 70-74 75+
Num
ber o
f peo
ple
Age group
Female observed Female projected
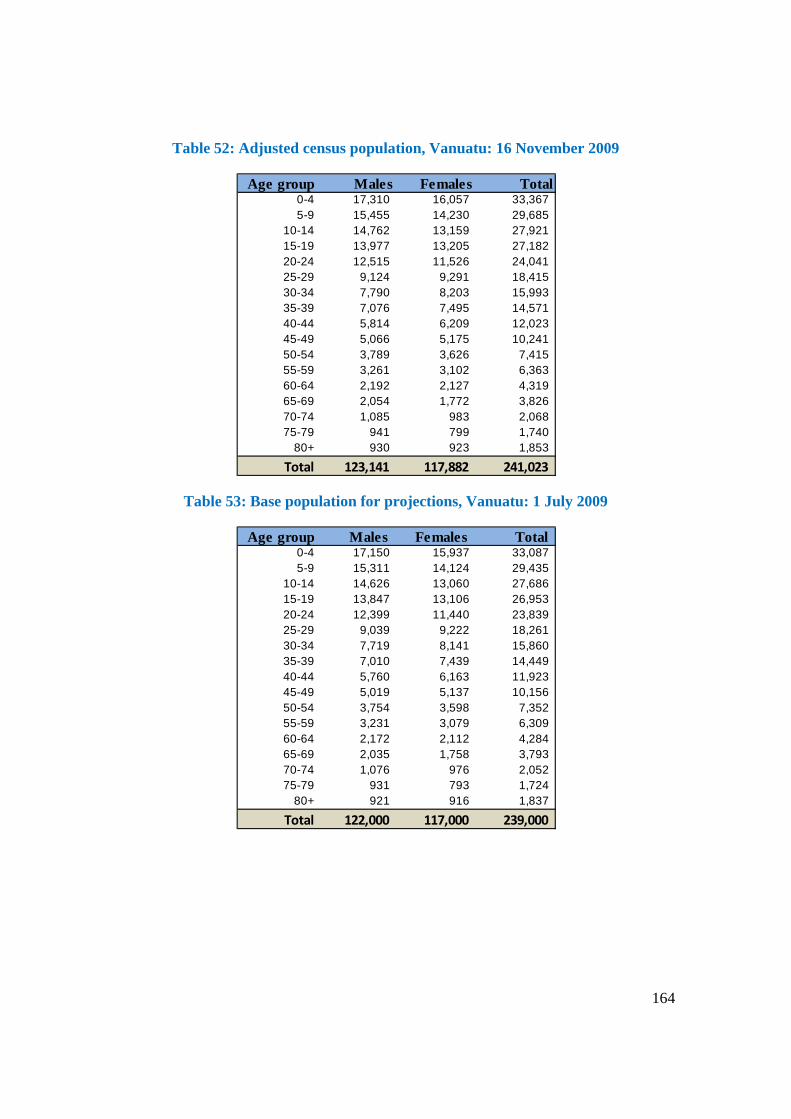
164
Table 52: Adjusted census population, Vanuatu: 16 November 2009
Table 53: Base population for projections, Vanuatu: 1 July 2009
Age group Males Females Total0-4 17,310 16,057 33,367 5-9 15,455 14,230 29,685
10-14 14,762 13,159 27,921 15-19 13,977 13,205 27,182 20-24 12,515 11,526 24,041 25-29 9,124 9,291 18,415 30-34 7,790 8,203 15,993 35-39 7,076 7,495 14,571 40-44 5,814 6,209 12,023 45-49 5,066 5,175 10,241 50-54 3,789 3,626 7,415 55-59 3,261 3,102 6,363 60-64 2,192 2,127 4,319 65-69 2,054 1,772 3,826 70-74 1,085 983 2,068 75-79 941 799 1,740
80+ 930 923 1,853
Total 123,141 117,882 241,023
Age group Males Females Total0-4 17,150 15,937 33,087 5-9 15,311 14,124 29,435
10-14 14,626 13,060 27,686 15-19 13,847 13,106 26,953 20-24 12,399 11,440 23,839 25-29 9,039 9,222 18,261 30-34 7,719 8,141 15,860 35-39 7,010 7,439 14,449 40-44 5,760 6,163 11,923 45-49 5,019 5,137 10,156 50-54 3,754 3,598 7,352 55-59 3,231 3,079 6,309 60-64 2,172 2,112 4,284 65-69 2,035 1,758 3,793 70-74 1,076 976 2,052 75-79 931 793 1,724
80+ 921 916 1,837
Total 122,000 117,000 239,000

165
Fertility The estimated TFR of the period 2009 and associated ASFR, as described in Section 3.1 (Table 11), are used as a starting point, with four different assumptions made about future fertility developments (Fig.170). The future TFR level of the medium fertility assumption is assumed to reach 2.0, which is the average level of TFR of populations in present-day Australia, France, New Zealand and the United States (App. 22). This level will be reached (by means of extrapolation) with a pace of fertility decline that is based on Vanuatu’s past fertility trend. According to this pace, Vanuatu will reach a TFR of 2.0 in the year 2058, and will reach a level of 2.1 at the end of the projection period in 2054. The reason for choosing the fertility level of countries such as Australia, France, New Zealand and the United States as the future level for Vanuatu is twofold:
1) These countries have completed the “demographic transition” (see explanatory note in App.24). Appendix 22 shows that the TFR of these four countries has remained at an almost constant level of 2.0 over the last 30 years (1975–2010).
2) They are regarded as the metropolitan focal points of Pacific Island countries.
Therefore the medium fertility assumption is set as follows. Assumption 1 — Medium Fertility: Fertility decreases to 2.1 in the year 2054 (as described above).
The high and low fertility assumptions were built symmetrically around the medium fertility assumption. Assumption 2 — High Fertility: The high fertility assumption assumes a TFR of 0.5 higher than the medium fertility level. Therefore, the level of TFR in 2054 is 2.6. Assumption 3 — Low Fertility: The low fertility assumption assumes a TFR of 0.5 lower than the medium fertility level. Therefore, the level of TFR in 2054 is 1.6. Assumption 4 — Constant Fertility: This is a purely academic assumption, with the purpose to demonstrate what would happen to Vanuatu in terms of population size if the current TFR of 4.1 remains constant at this level for the entire projection period.

166
Figure 170: Estimated past levels of fertility, and future fertility assumptions for projections, Vanuatu: 1954–2054
Mortality It is thought that under normal circumstances (meaning in the absence of catastrophes such as wars, epidemics and major natural disasters), the Vanuatu’ health situation and mortality levels will continuously improve throughout the projection period. The estimated life expectancies at birth [E(0)] — 69.6 years and 72.7 years for males and females, respectively — are used as the starting point for projections in 2009. These estimates are based on the estimates as outlined in section 3.2. Assumption: The population projections presented here assumes a rising trend in life expectancy for males and females according to the UN working models of mortality improvement, as described in “World Population Prospects, p. 14412 (App.23). According to this model, current estimated life expectancies gradually increase and reach 77.3 and 81.4 years in 2054 for males and females, respectively (Fig.171). Only one assumption regarding mortality is made. The reason for this is that variations in mortality levels (multiple assumptions) usually have only a minor impact on final projection
12 1995. United Nations. World Population Prospects. NewYork: United Nations. 886 p.
7.6
6.1
5.0
4.5 4.1
2.1
2.6
1.6
4.1
0
1
2
3
4
5
6
7
8
1954 1959 1964 1969 1974 1979 1984 1989 1994 1999 2004 2009 2014 2019 2024 2029 2034 2039 2044 2049 2054
TFR
Year
Past level Medium High Low Constant
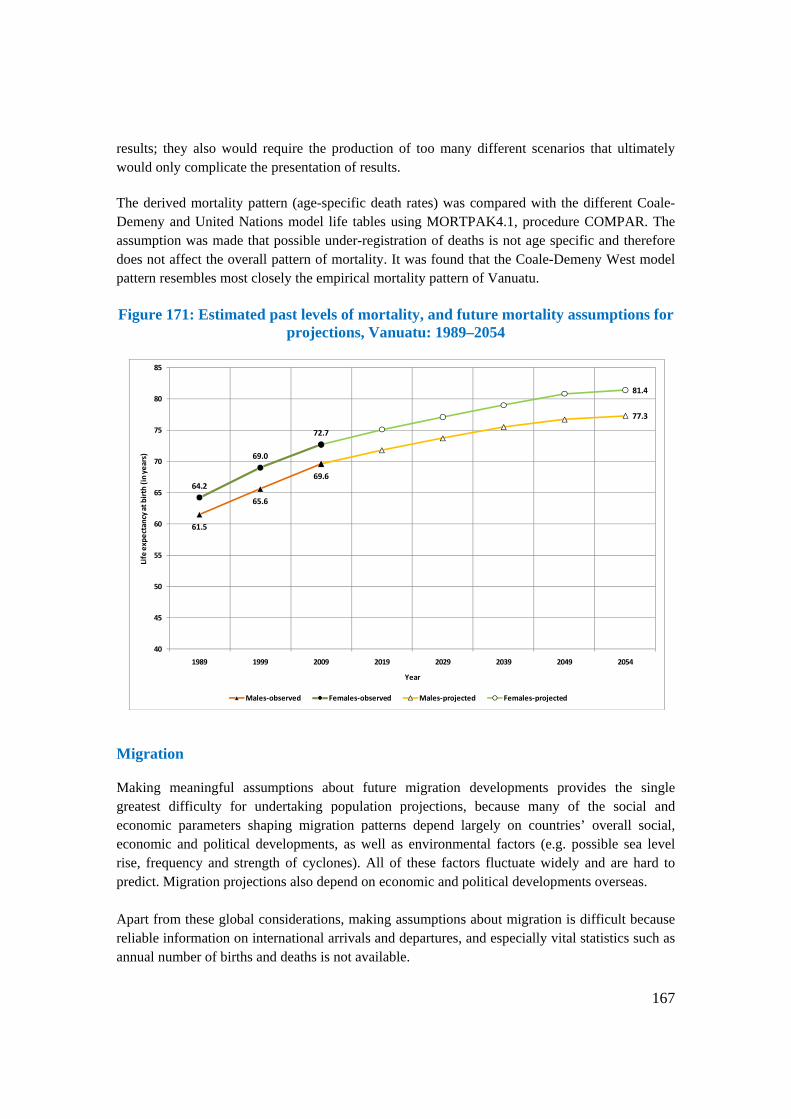
167
results; they also would require the production of too many different scenarios that ultimately would only complicate the presentation of results. The derived mortality pattern (age-specific death rates) was compared with the different Coale-Demeny and United Nations model life tables using MORTPAK4.1, procedure COMPAR. The assumption was made that possible under-registration of deaths is not age specific and therefore does not affect the overall pattern of mortality. It was found that the Coale-Demeny West model pattern resembles most closely the empirical mortality pattern of Vanuatu. Figure 171: Estimated past levels of mortality, and future mortality assumptions for
projections, Vanuatu: 1989–2054
Migration Making meaningful assumptions about future migration developments provides the single greatest difficulty for undertaking population projections, because many of the social and economic parameters shaping migration patterns depend largely on countries’ overall social, economic and political developments, as well as environmental factors (e.g. possible sea level rise, frequency and strength of cyclones). All of these factors fluctuate widely and are hard to predict. Migration projections also depend on economic and political developments overseas. Apart from these global considerations, making assumptions about migration is difficult because reliable information on international arrivals and departures, and especially vital statistics such as annual number of births and deaths is not available.
61.5
65.6
69.664.2
69.0
72.7
77.3
81.4
40
45
50
55
60
65
70
75
80
85
1989 1999 2009 2019 2029 2039 2049 2054
Life
exp
ecta
ncy
at b
irth
(in
year
s)
Year
Males-observed Females-observed Males-projected Females-projected

168
However, at present the Vanuatu population is not known for migrating permanently overseas at any significant measure, while Vanuatu itself is not an immigration country either. Furthermore, an analysis of the fertility and mortality level reveals that the last intercensal population growth
rate (taking under enumeration of the 2009 census into account as described above) closely resembles the current natural growth rate, which implies that there is very little international migration (see section 3.3.2). In view of the absence of significant past international migration, it is decided to assume zero net migration for the entire projection period as it is impossible to predict what the level of migration would be should it occur in future. Of course the projections needs to be amended should this situation change. Projection results The four different fertility assumptions results in four different projections (Table 54 and Fig.172). These different projections highlight the impact of different levels of fertility on the population size and structure of Vanuatu: The higher the fertility level assumed, the higher the population outcome.
Table 54: Population size according to 4 projection variants, Vanuatu: 2010–2050
The four population projection scenarios are described in detail below:
1) High population scenario. This projection outcome is determined by applying the high fertility assumption (constant fertility). This scenario results in a population size of 388 thousand in the year 2030, and 542 thousand in the year 2050.
2) Medium population scenario. This projection outcome is determined by applying the
medium fertility assumption (moderate fertility decline). This scenario results in a population size of 370 thousand in the year 2030, and 483 thousand in 2050.
3) Low population scenario. This projection outcome is determined by applying the low
fertility assumption (fast fertility decline). This scenario results in a population size of 353 thousand in the year 2030, and only 428 thousand in the year 2050.
2010 2015 2020 2025 2030 2035 2040 2045 2050
Constant 245,376 280,245 319,467 362,340 409,251 461,367 519,923 585,596 658,948
High 245,376 279,022 314,579 351,060 387,908 425,211 463,510 502,652 541,896
Medium 245,376 277,503 309,299 340,221 370,392 400,033 429,157 457,130 483,048
Low 245,376 275,995 304,025 329,363 352,879 375,025 395,452 413,275 427,621
YearFertility assumption

169
4) Constant population scenario. This projection outcome is determined by assuming that the current high level of fertility remains constant during the entire projection period. This scenario results in a population size of 409 thousand in the year 2030, and 659 thousand in the year 2050.
Figure 172: Past and future population trends according to 4 projection variants,
Vanuatu: 1967–2050
In general it becomes clear that the population will increase substantially regardless of which projection scenario is used. It can be seen that the impact of the different projections on the population size until the year 2020 are relatively minor. Significant population differences based on the different projection assumptions can only be expected thereafter. Figures 173 to 176 provide the comparative results of the various projections, and highlight the differential impact on population size, growth and structure. The population aged 6–13 — the mandatory school age population — can be expected to increase from its current size of 39 thousand until the year 2020 regardless of the projection scenario used (Fig.173) and will then be almost 60 thousand people; only according to the low population scenario is the school age population expected to decrease after 2020, but it will stay higher than in 2009. All other projection scenarios will result in a significant higher school age population than in 2009.
78
111
142
187
239
483
542
428
659
0
100
200
300
400
500
600
700
1967 1979 1989 1999 2009 2015 2020 2025 2030 2035 2040 2045 2050
Num
ber o
f peo
ple
Thou
sand
s
Year
Past Medium High Low Constant

170
According to the constant population scenario, assuming constant fertility at its present high level, the school age population would more than double until 2050. However, according to the medium scenario, the school age population aged 6–13 would increase to about 60,000 people in 2025 and stabilize at that level thereafter.
The general impact on the future population structure by broad age groups can be seen in Table 55 and Figures 174 to 176. Figure 173: Population aged 6–13 (mandatory school age) according to high, medium, low
and constant population projection scenarios, Vanuatu: 2009-2050
Regardless of the projection scenario used, the size of the working age population (aged 15–59) will be much larger than in 2009 (129 thousand), and will be 159 thousand in 2015, and will further increase to more than 200 thousand people in 2030. According to the medium variant scenario, the working age population will reach 300 thousand in the year 2050. Another general outcome is that the population aged 60 and older will be significantly larger than 14 thousand in 2009, regardless of the projection scenario used. The ‘elderly’ population will be 17 thousand in 2015, 32 thousand in 2030, and 68 thousand in 2050. Therefore the population will grow older regardless of which projection is used, as is expressed in the median age, which will increase from 20.7 years in 2009 to 25 in 2030 and 32 in 2050 according to the medium projection variant.
0
20
40
60
80
100
120
2009 2015 2020 2025 2030 2035 2040 2045 2050
Num
ber o
f peo
ple
aged
6-1
3 ye
ars
Thou
sand
s
Year
2009 census High Medium Low Constant

171
The proportion of the young population aged 0–14 (as part of the total population) will decrease regardless of the type of projection scenario used (Table 55). However, its size will increase at least until 2030, and only under the low projection scenario would the population aged 0-14 decrease thereafter. The size of the population younger than 15 years is likely to increase from about 91 thousand in 2009 to about 112 thousand in 2030 (according to the medium population scenarios), and would be 115 thousand in 2050. On the other hand the young population will be much higher than that if fertility levels remain high and there could be almost 150 thousand people aged 0-14 years in 2050.
The three different projection scenarios will produce very different population growth rates: the high population scenario will result in an annual population growth rate of 2.4%, while the medium population scenario will only produce 1.5% annual growth in 2030, and only 1% in 2050. Finally, the different projections result in very different age-dependency ratios: the lower the level of future fertility, the lower the age-dependency ratio.
Table 55: Population structure and indicators according to three different projection scenarios, Vanuatu: 2010, 2030 and 2050
2030 2050 2030 2050 2030 2050 2030 2050
Population by broad age groups (%) 0 - 14 years 38 36 35 33 28 30 24 27 20 15 - 59 years 57 56 55 59 60 61 62 64 64 60 years and older 6 8 10 8 13 9 14 9 16
Dependency ratio 76 78 83 70 67 63 61 57 55 Median age 20.7 22.5 23.6 24.1 28.8 25.4 31.9 26.9 35.5 Average annual growth rate (%) 2.6 2.4 2.4 1.9 1.5 1.6 1.0 1.3 0.6
Constant High Medium Low Indicator 2010

172
Figure 174: 2015 population projections by broad age groups according to four scenarios
Figure 175: 2030 population projections by broad age groups according to four scenarios
91 104 103 101 100
129
159 159 159 159
14
17 17 17 17
0
100
200
300
400
500
600
2009 census Constant High Medium Low
Popu
lati
on si
ze
Thou
sand
s
Projection variant
younger than 15 years 15 - 59 years 60 years and older
91
148 128 112 96
129
229228
227 225
14
3232
32 32
0
100
200
300
400
500
600
2009 census Constant High Medium Low
Popu
lati
on si
ze
Thou
sand
s
Projection variant
younger than 15 years 15 - 59 years 60 years and older

173
Figure 176: 2050 population projections by broad age groups according to four scenarios
The different impacts on the population size and structure are furthermore illustrated as population pyramids (Figs. 177 to 180). The shaded area represents the enumerated 2009 population size by sex and age group, and the outlined area represents the estimated (projected) population size in 2050, according to the high (Fig.178), medium (Fig.179), and low (Fig.180) population scenarios. In addition, Figure 177 illustrates the impact of constant high level fertility. It shows what the population would look like if the current level of 4 children per woman remains at this level for the entire projection period 2009–2050. As is shown in Figure 172, the population would then be 659 thousand people. The different shaped pyramids of the four different projection scenarios (constant, high, medium, and low) clearly illustrate that the difference in population size and structure in 2050 is the size of the population aged 0–34. It highlights the effect of the assumed fertility level on future population size and structure: the lower the assumption of the future fertility level, the smaller the size of the population younger than 35 years of age in the future.
91
230
149 115
85
129
361
325
300
275 14
68
68
68
68
0
100
200
300
400
500
600
700
2009 census Constant High Medium Low
Popu
lati
on si
ze
Thou
sand
s
Projection variant
younger than 15 years 15 - 59 years 60 years and older

174
Figure 177: Population pyramid, constant fertility projection, Vanuatu: 2010 and 2050
Figure 178: Population pyramid, high fertility projection, Vanuatu: 2010 and 2050
50,000 40,000 30,000 20,000 10,000 0 10,000 20,000 30,000 40,000 50,000
0- 4
5- 9
10-14
15-19
20-24
25-29
30-34
35-39
40-44
45-49
50-54
55-59
60-64
65-69
70-74
75-79
80+
Number of people
Age
gro
up
Males Females
2010 (shaded area) & 2050 (outlined)
50,000 40,000 30,000 20,000 10,000 0 10,000 20,000 30,000 40,000 50,000
0- 4
5- 9
10-14
15-19
20-24
25-29
30-34
35-39
40-44
45-49
50-54
55-59
60-64
65-69
70-74
75-79
80+
Number of people
Age
gro
up
Males Females
2010 (shaded area) & 2050 (outlined)

175
Figure 179: Population pyramid, medium fertility projection, Vanuatu: 2010 and 2050
Figure 180: Population pyramid, low fertility projection, Vanuatu: 2010 and 2050
50,000 40,000 30,000 20,000 10,000 0 10,000 20,000 30,000 40,000 50,000
0- 4
5- 9
10-14
15-19
20-24
25-29
30-34
35-39
40-44
45-49
50-54
55-59
60-64
65-69
70-74
75-79
80+
Number of people
Age
gro
up
Males Females
2010 (shaded area) & 2050 (outlined)
50,000 40,000 30,000 20,000 10,000 0 10,000 20,000 30,000 40,000 50,000
0- 4
5- 9
10-14
15-19
20-24
25-29
30-34
35-39
40-44
45-49
50-54
55-59
60-64
65-69
70-74
75-79
80+
Number of people
Age
gro
up
Males Females
2010 (shaded area) & 2050 (outlined)

176
Most likely outcome Predicting the likelihood of a certain future population size and structure is difficult for any country, and the further into the future the prediction, the more uncertain the outcome. Therefore, several projection variants need to be produced to allow users to choose from an outcome that seems most probable according to their own views and opinions. Most data users, however, prefer to use a recommended projection scenario that depicts a "most likely outcome". Such a variant is usually called the “medium” projection scenario using the medium assumptions used. Population changes close to those presented in the medium population scenario appears to be the most likely outcome because:
The current fertility level is expected to decline as it has in Vanuatu’s recent past, and is furthermore expected to do so based on historical worldwide observations of countries with a similar level of fertility (see also the “theory of demographic transition”, App.24). Therefore, the high fertility assumption, with its very slow fertility decline, seems to be a more unlikely outcome, and a constant high level of the current TFR of 4.1 is surely an unrealistic scenario.
Regarding the low fertility assumption, fertility levels (TFR) have already declined to well below 2 in many parts of the world, and it is therefore a realistic assumption to make. Nevertheless, such rapid fertility decline does not seem likely to occur in Vanuatu as it seems “uncharacteristic” for Pacific Islands populations at the moment.
6.2 Sub-national projections Population projections for each of Vanuatu’s six provinces were prepared according to the same principles as the national projection. The cohort-component method was applied, and the fertility and mortality indicators as estimated from the 2009 census were used as inputs for each province. However, there is one significant difference in the preparation of sub-national projections compared to the national projection, and that is the assumptions of (internal) migration. While no migration assumption was made for the national projections (net international migration is zero), a migration assumption for the provinces had to be included as the demographic pattern of each province is strongly influenced by internal migration.

177
Base population The census age distributions of each province as recorded in the census are used and prorated to be consistent with the adjusted base population for the national projections (App.25 and Tables 52 to 53).
Fertility The trend of fertility of each province throughout the projection period follows the same pattern as that established for the national projection (medium variant). However, the level of fertility is determined by the estimated level for 2009 (Fig.181). The higher the level in 2009, the higher the level throughout the projection period, because the target level of a TFR of 2 will be reached later in time. According to this fertility schedule, Shefa would reach a TFR of 2 already in 2029 (because it starts with a much lower level in 2009), and will stay at this level throughout the remainder of the projection period.
Figure 181: Fertility trend by province, Vanuatu: 2009-2054
Note: The line showing the fertility level and trend of Sanma and Malampa overlap as their TFR in 2009 was with 4.2 the same
0
1
2
3
4
5
6
2009 2014 2019 2024 2029 2034 2039 2044 2049 2054
TFR
Year
Vanuatu Torba Sanma Penama Shefa Tafea Malampa

178
Mortality The level of future mortality (life expectancy at birth) of each province is determined by using the UN working models of mortality improvement as described earlier (App.23), applied to the estimated life expectancy at birth of each province as described in section 3.2.2.
Migration In order to estimate the migration component of each province, the balancing equation was used.
Balancing equation: Population growth = Births minus Deaths plus Migration Net migration can be estimated as Migration = Population growth minus Births plus Deaths
Since the population growth rate and the level of fertility and mortality are known from the census, the migration component can be calculated. The following levels of fertility, mortality and migration were used as a starting point for each province (Table 56). Please note that for Sanma zero net migration is assumed, as its current growth rate is about the same as the estimated natural growth rate, and its demographic dynamic is very similar to the national average of Vanuatu.
With respect to migration, two variants of migration have been prepared.
1. Constant migration: The estimated level in 2009 has been kept constant throughout the projection period
2. Zero net migration: Zero net migration is assumed for the entire projection period (only natural growth influences population growth).
The zero migration variant has been prepared in order to illustrate the impact of migration on the population size of the different provinces. With regard to the age and sex structure of migrants, it is assumed that there will be equal numbers of males and females, and the age structure resembles that of a family type migration pattern (App.26).

179
Table 56 summarizes the different population components used for the provincial projections.
Table 56: Demographic components for provincial projections
*not adjusted for under enumeration
Projection results Figures 182 to 189 and Table 57 illustrate the impact of migration on the size of the different provinces.
Table 57: Population size by province according to different migration variants, Vanuatu: 2009-2050
*The provincial projections are prepared to match the national medium fertility projection
Deomographic component Torba Sanma Penama Malampa Shefa Tafea Vanuatu
Annual growth rate (%)* 1.9 2.4 1.5 1.2 3.7 1.1 2.3
TFR 4.5 4.2 4.7 4.2 3.4 5.2 4.1
E(0) - 2009 Males 67.2 69.8 66.2 69.2 70.4 69.1 69.6 Females 71.2 72.4 71.7 72.6 73.4 72.1 72.7
E(0) - 2054 Males 76.3 77.5 75.6 77.0 77.6 76.9 77.3 Females 80.8 81.4 81.2 81.3 81.7 81.4 81.4
Net migration (annual) -60 0 -260 -400 1,370 -650 0
Migration variant/ Year
Vanuatu* Torba Sanma Penama Malampa Shefa Tafea
2009 239,000 9,545 46,839 31,395 37,395 80,754 33,073
Constant migration2010 245,376 9,752 48,163 31,912 37,881 84,207 33,461 2015 277,503 10,792 54,975 34,521 40,120 102,143 34,952 2020 309,299 11,843 61,865 37,236 42,114 120,235 36,004 2025 340,221 12,910 68,657 40,100 43,926 137,607 37,021 2030 370,392 14,006 75,331 43,152 45,654 153,934 38,315 2035 400,033 15,103 81,816 46,246 47,199 169,836 39,833 2040 429,157 16,163 88,094 49,237 48,427 185,973 41,262 2045 457,130 17,168 94,086 52,084 49,267 202,196 42,329 2050 483,048 18,098 99,639 54,779 49,687 217,831 43,014
Zero migration2010 245,376 9,813 48,160 32,179 38,291 82,801 34,132 2015 277,503 11,194 54,886 36,302 42,831 92,723 39,566 2020 309,299 12,624 61,570 40,763 47,439 101,527 45,375 2025 340,221 14,088 68,055 45,497 52,032 108,871 51,679 2030 370,392 15,586 74,336 50,465 56,610 114,849 58,545 2035 400,033 17,089 80,366 55,504 61,041 120,189 65,845 2040 429,157 18,558 86,116 60,490 65,197 125,414 73,382 2045 457,130 19,972 91,469 65,403 69,015 130,215 81,056 2050 483,048 21,308 96,256 70,219 72,435 133,964 88,866

180
In general, all provinces will increase in size until 2050 regardless of which type of migration assumption was applied, although the rate of increase varies considerably depending on the type of migration assumption used. The size of Shefa will increase substantially to 218 thousand people until the year 2050 if the current high level of rural-urban migration continues. In comparison the other provinces remain relatively small in size, although each province will continue to increase. About 45% of the Vanuatu population would live in Shefa in 2050 compared to one third in 2009. The estimated demographic components of births, deaths, and migration, and population size and growth by province for the years 2011, 2015, and 2020 are shown in Table 58. If suddenly there would be no further internal migration, and each province would be closed to migration, Shefa’s population would only be 134 thousand people in 2050, and the other provinces would increase sharply in size. Only 28% of Vanuatu’s population would live in Shefa.
Most likely outcome Clearly Vanuatu’s provinces are not and will not be closed to migration, and internal migration (rural-urban) will continue. In view of the currently relative small urban proportion of Vanuatu, it can be expected to grow substantially in future, as has been the case in most other countries in the world. Therefore the projection results using the constant migration assumption is the more realistic outcome.

181
Table 58: Projected demographic components of births, deaths and migration, and population size and growth by province, Vanuatu: 2011, 2015, and 2020
Torba Sanma Penama Malampa Shefa Tafea Vanuatu
Births 328 1,570 1,008 1,113 2,526 1,172 7,719
Deaths 61 229 234 246 370 172 1,311
Migrants -60 0 -260 -400 1,370 -650 0
Growth 207 1,341 515 467 3,527 351 6,407
Population 9,959 49,503 32,430 38,354 87,721 33,816 251,784 Growth rate 2.1 2.7 1.6 1.2 4.0 1.0 2.5
Indicator2011
Torba Sanma Penama Malampa Shefa Tafea Vanuatu
Births 327 1,622 1,006 1,053 2,705 1,055 7,768
Deaths 60 243 225 240 415 170 1,353
Migrants -60 0 -260 -400 1,370 -650 0
Growth 208 1,378 521 414 3,660 235 6,416
Population 10,792 54,975 34,521 40,120 102,143 34,952 277,503 Growth rate 1.9 2.5 1.5 1.0 3.6 0.7 2.3
Indicator2015
Torba Sanma Penama Malampa Shefa Tafea Vanuatu
Births 330 1,636 1,028 1,006 2,711 1,002 7,713
Deaths 60 264 221 238 479 170 1,432
Migrants -60 0 -260 -400 1,370 -650 0
Growth 210 1,372 547 368 3,602 182 6,281
Population 11,843 61,865 37,236 42,114 120,235 36,004 309,299 Growth rate 1.8 2.2 1.5 0.9 3.0 0.5 2.0
Indicator2020

182
Figure 182: Population size by province according to the constant migration variant, Vanuatu: 2010-2050
Figure 183: Population size by province according to the zero migration variant, Vanuatu: 2010-2050
0
50
100
150
200
250
2010 2015 2020 2025 2030 2035 2040 2045 2050
Num
ber o
f peo
ple
Thou
sand
s
Year
Torba Sanma Penama Malampa Shefa Tafea
0
50
100
150
200
250
2010 2015 2020 2025 2030 2035 2040 2045 2050
Num
ber o
f peo
ple
Thou
sand
s
Year
Torba Sanma Penama Malampa Shefa Tafea

183
Figure 184: Population size according to two different migration variants, Torba: 2010-2050
Figure 185: Population size, Sanma: 2010-2050
Note: for Sanma only one projection variant has been prepared with zero net migration
10 11
12 13
14 15
16 17
18
10
11
13
14
16
17
19
20 21
0
5
10
15
20
25
2010 2015 2020 2025 2030 2035 2040 2045 2050
Num
ber o
f peo
ple
Thou
sand
s
Year
Constant migration Zero migration
48
55
62
69
75 82
88 93
99
0
20
40
60
80
100
120
2010 2015 2020 2025 2030 2035 2040 2045 2050
Num
ber o
f peo
ple
Thou
sand
s
Year
Declining migration

184
Figure 186: Population size according to two different migration variants, Penama: 2010-2050
Figure 187: Population size according to two different migration variants, Malampa: 2010-2050
32 35
37 40
43 46
49 52
55
32 36
41
45
50
56
60
65
70
0
10
20
30
40
50
60
70
80
2010 2015 2020 2025 2030 2035 2040 2045 2050
Num
ber o
f peo
ple
Thou
sand
s
Year
Constant migration Zero migration
38 40
42 44 46 47 48 49 50
38
43
47
52
57
61 65
69 72
0
10
20
30
40
50
60
70
80
2010 2015 2020 2025 2030 2035 2040 2045 2050
Num
ber o
f peo
ple
Thou
sand
s
Year
Constant migration Zero migration

185
Figure 188: Population size according to two different migration variants, Shefa: 2010-2050
Figure 189: Population size according to two different migration variants, Tafea: 2010-2050
84
102
120
138
154
170
186
202
218
83 93
102 109
115 120 125 130 134
0
50
100
150
200
250
2010 2015 2020 2025 2030 2035 2040 2045 2050
Num
ber o
f peo
ple
Thou
sand
s
Year
Constant migration Zero migration
33 35 36 37 38 40 41 42 43 34
40
45
52
59
66
73
81
89
0
10
20
30
40
50
60
70
80
90
100
2010 2015 2020 2025 2030 2035 2040 2045 2050
Num
ber o
f peo
ple
Thou
sand
s
Year
Constant migration Zero migration

186
7. IMPLICATIONS OF DEMOGRAPHIC TRENDS
7.1 Population dynamics
7.1.1 Growth rate Vanuatu’s annual population growth rate of 2.3% is still one of the highest in the Pacific region. Nevertheless the population density (19 people per sq. km) is one of the lowest in the region. At a fixed growth rate, the population of Vanuatu would double in 31 years. In addition, Tafea (at 1.1%) and Malampa (at 1.2%) will have their populations doubling in 60 years. Shefa (at 3.7%) would have the lowest doubling time of just 19 years caused by its growing urban area of Port Vila.
7.1.2 Fertility Annual population growth is the result of a relatively high natural growth rate which is caused by high fertility (birth) rates. The average number of children per woman (TFR) has only dropped from about 4.6 to 4.1 children per woman during the 10-year period 1999–2009, and is still one of the highest in the Pacific region. Should the government wish to influence fertility levels, policies and programmes directed toward the expansion of family-planning services and reproductive health programmes should be considered. In the rural areas, access to services is of importance. Life education, as part of the curriculum, is one means of ensuring that young people are provided with the information and support they may need. Access to education should extend beyond school age and be part of a life long process. The availability and accessibility of family planning services for women (and their partners) of all ages will empower them to make conscious decisions about the number and spacing of their births. Furthermore, pregnancies of young women are often unwanted and the result of unprotected sex. This is a major health concern, especially considering the risk of HIV/AIDS and sexually transmitted diseases. The promotion of arranged marriages at an early age, through custom and culture, can affect fertility. Teen pregnancy is a social issue; children of teenage mothers often have lower educational levels, higher rates of poverty, and other poorer “life outcomes”. In general, teenage pregnancy usually occurs outside of marriage and, for this reason it often carries a social stigma. Social protection for solo parents and young mothers can include the provision of child support and maintenance. Many stakeholders are involved in teenage reproductive health strategies, working at various levels to reduce teenage pregnancy by increasing the knowledge and practice of family planning, promoting peer education, providing sex education advisory services including contraceptives,

187
involving young people in service design, educating the parents of teenagers on effective communication, providing better support for teenage mothers (such as help returning to education, advice and support), working with young fathers, giving better childcare, and increasing the availability of supported housing.
7.1.3 Mortality
Improved mortality rates mean that healthier people live longer lives. Based on census data for the number of children ever born and still alive, the infant mortality rate (IMR) was estimated at 21; 22 for males and 19 for females. This estimate is lower than the 1999 levels when the IMR was 27 and 26 for males and females – and is thus an improvement in infant mortality rates. Estimates of mortality level presented in this report suggest that females live longer than males, and live on average about three years longer than males. Life expectancy at birth is estimated at 69.6 and 72.7 for males and females, respectively. This represents an increase compared to 1999 when it was 65.6 and 69.0 years for males and females. The figures in Vanuatu compare with levels of 78.8 and 82.7 years for males and females in New Zealand. Life expectancy at birth in France is 78.1 and 84.8 years for males and females, and in Australia it is 79.3 and 83.9 years. Therefore an average person in New Zealand, France or Australia lives about 10 years longer than a Ni-Vanuatu. On the other hand, life expectancies at birth for Fiji are estimated at 63.8 and 67.7 years for males and females in 2001, which is considerably shorter than in Vanuatu.
7.1.4 Internal migration Shefa province had the highest growth rate of all provinces – a clear sign of internal migration flows towards Shefa and the capital Port Vila. Some rural areas and islands show a very low population increase despite high natural growth or sometimes even negative population growth rates (i.e. a population decline) during the intercensal period. These developments point to a possible dissatisfaction with living conditions in these areas. Reasons may include the lack of education opportunities (for tertiary or vocational/technical qualifications), and limited employment opportunities. The urban centers attract people by offering higher living standards through the availability and accessibility to services such as medical and educational institutions, entertainment facilities, and a wider range of employment opportunities. If the government wishes to change this trend, at least some of the disadvantages of living in the remote rural areas and outer islands need to be eased by improving the above-mentioned services and opportunities through:

188
Promotion of policies for employment and livelihood in rural areas; Decentralization of services to all provinces; Support of income generating opportunities in other provinces to retain populations,
in particular the youth; Provision of better education in the rural areas; Promotion of better market distribution systems; Provision of better and cheaper transport; Conducting of in depth research into youth migration and their reasons for migrating; Provision of basic services for the growing population in the urban/peri-urban areas.
7.1.5 International migration
Data on arrivals and departures remain incomplete for detailed migration analysis. The net migration level can only be crudely estimated by comparing intercensal population growth with estimated rates of natural increase for the same time period. While this method provides a reasonably robust indication of net migration, planners and policy-makers require more detailed and timelier information on the demographic makeup of opposing migration streams in order to make and implement realistic policy decisions. Hence, further improvements are needed to collect and process information on age, sex and nationality of all arriving and departing passengers in Vanuatu. If improvements prove to be impossible, an alternative would be to apply the proper demographic methodologies, by comparing the two nearest censuses, to calculate the desired population data. The disadvantage of this option is that this can only be done after the analysis of the latest census is completed. This exercise could prove more time consuming and costly than an efficient registration system that would provide regular and timely migration information. As the national average annual population growth rates are similar to the estimated natural growth, it can be concluded that net migration rates are negligible, and no significant international migration had occurred during the intercensal period 1999-2009.
7.1.6 Population projections
Knowledge about the current size and structure of a country’s population is needed for the formulation and implementation of policies and programmes in almost all areas of public life. Because policies are aimed at achieving goals in the future, knowledge about future population trends is required. The population projection scenarios presented in this report point to a continuously growing population for Vanuatu during the next 40 years. The medium-variant scenario of the projections points to a population of about 278 thousand in 2015, 370 thousand in 2030, and 483 thousand people in 2050.. Changes in Vanuatu's population age structure, as a result of possible declining fertility rates, will have an impact on the proportion of the young population aged 0–14. Changes will be reflected in

189
a smaller proportion of those under the age of 15, and a larger working age population aged 15–59. As a result, the dependency ratio of Vanuatu’s population will decrease, and the population’s median age will increase. The proportion of the population aged 60 and older will increase from 6% in 20069 to 8–9% of the total population in 2030. The working age population is expected to increase considerably, both in proportion and in absolute numbers. According to the medium population scenario, the working age population will be about 227 thousand people in 2030, compared to 129 thousand in 2009. The needs of this larger population size and its different population subgroups should be considered in development plans in areas as diverse as health, education, environment, and economic growth.
7.2 Crosscutting issues
Vanuatu will most likely experience a continued population growth during the next few years. Appropriate health, education, and social welfare programmes must be in place to fulfill the needs and aspirations of Vanuatu’s communities.
7.2.1 Vital statistics
A well functioning registration system, able to supply accurate and timely statistics on population developments, is of fundamental importance to planners and policy-makers. To make reliable estimates regarding fertility and mortality indicator levels and trends, a complete registration system needs to be in place; one that records the number of deaths by age and sex, and cause of death, and the number of births by sex and by age of mother, and place of mother’s usual place of residence. Improved coordination between all agencies involved is required. By tracking all immigrants and exiting people, policy-makers will have an accurate and current picture of Vanuatu’s total population size and structure. Such information will be indispensable for policy planning purposes and policy formulation.
7.2.2 The environment
Careful use of terrestrial and marine resources forms the basis of a sustainable and healthy life for Vanuatu's people. As such, maintaining a healthy and sustainable living environment should be a top priority for the government and people of Vanuatu. Apart from enabling a good quality of life for local people, conservation of the environment can foster a vibrant tourism industry. The size and density of the population has a direct impact on water and energy consumption, sewage and waste production, general infrastructure such as roads, the use of land, and the development of agriculture and marine resources.

190
High population densities put considerable stress on the environment. Consequently, there is a higher demand on environmental health services, such as public garbage collection, and most importantly, a well-functioning sewage system. In addition, water sources need to be protected.
7.2.3 Households
Population growth not only contributes to an increased demand in water and energy supply, waste disposal, sewage connections and general infrastructure, but also to an increase in the number of households due to changes in average household size. Even if the population size remained stable, the number of households would still increase when households and/or family structures break up into smaller units, often described as the transition from extended family type households to nuclear family type living arrangements. Households and families that are economically incapable of sustaining an acceptable and healthy lifestyle might need extra assistance from the government, since unhealthy living environments affect everyone in the long term. In particular, access to clean water, public electricity, an adequate public sewage system and waste disposal facilities should all be the minimum housing standard for Vanuatu’s population. Specific areas of assistance include:
Dwellings: 25% of dwellings in rural areas are more than 10 yrs old and are prone to natural disaster. As such, government needs to improve housing in rural areas using local materials which are affordable and cyclone proof.
Water supply: 33% of total households in Tafea use the river, lake, or spring as
sources of water. The development of more community programmes focusing on water supply, and providing water tanks, or water pumps is required.
Lighting: 48% of households in Vanuatu use kerosene lamps as the main source
of light and mainly in the rural areas. With continued rising prices, kerosene is no longer an affordable source for the home, community, school, or business. Alternatives are needed and ‘green power’ sources such as solar (currently used by 4% of households), wind, or renewable energy should be researched. In this respect, government could encourage students to enter into engineering or environmental studies.
Toilet facilities: 88% of the total households in Penama use the pit-latrine which is not a hygienic toilet facility. Health awareness programmes and assistance in the introduction and improvement of toilet facilities are needed.
7.2.4 Health services and well-being The health status of each individual and his/her family members is probably one of the most important concerns people have. Therefore, the availability, use and affordability of quality health

191
care and medical services are major issues of concern. Government and health officials need to address the challenges of health services and the health care system. In Vanuatu’s remote areas and outer islands, small population size and isolation inhibit the operation of state-of-the-art health services that require the employment of specialist personnel and the purchase and maintenance of specialised equipment. However resident medical staff needs to be sufficiently qualified to provide basic health care. An efficient referral service to the nearest health facility, together with regular visits by medical specialists, is needed to ensure that peoples’ health demands are met. The population projections have shown that the population aged 60 and older will increase in future. This requires strengthening of special services for the growing number of elderly people, including a pension scheme with retirement benefits, and specialised health care for the elderly. In working towards a healthier population, the following efforts should be made:
Improve infant, child and maternal health by improving primary health care programmes; Improve emergency obstetric care to decrease neo natal mortality Expand immunization programmes; Prevent HIV and AIDS, and other STIs by:
- Increasing awareness and knowledge of safer sexual behaviours and practices by
using appropriate language; - Targeting priority groups (youth, women and men, particularly aged 10–24); - Enhancing education programmes to encourage open discussions (between
partners and their children) on issues of sexual behaviours; - Promoting and disseminating information outlining the advantages and proper
use of condoms by men and women, with an emphasis on targeting male organisations;
- Reviewing, developing, implementing and evaluating the effectiveness of appropriate policies;
- Delaying young peoples' initial sexual activity; - Developing a well-planned media campaign throughout the year based on health
promotion with regards to HIV and AIDS; - Ensuring protection of the rights of people living with HIV and AIDS; - Ensuring that people living with HIV and AIDS have free and unrestricted access
to medical treatment, facilities and support services; - Ensuring that a reliable HIV and AIDS testing system is in place; - Establishing a voluntary, confidential system of HIV and AIDS testing with
informed consent that includes pre and post test counseling;
Address the increasing occurrence of Non Communicable Diseases (NCDs); Combat the prevalence of diabetes and heart disease; Promote healthy eating habits and food nutrition programmes; Advocate a general healthy life style including regular physical exercise; and Discourage smoking and excessive alcohol consumption; Provide a hygienic and safe living environment; Improve the quality of drinking water;

192
Distribute bednets as a way of combating malaria.
7.2.5 Disabilities Vanuatu is a signatory to a United Nations convention to uphold the rights of people with disabilities; and is therefore obliged to: “Promote, protect and ensure the full and equal enjoyment of all human rights and fundamental freedoms by all persons with disabilities and to promote respect for their inherent dignity.”
7.2.6 Education
Educational level is a key indicator of development and quality of life in a country. Education plays an important role in development through its links with demographic, as well as economic and social factors. In general, there is a close and complex relationship between education, fertility, morbidity, mortality and mobility: when couples are better educated, they tend to have fewer children, their children’s health status improves, and their survival rates tend to increase. Higher levels of educational attainment also contribute to a better qualified workforce, higher wages, and better economic performance than for people who have little or no formal education and training. The Ministry of Education has made considerable progress towards achieving universal primary education. As a result of broad consultation processes and the SWA (Sector wide approach) used in developing the Vanuatu Education Sector Strategy 2007-2016, the Ministry of Education realigned its priorities towards universal primary education and literacy. Constraints for universal primary education identified during this process were the costs of maintaining the dual education system with separate streams for ‘English’ and ‘French’ as the language of instruction and the need to achieve an integrated system of bilingual schools. A concerted effort with development partners to provide ‘fee free’ primary level education up to Year 6 in Government and Government-assisted schools began in some areas in 2009 and achieved full coverage in 2010. Compulsory primary school contributions have been phased out and replaced by grants paid directly to the schools. This was in direct response to declining primary enrolment rates which were around 95% in 2005 but decreased to 80% in 2008; and subsequent research highlighted rising parental contributions (school fees) as one of the main reasons why enrolment rates were falling. Other options for government include; considering
increasing school budgets (for materials and teachers) to reduce year eight drop-outs. In addition, the building of vocational centres featuring youth development programmes could provide life skills (including family planning). The programmes may reduce teenage delinquency, and teenage pregnancy, while providing youth the skills they need to be part of the work force and community.

193
School attendance, educational attainment, and literacy rates are much lower in the rural than in the urban areas. The provinces of Tafea and Torba require specific attention.
7.2.7 Economic activity and labour market
Economic activity and employment are shaped by the size of the working age population, the educational skill level of the labour force, and the economic resources available to a country. Although a high proportion (71%) of Vanuatu’s population aged 15 and older was economically active (in the labour force), only a relatively small proportion (30%) was engaged in paid employment. These relatively few people (42 thousand) supported the rest of the population with respect to paid income, meaning that one paid person supports, on average, about 4.5 other people. Vanuatu enjoys the benefits of migrant labour with Government agreements with New Zealand and Australia. The most popular country was New Zealand and its Recognized Seasonal Employer (RSE) programme began in 2007 with a pilot and larger numbers followed thereafter. The Australian pilot was in 2009. The workers are mostly unskilled and are mainly involved in agricultural work. During the year before the census, almost 8 thousand N-Vanuatu workers and their families benefitted from these agreements, and will hopefully continue to benefit in future. According to projection results presented in this report, the working age population will increase significantly during the next years. Government and business officials are encouraged to collaborate in developing innovative strategies that will promote economic diversification and growth.

194
7.2.8 Communication and internet use The access and use of telecommunications has increased a lot since liberalization in the mid 2008. Existing research in telecommunications suggests that access can increase economic growth, attract foreign investment, improve market efficiencies, increase accessibility to health and education and empower women and others. The telecommunication sector is presumed to provide new opportunities and frontiers across businesses, social, economic and political arena. An improvement in the infrastructure and facilities of telecommunications will have a direct effect on the well being of individuals in the country. i) Examples where assistance is needed include:
Mobile phone access: 90% of Torba household do not have mobile phone; this may be due to a coverage issue. Government should negotiate with telecommunication companies to discuss improvements in phone coverage to Torba and Tafea.
Radio availability: 82% and 80% of households in Tafea and Torba do not have radio; this may be mainly due to limited radio coverage. One way to improve coverage to remote areas is through the establishment of provincial radio stations devoted mainly to culture, sport, education, and health awareness programmes.
Better coverage for radio and phone services in the rural areas is vital in improving communication in the areas of health (family planning), and education.
ii) Examples where assistance can be provided include:
The use of the internet to provide online medical advice; Registration of births using mobile phones; Dissemination of computers to school children as part of an education programme, as per
the SPC one laptop per child programme.
7.2.9 Good governance Good governance and effective policy-making should provide the framework for sustainable development within which the interrelationship of population, environment, and all possible socioeconomic aspects of a country can prosper cohesively. In this regard it is important that policy-makers, planners, politicians and community leaders are aware of the needs and aspirations of their country's people in order to effectively provide for the specific needs of the population, and the different population sub-groups. Then government needs to know about its country’s population structure, population processes and socioeconomic characteristics in order to plan for an adequate standard of living, and for a proper provision and distribution of goods and services.

195
GLOSSARY
Indicator Definition
Age–dependency ratio Number of people in the “dependent” age category
(population younger than 15 years plus population 60 years and older) per 100 in the “economically productive ages” 15–59 years
Average age at (first) marriage (SMAM)
Approximation of average age at marriage, based on proportion of population never married (single)
Balance equation Population growth = births – deaths + net migration
Births — estimated number for 2009
Estimated age-specific fertility rates (ASFR) multiplied by enumerated number of women by age in 2009
Child-woman ratio (CWR) Number of children under age 5 per 1,000 women aged 15-49
Child mortality rate (1q5) The probability of dying between age 1 and age 5
Crude birth rate (CBR) Estimated number of births per 1,000 population (7,335/234,023 X 1,000)
Crude death rate (CDR) Estimated number of deaths per 1,000 population (1,260/234,023 X 1,000)
Crude net migration rate Rate of growth minus rate of natural increase
Deaths — estimated number for 2009
Estimated age-specific death rates [m(x)] by sex (from life multiplied by enumerated population by age and sex in 2009
Employment–population ratio Proportion of employed people in cash work (by a given age and sex), as part of the corresponding total number of people of the same age and sex
General fertility rate Annual number of births per 1,000 women of childbearing age (15-49)
Gini coefficient The Gini coefficient is a measure of the inequality of a distribution, a value of 0 expressing total equality and a value of 1 maximal inequality.
Infant mortality rate (IMR) Number of infant deaths (children younger than 1 year) per 1,000 births

196
Institutions Boarding schools, prisons, hospitals, hotels/hostels/guesthouses, and mobile households (passenger boats)
Intercensal period Time period between two censuses
Labour force
People employed (cash work plus village work) and unemployed (excludes those not seeking employment)
Labour force participation rate Proportion of people in the labour force (by a given age and sex), as part of the corresponding total number of people of the same age and sex
Language ability see Literacy rate
Life expectancy at birth Number of years a newborn baby can expect to live on average
Life expectancy at age 20 Number of additional years a 20 year old can expect to live on average
Literacy rate Proportion of the population age 15 years and older or 15-24 years, who are able to read and write a simple sentence in any language
Mean age at childbearing Average age of women when giving birth
Median age The age at which exactly half the population is older and half is younger
Parity (average) Average number of children per woman
Rate of growth (%) Average annual growth rate during 1999–2009 ln(TotPop2009/TotPop1999)/10 X 100
Rate of natural increase Crude birth rate (CBR) minus crude death rate (CDR)
Sex ratio Number of males per 100 females
Teenage fertility rate Number of births by women aged 15–19 per 1,000
Total fertility rate (TFR) Average number of children per woman
Under 5 mortality (q5) The probability of dying between birth and age 5
Urban population Total population of the towns Luganville in province Sanma and Port Vila in province Shefa

197
APPENDICES

198
Appendix 1: Accuracy of age reporting - indices of age heaping The 2009 Vanuatu census population shows the following distinct age patterns (Fig.A1):
1. Age heaping at ages ending with ‘0, ‘7’ and ‘9’, and avoidance of ages ending in ‘8’;
2. Relatively high number of people aged 75 years and older, and of these more males than females.
Figure A1: Population pyramid, Vanuatu: 2009
Regarding the above:
1. The occurrence of age heaping is expressed by the calculated Whipple, Myers, Bachi, and the United Nations age-sex accuracy indexes (Table A1).
Table A1: Age accuracy indices, Vanuatu: 1999 and 2009
With respect to the interpretation of these indices:
4,000 3,500 3,000 2,500 2,000 1,500 1,000 500 0 500 1,000 1,500 2,000 2,500 3,000 3,500 4,000
0
5
10
15
20
25
30
35
40
45
50
55
60
65
70
75
80
85
90+
Number of people
Age
Males Females
Males Females Males Females Males Females1999 10.1 8.2 6.5 5.6 117 117 24.32009 7.8 7.2 5.5 5.2 112 110 26.4
UN Secretariat
Myers' WhipplesBachiCensus year

199
A. Myers – the higher the index, the greater the concentration on the age examined. Positive values show a preference for the digit, and negative values avoidance of the digit (Figs.2a/b). The index calculated for males is 7.8 and for females 7.2. As a comparison, the index for the 1999 Vanuatu census population was 10.1 and 8.2 for males and females respectively. The theoretical range of Myer’s index is 0, representing no heaping, to 90, which would result if all ages were reported at a single digit. Figure 2b shows high indexes for ages ending with a ‘0’ and ‘9’, and to a lesser degree ‘7’ and ‘5’; these indexes are over represented. Indexes with a negative value such as ‘8’, and ‘1’, ‘2’, and ‘3’ were avoided and are underrepresented.
B. Bachi – the higher the index, the greater the concentration on the age examined. Positive values show a preference for the digit, and negative values avoidance of the digit. The index calculated for Males is 5.5; Females 5.2, which compares to 6.5 and 5.6 for males and females for the 1999 census (Figs.3a/b). The Bachi index as indicator of the general extend of heaping differs little from Myers’. The theoretical range of Bach’s index is also 0, representing no heaping, to 90, which would result if all ages were reported at a single digit, say zero. Figure 3b shows high indexes for ages ending with a ‘7’, ‘0’ and ‘9’, and to a lesser degree ‘5’; these indexes are over represented. Indexes with a negative value such as ‘8’, and ‘1’, ‘2’, and ‘3’ were avoided and are underrepresented.
C. Whipple: Males and Females was 112 and 110 respectively. This measure means that the Vanuatu population overstated ages ending in 0 or 5 by 12% and 10% for males and females. As a comparison, the index for 1999 Vanuatu census population was 117 for both males and females.
The decrease of the different indices is an indication that age reporting in the 2009 census has improved compared to the 1999 census. In general it is not possible to measure digit preference precisely, because an accurate distinction between the error due to digit preference, other errors, and real fluctuations cannot be made. Therefore none of the above indexes provides a critical value of age heaping/misreporting because of each country-specific effect of past trends of births, deaths and migration on a population’s age distribution. The genuine fluctuations become the more pronounced the smaller the population (sample) size. Nonetheless, the fluctuations observed suggest some faulty reporting.

200
Finally, the United Nations age-sex accuracy index for the Vanuatu 1999 and 2009 census populations is calculated. It shows a (corrected) index of 24.3 and 26.4 for the 1999 and 2009 censuses respectively. Census age-sex data are described by the United Nations as “accurate”, “inaccurate”, or “highly inaccurate” depending on whether the UN index is under 20, 20-40, or over 40. However, this procedure as a measurement of age-sex accuracy is labeled as questionable13 due to its problematic underlying assumptions made.
Figure 2a: Myers Preference by digit, Vanuatu: 1999
Figure 3a: Bachi Preference by digit, Vanuatu: 1999
Figure 2b: Myers Preference by digit, Vanuatu: 2009
Figure 3b: Bachi Preference by digit, Vanuatu: 2009
Source: US Census Bureau, Population Analysis Spreadsheets (PAS), procedure SINGAGE
13 Methods and Materials of Demography, Second Edition, Jacob S. Siegel/David A. Swanson, p.150
-2.0
-1.5
-1.0
-0.5
0.0
0.5
1.0
1.5
2.0
2.5
0 1 2 3 4 5 6 7 8 9
Ind
ex
Age
Male Female
-2.5
-2.0
-1.5
-1.0
-0.5
0.0
0.5
1.0
1.5
2.0
2.5
3.0
0 1 2 3 4 5 6 7 8 9
Ind
ex
Age
Male Female
-2.0
-1.5
-1.0
-0.5
0.0
0.5
1.0
1.5
2.0
2.5
0 1 2 3 4 5 6 7 8 9
Ind
ex
Age
Male Female
-2.5
-2.0
-1.5
-1.0
-0.5
0.0
0.5
1.0
1.5
2.0
2.5
3.0
0 1 2 3 4 5 6 7 8 9
Ind
ex
Age
Male Female

201
2. With respect to the second observation made, the occurrence of higher number of males than females at older ages has to be regarded as suspect, because life expectancy of females is estimated to be higher than males (more females survive to older ages than males). Furthermore, census data show that the proportion of widowed females at older ages is significantly higher than males. The number of widows increases (much) faster than widowers at older ages. This is explained by the higher death rates among men. Thus there are more widows than widowers among the old. Furthermore the question on whether a respondent’s father and/or mother were still alive revealed that the proportion of surviving mothers was significantly higher than that of fathers.
These findings contradict the access count of older males versus females, and points to:
a. Under-enumeration of (older) females, and/or b. (Sex-selective) age misreporting - old people (particularly males) reported
to be even older than they really were.

202
Appendix 2: Arraiga's approach for estimation of ASFR for one point (1999) in time and the age pattern of fertility (Brass)
Appendix 3: Arraiga's approach for estimation of ASFR for one point (2009) in time and the age pattern of fertility (Brass)
Month NovemberYear 1999
Fertil ity pattern is tabulated by age of woman at enumeration
20 - 25 25 - 30 20 - 30Nov-99
Recorded Calculated 15 - 20 0.129 0.042 0.091 0.042 0.054 0.091 0.054 1.700 0.065 0.063 0.064 20 - 25 0.997 0.194 0.218 0.194 0.204 0.309 0.257 1.201 0.244 0.238 0.241 25 - 30 2.100 0.204 0.228 0.204 0.201 0.537 0.459 1.171 0.242 0.236 0.239 30 - 35 3.256 0.158 0.208 0.158 0.153 0.745 0.611 1.219 0.184 0.179 0.181 35 - 40 4.058 0.109 0.116 0.109 0.104 0.862 0.716 1.204 0.125 0.122 0.124 40 - 45 4.573 0.054 0.070 0.054 0.050 0.932 0.765 1.218 0.060 0.058 0.059 45 - 50 4.782 0.036 0.026 0.036 0.032 0.958 0.797 1.202 0.038 0.037 0.037
Mean Age of Childbearing: 27.54 27.76Total Fertil ity Rate: 4.79 3.99 4.78 4.67 4.73
Fertil ity Pattern by
Age at Birth
Age Group of Women
Cumulation of Age Specific Fertil ity Rates Based on Adjustment Factor for the Age
GroupAdjustment
FactorsChildren
Ever Born
Age Specific Fertil ity Pattern
Fertil ity Consistent with C.E.B. (A.S.F.R.)
Fertil ity Pattern by
Age at Survey Date
Ferti l ity Pattern by
Age at Birth of Child
A.S.F.R.
Month NovemberYear 2009
Fertil ity pattern is tabulated by age of woman at enumeration
20 - 25 25 - 30 20 - 30Nov-09
Recorded Calculated 15 - 20 0.096 0.044 0.076 0.044 0.055 0.076 0.055 1.386 0.063 0.062 0.063 20 - 25 0.887 0.180 0.203 0.180 0.188 0.279 0.244 1.146 0.216 0.212 0.214 25 - 30 1.898 0.190 0.205 0.190 0.187 0.484 0.431 1.123 0.214 0.210 0.212 30 - 35 2.927 0.146 0.185 0.146 0.141 0.669 0.572 1.170 0.162 0.158 0.160 35 - 40 3.635 0.098 0.102 0.098 0.093 0.771 0.664 1.161 0.106 0.104 0.105 40 - 45 4.109 0.045 0.063 0.045 0.041 0.834 0.705 1.183 0.047 0.046 0.047 45 - 50 4.418 0.015 0.023 0.015 0.012 0.857 0.717 1.196 0.014 0.013 0.014
Mean Age of Childbearing: 27.56 27.30Total Fertil ity Rate: 4.29 3.59 4.11 4.03 4.07
Cumulation ofAdjustment
Factors
Age Specific Fertil ity Rates Based on Adjustment Factor for the Age
Group A.S.F.R. Fertil ity
Pattern by Age at Birth
Age Group of Women
Children Ever Born
Age Specific Fertil ity Pattern
Fertil ity Consistent with C.E.B. (A.S.F.R.)
Fertil ity Pattern by
Age at Survey Date
Ferti l ity Pattern by
Age at Birth of Child

203
Appendix 4: Arraiga's approach for estimation of ASFR for two points (19999 and 2009) in time and the age patterns of fertility (Arriaga-Brass)
First EnumerationMonth NovemberYear 1999
Fertil ity pattern is tabulated by age of woman at enumeration
20 - 25 25 - 30 20 - 30November 1999 to November 2000
Recorded Calculated 15 - 20 0.129 0.042 0.087 0.042 0.054 0.087 0.054 1.624 0.061 0.059 0.060 20 - 25 0.997 0.194 0.206 0.194 0.204 0.293 0.257 1.139 0.232 0.222 0.227 25 - 30 2.100 0.204 0.206 0.204 0.201 0.500 0.459 1.089 0.229 0.219 0.224 30 - 35 3.256 0.158 0.175 0.158 0.153 0.674 0.611 1.102 0.174 0.166 0.170 35 - 40 4.058 0.109 0.074 0.109 0.104 0.748 0.716 1.045 0.119 0.114 0.116 40 - 45 4.573 0.054 0.038 0.054 0.050 0.786 0.765 1.026 0.057 0.054 0.055 45 - 50 4.782 0.036 0.014 0.036 0.032 0.800 0.797 1.003 0.036 0.034 0.035
Mean Age of Childbearing: 26.66 27.76Total Fertil ity Rate: 4.00 3.99 4.54 4.34 4.44
Second EnumerationMonth NovemberYear 2009
Fertil ity pattern is tabulated by age of woman at enumeration
20 - 25 25 - 30 20 - 30November 2008 to November 2009
Recorded Calculated 15 - 20 0.096 0.044 0.074 0.044 0.056 0.074 0.056 1.326 0.061 0.058 0.059 20 - 25 0.887 0.180 0.193 0.180 0.188 0.266 0.244 1.091 0.206 0.197 0.201 25 - 30 1.898 0.190 0.185 0.190 0.187 0.452 0.431 1.047 0.204 0.196 0.200 30 - 35 2.927 0.146 0.154 0.146 0.141 0.605 0.572 1.058 0.154 0.148 0.151 35 - 40 3.635 0.098 0.061 0.098 0.093 0.666 0.665 1.001 0.102 0.098 0.100 40 - 45 4.109 0.045 0.031 0.045 0.041 0.698 0.706 0.988 0.045 0.043 0.044 45 - 50 4.418 0.015 0.012 0.015 0.012 0.709 0.718 0.988 0.013 0.012 0.012
Mean Age of Childbearing: 26.56 27.29Total Fertil ity Rate: 3.55 3.59 3.92 3.76 3.84
Ferti l ity Pattern by
Age at Birth of Child
Cumulation ofAdjustment
Factors
Age Specific Fertil ity Rates Based on Adjustment Factor for the Age
Group A.S.F.R. Fertil ity
Pattern by Age at Birth
Cumulation ofAdjustment
Factors
Age Specific Fertil ity Rates Based on Adjustment Factor for the Age
Group A.S.F.R. Fertil ity
Pattern by Age at Birth
Age Group of Women
Children Ever Born
Age Specific Fertil ity Pattern
Fertil ity Consistent with C.E.B. (A.S.F.R.)
Fertil ity Pattern by
Age at Survey Date
Age Group of Women
Children Ever Born
Age Specific Fertil ity Pattern
Fertil ity Consistent with C.E.B. (A.S.F.R.)
Fertil ity Pattern by
Age at Survey Date
Ferti l ity Pattern by
Age at Birth of Child

204
Appendix 5: Fertility estimates using the Trussell P/F Ratio Technique, PAS procedure PFRATIO, Vanuatu: 1999
* Pattern corrected for one-half year between birth and reporting. ASFR Age-specific fertility rate. CEB Average number of children ever born.
Reported Average CumulativeASFR CEB fertility P/F
Age f(i) P(i) Phi(i) F(i) ratio15-19 0.042 0.129 0.209 0.079 1.62720-24 0.194 0.997 1.177 0.762 1.30725-29 0.204 2.100 2.199 1.803 1.16430-34 0.158 3.256 2.991 2.694 1.20835-39 0.109 4.058 3.539 3.337 1.21640-44 0.054 4.573 3.811 3.658 1.25045-49 0.036 4.782 3.993 3.950 1.211Age code 0.000TFR 3.993
* Age code: ASFR based on age of mother at: 0 census/survey 1 birth of child
P2/F2 P3/F3 P4/F4 Avg(P3/F3,P4/F4)Age ASFR * 1.307 1.164 1.208 1.18615-19 0.054 0.070 0.062 0.065 0.06420-24 0.203 0.266 0.237 0.246 0.24125-29 0.202 0.264 0.235 0.244 0.23930-34 0.153 0.200 0.178 0.185 0.18235-39 0.105 0.137 0.122 0.127 0.12440-44 0.050 0.065 0.058 0.060 0.05945-49 0.032 0.042 0.037 0.039 0.038
TFR 3.99 5.22 4.65 4.82 4.74
Adjusted ASFR's

205
Appendix 6: Fertility estimates using the Trussell P/F Ratio Technique, PAS procedure PFRATIO, Vanuatu: 2009
* Pattern corrected for one-half year between birth and reporting. ASFR Age-specific fertility rate. CEB Average number of children ever born.
Reported Average CumulativeASFR CEB fertility P/F
Age f(i) P(i) Phi(i) F(i) ratio15-19 0.044 0.096 0.218 0.085 1.13620-24 0.180 0.887 1.118 0.730 1.21425-29 0.190 1.898 2.067 1.698 1.11830-34 0.146 2.927 2.797 2.525 1.15935-39 0.098 3.635 3.285 3.108 1.16940-44 0.045 4.109 3.510 3.421 1.20145-49 0.015 4.418 3.586 3.568 1.238Age code 0.000TFR 3.586
* Age code: ASFR based on age of mother at: 0 census/survey 1 birth of child
P2/F2 P3/F3 P4/F4 Avg(P3/F3,P4/F4)Age ASFR * 1.214 1.118 1.159 1.13915-19 0.055 0.067 0.062 0.064 0.06320-24 0.189 0.229 0.211 0.219 0.21525-29 0.187 0.227 0.209 0.217 0.21330-34 0.141 0.171 0.158 0.163 0.16135-39 0.093 0.113 0.104 0.108 0.10640-44 0.041 0.050 0.046 0.048 0.04745-49 0.012 0.014 0.013 0.014 0.014
TFR 3.59 4.35 4.01 4.16 4.08
Adjusted ASFR's

206
Appendix 7: Fertility estimates using the Relational Gompertz method, Vanuatu: 1999 and 2009
Summary Estimates of the Total Fertility Rate - 1999
Based on CEB only Based on ASFR and CEB2+2 points 3+3 points 2+2 points 3+3 points
15-19 4.331 4.627 7.267 4.90920-24 4.896 5.220 5.096 5.99925-29 4.673 4.900 4.417 5.54630-34 4.794 4.944 4.504 5.41035-39 4.730 4.808 4.542 5.06740-44 4.731 4.755 4.666 4.84545-49 4.793 4.795 4.786 4.806Average 4.707 4.864 5.040 5.226Average (20-39) 4.773 4.968 4.640 5.5062+2 points based on the age groups 15-19 to 35-39
3+3 points based on the age groups 15-19 to 45-49
CEB Children ever born.
ASFR Age-specific ferti l ity rate.
Summary Estimates of the Total Fertility Rate - 2009
2+2 points 3+3 points 2+2 points 3+3 points15-19 3.706 3.833 4.734 3.68420-24 4.369 5.189 4.302 4.75525-29 4.130 4.830 3.905 4.47430-34 4.213 4.715 4.014 4.46335-39 4.174 4.449 4.057 4.31140-44 4.229 4.320 4.191 4.27345-49 4.425 4.436 4.422 4.430Average (15-49) 4.178 4.539 4.232 4.342Average (20-39) 4.221 4.796 4.069 4.5012+2 points based on the age groups 15-19 to 35-39
3+3 points based on the age groups 15-19 to 45-49
CEB Children ever born.
ASFR Age-specific ferti l ity rate.
Age
Age Based on CEB only Based on ASFR and CEB

207
Appendix 8: Abridged life table - Males, Torba: 2009
Appendix 9: Abridged life table - Females, Torba: 2009
Age m(x,n) q(x,n) l(x) d(x,n) L(x,n) S(x,n) T(x) e(x)0 0.0152 0.0150 100,000 1,500 98,628 0.9843 6,716,094 67.2 1 0.0005 0.0020 98,500 197 393,529 0.9960 6,617,466 67.2 5 0.0011 0.0053 98,303 522 490,209 0.9949 6,223,937 63.3
10 0.0010 0.0049 97,781 478 487,708 0.9923 5,733,728 58.6 15 0.0023 0.0113 97,303 1,098 483,962 0.9882 5,246,020 53.9 20 0.0023 0.0116 96,205 1,118 478,238 0.9882 4,762,058 49.5 25 0.0024 0.0120 95,087 1,141 472,611 0.9874 4,283,821 45.1 30 0.0027 0.0135 93,945 1,272 466,633 0.9849 3,811,210 40.6 35 0.0034 0.0170 92,674 1,575 459,600 0.9801 3,344,577 36.1 40 0.0047 0.0235 91,098 2,140 450,443 0.9714 2,884,977 31.7 45 0.0071 0.0347 88,959 3,091 437,545 0.9572 2,434,534 27.4 50 0.0107 0.0523 85,868 4,489 418,814 0.9352 1,996,988 23.3 55 0.0165 0.0795 81,379 6,473 391,656 0.9019 1,578,175 19.4 60 0.0254 0.1199 74,906 8,979 353,221 0.8532 1,186,519 15.8 65 0.0391 0.1788 65,928 11,790 301,363 0.7814 833,298 12.6 70 0.0613 0.2665 54,138 14,427 235,496 0.6785 531,934 9.8 75 0.0966 0.3885 39,711 15,428 159,785 0.4610 296,438 7.5 80 0.1777 ... 24,283 24,283 136,653 ... 136,653 5.6
Age m(x,n) q(x,n) l(x) d(x,n) L(x,n) S(x,n) T(x) e(x)0 0.0193 0.0190 100,000 1,900 98,285 0.9800 7,119,434 71.2 1 0.0008 0.0030 98,100 294 391,693 0.9969 7,021,149 71.6 5 0.0005 0.0024 97,806 236 488,440 0.9978 6,629,456 67.8
10 0.0004 0.0021 97,570 204 487,342 0.9970 6,141,016 62.9 15 0.0008 0.0042 97,367 410 485,891 0.9950 5,653,674 58.1 20 0.0011 0.0056 96,957 540 483,462 0.9944 5,167,783 53.3 25 0.0011 0.0055 96,417 531 480,765 0.9942 4,684,321 48.6 30 0.0012 0.0062 95,885 596 477,983 0.9930 4,203,556 43.8 35 0.0016 0.0081 95,289 775 474,619 0.9900 3,725,572 39.1 40 0.0025 0.0125 94,514 1,177 469,857 0.9837 3,250,953 34.4 45 0.0043 0.0211 93,337 1,966 462,181 0.9726 2,781,096 29.8 50 0.0071 0.0349 91,372 3,190 449,526 0.9543 2,318,915 25.4 55 0.0120 0.0584 88,182 5,154 428,973 0.9258 1,869,389 21.2 60 0.0194 0.0926 83,028 7,692 397,137 0.8830 1,440,416 17.3 65 0.0314 0.1460 75,336 10,998 350,690 0.8169 1,043,279 13.8 70 0.0511 0.2276 64,338 14,641 286,493 0.7199 692,589 10.8 75 0.0829 0.3441 49,697 17,101 206,241 0.4921 406,096 8.2 80 0.1631 ... 32,596 32,596 199,856 ... 199,856 6.1

208
Appendix 10: Abridged life table - Males, Sanma: 2009
Appendix 11: Abridged life table - Females, Sanma: 2009
Age m(x,n) q(x,n) l(x) d(x,n) L(x,n) S(x,n) T(x) e(x)0 0.0245 0.0240 100,000 2,400 97,868 0.9742 6,982,924 69.8 1 0.0013 0.0050 97,600 488 389,219 0.9954 6,885,056 70.5 5 0.0006 0.0030 97,112 291 484,831 0.9972 6,495,837 66.9
10 0.0005 0.0025 96,821 244 483,493 0.9965 6,011,005 62.1 15 0.0010 0.0048 96,577 468 481,806 0.9942 5,527,513 57.2 20 0.0013 0.0066 96,109 634 478,997 0.9934 5,045,706 52.5 25 0.0013 0.0066 95,475 630 475,813 0.9931 4,566,709 47.8 30 0.0015 0.0074 94,845 706 472,513 0.9916 4,090,896 43.1 35 0.0019 0.0097 94,139 909 468,543 0.9882 3,618,384 38.4 40 0.0029 0.0145 93,229 1,349 463,020 0.9813 3,149,841 33.8 45 0.0048 0.0237 91,880 2,180 454,377 0.9695 2,686,822 29.2 50 0.0078 0.0385 89,700 3,451 440,529 0.9503 2,232,445 24.9 55 0.0130 0.0629 86,248 5,429 418,621 0.9206 1,791,916 20.8 60 0.0207 0.0986 80,820 7,967 385,392 0.8765 1,373,295 17.0 65 0.0331 0.1533 72,853 11,169 337,778 0.8089 987,903 13.6 70 0.0534 0.2364 61,684 14,583 273,242 0.7104 650,125 10.5 75 0.0860 0.3544 47,101 16,691 194,108 0.4850 376,883 8.0 80 0.1664 ... 30,410 30,410 182,774 ... 182,774 6.0
Age m(x,n) q(x,n) l(x) d(x,n) L(x,n) S(x,n) T(x) e(x)0 0.0204 0.0200 100,000 2,000 98,200 0.9790 7,242,868 72.4 1 0.0008 0.0030 98,000 294 391,292 0.9971 7,144,668 72.9 5 0.0004 0.0018 97,706 174 488,095 0.9984 6,753,375 69.1
10 0.0003 0.0015 97,532 148 487,290 0.9979 6,265,281 64.2 15 0.0006 0.0030 97,384 288 486,262 0.9963 5,777,991 59.3 20 0.0008 0.0042 97,096 410 484,484 0.9958 5,291,729 54.5 25 0.0008 0.0041 96,686 397 482,446 0.9957 4,807,245 49.7 30 0.0009 0.0046 96,289 445 480,372 0.9947 4,324,799 44.9 35 0.0012 0.0061 95,845 588 477,842 0.9923 3,844,428 40.1 40 0.0020 0.0097 95,256 928 474,160 0.9869 3,366,585 35.3 45 0.0035 0.0173 94,329 1,633 467,932 0.9770 2,892,426 30.7 50 0.0060 0.0298 92,695 2,759 457,183 0.9602 2,424,494 26.2 55 0.0106 0.0518 89,936 4,655 438,966 0.9335 1,967,311 21.9 60 0.0174 0.0837 85,281 7,136 409,787 0.8931 1,528,345 17.9 65 0.0288 0.1347 78,145 10,528 365,977 0.8293 1,118,557 14.3 70 0.0476 0.2138 67,616 14,455 303,518 0.7348 752,580 11.1 75 0.0782 0.3279 53,161 17,433 223,014 0.5034 449,062 8.4 80 0.1581 ... 35,728 35,728 226,048 ... 226,048 6.3

209
Appendix 12: Abridged life table - Males, Penama: 2009
Appendix 13: Abridged life table - Females, Penama: 2009
Age m(x,n) q(x,n) l(x) d(x,n) L(x,n) S(x,n) T(x) e(x)0 0.0245 0.0240 100,000 2,400 97,868 0.9742 6,617,252 66.2 1 0.0013 0.0050 97,600 488 389,219 0.9939 6,519,385 66.8 5 0.0012 0.0059 97,112 571 484,133 0.9945 6,130,165 63.1
10 0.0010 0.0050 96,541 487 481,488 0.9927 5,646,032 58.5 15 0.0021 0.0103 96,054 991 477,969 0.9886 5,164,545 53.8 20 0.0024 0.0120 95,063 1,143 472,500 0.9878 4,686,576 49.3 25 0.0025 0.0124 93,921 1,169 466,713 0.9869 4,214,077 44.9 30 0.0028 0.0141 92,751 1,303 460,586 0.9844 3,747,364 40.4 35 0.0035 0.0176 91,448 1,610 453,389 0.9794 3,286,778 35.9 40 0.0049 0.0242 89,839 2,174 444,058 0.9706 2,833,388 31.5 45 0.0072 0.0355 87,665 3,116 431,008 0.9563 2,389,330 27.3 50 0.0109 0.0532 84,549 4,500 412,181 0.9342 1,958,322 23.2 55 0.0168 0.0806 80,049 6,452 385,041 0.9007 1,546,141 19.3 60 0.0257 0.1212 73,597 8,918 346,806 0.8518 1,161,100 15.8 65 0.0395 0.1803 64,680 11,663 295,407 0.7799 814,294 12.6 70 0.0617 0.2682 53,016 14,218 230,374 0.6767 518,886 9.8 75 0.0972 0.3904 38,798 15,146 155,899 0.4596 288,512 7.4 80 0.1783 ... 23,652 23,652 132,613 ... 132,613 5.6
Age m(x,n) q(x,n) l(x) d(x,n) L(x,n) S(x,n) T(x) e(x)0 0.0298 0.0290 100,000 2,900 97,465 0.9684 7,171,110 71.7 1 0.0018 0.0070 97,100 680 386,745 0.9948 7,073,645 72.8 5 0.0004 0.0018 96,420 172 481,671 0.9984 6,686,900 69.4
10 0.0003 0.0014 96,248 137 480,901 0.9982 6,205,229 64.5 15 0.0005 0.0025 96,112 238 480,016 0.9967 5,724,328 59.6 20 0.0008 0.0040 95,874 385 478,444 0.9960 5,244,312 54.7 25 0.0008 0.0039 95,489 372 476,521 0.9959 4,765,868 49.9 30 0.0009 0.0044 95,117 417 474,577 0.9950 4,289,347 45.1 35 0.0012 0.0058 94,700 553 472,204 0.9926 3,814,770 40.3 40 0.0019 0.0093 94,147 878 468,731 0.9874 3,342,567 35.5 45 0.0034 0.0167 93,269 1,560 462,808 0.9777 2,873,836 30.8 50 0.0059 0.0289 91,710 2,654 452,503 0.9611 2,411,028 26.3 55 0.0104 0.0507 89,056 4,512 434,908 0.9348 1,958,525 22.0 60 0.0171 0.0822 84,544 6,948 406,558 0.8948 1,523,617 18.0 65 0.0283 0.1328 77,596 10,307 363,781 0.8314 1,117,059 14.4 70 0.0470 0.2114 67,290 14,227 302,464 0.7373 753,278 11.2 75 0.0774 0.3251 53,063 17,252 223,013 0.5053 450,814 8.5 80 0.1572 ... 35,810 35,810 227,801 ... 227,801 6.4

210
Appendix 14: Abridged life table - Males, Malampa: 2009
Appendix 15: Abridged life table - Females, Malampa: 2009
Age m(x,n) q(x,n) l(x) d(x,n) L(x,n) S(x,n) T(x) e(x)0 0.0245 0.0240 100,000 2,400 97,868 0.9742 6,916,384 69.2 1 0.0013 0.0050 97,600 488 389,219 0.9952 6,818,517 69.9 5 0.0007 0.0034 97,112 332 484,729 0.9968 6,429,297 66.2
10 0.0006 0.0029 96,780 280 483,198 0.9960 5,944,568 61.4 15 0.0011 0.0056 96,500 543 481,247 0.9933 5,461,371 56.6 20 0.0015 0.0074 95,957 714 478,040 0.9925 4,980,124 51.9 25 0.0015 0.0075 95,243 713 474,448 0.9921 4,502,084 47.3 30 0.0017 0.0085 94,530 800 470,708 0.9905 4,027,636 42.6 35 0.0022 0.0109 93,730 1,022 466,226 0.9868 3,556,928 37.9 40 0.0032 0.0161 92,707 1,492 460,067 0.9795 3,090,702 33.3 45 0.0052 0.0258 91,215 2,355 450,631 0.9671 2,630,634 28.8 50 0.0084 0.0412 88,860 3,662 435,815 0.9472 2,180,004 24.5 55 0.0137 0.0663 85,198 5,651 412,815 0.9168 1,744,188 20.5 60 0.0217 0.1030 79,547 8,194 378,451 0.8716 1,331,373 16.7 65 0.0343 0.1587 71,353 11,325 329,847 0.8031 952,922 13.4 70 0.0550 0.2429 60,029 14,580 264,890 0.7035 623,075 10.4 75 0.0882 0.3618 45,449 16,444 186,347 0.4797 358,184 7.9 80 0.1688 ... 29,005 29,005 171,837 ... 171,837 5.9
Age m(x,n) q(x,n) l(x) d(x,n) L(x,n) S(x,n) T(x) e(x)0 0.0162 0.0160 100,000 1,600 98,542 0.9833 7,256,880 72.6 1 0.0005 0.0020 98,400 197 393,128 0.9978 7,158,339 72.7 5 0.0004 0.0018 98,203 180 490,566 0.9983 6,765,210 68.9
10 0.0003 0.0016 98,023 158 489,723 0.9977 6,274,644 64.0 15 0.0007 0.0033 97,866 327 488,580 0.9960 5,784,922 59.1 20 0.0009 0.0044 97,539 432 486,636 0.9956 5,296,342 54.3 25 0.0009 0.0043 97,107 420 484,492 0.9955 4,809,706 49.5 30 0.0010 0.0049 96,687 470 482,298 0.9945 4,325,214 44.7 35 0.0013 0.0064 96,217 620 479,627 0.9919 3,842,916 39.9 40 0.0020 0.0102 95,596 972 475,756 0.9864 3,363,289 35.2 45 0.0036 0.0179 94,625 1,695 469,265 0.9763 2,887,533 30.5 50 0.0062 0.0306 92,929 2,844 458,151 0.9592 2,418,268 26.0 55 0.0108 0.0529 90,085 4,763 439,453 0.9322 1,960,117 21.8 60 0.0177 0.0852 85,322 7,267 409,676 0.8914 1,520,664 17.8 65 0.0292 0.1366 78,055 10,664 365,187 0.8272 1,110,988 14.2 70 0.0482 0.2161 67,391 14,565 302,096 0.7322 745,801 11.1 75 0.0790 0.3307 52,826 17,469 221,203 0.5015 443,705 8.4 80 0.1589 ... 35,357 35,357 222,502 ... 222,502 6.3

211
Appendix 16: Abridged life table - Males, Shefa: 2009
Appendix 17: Abridged life table - Females, Shefa: 2009
Age m(x,n) q(x,n) l(x) d(x,n) L(x,n) S(x,n) T(x) e(x)0 0.0224 0.0220 100,000 2,200 98,033 0.9766 7,036,602 70.4 1 0.0010 0.0040 97,800 391 390,256 0.9961 6,938,570 70.9 5 0.0006 0.0028 97,409 269 486,371 0.9974 6,548,313 67.2
10 0.0005 0.0024 97,140 228 485,127 0.9967 6,061,942 62.4 15 0.0009 0.0046 96,911 447 483,527 0.9945 5,576,815 57.5 20 0.0012 0.0062 96,464 598 480,859 0.9938 5,093,288 52.8 25 0.0012 0.0062 95,866 592 477,861 0.9935 4,612,429 48.1 30 0.0014 0.0070 95,274 664 474,760 0.9921 4,134,568 43.4 35 0.0018 0.0091 94,610 858 471,022 0.9889 3,659,807 38.7 40 0.0028 0.0137 93,752 1,284 465,789 0.9822 3,188,785 34.0 45 0.0046 0.0227 92,468 2,100 457,509 0.9707 2,722,996 29.4 50 0.0076 0.0371 90,368 3,355 444,104 0.9518 2,265,486 25.1 55 0.0126 0.0613 87,013 5,330 422,689 0.9226 1,821,383 20.9 60 0.0202 0.0964 81,683 7,871 389,955 0.8789 1,398,693 17.1 65 0.0324 0.1506 73,812 11,115 342,737 0.8119 1,008,738 13.7 70 0.0525 0.2331 62,697 14,617 278,274 0.7139 666,001 10.6 75 0.0848 0.3506 48,081 16,855 198,662 0.4876 387,727 8.1 80 0.1652 ... 31,225 31,225 189,065 ... 189,065 6.1
Age m(x,n) q(x,n) l(x) d(x,n) L(x,n) S(x,n) T(x) e(x)0 0.0121 0.0120 100,000 1,200 98,892 0.9877 7,335,757 73.4 1 0.0003 0.0010 98,800 99 394,964 0.9985 7,236,864 73.2 5 0.0003 0.0016 98,701 155 493,116 0.9985 6,841,900 69.3
10 0.0003 0.0014 98,546 143 492,370 0.9978 6,348,784 64.4 15 0.0006 0.0032 98,403 319 491,282 0.9963 5,856,413 59.5 20 0.0008 0.0040 98,083 394 489,446 0.9960 5,365,131 54.7 25 0.0008 0.0039 97,689 381 487,501 0.9959 4,875,685 49.9 30 0.0009 0.0044 97,309 426 485,512 0.9950 4,388,184 45.1 35 0.0012 0.0058 96,882 566 483,084 0.9926 3,902,672 40.3 40 0.0019 0.0093 96,316 898 479,532 0.9874 3,419,587 35.5 45 0.0034 0.0167 95,419 1,596 473,472 0.9777 2,940,056 30.8 50 0.0059 0.0289 93,823 2,715 462,929 0.9611 2,466,584 26.3 55 0.0104 0.0507 91,108 4,616 444,929 0.9348 2,003,654 22.0 60 0.0171 0.0822 86,492 7,108 415,927 0.8948 1,558,725 18.0 65 0.0283 0.1328 79,384 10,544 372,163 0.8314 1,142,799 14.4 70 0.0470 0.2114 68,840 14,555 309,434 0.7373 770,635 11.2 75 0.0774 0.3251 54,285 17,650 228,151 0.5053 461,202 8.5 80 0.1572 ... 36,636 36,636 233,050 ... 233,050 6.4

212
Appendix 18: Abridged life table - Males, Tafea: 2009
Appendix 19: Abridged life table - Females, Tafea: 2009
Age m(x,n) q(x,n) l(x) d(x,n) L(x,n) S(x,n) T(x) e(x)0 0.0245 0.0240 100,000 2,400 97,868 0.9742 6,905,245 69.1 1 0.0013 0.0050 97,600 488 389,219 0.9951 6,807,377 69.7 5 0.0007 0.0035 97,112 340 484,711 0.9968 6,418,158 66.1
10 0.0006 0.0030 96,772 286 483,146 0.9959 5,933,447 61.3 15 0.0012 0.0058 96,486 556 481,149 0.9932 5,450,300 56.5 20 0.0015 0.0076 95,930 727 477,872 0.9923 4,969,152 51.8 25 0.0015 0.0076 95,203 728 474,211 0.9920 4,491,280 47.2 30 0.0017 0.0086 94,475 816 470,394 0.9903 4,017,069 42.5 35 0.0022 0.0111 93,659 1,042 465,823 0.9865 3,546,675 37.9 40 0.0033 0.0164 92,617 1,516 459,555 0.9792 3,080,852 33.3 45 0.0053 0.0262 91,100 2,385 449,984 0.9667 2,621,297 28.8 50 0.0085 0.0417 88,716 3,697 435,008 0.9467 2,171,313 24.5 55 0.0138 0.0669 85,019 5,687 411,829 0.9161 1,736,305 20.4 60 0.0218 0.1037 79,332 8,230 377,282 0.8708 1,324,476 16.7 65 0.0345 0.1596 71,102 11,348 328,523 0.8021 947,194 13.3 70 0.0553 0.2439 59,754 14,576 263,510 0.7024 618,670 10.4 75 0.0886 0.3630 45,178 16,401 185,078 0.4789 355,160 7.9 80 0.1692 ... 28,777 28,777 170,082 ... 170,082 5.9
Age m(x,n) q(x,n) l(x) d(x,n) L(x,n) S(x,n) T(x) e(x)0 0.0371 0.0360 100,000 3,600 96,926 0.9603 7,213,254 72.1 1 0.0025 0.0100 96,400 964 383,233 0.9931 7,116,328 73.8 5 0.0003 0.0013 95,436 127 476,863 0.9988 6,733,095 70.6
10 0.0002 0.0010 95,309 97 476,304 0.9988 6,256,232 65.6 15 0.0003 0.0016 95,212 155 475,710 0.9977 5,779,928 60.7 20 0.0006 0.0030 95,057 286 474,604 0.9970 5,304,219 55.8 25 0.0006 0.0029 94,771 272 473,179 0.9970 4,829,614 51.0 30 0.0006 0.0032 94,499 304 471,761 0.9963 4,356,435 46.1 35 0.0009 0.0044 94,195 411 470,015 0.9944 3,884,675 41.2 40 0.0014 0.0072 93,784 677 467,387 0.9899 3,414,659 36.4 45 0.0027 0.0136 93,107 1,271 462,677 0.9814 2,947,273 31.7 50 0.0050 0.0245 91,836 2,252 454,091 0.9663 2,484,596 27.1 55 0.0091 0.0447 89,584 4,001 438,782 0.9419 2,030,505 22.7 60 0.0153 0.0739 85,583 6,328 413,272 0.9041 1,591,723 18.6 65 0.0259 0.1222 79,255 9,685 373,659 0.8433 1,178,451 14.9 70 0.0437 0.1981 69,570 13,785 315,098 0.7518 804,792 11.6 75 0.0728 0.3093 55,785 17,253 236,889 0.5162 489,694 8.8 80 0.1524 ... 38,533 38,533 252,804 ... 252,804 6.6

213
Appendix 20: Total population size and growth by place of residence and sex, Vanuatu: 1999 -2009
Male Female Total Male Female Total Male Female Total Male Female Total Male Female Total
VANUATU 95682 90996 186678 119091 114932 234023 23409 23936 47345 24.5 26.3 25.4 2.2 2.3 2.3
URBAN 20726 19368 40094 29618 27577 57195 8892 8209 17101 42.9 42.4 42.7 3.6 3.5 3.6Port Vi la 15189 14167 29356 22852 21187 44039 7663 7020 14683 50.5 49.6 50.0 4.1 4.0 4.1Luganvi l le 5537 5201 10738 6766 6390 13156 1229 1189 2418 22.2 22.9 22.5 2.0 2.1 2.0
RURAL 74956 71628 146584 89473 87355 176828 14517 15727 30244 19.4 22.0 20.6 1.8 2.0 1.9
TORBA 3937 3820 7757 4727 4632 9359 790 812 1602 20.1 21.3 20.7 1.8 1.9 1.9Gaua 1026 1005 2031 1262 1229 2491 236 224 460 23.0 22.3 22.6 2.1 2.0 2.0Hiu 92 108 200 122 147 269 30 39 69 32.6 36.1 34.5 2.8 3.1 3.0Kwakea - - - 12 14 26 12 14 26Loh 61 78 139 103 107 210 42 29 71 68.9 37.2 51.1 5.2 3.2 4.1Merelava 347 403 750 296 351 647 -51 -52 -103 -14.7 -12.9 -13.7 -1.6 -1.4 -1.5Merig 8 11 19 7 5 12 -1 -6 -7 -12.5 -54.5 -36.8 -1.3 -7.9 -4.6Metoma 5 5 10 8 5 13 3 0 3 60.0 0.0 30.0 4.7 0.0 2.6Mota 337 349 686 337 346 683 0 -3 -3 0.0 -0.9 -0.4 0.0 -0.1 0.0Motalava 606 540 1146 716 735 1451 110 195 305 18.2 36.1 26.6 1.7 3.1 2.4Rah 73 70 143 95 94 189 22 24 46 30.1 34.3 32.2 2.6 2.9 2.8Tegua 17 22 39 24 34 58 7 12 19 41.2 54.5 48.7 3.4 4.4 4.0Toga 148 150 298 131 145 276 -17 -5 -22 -11.5 -3.3 -7.4 -1.2 -0.3 -0.8Ureparapara 185 178 363 226 211 437 41 33 74 22.2 18.5 20.4 2.0 1.7 1.9Vanualava 1032 901 1933 1388 1209 2597 356 308 664 34.5 34.2 34.4 3.0 2.9 3.0
SANMA 18676 17408 36084 23623 22232 45855 4947 4824 9771 26.5 27.7 27.1 2.3 2.4 2.4Aes e 2 - 2 - - - -2 0 -2Aore 236 206 442 279 277 556 43 71 114 18.2 34.5 25.8 1.7 3.0 2.3Araki 52 46 98 65 75 140 13 29 42 25.0 63.0 42.9 2.2 4.9 3.6Bokiss a 16 14 30 30 26 56 14 12 26 87.5 85.7 86.7 6.3 6.2 6.2Malo 1868 1664 3532 2260 2019 4279 392 355 747 21.0 21.3 21.1 1.9 1.9 1.9Maloki l iki l i 9 6 15 6 7 13 -3 1 -2 -33.3 16.7 -13.3 -4.1 1.5 -1.4Mavea 100 72 172 104 103 207 4 31 35 4.0 43.1 20.3 0.4 3.6 1.9Santo 15923 14977 30900 20369 19232 39601 4446 4255 8701 27.9 28.4 28.2 2.5 2.5 2.5Tangoa 188 185 373 199 195 394 11 10 21 5.9 5.4 5.6 0.6 0.5 0.5Tutuba 281 237 518 311 298 609 30 61 91 10.7 25.7 17.6 1.0 2.3 1.6Urelapa 1 1 2 - - - -1 -1 -2
= places with an annual population growth rate of higher than 3 percent between 1999 and 2009= places that decreased in population size between 1999 and 2009
Place of residence
Population change from 1999 to 2009Total population size(in numbers) (in %) Annual growth rate1999 2009

214
Appendix 20: Total population size and growth by place of residence and sex, Vanuatu: 1999 -2009 (cont’d.)
Male Female Total Male Female Total Male Female Total Male Female Total Male Female Total
PENAMA 13724 12922 26646 15543 15276 30819 1819 2354 4173 13.3 18.2 15.7 1.2 1.7 1.5Ambae 4882 4536 9418 5325 5082 10407 443 546 989 9.1 12.0 10.5 0.9 1.1 1.0Maewo 1656 1515 3171 1805 1764 3569 149 249 398 9.0 16.4 12.6 0.9 1.5 1.2Pentecost 7186 6871 14057 8413 8430 16843 1227 1559 2786 17.1 22.7 19.8 1.6 2.0 1.8
MALAMPA 16653 16052 32705 18446 18281 36727 1793 2229 4022 10.8 13.9 12.3 1.0 1.3 1.2Akhamb 311 256 567 324 322 646 13 66 79 4.2 25.8 13.9 0.4 2.3 1.3Ambrym 3763 3606 7369 3638 3637 7275 -125 31 -94 -3.3 0.9 -1.3 -0.3 0.1 -0.1Arseo 152 138 290 - - - -152 -138 -290Atchin 377 384 761 357 381 738 -20 -3 -23 -5.3 -0.8 -3.0 -0.5 -0.1 -0.3Avock 74 95 169 79 102 181 5 7 12 6.8 7.4 7.1 0.7 0.7 0.7Khoti - - - 8 6 14 8 6 14Lopevi 1 - 1 - - - -1 0 -1Malekula 9762 9222 18984 11600 11302 22902 1838 2080 3918 18.8 22.6 20.6 1.7 2.0 1.9Maskelynes 425 519 944 481 540 1021 56 21 77 13.2 4.0 8.2 1.2 0.4 0.8Lembong - - - 31 29 60 31 29 60Norsup 43 49 92 41 47 88 -2 -2 -4 -4.7 -4.1 -4.3 -0.5 -0.4 -0.4Paama 785 848 1633 804 823 1627 19 -25 -6 2.4 -2.9 -0.4 0.2 -0.3 0.0Rano 129 144 273 155 149 304 26 5 31 20.2 3.5 11.4 1.8 0.3 1.1Tomman 136 108 244 149 141 290 13 33 46 9.6 30.6 18.9 0.9 2.7 1.7Uri 34 32 66 15 14 29 -19 -18 -37Uripiv 224 220 444 180 204 384 -44 -16 -60 -19.6 -7.3 -13.5 -2.2 -0.8 -1.5Vao 325 342 667 452 446 898 127 104 231 39.1 30.4 34.6 3.3 2.7 3.0Wala 112 89 201 132 138 270 20 49 69 17.9 55.1 34.3 1.6 4.4 3.0
= places with an annual population growth rate of higher than 3 percent between 1999 and 2009= places that decreased in population size between 1999 and 2009
Place of residence
Total population size Population change from 1999 to 20091999 2009 (in numbers) (in %) Annual growth rate
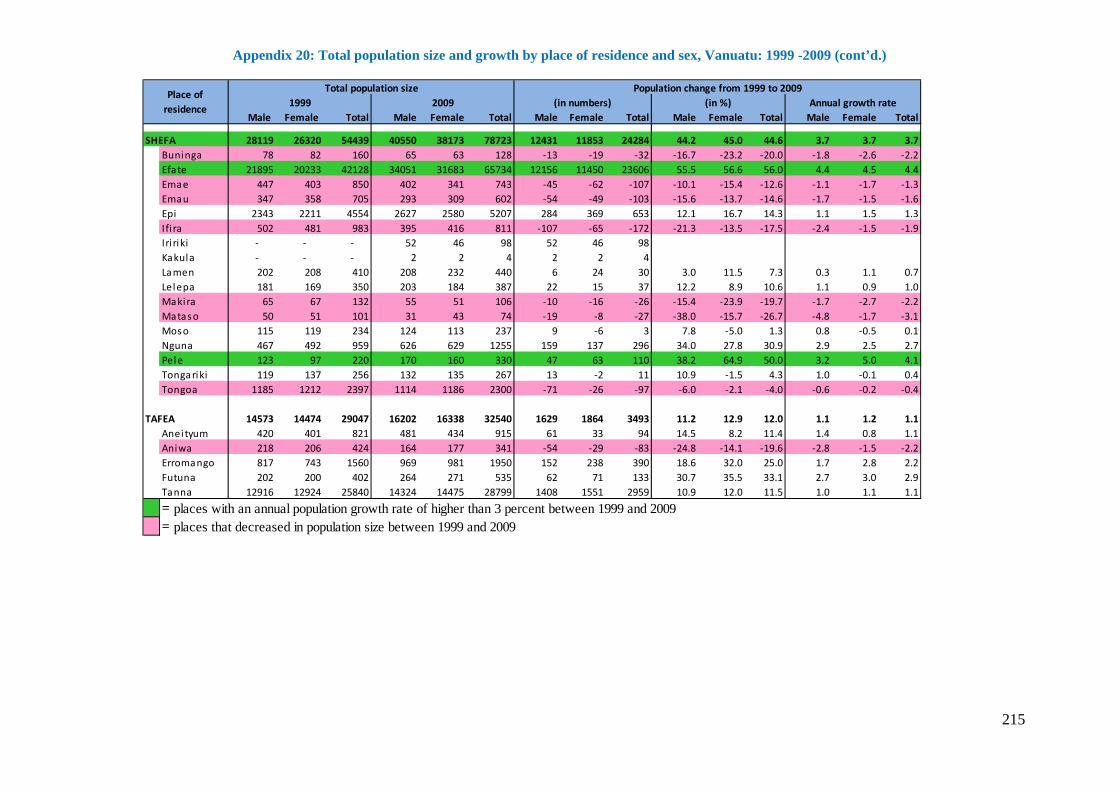
215
Appendix 20: Total population size and growth by place of residence and sex, Vanuatu: 1999 -2009 (cont’d.)
Male Female Total Male Female Total Male Female Total Male Female Total Male Female Total
SHEFA 28119 26320 54439 40550 38173 78723 12431 11853 24284 44.2 45.0 44.6 3.7 3.7 3.7Buninga 78 82 160 65 63 128 -13 -19 -32 -16.7 -23.2 -20.0 -1.8 -2.6 -2.2Efate 21895 20233 42128 34051 31683 65734 12156 11450 23606 55.5 56.6 56.0 4.4 4.5 4.4Emae 447 403 850 402 341 743 -45 -62 -107 -10.1 -15.4 -12.6 -1.1 -1.7 -1.3Emau 347 358 705 293 309 602 -54 -49 -103 -15.6 -13.7 -14.6 -1.7 -1.5 -1.6Epi 2343 2211 4554 2627 2580 5207 284 369 653 12.1 16.7 14.3 1.1 1.5 1.3Ifi ra 502 481 983 395 416 811 -107 -65 -172 -21.3 -13.5 -17.5 -2.4 -1.5 -1.9Iri riki - - - 52 46 98 52 46 98Kakula - - - 2 2 4 2 2 4Lamen 202 208 410 208 232 440 6 24 30 3.0 11.5 7.3 0.3 1.1 0.7Lelepa 181 169 350 203 184 387 22 15 37 12.2 8.9 10.6 1.1 0.9 1.0Makira 65 67 132 55 51 106 -10 -16 -26 -15.4 -23.9 -19.7 -1.7 -2.7 -2.2Mataso 50 51 101 31 43 74 -19 -8 -27 -38.0 -15.7 -26.7 -4.8 -1.7 -3.1Moso 115 119 234 124 113 237 9 -6 3 7.8 -5.0 1.3 0.8 -0.5 0.1Nguna 467 492 959 626 629 1255 159 137 296 34.0 27.8 30.9 2.9 2.5 2.7Pele 123 97 220 170 160 330 47 63 110 38.2 64.9 50.0 3.2 5.0 4.1Tongariki 119 137 256 132 135 267 13 -2 11 10.9 -1.5 4.3 1.0 -0.1 0.4Tongoa 1185 1212 2397 1114 1186 2300 -71 -26 -97 -6.0 -2.1 -4.0 -0.6 -0.2 -0.4
TAFEA 14573 14474 29047 16202 16338 32540 1629 1864 3493 11.2 12.9 12.0 1.1 1.2 1.1Aneityum 420 401 821 481 434 915 61 33 94 14.5 8.2 11.4 1.4 0.8 1.1Aniwa 218 206 424 164 177 341 -54 -29 -83 -24.8 -14.1 -19.6 -2.8 -1.5 -2.2Erromango 817 743 1560 969 981 1950 152 238 390 18.6 32.0 25.0 1.7 2.8 2.2Futuna 202 200 402 264 271 535 62 71 133 30.7 35.5 33.1 2.7 3.0 2.9Tanna 12916 12924 25840 14324 14475 28799 1408 1551 2959 10.9 12.0 11.5 1.0 1.1 1.1
= places with an annual population growth rate of higher than 3 percent between 1999 and 2009= places that decreased in population size between 1999 and 2009
Place of residence
Total population size Population change from 1999 to 20091999 2009 (in numbers) (in %) Annual growth rate

216
Appendix 21: Population aged 15 and older by labour market activity, sex, and residence, Vanuatu: 2009
* includes: 2,751 people who did not want to work, 897 who did not work because they believed no work was available, 51 who did not work because of weather/transport, 988 ‘Other reasons’, 3,129 not stated, and 939 people who were not available to work
Employer Self
employed
Employee for
wage/salary Unpaid worker
Subsistence
work Un-
employed Total Full time
student Home duties
Retired/Old age
Disabled Other* Total
Vanuatu 1,369 15,920 25,006 10,288 41,877 4,518 98,978 9,008 17,840 4,480 581 8,755 40,664
Males 953 9,215 15,748 5,788 21,942 2,301 55,947 4,625 3,030 1,823 329 3,840 13,647
Females 416 6,705 9,258 4,500 19,935 2,217 43,031 4,383 14,810 2,657 252 4,915 27,017
Urban 828 2,346 14,842 744 1,996 2,798 23,554 4,112 5,393 1,392 136 3,689 14,722
Males 546 1,318 9,019 421 1,131 1,363 13,798 2,073 1,183 668 77 1,807 5,808
Females 282 1,028 5,823 323 865 1,435 9,756 2,039 4,210 724 59 1,882 8,914
Rural 541 13,574 10,164 9,544 39,881 1,720 75,424 4,896 12,447 3,088 445 5,066 25,942
Males 407 7,897 6,729 5,367 20,811 938 42,149 2,552 1,847 1,155 252 2,033 7,839
Females 134 5,677 3,435 4,177 19,070 782 33,275 2,344 10,600 1,933 193 3,033 18,103
Torba 8 397 311 337 2,977 7 4,037 256 560 155 17 214 1,202
Males 7 282 209 215 1,479 6 2,198 135 75 57 13 71 351
Females 1 115 102 122 1,498 1 1,839 121 485 98 4 143 851
Sanma 124 2,827 4,645 1,253 9,788 791 19,428 1,603 3,154 779 102 1,547 7,185
Males 94 1,690 3,049 742 4,979 415 10,969 804 553 358 59 751 2,525
Females 30 1,137 1,596 511 4,809 376 8,459 799 2,601 421 43 796 4,660
Penama 71 3,742 1,074 2,244 6,695 67 13,893 840 1,486 572 94 563 3,555
Males 52 2,200 661 1,154 3,361 35 7,463 443 225 246 59 207 1,180
Females 19 1,542 413 1,090 3,334 32 6,430 397 1,261 326 35 356 2,375
Malampa 99 3,130 1,481 3,031 8,274 312 16,327 930 2,706 691 107 849 5,283
Males 65 1,905 950 1,715 4,321 154 9,110 494 275 228 63 281 1,341
Females 34 1,225 531 1,316 3,953 158 7,217 436 2,431 463 44 568 3,942
Shefa 1,004 4,987 16,100 2,072 6,090 2,516 32,769 4,360 7,615 1,832 181 4,654 18,642
Males 687 2,652 9,963 1,184 3,569 1,246 19,301 2,226 1,656 783 99 2,185 6,949
Females 317 2,335 6,137 888 2,521 1,270 13,468 2,134 5,959 1,049 82 2,469 11,693
Tafea 63 837 1,395 1,351 8,053 825 12,524 1,019 2,319 451 80 928 4,797
Males 48 486 916 778 4,233 445 6,906 523 246 151 36 345 1,301
Females 15 351 479 573 3,820 380 5,618 496 2,073 300 44 583 3,496
Region/ Sex
Labour Force Non Labour Force

217
Appendix 22: Level of TFR of Australia, France, New Zealand, and the USA since 1975
0.0
0.5
1.0
1.5
2.0
2.5
TF
R
(ave
rag
e n
um
ber
of
chil
dre
n p
er w
om
an)
Year
Total Fertility rate (TFR)
USA NZ France Australia Average
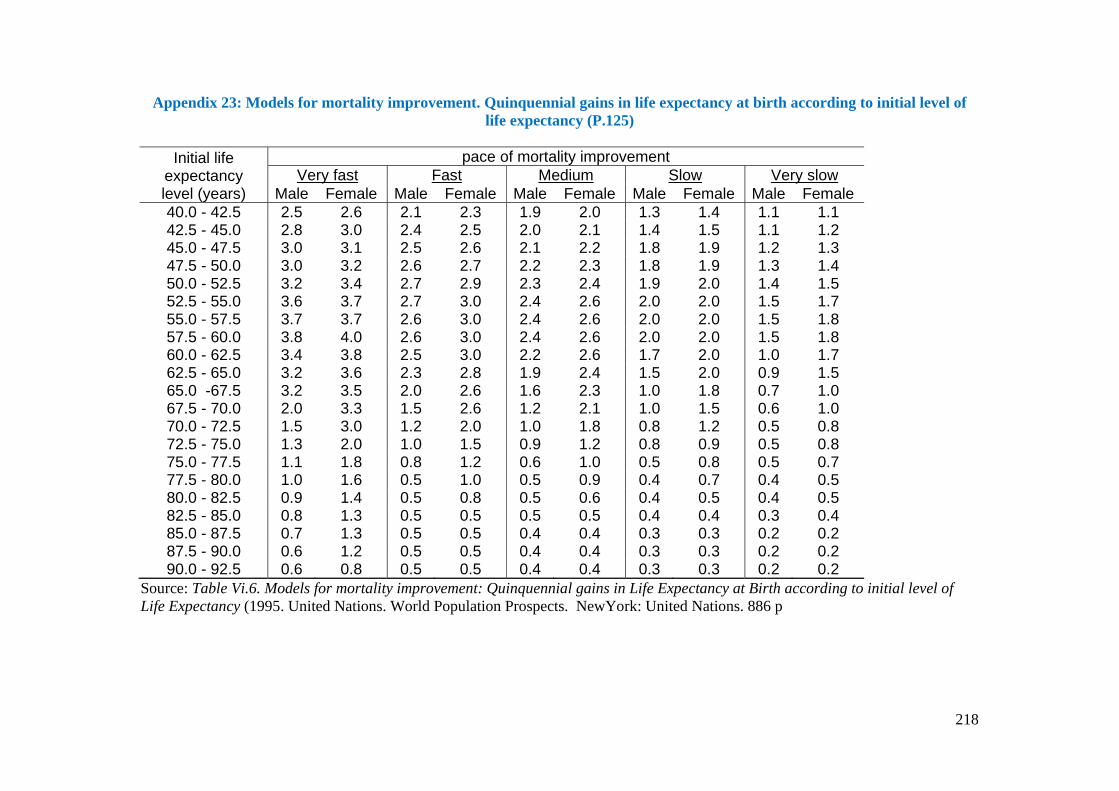
218
Appendix 23: Models for mortality improvement. Quinquennial gains in life expectancy at birth according to initial level of life expectancy (P.125)
Initial life
expectancy level (years)
pace of mortality improvement Very fast Fast Medium Slow Very slow
Male Female Male Female Male Female Male Female Male Female 40.0 - 42.5 2.5 2.6 2.1 2.3 1.9 2.0 1.3 1.4 1.1 1.1 42.5 - 45.0 2.8 3.0 2.4 2.5 2.0 2.1 1.4 1.5 1.1 1.2 45.0 - 47.5 3.0 3.1 2.5 2.6 2.1 2.2 1.8 1.9 1.2 1.3 47.5 - 50.0 3.0 3.2 2.6 2.7 2.2 2.3 1.8 1.9 1.3 1.4 50.0 - 52.5 3.2 3.4 2.7 2.9 2.3 2.4 1.9 2.0 1.4 1.5 52.5 - 55.0 3.6 3.7 2.7 3.0 2.4 2.6 2.0 2.0 1.5 1.7 55.0 - 57.5 3.7 3.7 2.6 3.0 2.4 2.6 2.0 2.0 1.5 1.8 57.5 - 60.0 3.8 4.0 2.6 3.0 2.4 2.6 2.0 2.0 1.5 1.8 60.0 - 62.5 3.4 3.8 2.5 3.0 2.2 2.6 1.7 2.0 1.0 1.7 62.5 - 65.0 3.2 3.6 2.3 2.8 1.9 2.4 1.5 2.0 0.9 1.5 65.0 -67.5 3.2 3.5 2.0 2.6 1.6 2.3 1.0 1.8 0.7 1.0 67.5 - 70.0 2.0 3.3 1.5 2.6 1.2 2.1 1.0 1.5 0.6 1.0 70.0 - 72.5 1.5 3.0 1.2 2.0 1.0 1.8 0.8 1.2 0.5 0.8 72.5 - 75.0 1.3 2.0 1.0 1.5 0.9 1.2 0.8 0.9 0.5 0.8 75.0 - 77.5 1.1 1.8 0.8 1.2 0.6 1.0 0.5 0.8 0.5 0.7 77.5 - 80.0 1.0 1.6 0.5 1.0 0.5 0.9 0.4 0.7 0.4 0.5 80.0 - 82.5 0.9 1.4 0.5 0.8 0.5 0.6 0.4 0.5 0.4 0.5 82.5 - 85.0 0.8 1.3 0.5 0.5 0.5 0.5 0.4 0.4 0.3 0.4 85.0 - 87.5 0.7 1.3 0.5 0.5 0.4 0.4 0.3 0.3 0.2 0.2 87.5 - 90.0 0.6 1.2 0.5 0.5 0.4 0.4 0.3 0.3 0.2 0.2 90.0 - 92.5 0.6 0.8 0.5 0.5 0.4 0.4 0.3 0.3 0.2 0.2
Source: Table Vi.6. Models for mortality improvement: Quinquennial gains in Life Expectancy at Birth according to initial level of Life Expectancy (1995. United Nations. World Population Prospects. NewYork: United Nations. 886 p

219
Appendix 24: The demographic transition According to the theory of demographic transition, over time all countries will undergo change from high rates of births and deaths to low rates of births and deaths. This transition process is usually closely associated with economic, social and scientific developments. This is assumed to happen in four distinct stages: Stage 1: High birth rate, high death rate little or no population growth Stage 2: High birth rate, falling death rate high growth Stage 3: Declining birth rate, relatively low death rate slowed growth Stage 4: Low birth rate, low death rate very low growth Historically, high levels of births and deaths kept most populations from growing rapidly through time. In fact, many populations not only failed to grow but also completely died out when birth rates did not compensate for high death rates (stage 1). There are few populations/communities left today at stage 1. Death rates eventually fell as living conditions, nutrition and public health improved. The decline in mortality usually preceded the decline in fertility, resulting in population growth during the transition period (stage 2). In Europe and other industrialised countries, death rates fell slowly. With the added benefit of medical advances, death rates fell more rapidly in the countries that began the transition in the 20th century. These are/were primarily developing countries. Their death rates often fell much faster than in European countries because they benefited from Western inventions and innovations. In general, fertility rates fell neither as quickly nor as dramatically as death rates, and thus populations grew rapidly. Stage 3 is characterized by falling birth rates, which occur for many reasons and vary from country to country and population to population. A decrease in birth rates may result from: a transition from a non-monetary to a monetary economy, urbanization, a change in values from a community emphasis to individualism, increasing emphasis on consumerism, improved education, availability of (modern) family planning methods (i.e. contraceptives), greater involvement of women in the workplace, rising cost of living, rising cost of raising children, and preferences in how people want to spend their time. The demographic transition is regarded as completed when both birth and death rates have reached a low and stable level (stage 4). As a result, population growth is very low. Originally, the theory of demographic transition included only the four stages described above. There is now another stage, the post-transition period (although it is uncertain whether all countries will reach this stage). Post-transition period: Very low birth rate, low death rate negative growth When fertility falls to very low levels and stays there for a protracted period, a slow rate of population growth can turn into a negative one, resulting in a population decrease. Many countries in Europe and some in Asia now have TFRs well below two children per
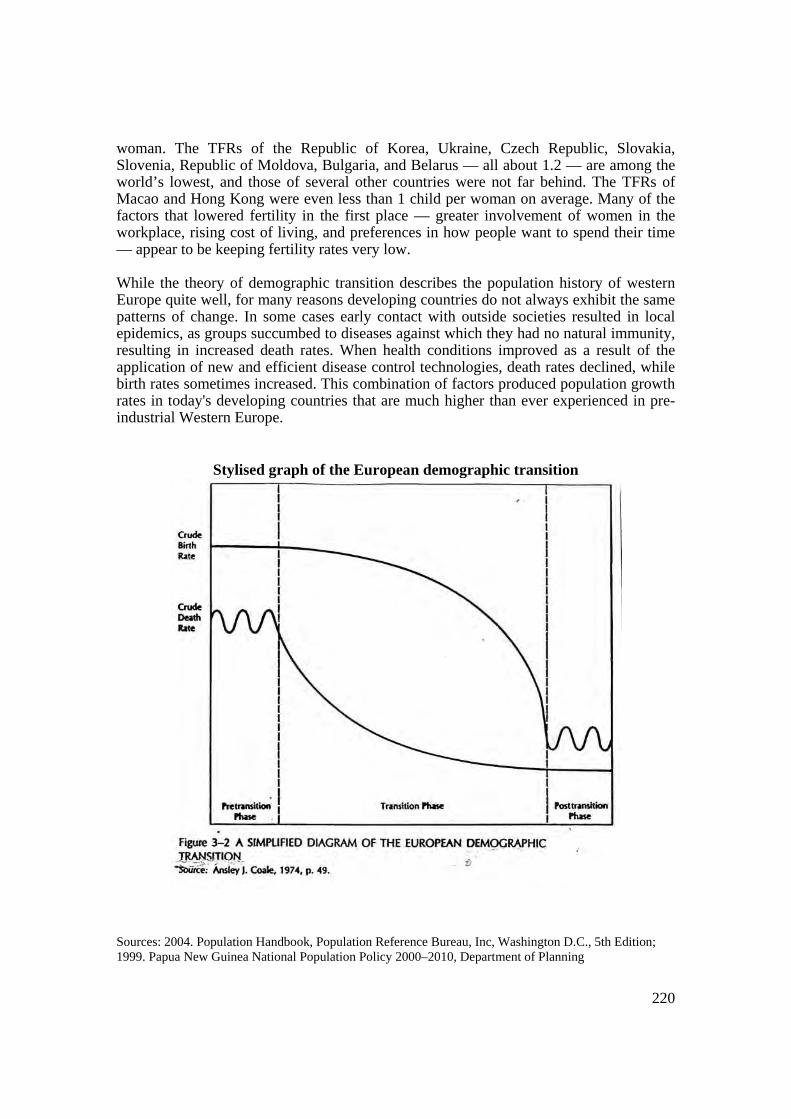
220
woman. The TFRs of the Republic of Korea, Ukraine, Czech Republic, Slovakia, Slovenia, Republic of Moldova, Bulgaria, and Belarus — all about 1.2 — are among the world’s lowest, and those of several other countries were not far behind. The TFRs of Macao and Hong Kong were even less than 1 child per woman on average. Many of the factors that lowered fertility in the first place — greater involvement of women in the workplace, rising cost of living, and preferences in how people want to spend their time — appear to be keeping fertility rates very low. While the theory of demographic transition describes the population history of western Europe quite well, for many reasons developing countries do not always exhibit the same patterns of change. In some cases early contact with outside societies resulted in local epidemics, as groups succumbed to diseases against which they had no natural immunity, resulting in increased death rates. When health conditions improved as a result of the application of new and efficient disease control technologies, death rates declined, while birth rates sometimes increased. This combination of factors produced population growth rates in today's developing countries that are much higher than ever experienced in pre-industrial Western Europe.
Stylised graph of the European demographic transition
Sources: 2004. Population Handbook, Population Reference Bureau, Inc, Washington D.C., 5th Edition; 1999. Papua New Guinea National Population Policy 2000–2010, Department of Planning

221
Appendix 25: Base population for projections for each province, 1 July 2009
Males Females Total Males Females Total Males Females Total0-4 691 695 1,385 3,460 3,170 6,630 2,315 2,233 4,549
5-9 682 633 1,315 3,130 2,864 5,994 2,065 1,989 4,054
10-14 675 579 1,253 2,943 2,655 5,598 2,121 1,909 4,030
15-19 556 503 1,059 2,810 2,775 5,585 1,886 1,637 3,523
20-24 432 439 871 2,368 2,178 4,546 1,279 1,178 2,457
25-29 360 346 706 1,858 1,858 3,716 1,012 1,096 2,107
30-34 265 283 548 1,550 1,613 3,163 899 949 1,847
35-39 284 300 584 1,355 1,382 2,737 898 951 1,849
40-44 207 228 435 1,066 1,117 2,183 732 773 1,505
45-49 145 189 333 987 922 1,909 644 659 1,303
50-54 136 126 262 694 605 1,300 473 504 977
55-59 98 116 214 637 514 1,151 372 477 850
60-64 95 84 180 422 377 799 309 297 606
65-69 73 69 143 397 289 686 292 295 587
70-74 54 35 88 211 128 339 192 182 374
75-79 35 40 74 163 90 254 180 163 343
80+ 48 44 91 143 109 252 208 226 434
Total 4,833 4,709 9,542 24,194 22,648 46,841 15,877 15,518 31,394
Males Females Total Males Females Total Males Females Total0-4 2,637 2,467 5,105 5,221 4,775 9,996 2,826 2,596 5,422
5-9 2,587 2,234 4,821 4,179 3,952 8,131 2,670 2,451 5,121
10-14 2,459 2,167 4,626 4,062 3,683 7,745 2,366 2,068 4,434
15-19 2,049 1,893 3,942 4,949 4,743 9,691 1,597 1,555 3,152
20-24 1,518 1,484 3,002 5,490 4,662 10,152 1,312 1,499 2,811
25-29 1,190 1,379 2,568 3,542 3,304 6,846 1,079 1,239 2,318
30-34 1,109 1,213 2,321 3,021 3,035 6,056 876 1,049 1,925
35-39 994 1,191 2,185 2,619 2,693 5,313 860 922 1,782
40-44 907 1,017 1,924 2,214 2,257 4,471 633 771 1,404
45-49 768 892 1,660 1,904 1,813 3,718 572 661 1,233
50-54 597 648 1,245 1,418 1,276 2,694 436 439 875
55-59 535 601 1,135 1,183 977 2,160 405 394 799
60-64 387 422 809 715 630 1,346 243 301 544
65-69 394 334 729 588 504 1,091 290 267 557
70-74 224 213 437 267 254 521 128 165 293
75-79 216 194 410 223 185 407 115 121 236
80+ 244 231 475 191 226 418 88 79 168
Total 18,816 18,579 37,395 41,786 38,971 80,756 16,495 16,576 33,071
Age group
Age group
TORBA SANMA PENAMA
MALAMPA SHEFA TAFEA

222
Appendix 26: UN migration model: Family migration
Source: UN Population Division, New York, USA
25 20 15 10 5 0 5 10 15 20 25
0- 4
5- 9
10-14
15-19
20-24
25-29
30-34
35-39
40-44
45-49
50-54
55-59
60-64
65-69
70-74
75+
%
Age
gro
up
VANUATU
Males Females

223
Appendix 27:
Age and sex structure for Vanuatu and each province:
1999 and 2009

224
VANUATU
Population trend: 1967–2009
Population pyramid by five-year age group and sex, 1999 and 2009
78
111
142
187
234
0
50
100
150
200
250
1967 1979 1989 1999 2009
Nu
mb
er o
f peo
ple
Th
ou
san
ds
Census year
20,000 16,000 12,000 8,000 4,000 0 4,000 8,000 12,000 16,000 20,000
0- 4
5- 9
10-14
15-19
20-24
25-29
30-34
35-39
40-44
45-49
50-54
55-59
60-64
65-69
70-74
75-79
80+
Number of people
Age
gro
up
Males Females
1999 (shaded area) & 2009 (outlined)

225
Age Males Females Total Age Males Females Total
0-4 14,581 13,484 28,065 0-4 17,310 16,057 33,3675-9 14,086 13,283 27,369 5-9 15,455 14,230 29,685
10-14 12,670 11,629 24,299 10-14 14,762 13,159 27,92115-19 9,136 8,666 17,802 15-19 12,027 11,855 23,88220-24 8,027 8,386 16,413 20-24 10,415 11,126 21,54125-29 7,303 7,627 14,930 25-29 9,124 9,291 18,41530-34 6,295 6,397 12,692 30-34 7,790 7,903 15,69335-39 5,438 5,429 10,868 35-39 7,076 7,095 14,17140-44 4,198 3,998 8,195 40-44 5,814 5,709 11,52345-49 3,639 3,373 7,012 45-49 5,066 5,175 10,24150-54 2,785 2,550 5,335 50-54 3,789 3,626 7,41555-59 2,328 1,962 4,290 55-59 3,261 3,102 6,36360-64 1,597 1,428 3,025 60-64 2,192 2,127 4,31965-69 1,373 1,053 2,426 65-69 2,054 1,772 3,82670-74 793 638 1,431 70-74 1,085 983 2,06875-79 624 493 1,117 75-79 941 799 1,740
80+ 809 600 1,409 80+ 930 923 1,853 Total 95,682 90,996 186,678 Total 119,091 114,932 234,023
0-14 41,337 38,397 79,734 0-14 47,527 43,446 90,97315-24 17,163 17,051 34,215 15-24 22,442 22,981 45,42325-59 31,987 31,336 63,323 25-59 41,920 41,901 83,82125-64 33,583 32,764 66,348 25-64 44,112 44,028 88,140
60+ 5,195 4,212 9,407 60+ 7,202 6,604 13,80665+ 3,599 2,783 6,382 65+ 5,010 4,477 9,487
0-14 43 42 43 0-14 40 38 3915-24 18 19 18 15-24 19 20 1925-59 33 34 34 25-59 35 36 3625-64 35 36 36 25-64 37 38 38
60+ 5 5 5 60+ 6 6 665+ 4 3 3 65+ 4 4 4
15-59 91 15-59 8115-64 86 15-64 75
105 104
Total 18.6 19.1 18.8 Total 20.0 21.0 20.5
Males Females Total Total difference 23,409 23,936 47,345 Average annual change (in numbers) 2,341 2,394 4,735 Percentage difference (%) 24.5 26.3 25.4 Average annual growth rate (%) 2.19 2.34 2.26
1999
VANUATU2009
Population by 5-year age groups and sex
Population by broad age groups (in numbers)
Population change 1999-2009
Population by broad age groups (in percentages)
Age dependency ratio
Sex ratio (males per 100 females)
Median age (years)

226
TORBA
Population trend: 1967–2009
Population pyramid by five-year age group and sex, 1999 and 2009
3 5 6 8 9 0
10
20
30
40
50
60
70
80
90
100
1967 1979 1989 1999 2009
Nu
mb
er o
f peo
ple
Th
ou
san
ds
Census year
1,000 800 600 400 200 0 200 400 600 800 1,000
0- 4
5- 9
10-14
15-19
20-24
25-29
30-34
35-39
40-44
45-49
50-54
55-59
60-64
65-69
70-74
75-79
80+
Number of people
Age
gro
up
Males Females
1999 (shaded area) & 2009 (outlined)

227
Age Males Females Total Age Males Females Total
0-4 665 604 1,268 0-4 697 700 1,3975-9 663 599 1,261 5-9 688 638 1,326
10-14 561 532 1,094 10-14 681 583 1,26415-19 377 340 717 15-19 483 455 93820-24 270 347 617 20-24 363 427 79025-29 292 296 588 25-29 363 349 71230-34 222 250 472 30-34 267 275 54235-39 177 179 356 35-39 287 286 57340-44 152 130 282 40-44 209 211 42045-49 120 149 269 45-49 146 190 33650-54 107 112 220 50-54 137 127 26455-59 95 68 164 55-59 99 117 21660-64 79 57 136 60-64 96 85 18165-69 66 59 125 65-69 74 70 14470-74 41 40 81 70-74 54 35 8975-79 26 26 52 75-79 35 40 75
80+ 23 31 54 80+ 48 44 92 Total 3,937 3,820 7,757 Total 4,727 4,632 9,359
0-14 1,889 1,735 3,624 0-14 2,066 1,921 3,98715-24 647 687 1,334 15-24 846 882 1,72825-59 1,165 1,185 2,350 25-59 1,508 1,555 3,06325-64 1,244 1,242 2,487 25-64 1,604 1,640 3,244
60+ 236 214 450 60+ 307 274 58165+ 157 156 313 65+ 211 189 400
0-14 48 45 47 0-14 44 41 4315-24 16 18 17 15-24 18 19 1825-59 30 31 30 25-59 32 34 3325-64 32 33 32 25-64 34 35 35
60+ 6 6 6 60+ 6 6 665+ 4 4 4 65+ 4 4 4
15-59 111 15-59 9515-64 103 15-64 88
103 102
Total 16.1 17.6 16.8 Total 18.1 19.3 18.7
Males Females Total Total difference 790 812 1,602 Average annual change (in numbers) 79 81 160 Percentage difference (%) 20.1 21.3 20.7 Average annual growth rate (%) 1.8 1.9 1.9
Population by broad age groups (in percentages)
Age dependency ratio
Sex ratio (males per 100 females)
Median age (years)
Population change 1999-2009
Population by broad age groups (in numbers)
1999
TORBA2009
Population by 5-year age groups and sex

228
SANMA
Population trend: 1967–2009
Population pyramid by five-year age group and sex, 1999 and 2009
13 19
26
36
46
0
10
20
30
40
50
60
70
80
90
100
1967 1979 1989 1999 2009
Nu
mb
er o
f peo
ple
Th
ou
san
ds
Census year
4,000 3,200 2,400 1,600 800 0 800 1,600 2,400 3,200 4,000
0- 4
5- 9
10-14
15-19
20-24
25-29
30-34
35-39
40-44
45-49
50-54
55-59
60-64
65-69
70-74
75-79
80+
Number of people
Age
gro
up
Males Females
1999 (shaded area) & 2009 (outlined)

229
Age Males Females Total Age Males Females Total
0-4 2,891 2,710 5,602 0-4 3,492 3,194 6,6865-9 2,755 2,688 5,443 5-9 3,159 2,886 6,045
10-14 2,495 2,238 4,733 10-14 2,970 2,675 5,64515-19 1,934 1,821 3,755 15-19 2,441 2,510 4,95120-24 1,571 1,645 3,216 20-24 1,989 2,118 4,10725-29 1,419 1,473 2,891 25-29 1,875 1,872 3,74730-34 1,256 1,274 2,529 30-34 1,564 1,566 3,13035-39 1,119 1,001 2,120 35-39 1,368 1,318 2,68640-44 790 729 1,519 40-44 1,076 1,035 2,11145-49 695 594 1,289 45-49 996 929 1,92550-54 539 417 956 50-54 701 610 1,31155-59 409 293 702 55-59 643 518 1,16160-64 262 215 476 60-64 426 380 80665-69 216 136 352 65-69 401 291 69270-74 128 75 204 70-74 213 129 34275-79 87 43 129 75-79 165 91 256
80+ 110 57 168 80+ 144 110 254 Total 18,676 17,408 36,084 Total 23,623 22,232 45,855
0-14 8,141 7,636 15,777 0-14 9,621 8,755 18,37615-24 3,505 3,466 6,971 15-24 4,430 4,628 9,05825-59 6,227 5,780 12,007 25-59 8,223 7,848 16,07125-64 6,488 5,995 12,483 25-64 8,649 8,228 16,877
60+ 803 526 1,329 60+ 1,349 1,001 2,35065+ 541 311 853 65+ 923 621 1,544
0-14 44 44 44 0-14 41 39 4015-24 19 20 19 15-24 19 21 2025-59 33 33 33 25-59 35 35 3525-64 35 34 35 25-64 37 37 37
60+ 4 3 4 60+ 6 5 565+ 3 2 2 65+ 4 3 3
15-59 90 15-59 8215-64 85 15-64 77
107 106
Total 18.1 17.9 18.0 Total 19.5 19.7 19.6
Males Females Total Total difference 4,947 4,824 9,771 Average annual change (in numbers) 495 482 977 Percentage difference (%) 26.5 27.7 27.1 Average annual growth rate (%) 2.3 2.4 2.4
Population by broad age groups (in percentages)
Age dependency ratio
Sex ratio (males per 100 females)
Median age (years)
Population change 1999-2009
Population by broad age groups (in numbers)
1999
SANMA2009
Population by 5-year age groups and sex

230
PENAMA
Population trend: 1967–2009
Population pyramid by five-year age group and sex, 1999 and 2009
14 19 22
27 31
0
10
20
30
40
50
60
70
80
90
100
1967 1979 1989 1999 2009
Nu
mb
er o
f peo
ple
Th
ou
san
ds
Census year
3,000 2,400 1,800 1,200 600 0 600 1,200 1,800 2,400 3,000
0- 4
5- 9
10-14
15-19
20-24
25-29
30-34
35-39
40-44
45-49
50-54
55-59
60-64
65-69
70-74
75-79
80+
Number of people
Age
gro
up
Males Females
1999 (shaded area) & 2009 (outlined)

231
Age Males Females Total Age Males Females Total
0-4 2,090 1,957 4,047 0-4 2,337 2,250 4,5875-9 2,097 1,854 3,952 5-9 2,084 2,004 4,088
10-14 1,859 1,667 3,526 10-14 2,141 1,923 4,06415-19 1,350 1,248 2,599 15-19 1,638 1,481 3,11920-24 1,033 1,062 2,095 20-24 1,074 1,146 2,22025-29 988 956 1,944 25-29 1,021 1,104 2,12530-34 844 837 1,680 30-34 907 921 1,82835-39 738 712 1,449 35-39 906 907 1,81340-44 545 577 1,122 40-44 739 716 1,45545-49 473 492 965 45-49 650 664 1,31450-54 378 415 793 50-54 477 508 98555-59 353 336 689 55-59 376 481 85760-64 255 241 496 60-64 312 299 61165-69 254 188 442 65-69 295 297 59270-74 149 118 267 70-74 194 183 37775-79 110 92 201 75-79 182 164 346
80+ 209 170 379 80+ 210 228 438 Total 13,724 12,922 26,646 Total 15,543 15,276 30,819
0-14 6,047 5,478 11,525 0-14 6,562 6,177 12,73915-24 2,383 2,310 4,694 15-24 2,712 2,627 5,33925-59 4,317 4,325 8,642 25-59 5,076 5,301 10,37725-64 4,572 4,565 9,138 25-64 5,388 5,600 10,988
60+ 977 808 1,785 60+ 1,193 1,171 2,36465+ 722 568 1,289 65+ 881 872 1,753
0-14 44 42 43 0-14 42 40 4115-24 17 18 18 15-24 17 17 1725-59 31 33 32 25-59 33 35 3425-64 33 35 34 25-64 35 37 36
60+ 7 6 7 60+ 8 8 865+ 5 4 5 65+ 6 6 6
15-59 100 15-59 9615-64 93 15-64 89
106 102
Total 18.0 18.9 18.5 Total 18.7 19.9 19.3
Males Females Total Total difference 1,819 2,354 4,173 Average annual change (in numbers) 182 235 417 Percentage difference (%) 13.3 18.2 15.7 Average annual growth rate (%) 1.2 1.7 1.5
Population by broad age groups (in percentages)
Age dependency ratio
Sex ratio (males per 100 females)
Median age (years)
Population change 1999-2009
Population by broad age groups (in numbers)
1999
PENAMA2009
Population by 5-year age groups and sex

232
MALAMPA
Population trend: 1967–2009
Population pyramid by five-year age group and sex, 1999 and 2009
17 24
28 33
37
0
10
20
30
40
50
60
70
80
90
100
1967 1979 1989 1999 2009
Nu
mb
er o
f peo
ple
Th
ou
san
ds
Census year
4,000 3,200 2,400 1,600 800 0 800 1,600 2,400 3,200 4,000
0- 4
5- 9
10-14
15-19
20-24
25-29
30-34
35-39
40-44
45-49
50-54
55-59
60-64
65-69
70-74
75-79
80+
Number of people
Age
gro
up
Males Females
1999 (shaded area) & 2009 (outlined)

233
Age Males Females Total Age Males Females Total
0-4 2,466 2,174 4,640 0-4 2,662 2,486 5,1485-9 2,414 2,338 4,751 5-9 2,611 2,251 4,862
10-14 2,330 2,174 4,504 10-14 2,482 2,183 4,66515-19 1,653 1,516 3,169 15-19 1,780 1,712 3,49220-24 1,291 1,348 2,638 20-24 1,275 1,443 2,71825-29 1,047 1,238 2,285 25-29 1,201 1,389 2,59030-34 1,019 1,056 2,075 30-34 1,119 1,177 2,29635-39 884 968 1,851 35-39 1,003 1,136 2,13940-44 722 771 1,493 40-44 916 942 1,85845-49 615 636 1,251 45-49 775 899 1,67450-54 538 513 1,051 50-54 603 653 1,25655-59 468 366 834 55-59 540 605 1,14560-64 333 306 639 60-64 391 425 81665-69 315 252 568 65-69 398 337 73570-74 186 147 333 70-74 226 214 44075-79 154 107 261 75-79 218 196 414
80+ 218 144 362 80+ 246 233 479 Total 16,653 16,052 32,705 Total 18,446 18,281 36,727
0-14 7,211 6,685 13,895 0-14 7,755 6,920 14,67515-24 2,943 2,864 5,807 15-24 3,055 3,155 6,21025-59 5,292 5,548 10,840 25-59 6,157 6,801 12,95825-64 5,625 5,854 11,479 25-64 6,548 7,226 13,774
60+ 1,207 956 2,163 60+ 1,479 1,405 2,88465+ 874 650 1,524 65+ 1,088 980 2,068
0-14 43 42 42 0-14 42 38 4015-24 18 18 18 15-24 17 17 1725-59 32 35 33 25-59 33 37 3525-64 34 36 35 25-64 35 40 38
60+ 7 6 7 60+ 8 8 865+ 5 4 5 65+ 6 5 6
15-59 96 15-59 9215-64 89 15-64 84
104 101
Total 18.4 19.4 18.9 Total 19.1 21.8 20.4
Males Females Total Total difference 1,793 2,229 4,022 Average annual change (in numbers) 179 223 402 Percentage difference (%) 10.8 13.9 12.3 Average annual growth rate (%) 1.0 1.3 1.2
Population by broad age groups (in percentages)
Age dependency ratio
Sex ratio (males per 100 females)
Median age (years)
Population change 1999-2009
Population by broad age groups (in numbers)
1999
MALAMPA2009
Population by 5-year age groups and sex
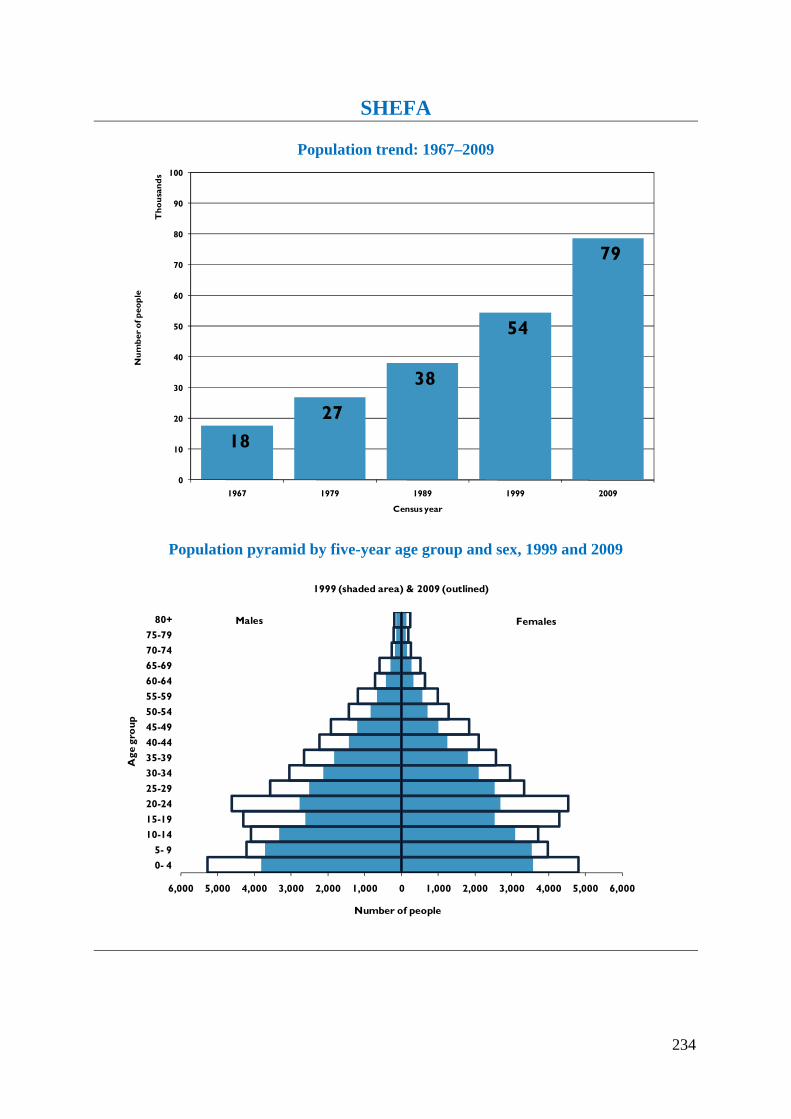
234
SHEFA
Population trend: 1967–2009
Population pyramid by five-year age group and sex, 1999 and 2009
18
27
38
54
79
0
10
20
30
40
50
60
70
80
90
100
1967 1979 1989 1999 2009
Nu
mb
er o
f peo
ple
Th
ou
san
ds
Census year
6,000 5,000 4,000 3,000 2,000 1,000 0 1,000 2,000 3,000 4,000 5,000 6,000
0- 4
5- 9
10-14
15-19
20-24
25-29
30-34
35-39
40-44
45-49
50-54
55-59
60-64
65-69
70-74
75-79
80+
Number of people
Age
gro
up
Males Females
1999 (shaded area) & 2009 (outlined)

235
Age Males Females Total Age Males Females Total
0-4 3,813 3,571 7,384 0-4 5,270 4,811 10,0815-9 3,720 3,537 7,257 5-9 4,218 3,982 8,200
10-14 3,335 3,092 6,427 10-14 4,100 3,711 7,81115-19 2,610 2,535 5,145 15-19 4,298 4,290 8,58820-24 2,780 2,687 5,467 20-24 4,612 4,534 9,14625-29 2,519 2,528 5,047 25-29 3,575 3,329 6,90430-34 2,127 2,097 4,224 30-34 3,049 2,946 5,99535-39 1,838 1,794 3,632 35-39 2,644 2,569 5,21340-44 1,440 1,247 2,687 40-44 2,235 2,091 4,32645-49 1,211 996 2,207 45-49 1,922 1,827 3,74950-54 851 700 1,551 50-54 1,431 1,286 2,71755-59 675 558 1,233 55-59 1,194 984 2,17860-64 419 323 743 60-64 722 635 1,35765-69 309 265 574 65-69 593 508 1,10170-74 178 149 327 70-74 269 256 52575-79 148 116 264 75-79 225 186 411
80+ 147 125 271 80+ 193 228 421 Total 28,119 26,320 54,439 Total 40,550 38,173 78,723
0-14 10,868 10,201 21,069 0-14 13,588 12,504 26,09215-24 5,390 5,222 10,611 15-24 8,910 8,824 17,73425-59 10,661 9,919 20,580 25-59 16,050 15,032 31,08225-64 11,080 10,243 21,323 25-64 16,772 15,667 32,439
60+ 1,200 978 2,179 60+ 2,002 1,813 3,81565+ 781 655 1,436 65+ 1,280 1,178 2,458
0-14 39 39 39 0-14 34 33 3315-24 19 20 19 15-24 22 23 2325-59 38 38 38 25-59 40 39 3925-64 39 39 39 25-64 41 41 41
60+ 4 4 4 60+ 5 5 565+ 3 2 3 65+ 3 3 3
15-59 75 15-59 6115-64 70 15-64 57
107 106
Total 21.0 20.8 20.9 Total 22.6 22.5 22.6
Males Females Total Total difference 12,431 11,853 24,284 Average annual change (in numbers) 1,243 1,185 2,428 Percentage difference (%) 44.2 45.0 44.6 Average annual growth rate (%) 3.7 3.7 3.7
Population by broad age groups (in percentages)
Age dependency ratio
Sex ratio (males per 100 females)
Median age (years)
Population change 1999-2009
Population by broad age groups (in numbers)
1999
SHEFA2009
Population by 5-year age groups and sex

236
TAFEA
Population trend: 1967–2009
Population pyramid by five-year age group and sex, 1999 and 2009
12 18
22 29 33
0
10
20
30
40
50
60
70
80
90
100
1967 1979 1989 1999 2009
Nu
mb
er o
f peo
ple
Th
ou
san
ds
Census year
4,000 3,000 2,000 1,000 0 1,000 2,000 3,000 4,000
0- 4
5- 9
10-14
15-19
20-24
25-29
30-34
35-39
40-44
45-49
50-54
55-59
60-64
65-69
70-74
75-79
80+
Number of people
Age
gro
up
Males Females
1999 (shaded area) & 2009 (outlined)

237
Age Males Females Total Age Males Females Total
0-4 2,655 2,469 5,124 0-4 2,852 2,616 5,4685-9 2,437 2,267 4,705 5-9 2,695 2,469 5,164
10-14 2,089 1,926 4,015 10-14 2,388 2,084 4,47215-19 1,213 1,206 2,418 15-19 1,387 1,407 2,79420-24 1,082 1,297 2,379 20-24 1,102 1,458 2,56025-29 1,039 1,136 2,175 25-29 1,089 1,248 2,33730-34 828 884 1,712 30-34 884 1,018 1,90235-39 683 776 1,459 35-39 868 879 1,74740-44 548 543 1,092 40-44 639 714 1,35345-49 526 506 1,032 45-49 577 666 1,24350-54 371 393 765 50-54 440 442 88255-59 329 340 669 55-59 409 397 80660-64 248 287 535 60-64 245 303 54865-69 212 152 365 65-69 293 269 56270-74 111 108 219 70-74 129 166 29575-79 99 110 209 75-79 116 122 238
80+ 102 73 175 80+ 89 80 169 Total 14,573 14,474 29,047 Total 16,202 16,338 32,540
0-14 7,181 6,662 13,843 0-14 7,935 7,169 15,10415-24 2,295 2,503 4,798 15-24 2,489 2,865 5,35425-59 4,325 4,579 8,904 25-59 4,906 5,364 10,27025-64 4,573 4,865 9,438 25-64 5,151 5,667 10,818
60+ 772 730 1,502 60+ 872 940 1,81265+ 524 443 968 65+ 627 637 1,264
0-14 49 46 48 0-14 49 44 4615-24 16 17 17 15-24 15 18 1625-59 30 32 31 25-59 30 33 3225-64 31 34 32 25-64 32 35 33
60+ 5 5 5 60+ 5 6 665+ 4 3 3 65+ 4 4 4
15-59 112 15-59 10815-64 104 15-64 101
101 99
Total 15.4 17.4 16.4 Total 15.6 18.6 17.1
Males Females Total Total difference 1,629 1,864 3,493 Average annual change (in numbers) 163 186 349 Percentage difference (%) 11.2 12.9 12.0 Average annual growth rate (%) 1.1 1.2 1.1
Population by broad age groups (in percentages)
Age dependency ratio
Sex ratio (males per 100 females)
Median age (years)
Population change 1999-2009
Population by broad age groups (in numbers)
1999
TAFEA2009
Population by 5-year age groups and sex