Quantification of the Organic Acids in Hawthorn Wine - MDPI
14
molecules Article Quantification of the Organic Acids in Hawthorn Wine: A Comparison of Two HPLC Methods Yingying Han, Jinhua Du * , Jie Li and Miaomiao Li College of Food Science and Engineering, Shandong Agricultural University, Tai’an 271018, China; [email protected] (Y.H.); [email protected] (J.L.); [email protected] (M.L.) * Correspondence: [email protected]; Tel.: +86-538-8249157 Received: 5 May 2019; Accepted: 6 June 2019; Published: 7 June 2019 Abstract: Hawthorn wine is rich in anthocyanins, polyphenols, flavonoids and other macromolecular substances, which results in difficulty to rapidly determine organic acids in the wine. An enzymatic method is accurate but expensive and not able to quantify all of the organic acids simultaneously. Therefore, in this study, two HPLC methods were applied to quantify the organic acids in the wine with the enzymatic method as a reference. Seven organic acids were found with the enzymatic method including citric, succinic, l-malic, acetic, lactic, pyruvic, and fumaric acids, in which citric and succinic acid accounted for more than 80% of the total acids. By an 87H column equipped with DAD (diode array) detector at 215 nm (HPLC method 1), only citric and lactic acids were quantified accurately and the elution period was shortened from 100 min to 20 min by removing the impurity in the sample with a LC-18 SPE(solid-phase extraction) tube. While citric, succinic, l-malic, acetic, pyruvic, and fumaric acids were quantified reliably by a dC18 column equipped with DAD detector at 210 nm (HPLC method 2), with the sample requires only dilution and filtration before injection. It was suggested that HPLC method 2 was an effective method to quantify the organic acids in hawthorn wine. The method provides a choice for accurate quantification of organic acids in hawthorn wine or other drinks, and would be helpful for controlling the quality of hawthorn wine. Keywords: hawthorn wine; organic acids; high-performance liquid chromatography methods; enzymatic method 1. Introduction Hawthorn mostly grows around the temperate region of the world. Its fruits play an important role in promoting digestion [1], reducing blood tension [2], resisting oxidation [3], preventing cardiovascular diseases [4,5] and type II diabetes [6]. Although hawthorn has many functions for human health, strong acid-sensing makes it not widely suitable to be eaten raw. The total acidity of fresh hawthorn fruits is as much as 11.8 g/100 g dry weight [7]. To meet the challenge, the hawthorn is widely used to ferment wine. Nowadays, hawthorn wine is very popular in China for not only its natural nutrients but also its unique flavor. Additionally, the profile and concentration of organic acids are important parameters in relation to the characteristics and flavor of hawthorn wine owing to their unique flavor and influence on taste balance, chemical and microbial stability [8]. As is known, appropriate amount of organic acids can give hawthorn wine a fresh taste and appropriate sweet-sour balance; while a tart taste will appear if they are excessive. Therefore, quantification of organic acids plays an important role in controlling the quality of hawthorn wine. Up to now, the studies of hawthorn wine have been mainly focused on screening the optimal yeast for fermentation [9], analyzing the content of phenolic substances and their antioxidant properties during storage or fermentation using different yeasts [10–12] and the methods to reduce methanol content [13]. However, the analysis of organic acids in hawthorn wine was rarely reported. Molecules 2019, 24, 2150; doi:10.3390/molecules24112150 www.mdpi.com/journal/molecules
-
Upload
khangminh22 -
Category
Documents
-
view
1 -
download
0
Transcript of Quantification of the Organic Acids in Hawthorn Wine - MDPI
molecules
Article
Quantification of the Organic Acids in HawthornWine: A Comparison of Two HPLC Methods
Yingying Han, Jinhua Du * , Jie Li and Miaomiao Li
College of Food Science and Engineering, Shandong Agricultural University, Tai’an 271018, China;[email protected] (Y.H.); [email protected] (J.L.); [email protected] (M.L.)* Correspondence: [email protected]; Tel.: +86-538-8249157
Received: 5 May 2019; Accepted: 6 June 2019; Published: 7 June 2019�����������������
Abstract: Hawthorn wine is rich in anthocyanins, polyphenols, flavonoids and other macromolecularsubstances, which results in difficulty to rapidly determine organic acids in the wine. An enzymaticmethod is accurate but expensive and not able to quantify all of the organic acids simultaneously.Therefore, in this study, two HPLC methods were applied to quantify the organic acids in the winewith the enzymatic method as a reference. Seven organic acids were found with the enzymaticmethod including citric, succinic, l-malic, acetic, lactic, pyruvic, and fumaric acids, in which citricand succinic acid accounted for more than 80% of the total acids. By an 87H column equipped withDAD (diode array) detector at 215 nm (HPLC method 1), only citric and lactic acids were quantifiedaccurately and the elution period was shortened from 100 min to 20 min by removing the impurityin the sample with a LC-18 SPE(solid-phase extraction) tube. While citric, succinic, l-malic, acetic,pyruvic, and fumaric acids were quantified reliably by a dC18 column equipped with DAD detector at210 nm (HPLC method 2), with the sample requires only dilution and filtration before injection. It wassuggested that HPLC method 2 was an effective method to quantify the organic acids in hawthornwine. The method provides a choice for accurate quantification of organic acids in hawthorn wine orother drinks, and would be helpful for controlling the quality of hawthorn wine.
Keywords: hawthorn wine; organic acids; high-performance liquid chromatography methods;enzymatic method
1. Introduction
Hawthorn mostly grows around the temperate region of the world. Its fruits play an important rolein promoting digestion [1], reducing blood tension [2], resisting oxidation [3], preventing cardiovasculardiseases [4,5] and type II diabetes [6]. Although hawthorn has many functions for human health,strong acid-sensing makes it not widely suitable to be eaten raw. The total acidity of fresh hawthornfruits is as much as 11.8 g/100 g dry weight [7]. To meet the challenge, the hawthorn is widely used toferment wine. Nowadays, hawthorn wine is very popular in China for not only its natural nutrientsbut also its unique flavor. Additionally, the profile and concentration of organic acids are importantparameters in relation to the characteristics and flavor of hawthorn wine owing to their unique flavorand influence on taste balance, chemical and microbial stability [8]. As is known, appropriate amountof organic acids can give hawthorn wine a fresh taste and appropriate sweet-sour balance; while a tarttaste will appear if they are excessive. Therefore, quantification of organic acids plays an importantrole in controlling the quality of hawthorn wine. Up to now, the studies of hawthorn wine havebeen mainly focused on screening the optimal yeast for fermentation [9], analyzing the content ofphenolic substances and their antioxidant properties during storage or fermentation using differentyeasts [10–12] and the methods to reduce methanol content [13]. However, the analysis of organicacids in hawthorn wine was rarely reported.
Molecules 2019, 24, 2150; doi:10.3390/molecules24112150 www.mdpi.com/journal/molecules
Molecules 2019, 24, 2150 2 of 14
The main methods reported to evaluate organic acids in fruits, juice and wine are the enzymaticmethod [14–16], capillary electrophoresis [17,18], gas chromatography [19], liquid chromatography [20]and ion chromatography [21]. The enzymatic method is highly specific and many commercial kits areavailable for determining certain organic acids, such as citric acid, succinic acid, l-malic acid, aceticacid, lactic acid, pyruvic acid and fumaric acid. However, these kits are expensive, time consumingand cannot be used to quantify all of the organic acids in the samples simultaneously. Better separationcan be obtained with ion chromatography and gas chromatography, but they were hard to use widelybecause of the high consumption, harsh operating conditions, as well as the tedious pretreatment.Capillary electrophoresis presents not only advantages including high resolution, simplicity andshort analysis times, but also disadvantages, such as lower reproducibility. High performance liquidchromatography (HPLC) is the most popular method for analyzing organic acids because of thesimplicity, speed and stability. The C18 column, as a common HPLC column, was used for separatingorganic acids frequently by phosphate solution as mobile phase [22,23]. Additionally, ion exchangecolumn such as HPX-87H has been used to separate organic acids because it can separate sugars andacids simultaneously [20,24].
Based on our previous research, hawthorn wine is rich in anthocyanins, polyphenols andflavonoids [10] and other macromolecular substances such as pectin [13], which results in problemsto rapidly determine organic acids in the wine. Organic acids separated with HPLC are usuallydetected with ultraviolet detector (UV) at wavelengths below 220 nm where the carboxyl groups havean absorption band [25]. However, coexisting substances can interfere with organic acids in the lowwavelength range especially those with conjugate double bonds, such as phenols which still havestrong UV absorption even at low concentrations. Therefore, ten hawthorn wines were fermented bywine yeast. Two HPLC methods were compared to quantify organic acids in the wines, with enzymaticmethod working as a reference method. By the enzymatic method seven organic acids was quantifiedincluding citric, succinic, l-malic, acetic, lactic, pyruvic, and fumaric acids, respectively. Two HPLCmethods applied were an 87H column equipped with a DAD detector at 215 nm (method 1) and a dC18column equipped with a DAD detector at 210 nm (method 2). This study is aiming to quantify organicacids in hawthorn wine accurately, rapidly and simultaneously, and control the quality of hawthornwine by monitoring the organic acids. The varietal characteristics, processing conditions, microbialcontamination of hawthorn wine and ripeness levels of the hawthorn fruits can be understood bymonitoring the organic acids content.
2. Results and Discussion
2.1. Physicochemical Analysis of Hawthorn Wine
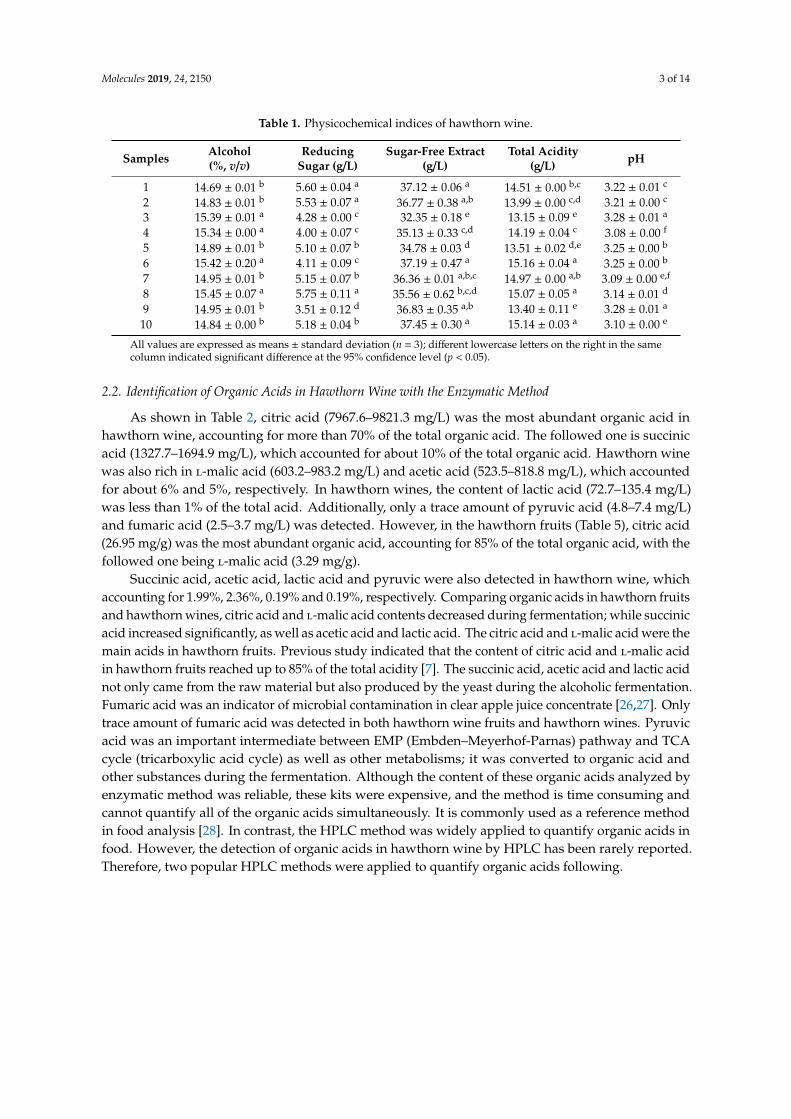
The physicochemical indexes of the ten hawthorn wines were shown in Table 1. The alcoholcontent varied from 14.69% to 15.45% by volume; residual sugar content was 3.51–5.75 g/L; sugar-freeextract was 32.35–37.45 g/L, and pH value ranged from 3.08 to 3.28. It was found that the total aciditywas relatively high and range from 13.15 g/L to 15.16 g/L. Appropriate acidity gives the wine a freshtaste and benefits the microbial stability of the wine while excessive acidity will give the wine atart taste. Therefore, accurate and rapid quantification of organic acids plays an important role inmaintaining a well balance of sugar and acid and controlling the quality of hawthorn wine.
Molecules 2019, 24, 2150 3 of 14
Table 1. Physicochemical indices of hawthorn wine.
Samples Alcohol(%, v/v)
ReducingSugar (g/L)
Sugar-Free Extract(g/L)
Total Acidity(g/L) pH
1 14.69 ± 0.01 b 5.60 ± 0.04 a 37.12 ± 0.06 a 14.51 ± 0.00 b,c 3.22 ± 0.01 c
2 14.83 ± 0.01 b 5.53 ± 0.07 a 36.77 ± 0.38 a,b 13.99 ± 0.00 c,d 3.21 ± 0.00 c
3 15.39 ± 0.01 a 4.28 ± 0.00 c 32.35 ± 0.18 e 13.15 ± 0.09 e 3.28 ± 0.01 a
4 15.34 ± 0.00 a 4.00 ± 0.07 c 35.13 ± 0.33 c,d 14.19 ± 0.04 c 3.08 ± 0.00 f
5 14.89 ± 0.01 b 5.10 ± 0.07 b 34.78 ± 0.03 d 13.51 ± 0.02 d,e 3.25 ± 0.00 b
6 15.42 ± 0.20 a 4.11 ± 0.09 c 37.19 ± 0.47 a 15.16 ± 0.04 a 3.25 ± 0.00 b
7 14.95 ± 0.01 b 5.15 ± 0.07 b 36.36 ± 0.01 a,b,c 14.97 ± 0.00 a,b 3.09 ± 0.00 e,f
8 15.45 ± 0.07 a 5.75 ± 0.11 a 35.56 ± 0.62 b,c,d 15.07 ± 0.05 a 3.14 ± 0.01 d
9 14.95 ± 0.01 b 3.51 ± 0.12 d 36.83 ± 0.35 a,b 13.40 ± 0.11 e 3.28 ± 0.01 a
10 14.84 ± 0.00 b 5.18 ± 0.04 b 37.45 ± 0.30 a 15.14 ± 0.03 a 3.10 ± 0.00 e
All values are expressed as means ± standard deviation (n = 3); different lowercase letters on the right in the samecolumn indicated significant difference at the 95% confidence level (p < 0.05).
2.2. Identification of Organic Acids in Hawthorn Wine with the Enzymatic Method
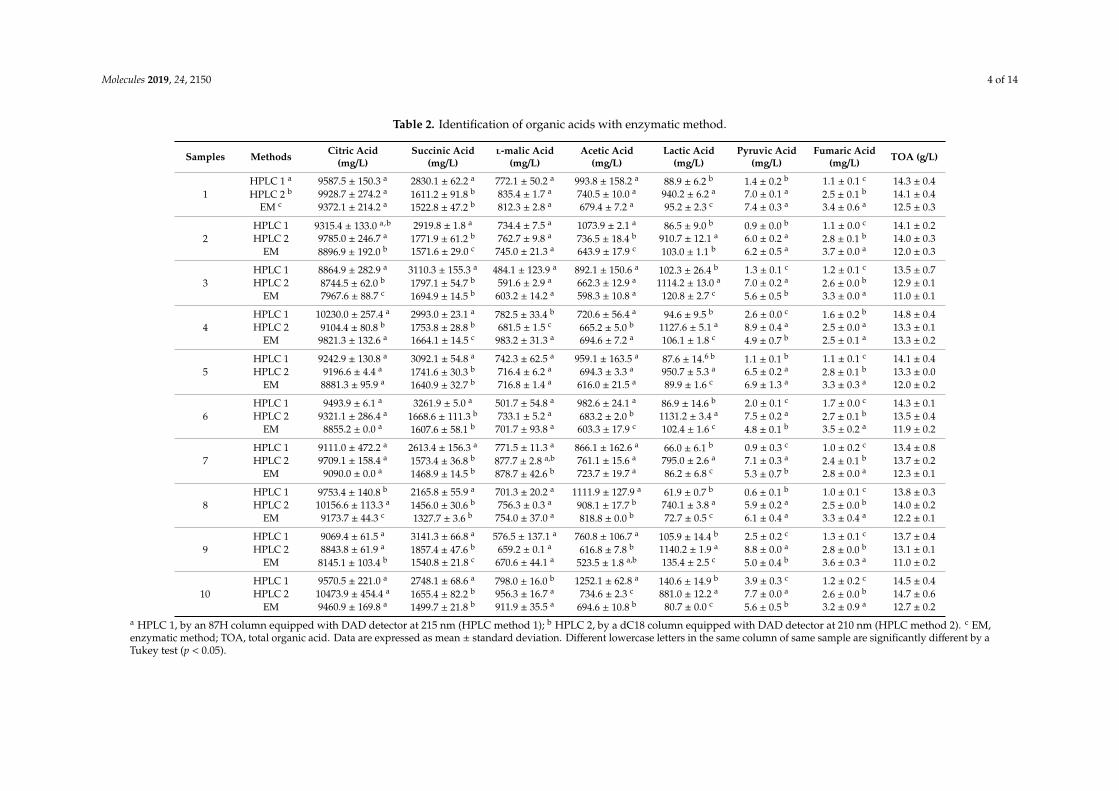
As shown in Table 2, citric acid (7967.6–9821.3 mg/L) was the most abundant organic acid inhawthorn wine, accounting for more than 70% of the total organic acid. The followed one is succinicacid (1327.7–1694.9 mg/L), which accounted for about 10% of the total organic acid. Hawthorn winewas also rich in l-malic acid (603.2–983.2 mg/L) and acetic acid (523.5–818.8 mg/L), which accountedfor about 6% and 5%, respectively. In hawthorn wines, the content of lactic acid (72.7–135.4 mg/L)was less than 1% of the total acid. Additionally, only a trace amount of pyruvic acid (4.8–7.4 mg/L)and fumaric acid (2.5–3.7 mg/L) was detected. However, in the hawthorn fruits (Table 5), citric acid(26.95 mg/g) was the most abundant organic acid, accounting for 85% of the total organic acid, with thefollowed one being l-malic acid (3.29 mg/g).
Succinic acid, acetic acid, lactic acid and pyruvic were also detected in hawthorn wine, whichaccounting for 1.99%, 2.36%, 0.19% and 0.19%, respectively. Comparing organic acids in hawthorn fruitsand hawthorn wines, citric acid and l-malic acid contents decreased during fermentation; while succinicacid increased significantly, as well as acetic acid and lactic acid. The citric acid and l-malic acid were themain acids in hawthorn fruits. Previous study indicated that the content of citric acid and l-malic acidin hawthorn fruits reached up to 85% of the total acidity [7]. The succinic acid, acetic acid and lactic acidnot only came from the raw material but also produced by the yeast during the alcoholic fermentation.Fumaric acid was an indicator of microbial contamination in clear apple juice concentrate [26,27]. Onlytrace amount of fumaric acid was detected in both hawthorn wine fruits and hawthorn wines. Pyruvicacid was an important intermediate between EMP (Embden–Meyerhof-Parnas) pathway and TCAcycle (tricarboxylic acid cycle) as well as other metabolisms; it was converted to organic acid andother substances during the fermentation. Although the content of these organic acids analyzed byenzymatic method was reliable, these kits were expensive, and the method is time consuming andcannot quantify all of the organic acids simultaneously. It is commonly used as a reference methodin food analysis [28]. In contrast, the HPLC method was widely applied to quantify organic acids infood. However, the detection of organic acids in hawthorn wine by HPLC has been rarely reported.Therefore, two popular HPLC methods were applied to quantify organic acids following.
Molecules 2019, 24, 2150 4 of 14
Table 2. Identification of organic acids with enzymatic method.
Samples Methods Citric Acid(mg/L)
Succinic Acid(mg/L)
l-malic Acid(mg/L)
Acetic Acid(mg/L)
Lactic Acid(mg/L)
Pyruvic Acid(mg/L)
Fumaric Acid(mg/L) TOA (g/L)
1HPLC 1 a 9587.5 ± 150.3 a 2830.1 ± 62.2 a 772.1 ± 50.2 a 993.8 ± 158.2 a 88.9 ± 6.2 b 1.4 ± 0.2 b 1.1 ± 0.1 c 14.3 ± 0.4HPLC 2 b 9928.7 ± 274.2 a 1611.2 ± 91.8 b 835.4 ± 1.7 a 740.5 ± 10.0 a 940.2 ± 6.2 a 7.0 ± 0.1 a 2.5 ± 0.1 b 14.1 ± 0.4
EM c 9372.1 ± 214.2 a 1522.8 ± 47.2 b 812.3 ± 2.8 a 679.4 ± 7.2 a 95.2 ± 2.3 c 7.4 ± 0.3 a 3.4 ± 0.6 a 12.5 ± 0.3
2HPLC 1 9315.4 ± 133.0 a,b 2919.8 ± 1.8 a 734.4 ± 7.5 a 1073.9 ± 2.1 a 86.5 ± 9.0 b 0.9 ± 0.0 b 1.1 ± 0.0 c 14.1 ± 0.2HPLC 2 9785.0 ± 246.7 a 1771.9 ± 61.2 b 762.7 ± 9.8 a 736.5 ± 18.4 b 910.7 ± 12.1 a 6.0 ± 0.2 a 2.8 ± 0.1 b 14.0 ± 0.3
EM 8896.9 ± 192.0 b 1571.6 ± 29.0 c 745.0 ± 21.3 a 643.9 ± 17.9 c 103.0 ± 1.1 b 6.2 ± 0.5 a 3.7 ± 0.0 a 12.0 ± 0.3
3HPLC 1 8864.9 ± 282.9 a 3110.3 ± 155.3 a 484.1 ± 123.9 a 892.1 ± 150.6 a 102.3 ± 26.4 b 1.3 ± 0.1 c 1.2 ± 0.1 c 13.5 ± 0.7HPLC 2 8744.5 ± 62.0 b 1797.1 ± 54.7 b 591.6 ± 2.9 a 662.3 ± 12.9 a 1114.2 ± 13.0 a 7.0 ± 0.2 a 2.6 ± 0.0 b 12.9 ± 0.1
EM 7967.6 ± 88.7 c 1694.9 ± 14.5 b 603.2 ± 14.2 a 598.3 ± 10.8 a 120.8 ± 2.7 c 5.6 ± 0.5 b 3.3 ± 0.0 a 11.0 ± 0.1
4HPLC 1 10230.0 ± 257.4 a 2993.0 ± 23.1 a 782.5 ± 33.4 b 720.6 ± 56.4 a 94.6 ± 9.5 b 2.6 ± 0.0 c 1.6 ± 0.2 b 14.8 ± 0.4HPLC 2 9104.4 ± 80.8 b 1753.8 ± 28.8 b 681.5 ± 1.5 c 665.2 ± 5.0 b 1127.6 ± 5.1 a 8.9 ± 0.4 a 2.5 ± 0.0 a 13.3 ± 0.1
EM 9821.3 ± 132.6 a 1664.1 ± 14.5 c 983.2 ± 31.3 a 694.6 ± 7.2 a 106.1 ± 1.8 c 4.9 ± 0.7 b 2.5 ± 0.1 a 13.3 ± 0.2
5HPLC 1 9242.9 ± 130.8 a 3092.1 ± 54.8 a 742.3 ± 62.5 a 959.1 ± 163.5 a 87.6 ± 14.6 b 1.1 ± 0.1 b 1.1 ± 0.1 c 14.1 ± 0.4HPLC 2 9196.6 ± 4.4 a 1741.6 ± 30.3 b 716.4 ± 6.2 a 694.3 ± 3.3 a 950.7 ± 5.3 a 6.5 ± 0.2 a 2.8 ± 0.1 b 13.3 ± 0.0
EM 8881.3 ± 95.9 a 1640.9 ± 32.7 b 716.8 ± 1.4 a 616.0 ± 21.5 a 89.9 ± 1.6 c 6.9 ± 1.3 a 3.3 ± 0.3 a 12.0 ± 0.2
6HPLC 1 9493.9 ± 6.1 a 3261.9 ± 5.0 a 501.7 ± 54.8 a 982.6 ± 24.1 a 86.9 ± 14.6 b 2.0 ± 0.1 c 1.7 ± 0.0 c 14.3 ± 0.1HPLC 2 9321.1 ± 286.4 a 1668.6 ± 111.3 b 733.1 ± 5.2 a 683.2 ± 2.0 b 1131.2 ± 3.4 a 7.5 ± 0.2 a 2.7 ± 0.1 b 13.5 ± 0.4
EM 8855.2 ± 0.0 a 1607.6 ± 58.1 b 701.7 ± 93.8 a 603.3 ± 17.9 c 102.4 ± 1.6 c 4.8 ± 0.1 b 3.5 ± 0.2 a 11.9 ± 0.2
7HPLC 1 9111.0 ± 472.2 a 2613.4 ± 156.3 a 771.5 ± 11.3 a 866.1 ± 162.6 a 66.0 ± 6.1 b 0.9 ± 0.3 c 1.0 ± 0.2 c 13.4 ± 0.8HPLC 2 9709.1 ± 158.4 a 1573.4 ± 36.8 b 877.7 ± 2.8 a,b 761.1 ± 15.6 a 795.0 ± 2.6 a 7.1 ± 0.3 a 2.4 ± 0.1 b 13.7 ± 0.2
EM 9090.0 ± 0.0 a 1468.9 ± 14.5 b 878.7 ± 42.6 b 723.7 ± 19.7 a 86.2 ± 6.8 c 5.3 ± 0.7 b 2.8 ± 0.0 a 12.3 ± 0.1
8HPLC 1 9753.4 ± 140.8 b 2165.8 ± 55.9 a 701.3 ± 20.2 a 1111.9 ± 127.9 a 61.9 ± 0.7 b 0.6 ± 0.1 b 1.0 ± 0.1 c 13.8 ± 0.3HPLC 2 10156.6 ± 113.3 a 1456.0 ± 30.6 b 756.3 ± 0.3 a 908.1 ± 17.7 b 740.1 ± 3.8 a 5.9 ± 0.2 a 2.5 ± 0.0 b 14.0 ± 0.2
EM 9173.7 ± 44.3 c 1327.7 ± 3.6 b 754.0 ± 37.0 a 818.8 ± 0.0 b 72.7 ± 0.5 c 6.1 ± 0.4 a 3.3 ± 0.4 a 12.2 ± 0.1
9HPLC 1 9069.4 ± 61.5 a 3141.3 ± 66.8 a 576.5 ± 137.1 a 760.8 ± 106.7 a 105.9 ± 14.4 b 2.5 ± 0.2 c 1.3 ± 0.1 c 13.7 ± 0.4HPLC 2 8843.8 ± 61.9 a 1857.4 ± 47.6 b 659.2 ± 0.1 a 616.8 ± 7.8 b 1140.2 ± 1.9 a 8.8 ± 0.0 a 2.8 ± 0.0 b 13.1 ± 0.1
EM 8145.1 ± 103.4 b 1540.8 ± 21.8 c 670.6 ± 44.1 a 523.5 ± 1.8 a,b 135.4 ± 2.5 c 5.0 ± 0.4 b 3.6 ± 0.3 a 11.0 ± 0.2
10HPLC 1 9570.5 ± 221.0 a 2748.1 ± 68.6 a 798.0 ± 16.0 b 1252.1 ± 62.8 a 140.6 ± 14.9 b 3.9 ± 0.3 c 1.2 ± 0.2 c 14.5 ± 0.4HPLC 2 10473.9 ± 454.4 a 1655.4 ± 82.2 b 956.3 ± 16.7 a 734.6 ± 2.3 c 881.0 ± 12.2 a 7.7 ± 0.0 a 2.6 ± 0.0 b 14.7 ± 0.6
EM 9460.9 ± 169.8 a 1499.7 ± 21.8 b 911.9 ± 35.5 a 694.6 ± 10.8 b 80.7 ± 0.0 c 5.6 ± 0.5 b 3.2 ± 0.9 a 12.7 ± 0.2a HPLC 1, by an 87H column equipped with DAD detector at 215 nm (HPLC method 1); b HPLC 2, by a dC18 column equipped with DAD detector at 210 nm (HPLC method 2). c EM,enzymatic method; TOA, total organic acid. Data are expressed as mean ± standard deviation. Different lowercase letters in the same column of same sample are significantly different by aTukey test (p < 0.05).
Molecules 2019, 24, 2150 5 of 14
2.3. Validation of the two HPLC Methods
To validate the two HPLC methods, proper quality assurance/quality control (QA/QC) procedureswere applied. As shown in Table 3, a good linear range of the two HPLC methods were showedwhere the values for the correlation coefficient (R2) were 0.9995–1.0000 and their concentrationrange encompasses the expected analyte concentrations in the measured samples. According toKonieczka [29], the R2 values for the calibration curves must be greater than 0.999, which verifiesthat the linearity obtained in this study for the response to external standards was adequate for theintended purpose. The precision parameter of the HPLC method 1 showed a coefficient of variationranged from 0.76 to 4.21 for hawthorn wine. And the precision parameter of the HPLC method 2ranged from 0.26 to 1.73. The variation coefficient of pyruvate was relative large with HPLC method1 but still lower than the maximum limit of 5% [30]. The HPLC method 2 was better than method 1in precision for its good reproducibility. Recovery was obtained from the results of six injections of5.0 mL of the hawthorn wine samples mixture with 5.0 mL of a mix organic acids standards solution.The recovery was calculated comparing the result obtained analytically for each compound with theinitial concentration in the spiked sample. The recovery percentages (R%) values for the wine rangedfrom 83.6 to 101.2 analyzed with the HPLC method 1, and ranged from 98.2 to 108.5 analyzed with theHPLC method 2. The recovery rate of acetic acid (83.6) was low when analyzed with HPLC method1; it is speculated that there might be material interference. The LOD (limit of detection) and LOQ(limit of quantification) were used to demonstrate the ability of a method to detect and quantify lowconcentrations of a substance, respectively. The LOD and LOQ values were considered suitable for theuse of this methodology in quantification of organic acids in hawthorn wine.
Table 3. Validation parameters for the two HPLC methods.
Methods OA Concentration(mg/L) Equation R2 Precision% R% LOD
(mg/L)LOQ
(mg/L)
HPLC 1
Citric 606.6–12411.00 Y = 1879.80x + 8077.20 1.0000 0.76 100.4 0.61 2.02Pyruvic 0.00–8.90 Y = 31419.00x + 1474.70 0.9995 4.21 92.2 0.03 0.11l-malic 72.11–1730.69 Y = 1731.50x + 1210.30 0.9999 1.72 101.2 0.64 1.60Succinic 128.88–1611.00 Y = 945.26x − 1668.30 0.9999 0.76 99.4 1.75 5.84
Lactic 1.68–84.00 Y = 815.37x − 629.03 1.0000 3.66 91.1 1.93 6.45Fumaric 0.09–4.7 Y = 199715x − 5007.3 0.9999 2.95 94.4 0.01 0.03Acetic 1.68–427.20 Y = 802.29x − 355.28 1.0000 0.88 83.6 2.11 7.05
Citric 426.24–10656.00 Y = 1011.90x − 15648.00 1.0000 0.57 100.9 1.16 3.86
HPLC 2
Pyruvic 0.00–30.20 Y = 13348.00x − 732.84 0.9999 1.28 100.3 0.08 0.28l-malic 56.10–1402.4 Y = 797.75x + 2302.9 0.9999 0.48 102.8 1.00 3.33Succinic 122.48–3062.00 Y = 605.52x − 6762.2 0.9999 1.73 100.1 2.13 7.10
Lactic 2.45–522.0 Y = 475.82x + 1562.20 0.9998 0.26 100.7 1.04 3.46Fumaric 0.00–7.36 Y = 134887.00x + 4235.6 0.9999 0.53 98.2 0.01 0.03Acetic 10.89–544.40 Y = 540.39x + 476.03 0.9999 0.54 108.5 1.98 6.6
OA: organic acid; R%: recovery; LOD: limit of detection; LOQ: limit of quantification.
2.4. Analysis of Organic Acids with HPLC Method 1
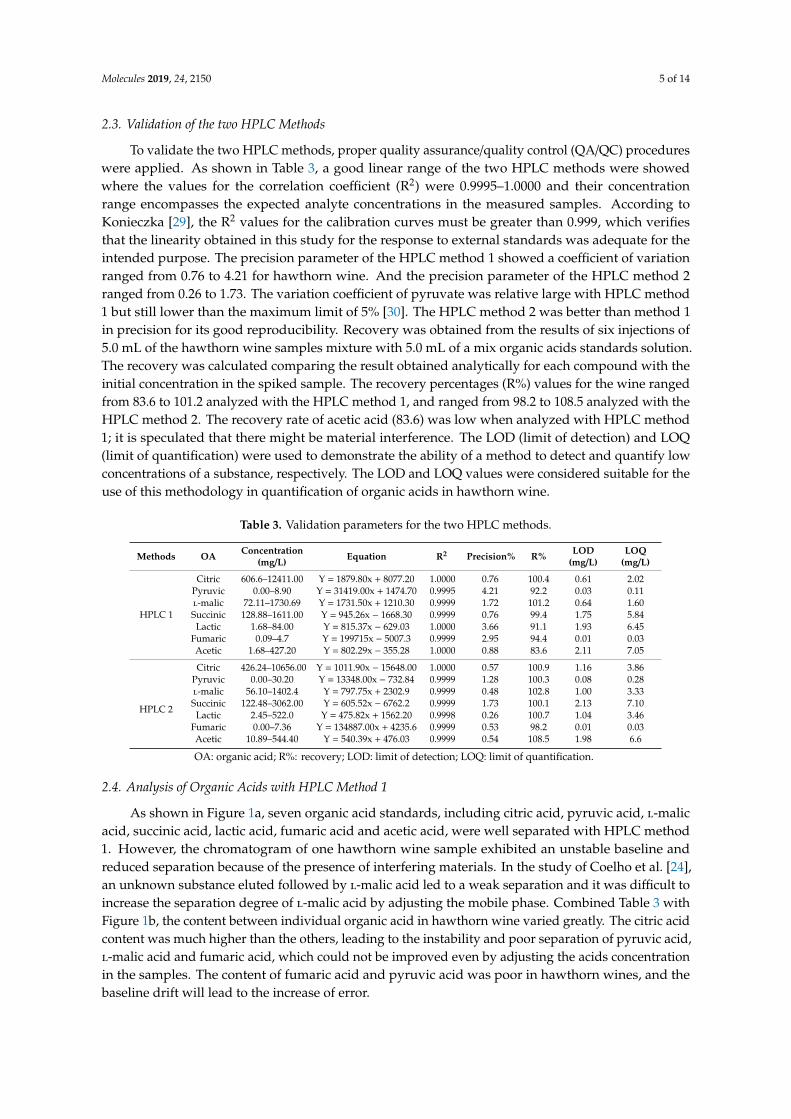
As shown in Figure 1a, seven organic acid standards, including citric acid, pyruvic acid, l-malicacid, succinic acid, lactic acid, fumaric acid and acetic acid, were well separated with HPLC method1. However, the chromatogram of one hawthorn wine sample exhibited an unstable baseline andreduced separation because of the presence of interfering materials. In the study of Coelho et al. [24],an unknown substance eluted followed by l-malic acid led to a weak separation and it was difficult toincrease the separation degree of l-malic acid by adjusting the mobile phase. Combined Table 3 withFigure 1b, the content between individual organic acid in hawthorn wine varied greatly. The citric acidcontent was much higher than the others, leading to the instability and poor separation of pyruvic acid,l-malic acid and fumaric acid, which could not be improved even by adjusting the acids concentrationin the samples. The content of fumaric acid and pyruvic acid was poor in hawthorn wines, and thebaseline drift will lead to the increase of error.
Molecules 2019, 24, 2150 6 of 14
Molecules 2019, 24, x FOR PEER REVIEW 2 of 15
even by adjusting the acids concentration in the samples. The content of fumaric acid and pyruvic
acid was poor in hawthorn wines, and the baseline drift will lead to the increase of error.
Figure 1. Analysis of organic acids with HPLC method 1. (a) Chromatogram of organic acid
standards; (b) Chromatogram of hawthorn wine. Peak 1, 2, 3, 4, 5, 6 and 7 were citric acid, pyruvic
acid, L‐malic acid, succinic acid, lactic acid, fumaric acid, and acetic acid.
2.5. Analysis of Organic Acids with HPLC Method 2
As indicated in Figure 2a, the seven organic acid standards mentioned in 2.4 were well
separated with HPLC method 2. By analyzing the same hawthorn wine sample used in Figure 1,
stable baseline and effective separation except acetic acid were realized as showed in Figure 2b. An
unknown peak at retention time of 8.0 min in Figure 2b appeared behind the peak of acetic acid,
leading to a weak separation. Although the elution period of organic acid standards is only 13 min,
many weak polar materials were eluted followed by the last peak of fumaric acid, resulting in up to
100 min analysis period for one sample as exhibited in Figure 4b.
The difference in separation principle between these two HPLC methods led to significant
differences in sample separation. For HPLC method 1, the main problems were unstable baseline,
poor separation in pyruvic acid, L‐malic acid and fumaric acid and the long elution period. For
HPLC method 2, the problems were the long elution period and poor separation degree in acetic
acid. The main reason for these problems mentioned above is due to the poor selectivity of diode
array detector at the low wavelength range [25]. Phenols, nucleotide phosphates and the substances
containing conjugated double bond display intensive absorption in this ultraviolet range. Thus,
Figure 1. Analysis of organic acids with HPLC method 1. (a) Chromatogram of organic acid standards;(b) Chromatogram of hawthorn wine. Peak 1, 2, 3, 4, 5, 6 and 7 were citric acid, pyruvic acid, l-malicacid, succinic acid, lactic acid, fumaric acid, and acetic acid.
2.5. Analysis of Organic Acids with HPLC Method 2
As indicated in Figure 2a, the seven organic acid standards mentioned in 2.4 were well separatedwith HPLC method 2. By analyzing the same hawthorn wine sample used in Figure 1, stable baselineand effective separation except acetic acid were realized as showed in Figure 2b. An unknown peakat retention time of 8.0 min in Figure 2b appeared behind the peak of acetic acid, leading to a weakseparation. Although the elution period of organic acid standards is only 13 min, many weak polarmaterials were eluted followed by the last peak of fumaric acid, resulting in up to 100 min analysisperiod for one sample as exhibited in Figure 4b.
The difference in separation principle between these two HPLC methods led to significantdifferences in sample separation. For HPLC method 1, the main problems were unstable baseline,poor separation in pyruvic acid, l-malic acid and fumaric acid and the long elution period. ForHPLC method 2, the problems were the long elution period and poor separation degree in aceticacid. The main reason for these problems mentioned above is due to the poor selectivity of diodearray detector at the low wavelength range [25]. Phenols, nucleotide phosphates and the substancescontaining conjugated double bond display intensive absorption in this ultraviolet range. Thus,they are able to disturb the determination even at a very low level. Another reason might be thathawthorn wine is a complex system containing vitamins, polyphenols, pigments, polysaccharides [11]
Molecules 2019, 24, 2150 7 of 14
and other interfering substances. Therefore, LC-18 SPE tube pretreatment would be applied in thefollowing pretreatment.
Molecules 2019, 24, x FOR PEER REVIEW 3 of 15
they are able to disturb the determination even at a very low level. Another reason might be that
hawthorn wine is a complex system containing vitamins, polyphenols, pigments, polysaccharides
[11] and other interfering substances. Therefore, LC‐18 SPE tube pretreatment would be applied in
the following pretreatment.
Figure 2. Analysis of organic acids with HPLC method 2. (a) Chromatogram of organic acid
standards; (b) Chromatogram of the hawthorn wine. Peak 1, 2, 3, 4, 5, 6 and 7 were pyruvic acid,
L‐malic acid, lactic acid, acetic acid, citric acid, succinic acid, and fumaric acid.
2.6. Pretreatment of the Samples with LC‐18 SPE Tube
2.6.1. Recovery of Organic Acids Treated with LC‐18 SPE Tube
As indicated in Table 4, precision of the organic acids in hawthorn wine was reduced after
purification pretreatment, especially with HPLC method 1. It was speculated that the impurity
removed effectively by the purification pretreatment and the filtration speed will affect the degree
of purification when analyzed with HPLC method 1. There were no large changes in the LOD and
the LOQ because the signal‐to‐noise ratio did not change so much. The recovery rate of organic acid
standards analyzed with HPLC method 1 was 90.8–101.6%, demonstrating that the LC‐18 SPE tube
will not result in organic acids loss. However, the recovery of some organic acids in the samples
was out of the reasonable range. The recovery rate of pyruvate acid was 139.9% with a relatively
high deviation (34.9%). It is speculated that the main reason would be the flat baseline and the
increased separation after purification. On the other hand, the tiny elution peak of pyruvate acid
led to the large deviation owing to the lower content in these samples. The recovery rate of lactic
acid in the sample was only 71.4%, while the standard was 101.6%. It is considered that the low
Figure 2. Analysis of organic acids with HPLC method 2. (a) Chromatogram of organic acid standards;(b) Chromatogram of the hawthorn wine. Peak 1, 2, 3, 4, 5, 6 and 7 were pyruvic acid, l-malic acid,lactic acid, acetic acid, citric acid, succinic acid, and fumaric acid.
2.6. Pretreatment of the Samples with LC-18 SPE Tube
2.6.1. Recovery of Organic Acids Treated with LC-18 SPE Tube
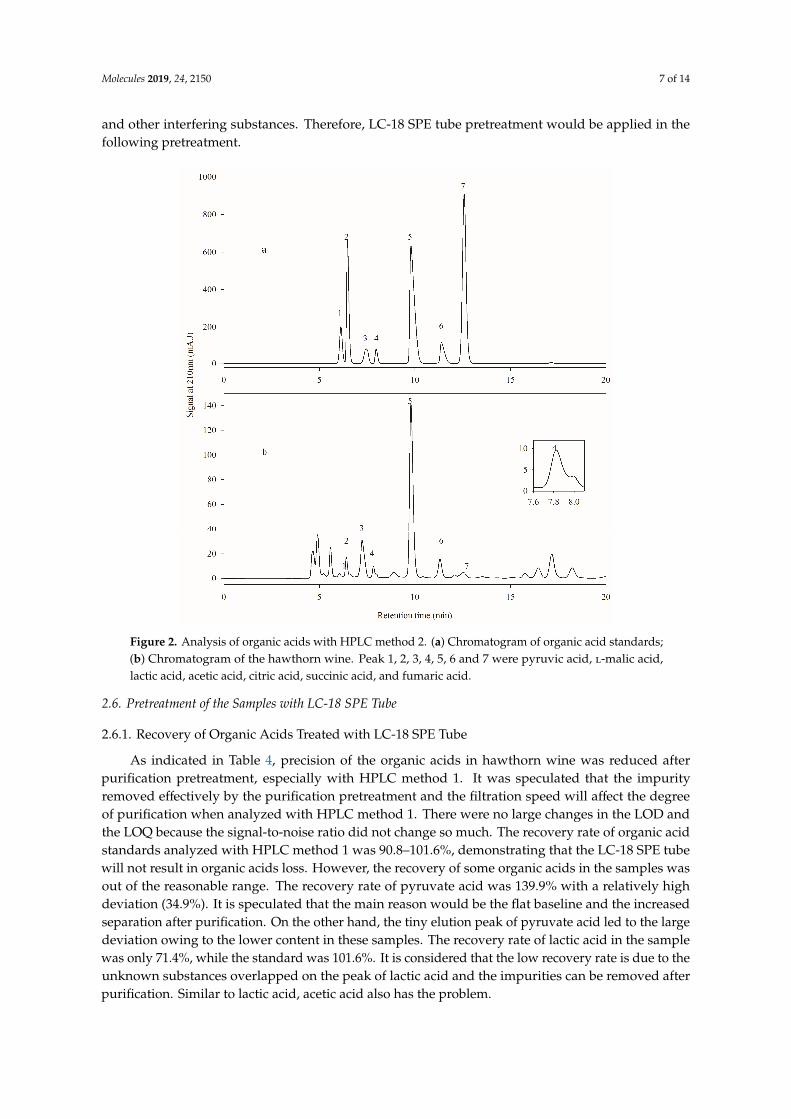
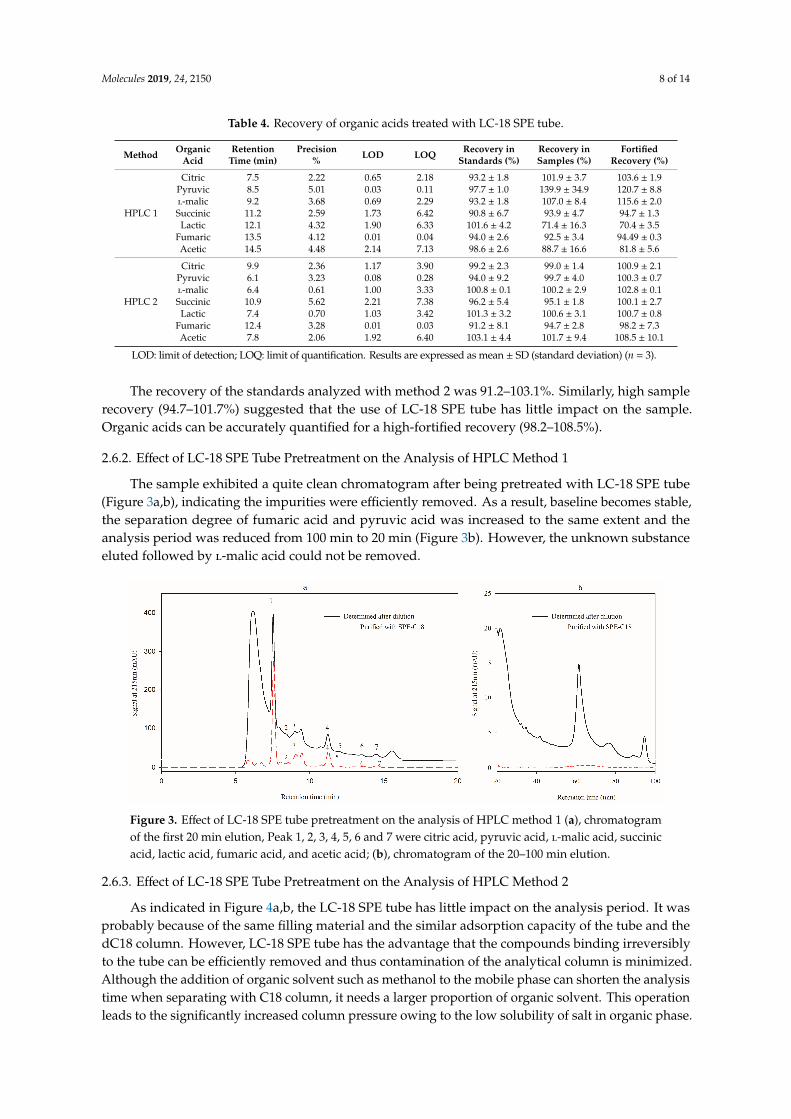
As indicated in Table 4, precision of the organic acids in hawthorn wine was reduced afterpurification pretreatment, especially with HPLC method 1. It was speculated that the impurityremoved effectively by the purification pretreatment and the filtration speed will affect the degreeof purification when analyzed with HPLC method 1. There were no large changes in the LOD andthe LOQ because the signal-to-noise ratio did not change so much. The recovery rate of organic acidstandards analyzed with HPLC method 1 was 90.8–101.6%, demonstrating that the LC-18 SPE tubewill not result in organic acids loss. However, the recovery of some organic acids in the samples wasout of the reasonable range. The recovery rate of pyruvate acid was 139.9% with a relatively highdeviation (34.9%). It is speculated that the main reason would be the flat baseline and the increasedseparation after purification. On the other hand, the tiny elution peak of pyruvate acid led to the largedeviation owing to the lower content in these samples. The recovery rate of lactic acid in the samplewas only 71.4%, while the standard was 101.6%. It is considered that the low recovery rate is due to theunknown substances overlapped on the peak of lactic acid and the impurities can be removed afterpurification. Similar to lactic acid, acetic acid also has the problem.
Molecules 2019, 24, 2150 8 of 14
Table 4. Recovery of organic acids treated with LC-18 SPE tube.
Method OrganicAcid
RetentionTime (min)
Precision% LOD LOQ Recovery in
Standards (%)Recovery inSamples (%)
FortifiedRecovery (%)
HPLC 1
Citric 7.5 2.22 0.65 2.18 93.2 ± 1.8 101.9 ± 3.7 103.6 ± 1.9Pyruvic 8.5 5.01 0.03 0.11 97.7 ± 1.0 139.9 ± 34.9 120.7 ± 8.8l-malic 9.2 3.68 0.69 2.29 93.2 ± 1.8 107.0 ± 8.4 115.6 ± 2.0Succinic 11.2 2.59 1.73 6.42 90.8 ± 6.7 93.9 ± 4.7 94.7 ± 1.3
Lactic 12.1 4.32 1.90 6.33 101.6 ± 4.2 71.4 ± 16.3 70.4 ± 3.5Fumaric 13.5 4.12 0.01 0.04 94.0 ± 2.6 92.5 ± 3.4 94.49 ± 0.3Acetic 14.5 4.48 2.14 7.13 98.6 ± 2.6 88.7 ± 16.6 81.8 ± 5.6
HPLC 2
Citric 9.9 2.36 1.17 3.90 99.2 ± 2.3 99.0 ± 1.4 100.9 ± 2.1Pyruvic 6.1 3.23 0.08 0.28 94.0 ± 9.2 99.7 ± 4.0 100.3 ± 0.7l-malic 6.4 0.61 1.00 3.33 100.8 ± 0.1 100.2 ± 2.9 102.8 ± 0.1Succinic 10.9 5.62 2.21 7.38 96.2 ± 5.4 95.1 ± 1.8 100.1 ± 2.7
Lactic 7.4 0.70 1.03 3.42 101.3 ± 3.2 100.6 ± 3.1 100.7 ± 0.8Fumaric 12.4 3.28 0.01 0.03 91.2 ± 8.1 94.7 ± 2.8 98.2 ± 7.3Acetic 7.8 2.06 1.92 6.40 103.1 ± 4.4 101.7 ± 9.4 108.5 ± 10.1
LOD: limit of detection; LOQ: limit of quantification. Results are expressed as mean ± SD (standard deviation) (n = 3).
The recovery of the standards analyzed with method 2 was 91.2–103.1%. Similarly, high samplerecovery (94.7–101.7%) suggested that the use of LC-18 SPE tube has little impact on the sample.Organic acids can be accurately quantified for a high-fortified recovery (98.2–108.5%).
2.6.2. Effect of LC-18 SPE Tube Pretreatment on the Analysis of HPLC Method 1
The sample exhibited a quite clean chromatogram after being pretreated with LC-18 SPE tube(Figure 3a,b), indicating the impurities were efficiently removed. As a result, baseline becomes stable,the separation degree of fumaric acid and pyruvic acid was increased to the same extent and theanalysis period was reduced from 100 min to 20 min (Figure 3b). However, the unknown substanceeluted followed by l-malic acid could not be removed.
Molecules 2019, 24, x FOR PEER REVIEW 4 of 15
recovery rate is due to the unknown substances overlapped on the peak of lactic acid and the
impurities can be removed after purification. Similar to lactic acid, acetic acid also has the problem.
The recovery of the standards analyzed with method 2 was 91.2–103.1%. Similarly, high
sample recovery (94.7–101.7%) suggested that the use of LC‐18 SPE tube has little impact on the
sample. Organic acids can be accurately quantified for a high‐fortified recovery (98.2–108.5%).
Table 4. Recovery of organic acids treated with LC‐18 SPE tube.
Method Organic
Acid
Retention
Time (min)
Precision
% LOD LOQ
Recovery in
Standards (%)
Recovery in
Samples (%)
Fortified
Recovery
(%)
HPLC 1
Citric 7.5 2.22 0.65 2.18 93.2 ± 1.8 101.9 ± 3.7 103.6 ± 1.9
Pyruvic 8.5 5.01 0.03 0.11 97.7 ± 1.0 139.9 ± 34.9 120.7 ± 8.8
L‐malic 9.2 3.68 0.69 2.29 93.2 ± 1.8 107.0 ± 8.4 115.6 ± 2.0
Succinic 11.2 2.59 1.73 6.42 90.8 ± 6.7 93.9 ± 4.7 94.7 ± 1.3
Lactic 12.1 4.32 1.90 6.33 101.6 ± 4.2 71.4 ± 16.3 70.4 ± 3.5
Fumaric 13.5 4.12 0.01 0.04 94.0 ± 2.6 92.5 ± 3.4 94.49 ± 0.3
Acetic 14.5 4.48 2.14 7.13 98.6 ± 2.6 88.7 ± 16.6 81.8 ± 5.6
HPLC 2
Citric 9.9 2.36 1.17 3.90 99.2 ± 2.3 99.0 ± 1.4 100.9 ± 2.1
Pyruvic 6.1 3.23 0.08 0.28 94.0 ± 9.2 99.7 ± 4.0 100.3 ± 0.7
L‐malic 6.4 0.61 1.00 3.33 100.8 ± 0.1 100.2 ± 2.9 102.8 ± 0.1
Succinic 10.9 5.62 2.21 7.38 96.2 ± 5.4 95.1 ± 1.8 100.1 ± 2.7
Lactic 7.4 0.70 1.03 3.42 101.3 ± 3.2 100.6 ± 3.1 100.7 ± 0.8
Fumaric 12.4 3.28 0.01 0.03 91.2 ± 8.1 94.7 ± 2.8 98.2 ± 7.3
Acetic 7.8 2.06 1.92 6.40 103.1 ± 4.4 101.7 ± 9.4 108.5 ± 10.1
LOD: limit of detection; LOQ: limit of quantification. Results are expressed as mean ± SD (standard
deviation) (n = 3).
2.6.2. Effect of LC‐18 SPE Tube Pretreatment on the Analysis of HPLC Method 1
The sample exhibited a quite clean chromatogram after being pretreated with LC‐18 SPE tube
(Figure 3a,b), indicating the impurities were efficiently removed. As a result, baseline becomes
stable, the separation degree of fumaric acid and pyruvic acid was increased to the same extent and
the analysis period was reduced from 100 min to 20 min (Figure 3b). However, the unknown
substance eluted followed by L‐malic acid could not be removed.
Figure 3. Effect of LC‐18 SPE tube pretreatment on the analysis of HPLC method 1 (a),
chromatogram of the first 20 min elution, Peak 1, 2, 3, 4, 5, 6 and 7 were citric acid, pyruvic acid,
L‐malic acid, succinic acid, lactic acid, fumaric acid, and acetic acid; (b), chromatogram of the 20–100
min elution.
2.6.3. Effect of LC‐18 SPE Tube Pretreatment on the Analysis of HPLC Method 2
Figure 3. Effect of LC-18 SPE tube pretreatment on the analysis of HPLC method 1 (a), chromatogramof the first 20 min elution, Peak 1, 2, 3, 4, 5, 6 and 7 were citric acid, pyruvic acid, l-malic acid, succinicacid, lactic acid, fumaric acid, and acetic acid; (b), chromatogram of the 20–100 min elution.
2.6.3. Effect of LC-18 SPE Tube Pretreatment on the Analysis of HPLC Method 2
As indicated in Figure 4a,b, the LC-18 SPE tube has little impact on the analysis period. It wasprobably because of the same filling material and the similar adsorption capacity of the tube and thedC18 column. However, LC-18 SPE tube has the advantage that the compounds binding irreversiblyto the tube can be efficiently removed and thus contamination of the analytical column is minimized.Although the addition of organic solvent such as methanol to the mobile phase can shorten the analysistime when separating with C18 column, it needs a larger proportion of organic solvent. This operationleads to the significantly increased column pressure owing to the low solubility of salt in organic phase.
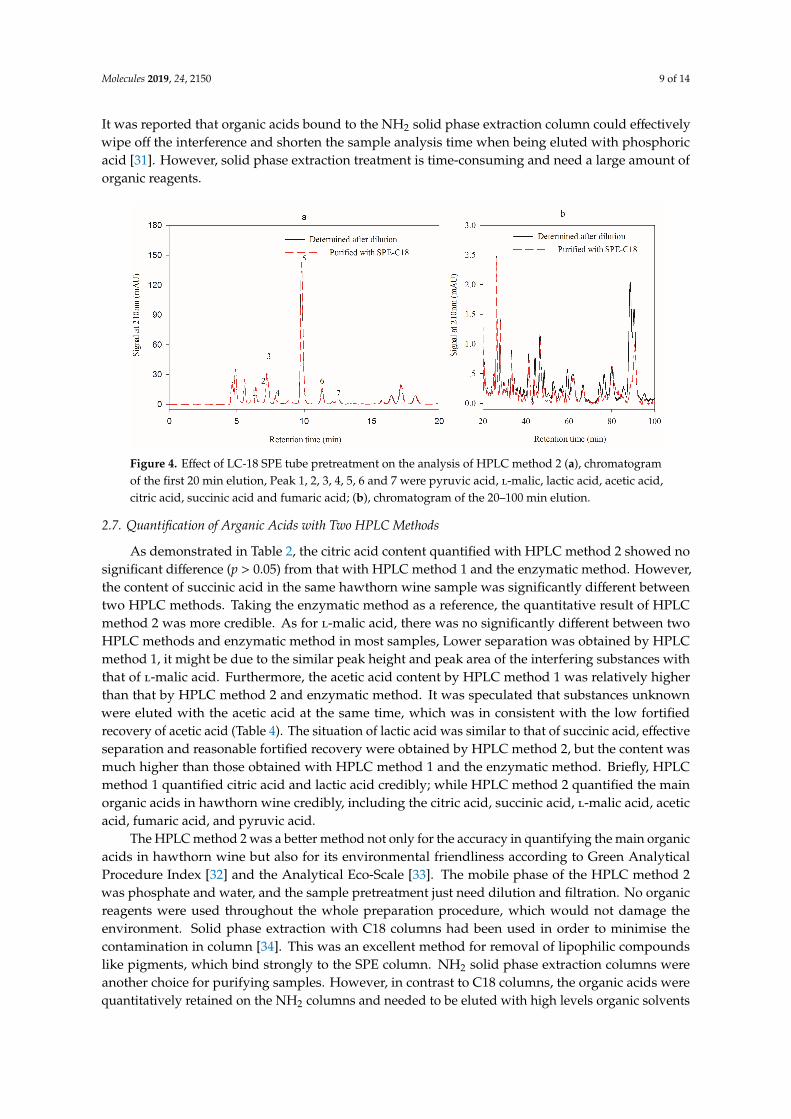
Molecules 2019, 24, 2150 9 of 14
It was reported that organic acids bound to the NH2 solid phase extraction column could effectivelywipe off the interference and shorten the sample analysis time when being eluted with phosphoricacid [31]. However, solid phase extraction treatment is time-consuming and need a large amount oforganic reagents.Molecules 2019, 24, x FOR PEER REVIEW 5 of 15
Figure 4. Effect of LC‐18 SPE tube pretreatment on the analysis of HPLC method 2 (a),
chromatogram of the first 20 min elution, Peak 1, 2, 3, 4, 5, 6 and 7 were pyruvic acid, L‐malic, lactic
acid, acetic acid, citric acid, succinic acid and fumaric acid; (b), chromatogram of the 20–100 min
elution.
As indicated in Figure 4a,b, the LC‐18 SPE tube has little impact on the analysis period. It was
probably because of the same filling material and the similar adsorption capacity of the tube and
the dC18 column. However, LC‐18 SPE tube has the advantage that the compounds binding
irreversibly to the tube can be efficiently removed and thus contamination of the analytical column
is minimized. Although the addition of organic solvent such as methanol to the mobile phase can
shorten the analysis time when separating with C18 column, it needs a larger proportion of organic
solvent. This operation leads to the significantly increased column pressure owing to the low
solubility of salt in organic phase. It was reported that organic acids bound to the NH2 solid phase
extraction column could effectively wipe off the interference and shorten the sample analysis time
when being eluted with phosphoric acid [31]. However, solid phase extraction treatment is
time‐consuming and need a large amount of organic reagents.
2.7. Quantification of Arganic Acids with Two HPLC Methods
As demonstrated in Table 2, the citric acid content quantified with HPLC method 2 showed no
significant difference (p > 0.05) from that with HPLC method 1 and the enzymatic method.
However, the content of succinic acid in the same hawthorn wine sample was significantly different
between two HPLC methods. Taking the enzymatic method as a reference, the quantitative result of
HPLC method 2 was more credible. As for L‐malic acid, there was no significantly different
between two HPLC methods and enzymatic method in most samples, Lower separation was
obtained by HPLC method 1, it might be due to the similar peak height and peak area of the
interfering substances with that of L‐malic acid. Furthermore, the acetic acid content by HPLC
method 1 was relatively higher than that by HPLC method 2 and enzymatic method. It was
speculated that substances unknown were eluted with the acetic acid at the same time, which was
in consistent with the low fortified recovery of acetic acid (Table 4). The situation of lactic acid was
similar to that of succinic acid, effective separation and reasonable fortified recovery were obtained
by HPLC method 2, but the content was much higher than those obtained with HPLC method 1
and the enzymatic method. Briefly, HPLC method 1 quantified citric acid and lactic acid credibly;
while HPLC method 2 quantified the main organic acids in hawthorn wine credibly, including the
citric acid, succinic acid, L‐malic acid, acetic acid, fumaric acid, and pyruvic acid.
The HPLC method 2 was a better method not only for the accuracy in quantifying the main
organic acids in hawthorn wine but also for its environmental friendliness according to Green
Analytical Procedure Index [32] and the Analytical Eco‐Scale [33]. The mobile phase of the HPLC
method 2 was phosphate and water, and the sample pretreatment just need dilution and filtration.
Figure 4. Effect of LC-18 SPE tube pretreatment on the analysis of HPLC method 2 (a), chromatogramof the first 20 min elution, Peak 1, 2, 3, 4, 5, 6 and 7 were pyruvic acid, l-malic, lactic acid, acetic acid,citric acid, succinic acid and fumaric acid; (b), chromatogram of the 20–100 min elution.
2.7. Quantification of Arganic Acids with Two HPLC Methods
As demonstrated in Table 2, the citric acid content quantified with HPLC method 2 showed nosignificant difference (p > 0.05) from that with HPLC method 1 and the enzymatic method. However,the content of succinic acid in the same hawthorn wine sample was significantly different betweentwo HPLC methods. Taking the enzymatic method as a reference, the quantitative result of HPLCmethod 2 was more credible. As for l-malic acid, there was no significantly different between twoHPLC methods and enzymatic method in most samples, Lower separation was obtained by HPLCmethod 1, it might be due to the similar peak height and peak area of the interfering substances withthat of l-malic acid. Furthermore, the acetic acid content by HPLC method 1 was relatively higherthan that by HPLC method 2 and enzymatic method. It was speculated that substances unknownwere eluted with the acetic acid at the same time, which was in consistent with the low fortifiedrecovery of acetic acid (Table 4). The situation of lactic acid was similar to that of succinic acid, effectiveseparation and reasonable fortified recovery were obtained by HPLC method 2, but the content wasmuch higher than those obtained with HPLC method 1 and the enzymatic method. Briefly, HPLCmethod 1 quantified citric acid and lactic acid credibly; while HPLC method 2 quantified the mainorganic acids in hawthorn wine credibly, including the citric acid, succinic acid, l-malic acid, aceticacid, fumaric acid, and pyruvic acid.
The HPLC method 2 was a better method not only for the accuracy in quantifying the main organicacids in hawthorn wine but also for its environmental friendliness according to Green AnalyticalProcedure Index [32] and the Analytical Eco-Scale [33]. The mobile phase of the HPLC method 2was phosphate and water, and the sample pretreatment just need dilution and filtration. No organicreagents were used throughout the whole preparation procedure, which would not damage theenvironment. Solid phase extraction with C18 columns had been used in order to minimise thecontamination in column [34]. This was an excellent method for removal of lipophilic compoundslike pigments, which bind strongly to the SPE column. NH2 solid phase extraction columns wereanother choice for purifying samples. However, in contrast to C18 columns, the organic acids werequantitatively retained on the NH2 columns and needed to be eluted with high levels organic solvents
Molecules 2019, 24, 2150 10 of 14
subsequently [34–36]. Therefore, this was an accurate and environmental friendly approach to quantifyorganic acids in hawthorn wine.
3. Materials and Methods
3.1. Materials and Reagents
Hawthorn fruits used to brew the wine were purchased from the local fruit market (Taian, China),organic acids contents of them were shown in Table 5. Commercial wine yeast SIHA Active Yeast3 (Saccharomyces cerevisiae WET 136) reputed to hawthorn wine making was purchased from E.Begerow GmbH & Co (Langenlonsheim, Germany). Standards including citric acid (99.5%), lactic acid(92%), acetic acid (99.7%), fumaric acid (99%) and succinic acid (99%) were purchased from SigmaAldrich (St. Louis, MO, USA). l-malic acid standard (98%) was obtained from Aladdin (Shanghai,China). Pyruvic acid (98%) was ordered at Yuanye (Shanghai, China). Organic acid assay kits werepurchased from Megazyme (Bray, Ireleand), including acetic acid (ACS Manual Format, K-ACET;accepted by ISO, EN, CUMSA, IFU, MEBAK), citric acid (K-CITR; accepted by AOAC, OIV, EU, ISO2963,IFU22, MEBAK), succinic acid (K-SUCC; accepted by EEC), d-/l-lactic acid (K-DLATE; accepted byISO, EEC, DIN, GOST, IDF, EN, OIV, AIJN, IFU, MEBAK) and l-malic acid (Manual Format, K-LMAL;accepted by AOAC, EEC, EN, NF, NEN, DIN, GOST, OIV, AIJN, IFU, MEBAK) assay kits. Plantpyruvate ELISA and fumaric ELISA acid kits were purchased at Jiangsu Jingmei Biological TechnologyCo. Ltd. (Jiangsu, China).
Table 5. Organic acids in hawthorn fruits.
Organic Acid Citric Succinic l-malic Acetic Lactic Pyruvic Fumaric TOA
Content (mg/g) 26.95 ± 0.41 0.63 ± 0.05 3.29 ± 0.08 0.75 ± 0.13 0.06 ± 0.00 0.02 ± 0.00 nd 31.70 ± 0.67
nd, below detectable limit; all values are expressed as means ± standard deviation (n = 3).
3.2. Technological Process of Hawthorn Wine Making
The making of hawthorn wine was performed according to He et al. [10] and with somemodification. Well-matured hawthorn fruits were selected, which was characterized as having a darkred fruit skin and a strong fruit aroma. The fruits were washed with tap water and 100 mg/L of KMnO4,followed by flushing with sterile water, draining and crushing by a crusher to 3–5 mm size particles.The crushed hawthorn fruit must was mixed with a 40% aqueous solution of white granulated sugar(mash) in a ratio of 1:1.2 in a fermenter with an 80% loading. Yeast SIHA Active Yeast 3 in a ratio of 30g/100 kg by chaptalized must was added into the must to obtain a total inoculated population up to5.0 × 106 cells/mL. The fermentation temperature was conducted at 22–24 ◦C. The fermenting mashwas gently stirred once a day. The pomace and seed were separated from the fermented juice whenthe residual sugar in the must had no longer decreased over three consecutive days. After aging, thehawthorn wine was clarified with 1.2 g/L bentonite. The wine was filtered and bottled. Ten hawthornwines were made for organic acids analysis.
3.3. Chemical Analysis
Physicochemical indexes of hawthorn wine were determined including alcohol, reducing sugar,sugar-free extract, titratable acidity and pH value. The alcohol and sugar-free extract of the hawthorn winewere performed with the method of pycnometer according to the methods of the National Standards of thePeople’s Republic of China GB/T 15038. The automatic determine instrument of reducing sugar (SGD-IV-D,China) was used to quantify reducing sugar. The total acidity was performed by potentiometric titration,with pH 8.20 as titration end-point titrated with 0.1 M sodium hydroxide standard solution and calculatedaccording to the volume of sodium hydroxide consumed. The pH value was measured directly in thewine by the laboratory recording pH meter (Mettler Toledo, Switzerland).
Molecules 2019, 24, 2150 11 of 14
3.4. Identification of Organic Acids with the Enzymatic Method
Identification of organic acids in hawthorn wines with the enzymatic method was conductedaccording to the manufacturer’s instruction. A multi-mode microplate reader (SpectraMaxR M5,Molecular Devices, San Jose, CA, USA) was used for the measurements. The pretreatment anddetermination of samples were conducted according to the manufacturer’s manual.
3.5. Quantification of Organic Acids with HPLC Method 1
3.5.1. Pretreatment of Samples
Samples were centrifuged at 5000 rpm for 10 min; the resulting supernatant was aliquoted intotwo parts after a five-fold dilution with purified water. Part one was sequentially filtered through a0.45 µm and a 0.22 µm pore size membrane filters (Nylon PES, Tianjin, China) for further analysis. Parttwo was passed through a LC-18 SPE Tube (SupelcleanTMLC-18 SPE Tubes, Supelco, USA) activatedby menthol in advance according to the manufacturer’s instruction and then sequentially filtered by a0.45 µm and a 0.22 µm pore size membrane filters (Nylon PES, Tianjin, China) for further analysis.
3.5.2. Chromatographic Condition
Quantification of organic acids by Aminex HPX-87H column (300 × 7.8 mm, Bio-Rad, Hercules,CA, USA) was performed as described previously [34] with some modifications. The mobile phase was3 mM sulfuric acid aqueous solution. Sample (20 µL) was separated on a column set at 42 ◦C with a flowrate of 0.6 mL/min; and the absorbance at 215 nm was monitored by an SPD-M20A detector (Shimadzu,Japan). The HPLC system consisted of two pumps (LC-20 AT, Shimadzu, Kyoto, Japan), a degasser(DGU-20A, Shimadzu), an autosampler (SIL-20 A, Shimadzu) and a column oven (CTO-20A, Shimadzu).Chromatograms were evaluated with the Clarity software package (LabSolutions, Shimadzu). Thismethod was termed as HPLC method 1.
3.5.3. Quantification of Organic Acids
The peaks of organic acids were identified by their retention time, and quantification wasdetermined using an external standard curve. Six concentration points were used to plot the calibrationcurves. The limit of detection was the minimal concentration of the analyte giving a peak height withonly three times of the noise base line, and 10 times for the limit of quantification. Linearity of organicacids signal is presented in Table 3.
3.6. Quantification of Organic Acids with HPLC Method 2
3.6.1. Pretreatment of Samples
Samples were centrifuged at 5000 rpm for 10 min to harvest the supernatant which was thereafterdivided into two parts after being diluted fourfold using purified water. The pretreatment of these twoparts was as same as Section 3.5.1.
3.6.2. Chromatographic Condition
Organic acids in the samples were separated on a dC18 column (250 × 4.6 mm, 5 µm, Waters,Atlantis, MA, USA) as described previously [23] with some modifications. The mobile phase was0.02 M KH2PO4 (pH 2.8) with a flow rate of 0.7 mL/min and the column temperature was 35 ◦C.The injection volume was 10 µL. Samples were detected with DAD (Shimadzu, Japan) at a wavelengthof 210 nm in the same HPLC system. This method was termed as HPLC method 2.
Molecules 2019, 24, 2150 12 of 14
3.6.3. Quantification of Organic Acids
Under the chromatographic conditions described above, calibration curves were determined forthe mixture of organic acids standard solutions with five different concentrations. Table 3 shows thelinear equation, the range of linearity and the determination coefficients of organic acids.
3.7. Pretreatment with LC-18 SPE Tube
The effect of LC-18 SPE tube on organic acid standards was verified through the recoveryexperiment. The mixture of standards containing seven organic acids was diluted into differentconcentrations, and each concentration was divided into two groups. The pretreatment of these twogroups was as same as Section 3.5.1. The calculation was performed using the Equation (1):
% Recoverystandards = standards pretreated by the LC-18 SPE tube/standards without pretreatment × 100 (1)
The presence of organic acid interfering substances was verified by sample recovery rate. Threehawthorn wine samples were diluted five-fold with purified water after centrifugation; and each samplewas aliquoted into two groups with the same treatment as organic acid standards. The calculation wasperformed using the Equation (2):
% Recoverysamples = samples pretreated by the LC-18 SPE tube/samples without pretreatment × 100 (2)
In order to validate the proposed method, a fortified recovery test was conducted by 5 mLof analyzing samples fortified with 5 mL of certain concentration of the mixed standards solution.The calculation was carried out using the Equation (3):
% Recovery = 2 × analyte mixture of standards and samples/(analytesample+ analytestandard) × 100 (3)
3.8. Statistical Analysis
Data were indicated as means ± SD of three replicates. Statistical analysis was performed usingSPSS software version 22.0 (SPSS-IBM Inc, Chicago, IL, USA). One-way analysis of variance (ANOVA)was applied to analyze the difference of the results from HPLC method 1, HPLC method 2 andenzymatic method. Mean differences at p < 0.05 were considered to be significant using Tukey test.Sigmaplot 12.0 was used to draw HPLC chromatograms.
4. Conclusions
Two HPLC methods differed greatly in the degree of separation, analytical time and accuracyin determination organic acids in the hawthorn wines. A clean-up pretreatment of LC-18 SPE tuberemoved the impurity effectively, resulting in a significantly shortened elution period when the sampledetected by an 87H column with a DAD detector at 215 nm (HPLC method 1). Citric and lactic acidswere quantified accurately with this method. Using a dC18 column equipped with DAD detector at210 nm (HPLC method 2), citric, succinic, l-malic, acetic, pyruvic, and fumaric acids were quantifiedreliably with the results of enzymatic method as references, even without the pretreatment of LC-18SPE tube. It was concluded that HPLC method 2 was an effective method to quantify the organic acidsin hawthorn wine. To our knowledge, it was the first time these two HPLC methods were comparedfor the quantification of organic acids in hawthorn wine. All organic acids analyzed in this study weretaking enzymatic method as a reference, making the measurement results more accurate and reliable.In addition, this study also provided a method for quantifying the main organic acids simultaneouslyand accurately, and a good choice for quantification organic acids in other drinks could be suggested.
Author Contributions: Y.H. managed the data acquisition, analyzed and interpreted the results, and drafted themanuscript; J.D. designed, reviewed and edited the study; J.L. reviewed and edited the study; M.L. criticallyrevised the manuscript. All authors have read and approved the manuscript.
Molecules 2019, 24, 2150 13 of 14
Funding: This study was supported by the major agricultural application technology innovation projects ofShandong Province in 2018 (Title: New alcoholic fermented and liquor products from low-value apple andhawthorn wine, food safety key issues solutions, and promotion demonstration)
Conflicts of Interest: The authors declare no conflicts of interest.
References
1. Rigelsky, J.M.; Sweet, B.V. Hawthorn wine: Pharmacology and therapeutic uses. Am. J. Health Syst. Ph. 2002,59, 417–422. [CrossRef] [PubMed]
2. Zhang, Z.S.; Ho, W.K.K.; Huang, Y.; Chen, Z.Y. Hypocholesterolemic activity of hawthorn wine fruit ismediated by regulation of cholesterol-7alpha-hydroxylase and acyl COA: Cholesterol acyltransferase. FoodRes. Int. 2002, 35, 885–891. [CrossRef]
3. Quettier-Deleu, C.; Voiselle, G.; Fruchart, J.C.; Duriez, P.; Teissier, E.; Bailleul, F.; Vasseur, J.; Trotin, F.Hawthorn wine extracts inhibit LDL oxidation. Pharmazie 2003, 58, 577–581. [PubMed]
4. Tassell, M.C.; Rosari, K.; Deirdre, G.; Mary, L.; Ambrose, F. Hawthorn wine (Crataegus spp.) in the treatmentof cardiovascular disease. Pharm. Rev. 2010, 4, 32–41.
5. Zhu, R.G.; Sun, Y.D.; Li, T.P.; Chen, G.; Peng, X.; Duan, W.B.; Zheng, Z.Z.; Shi, S.L.; Xu, J.G.; Liu, Y.H.; et al.Comparative effects of hawthorn wine (Crataegus pinnatifida, bunge) pectin and pectin hydrolyzates onthe cholesterol homeostasis of hamsters fed high-cholesterol diets. Chem. Biol. Interact. 2015, 238, 42–47.[CrossRef] [PubMed]
6. Aierken, A.; Buchholz, T.; Chen, C.; Zhang, X.; Melzig, M.F. Hypoglycemic effect of hawthorn wine in type IIdiabetes mellitus rat model. J. Sci. Food Agr. 2017, 97, 4557–4561. [CrossRef] [PubMed]
7. Liu, P.Z.; Kallio, H.; Lü, D.G.; Zhou, C.S.; Ou, S.Y.; Yang, B.R. Acids, sugars, and sugar alcohols in Chinesehawthorn wine (Crataegus spp.) fruits. J. Agr. Food Chem. 2010, 58, 1012–1019. [CrossRef]
8. Silva, F.L.D.N.; Schmidt, E.M.; Messias, C.L.; Eberlin, M.N. Quantitation of organic acids in wine and grapesby direct infusion electrospray ionization mass spectrometry. Anal. Methods UK 2014, 7, 53–62. [CrossRef]
9. Hu, J.T.; Du, J.H.; He, G.F. Influence of fruit yeasts on quality and antioxidant capability of hawthorn winewine. Liquor making 2012, 39, 52–56.
10. He, G.F.; Sui, J.L.; Du, J.H.; Lin, J. Characteristics and antioxidant capacities of five hawthorn wine winesfermented by different wine yeasts. J. Inst. Brewing 2013, 119, 321–327. [CrossRef]
11. Liu, S.W.; Zhang, X.; You, L.; Guo, Z.Y.; Chang, X.D. Changes in anthocyanin profile, color, and antioxidantcapacity of hawthorn wine wine (Crataegus pinnatifida) during storage by pretreatments. LWT Food Sci.Technol. 2018, 95, 179–186. [CrossRef]
12. Liu, S.W.; Chang, X.D.; Liu, X.F.; Shen, Z.E. Effects of pretreatments on anthocyanin composition, phenolicscontents and antioxidant capacities during fermentation of hawthorn wine (Crataegus pinnatifida) drink.Food Chem. 2016, 212, 87–95. [CrossRef]
13. Dong, W.J.; Du, J.H.; Fu, Y.Z. Research of hawthorn wine wine with reduced methanol content. Liquor Making2015, 42, 40–45.
14. Anthon, G.E.; Lestrange, M.; Barrett, D.M. Changes in pH, acids, sugars and other quality parameters duringextended vine holding of ripe processing tomatoes. J. Sci. Food Agr. 2011, 91, 1175–1181. [CrossRef]
15. Velterop, J.S.; Vos, F. A rapid and inexpensive microplate assay for the enzymatic determination of glucose,fructose, sucrose, l-malate and citrate in tomato (Lycopersicon esculentum) extracts and in orange juice.Phytochem. Anal. 2001, 12, 299–304. [CrossRef]
16. Vermeir, S.; Nicolai, B.; Jans, K.; Maes, G.; Lammertyn, J. High-throughput microplate enzymatic assays forfast sugar and acid quantification in apple and tomato. J. Agr. Food Chem. 2007, 55, 3240–3248. [CrossRef]
17. Arraezroman, D.; Fernandezsanchez, J.F.; Cortaceroramirez, S.; Seguracarretero, A.; Fernandezgutierrez, A. Asimple light-emitted diode-induced fluorescence detector using optical fibers and a charged coupled devicefor direct and indirect capillary electrophoresis methods. Electrophoresis 2006, 27, 1776–1783. [CrossRef]
18. Peres, R.G.; Moraes, E.P.; Micke, G.A.; Tonin, F.G.; Tavares, M.F.M.; Rodriguez-Amaya, D.B. Rapid methodfor the determination of organic acids in wine by capillary electrophoresis with indirect UV detection. FoodControl. 2009, 20, 548–552. [CrossRef]
19. Jham, G.N.; Fernandes, S.A.; Garcia, C.F.; Da, S.A. Comparison of GC and HPLC for the quantification oforganic acids in coffee. Phytochem. Anal. 2002, 13, 99–104. [CrossRef]
Molecules 2019, 24, 2150 14 of 14
20. Stelios, K.; Paraskeri, S.; Theophiles, M. Comparison of the characteristics of set type yoghurt made fromovine milk of different fat content. Int. J. Food Sci. Tech. 2007, 42, 1019–1028.
21. Tanaka, K.; Mori, M.; Xu, Q.; Helaleh, M.I.H.; Ikedo, M.; Taoda, H.; Hu, W.; Hasebe, K.; Fritz, J.S.; Haddad, P.R.Ion-exclusion chromatography with conductimetric detection of aliphatic carboxylic acids on a weakly acidiccation-exchange resin by elution with benzoic acid-β-cyclodextrin. J. Chromatogr. A. 2003, 997, 127–132.
22. Tormo, M.; Izco, J.M. Alternative reversed-phase high-performance liquid chromatography method toanalyse organic acids in dairy products. J. Chromatogr. A. 2004, 1033, 305–310. [CrossRef]
23. Scherer, R.; Rybka, A.C.P.; Ballus, C.A.; Meinhart, A.D.; Filho, J.T.; Godoy, H.T. Validation of a HPLC methodfor simultaneous determination of main organic acids in fruits and juices. Food Chem. 2012, 135, 150–154.[CrossRef]
24. Coelho, E.M.; Padilha, C.V.; Miskinis, G.A.; De Sá, A.G.B.; Pereira, G.E.; Azevedo, L.; Lima, M.D. Simultaneousanalysis of sugars and organic acids in wine and grape juices by HPLC: Method validation and characterizationof products from Northeast Brazil. J. Food Compos. Anal. 2018, 66, 160–167. [CrossRef]
25. Pereira, V.; Câmara, J.S.; Cacho, J.; Marques, J.C. HPLC-DAD methodology for the quantification of organicacids, furans and polyphenols by direct injection of wine samples. J. Sep. Sci. 2010, 33, 1204–1215. [CrossRef]
26. Kadakal, C.; Nas, S. Effect of activated charcoal on patulin, fumaric acid and some other properties of applejuice. Die Nahrung 2002, 46, 31–33. [CrossRef]
27. Gökmen, V.; Acar, J. Fumaric acid in apple juice: A potential indicator of microbial spoilage of apples used asraw material. Food Addit Contam. 2004, 21, 626–631. [CrossRef]
28. Shapiro, F.; Silanikove, N. Rapid and accurate determination of malate, citrate, pyruvate and oxaloacetateby enzymatic reactions coupled to formation of a fluorochromophore: Application in colorful juices andfermentable food (yogurt, wine) analysis. Food Chem. 2011, 129, 608–613. [CrossRef]
29. Konieczka, P. The role of and the place of method validation in the quality assurance and quality control(QA/QC) system. Crit. Rev. Anal. Chem. 2007, 37, 173–190. [CrossRef]
30. Gao, Y.; Ierapetritou, M.G.; Muzzio, F.J. Determination of the confidence interval of the relative standarddeviation using convolution. J. Pharm. Innov. 2013, 8, 72–82. [CrossRef]
31. Agius, C.; Tucher, S.V.; Poppenberger, B.; Rozhon, W. Quantification of sugars and organic acids in tomatofruits. Methodsx 2018, 5, 537–550. [CrossRef]
32. Gałuszka, A.; Migaszewski, Z.M.; Konieczka, P.; Namiesnik, J. Analytical Eco-Scale for assessing thegreenness of analytical procedures. Trends Anal. Chem. 2012, 37, 61–72. [CrossRef]
33. Płotka-wasylka, J. A new tool for the evaluation of the analytical procedure: Green analytical procedureindex. Talanta 2018, 181, 204–209. [CrossRef]
34. Cristina, G.M.; Luh, B.S. HPLC analysis of organic acids and sugars in tomato juice. J. Food Sci. 2010, 51,571–573.
35. Marconi, O.; Floridi, S.; Montanari, L. Organic acids profile in tomato juice by HPLC with UV detection. J.Food Qual. 2007, 30, 253–266. [CrossRef]
36. Rozhon, W.; Petutschnig, E.; Wrzaczek, M.; Jonak, C. Quantification of free and total salicylic acid in plantsby solid-phase extraction and isocratic high-performance anion-exchange chromatography. Anal. Bioanal.Chem. 2005, 382, 1620–1627. [CrossRef]
Sample Availability: Samples of the compounds are available from the authors.
© 2019 by the authors. Licensee MDPI, Basel, Switzerland. This article is an open accessarticle distributed under the terms and conditions of the Creative Commons Attribution(CC BY) license (http://creativecommons.org/licenses/by/4.0/).