QUANTIFICATION OF PRIMARY PRODUCTION IN WADDEN SEA USING REMOTE SENSING AND FIELD MEASUREMENTS
54
QUANTIFICATION OF PRIMARY PRODUCTION IN WADDEN SEA USING REMOTE SENSING AND FIELD MEASUREMENTS MICAEL G. WOLDEGIORGIS February, 2012 SUPERVISORS: Dr. Ir. Suhyb Salama Dr. Ir. Chris Mannaerts
-
Upload
independent -
Category
Documents
-
view
3 -
download
0
Transcript of QUANTIFICATION OF PRIMARY PRODUCTION IN WADDEN SEA USING REMOTE SENSING AND FIELD MEASUREMENTS
QUANTIFICATION OF PRIMARY PRODUCTION IN WADDEN SEA USING REMOTE SENSING AND FIELD MEASUREMENTS
MICAEL G. WOLDEGIORGIS February, 2012
SUPERVISORS: Dr. Ir. Suhyb Salama Dr. Ir. Chris Mannaerts
Thesis submitted to the Faculty of Geo-Information Science and Earth Observation of the University of Twente in partial fulfilment of the requirements for the degree of Master of Science in Geo-information Science and Earth Observation. Specialization: Water Resources and Environmental Management SUPERVISORS: Dr. Ir. Suhyb Salama Dr. Ir. Chris Mannaerts THESIS ASSESSMENT BOARD: Prof. Dr. Ing. Wouter Verhoef (Chair) Dr. Hans van der Woerd (External Examiner, Institute for Environmental Studies, Vrije Universiteit Amsterdam)
QUANTIFICATION OF PRIMARY PRODUCTION IN WADDEN SEA USING REMOTE SENSING AND FIELD MEASUREMENTS
MICAEL G. WOLDEGIORGIS Enschede, The Netherlands, February, 2012

DISCLAIMER This document describes work undertaken as part of a programme of study at the Faculty of Geo-Information Science and Earth Observation of the University of Twente. All views and opinions expressed therein remain the sole responsibility of the author, and do not necessarily represent those of the Faculty.
i
ABSTRACT
Primary production is production of organic compounds by the processes of photosynthesis through interaction of carbon dioxide from the atmosphere or aquatic system, inorganic raw materials and light as a main energy source. Aim of the research was to use a remote sensing approach to quantify phytoplankton biomass and its primary production in the water column of the Wadden Sea and compare them with insitu data. Long-term remote sensing data were utilized to analyze the Primary Productivity of Wadden Sea with its trends and anomalies. In this work we determined the temporal–spatial variations of primary production (PP), based on a vertically generalized production model (VGPM) from 2003 to 2011 using two sensors- MERIS and MODIS. The result showed that higher Chl-a concentration and PP values were recorded in Wadden Sea in 2003 and 2007 than in other years. Between 2003-2011, the annual mean daily PP, calculated as the mean for all 3 sites (near Marsdiep, mid of Dutch Wadden Sea and near west Terschelling), ranged from 0.026 to 4.52 g C m-2day-1. The highest daily PP of Wadden Sea was occurred in 2003 and 2008, 4.52 and 4.40 gC m-2day-1. A mean value of the daily mean PP for 3 sites provides an approximation of annual PP for Wadden sea values, calculated by sum up every month to give total annual PP. The total annual integrated PP of the Wadden sea , from 2003-2010, ranged from 22.95 gC m-2 year-1 in 2010 to 24.96 gC m-2 year-1 2003. From MODIS time series analyzed data, mean daily PP decreased significantly in 2009-2011 compared with 2003-2008. From the available 2011 MERIS images of study area annual mean PP is 2.50 g C m-2 day-1 and RMSE 0.19 g C m-2 day--1. There were marked spatial differences in PP within Wadden Sea. The highest annual mean daily PP of 4.52 gC m-2day-1 was recorded at site near Marsdiep inlet and has relatively higher PP than mid and eastern part of Dutch Wadden Sea. Monthly variations of daily mean PP were characterized by lowest values in January (following the Chl-a concentration) and peaks in July in all sites and sometimes highest PP occur in June. The summer (June–August) algal bloom accounted for 49.0% of the annual PP in Wadden Sea. By considering the effect of water temperature, photosynthetically active radiation and photoperiod on PP, the VGPM- generated PP more accurately captured monthly variations in Wadden Sea. Though the VGPM model has overestimated the insitu data, PP derived using the model from remote sensing approaches was strongly correlated with the 14C-based PP estimates of insitu measurements. The performance of the VGPM model can be improved further by adjusting retrieval models on important parameters such as Chl-a concentration (chl-a), euphotic depth (Zeu) and maximum Carbon fixation rate in water column (PBopt). .

ii
ACKNOWLEDGEMENTS
My Gratitude goes to many people who guide, assist and support me during my thesis work that it would not have been success without them. First and foremost I would like to express my eternal gratitude to my first supervisor Dr. Suhyb Salama for help me in writing IDL codes and insightful comments throughout my thesis period and for his guidance to carry out the research in scientific framework. My earnest thanks to Dr. Chris Mannaerts, my second supervisor, for his helpful knowledge in analysis and critically reading of my thesis. I wish also to thanks to the People and Government of Netherlands for grant me fellowship. I would like to thank the Navicula and IN PLACE teams from the Royal Netherlands Institute for Sea Research (NIOZ) and ITC for their technical and scientific supports. Thanks to Katja Philippart (NIOZ) and Jacco Kromkamp (NIOZ-Yerseke) I am indebted to Mussie Ghirmai for his consistent support and encouragement to complete my research. Sincere gratitude to my classmates, especially Tewelde Yideg, for their many hours of discourse in academic and general discussion, and coffee break which make ITC memorable. To my family words are not enough to express my sincerely appreciation for your love and motivation which contribute to my overall well-being. All Glory and honour belongs to Jesus Christ son of the almighty God for his mercies that carried me throughout my research.
iii
TABLE OF CONTENTS 1. Introduction ........................................................................................................................................................... 1
1.1. Background ...................................................................................................................................................................1 1.2. Research problem ........................................................................................................................................................2 1.3. Research objectives .....................................................................................................................................................2 1.4. Research questions ......................................................................................................................................................2 1.5. Research hypothesis ....................................................................................................................................................3 1.6. Thesis Structure ...........................................................................................................................................................3
2. Literature Review .................................................................................................................................................. 5 2.1. Chlorophyll-a ................................................................................................................................................................5 2.2. Primary Production .....................................................................................................................................................5
3. Study Area and Datasets ..................................................................................................................................... 9 3.1. Study Area .....................................................................................................................................................................9 3.2. Datasets ...................................................................................................................................................................... 11 3.3. Remote sensing Datasets......................................................................................................................................... 13 3.4. Photoperiod(Dirr) .................................................................................................................................................... 14
4. Methodology ....................................................................................................................................................... 15 4.1. Coastal case 2 Regional Processor (C2R) ............................................................................................................. 16 4.2. Models and processing ............................................................................................................................................ 17 4.3. Time series Analysis ................................................................................................................................................. 19
5. Results .................................................................................................................................................................. 21 5.1. Atmospheric correction........................................................................................................................................... 21 5.2. Input Parameters ...................................................................................................................................................... 22 5.3. Input parameters and Primary production .......................................................................................................... 29 5.4. Primary Production .................................................................................................................................................. 30 5.5. MERIS Mapping of Primary Production (PP) .................................................................................................... 32 5.6. Comparison of MERIS PP and MODIS PP ....................................................................................................... 33 5.7. Comparison of Insitu PP with MODIS and MERIS PP .................................................................................. 34
6. Discussion ........................................................................................................................................................... 37 6.1. Temporal and Spatial Variation of Chlorophyll-a .............................................................................................. 37 6.2. Assessment of temporal and spatial patterns of Chl-a and other input parameters to PP ......................... 37 6.3. Evaluation on Variation of PBopt.......................................................................................................................... 38 6.4. Assessment of primary production Variations ................................................................................................... 39 6.5. PP Value and Anomalies Trend ........................................................................................................................... 39 6.6. Uncertainty analysis .................................................................................................................................................. 40
7. Conclusions and Recommendations .............................................................................................................. 41 7.1. Conclusions ............................................................................................................................................................... 41 7.2. Recommendations .................................................................................................................................................... 41
iv
LIST OF FIGURE Figure 1-1 Thesis Structure .......................................................................................................................................... 4 Figure 3-1 Location map of study area ...................................................................................................................... 9 Figure 3-2 Study Area- Wadden Sea and its neighborhood water....................................................................... 10 Figure 3-3 Microflu sensors for chlorophyll-a concentration(A and B), mounted Trios RASMES irradiance and radiance sensors(C) and sensors monitoring room(D) .................................................................................. 12 Figure 3-4 Sampling sites for 3 days in Wadden Sea during field campaign ..................................................... 13 Figure 5-1 MERIS –corrected Rrs and insitu Rrs spectra for accuracy assessment of atmospheric correction in the study area ........................................................................................................................................ 21 Figure 5-2 Validation of measured chl-a concentration on MERIS derived absorption of chl-a .................. 22 Figure 5-3 MODIS time series chlorophyll-a concentration variation from 2003 to 2011 ............................. 23 Figure 5-4 a, b: Spatial distribution map (28 September 2011, MERIS FR) and temporal variation (monthly average, MODIS) of chlorophyll-a concentration in the study area .................................................. 24 Figure 5-5 Time series MODIS SST and PBopt Variation from 2003 to 2011 ................................................ 24 Figure 5-6 a, b: Spatial distribution map (28 September 2011, MODIS resampled to 300 m spatial resolution) and temporal variation (monthly average, MODIS) of sea surface temperature in the study area ........................................................................................................................................................................................ 25 Figure 5-7 Relationship of MODIS SST and PBopt .............................................................................................. 26 Figure 5-8 MODIS time series Euphotic depth data from 2003 to 2011 .......................................................... 26 Figure 5-9 a, b: Spatial distribution map (28 September 2011, MERIS FR) and temporal variation (monthly average, MODIS) of euphotic depth in the study area ......................................................................................... 27 Figure 5-10 MODIS time series PAR of the study area from 2003 to 2011 ..................................................... 28 Figure 5-11 a, b: Spatial distribution map (28 September 2011, MODIS resampled to 300 m spatial resolution) and temporal variation (monthly average, MODIS) of photosynthetically active radiation in the study area ...................................................................................................................................................................... 28 Figure 5-12 Average monthly sunshine day length (photoperiod) ...................................................................... 29 Figure 5-13 Mean annual PP of Wadden Sea from MERIS (left) and standard deviation (right).................. 31 Figure 5-14 Comparison of PP in three different areas of the Wadden Sea from MERIS data for the year 2011 ............................................................................................................................................................................... 31 Figure 5-15 Monthly Primary Production maps of Wadden Sea for year 2011 ................................................ 32 Figure 5-16 Time series primary production of Wadden Sea from MODIS data (2003-2011) and MERIS data of year 2011.......................................................................................................................................................... 33 Figure 5-17 MODIS primary production versus MERIS primary production for the year of 2011 from March to October ........................................................................................................................................................ 33 Figure 5-18 a,b,c,d : Correlation of MODIS PP to insitu PP 2005,2006,2010 and 2011 respectively .......... 34 Figure 5-19 Correlation of MERIS PP to insitu PP 2011 ..................................................................................... 35 Figure 5-20 a, b, c, d: Comparison of MODIS PP and insitu PP 2005, 2006, 2010 and 2011 respectively . 36 Figure 6-1 Relationship between PBopt and PP in Wadden Sea. ........................................................................ 38

v
LIST OF TABLES Table 2-1 List of some of the existing primary production algorithms ................................................................ 7 Table 3-1 Main Field Measurements ....................................................................................................................... 12 Table 3-2 Coordinates of the stations sampled from study area ........................................................................ 12 Table 3-3 Time and dates of MERIS cloud-free images in the Study Area for the year 2011 ...................... 14 Table 4-1 VGPM model input parameters and Source of data acquisition ...................................................... 19
vi
LIST OF ACRONYMS Term Description aChl-a Absorption by Chlorophyll-a aCDOM(λ) Absorption by Colored dissolved organic matters aNAP(λ) Absorption by Non-Algal particles CDOM Colored dissolved organic matters [chl-a] Chlorophyll-a concentration chl-a Chlorophyll-a CZCS Coastal Zone Color Scanner ENVISAT Environmental Satellite IOP Inherent optical properties MODIS Moderate Resolution Imaging Spectrometer MERIS Medium Resolution Imaging Spectrometer NIR Near-InfraRed NAP Non-Algal Particle Rrs Remote Sensing Reflectance RS Remote sensing SPM Suspended particulate matters ESA European space Agency NASA National Aeronautics and Space Administration DPPP Daily Phytoplankton primary production PPC Phytoplankton pigment concentration Dirr Photoperiod Eo Daily sea surface PAR PAR Phytosynthetically active radiation Zeu Euphotic depth PP Primary Production PBOpt Optimal rate of daily carbon fixation within a water column aw (λ) Absorption of water bb (λ) Total back scattering SST Sea surface temperature FR Full Resolution RR Reduced Resolution DIC Dissolved inorganic carbon POC Particulate organic matter 14C Carbon-14 SeaWiFS Sea-viewing Wide Field-of-view Sensor C2R Coastal Case 2 Regional Processor RLtoa top of atmosphere radiance reflectance RLw water leaving radiance reflectance BF Behrenfeld & Falkowski
QUANTIFICATION OF PRIMARY PRODUCTION IN WADDEN SEA USING REMOTE SENSING AND FIELD MEASUREMENTS
1
1. INTRODUCTION
1.1. Background Primary production is production of organic compounds by the processes of photosynthesis through interaction of carbon dioxide from the atmosphere or aquatic system, inorganic raw materials and light as a main energy source. All living organisms depend on primary production as it forms the base of food chain. Primary production is the formation of organic compounds in autotrophic organisms and consumed by heterotrophic organism, such as animals to fuel the entire earth living systems. In terrestrial plants are the main primary producers and algae accounts in the marine ecosystem.
Primary production is carried out in the water column dominantly by small, free-floating algal cells which forms the phytoplankton. The objective of this research is to study the water column primary production in Wadden Sea using remote sensing and their verification through field measurements. The phytoplankton produces organic compounds to increase their own cell numbers by attaining energy from sunlight and using inorganic raw materials. Phytoplankton are important as the base of aquatic food webs.
Understanding the primary production in time and space in Wadden Sea, which is inscribed on UNESCO`s World Heritage List, will assist in monitoring and prediction of preserving natural ecological environment and prolonged economic developments of the sea. The Wadden Sea is a shallow coastal sea with high both benthic and pelagic primary production rates (Loebl, Dolch, & van Beusekom, 2007). Generally numerous approaches have been carried out to estimate phytoplankton biomass and its productivity by field measurements. In previous, many researches carried out in Wadden Sea to quantify phytoplankton biomass and its primary productivity using field measurements. It was estimated low values during winter season with lowest rate in January and increase from the mid of March during phytoplankton bloom to a highest rate in May(Cadée, 1986). One of the main obstacles in estimating annual phytoplankton primary productivity is the seasonal variability of the phytoplankton growths. In the recent study by (Loebl et al., 2007) revealed yearly primary production of 146 gC m− 2 y− 1 in Wadden Sea which is much higher with current findings. At present growths of phytoplankton are limited due to high turbidity and availability of nitrogen compounds.
Field measurement are sparse in time and space, hence it is complicated and unreliable to know the true magnitude of primary production. It has become clear that the algal bloom and its primary productivity observed at spatial and temporal variability cannot be adequately characterized and analyzed from ship board measurements. Thus, remote sensing approaches have been developed through time. Such as primary production which was determined using 14C uptake in the Atlantic ocean to validate three primary production(PP) satellite algorithms to more complex semi –analytical models(Tilstone, Smyth, Poulton, & Hutson, 2009). The Wadden Sea is optically complex area due to its shallowness, high turbidity and fast changes in concentration of optically active substances. Recent research conducted by Hommerson, Peters, Wernand,& de Boer(2009)to examine specific inherent optical properties in Wadden Sea water quality parameters give out results with 2–67 (mg m-3) chlorophyll-a as proxy to phytoplankton biomass. Generally remote sensing works have been carried out to quantify phytoplankton biomass in Wadden Sea (Reid, Lancelot, Gieskes, Hagmeier, & Weichart, 1990) but no means remote sensing approach to quantify primary productivity.

QUANTIFICATION OF PRIMARY PRODUCTION IN WADDEN SEA USING REMOTE SENSING AND FIELD MEASUREMENTS
2
Although the economic and ecologic importance of the Wadden Sea has been recognized by many studies, e.g. UNESCO`s Heritage List, quantitative monitoring of PP is still lacking. To estimate qualitative and quantitative primary production, accurate ship-borne and satellite measurements are needed. Wadden Sea is an area with complicated processes in estuaries and tidal flats, thus, remote sensing research in such area requires high temporal and spatial resolution sensors, algorithms that work for low and high concentration of the substances and the local specific optical properties. In addition a simultaneous detection of water color and land-water boundaries, a very short time lag between acquisition of remote sensing and in-situ data used for validation are also important factors (A. Hommersom, Peters, de Boer, & Wernand, 2010). This MSc. Research focuses on remote sensing approach to quantify phytoplankton biomass and its primary productivity in water column of the Wadden Sea and compare them with insitu data. Satellites images from ocean color sensors such as MERIS/MODIS data were utilized to time series analysis of primary production.
1.2. Research problem Wadden Sea has both the Socio-economic and ecologic significance. Moreover on its social aspects, Wadden Sea has outstanding aesthetic scenery and recreational potentials which make it worthy for boating, sport fishing and bird watching. Wadden Sea is famous for its rich in flora and fauna, especially birds and seals. The imbalance in primary production in the sea, therefore, may results in major ecological and social impacts through habitat alteration, displacement of indigenous species, disproportionality in oxygen in the bottom waters and aquaculture mortality due to diminish or altering the food-web dynamics(Ghirmai Habte, 2011). It is therefore crucial to monitor the water quality in time and space based on Remote Sensing (RS) which provides synoptic spatial coverage for near real-time monitoring and mitigating of such impacts. Despite economic and socio-ecological importance of Wadden Sea, there is no adequate method for spatio-temporal analysis to the degrade/growth of phytoplankton and their primary production.
1.3. Research objectives Understanding the distribution of Chlorophyll (Chl-a)as proxy to phytoplankton biomass and its primary productivity in Wadden Sea will help in monitoring and predicting the growth of phytoplankton in the region for economic development and ecological and environmental sustainability of the region. The main objectives of the research are:
1. Using Case 2 Regional Processor (C2R) to derive chlorophyll-a absorption as proxy to the phytoplankton biomass from MERIS images. 2. Estimate the primary production in the Wadden Sea using remote sensing from MERIS and MODIS products using VGPM model. 3. Time series analysis of primary Production from MODIS data Products.
1.4. Research questions 1. Is it possible to determine Primary Production using VGPM model in shallow and complicated Wadden Sea from MERIS Images? 2. What is the correlation between MERIS and MODIS primary production results? 3. What is the distribution of the primary production in space and time in the Wadden Sea?
QUANTIFICATION OF PRIMARY PRODUCTION IN WADDEN SEA USING REMOTE SENSING AND FIELD MEASUREMENTS
3
1.5. Research hypothesis Concentration of Chl-a will be estimated using coastal case 2 regional processor model after validation with in-situ measurements. Chl-a product of MERIS will be processed using Vertical Generalized Production Model(VGPM) to quantify depth integrated primary production of the Wadden Sea with other four parameters such as photoperiod(Dirr), daily solar irradiance(Eo), euphotic depth(Zeu) and maximum Carbon fixation rate in water column(PBopt).
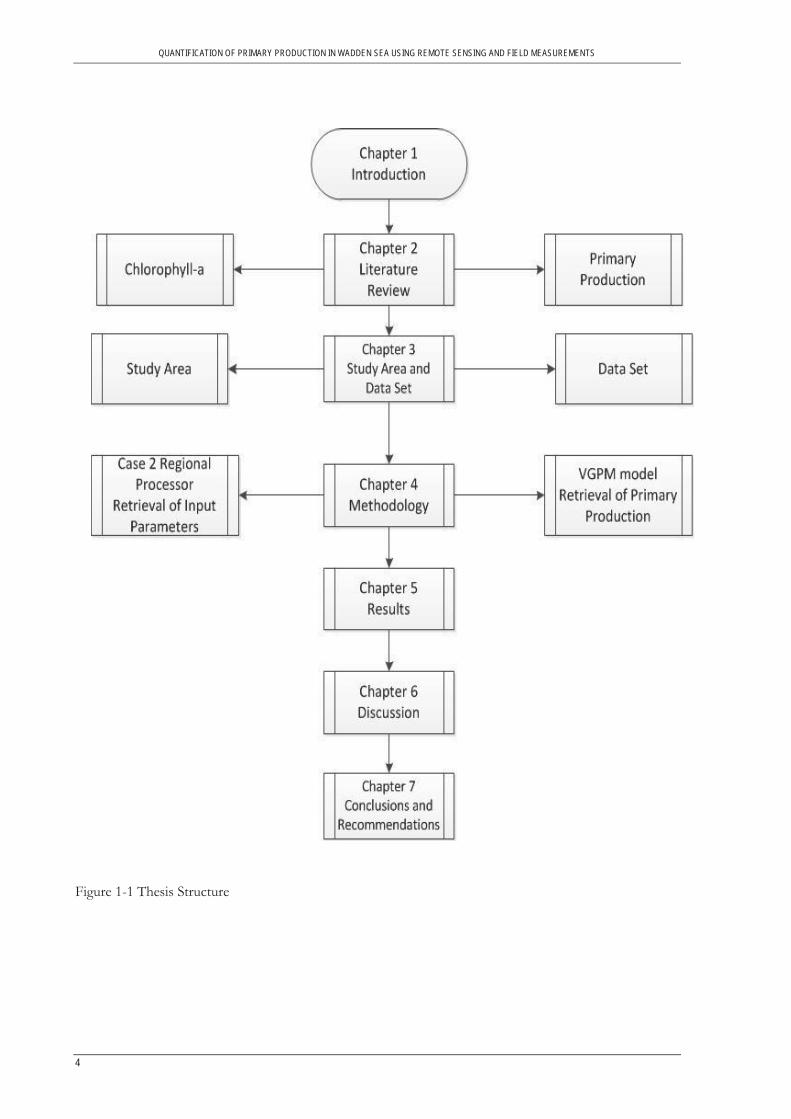
1.6. Thesis Structure This thesis is structured by chapters accordingly: Chapter one introduce general description of the work, research problems, objectives, questions and hypotheses. Chapter two discuss mainly on literature review based on previous works done of models both on inherited optical property and primary production. Chapter three describes the study areas and data set collected and used for processing to final products. Chapter four deals in detail with general methodology used to meet the objectives. Chapter five well presents the research findings (results). Chapter six offers complete discussion of the findings based on the results. Chapter seven consist of conclusions and recommendations (Figure 1-1)
QUANTIFICATION OF PRIMARY PRODUCTION IN WADDEN SEA USING REMOTE SENSING AND FIELD MEASUREMENTS
4
Figure 1-1 Thesis Structure

QUANTIFICATION OF PRIMARY PRODUCTION IN WADDEN SEA USING REMOTE SENSING AND FIELD MEASUREMENTS
5
2. LITERATURE REVIEW
The two main approaches that will be discuss in this research are remote sensing estimation of chlorophyll-a as proxy to phytoplankton biomass and model that uses chlorophyll-a along with other parameters to quantify primary productions. Many works has done to reliably estimate chlorophyll-a directly from satellites and hence to quantify of primary productions.
2.1. Chlorophyll-a Remote sensing of chlorophyll-a (chl-a) concentration, as proxy of phytoplankton biomass, mostly used on open oceans (case 1) waters and typically uses reflectance in the blue and green spectral regions. In turbid and productive waters (case II), however, this methodology cannot be used. The reflectance of the spectral region to estimate chlorophyll-a coincided and uncorrelated with absorption of CDOM as well as scattering and absorption by detritus((Gons, 1999);(Dall'Olmo & Gitelson, 2005)). The first satellite measurements were made by Coastal Zone Color Scanner (CZCS) which functioned between 1978 and 1986. SeaWiFS sensor, with enhanced spectral and radiometric resolution, was estimating global maps of chlorophyll-a concentration in 1997and later followed by MODIS and MERIS multispectral sensors for better quantification of Bio-optical properties.
Many investigations have been directed toward the development of remote sensing methods for the estimation of the chl-a concentration and other water constituents. Chl-a is key variable that controlling the primary productivity by phytoplaktons. Two main approaches to quantify chl-a are namely analytical and empirical/semianalytical. The analytical approach is based on specific inherent optical properties (SIOP) and IOPs such as absorption and scattering coefficients per unit concentration of constituents, which are used to simulate reflectance spectra by using a radiative transfer technique. The value of Specific inherent optical vary with time and space even within a water body. Hence assumption of SIOP is often invalid for turbid productive waters. The empirical or semianalytical approach involves algorithms that are based on relationships between physically based models and experimental results(Weng, 2011).
Recently many works are carried out to modify the existing algorithms for turbid waters. The analytical and semi-analytical algorithms ((Carder, Chen, Cannizzaro, Campbell, & Mitchell, 2004);(Lee, Carder, & Arnone, 2002)) are some of the bio-optical algorithms in ocean color remote sensing developed to evaluate water components. Optical models are also modified to be able to characterize the optical property of water body under investigation and improve their retrieval accuracy. The GSM algorithm was modified to estimate chl-a (Salama, Dekker, Su, Mannaerts, & Verhoef, 2009).Dall`Olmo & Gitelson(2005) have developed a three band NIR-red model to estimate chl-a. This model was initially developed for terrestrial vegetation pigment estimation. In addition two bands spectral ratios in the MERIS and MODIS spectrum (around 665nm and 753nm) are also developed by the same authors and lead to better correlation of the estimated chl-a in turbid waters.
2.2. Primary Production Many measurements have been made on marine primary production using radiolabelling based on carbon uptake (14C) method which was first introduced by Steemann Nielsen in 1952. Even though many primary
QUANTIFICATION OF PRIMARY PRODUCTION IN WADDEN SEA USING REMOTE SENSING AND FIELD MEASUREMENTS
6
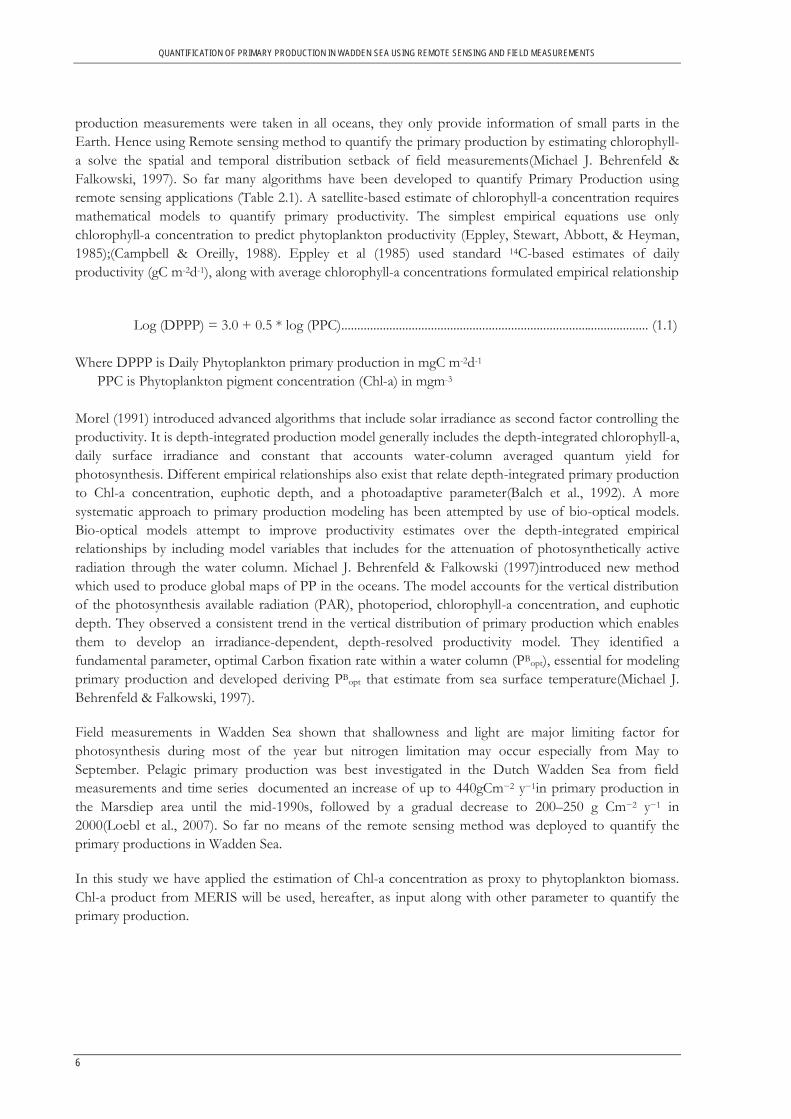
production measurements were taken in all oceans, they only provide information of small parts in the Earth. Hence using Remote sensing method to quantify the primary production by estimating chlorophyll-a solve the spatial and temporal distribution setback of field measurements(Michael J. Behrenfeld & Falkowski, 1997). So far many algorithms have been developed to quantify Primary Production using remote sensing applications (Table 2.1). A satellite-based estimate of chlorophyll-a concentration requires mathematical models to quantify primary productivity. The simplest empirical equations use only chlorophyll-a concentration to predict phytoplankton productivity (Eppley, Stewart, Abbott, & Heyman, 1985);(Campbell & Oreilly, 1988). Eppley et al (1985) used standard 14C-based estimates of daily productivity (gC m-2d-1), along with average chlorophyll-a concentrations formulated empirical relationship
Log (DPPP) = 3.0 + 0.5 * log (PPC)................................................................................................ (1.1) Where DPPP is Daily Phytoplankton primary production in mgC m-2d-1 PPC is Phytoplankton pigment concentration (Chl-a) in mgm-3 Morel (1991) introduced advanced algorithms that include solar irradiance as second factor controlling the productivity. It is depth-integrated production model generally includes the depth-integrated chlorophyll-a, daily surface irradiance and constant that accounts water-column averaged quantum yield for photosynthesis. Different empirical relationships also exist that relate depth-integrated primary production to Chl-a concentration, euphotic depth, and a photoadaptive parameter(Balch et al., 1992). A more systematic approach to primary production modeling has been attempted by use of bio-optical models. Bio-optical models attempt to improve productivity estimates over the depth-integrated empirical relationships by including model variables that includes for the attenuation of photosynthetically active radiation through the water column. Michael J. Behrenfeld & Falkowski (1997)introduced new method which used to produce global maps of PP in the oceans. The model accounts for the vertical distribution of the photosynthesis available radiation (PAR), photoperiod, chlorophyll-a concentration, and euphotic depth. They observed a consistent trend in the vertical distribution of primary production which enables them to develop an irradiance-dependent, depth-resolved productivity model. They identified a fundamental parameter, optimal Carbon fixation rate within a water column (PBopt), essential for modeling primary production and developed deriving PBopt that estimate from sea surface temperature(Michael J. Behrenfeld & Falkowski, 1997).
Field measurements in Wadden Sea shown that shallowness and light are major limiting factor for photosynthesis during most of the year but nitrogen limitation may occur especially from May to September. Pelagic primary production was best investigated in the Dutch Wadden Sea from field measurements and time series documented an increase of up to 440gCm−2 y−1in primary production in the Marsdiep area until the mid-1990s, followed by a gradual decrease to 200–250 g Cm−2 y−1 in 2000(Loebl et al., 2007). So far no means of the remote sensing method was deployed to quantify the primary productions in Wadden Sea.
In this study we have applied the estimation of Chl-a concentration as proxy to phytoplankton biomass. Chl-a product from MERIS will be used, hereafter, as input along with other parameter to quantify the primary production.
QUANTIFICATION OF PRIMARY PRODUCTION IN WADDEN SEA USING REMOTE SENSING AND FIELD MEASUREMENTS
7
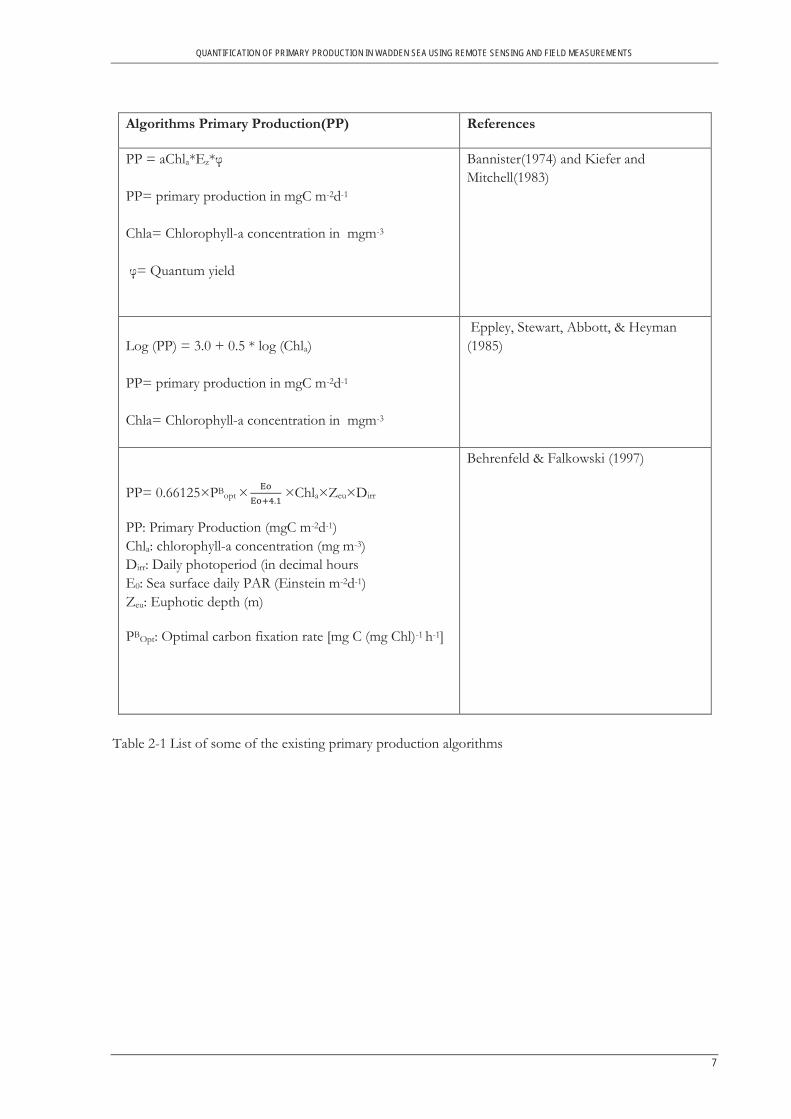
Algorithms Primary Production(PP) References
PP = aChla*Ez*φ PP= primary production in mgC m-2d-1 Chla= Chlorophyll-a concentration in mgm-3 φ= Quantum yield
Bannister(1974) and Kiefer and Mitchell(1983)
Log (PP) = 3.0 + 0.5 * log (Chla) PP= primary production in mgC m-2d-1 Chla= Chlorophyll-a concentration in mgm-3
Eppley, Stewart, Abbott, & Heyman (1985)
PP= 0.66125×PBopt × ×Chla×Zeu×Dirr
PP: Primary Production (mgC m-2d-1) Chla: chlorophyll-a concentration (mg m-3) Dirr: Daily photoperiod (in decimal hours E0: Sea surface daily PAR (Einstein m-2d-1) Zeu: Euphotic depth (m)
PBOpt: Optimal carbon fixation rate [mg C (mg Chl)-1 h-1]
Behrenfeld & Falkowski (1997)
Table 2-1 List of some of the existing primary production algorithms

QUANTIFICATION OF PRIMARY PRODUCTION IN WADDEN SEA USING REMOTE SENSING AND FIELD MEASUREMENTS
9
3. STUDY AREA AND DATASETS
3.1. Study Area
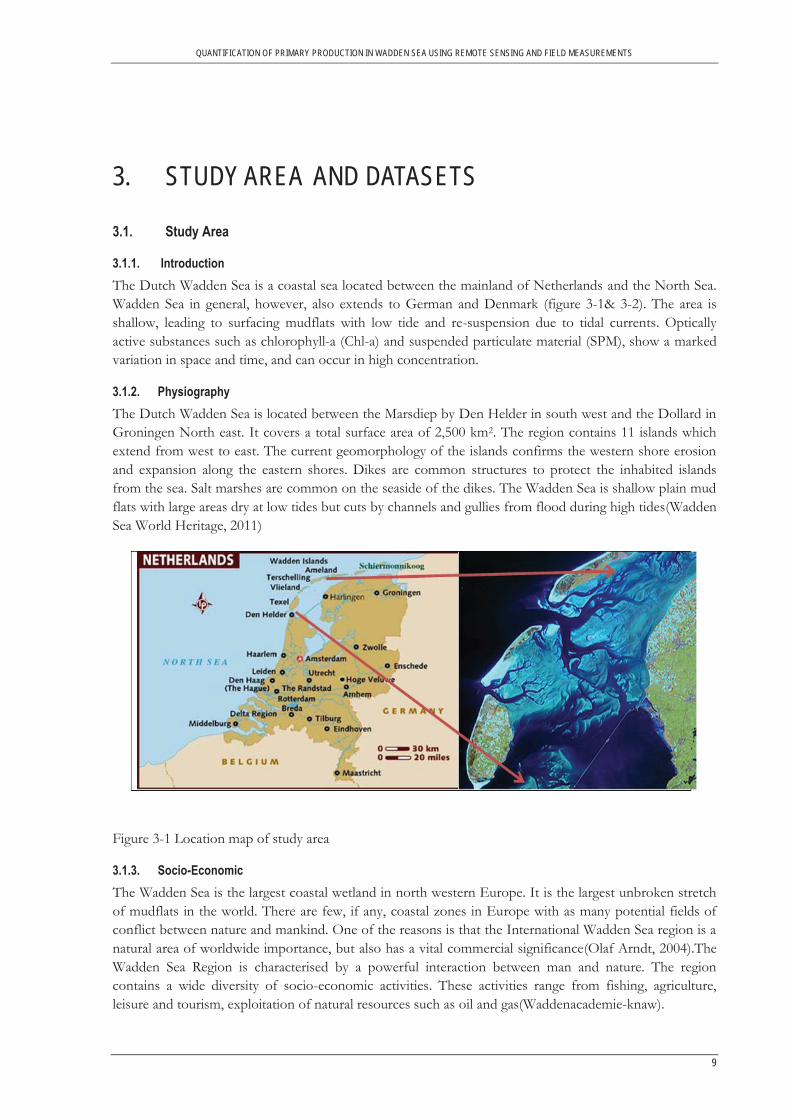
3.1.1. Introduction The Dutch Wadden Sea is a coastal sea located between the mainland of Netherlands and the North Sea. Wadden Sea in general, however, also extends to German and Denmark (figure 3-1& 3-2). The area is shallow, leading to surfacing mudflats with low tide and re-suspension due to tidal currents. Optically active substances such as chlorophyll-a (Chl-a) and suspended particulate material (SPM), show a marked variation in space and time, and can occur in high concentration.
3.1.2. Physiography The Dutch Wadden Sea is located between the Marsdiep by Den Helder in south west and the Dollard in Groningen North east. It covers a total surface area of 2,500 km2. The region contains 11 islands which extend from west to east. The current geomorphology of the islands confirms the western shore erosion and expansion along the eastern shores. Dikes are common structures to protect the inhabited islands from the sea. Salt marshes are common on the seaside of the dikes. The Wadden Sea is shallow plain mud flats with large areas dry at low tides but cuts by channels and gullies from flood during high tides(Wadden Sea World Heritage, 2011)
Figure 3-1 Location map of study area
3.1.3. Socio-Economic The Wadden Sea is the largest coastal wetland in north western Europe. It is the largest unbroken stretch of mudflats in the world. There are few, if any, coastal zones in Europe with as many potential fields of conflict between nature and mankind. One of the reasons is that the International Wadden Sea region is a natural area of worldwide importance, but also has a vital commercial significance(Olaf Arndt, 2004).The Wadden Sea Region is characterised by a powerful interaction between man and nature. The region contains a wide diversity of socio-economic activities. These activities range from fishing, agriculture, leisure and tourism, exploitation of natural resources such as oil and gas(Waddenacademie-knaw).
QUANTIFICATION OF PRIMARY PRODUCTION IN WADDEN SEA USING REMOTE SENSING AND FIELD MEASUREMENTS
10
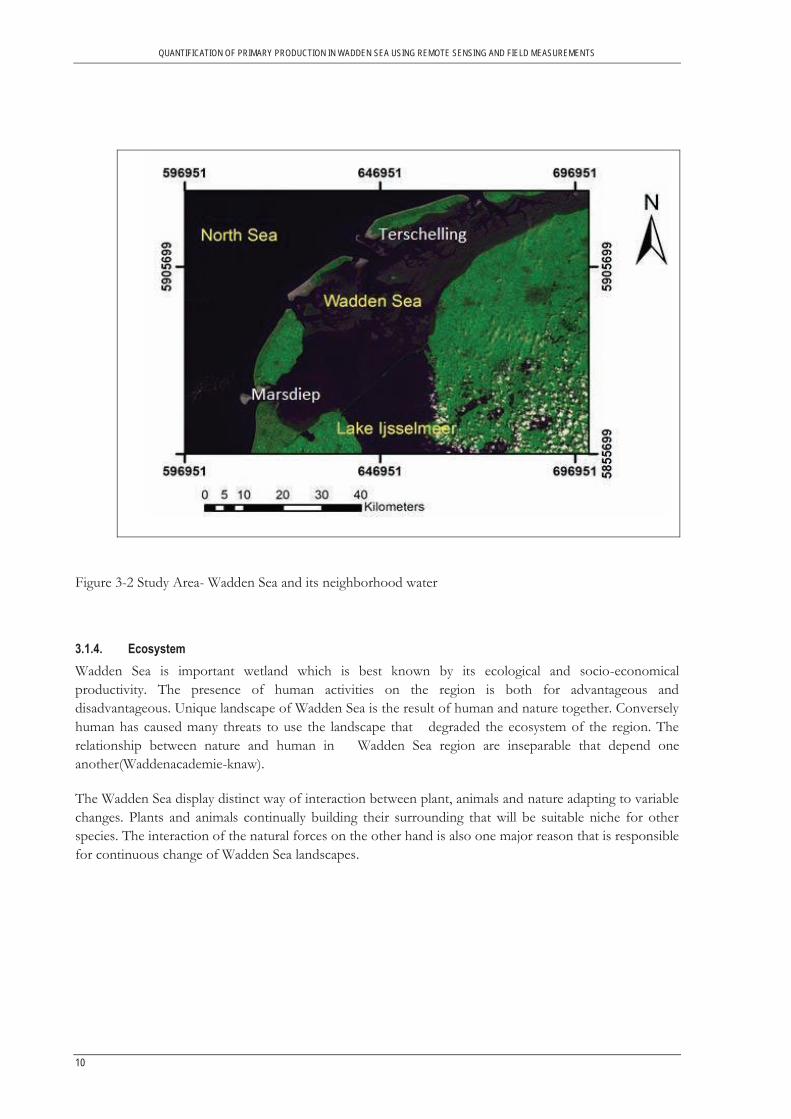
Figure 3-2 Study Area- Wadden Sea and its neighborhood water
3.1.4. Ecosystem Wadden Sea is important wetland which is best known by its ecological and socio-economical productivity. The presence of human activities on the region is both for advantageous and disadvantageous. Unique landscape of Wadden Sea is the result of human and nature together. Conversely human has caused many threats to use the landscape that degraded the ecosystem of the region. The relationship between nature and human in Wadden Sea region are inseparable that depend one another(Waddenacademie-knaw).
The Wadden Sea display distinct way of interaction between plant, animals and nature adapting to variable changes. Plants and animals continually building their surrounding that will be suitable niche for other species. The interaction of the natural forces on the other hand is also one major reason that is responsible for continuous change of Wadden Sea landscapes.
QUANTIFICATION OF PRIMARY PRODUCTION IN WADDEN SEA USING REMOTE SENSING AND FIELD MEASUREMENTS
11
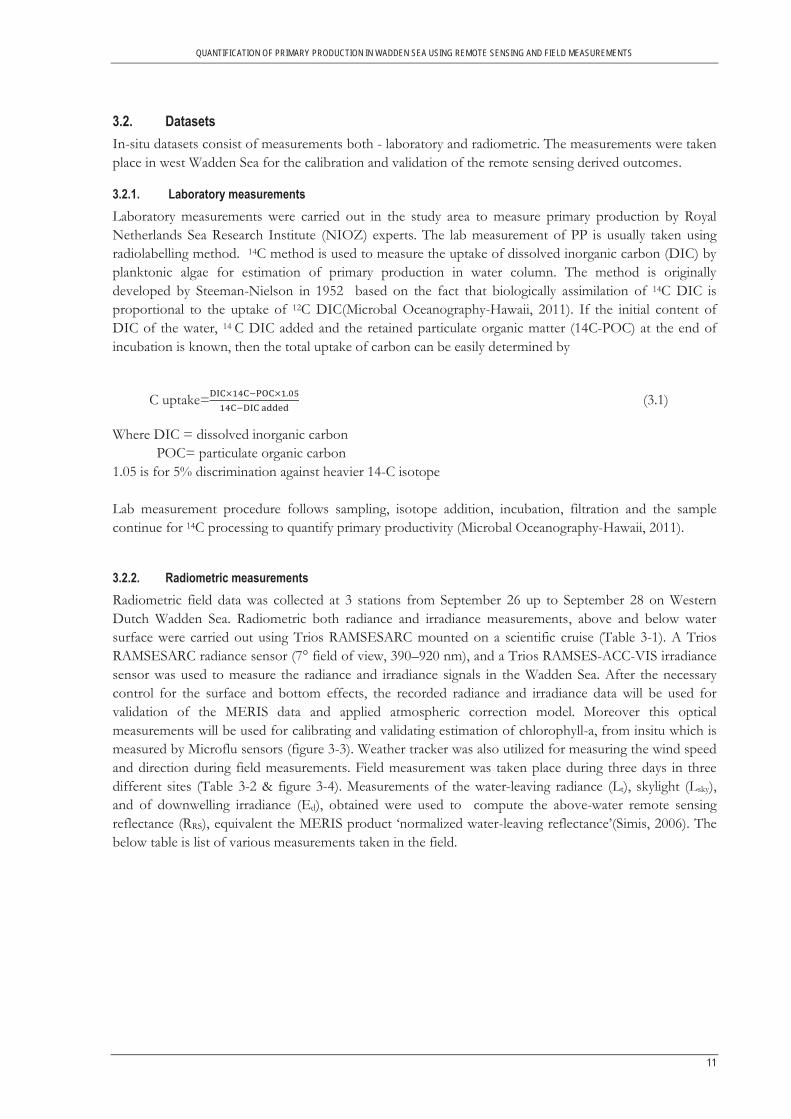
3.2. Datasets In-situ datasets consist of measurements both - laboratory and radiometric. The measurements were taken place in west Wadden Sea for the calibration and validation of the remote sensing derived outcomes.
3.2.1. Laboratory measurements Laboratory measurements were carried out in the study area to measure primary production by Royal Netherlands Sea Research Institute (NIOZ) experts. The lab measurement of PP is usually taken using radiolabelling method. 14C method is used to measure the uptake of dissolved inorganic carbon (DIC) by planktonic algae for estimation of primary production in water column. The method is originally developed by Steeman-Nielson in 1952 based on the fact that biologically assimilation of 14C DIC is proportional to the uptake of 12C DIC(Microbal Oceanography-Hawaii, 2011). If the initial content of DIC of the water, 14 C DIC added and the retained particulate organic matter (14C-POC) at the end of incubation is known, then the total uptake of carbon can be easily determined by
C uptake= (3.1)
Where DIC = dissolved inorganic carbon POC= particulate organic carbon 1.05 is for 5% discrimination against heavier 14-C isotope Lab measurement procedure follows sampling, isotope addition, incubation, filtration and the sample continue for 14C processing to quantify primary productivity (Microbal Oceanography-Hawaii, 2011).
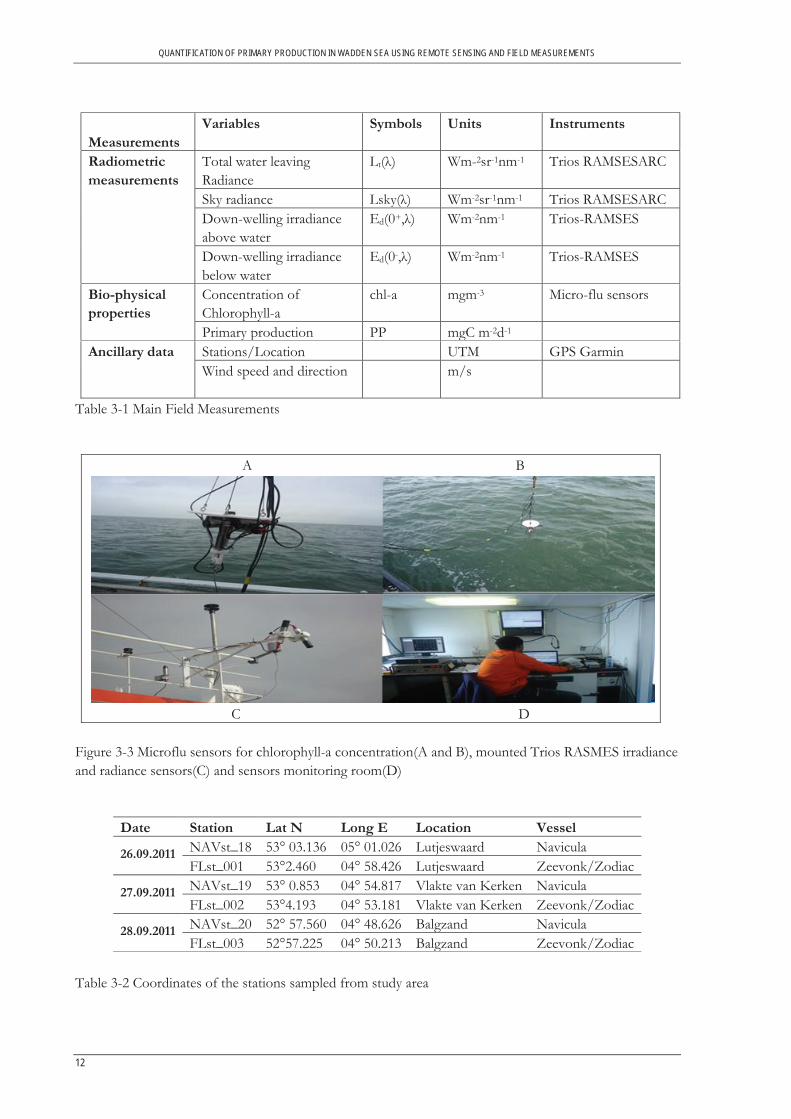
3.2.2. Radiometric measurements Radiometric field data was collected at 3 stations from September 26 up to September 28 on Western Dutch Wadden Sea. Radiometric both radiance and irradiance measurements, above and below water surface were carried out using Trios RAMSESARC mounted on a scientific cruise (Table 3-1). A Trios RAMSESARC radiance sensor (7° field of view, 390–920 nm), and a Trios RAMSES-ACC-VIS irradiance sensor was used to measure the radiance and irradiance signals in the Wadden Sea. After the necessary control for the surface and bottom effects, the recorded radiance and irradiance data will be used for validation of the MERIS data and applied atmospheric correction model. Moreover this optical measurements will be used for calibrating and validating estimation of chlorophyll-a, from insitu which is measured by Microflu sensors (figure 3-3). Weather tracker was also utilized for measuring the wind speed and direction during field measurements. Field measurement was taken place during three days in three different sites (Table 3-2 & figure 3-4). Measurements of the water-leaving radiance (Lt), skylight (Lsky), and of downwelling irradiance (Ed), obtained were used to compute the above-water remote sensing reflectance (RRS), equivalent the MERIS product ‘normalized water-leaving reflectance’(Simis, 2006). The below table is list of various measurements taken in the field.
QUANTIFICATION OF PRIMARY PRODUCTION IN WADDEN SEA USING REMOTE SENSING AND FIELD MEASUREMENTS
12
Measurements
Variables Symbols Units Instruments
Radiometric measurements
Total water leaving Radiance
Lt(λ) Wm-2sr-1nm-1 Trios RAMSESARC
Sky radiance Lsky(λ) Wm-2sr-1nm-1 Trios RAMSESARC Down-welling irradiance
above water Ed(0+,λ) Wm-2nm-1 Trios-RAMSES
Down-welling irradiance below water
Ed(0-,λ) Wm-2nm-1 Trios-RAMSES
Bio-physical properties
Concentration of Chlorophyll-a
chl-a mgm-3 Micro-flu sensors
Primary production PP mgC m-2d-1 Ancillary data Stations/Location UTM GPS Garmin Wind speed and direction
m/s
Table 3-1 Main Field Measurements
A B
C D Figure 3-3 Microflu sensors for chlorophyll-a concentration(A and B), mounted Trios RASMES irradiance and radiance sensors(C) and sensors monitoring room(D)
Table 3-2 Coordinates of the stations sampled from study area
Date Station Lat N Long E Location Vessel
26.09.2011 NAVst_18 53° 03.136 05° 01.026 Lutjeswaard Navicula FLst_001 53°2.460 04° 58.426 Lutjeswaard Zeevonk/Zodiac
27.09.2011 NAVst_19 53° 0.853 04° 54.817 Vlakte van Kerken Navicula FLst_002 53°4.193 04° 53.181 Vlakte van Kerken Zeevonk/Zodiac
28.09.2011 NAVst_20 52° 57.560 04° 48.626 Balgzand Navicula FLst_003 52°57.225 04° 50.213 Balgzand Zeevonk/Zodiac
QUANTIFICATION OF PRIMARY PRODUCTION IN WADDEN SEA USING REMOTE SENSING AND FIELD MEASUREMENTS
13
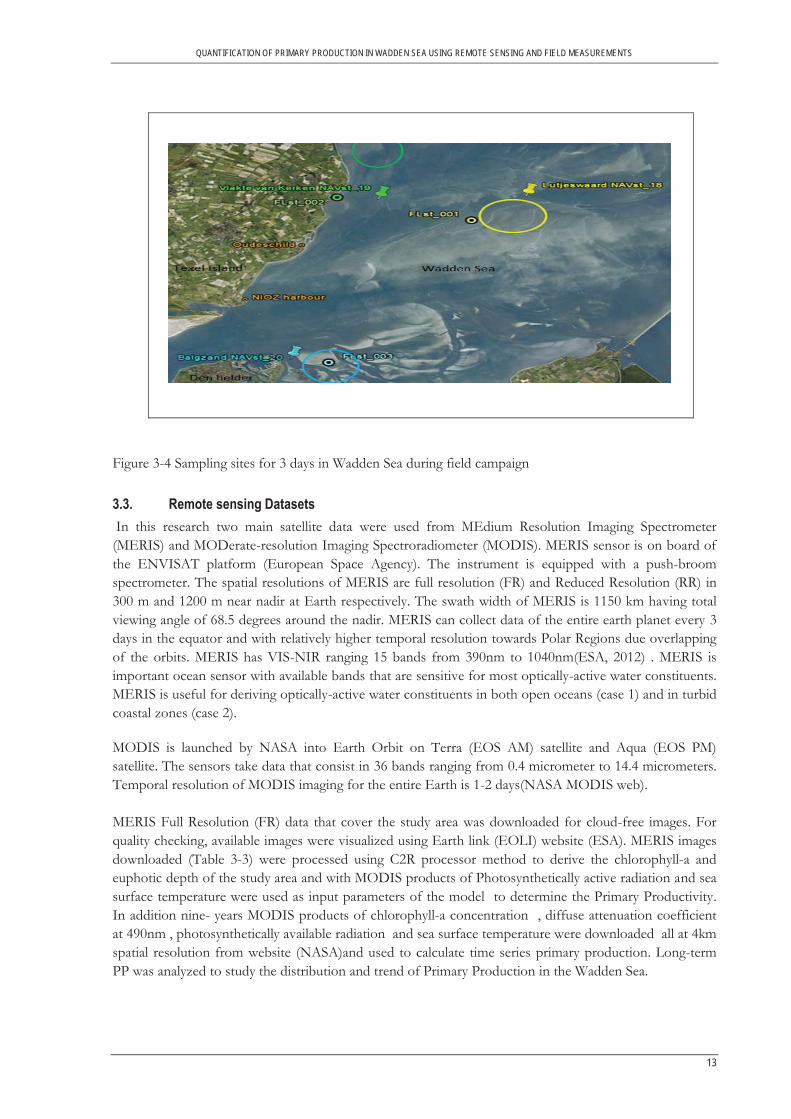
Figure 3-4 Sampling sites for 3 days in Wadden Sea during field campaign
3.3. Remote sensing Datasets In this research two main satellite data were used from MEdium Resolution Imaging Spectrometer (MERIS) and MODerate-resolution Imaging Spectroradiometer (MODIS). MERIS sensor is on board of the ENVISAT platform (European Space Agency). The instrument is equipped with a push-broom spectrometer. The spatial resolutions of MERIS are full resolution (FR) and Reduced Resolution (RR) in 300 m and 1200 m near nadir at Earth respectively. The swath width of MERIS is 1150 km having total viewing angle of 68.5 degrees around the nadir. MERIS can collect data of the entire earth planet every 3 days in the equator and with relatively higher temporal resolution towards Polar Regions due overlapping of the orbits. MERIS has VIS-NIR ranging 15 bands from 390nm to 1040nm(ESA, 2012) . MERIS is important ocean sensor with available bands that are sensitive for most optically-active water constituents. MERIS is useful for deriving optically-active water constituents in both open oceans (case 1) and in turbid coastal zones (case 2).
MODIS is launched by NASA into Earth Orbit on Terra (EOS AM) satellite and Aqua (EOS PM) satellite. The sensors take data that consist in 36 bands ranging from 0.4 micrometer to 14.4 micrometers. Temporal resolution of MODIS imaging for the entire Earth is 1-2 days(NASA MODIS web). MERIS Full Resolution (FR) data that cover the study area was downloaded for cloud-free images. For quality checking, available images were visualized using Earth link (EOLI) website (ESA). MERIS images downloaded (Table 3-3) were processed using C2R processor method to derive the chlorophyll-a and euphotic depth of the study area and with MODIS products of Photosynthetically active radiation and sea surface temperature were used as input parameters of the model to determine the Primary Productivity. In addition nine- years MODIS products of chlorophyll-a concentration , diffuse attenuation coefficient at 490nm , photosynthetically available radiation and sea surface temperature were downloaded all at 4km spatial resolution from website (NASA)and used to calculate time series primary production. Long-term PP was analyzed to study the distribution and trend of Primary Production in the Wadden Sea.
QUANTIFICATION OF PRIMARY PRODUCTION IN WADDEN SEA USING REMOTE SENSING AND FIELD MEASUREMENTS
14
Date Time MERIS overpass in the study area(UTC)
Near(Matchup)
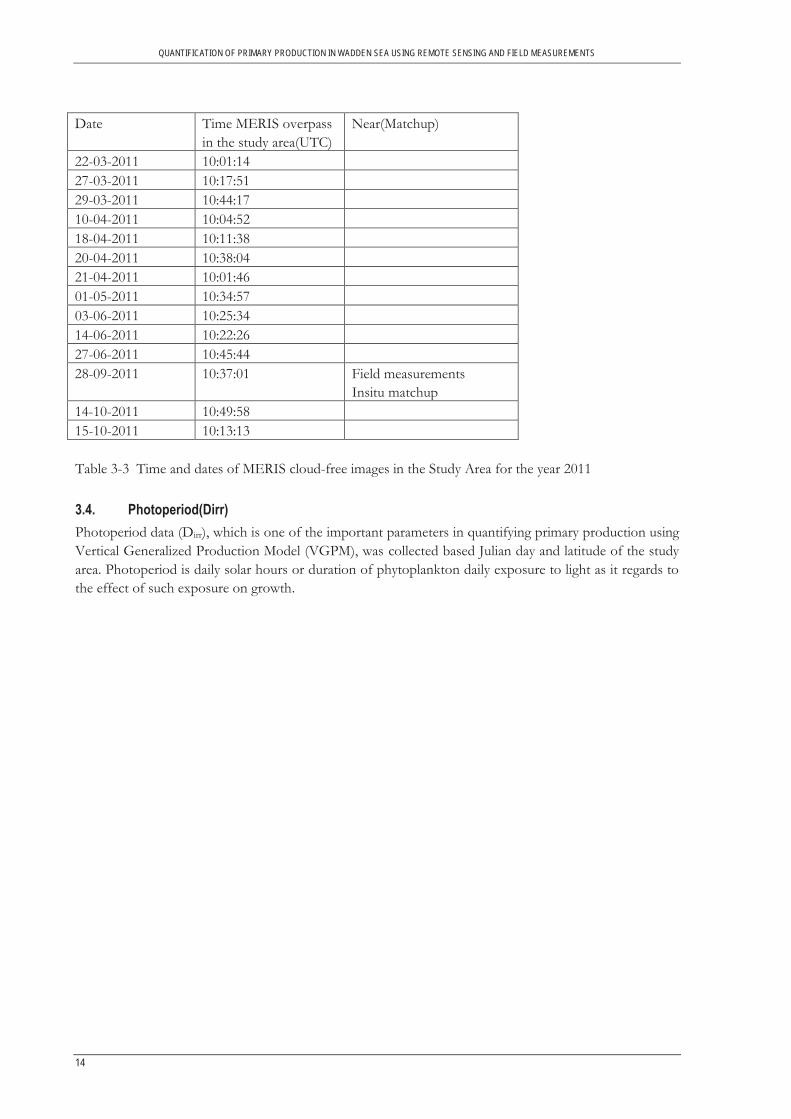
22-03-2011 10:01:14 27-03-2011 10:17:51 29-03-2011 10:44:17 10-04-2011 10:04:52 18-04-2011 10:11:38 20-04-2011 10:38:04 21-04-2011 10:01:46 01-05-2011 10:34:57 03-06-2011 10:25:34 14-06-2011 10:22:26 27-06-2011 10:45:44 28-09-2011 10:37:01 Field measurements
Insitu matchup 14-10-2011 10:49:58 15-10-2011 10:13:13 Table 3-3 Time and dates of MERIS cloud-free images in the Study Area for the year 2011
3.4. Photoperiod(Dirr) Photoperiod data (Dirr), which is one of the important parameters in quantifying primary production using Vertical Generalized Production Model (VGPM), was collected based Julian day and latitude of the study area. Photoperiod is daily solar hours or duration of phytoplankton daily exposure to light as it regards to the effect of such exposure on growth.
QUANTIFICATION OF PRIMARY PRODUCTION IN WADDEN SEA USING REMOTE SENSING AND FIELD MEASUREMENTS
15
4. METHODOLOGY
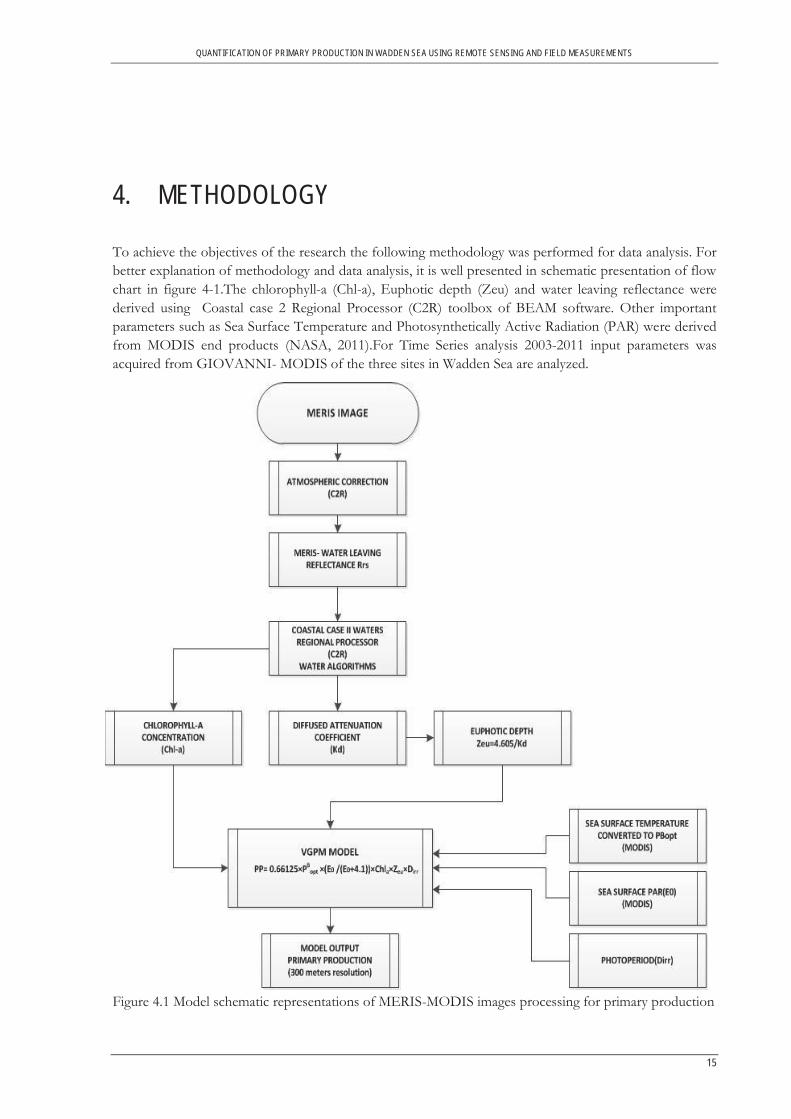
To achieve the objectives of the research the following methodology was performed for data analysis. For better explanation of methodology and data analysis, it is well presented in schematic presentation of flow chart in figure 4-1.The chlorophyll-a (Chl-a), Euphotic depth (Zeu) and water leaving reflectance were derived using Coastal case 2 Regional Processor (C2R) toolbox of BEAM software. Other important parameters such as Sea Surface Temperature and Photosynthetically Active Radiation (PAR) were derived from MODIS end products (NASA, 2011).For Time Series analysis 2003-2011 input parameters was acquired from GIOVANNI- MODIS of the three sites in Wadden Sea are analyzed.
Figure 4.1 Model schematic representations of MERIS-MODIS images processing for primary production
QUANTIFICATION OF PRIMARY PRODUCTION IN WADDEN SEA USING REMOTE SENSING AND FIELD MEASUREMENTS
16
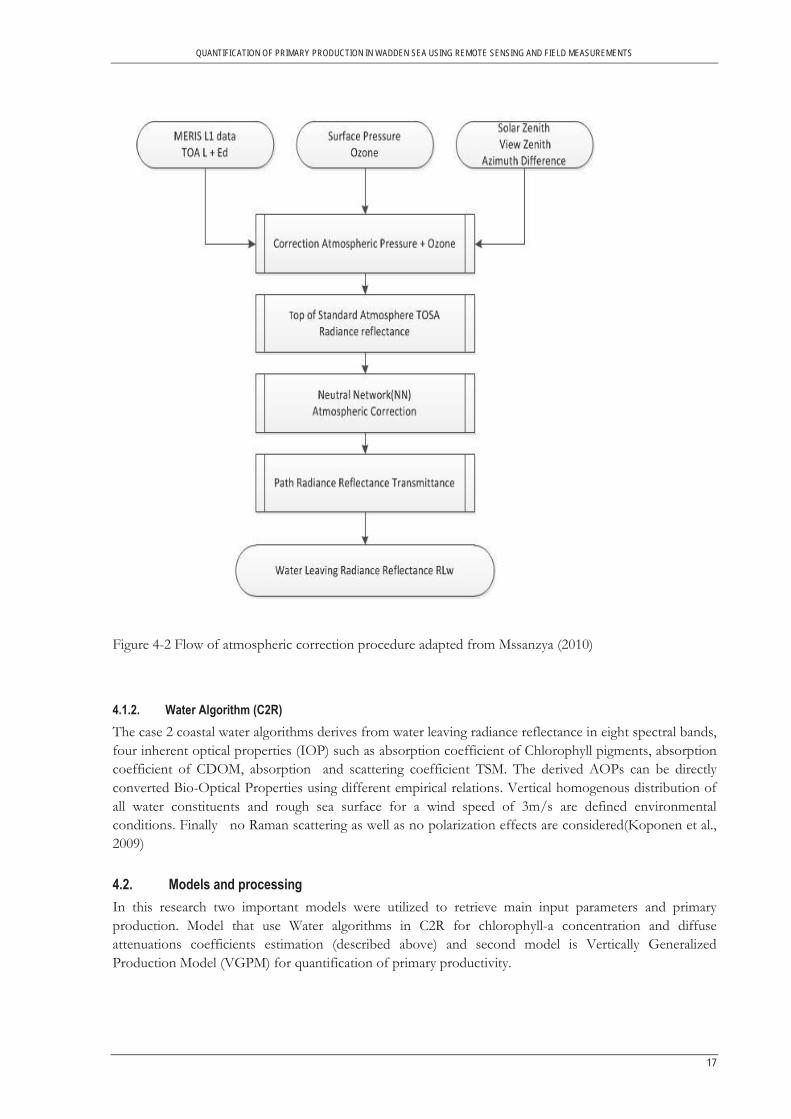
4.1. Coastal case 2 Regional Processor (C2R) Coastal case 2 Regional processor (C2R) is one of the MERIS water quality processor which is developed by the Gesellschaft fur Kernenergieverwertung in Schiffbau und Schiffahrt mbH (GKSS). The Processor determines the water leaving radiance reflectance spectrum RLw from the top of atmosphere radiance reflectance spectrum RLtoa measured by MERIS after atmospheric correction and derive the bio-optical properties of waters.
4.1.1. Atmospheric correction (C2R) The applicability of remote sensing to water quality monitoring largely depends on the method and accuracy of the atmospheric correction model used .The purpose of the atmospheric correction algorithms applied to remote sensing of water is to retrieve the water-leaving radiance at the sea level by eliminate the atmospheric contribution from the total radiance recorded at the top of the atmosphere by a satellite. This radiance is made of photons that have crossed the atmosphere down to the ocean, and then have twice crossed the air-sea interface before reaching the sensor (Koponen, Sampsa, Jaume, & 2009). There are numerous atmospheric correction systems with specific advantage and disadvantages with respect to the desired purpose of the research. This research uses an easily applicable of C2R atmospheric correction processor due to its potentials for automatic processing of large data quantities in a time series study. Actual air pressure and actual ozone column taken from MERIS L1b data used to correct the Rayleigh scattering and Ozone absorption respectively. Water vapor influence correction on band 9 (708 nm) as performed in the MERIS. A standard atmosphere, used in the simulations which include 1km thick each 50 layers with the next layer dependent parameters which includes four different aerosols models ranged and vertically distributed according to AERONET measurements. And it also stimulates thin cirrus cloud particles, rough and wind dependent sea surface. In addition the correction includes constant parameters such as Rayleigh scattering coefficient .(Koponen et al., 2009) (figure 4-2).
QUANTIFICATION OF PRIMARY PRODUCTION IN WADDEN SEA USING REMOTE SENSING AND FIELD MEASUREMENTS
17
Figure 4-2 Flow of atmospheric correction procedure adapted from Mssanzya (2010)
4.1.2. Water Algorithm (C2R) The case 2 coastal water algorithms derives from water leaving radiance reflectance in eight spectral bands, four inherent optical properties (IOP) such as absorption coefficient of Chlorophyll pigments, absorption coefficient of CDOM, absorption and scattering coefficient TSM. The derived AOPs can be directly converted Bio-Optical Properties using different empirical relations. Vertical homogenous distribution of all water constituents and rough sea surface for a wind speed of 3m/s are defined environmental conditions. Finally no Raman scattering as well as no polarization effects are considered(Koponen et al., 2009)
4.2. Models and processing In this research two important models were utilized to retrieve main input parameters and primary production. Model that use Water algorithms in C2R for chlorophyll-a concentration and diffuse attenuations coefficients estimation (described above) and second model is Vertically Generalized Production Model (VGPM) for quantification of primary productivity.

QUANTIFICATION OF PRIMARY PRODUCTION IN WADDEN SEA USING REMOTE SENSING AND FIELD MEASUREMENTS
18
Vertical Generalized Production Model (VGPM) (Michael J. Behrenfeld & Falkowski, 1997) Vertical Generalized Production Model (VGPM) is used for determining daily depth-integrated phytoplankton carbon fixation (Primary Production) from measurements of sea surface pigment concentrations (Chl-a). Chl-a concentration is output of C2R model after validated with the in-situ measurements.
In this research VGPM model, which is developed by Michael J. Behrenfeld & Falkowski (1997), were used to quantify depth integrated primary production (PP). The VGPM model requires measured or estimated data of five input variables, namely Optimum C fixation rate within a water column (PBopt), Chlorophyll-a (chl-a), euphotic depth(Zeu), photoperiod(Dirr), daily solar irradiance(Eo)( Table 4-1).There is no method currently available for directly measuring the PBopt parameter, and thus it was related to other environmental parameters that can be detected remotely, such as sea surface temperature (SST) (Michael J. Behrenfeld & Falkowski, 1997).The core equation describing the relationship between surface chlorophyll-a and depth-integrated primary production is expressed as follows: PP= 0.66125×PBopt× × Chla×Zeu×Dirr (4.1)
PP: Primary Production (g C/m2/day) Chla: chlorophyll-a concentration (mg /m3). Dirr: Daily photoperiod (in decimal hours) E0: Sea surface daily PAR (Einstein /m2/d) Zeu: Euphotic depth (m).
Euphotic depth is determined by converting diffused attenuation coefficient
Zeu = (4.2)
PBOpt: Optimal daily carbon fixation rate within a water column [mg C (mg Chl)-1 h-1]. PBOpt can be modeled from temperature-dependent relationships.
PBopt = (4.3)
PBopt' = 1.2956 + 2.749×10⁻¹ T + 6.17×10⁻²T2 - 2.05×10⁻²T3 + (4.4) 2.462×10⁻³T4 – 1.348×10⁻⁴T5 + 3.4132×10⁻⁶T6 – 3.27×10⁻⁸T7
Where T is sea surface temperature
QUANTIFICATION OF PRIMARY PRODUCTION IN WADDEN SEA USING REMOTE SENSING AND FIELD MEASUREMENTS
19
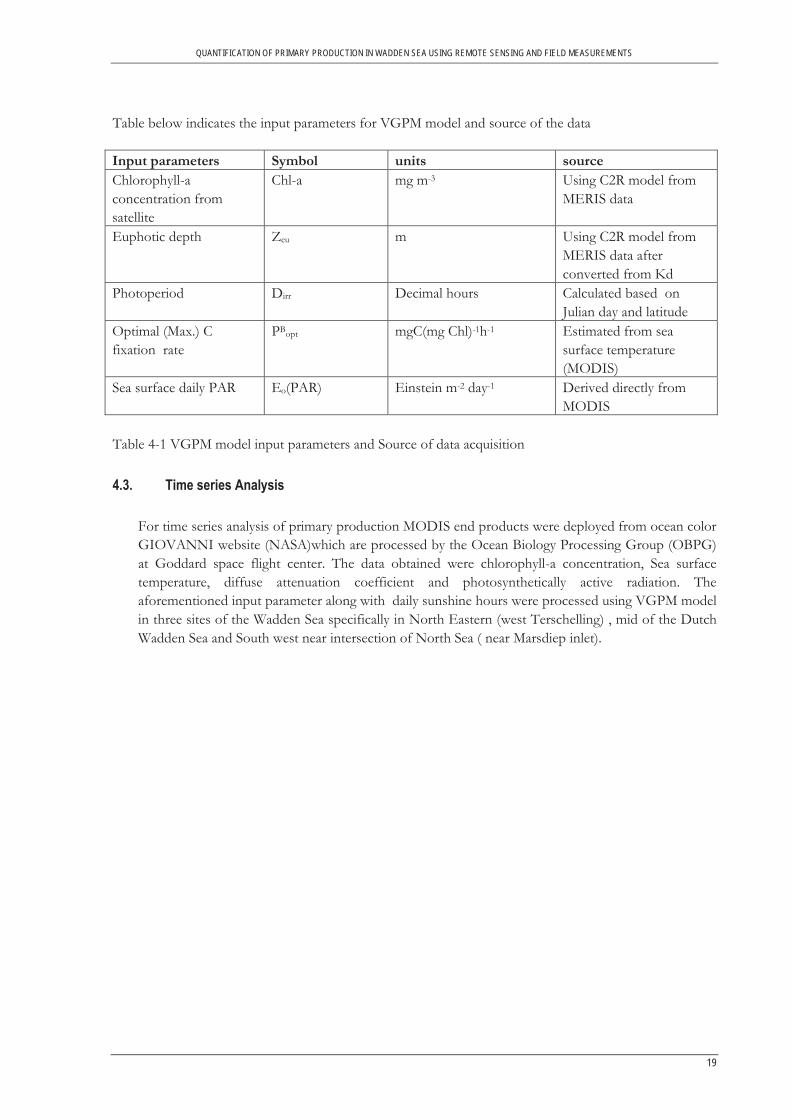
Table below indicates the input parameters for VGPM model and source of the data Input parameters Symbol units source Chlorophyll-a concentration from satellite
Chl-a mg m-3 Using C2R model from MERIS data
Euphotic depth Zeu m Using C2R model from MERIS data after converted from Kd
Photoperiod Dirr Decimal hours Calculated based on Julian day and latitude
Optimal (Max.) C fixation rate
PBopt mgC(mg Chl)-1h-1 Estimated from sea surface temperature (MODIS)
Sea surface daily PAR Eo(PAR) Einstein m-2 day-1 Derived directly from MODIS
Table 4-1 VGPM model input parameters and Source of data acquisition
4.3. Time series Analysis
For time series analysis of primary production MODIS end products were deployed from ocean color GIOVANNI website (NASA)which are processed by the Ocean Biology Processing Group (OBPG) at Goddard space flight center. The data obtained were chlorophyll-a concentration, Sea surface temperature, diffuse attenuation coefficient and photosynthetically active radiation. The aforementioned input parameter along with daily sunshine hours were processed using VGPM model in three sites of the Wadden Sea specifically in North Eastern (west Terschelling) , mid of the Dutch Wadden Sea and South west near intersection of North Sea ( near Marsdiep inlet).


QUANTIFICATION OF PRIMARY PRODUCTION IN WADDEN SEA USING REMOTE SENSING AND FIELD MEASUREMENTS
21
00.0020.0040.0060.008
0.010.0120.0140.016
400 500 600 700 800
Refle
ctan
ce(S
r-1)
Wave length(nm)
Insitu1
Insitu2
Insitu3
Insitu4
Insitu5
Insitu6
Insitu7
Insitu8
Insitu9
Insitu10
MERIS
5. RESULTS
Wadden sea waters are areas of high biological productivity and play an important role in the global carbon cycle. There are high primary productivity (PP) in these ecosystems if prompted by the supply of inorganic nutrients from rivers, terrestrial inputs, coastal upwelling and heterotrophic nutrient recycling (Holt et al., 2009).
By combining data of irradiance, diffused attenuation and Chlorophyll-a concentrations and sea surface temperature (SST), planktonic primary production in Dutch Wadden Sea was computed for year 2011 from MERIS and nine – years MODIS time series analysis from 2003 to 2011. Daily water column primary production ranged from 0.026 to 4.52 gC m–2 day–1 and showed similar pattern to chlorophyll-a. Calculated annual mean primary productions is 24.15 gC m–2 year-1. Phytoplankton growth was very low in winter. In spring and summer, production increases gradually. The chlorophyll-a specific optimal photosynthetic rate (PBopt) ranged from 1.4 to 6.63 mg C (mg Chl)–1 h–1 and was strongly correlated with sea surface temperature (r2 = 0.98). By contrast, there is almost perfect seasonal cycle in PBopt in which its variability was much more related to sea surface temperature. Primary production in the Wadden Sea is predominantly controlled by light limitation and that nutrient limitation and a process was likely to occur for a few hours per day(Tillmann, Hesse, & Colijn, 2000).
5.1. Atmospheric correction Atmospheric correction was done for the 28 September 2011 MERIS image which is the only match up date for 3 day field measurements. Before Processing of the PP input parameters from MERIS, the accuracy of C2R atmospheric correction methodology was assessed in the study area and was found generally successful. The matchup between the ground measured remote sensing reflectance (Rrs) and MERIS Rrs (after atmospheric correction by C2R) depicted with strong correlation (figure 5.1).
Figure 5-1 MERIS –corrected Rrs and insitu Rrs spectra for accuracy assessment of atmospheric correction in the study area
QUANTIFICATION OF PRIMARY PRODUCTION IN WADDEN SEA USING REMOTE SENSING AND FIELD MEASUREMENTS
22
5.2. Input Parameters A combination of MERIS (chl-a and Zeu) and MODIS (SST and PAR) data for Wadden sea was a processed daily for year 2011 starting from March to October for available cloud-free images. Primary production from MODIS end products were also determined monthly from 2003 to 2011(upto October for year 2011).The primary production was estimated using VGPM model. Primary production showed clear seasonal variation. Chlorophyll-a, temperature and PAR values were low during winter, resulting in low primary production. Primary production increased in March through May due to the high chlorophyll-a in spring bloom. As result of high temperature and PAR, high primary production was also estimated during summer and fall. Comparison of satellites PP of MERIS and MODIS integrated primary production data revealed consistency. Although data generally from MERIS and MODIS were comparable, MERIS primary production from March and April was higher than the MODIS values. Differences between MERIS and MODIS chlorophyll-a (chl-a) and euphotic depth (Zeu) data were not very large; however, they are very sensitive parameter and make large difference. The discrepancy, hence, between MERIS and MODIS integrated primary production came mainly from the differences in Chl-a concentration and Zeu. Note that the time differences of the satellite overpass of MERIS and MODIS were also another reason for inconsistency.
5.2.1. Temporal and spatial variation of input parameters
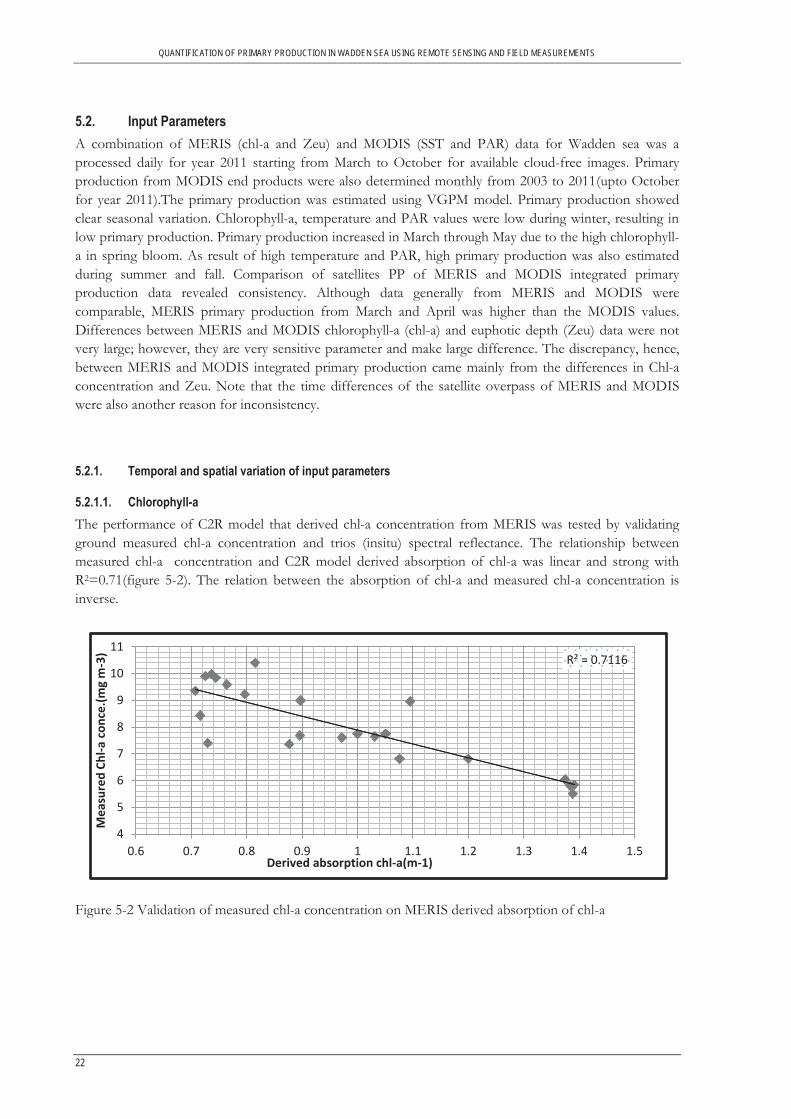
5.2.1.1. Chlorophyll-a The performance of C2R model that derived chl-a concentration from MERIS was tested by validating ground measured chl-a concentration and trios (insitu) spectral reflectance. The relationship between measured chl-a concentration and C2R model derived absorption of chl-a was linear and strong with R2=0.71(figure 5-2). The relation between the absorption of chl-a and measured chl-a concentration is inverse.
Figure 5-2 Validation of measured chl-a concentration on MERIS derived absorption of chl-a
R² = 0.7116
4
5
6
7
8
9
10
11
0.6 0.7 0.8 0.9 1 1.1 1.2 1.3 1.4 1.5
Mea
sure
d Ch
l-a c
once
.(mg
m-3
)
Derived absorption chl-a(m-1)
QUANTIFICATION OF PRIMARY PRODUCTION IN WADDEN SEA USING REMOTE SENSING AND FIELD MEASUREMENTS
23
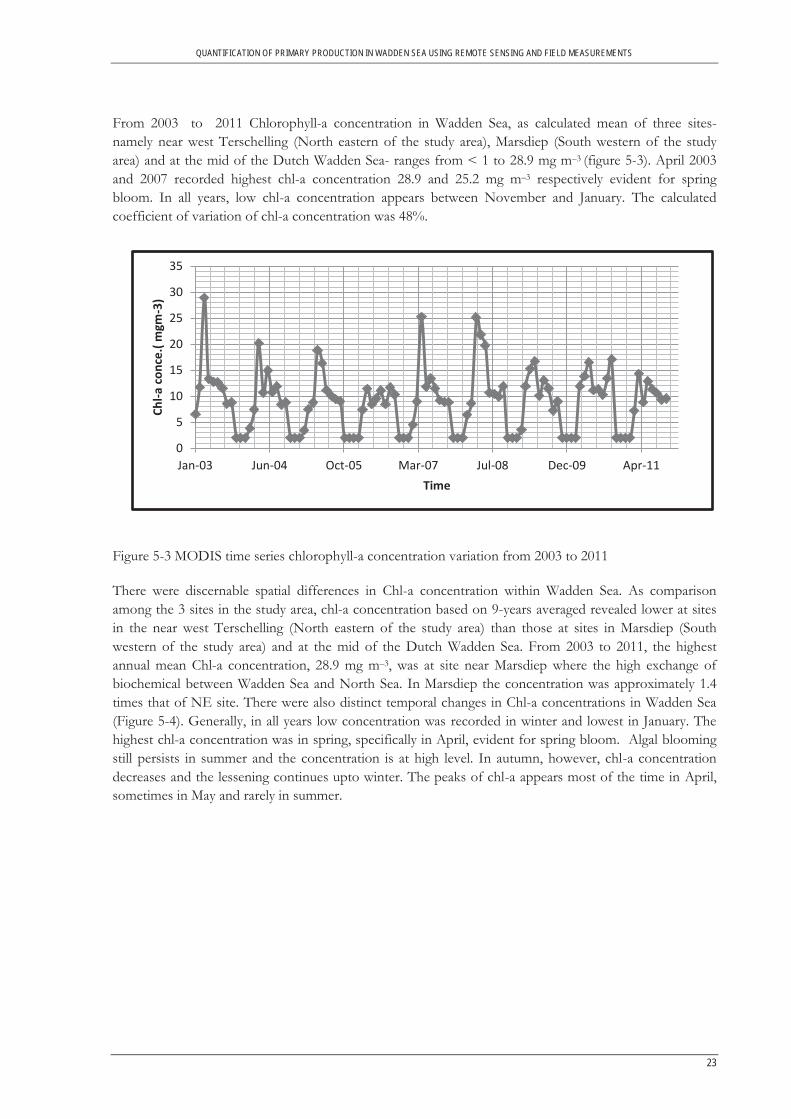
From 2003 to 2011 Chlorophyll-a concentration in Wadden Sea, as calculated mean of three sites- namely near west Terschelling (North eastern of the study area), Marsdiep (South western of the study area) and at the mid of the Dutch Wadden Sea- ranges from < 1 to 28.9 mg m–3 (figure 5-3). April 2003 and 2007 recorded highest chl-a concentration 28.9 and 25.2 mg m–3 respectively evident for spring bloom. In all years, low chl-a concentration appears between November and January. The calculated coefficient of variation of chl-a concentration was 48%.
Figure 5-3 MODIS time series chlorophyll-a concentration variation from 2003 to 2011
There were discernable spatial differences in Chl-a concentration within Wadden Sea. As comparison among the 3 sites in the study area, chl-a concentration based on 9-years averaged revealed lower at sites in the near west Terschelling (North eastern of the study area) than those at sites in Marsdiep (South western of the study area) and at the mid of the Dutch Wadden Sea. From 2003 to 2011, the highest annual mean Chl-a concentration, 28.9 mg m–3, was at site near Marsdiep where the high exchange of biochemical between Wadden Sea and North Sea. In Marsdiep the concentration was approximately 1.4 times that of NE site. There were also distinct temporal changes in Chl-a concentrations in Wadden Sea (Figure 5-4). Generally, in all years low concentration was recorded in winter and lowest in January. The highest chl-a concentration was in spring, specifically in April, evident for spring bloom. Algal blooming still persists in summer and the concentration is at high level. In autumn, however, chl-a concentration decreases and the lessening continues upto winter. The peaks of chl-a appears most of the time in April, sometimes in May and rarely in summer.
0
5
10
15
20
25
30
35
Jan-03 Jun-04 Oct-05 Mar-07 Jul-08 Dec-09 Apr-11
Chl-a
con
ce.(
mgm
-3)
Time
QUANTIFICATION OF PRIMARY PRODUCTION IN WADDEN SEA USING REMOTE SENSING AND FIELD MEASUREMENTS
24
a b
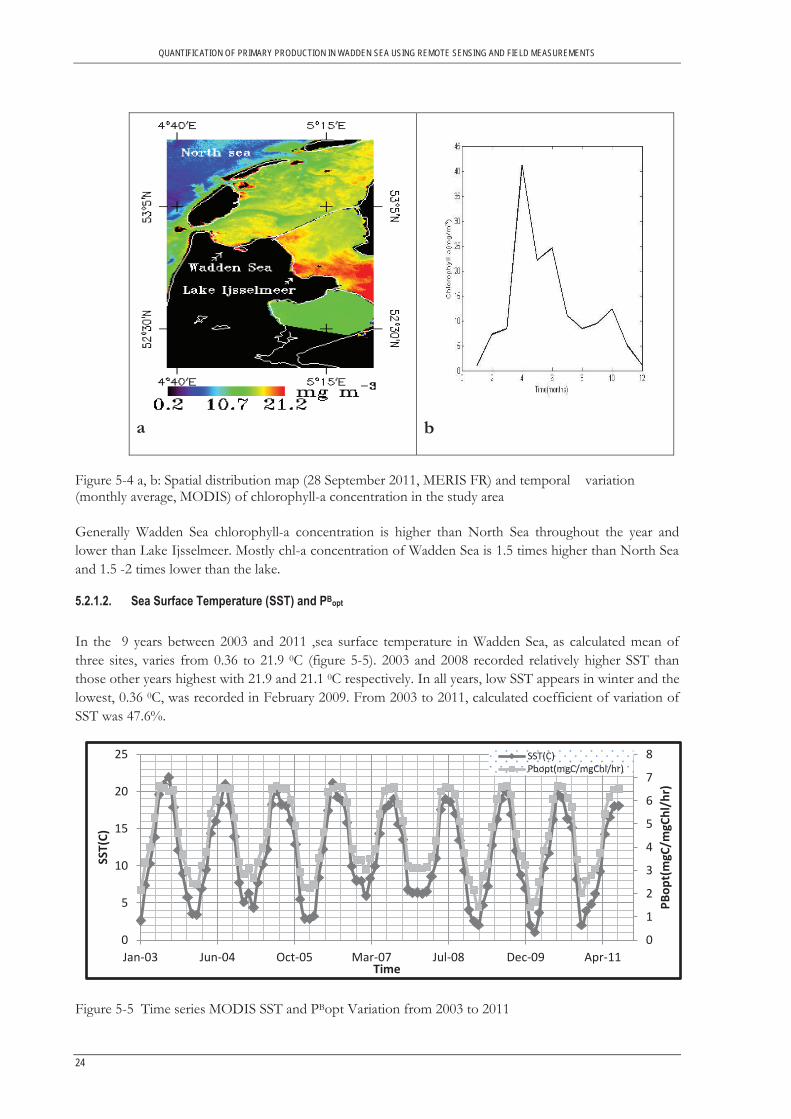
Figure 5-4 a, b: Spatial distribution map (28 September 2011, MERIS FR) and temporal variation (monthly average, MODIS) of chlorophyll-a concentration in the study area Generally Wadden Sea chlorophyll-a concentration is higher than North Sea throughout the year and lower than Lake Ijsselmeer. Mostly chl-a concentration of Wadden Sea is 1.5 times higher than North Sea and 1.5 -2 times lower than the lake.
5.2.1.2. Sea Surface Temperature (SST) and PBopt In the 9 years between 2003 and 2011 ,sea surface temperature in Wadden Sea, as calculated mean of three sites, varies from 0.36 to 21.9 0C (figure 5-5). 2003 and 2008 recorded relatively higher SST than those other years highest with 21.9 and 21.1 0C respectively. In all years, low SST appears in winter and the lowest, 0.36 0C, was recorded in February 2009. From 2003 to 2011, calculated coefficient of variation of SST was 47.6%.
Figure 5-5 Time series MODIS SST and PBopt Variation from 2003 to 2011
0
1
2
3
4
5
6
7
8
0
5
10
15
20
25
Jan-03 Jun-04 Oct-05 Mar-07 Jul-08 Dec-09 Apr-11
PBop
t(m
gC/m
gChl
/hr)
SST(
C)
Time
SST(C)Pbopt(mgC/mgChl/hr)

QUANTIFICATION OF PRIMARY PRODUCTION IN WADDEN SEA USING REMOTE SENSING AND FIELD MEASUREMENTS
25
There were no much spatial differences in SST within the study area. As comparison among the 3 sites SST values based on 9-years averaged, however, revealed lower at sites in the near west Terschelling (NE) and at the mid of the Dutch Wadden Sea than those at sites in Marsdiep (SW). The highest annual mean SST from 2003 to 2011 of 12.1 0C was at site near Marsdiep. There were also marked temporal changes in SST in Wadden Sea (Figure 5-6). Generally, in all years low concentration was recorded in winter and lowest 2-5 0C in February. In spring bloom season, starting around April, SST increases slowly and reaches its highest in summer (June-August) evident in all sites. In autumn, SST decreases most of the time but still high and sometime in September with quite high SST. Though the peaks of SST appeared in different months, commonly highest SST is in summer precisely in August and July.
a b
Figure 5-6 a, b: Spatial distribution map (28 September 2011, MODIS resampled to 300 m spatial resolution) and temporal variation (monthly average, MODIS) of sea surface temperature in the study area
Sea surface temperature (SST) and optimal Chlorophyll-a rate of fixation (PBopt) are shown similar temporal variation. SST and PBopt have very strong correlation (r2=0.98) which is evident for the PBopt is mainly influenced by SST than other environmental parameters (figure 5-7).
As aforementioned there is merely noticeable spatial difference in SST in the study area. SST in Wadden Sea is bit higher than North Sea and lower that south part of Lake Ijsselmeer. Near the inlet of the river in Lake of Ijsselmeer, the nutrients might be absorbing more energy to increase the temperature the area.

QUANTIFICATION OF PRIMARY PRODUCTION IN WADDEN SEA USING REMOTE SENSING AND FIELD MEASUREMENTS
26
Figure 5-7 Relationship of MODIS SST and PBopt
5.2.1.3. Euphotic Depth (Zeu) Euphotic depth is measurement of water clarity in water bodies and is one of the crucial parameter in VGPM model. It is determined by water constituents such as suspended substance, dissolved organic matter, phytoplankton particles and water molecules which reduce solar radiation as it transfers down a water column(Majozi, 2011). Primary production is at its maximum within the euphotic depth zone because there is sufficient photosynthetically active radiation (PAR) photosynthetic to take place. Estimation of euphotic depth was based on attenuation coefficient (Kd) in MERIS and MODIS. Euphotic depth in Wadden Sea, as calculated mean of the three sites, ranges from few centimeters to 16 m between 2003 to 2011(figure 5-8). Euphotic depth MODIS data revealed that deepest 16.27 and 11.9 m, were recorded in 2007 and 2010, respectively. In all years, the shallowest euphotic depth appears from November to January where there is high turbidity in the sea. From 2003 to 2011, calculated coefficient of variation of Zeu was 41.3%. MODIS much overestimated than true value Zeu which in turn was main source of uncertainty in the model.
Figure 5-8 MODIS time series Euphotic depth data from 2003 to 2011
There were significant spatial differences in Zeu within Wadden Sea. The depths were, however, bit deeper at sites in the near west Terschelling (NE) than those at sites in Marsdiep (SW) and at the Mid of
y = 0.2751x + 1.3537 R² = 0.984
012345678
0 5 10 15 20 25
PBop
t(m
gC/m
gChl
/hr
SST(C)
0
2
4
6
8
10
12
14
Jan-03 Jun-04 Oct-05 Mar-07 Jul-08 Dec-09 Apr-11
Zeu(
m)
Time
QUANTIFICATION OF PRIMARY PRODUCTION IN WADDEN SEA USING REMOTE SENSING AND FIELD MEASUREMENTS
27
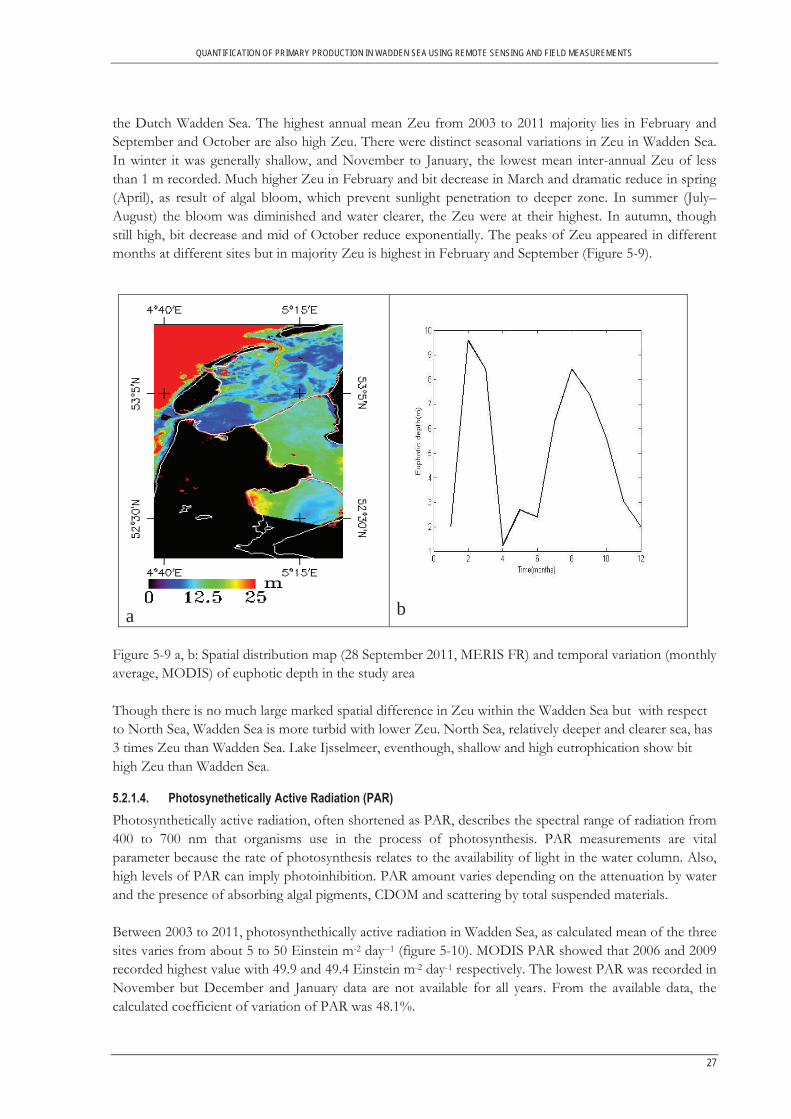
the Dutch Wadden Sea. The highest annual mean Zeu from 2003 to 2011 majority lies in February and September and October are also high Zeu. There were distinct seasonal variations in Zeu in Wadden Sea. In winter it was generally shallow, and November to January, the lowest mean inter-annual Zeu of less than 1 m recorded. Much higher Zeu in February and bit decrease in March and dramatic reduce in spring (April), as result of algal bloom, which prevent sunlight penetration to deeper zone. In summer (July–August) the bloom was diminished and water clearer, the Zeu were at their highest. In autumn, though still high, bit decrease and mid of October reduce exponentially. The peaks of Zeu appeared in different months at different sites but in majority Zeu is highest in February and September (Figure 5-9).
a b
Figure 5-9 a, b: Spatial distribution map (28 September 2011, MERIS FR) and temporal variation (monthly average, MODIS) of euphotic depth in the study area Though there is no much large marked spatial difference in Zeu within the Wadden Sea but with respect to North Sea, Wadden Sea is more turbid with lower Zeu. North Sea, relatively deeper and clearer sea, has 3 times Zeu than Wadden Sea. Lake Ijsselmeer, eventhough, shallow and high eutrophication show bit high Zeu than Wadden Sea.
5.2.1.4. Photosynethetically Active Radiation (PAR) Photosynthetically active radiation, often shortened as PAR, describes the spectral range of radiation from 400 to 700 nm that organisms use in the process of photosynthesis. PAR measurements are vital parameter because the rate of photosynthesis relates to the availability of light in the water column. Also, high levels of PAR can imply photoinhibition. PAR amount varies depending on the attenuation by water and the presence of absorbing algal pigments, CDOM and scattering by total suspended materials. Between 2003 to 2011, photosynthethically active radiation in Wadden Sea, as calculated mean of the three sites varies from about 5 to 50 Einstein m-2 day--1 (figure 5-10). MODIS PAR showed that 2006 and 2009 recorded highest value with 49.9 and 49.4 Einstein m-2 day-1 respectively. The lowest PAR was recorded in November but December and January data are not available for all years. From the available data, the calculated coefficient of variation of PAR was 48.1%.

QUANTIFICATION OF PRIMARY PRODUCTION IN WADDEN SEA USING REMOTE SENSING AND FIELD MEASUREMENTS
28
Figure 5-10 MODIS time series PAR of the study area from 2003 to 2011
There were marked spatial differences in PAR within Wadden Sea. As comparison among the 3 sites in the study area, PAR based on 9-years averaged, revealed somehow higher at sites in the near Marsdiep than those at sites in west Terschelling and at the mid of the Dutch Wadden Sea. Between 2003 and 2011 the highest annual mean PAR was 49.9 Einstein m-2 day-1. There were also distinct seasonal changes in PAR in Wadden Sea (Figure 5-11). In winter it was generally low and depending on November and February records, PAR of December and January are not known. In spring PAR increase gently and in summer (May –August), the PAR were at their maximum. However, it decreases in autumn slowly up to winter. The peaks of PAR appeared in different months at different sites. Peaks of PAR are mainly in May and June and rarely in July.
a b
Figure 5-11 a, b: Spatial distribution map (28 September 2011, MODIS resampled to 300 m spatial resolution) and temporal variation (monthly average, MODIS) of photosynthetically active radiation in the study area
0
10
20
30
40
50
60
Jan-03 Jun-04 Oct-05 Mar-07 Jul-08 Dec-09 Apr-11
PAR(
Ein/
m2/
day)
Time
QUANTIFICATION OF PRIMARY PRODUCTION IN WADDEN SEA USING REMOTE SENSING AND FIELD MEASUREMENTS
29
6
8
10
12
14
16
18
1 3 5 7 9 11
Suns
hine
dur
atio
n(hr
s)
Time(month)
Though not large spatial variation, MODIS PAR images show Eastern part of Dutch Wadden Sea has lower value than Western part of Dutch Wadden Sea and also lower value than Lake Ijsselmeer and North Sea.
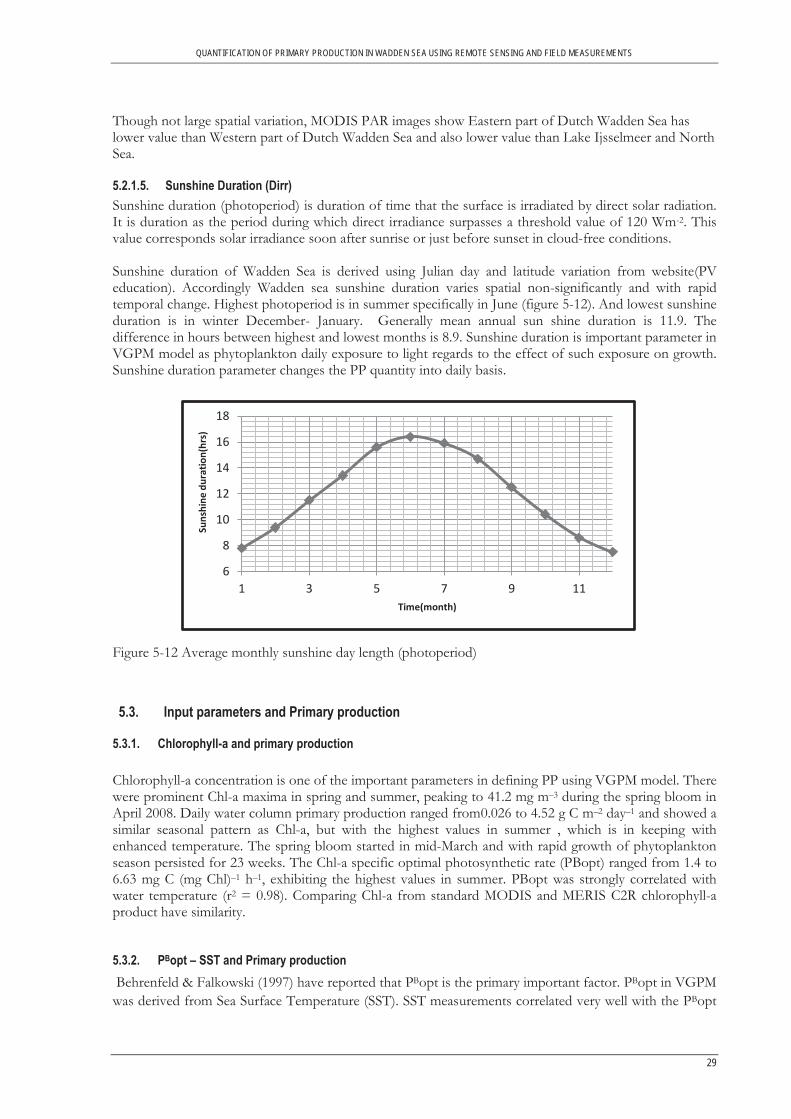
5.2.1.5. Sunshine Duration (Dirr) Sunshine duration (photoperiod) is duration of time that the surface is irradiated by direct solar radiation. It is duration as the period during which direct irradiance surpasses a threshold value of 120 Wm-2. This value corresponds solar irradiance soon after sunrise or just before sunset in cloud-free conditions. Sunshine duration of Wadden Sea is derived using Julian day and latitude variation from website(PV education). Accordingly Wadden sea sunshine duration varies spatial non-significantly and with rapid temporal change. Highest photoperiod is in summer specifically in June (figure 5-12). And lowest sunshine duration is in winter December- January. Generally mean annual sun shine duration is 11.9. The difference in hours between highest and lowest months is 8.9. Sunshine duration is important parameter in VGPM model as phytoplankton daily exposure to light regards to the effect of such exposure on growth. Sunshine duration parameter changes the PP quantity into daily basis. Figure 5-12 Average monthly sunshine day length (photoperiod)
5.3. Input parameters and Primary production
5.3.1. Chlorophyll-a and primary production Chlorophyll-a concentration is one of the important parameters in defining PP using VGPM model. There were prominent Chl-a maxima in spring and summer, peaking to 41.2 mg m–3 during the spring bloom in April 2008. Daily water column primary production ranged from0.026 to 4.52 g C m–2 day–1 and showed a similar seasonal pattern as Chl-a, but with the highest values in summer , which is in keeping with enhanced temperature. The spring bloom started in mid-March and with rapid growth of phytoplankton season persisted for 23 weeks. The Chl-a specific optimal photosynthetic rate (PBopt) ranged from 1.4 to 6.63 mg C (mg Chl)–1 h–1, exhibiting the highest values in summer. PBopt was strongly correlated with water temperature (r2 = 0.98). Comparing Chl-a from standard MODIS and MERIS C2R chlorophyll-a product have similarity.
5.3.2. PBopt – SST and Primary production Behrenfeld & Falkowski (1997) have reported that PBopt is the primary important factor. PBopt in VGPM was derived from Sea Surface Temperature (SST). SST measurements correlated very well with the PBopt
QUANTIFICATION OF PRIMARY PRODUCTION IN WADDEN SEA USING REMOTE SENSING AND FIELD MEASUREMENTS
30
(r2=0.98) and the estimation was evidently much better than the estimate based Chl-a. In the study area however, the errors in PP resulting from PBopt estimation is of secondary importance compared to the errors associated euphotic depth parameter estimation. The study area is light and nutrient limited region (Tillmann et al., 2000).
5.3.3. Euphotic depth and Primary production From MODIS records, attenuation coefficients (Kd) varied between 3.8 m–1 to a minimum of 0.27 m–1. Euphotic depth one of the strongest parameters and mainly determine the primary productivity. In oceans , where algal particles are chief attenuating materials, euphotic depths is determine based on Chl-a concentrations. For Optically complex case 2 water bodies, such as Wadden Sea SS and CDOM have indispensable influence on the absorption and scattering properties of water. The euphotic depth Zeu for Wadden Sea is calculated based on relationship with diffused attenuation (Kd) coefficient (Zeu=4.605/Kd). Wadden sea error analysis of Zeu , inadditon to overestimated, might be occurred from Kd as it is not considering TSM and Chl-a in essentials (Zhang, Qin, & Liu, 2007) VGPM model is not usually applied in case 2 water due to low precision in retrieval precision of Chl-a concentration and Zeu. In case 2 waters, absorption of non-algal components other than chlorophyll-a can often exceed that by phytoplankton (Frenette, Arts, & Morin, 2003). High amount of SS and CDOM often reduce the precision in deriving chl-a concentration. For Case 2 water bodies such as Wadden Sea, with complex and changeable optical properties, there might be substantial errors in estimates of PP using satellite Chl-a data as input for the model due to low retrieval precision of Chl-a concentration from satellite image (Zhang et al., 2007). Hence including Zeu depending on Scattering and absorption of the particulates can bring good results.
5.3.4. PAR-Dirr and Primary Production Daily PAR (E0) and photoperiod (Dirr) are quite robust and with small errors in VPGM parameters. The MODIS Level 2 PAR standard product was derived as end products. For 10% increase in intensity of solar radiation (PAR) results in 2% increase in Productivity. Sunshine duration (Dirr) has almost similar seasonal variation and its effect is significant on primary productivity.
5.4. Primary Production
5.4.1. Temporal and spatial variation of PP Wadden Sea Primary production (PP) data evaluated from 2003 to 2011 revealed that the annual mean daily PP ranged from 0.026 to 4.52 g C m-2day-1. The highest annual means for daily PP of Wadden Sea occur in 2003 and 2008 with 4.52 and 4.40 gC m-2day-1, respectively. 2007 and 2003 values were the highest total annual PP and lowest productivity ensues in 2010. The mean daily PP decreased significantly in 2009-2011 compared with 2003-2008. From the available 2011 MERIS images of Study area annual mean PP is 2.50 g C m-2 day-1 and RMSE 0.19 gC m-2 day-1 (figure 5-13).
QUANTIFICATION OF PRIMARY PRODUCTION IN WADDEN SEA USING REMOTE SENSING AND FIELD MEASUREMENTS
31
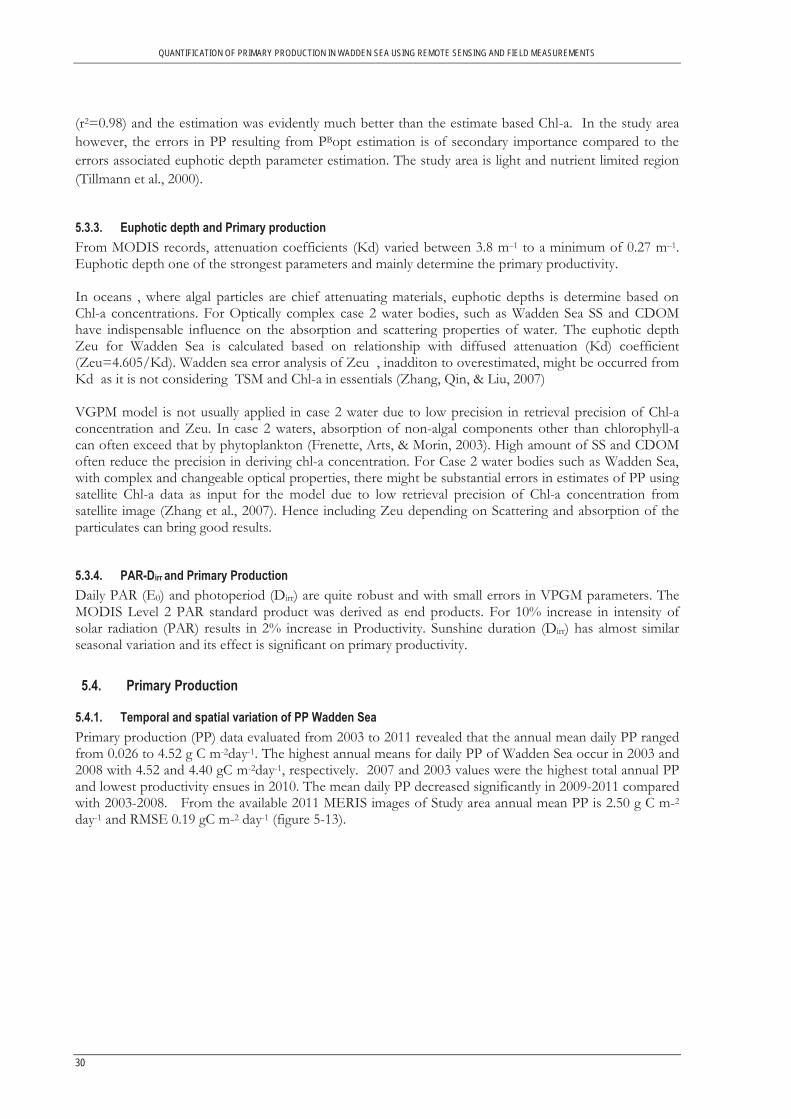
Figure 5-13 Mean annual PP of Wadden Sea from MERIS (left) and standard deviation (right) There were noticeable spatial differences in PP within Wadden Sea. At site near Marsdiep inlet, highest annual mean daily PP of 4.52 gC m-2day-1 was recorded. Monthly variations of daily mean PP were characterized by lowest values in January (following the Chl-a concentration) and peaks in July in all sites and sometimes highest PP occur in June. The summer (June–August) algal bloom accounted for 49.0% of the annual PP in Wadden Sea. In relation to neighbor water bodies such as North Sea and Lake Ijsselmeer, Wadden Sea has lower PP. North Sea daily PP is almost 2 times higher than Wadden Sea due to high Zeu, which is one of strongest parameter in light-limited regions VGPM model. Lake Ijsselmeer, as a result of high eutrophication, given rise to higher chlorophyll-a of approximately 1.3 times than Wadden Sea in the northern part and daily PP increase toward southern part of lake near intersection with the Ijssel river(high nutrients).
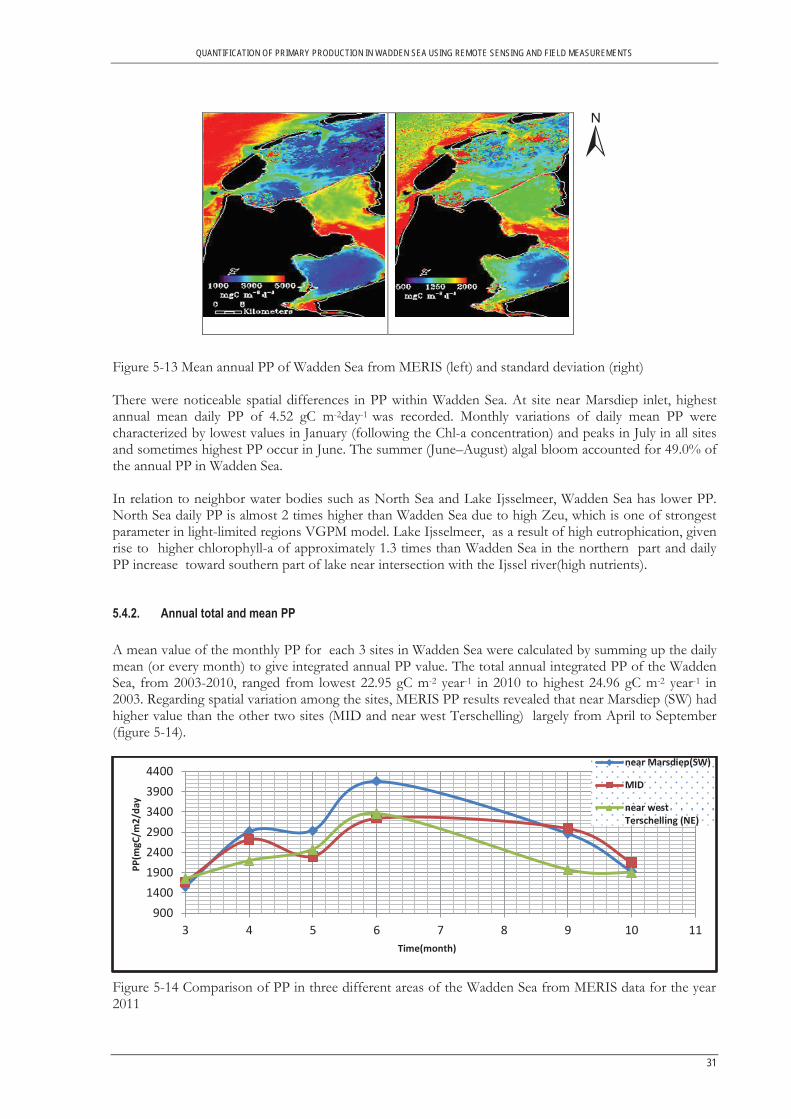
5.4.2. Annual total and mean PP A mean value of the monthly PP for each 3 sites in Wadden Sea were calculated by summing up the daily mean (or every month) to give integrated annual PP value. The total annual integrated PP of the Wadden Sea, from 2003-2010, ranged from lowest 22.95 gC m-2 year-1 in 2010 to highest 24.96 gC m-2 year-1 in 2003. Regarding spatial variation among the sites, MERIS PP results revealed that near Marsdiep (SW) had higher value than the other two sites (MID and near west Terschelling) largely from April to September (figure 5-14).
Figure 5-14 Comparison of PP in three different areas of the Wadden Sea from MERIS data for the year 2011
±
9001400190024002900340039004400
3 4 5 6 7 8 9 10 11
PP(m
gC/m
2/da
y
Time(month)
near Marsdiep(SW)
MID
near westTerschelling (NE)
QUANTIFICATION OF PRIMARY PRODUCTION IN WADDEN SEA USING REMOTE SENSING AND FIELD MEASUREMENTS
32
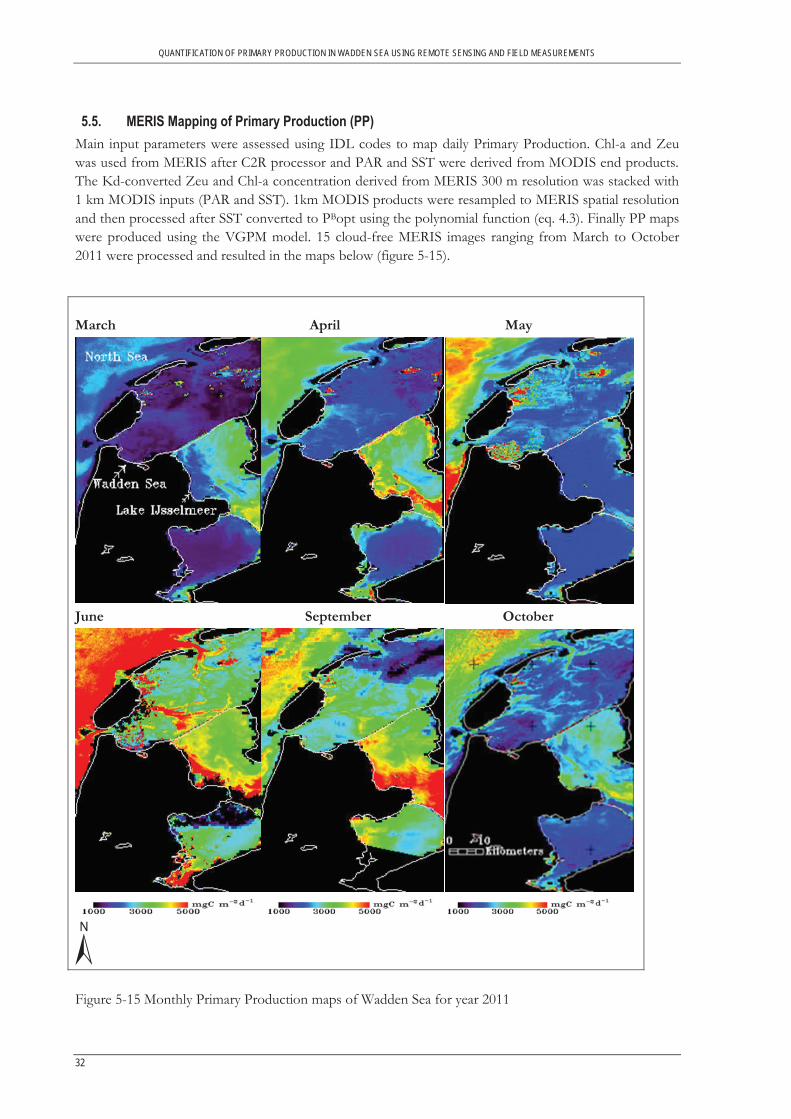
5.5. MERIS Mapping of Primary Production (PP) Main input parameters were assessed using IDL codes to map daily Primary Production. Chl-a and Zeu was used from MERIS after C2R processor and PAR and SST were derived from MODIS end products. The Kd-converted Zeu and Chl-a concentration derived from MERIS 300 m resolution was stacked with 1 km MODIS inputs (PAR and SST). 1km MODIS products were resampled to MERIS spatial resolution and then processed after SST converted to PBopt using the polynomial function (eq. 4.3). Finally PP maps were produced using the VGPM model. 15 cloud-free MERIS images ranging from March to October 2011 were processed and resulted in the maps below (figure 5-15). March April May
June September October
Figure 5-15 Monthly Primary Production maps of Wadden Sea for year 2011
±
QUANTIFICATION OF PRIMARY PRODUCTION IN WADDEN SEA USING REMOTE SENSING AND FIELD MEASUREMENTS
33
y = 0.4273x + 1496.4 R² = 0.6902
0
1000
2000
3000
4000
1000 2000 3000 4000 5000
MER
IS P
P(m
gC/m
2/da
y)
MODIS PP(mgC/m2/day)
5.6. Comparison of MERIS PP and MODIS PP Comparison of satellites PP of MERIS (300m resolution) and MODIS (4km resolution) primary production results has shown consistency (figure 5-14). MERIS PP was determined only for year of 2011 for the available cloud-free images from March to October. MERIS PP was expected to be more reliable result than MODIS PP due to higher spatial resolution. The comparison between MODIS and MERIS PP was done for the above mentioned period of time only, and the result as figure 5-16 shows that there is uniformity between the two satellite PP products. It was possible that hence, to extrapolate analysis PP of 2003-2011 based on MODIS outcomes. Although data generally from MERIS and MODIS were comparable, MERIS primary production from March and April was higher than the MODIS values. For the remaining months, however MODIS PP was on top of the MERIS.
Figure 5-16 Time series primary production of Wadden Sea from MODIS data (2003-2011) and MERIS data of year 2011. Differences between the MERIS and MODIS chlorophyll-a concentration (Chl-a) and euphotic depth (Zeu) data were not very large; however, euphotic depth and chlorophyll-a concentration are very sensitive parameters and make large difference. The discrepancy, hence, between MERIS and MODIS primary production came mainly from the differences in Zeu and Chl-a. Note that the time differences of the satellite overpass of MERIS and MODIS were also reason in inconsistency. The comparison of PP between the two satellites outcome, however, has good correlation with r2=0.69 (figure 5-17) Figure 5-17 MODIS primary production versus MERIS primary production for the year of 2011 from March to October
0500
100015002000250030003500400045005000
Jan-03 Jun-04 Oct-05 Mar-07 Jul-08 Dec-09 Apr-11
PP(m
gC/m
2/da
y)
Time
MODIS PP
MERIS PP
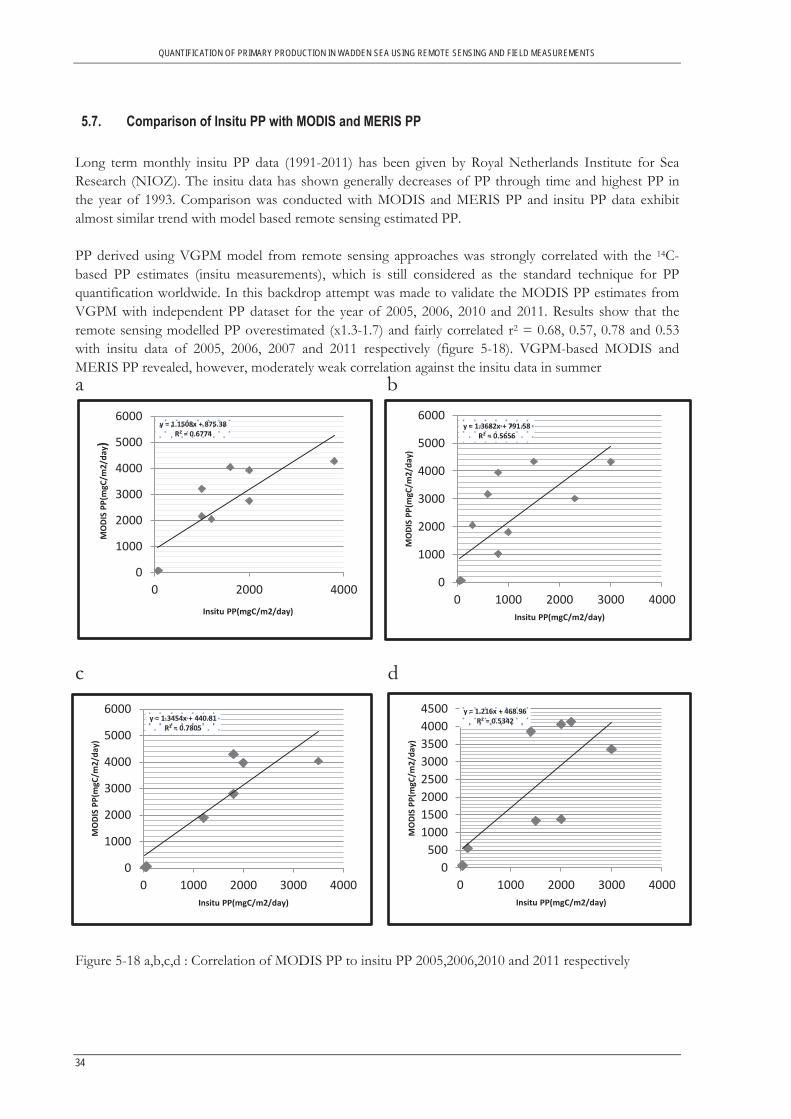
QUANTIFICATION OF PRIMARY PRODUCTION IN WADDEN SEA USING REMOTE SENSING AND FIELD MEASUREMENTS
34
y = 1.216x + 468.96 R² = 0.5342
0500
10001500200025003000350040004500
0 1000 2000 3000 4000
MO
DIS
PP(m
gC/m
2/da
y)
Insitu PP(mgC/m2/day)
y = 1.3682x + 791.58 R² = 0.5656
0
1000
2000
3000
4000
5000
6000
0 1000 2000 3000 4000
MO
DIS
PP(m
gC/m
2/da
y)
Insitu PP(mgC/m2/day)
5.7. Comparison of Insitu PP with MODIS and MERIS PP Long term monthly insitu PP data (1991-2011) has been given by Royal Netherlands Institute for Sea Research (NIOZ). The insitu data has shown generally decreases of PP through time and highest PP in the year of 1993. Comparison was conducted with MODIS and MERIS PP and insitu PP data exhibit almost similar trend with model based remote sensing estimated PP. PP derived using VGPM model from remote sensing approaches was strongly correlated with the 14C-based PP estimates (insitu measurements), which is still considered as the standard technique for PP quantification worldwide. In this backdrop attempt was made to validate the MODIS PP estimates from VGPM with independent PP dataset for the year of 2005, 2006, 2010 and 2011. Results show that the remote sensing modelled PP overestimated (x1.3-1.7) and fairly correlated r2 = 0.68, 0.57, 0.78 and 0.53 with insitu data of 2005, 2006, 2007 and 2011 respectively (figure 5-18). VGPM-based MODIS and MERIS PP revealed, however, moderately weak correlation against the insitu data in summer a b
c d
Figure 5-18 a,b,c,d : Correlation of MODIS PP to insitu PP 2005,2006,2010 and 2011 respectively
y = 1.1508x + 875.38 R² = 0.6774
0
1000
2000
3000
4000
5000
6000
0 2000 4000
MO
DIS
PP(m
gC/m
2/da
y)
Insitu PP(mgC/m2/day)
y = 1.3454x + 440.81 R² = 0.7805
0
1000
2000
3000
4000
5000
6000
0 1000 2000 3000 4000
MO
DIS
PP(m
gC/m
2/da
y)
Insitu PP(mgC/m2/day)
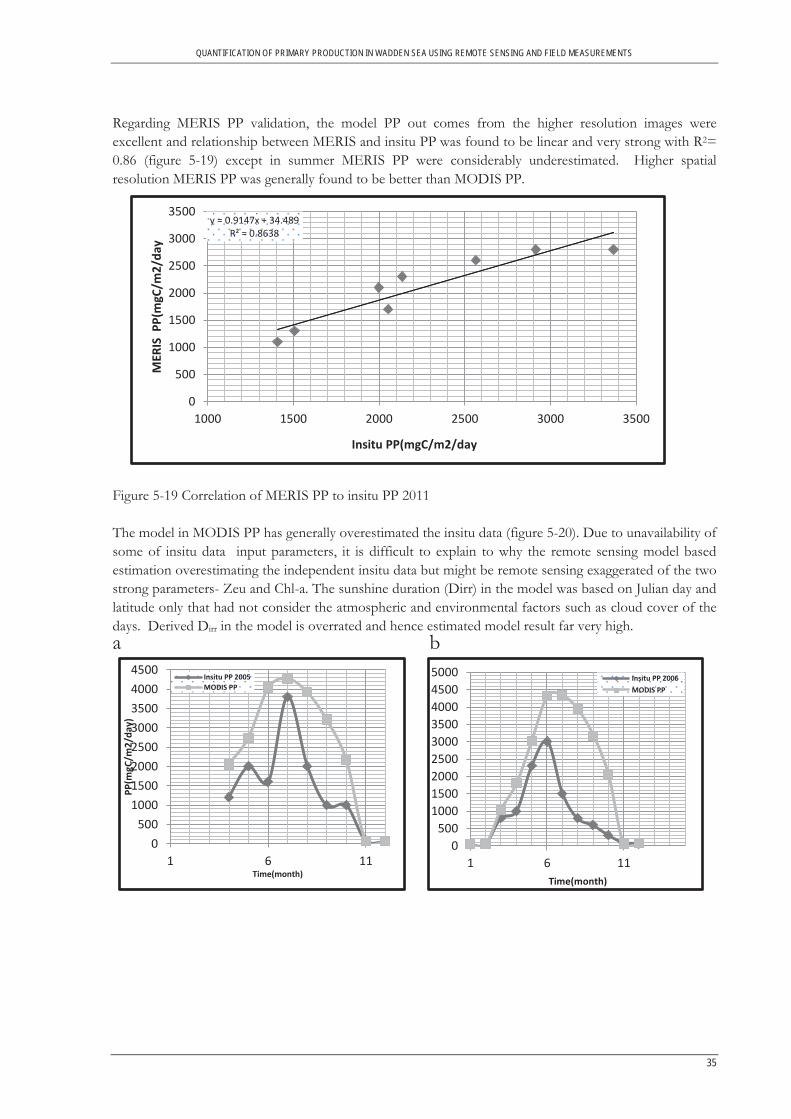
QUANTIFICATION OF PRIMARY PRODUCTION IN WADDEN SEA USING REMOTE SENSING AND FIELD MEASUREMENTS
35
0500
10001500200025003000350040004500
1 6 11
PP(m
gC/m
2/da
y)
Time(month)
Insitu PP 2005MODIS PP
y = 0.9147x + 34.489 R² = 0.8638
0
500
1000
1500
2000
2500
3000
3500
1000 1500 2000 2500 3000 3500
MER
IS P
P(m
gC/m
2/da
y
Insitu PP(mgC/m2/day
0500
100015002000250030003500400045005000
1 6 11Time(month)
Insitu PP 2006MODIS PP
Regarding MERIS PP validation, the model PP out comes from the higher resolution images were excellent and relationship between MERIS and insitu PP was found to be linear and very strong with R2= 0.86 (figure 5-19) except in summer MERIS PP were considerably underestimated. Higher spatial resolution MERIS PP was generally found to be better than MODIS PP.
Figure 5-19 Correlation of MERIS PP to insitu PP 2011 The model in MODIS PP has generally overestimated the insitu data (figure 5-20). Due to unavailability of some of insitu data input parameters, it is difficult to explain to why the remote sensing model based estimation overestimating the independent insitu data but might be remote sensing exaggerated of the two strong parameters- Zeu and Chl-a. The sunshine duration (Dirr) in the model was based on Julian day and latitude only that had not consider the atmospheric and environmental factors such as cloud cover of the days. Derived Dirr in the model is overrated and hence estimated model result far very high. a b
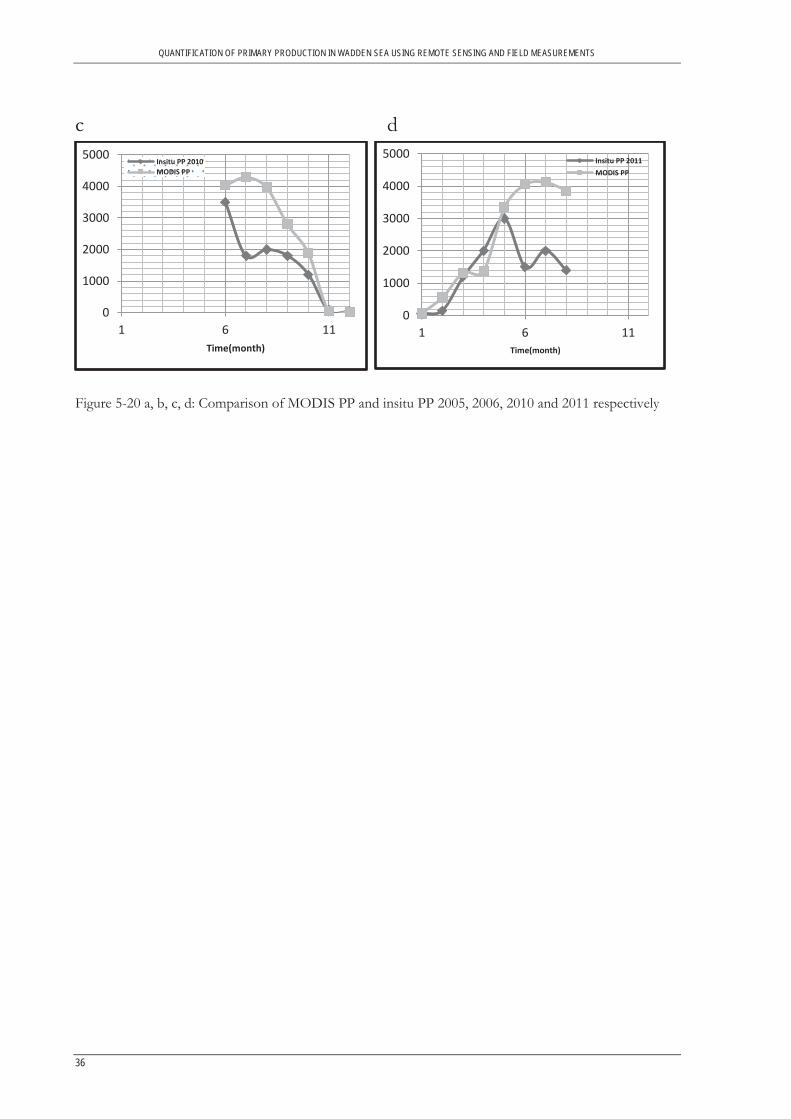
QUANTIFICATION OF PRIMARY PRODUCTION IN WADDEN SEA USING REMOTE SENSING AND FIELD MEASUREMENTS
36
c d
Figure 5-20 a, b, c, d: Comparison of MODIS PP and insitu PP 2005, 2006, 2010 and 2011 respectively
0
1000
2000
3000
4000
5000
1 6 11Time(month)
Insitu PP 2010MODIS PP
0
1000
2000
3000
4000
5000
1 6 11Time(month)
Insitu PP 2011MODIS PP

QUANTIFICATION OF PRIMARY PRODUCTION IN WADDEN SEA USING REMOTE SENSING AND FIELD MEASUREMENTS
37
6. DISCUSSION
Phytoplankton needs sunlight, water and nutrients for growth. Phytoplankton remains at or near the surface in the day because that is where sunlight is most abundant. As a result of stratification, nutrients can often become more enriched in bottom waters and often more depleted in surface waters. Phytoplankton generally undergoes a diurnal vertical migration (Townsend, Bennett, & Thomas, 2005) in which surface aggregations during the day and subsurface dispersal or accumulation at night. In general, phytoplankton blooms stay at deeper layers at night and return to the surface layer during the day to carry out photosynthesis(Kamykowski, Milligan, & Reed, 1998).
6.1. Temporal and Spatial Variation of Chlorophyll-a The Chl-a concentration in Wadden Sea is high, not only during the April peaks, but also in summer and this indicates the eutrophic nature of the sea. Chl-a concentrations were noticeably higher near Marsdiep due to possible differences in nutrient concentrations as exchanges with North Sea. Study showed that nutrients and water temperature play key roles in determining phytoplankton biomass (Chen, Fan, & Teubner, 2003).Total nitrogen and total phosphorus concentrations near Marsdiep might be considerably higher than those at other sites and might result in increase of Chl-a concentration at these sites. Another reason of the higher Chl-a concentration in Marsdiep can be possibly due to re-suspension of benthic algae in the South western part of the study area. The high concentrations of Chl-a in summer were related not only to higher temperatures, but also could be due to the prevailing wind (Fan, Chen, & Wu, 1998) and these winds may have brought cyanobacteria from the open lake Ijsselmeer into the near shore region around the sea. The present Chl-a spatial pattern results coincide similar to those previously reported by Hommersom et al (2009). Highest peaks chlorophyll-a was in 2008 and the downward trend in Chl-a concentrations between 2009 and 2011 indicated alteration of Wadden Sea water quality.
6.2. Assessment of temporal and spatial patterns of Chl-a and other input parameters to PP The temporal variation in PP was analogous with variation of Chl-a. Some differences were, however, observed between the temporal patterns of Chl-a concentration and daily mean PP. For example, the range of monthly variation of Chl-a concentration was distinctly different that of PP (as is explained below). Chl-a concentration and PP peaks appeared at different months. Water temperature was likely to be responsible for this difference. In January (winter), the water temperature is the lowest, which corresponded to a very low value for PBopt, greatly inhibiting PP. In January, photoperiod and PAR were also very low, consequential in the lowest Chl-a concentration and PP in this month. Although the highest Chl-a concentrations occurred in April or May, the highest PP did not appear in these month (June or July), due to the inhibition of PBopt by the high water temperatures in the summer. The maximal PBopt values occur at 18–220C appearing in summer (June-September). The highest PP usually occurred in June or July, the months with the longest photoperiod. The temporal–spatial pattern of daily mean PP and Chl-a concentration was consistent with the decrease from the Coastal to the off coast of the sea. From the available 2011 MERIS images of Study area annual mean PP is 2.50 gC m-2 day-1, is considered high. But it was still lower than other water bodies around such as eutrophic shallow lakes Ijsselmeer and open North Sea, which are at similar latitude.
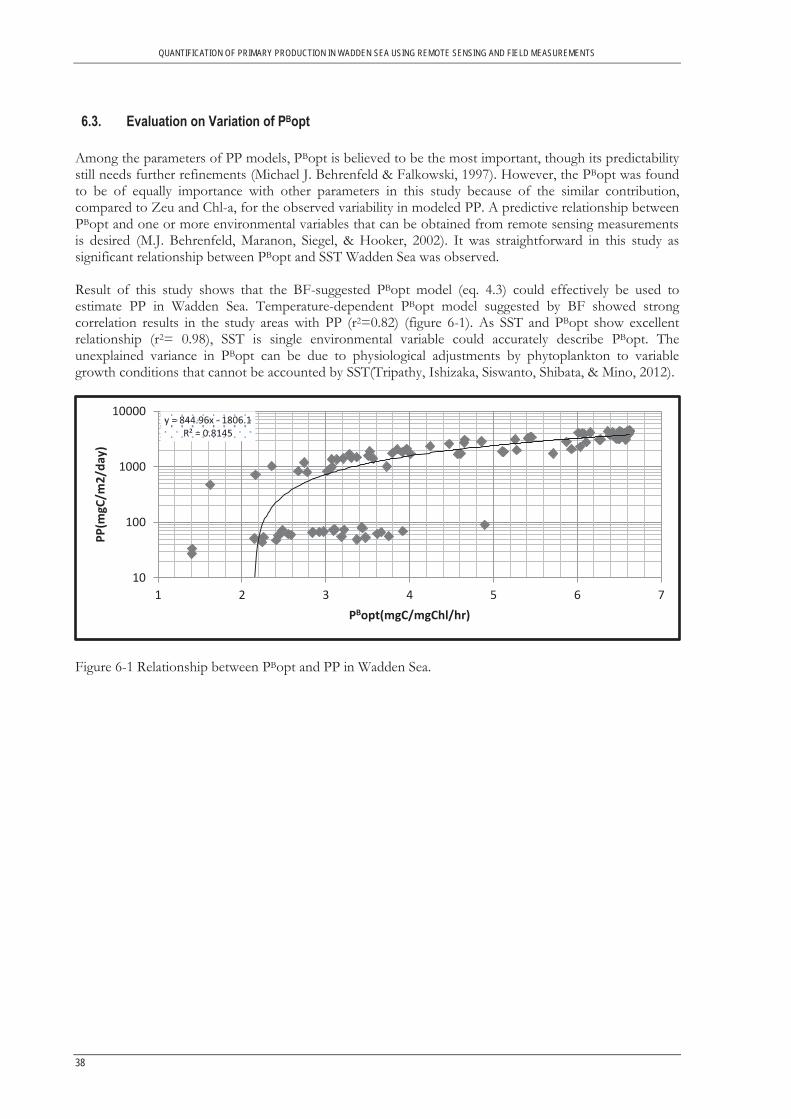
QUANTIFICATION OF PRIMARY PRODUCTION IN WADDEN SEA USING REMOTE SENSING AND FIELD MEASUREMENTS
38
6.3. Evaluation on Variation of PBopt Among the parameters of PP models, PBopt is believed to be the most important, though its predictability still needs further refinements (Michael J. Behrenfeld & Falkowski, 1997). However, the PBopt was found to be of equally importance with other parameters in this study because of the similar contribution, compared to Zeu and Chl-a, for the observed variability in modeled PP. A predictive relationship between PBopt and one or more environmental variables that can be obtained from remote sensing measurements is desired (M.J. Behrenfeld, Maranon, Siegel, & Hooker, 2002). It was straightforward in this study as significant relationship between PBopt and SST Wadden Sea was observed. Result of this study shows that the BF-suggested PBopt model (eq. 4.3) could effectively be used to estimate PP in Wadden Sea. Temperature-dependent PBopt model suggested by BF showed strong correlation results in the study areas with PP (r2=0.82) (figure 6-1). As SST and PBopt show excellent relationship (r2= 0.98), SST is single environmental variable could accurately describe PBopt. The unexplained variance in PBopt can be due to physiological adjustments by phytoplankton to variable growth conditions that cannot be accounted by SST(Tripathy, Ishizaka, Siswanto, Shibata, & Mino, 2012).
Figure 6-1 Relationship between PBopt and PP in Wadden Sea.
y = 844.96x - 1806.1 R² = 0.8145
10
100
1000
10000
1 2 3 4 5 6 7
PP(m
gC/m
2/da
y)
PBopt(mgC/mgChl/hr)

QUANTIFICATION OF PRIMARY PRODUCTION IN WADDEN SEA USING REMOTE SENSING AND FIELD MEASUREMENTS
39
6.4. Assessment of primary production Variations Some of explanations for the variation of PP in Wadden Sea can be summarized as follows:
Continuous interaction between the Wadden Sea waters with the lake Ijsselmeer and the coastal North Sea –biogeochemical exchanges.
Eutrophication in the North Sea predominantly remains restricted to relatively narrow coastal
areas due to the residual current system in the area. Thus an increase in primary production in the Dutch coastal waters might affect the Wadden Sea(Cadée, 1986).
Increase of PP might be also due to eutrophication from the river Rhine - an increase in
mineralization
Probably lower PP in turbid areas where light is the limiting factor. Inner the part of the Wadden, Sea light is the limiting factor for phytoplankton growth(Tillmann et al., 2000)
Wind direction changes most probably decrease water-column turbidity which had a positive
effect on phytoplankton growth and hence on primary productivity(Cadée, 1986)
Salinity decrease change indicator of an increase in stratification. As long as nutrients are not limiting, stronger stratification might lead to a higher phytoplankton biomass. Salinity could be due to due to river overflow, rainfalls and evaporations over sea surface. (Cadée, 1986)
There is however no common opinion as to the cause(s) of such as increase or decrease of PP in
Wadden Sea.
6.5. PP Value and Anomalies Trend PP derived using VGPM model of Wadden Sea and surrounding water processed using IDL codes revealed that North Sea and Wadden Sea has shown relatively higher value trend and indicates productivity increasing compare to the Lake Ijsselmeer. Value anomalies from MERIS PP points out that Wadden Sea and North Sea have positive and the lake PP exhibits as negative anomalies (figure 6-2).
Figure 6-2 PP map of value Trends (A) PP anomaly Trends (B)
A B
±
QUANTIFICATION OF PRIMARY PRODUCTION IN WADDEN SEA USING REMOTE SENSING AND FIELD MEASUREMENTS
40
6.6. Uncertainty analysis Through incorporation of SPM and mudflats areas, primary production in the Eastern part of the figures is lower than in the western part of figures. This effect is especially noticeable for known regions of high turbidity and mudflats areas. The model PP product can have many sources of uncertainty or error. factors approximation PBopt by the SST only and discounted other environmental. Another issue is the reliability of the depth integration and use of Zeu * Chl-a to represent the PP in the water column. The accuracy of VGPM model, developed for oceans, is also source of error in shallow and turbid water of study area and also error rooted from satellite derived of input parameters. In addition calculated sunshine duration (Dirr) neglected cloud coverage period of time, thus it was one of the reasons for overestimation of the model.
6.6.1. Accuracy of VGPM This study was first time to conduct from remote sensing in synoptic approach to cover in high resolution both spatial-temporal variations of PP in Wadden Sea. In the first attempt using VGPM model the results are reasonable. It is worth emphasizing here that, the VGPM, although a global open ocean model reasonably performed in this turbid water ecosystem. Furthermore, it is surprising that the light-dependent function (E0/E0 + 4.1) of VGPM, which describes the light saturation depth for PP in the water column, worked fairly well in this turbid waters where in other works modified to estimate of PP. The contribution of Zeu for variability in modeled PP was the maximum among all the embedded parameters of VGPM in this area. According BF have reported that the errors in PP resulting from Zeu estimation is of secondary importance compared to the errors associated with Chl-a and PBopt estimation, which is inconsistent with our results. After incorporating the Kd- converted Zeu, the model performance significantly improved, the Kd-converted Zeu explains much of the observed variability in measured Zeu. Thus, if more accurate models for estimation of Zeu can be developed, it is likely that the accuracy of modeled PP in turbid water ecosystems like Wadden Sea can be enhanced. Daily PP estimates from VGPM overestimated (1.3 to 1.7 times) the independent datasets of insitu-PP.
6.6.2. Accuracy chlorophyll-a and Euphotic depth Production values determined using satellite models are mainly dependent upon the accuracy of satellite retrievals of Chl-a and Zeu, which are limited in waters containing Suspended Sediments (SS) and/or CDOM(Smyth, Moore, Hirata, & Aiken, 2006). The predominant source of error originates from extracting Chl-a and Zeu data from remotely sensed measurements of water leaving radiance. In this study, Chl-a and Zeu derived from the C2R algorithm, designed for coastal waters, showed good correlation with in situ data However, it is known that due to problems associated with atmospheric correction, especially in turbid coastal waters, the performance of the C2R algorithm may be low when satellite Rrs will be used as input. Gordon & Clark (1980) have predicted that satellite-derived Chl-a would be erroneous at concentration > 10 mg m-3, predominantly in spring and summer, due to poor atmospheric correction. High Chl-a (> 10 mg m-3) and SS in Wadden Sea is also reported by Hommersom et al.,(2009), which means that better interpretation of coastal pigments and SS is desirable to improve Case 2 water Chl-a algorithm. Marra, Trees,& O’ Reilly(2007)have found that the absorption properties are more important predictors of daily productivity in some environments than the quantity of chemically extracted Chl-a. Further, they have shown that absorption is a more appropriate quantity than Chl-a for use in normalizing productivity. Phytoplankton absorption can be separated from Rrs-based total absorption(Lee et al., 2002). Phytoplankton absorption obtained from Rrs data can be used as substitute for Chl-a in PP estimation. If a good relationship between phytoplankton absorption and PP can be established in the study area; it will help to solve the related issues associated with Chl-a estimation in turbid waters(Tripathy et al., 2012).
QUANTIFICATION OF PRIMARY PRODUCTION IN WADDEN SEA USING REMOTE SENSING AND FIELD MEASUREMENTS
41
7. CONCLUSIONS AND RECOMMENDATIONS
7.1. Conclusions We have used a large remote sensing data set to describe the temporal– spatial distributions of PP in Wadden Sea. Within the 9-year study period of 2003–2011, peaks in Chl-a concentration occurred in 2003 and 2008. The highest Chl-concentrations occurred in spring (April–May) and the lowest concentrations in winter (January), the peaks were related to enrichment of nutrients in Wadden Sea and the prevailing wind in summer. The highest Chl-a concentration were generally found at Marsdiep sites. Chl-concentrations Marsdiep, were markedly higher than the sites in the inner of the Sea, supporting a trend of decreasing concentration from the mudflats dominated area of west Terschelling, through the coast to the inner of the Sea. The spatial pattern of daily mean PP distribution nearly matched that of Chl-a concentration. PP of Wadden Sea in 2008 values were approximately 2.5 times higher than those in 2003, a marked increase in PP corresponded with an increase in Chl-a concentration. The monthly mean PP was highest in July at most site where the peak of Chl-a occurred in April. The monthly mean PP was lowest in January, following a pattern similar to that of the Chl-concentrations. The spatial pattern in daily mean PP was similar to that of Chl-a, decreasing from the coasts through the inner of the sea. Temporal–spatial variation in PP appeared to be mainly driven by euphotic depth (Zeu) and temperature (SST), Chlorophyll-a and other contributing factors included surface PAR and photoperiod. VGPM model has shown reasonable result on PP of shallow and turbid Wadden Sea. Though the VGPM model has overestimated the insitu data, PP derived using the model from remote sensing approaches was strongly correlated with the 14C-based PP estimates of insitu measurements.
7.2. Recommendations
More accurate atmospheric correction method should be applied to reduce the errors occurring on the derived Chl-a and Zeu parameters.
Calculating PBopt should also consider other environmental condition along with sea surface temperature.
More MERIS images should be analyzed to understand trends in PP growth in the study area. Rrs-based total absorption models deriving Chl-a can be utilized to reduce the uncertainty
occurred as result of the C2R model which is more convenient for coastal and highly turbid waters.
Measured sunshine duration data should be used to avoid overestimation of the PP Generally the performance of the VGPM model can be improved further by giving consideration
in such a way by adjusting retrieval models on more sensitive parameters such as Chl-a concentration, Zeu and PBopt.


43
LIST OF REFERENCES Balch, W., Evans, R., Brown, J., Feldman, G., McClain, C., & Esaias, W. (1992). The Remote Sensing of
Ocean Primary Productivity: Use of a New Data Compilation to Test Satellite Algorithms. J. Geophys. Res. Journal of Geophysical Research, 97(C2), 2279-2293.
Behrenfeld, M. J., & Falkowski, P. G. (1997). Photosynthetic Rates Derived from Satellite-Based Chlorophyll Concentration. Limnology and Oceanography, 42(1), 1-20.
Behrenfeld, M. J., Maranon, E., Siegel, D. A., & Hooker, S. B. (2002). Photoacclimation and nutrient-based model of light-saturated photosynthesis for quantifying oceanic primary production. Marine Ecology Progress Series, 228, 103-117.
Cadée, G. C. (1986). Increased phytoplankton primary production in the Marsdiep area (Western Dutch Wadden Sea). Netherlands Journal of Sea Research, 20(2-3), 285-290. doi: 10.1016/0077-7579(86)90050-5
Campbell, J., & Oreilly, J. (1988). Role of satellites in estimating primary productivity on the northwest Atlantic continental shelf. Continental Shelf Research Continental Shelf Research, 8(2), 179-204.
Carder, K. L., Chen, F. R., Cannizzaro, J. P., Campbell, J. W., & Mitchell, B. G. (2004). Performance of the MODIS semi-analytical ocean color algorithm for chlorophyll-a. Advances in space research : the official journal of the Committee on Space Research (COSPAR). 33(7), 1152.
Chen, Y. W., Fan, C. X., & Teubner, K. (2003). Changes of nutrients and phytoplankton chlorophyll-a in a large shallow lake, Taihu,China: an 8-year investigation. Hydrobiologia
506–509, 273–279. Dall'Olmo, G., & Gitelson, A. A. (2005). Effect of bio-optical parameter variability on the remote
estimation of chlorophyll-a concentration in turbid productive waters: experimental results. Applied optics, 44(3), 412-422.
Eppley, R. W., Stewart, E., Abbott, M. R., & Heyman, U. (1985). Estimating ocean primary production from satellite chlorophyll. Introduction to regional differences and statistics for the Southern California Bight
ESA.). Retrieved 7/2/2012, from http://earth.esa.int/EOLi/EOLi.html ESA. (2012). Retrieved 09/02/2012, from https://earth.esa.int/web/guest/missions/esa-operational-eo-
missions/envisat/instruments/meris Fan, C. X., Chen, Y. W., & Wu, Q. L. (1998). Effect of prevailing wind in summer on distribution of algal
bloom in Lake Taihu, Shanghai. Environmental Science 17, 4-7. Frenette, J. J., Arts, M. T., & Morin, J. (2003). Spectral gradients of downwelling light in a fluvial lake
(Lake Saint–Pierre, St–LawrenceRiver) Aquatic Ecology, 37, 77-85. Ghirmai Habte, M. (2011). Estimating chlorophyll - A asorption as a proxy to phytoplankton biomass from MERIS
data lake Naivasha, Kenya. University of Twente Faculty of Geo-Information and Earth Observation ITC, Enschede.
Gons, H. J. (1999). Optical Teledetection of Chlorophyll a in Turbid Inland Waters. ENVIRONMENTAL SCIENCE AND TECHNOLOGY -WASHINGTON DC-, 33(7), 1127-1132.
Gordon, H. R., & Clark, D. (1980). Atmospheric effects in the remote sensing of phytoplankton pigments. Boundary Layer Meteorology, 18, 299-313.
Holt, J., Harle, J., Proctor, R., Michel, S., Ashworth, M., Batstone, C., . . . Smith, G. (2009). Modelling the global coastal ocean. Philosophical Transactions of the Royal Society, A 367, 939-951.
Hommersom, A., Peters, S., de Boer, J., & Wernand, M. R. (2010). A review on substances and processes relevant for optical remote sensing of extremely turbid marine areas, with a focus on the Wadden Sea. Helgol. Mar. Res. Helgoland Marine Research, 64(2), 75-92.
Hommersom, A., Peters, S., Wernand, M. R., & de Boer, J. (2009). Spatial and temporal variability in bio-optical properties of the Wadden Sea. Estuarine, Coastal and Shelf Science, 83(3), 360-370. doi: 10.1016/j.ecss.2009.03.042
Kamykowski, D., Milligan, E. J., & Reed, R. E. (1998). Relationships between geotaxis/phototaxis and diel vertical migration in autotrophic dinoflagellates. Journal of Plankton Research, 20, 1781–1796.
Koponen, Sampsa, Jaume, A. P., & (2009). Evaluation of MERIS Case-II Water Processors in the Baltic Sea: Universitat Politècnica de Catalunya.
44
Lee, Z., Carder, K. L., & Arnone, R. A. (2002). Deriving inherent optical properties from water color: a multiband quasi-analytical algorithm for optically deep waters. Applied optics, 41(27), 5755-5772.
Loebl, M., Dolch, T., & van Beusekom, J. E. E. (2007). Annual dynamics of pelagic primary production and respiration in a shallow coastal basin. Journal of Sea Research, 58(4), 269-282. doi: 10.1016/j.seares.2007.06.003
Majozi, N. P. (2011). Remote sensing of euphotic depth in lake Naivasha. University of Twente Faculty of Geo-Information and Earth Observation ITC, Enschede. Retrieved from http://www.itc.nl/library/papers_2011/msc/wrem/majozi.pdf
Marra, J., Trees, C. C., & O’Reilly, J. E. (2007). Phytoplankton pigment absorption: A strong predictor of primary productivity in the surface ocean. Deep Sea Research Part I: Oceanographic Research Papers, 54(2), 155-163. doi: 10.1016/j.dsr.2006.12.001
Microbal Oceanography-Hawaii. (2011). Retrieved 25/08/2011, from http://hahana.soest.hawaii.edu/hot/protocols/chap14.html
Morel, A. (1991). Light and marine photosynthesis: a spectral model with geochemical and climatological implications. Progress In Oceanography Progress In Oceanography, 26(3), 263-306.
Mssanzya, S. M. (2010). Monitoring and predicting eutrophication of inland waters using remote sensing. University of Twente Faculty of Geo-Information and Earth Observation ITC, Enschede. Retrieved from http://www.itc.nl/library/papers_2010/msc/wrem/mssanzya.pdf
NASA.). Retrieved 7/2/2012, from http://gdata1.sci.gsfc.nasa.gov/daac-bin/G3/gui.cgi?instance_id=ocean_month
NASA. (2011). Retrieved 7/2/2012, from http://oceancolor.gsfc.nasa.gov/cgi/browse.pl?sen=am NASA MODIS web.). Retrieved 09/02/2012, from http://modis.gsfc.nasa.gov/about/ Olaf Arndt, H. D., Tobias Koch. (2004). The Wadden Sea Regions: A Socio-Economic Analysis
Retrieved 24/08/2011, from http://www.safecoast.org/editor/databank/File/WaddenSeaRegional-analysis-En.pdf.
PV education.). Retrieved 8/2/2012, from http://pveducation.org/pvcdrom/properties-of-sunlight/calculation-fo-solar-insolation
Reid, P. C., Lancelot, C., Gieskes, W. W. C., Hagmeier, E., & Weichart, G. (1990). Phytoplankton of the North Sea and its dynamics: A review. Netherlands Journal of Sea Research, 26(2-4), 295-331. doi: 10.1016/0077-7579(90)90094-w
Salama, M. S., Dekker, A., Su, Z., Mannaerts, C. M., & Verhoef, W. (2009). Deriving inherent optical properties and associated inversion-uncertainties in the Dutch Lakes. Hydrol. Earth Syst. Sci. Hydrology and Earth System Sciences, 13(7), 1113-1121.
Simis, S. G. H. (2006). Blue-green catastrophe : remote sensing of mass viral lysis of cyanobacteria. s.n.], S.l. Available from http://worldcat.org /z-wcorg/ database.
Smyth, T. J., Moore, G. F., Hirata, T., & Aiken, J. (2006). A semi-analytical model for the derivation of ocean color inherent optical properties: description, implementation and performance assessment. Applied Optics, 45(8116-8131).
Tillmann, U., Hesse, K.-J., & Colijn, F. (2000). Planktonic primary production in the German Wadden Sea. Journal of Plankton Research, 22(7), 1253-1276.
Tilstone, G., Smyth, T., Poulton, A., & Hutson, R. (2009). Measured and remotely sensed estimates of primary production in the Atlantic Ocean from 1998 to 2005. Deep Sea Research Part II: Topical Studies in Oceanography, 56(15), 918-930. doi: 10.1016/j.dsr2.2008.10.034
Townsend, D. W., Bennett, S. L., & Thomas, M. A. (2005). Diel vertical distributions of the red tide dinoflagellate Alexandrium fundyense in the Gulf of Maine. Deep Sea Research Part II: Topical Studies in Oceanography, 52(19–21), 2593-2602. doi: 10.1016/j.dsr2.2005.06.027
Tripathy, S. C., Ishizaka, J., Siswanto, E., Shibata, T., & Mino, Y. (2012). Modification of the vertically generalized production model for the turbid waters of Ariake Bay, southwestern Japan. Estuarine, Coastal and Shelf Science, 97(0), 66-77. doi: 10.1016/j.ecss.2011.11.025
Wadden Sea World Heritage. (2011). Retrieved 24/08/2011, from http://www.waddensea-worldheritage.org/36.0.html?&L=0
Waddenacademie-knaw.). Retrieved 24/08/2011, from http://www.waddenacademie.knaw.nl/index.php?id=37&L=1
Weng, Q. (2011). Advances in environmental remote sensing : sensors, algorithms, and applications. Boca Raton: CRC Press.

45
Zhang, Y. L., Qin, B. Q., & Liu, M. L. (2007). Temporal–spatial variations of chlorophyll a and primary production in Meiliang Bay,Lake Taihu, China from1995 to 2003. Journal of Plankton Research, 29(8), 707–719.