Quantification and description of braking during mountain ...
233
Copyright is owned by the Author of the thesis. Permission is given for a copy to be downloaded by an individual for the purpose of research and private study only. The thesis may not be reproduced elsewhere without the permission of the Author.
-
Upload
khangminh22 -
Category
Documents
-
view
0 -
download
0
Transcript of Quantification and description of braking during mountain ...

Copyright is owned by the Author of the thesis. Permission is given for a copy to be downloaded by an individual for the purpose of research and private study only. The thesis may not be reproduced elsewhere without the permission of the Author.

Quantification and description of braking during
mountain biking using a novel brake power meter
A thesis presented in partial fulfilment of the requirements for the degree of
Doctor of Philosophy in
Sport & Exercise Science
at Massey University, Palmerston North, New Zealand.
Matthew Curtis Miller
Bachelor of Science in Exercise Science
Master of Science in Exercise Science
2017

Student Declaration
i
Student Declaration
I hereby declare that this thesis is my own work and does not, to the best of my knowledge,
contain material from any other source unless due acknowledgement is made. This thesis
was completed under the guidelines set by Massey University’s College of Health, for the
degree of Doctor of Philosophy and has not been submitted for a degree or diploma at
any other academic institution.
Candidate: _____________________________________
Date: _________________________________________

Foreword
ii
Foreword
When I came to New Zealand to do my PhD, I wasn’t very sure of what I wanted to study.
I knew I wanted to study mountain biking, but it’s such a diverse sport with many genres,
and I really had no clear direction of where my studies would go. However, one thing was
for sure: I was in the right place!
My supervisory team had what I felt was a good mixture of specialities within Sport &
Exercise Science, and the further I went through my research, the more I understood the
perfect mixture of talent surrounding me. Strangely, while this same team had previously
paved the way to new ideas in mountain biking research, I was given full liberty to shape
my own ideas and make my own mistakes.
The brake power meter idea was born during an actual mountain bike competition. I found
myself racing against my supervisor, Steve, who was much more fit than myself. As we
continued the race and I could hear Steve’s squeaky brakes, I knew the only reason I was
able to keep up with him was for not braking myself.
Rather than being told it was a silly idea to measure braking for my PhD, I was taught
how to apply for funding, given advice on what kind of variables we should measure, and
had conversations on how we might run experiments. It was these kinds of events that
taught me the depth of expertise and highly innovative scientists I’m surrounded by.

Foreword
iii
I’ve been tested more than I ever expected throughout this process, but have gained
knowledge and experience beyond that of sports experiments.
Thank you for believing in me.

Acknowledgements
iv
Acknowledgements
Thank you to my family and friends for motivating me and assuring me that this process
will be worth it in the end. GUNAX LBH GB ZL FGVAXL.
Thank you to Giant Bicycles NZ and Crank It Cycles for their generous equipment
support in each experimental study and for my own cycling adventures.
Thank you to Massey Ventures Limited, Massey University and SENSITIVUS Gauge for
supporting the commercial advancement of the Brake Power Meter.
This is for the haters.

Publications & Presentations
v
Publications & Presentations
Publications
Miller, M. C., Fink, P. W., Macdermid, P. W., & Stannard, S. R. (2017). Validation of a
normalized brake work algorithm designed to output a single metric to predict non-
propulsive mountain bike performance. (IN REVIEW).
Miller, M. C., Fink, P. W., Macdermid, P. W., & Stannard, S. R. (2017). Calculation of
brake power during skidding in road and off-road cycling conditions. (IN REVIEW).
Miller, M. C., Macdermid, P. W., Fink, P. W., & Stannard, S. R. (2017). Magnitude
differences in braking variables and their effects on performance when comparing
experienced and inexperienced mountain bikers navigating and isolated off-road turn. (IN
REVIEW).
Miller, M. C., Fink, P. W., Macdermid, P. W., & Stannard, S. R. (2017). Quantification
of brake data acquired with a brake power meter during simulated cross-country mountain
bike racing. Sports Biomechanics (IN PRESS).
Miller, M. C., Fink, P. W., Macdermid, P. W., Perry, B. G., & Stannard, S. R. (2017).
Validity of a device designed to measure braking power in bicycle disc brakes. Sports
Biomechanics, 1-11.

Publications & Presentations
vi
Macdermid, P. W., Miller, M. C., Fink, P. W., & Stannard, S. R. (2017). The
effectiveness of front fork systems at damping accelerations during isolated aspects
specific to cross-country mountain biking. Sports Biomechanics, 1-13.
Miller, M.C., Macdermid, P. W., Fink, P. W., and Stannard, S. R., (2017). Performance
and physiological effects of different descending strategies for cross-country mountain
biking. European Journal of Sport Science, 17(3): p. 279-285.
Macdermid, P. W., Fink, P. W., Miller, M. C., and Stannard, S., (2017). The impact of
uphill cycling and bicycle suspension on downhill performance during cross-country
mountain biking. Journal of Sports Sciences, 1-9.
Miller, M. C., Macdermid, P., Fink, P., and Stannard, S. Agreement between Powertap,
Quarq and Stages power meters for cross-country mountain biking (2016). Sports
Technology, p. 1-7.
Stannard, S., Macdermid, P., Miller, M. C., and Fink, P., The power of cycling (2015).
Movement, Health & Exercise, 4(2).
Miller M. C., Macdermid P. W. Ergonomic Strategies Related to Health and Efficiency
in Mountain Biking (2015). Journal of Ergonomics 5:e139.

Publications & Presentations
vii
Miller, M. C., & Macdermid, P. (2015). Predictive validity of critical power, the onset
of blood lactate and anaerobic capacity for cross-country mountain bike race
performance. Sport and Exercise Medicine Open Journal, 1(4), 105-110.
Macdermid, P. W , Miller, M. C., Macdermid, F. M., & Fink, P. W. (2015). Tyre Volume
and Pressure Effects on Impact Attenuation during Mountain Bike Riding. Shock and
Vibration, 10.
Miller, M. C., Moir, G. L., & Stannard, S. R. (2014). Validity of using functional
threshold power and intermittent power to predict cross-country mountain bike race
outcome. Journal of Science and Cycling, 3(1), 16.
Publications & Presentations
viii
Conference Presentations
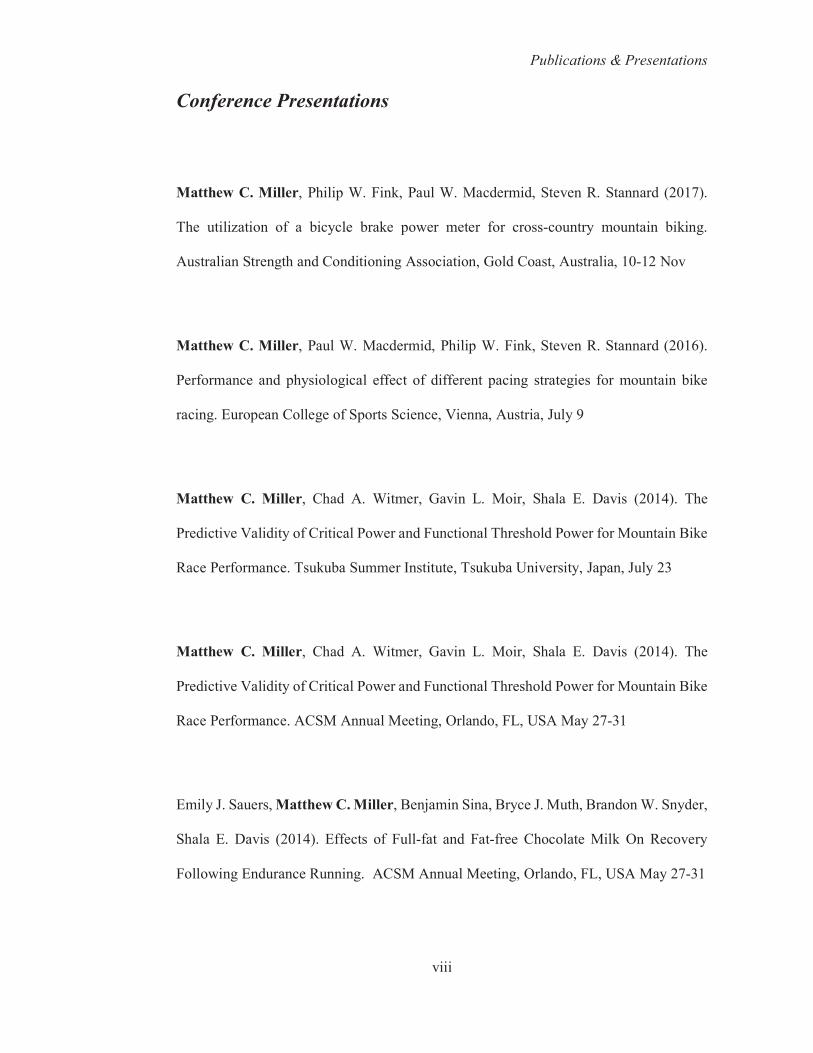
Matthew C. Miller, Philip W. Fink, Paul W. Macdermid, Steven R. Stannard (2017).
The utilization of a bicycle brake power meter for cross-country mountain biking.
Australian Strength and Conditioning Association, Gold Coast, Australia, 10-12 Nov
Matthew C. Miller, Paul W. Macdermid, Philip W. Fink, Steven R. Stannard (2016).
Performance and physiological effect of different pacing strategies for mountain bike
racing. European College of Sports Science, Vienna, Austria, July 9
Matthew C. Miller, Chad A. Witmer, Gavin L. Moir, Shala E. Davis (2014). The
Predictive Validity of Critical Power and Functional Threshold Power for Mountain Bike
Race Performance. Tsukuba Summer Institute, Tsukuba University, Japan, July 23
Matthew C. Miller, Chad A. Witmer, Gavin L. Moir, Shala E. Davis (2014). The
Predictive Validity of Critical Power and Functional Threshold Power for Mountain Bike
Race Performance. ACSM Annual Meeting, Orlando, FL, USA May 27-31
Emily J. Sauers, Matthew C. Miller, Benjamin Sina, Bryce J. Muth, Brandon W. Snyder,
Shala E. Davis (2014). Effects of Full-fat and Fat-free Chocolate Milk On Recovery
Following Endurance Running. ACSM Annual Meeting, Orlando, FL, USA May 27-31
Abstract
ix
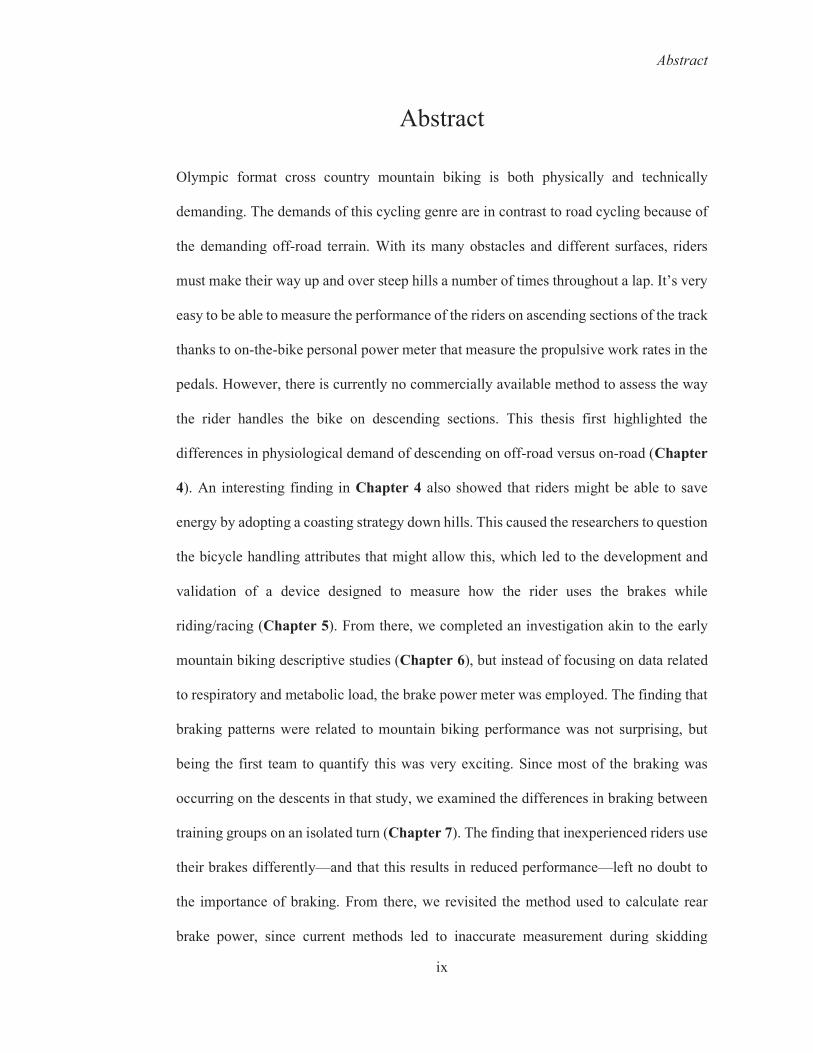
Abstract
Olympic format cross country mountain biking is both physically and technically
demanding. The demands of this cycling genre are in contrast to road cycling because of
the demanding off-road terrain. With its many obstacles and different surfaces, riders
must make their way up and over steep hills a number of times throughout a lap. It’s very
easy to be able to measure the performance of the riders on ascending sections of the track
thanks to on-the-bike personal power meter that measure the propulsive work rates in the
pedals. However, there is currently no commercially available method to assess the way
the rider handles the bike on descending sections. This thesis first highlighted the
differences in physiological demand of descending on off-road versus on-road (Chapter
4). An interesting finding in Chapter 4 also showed that riders might be able to save
energy by adopting a coasting strategy down hills. This caused the researchers to question
the bicycle handling attributes that might allow this, which led to the development and
validation of a device designed to measure how the rider uses the brakes while
riding/racing (Chapter 5). From there, we completed an investigation akin to the early
mountain biking descriptive studies (Chapter 6), but instead of focusing on data related
to respiratory and metabolic load, the brake power meter was employed. The finding that
braking patterns were related to mountain biking performance was not surprising, but
being the first team to quantify this was very exciting. Since most of the braking was
occurring on the descents in that study, we examined the differences in braking between
training groups on an isolated turn (Chapter 7). The finding that inexperienced riders use
their brakes differently—and that this results in reduced performance—left no doubt to
the importance of braking. From there, we revisited the method used to calculate rear
brake power, since current methods led to inaccurate measurement during skidding

Abstract
x
(Chapter 8). This thesis culminated with the exploration of an algorithm that could
quickly and easily describe mountain bike descending performance with one single metric
(Chapter 9); the hope is that the normalized brake work algorithm should increase the
utility of the brake power meter for training purposes and post-competition performance
analysis. Overall, this thesis highlights the need, importance and utility of a bicycle brake
power meter to assess mountain bike performance.

List of Abbreviations
xi
List of Abbreviations
ANOVA – analysis of variance
AT – aerobic threshold
CP – critical power
DH – downhill (descending) terrain
EK – kinetic energy
F - force
FTP - Functional threshold power
HR – heart rate
I - inertia
IP – intermittent power
J - joule
LT – lactate threshold
FLAT – flat terrain
m – meters
(omega) – angular velocity
OBLA – onset of blood lactate
r - radius
RCP – respiratory compensation point
rad - radians
RMS – root mean square
s - seconds
SD – standard deviation
t – time
List of Abbreviations
xii
- torque
TRIMPS – training impulse
UP – uphill (ascending) terrain
v - velocity
VO2 – volume of oxygen uptake
W – watt
W1 – anaerobic work capacity
XCO-MTB – Olympic format cross-country mountain bike racing

Table of Contents
xiii
Table of Contents
Student Declaration .................................................................................................... i
Foreword .................................................................................................................. ii
Acknowledgements .................................................................................................. iv
Publications & Presentations ..................................................................................... v
Abstract ................................................................................................................... ix
List of Abbreviations ............................................................................................... xi
Table of Contents ................................................................................................... xiii
List of Figures ....................................................................................................... xvii
List of Tables ......................................................................................................... xxi
Chapter 1 ...................................................................................................................... 1
INTRODUCTION .................................................................................................... 1
Chapter 2 ...................................................................................................................... 4
REVIEW OF LITERATURE .................................................................................... 4
2.1 Demands of Olympic format cross-country mountain bike racing ......... 4
2.2 Indices of performance ....................................................................... 10
2.3 Performance analysis and technological tools ..................................... 15
2.4 Descending performance .................................................................... 23
Chapter 3 .................................................................................................................... 26
AIMS & STRUCTURE .......................................................................................... 26
3.1 Background ........................................................................................ 26
3.2 Aims .................................................................................................. 27
3.3 Thesis structure .................................................................................. 28
Chapter 4 .................................................................................................................... 34

Table of Contents
xiv
PERFORMANCE AND PHYSIOLOGICAL EFFECTS OF DIFFERENT
DESCENDING STRATEGIES FOR CROSS-COUNTRY MOUNTAIN BIKING . 34
4.1 Abstract ............................................................................................. 34
4.2 Introduction ....................................................................................... 36
4.3 Methods ............................................................................................. 39
4.4 Results ............................................................................................... 43
4.5 Discussion .......................................................................................... 50
4.6 Conclusion ......................................................................................... 53
Chapter 5 .................................................................................................................... 55
VALIDITY OF A DEVICE DESIGNED TO MEASURE BRAKING POWER IN
BICYCLE DISC BRAKES ..................................................................................... 55
5.1 Abstract ............................................................................................. 55
5.2 Introduction ....................................................................................... 57
5.3 Methods ............................................................................................. 60
5.4 Results ............................................................................................... 69
5.5 Discussion and Implications ............................................................... 73
5.6 Conclusion ......................................................................................... 79
Chapter 6 .................................................................................................................... 81
QUANTIFICATION OF BRAKE DATA ACQUIRED WITH A BRAKE POWER
METER DURING SIMULATED CROSS-COUNTRY MOUNTAIN BIKING ...... 81
6.1 Abstract ............................................................................................. 81
6.2 Introduction ....................................................................................... 83
6.3 Methods ............................................................................................. 86
6.4 Results ............................................................................................... 91
6.5 Discussion and Implications ............................................................... 97
6.6 Conclusion ....................................................................................... 105

Table of Contents
xv
Chapter 7 .................................................................................................................. 107
MAGNITUDE DIFFERENCES IN BRAKING VARIABLES AND THEIR
EFFECTS ON PERFORMANCE WHEN COMPARING EXPERIENCED AND
INEXPERIENCED MOUNTAIN BIKERS NAVIGATING AN ISOLATED OFF-
ROAD TURN ....................................................................................................... 107
7.1 Abstract ........................................................................................... 107
7.2 Introduction ..................................................................................... 109
7.3 Methods ........................................................................................... 112
7.4 Results ............................................................................................. 115
7.5 Discussion ........................................................................................ 122
7.6 Conclusion ....................................................................................... 127
Chapter 8 .................................................................................................................. 128
CALCULATION OF REAR BRAKE POWER DURING SKIDDING IN ROAD AND
OFF-ROAD CYCLING CONDITIONS ................................................................ 128
8.1 Abstract ........................................................................................... 128
8.2 Introduction ..................................................................................... 129
8.3 Methods ........................................................................................... 133
8.4 Results ............................................................................................. 135
8.5 Discussion and Implications ............................................................. 138
8.6 Limitations and Conclusion .............................................................. 139
Chapter 9 .................................................................................................................. 140
VALIDATION OF A NORMALIZED BRAKE WORK ALGORITHM DESIGNED
TO OUTPUT A SINGLE METRIC TO PREDICT NON-PROPULSIVE MOUNTAIN
BIKE PERFORMANCE ....................................................................................... 140
9.1 Abstract ........................................................................................... 140
9.2 Introduction ..................................................................................... 142
9.3 Methods ........................................................................................... 146

Table of Contents
xvi
9.1 Results ............................................................................................. 151
9.2 Discussion and Implications ............................................................. 155
9.3 Conclusion ....................................................................................... 162
Chapter 10 ................................................................................................................ 163
DISCUSSION ....................................................................................................... 163
10.1 General discussion ..................................................................... 163
10.2 Practical applications ................................................................. 167
10.3 Thesis limitations ....................................................................... 174
10.4 Conclusions ............................................................................... 177
Appendices ............................................................................................................... 178
Appendix I ............................................................................................................ 179
References ................................................................................................................ 201

List of Figures
xvii
List of Figures
Figure 2.1 Elevation profile of the XCO-MTB World Championships in Canberra,
Australia in 2009 was originally published by Abbiss et al. (2013). .............................. 5
Figure 2.2 Elevation profile, propulsive power output and physiological variables (heart
rate and VO2) from one individual during a simulated XCO-MTB race. This figure
appeared in Macdermid & Stannard, 2012. ................................................................... 8
Figure 2.3 Example of placement of accelerometers for use in measuring vibrations
during cycling. This photo was first published by Macdermid et al. (2014). .................. 9
Figure 2.4 Example of a functional (albeit dirty) propulsive power meter located within
the chainring spider of a mountain bike crank set. ....................................................... 17
Figure 2.5 Some of the cycling metrics used by cycling practitioners presented from
TrainingPeaks software. It is not expected that all this data is useful to the untrained eye.
................................................................................................................................... 19
Figure 2.6 Power (W; pink), heart rate (BPM; red) and elevation (Feet; grey) collected
from one competitive cyclist during actual racing using TrainingPeaks software. ....... 20
Figure 3.1. Thesis structure schematic. ........................................................................ 33
Figure 4.1 Descent profiles with elevation (m) for A. DHC and DHP (1.01 km, -16.3%
gradient), and B. DHR (1.03 km, -15.7%). .................................................................. 40
Figure 4.2 Mean ± SD for values of A. Heart Rate (bpm) and B. VO2 (ml·min-1·kg-1) and
C. Time (s). ................................................................................................................. 45
Figure 4.3 Mean ± SD of A. heart rate (bpm) and B. VO2 (ml·min-1·kg-1) continuously
sampled and reduced to 15 s averages. ........................................................................ 47
Figure 4.4 Comparison between DHC, DHP and DHR for total accelerations. ............... 49
Figure 5.1 Non-drive side view of bike with A: data logger; B: front brake power meter;
and C: rear brake power meter. ................................................................................... 62
List of Figures
xviii
Figure 5.2 Front brake power meter mounted on bicycle fork. A: machined aluminium
block mounted to standard bicycle mounting posts; B: stainless steel rod; C: stainless steel
fixing pin for load cell; D: load cell housed within aluminium block; E: sliding aluminium
block with F: brake caliper mounted; G: magnetometer; H: brake rotor. ...................... 63
Figure 5.3. Correlation between total energy removed from the bicycle-rider system and
the change in kinetic energy for A: 348 braking trials completed on a flat, tar-sealed road;
and B: 60 braking trials completed on a flat dirt path. ................................................. 72
Figure 5.4. Braking example using both front and rear brakes highlighting measurements
of brake torque (A-B), angular velocity of the brake rotor (C-D) and resultant brake power
(E-F). Initial velocity was 3.7 m/s slowing a combined mass of 79.2 kg (rider plus cycling
gear and bicycle) to 2.6 m/s. Sample duration was 0.9 s with a total brake work of 231 J.
Mean brake power was 166 and 106 W for the front and rear brakes, respectively. ..... 76
Figure 5.5. Braking example using front brake only. Mean power was 105 and 6 W for
the front and rear brakes, respectively. Sample duration was 2.9 s with a total brake work
of 322.0 J. Initial velocity was 3.63 m/slowing a 79.2 kg mass to 1.7 m/s with subsequent
∆EK estimated at 316.8 J. ............................................................................................ 77
Figure 6.1. Lap profile for XCO-MTB time trial. The track was 1,240 m long and had 45
m elevation gain per lap. ............................................................................................. 87
Figure 6.2. A. Brake Work (J), B. Brake Time (s), and C. Brake Power (W) for front
(grey) and rear (black) brakes in laps 1-3. ................................................................... 94
Figure 6.3. A. lap time (s) and B. average propulsive power (W) for laps 1-3. ............. 96
Figure 6.4. Example of braking and propulsive data for one participant on lap 1 (A) and
lap 3 (B). The participant was a 22-year-old male weighing 68.5 kg with gear, had a
VO2max of 73.1 ml/kg/min and was competitive in international races. For lap 1, braking
variables were 20342 J, 28.3 s and 719 W for brake work, brake time and brake power,
respectively. Average propulsive power was 328 W with resultant lap duration of 263.3
s. For lap 3, braking variables were 18461 J, 27.0 s and 683 W for brake work, brake time
and brake power, respectively. Average propulsive power was 306 W with resultant lap
duration of 263.8 s. ................................................................................................... 103
Figure 7.1. Schematic representation of the off-road track and turn highlighting profiles
for terrain sections (A-D= distance, gradient; A= 14.50 m, -16%; B= 35.80 m, -16%; C=

List of Figures
xix
13.65 m, 0%; D= 13.65 m, 0%), which were measured with a trundle wheel. Black dots
represent boundary for each section. ......................................................................... 119
Figure 7.2. Two-way analyses for relative brake work (J/kg; A), brake time (s; B) and
relative brake power (W/kg; C) for Experienced and Inexperienced groups. .............. 120
Figure 7.3. Example trace of relative brake power of one experienced (black) and one
inexperienced (grey) riders throughout respective (A-D) sections of the track. The
respective mass of each rider (plus cycling gear) was not overly dissimilar (63.6 and 64.8
kg, respectively). Relative brake work, brake time, and relative brake power were 33.36
J/kg, 2.46 s, and 13.57 W/kg for the experienced and 37.16 J/kg, 4.53 s, and 8.21 W/kg
for the inexperienced rider, respectively. Individual braking strategies elicited
performance time of 14.08 and 15.87 s for the experienced and inexperienced rider,
respectively. .............................................................................................................. 121
Figure 8.1. Correlation between the change in kinetic energy and adjusted energy
removed from the bicycle-rider system. .................................................................... 136
Figure 9.1. Elevation profile of the descending track used for testing in this study. The
total distance was 1.01 km with a total elevation loss of 165 m (average gradient of -
16.3%). This track was chosen based in its previous use which indicated that performance
time was not dependent on propulsive work. ............................................................. 147
Figure 9.2. The relationship between Performance Time (s) on the mountain bike descent
and A) relative brake work (J/kg); B) brake time (s); C) relative brake power (W/kg); and
D) normalized brake work......................................................................................... 153
Figure 9.3. Graphical representation of normalized brake power (1/s) across a 150 m
portion of the descent from one trial each by a high-performing and low-performing
mountain biker. The normalized brake work was 0.13 and 0.80 for the high-performer
and low-performer, respectively. The time to complete this section was 14.72 and 18.22
s for the high- and low-performer, respectively, which equated to 10.91 and 8.23 m/s,
respectively. .............................................................................................................. 159
Figure 9.4. Frequency distribution of normalized brake power (1/s) comparing a high-
and low-performing mountain biker. Normalized brake power was separated in to 10 bins
in 0.05 1/s steps, with values below 0.05 1/s removed from analysis and values above 0.5
1/s combined in the same bin. ................................................................................... 161

List of Figures
xx
Figure 10.1 The Candidate with an early commercially viable prototype brake power
meter. Photo c. David Wiltshire, Massey University. ................................................ 170
Figure 10.2 An example of helmet video recording of the rider's view of the trail and the
braking trace completed throughout the trial. ............................................................ 171

List of Tables
xxi
List of Tables
Table 2.1. These regression models were derived from Miller et al. (2014) and indicated
the strength of cycling field tests for XCO-MTB race prediction. ................................ 12
Table 5.1. Mean ± SD and range for mean power and derivatives during braking. ....... 70
Table 5.2. Mean ± SD and range for calculated variables of energy loss during braking.
................................................................................................................................... 71
Table 6.1. Descriptive performance data (mean ± SD) per lap of a simulated XCO-MTB
time trial. .................................................................................................................... 92
Table 6.2. Multiple regression model incorporating brake time, brake work and relative
propulsive power to explain lap time. .......................................................................... 95
Table 7.1. Mean ± SD of performance and braking variables between Experienced and
Inexperienced mountain bikers. ................................................................................. 117
Table 7.2. Mean ±SD starting (Sections B-D) and maximum velocity (Sections A-D) for
Experienced and Inexperienced mountain bikers. ...................................................... 118
Table 8.1. Mean ± SD and range for calculated variables of energy loss during braking.
................................................................................................................................. 137
Table 9.1. Mean ± SD for performance and braking variables. .................................. 152

Chapter 1: Introduction
1
1. Chapter 1
INTRODUCTION
Indices to predict sport performance have largely relied on results of field and laboratory
tests due to their ease and reliability of measurement (Miller et al. 2014). Data garnered
through these tests has led to fine-tuned physical training programs for athletes and has
arguably contributed to the trajectory of world records throughout sporting history
(Clarke & Skiba, 2013). While beneficial overall, the laboratory focus has overlooked the
dynamic and technical nature of some sports, specifically in Olympic format cross-
country mountain bike racing (XCO-MTB).
XCO-MTB presents unique challenges compared to laboratory or road cycling, mostly
relating to the undulating terrain and variable surface conditions on mountain bike tracks.
While 40% of race distance might be uphill (Impellizzeri et al. 2007), races no longer
feature one major ascent and descent; rather, the terrain is generally made up of multiple
short, steep ascents separated by short, steep descents in succession throughout a lap.
Clearly this is at odds with traditional steady-state laboratory correlates traditionally used
in testing protocols. The sort of track profile in XCO-MTB requires intense intermittent
bouts of propulsive power production on ascending segments, with recovery bouts
occurring on the descents (Macdermid & Stannard, 2012). However, physiological
demands are complicated by the uneven and variable riding surfaces, which can
exacerbate oxygen demand due to the need to recruit additional musculature for vibration

Chapter 1: Introduction
2
damping (Macdermid et al. 2014; Macdermid et al. 2015). This in turn reduces the ability
to recover during non-pedalling bouts (Macdermid et al. 2017). These external variables
lead to relatively steady and elevated heart rate profiles, despite high oscillations in power
output (Stapelfeldt et al. 2004). Attempts to reduce the magnitude of the dissociation
between work output and physiological response has garnered much research attention
lately as scientists seek to utilise advances in technology for the athletes’ benefit (Hurst
et al. 2017; Macdermid et al. 2015; Macdermid et al. 2017).
Early reviews of the XCO-MTB have indicated that there is a need to quantify the way a
rider negotiates terrain (Impellizzeri et al. 2007) due to the notion that this has some effect
on performance. Broadly termed ‘technical ability’, it has been noted that some riders can
increase their speed on descending sections of the track to make up for lost time on ascents
(Mastroianni et al. 2000). While this raises particular health and safety concerns (Aleman
et al. 2010), small differences in technical ability can be crucial for performance in XCO-
MTB, though this area remains unexplored.
The programme of research described in this thesis aims to ascertain the need and utility
for technological developments to better understand dynamic XCO-MTB performance.
These aims evolved after particularly interesting findings in the first experimental chapter
(Chapter 4), which identified the need for a device to quantify mountain bike descending
ability. Successive investigations indicated the validity of a purpose-built, novel brake
power meter (Chapter 5), highlighted the enhanced understanding of XCO-MTB by
collecting variables recorded with the brake power meter during simulated racing

Chapter 1: Introduction
3
(Chapter 6), explored controlled and isolated aspects to better understanding of braking
variables (Chapter 7), explored a method to correct shortcomings of the device (Chapter
8) and finally, reduced braking performance to a single metric designed to predict
descending performance (Chapter 9).
The experiments presented in this thesis pioneer the way toward the development of novel
devices for cycling performance analysis, ultimately culminating by explaining new,
complicated variables with easy-to-understand metrics. Findings are presented as stand-
alone research manuscripts which are published or in-review, then compiled within this
thesis as a complete program of research towards a Doctor of Philosophy qualification.
Chapter 2: Review of Literature
4
2. Chapter 2
REVIEW OF LITERATURE
2.1 Demands of Olympic format cross-country mountain
bike racing
Competitive cross-country mountain biking is recognized by the International Olympic
Committee (IOC) and was first held during the Atlanta games in 1996. Current XCO-
MTB racing is governed by the Union Cycliste Internationale (UCI), which rules that
competitions should last approximately 90 minutes (Stapelfeldt et al. 2004). To make up
the race duration, relatively short (4-9 km) circuits are completed a number of times on a
mixture of terrain that is mostly off-road (Lee et al. 2004). The terrain can feature a
number of obstacles including roots, rocks, jumps and drops which can be natural or man-
made and on flat, ascending or downhill terrain (Figure 2.1). Riding surface can be
weather-dependent, meaning that a hard-packed, dry and dusty course could become
muddy and slippery after a rain; however, by and large competitions go on as scheduled
during inclement weather, with only minor changes made to the number of laps so as to
stay within completion time restraints. Tracks may also feature grass, gravel or tar-sealed
road sections, and it is expected that top athletes be able to navigate any type of terrain in
expert-fashion.

Chapter 2: Review of Literature
5
Figure 2.1 Elevation profile of the XCO-MTB World Championships in Canberra, Australia in 2009 was originally published by Abbiss et al. (2013).
Races are mass-start, but quickly funnel into sections of track that are only one-rider-
wide, which makes passing difficult (Macdermid & Morton, 2010). The 80% rule used in
Elite racing governs that any rider who falls to below 80% of the pace of the fastest rider
will be pulled from the race. This was made to reduce lapped traffic for the front
competitors, but complicates race strategy for racers lining up in the back of very large
(100+) rider fields (Macdermid & Morton, 2010). As such, race dynamics demand an all-
out effort from the start to gain positional advantage before the first narrow section of
track, after which intensity quickly reduces to a more sustainable effort (Viana et al.
2013). Despite this all-out start, elite riders are able to maintain lap time across the
duration of the lap regardless of variation of speeds recorded in different parts of the track
(Martin et al. 2012). Thus far this lap time maintenance stands as a testament to their peak
physical capability. As expected, ascending portions are the slowest parts of the track,
with technical ascents being even slower (Martin et al. 2013). Some 40% of the race

Chapter 2: Review of Literature
6
distance could be ascending (Lee et al. 2002), which is course dependent. Analysis of the
2009 XCO-MTB World Championships revealed 168 m of elevation gain in every 6.47
km lap (Abbiss et al. 2013). These observations place a premium on ascending ability,
which demands a high power:weight ratio (W/kg) (Gregory et al. 2007).
The earliest descriptive study by Impellizzeri et al, (2002) observed that 82% of lap time
was spent above the lactate threshold (LT), which highlighted the intense nature of the
sport. In this study, riders maintained 90% of maximum heart rate (HR) for the duration
of the race, which corresponded with 84% of maximum oxygen uptake ( O2max)
measured in laboratory testing. Generally, HR recordings appeared to remain steady in
the vicinity of the LT throughout races, which was supported by the relatively high levels
of blood lactate measured during competitions (Impellizzeri et al. 2007). The LT had
already been well-accepted as a strong indicator of endurance and road cycling ability
(Sjodin et al. 1981; Coyle et al. 1991), and race-specific data tended to support its
importance for XCO-MTB performance. While this may have been the case, the literature
fell short of describing the demands of XCO-MTB in comparison with road cycling until
the advent of on-the-bike personal power measuring devices (power meters); to that point
XCO-MTB was considered to be equivalent to a shorter, intense road race (Fernández-
García et al. 2000). Some years later, these early studies were revisited with the addition
of power meters, and later, portable breath-by-breath O2 analysers, which increased our
understanding of the uniqueness of XCO-MTB.
In 2004, Stapelfeldt et al. published the first longitudinal analysis of power profiles from
XCO-MTB competitors, indicating that average power output was relatively high (3.6

Chapter 2: Review of Literature
7
W/kg for males) throughout a season’s racing. The authors noted that 22% of power
produced during XCO-MTB was supramaximal, which alerted sport scientists to the
sport’s variable intensity. Power profiles from XCO-MTB races were contrasted with
cyclocross races (Hansen et al. 1999). The authors noted that XCO-MTB race duration
likely contributed to overall lower power output when compared with cyclocross racing
(where XCO-MTB is slightly longer in duration), placing the intensity somewhere
between cyclocross and road cycling with respect to demands. Nevertheless, it was
confirmed that periods of high power output (250-500 W) were seen on ascents, which
lasted several seconds to several minutes, and that power output was lowest on descents.
Macdermid & Stannard (2012) were the first to include respiratory gas analysis in their
comprehensive study on the demands of XCO-MTB. HR and power readings
reverberated previous work, but the authors additionally highlighted that actual measured
VO2 equated to be 77% of maximum values recorded in an exhaustive laboratory test.
Throughout these later studies, it became clear that there was a phase-delay between
actual propulsive power created through pedalling and the physiological strain placed on
the rider, especially on descending sections (Figure 2.2).

Chapter 2: Review of Literature
8
Figure 2.2 Elevation profile, propulsive power output and physiological variables (heart rate and VO2) from one individual during a simulated XCO-MTB race. This figure appeared in Macdermid & Stannard, 2012.
The group of Hurst et al. (2006) were the first to explore the demands of downhill riding,
and noted that the additional work of the upper body contributed to an elevated
physiological strain in contrast with power output. Later studies investigated specific
attributes of XCO-MTB riding surfaces, and indicated that the body adopts an autonomic
strategy to reduce vibration exposure to the head and central nervous system (Macdermid
et al. 2014). The bike and axial body are exposed to high frequencies and magnitudes of
vibrations during simulated XCO-MTB racing (Figure 2.3), however musculotendonous
damping and eccentric contractions reduce exposures before reaching the head and
lumbar spine; this damping comes at an increased physiological cost when compared with
road cycling (Macdermid et al. 2015). It has been postulated that vibration exposure—
and thus damping requirements—increase linearly with velocity, which contends that the
increases in both speed and damping requirement within descending track segments may

Chapter 2: Review of Literature
9
explain increased physiological strain. Exacerbated oxygen demand has shown
significant reduction in cycling economy on downhill sections when compared with
ascents, and may reduce the rate of recovery between high-intensity ascents. Researchers
have indicated the need to investigate strategies to reduce oxygen demand on descents to
help improve overall performance (Macdermid et al. 2016), however attempts to do so
have not been realised.
Figure 2.3 Example of placement of accelerometers for use in measuring vibrations during cycling. This photo was first published by Macdermid et al. (2014).

Chapter 2: Review of Literature
10
2.2 Indices of performance
To date, much of the literature related to XCO-MTB has focused on finding the strongest
indicator of actual performance measured from laboratory or field tests. The goal of this
type of research is to identify attributes or indices separating the best performer from the
least performers, and to henceforth utilise training interventions to improve these
attributes/indices. As highlighted above, descriptive characteristics of XCO-MTB stalled
for some years while scientists searched for additional variables to measure, and these
predictive tests appear to be following a similar trajectory. The traditional exhaustive
cycle ergometry test has proven to be popular, with different studies investigating various
metabolic thresholds and correlating them with actual or simulated XCO-MTB
performance. Amongst these it became clear early on that power output at the ventilatory
thresholds on the lower end of the intensity spectrum were not suitable determinants of
performance (r=-0.37) (Impellizzeri et al. 2005). VO2max proved to be slightly better (r=-
0.46), which is to be expected due to the very high oxygen uptake values previously
recorded in XCO-MTB athletes during maximal testing (Impellizzeri et al. 2002;
Impellizzeri et al. 2005). High-intensity testing continued to show promise with later
investigations supporting the strong relationship with maximum power output (Costa et
al. 2008). However, results from these tests overlooked the aerobic nature of the sport
and lacked practical resolution because after all, they were completed in the laboratory
and not in the field.
By further analysing respiratory gas and metabolite concentrations, high-end aerobic
metabolic thresholds in the vicinity of the LT and anaerobic threshold (AT) have

Chapter 2: Review of Literature
11
repeatedly been shown to relate to strongly to performance and thus continue to be some
of the better laboratory indices. Relative power output (W/kg) at the respiratory
compensation point (RCP) was one of the first strong significant indicators of
performance (r=-0.61) (Impellizzeri et al. 2005). That original data was supported by a
small study reporting a significant relationship with performance time and the second LT
(Costa et al. 2008). The findings of Gregory et al. (2007) reinforced this, highlighting
that relative power output (W/kg) at the individual anaerobic threshold were significantly
associated with a simulated XCO-MTB time trial (r=-0.78). In this same study, the
researchers went further and looked purely at ascending performance, which was
similarly strong (r=-0.75). Furthermore, it was uncovered that these relative power output
values were stronger indices than absolute measures due to the effects of gravity on
ascending. Prins et al. (2007) noted that relative power output at the onset of blood lactate
(OBLA) was significantly related to an XCO-MTB-specific time trial (r=-0.74). This was
followed up some years later (Miller et al. 2014), with the authors indicating that the
functional threshold power (FTP) field test used to estimate power output at OBLA
(Gavin et al. 2012; Allen & Coggan, 2012) was significantly related to race performance
(r2=0.74), which was a successful bid to determine widely available and convenient
testing methods (Miller et al. 2014). In an exploratory study, Miller et al. (2015) later
suggested that relative critical power (CP) may strongly indicate XCO-MTB performance
since it demarcates the boundary between aerobic and anaerobic energy production,
however the concept has yet to gain momentum in the sport.
The majority of these predictive studies have focused mainly on well-known steady-state
aerobic or peak anaerobic values, which arguably overlooks the numerous intense periods

Chapter 2: Review of Literature
12
within competition. While specific stationary XCO-MTB time trial performance is
strongly related to actual performance (r=0.79) (Prins et al. 2007), this type of test is more
difficult to measure than laboratory variables, and could be dependent on the course
profile. Attributable to the intermittent nature of XCO-MTB, mean power throughout a 5
x 30 s Wingate was shown to indicate performances quite well (Inoue et al. 2012).
Following these measurements, researchers developed a novel intermittent field testing
protocol (Miller et al. 2014), noting that it predicted performance better than the FTP field
test and could be completed in 20 minutes on a stationary trainer, which is appealing in
its own right.
Table 2.1. These regression models were derived from Miller et al. (2014) and indicated the strength of cycling field tests for XCO-MTB race prediction.
Variable Model r r2 MSE Error
Relative FTP Race time = 6317.224 +
(-655.688 Relative FTP)*
0.858 0.736 92,190 303.6
Relative IP Race Time = 6662.768 +
(-598.752 Relative IP)*
0.886 0.786 74,773 273.5
Note: Relative FTP = Functional Threshold Power; Relative IP = Intermittent Power; MSE = mean square error, calculated as the residual sum of squares divided by the degrees of freedom; Error = estimation error, calculated as the square root of MSE.
* Both models p < 0.001

Chapter 2: Review of Literature
13
Promising new methodology incorporating multidimensional variables has further
enhanced knowledge of XCO-MTB performance indices (Novak et al. 2017).
Incorporating video footage from XCO-MTB trails, participants were timed on their
ability to choose the fastest section of trail. Results from this test were henceforth utilised
in various regression models, and highlighted that a combination of fitness and sport-
specific decision-making variables could predict performance better than unidimensional
models. However, these models were admittedly weakest when predicting technical
and/or downhill sections.
To date, little research has focused on predicting ability on downhill sections within
XCO-MTB, with research relying on the few descriptive studies on descending
performance. This type of research is important because there is an equal amount of
elevation gain and loss due to the lap-style format of racing. Recreational participation in
downhill mountain biking is physically demanding and has been likened to other
moderate intensity exercise, with the magnitude of increase in oxygen uptake and heart
rate likened to off-road motorsports (Burr et al. 2012). However, competitive outcomes
are not reliant on propulsive power output (Hurst et al. 2006). In both types of riding,
there are similarly notable reductions in handgrip strength due to fatigue, and additional
energy that is potentially being directed towards concentration. The variation in
descending performance has been suggested to be attributable to difference in technical
ability (Mastroianni et al. 2000), which was supported by qualitative analysis (Chidley et
al. 2014), though reports otherwise remain unquantified. It seems sensible to begins to
describe or quantify descending performance—especially given the relative weakness of
physical fitness indices—however, the technology to do so is not currently available. It is

Chapter 2: Review of Literature
14
possible that these types of analyses may allow better identification and resolution of
factors that performance.

Chapter 2: Review of Literature
15
2.3 Performance analysis and technological tools
The efficacy of training interventions has reliably been monitored by collecting variables
such as oxygen uptake, the rate of substrate utilisation, and HR and comparing them to
the rates of work done in the laboratory on cycle ergometers. To monitor training sessions,
athletes and practitioners adopted metrics such as the training impulse score (TRIMPS)
(Banister et al. 1985)—which accounted for exercise time above and below the threshold
heart rate—to gain a better understanding of the stress from each session. This model has
been adapted over time to weight high-intensity training and differences in sex
characteristics (Morton et al. 1997). While these models are not perfect, the ease of
collection and calculation—along with the easy-to-interpret single metric—have proven
this metric to be valuable.
As technology advanced, the advent of on-the-bike personal power meters (Figure 2.4)
has revolutionised cycling, allowing training and race data to be collected and monitored
across days, months and multiple seasons. To calculate propulsive power, pedalling
torque and the angular velocity of the pedals are multiplied, given:
(Eq. 2.1)
Where, τ is torque, and is angular velocity. The unit for power is the watt (W).
Typically, average power output is of interest, and it would be up to the coach or
practitioner to decide the time interval of interest.

Chapter 2: Review of Literature
16
The total mechanical work done is calculated as the product of average power and time,
given:
(Eq. 2.2)
Where, t is the duration (s). The unit for work is the joule (J).
These measurements are reflective of the rate of energy expended for pedalling through
a race or section, which is valuable to the coach for understanding training/competition
stresses. These measurements help the coach to guide training interventions aimed at
improving performance. To this point, measuring propulsive power output has become
extremely well-accepted in cycling, mainly due to its ease of collection and strong
association with physical fitness (Jobson et al. 2009). This has led to a number of
practitioner publications that put readings of power output into an easy-to-understand
context for greater utility of data (Allen & Coggan, 2012). An effect of this has been the
increasing availability of companies marketing these types of tools; to date there are over
a dozen manufacturers marketing propulsive power meters.

Chapter 2: Review of Literature
17
Figure 2.4 Example of a functional (albeit dirty) propulsive power meter located within the chainring spider of a mountain bike crank set.
One area that remains debated is the accuracy and validity of devices marketed by
different power meter manufacturers (Abbiss et al, 2009; Bertucci et al. 2005; Millet et
al. 2003; Novak et al. 2015; Sparks et al. 2015). The SRM power meter is often
considered the ‘gold standard’ of commercially available power meters (Hurst et al.
2015), which may be attributable to its longevity within the market. This device places
strain gauges and accelerometers within the crank’s chainring spider to calculate
pedalling torque and angular velocity, respectively, and it has long been used to compare
the data collected from devices made by competing manufacturers. Nevertheless, despite
the various placements or methods utilised to calculate both torque and angular velocity,
algorithm development has allowed devices to attain similar readings (Gardner et al.
2004) regardless of the configuration the electronics are placed. This was of particular

Chapter 2: Review of Literature
18
interest at the onset of the present research program; therefore, we undertook the
investigation of three makes of power meters during both steady and XCO-MTB riding
(Appendix I). This investigation concluded that power meters are equal during steady
riding, but small differences arise during field use due to different technologies utilized
to measure cadence. It has been surmised that the low error in these devices can reflect
the small changes that affect performance in road cycling, and thus the propulsive power
data collected remains highly regarded (Paton & Hopkins, 2001).
The development of easy-to-understand metrics from propulsive power meters continued
on from heart rate models. This has included the complicated Impulse-Response model
(Busso et al. 1994; Morton, 1997), which calculates training stress curves and allows an
easier understanding or prediction of longitudinal training stresses. Other scientific
models, such as the critical power and W’bal model (Clarke & Skiba, 2013) have proven
useful to calculate physiological reserves within training and racing situations to allow
optimal pacing strategy. At the same time, coach practitioners have taught various
additional models to predict peak performances and guide training (Allen & Coggan,
2012), however despite their wide acceptance these have yet to be fully accepted in the
scientific community. Nevertheless, these single metrics help increase the utility and
efficacy of power meters as training tools.

Chapter 2: Review of Literature
19
Figure 2.5 Some of the cycling metrics used by cycling practitioners presented from TrainingPeaks software. It is not expected that all this data is useful to the untrained eye.
At the same time, it is common for other types of simple data analyses (Stannard et al.
2015), even though not all have yet to be dissected in the literature. An example of some
the metrics coaches may view can be seen in Figure 2.5. More common/well-accepted
practices for power data analysis include: the visual inspection of data; normalization of
power output (Allen & Coggan, 2012; Jobson et al. 2009); frequency histograms based
on intensity zones; comparison of HR and power output over a time course or after
repeating sections of a lap; detection of bilateral pedalling asymmetries (Carpes et al.
2010); and analysis of pacing strategy within races and training. The aforementioned
analyses have allowed coaches and athletes the ability to fine-tune training and racing
programs for peak physical ability

Cha
pter
2: R
evie
w o
f Lite
ratu
re
20
Figu
re 2
.6 P
ower
(W
; pin
k), h
eart
rate
(B
PM; r
ed)
and
elev
atio
n (F
eet;
grey
) col
lect
ed f
rom
one
com
petit
ive
cycl
ist d
urin
g ac
tual
rac
ing
usin
g Tr
aini
ngPe
aks
softw
are.

Chapter 2: Review of Literature
21
These types of analyses have similarly become well accepted to fine-tune XCO-MTB
performance (Macdermid & Stannard, 2012). An example of the analyses that can be
completed can be seen above in Figure 2.6, which is a snapshot of real racing data from
a competitive mountain biker. While the recordings from global positioning systems
(GPS) lack finite resolution (Wing et al. 2005), a ‘good enough’ approach has been taken
when analysing those types of data. As shown in the figure, coaches and athletes can view
the elevation profile and corresponding power output; based on known physiological
thresholds, HR and power data enhance understanding. Henceforth, the data can be used
to determine strengths and weakness of individual cyclists, or to determine pacing
strategy.
Figure 2.6 highlights the high power output at the start of the race, and a reduction is seen
thereafter despite a relatively steady elevated heart rate. One indication this individual
analysis may give is that the starting intensity was too high, which is clear due to the fact
that this power output was never achieved in the remaining hour of racing. Perhaps by
knowing the rider’s physiological thresholds—such as power output at the lactate
threshold—strengths or weaknesses may become apparent and can direct training
interventions. For example, it very well may be that in this case the athlete was able to
maintain power output at 100% of the lactate threshold on the track’s longest ascent,
which may be a personal best after 30 minutes spent racing. However, it could be the case
that the short ascents in the later part of the race were far below what the athlete has

Chapter 2: Review of Literature
22
shown possible in training. In these cases, adjustments could be made to training to focus
on improving weaknesses.
One aspect of performance that is not apparent with current analysis tools is that of
descending. It very well could be that this rider was only able to negotiate the descents
on this track by getting off the bike and walking, then pedalling for short sections. This
type of riding would be a serious detriment to performance because time would certainly
be lost, however this is impossible to see based strictly on propulsive power meter data.
Unfortunately, this type of analysis is difficult to quantify and thus left to guesswork.

Chapter 2: Review of Literature
23
2.4 Descending performance
As XCO-MTB race tracks roll through terrain, laps start and end in the same location.
Accordingly, there are equal amount of elevation gain and loss, and thus similar amount
of ascending and descending in a lap. However, ascending portions of the track are
markedly slower as the riders compete against gravity, and because of this, over 40% of
race time is spent ascending. Analysis amongst different groups competing on track has
revealed that the best riders spend the least amount of time on technical ascents (Martin
et al. 2012). GPS analysis has indicated that the majority of competition time is spent
ascending on the track on various segments featuring a variety of steepness and technical
demand (Abbiss et al. 2013). It is because of this that climbing ability has been indicated
as the most important attribute for XCO-MTB race performance. While this is likely due
to differences in physical fitness, it is in reference to these observations that
recommendations have been made for riders to focus on technical uphill ability (Abbiss
et al. 2013). It comes as no surprise then that most literature has focused on aspects that
could explain or improve ascending performance.
However, most literature has overlooked the importance of descending ability, demand
and performance, with only a few refereed papers covering the topic. It became apparent
early on that descending on a mountain bike in itself was not dependent on propulsive
work (Hurst & Atkins, 2006), but was rather related to aspects of technical ability
(Mastroianni et al. 2000). The group of Chidley et al. (2014) took a qualitative approach
to gain an understanding of descending ability, however this required visual inspection of
actual riding by an experienced coach. Some of the earlier studies helped explain that the

Chapter 2: Review of Literature
24
technical nature of the track can affect the recruitment of upper body musculature,
supposed mainly for steering and postural work throughout descents (Hurst et al. 2013).
Later studies indicated that vibrations translated from the riding surface through to the
body of the rider were particularly high on descents, and may be attributed to the high
speeds (Macdermid et al. 2014). These vibrations are dampened by the body through an
autonomic strategy adopted to protect the central nervous system (Miller & Macdermid,
2015); largely done by tiny eccentric contractions, this vibration damping comes at a
measurable metabolic cost. These reports helped fill the gap in understanding of why
heart rate and oxygen uptake remained elevated in XCO-MTB, and further explains the
dissociation between propulsive work and physiological strain in XCO-MTB
(Macdermid et al. 2015).
As highlighted previously, researchers have understood well that descending performance
contributed to overall performance—whether from the variations in time for competitors
to complete these sections or due to the elevated physiological variables. Qualitative
measures have not been able to answer all of the concerns, though they did reinforce the
notion that propulsive power was not the answer to understanding these sections. A recent
investigation by Macdermid et al. (2016), which highlighted very low cycling economy
on descending section of XCO-MTB racing, suggested the following:
“…competitive cross-country cyclists should focus on fitness aspects that will
allow to recover quicker and develop technical aspects of bike
handling…enabling greater efficiency during downhill riding…”
Appropriately, it very well could be the case that riders can recover quicker by increasing
their bike handling ability, or at the very least, improving bike handling on descents could

Chapter 2: Review of Literature
25
improve overall performance. To date however, bike handling remains multivariate,
immeasurable and difficult to understand; herein lies the issue.

Chapter 3: Aims & Structure
26
3. Chapter 3
AIMS & STRUCTURE
3.1 Background
Olympic format cross-country mountain bike racing features an equal amount of
elevation gain and loss, though measures of cycling economy are significantly reduced
on descents. The ability to navigate these sections more quickly without the addition of
propulsive work could reduce overall oxygen uptake, however the quantification of non-
propulsive cycling performance is currently inhibited by lack of technology available.
With current tools, scientists are able to accurately assess mechanical propulsive work,
but there is nothing commercially available to assess the economy by which a cyclist can
navigate the bicycle.

Chapter 3: Aims & Structure
27
3.2 Aims
Given the background of work done in research surrounding XCO-MTB, there are clear
pathways to new discoveries. Thus, the aims of this thesis were to:
1) compare the physiological demand of descending on-road versus off-road, and
to determine the effects on performance of the elimination of propulsive work
during off-road descending;
2) design and validate a device to measure brake power in bicycle disc brakes;
3) quantify data recorded on a brake power meter during simulated cross-country
mountain bike racing to understand the effects of braking on performance;
4) compare braking work done between experienced and inexperienced mountain
bikers;
5) determine a method that can account for brake work done when the rear wheel is
skidding;
6) validate an algorithm that reduces brake data to a single-number metric that can
explain variation in descending performance.

Chapter 3: Aims & Structure
28
3.3 Thesis structure
To address the aims of this thesis, six experimental investigations were devised and
conducted. These are written and presented as manuscripts suitable for stand-alone
publication in refereed academic journals. Individually, these manuscripts can stand
alone, and are either published (in which case the publication is shown in the Appendices)
or in review. These are written and presented as such because it makes the dissemination
of the information much more practical and reduces the need for much more extraneous
formatting and repetition. It is important to note that the direction of these individual
manuscripts evolved throughout this thesis where new questions arose. Moreover, the
hypotheses in each manuscript were derived from one preceding it, making this stand-
alone research sequence follow a communicable story suitable for a doctoral thesis. Often
times, these manuscripts were edited to suit specific Journal style (e.g. ‘Discussion &
Implications’ for Sports Biomechanics versus ‘Discussion’ for European Journal of
Sports Science). Below are individual, general abstracts for each experimental study.
Study 1 (Chapter 4): Eight nationally competitive cross-country mountain bike racers
completed a ramp-style laboratory test to exhaustion on a cycle ergometer. Through
respiratory gas analysis, the power output at the respiratory compensation point was
determined. Participants then undertook three experimental trial on a closed mountain
bike track which incorporated an ascent completed at power output associated with the
respiratory compensation point leading in to a descent that was completed at race pace.
All participants rode the same bike that was outfitted with six accelerometers, and also

Chapter 3: Aims & Structure
29
wore a portable metabolic gas analyser and heart rate monitor. In a random order,
participants firstly descended an off-road track twice; in one instance they were allowed
to pedal while they were instructed to coast in the second instance. During the last trial,
they descended a forest road that ran parallel to the mountain bike descent, and were
instructed to maintain the average velocity of the preceding two trials. Vibration exposure
was significantly higher on the mountain bike descent when compared with the road
descent, which led to significantly elevated heart rate and oxygen uptake. While vibration
exposure was not different between the mountain bike descending pacing strategies, the
coasting trial had significantly reduced oxygen uptake, and importantly, did not
negatively affect performance. Thus, it was determined that a purposeful reduction in
propulsive work during descents could positively benefit recovery during mountain bike
competitions without impacting performance. It was henceforth determined that future
investigations should seek to understand the efficiency of navigating the bicycle, which
could have to do with the way the brakes are used.
Study 2 (Chapter 5): A bicycle brake power meter was constructed to measure the work
done through the use of the brakes during cycling. One experienced mountain biker
completed 408 braking trials on a flat, tar-sealed road (n=348) and flat dirt path (n=60)
over five days on the bicycle outfitted with this device. Energy lost to drag and rolling
resistance was added to the work done through braking in each braking event; this total
energy removed from the bicycle-rider system was compared with the change in kinetic
energy of the bicycle-rider system. Analysis highlighted that the change in kinetic energy
was not different from the total energy removed from the bicycle-rider system. Similarly,
there was a strong linear relationship with these two values. It was therefore determined

Chapter 3: Aims & Structure
30
that this bicycle brake power meter was a valid means of assessing the energy removed
during braking while cycling, and it was recommended that future research should
quantify braking during simulated racing.
Study 3 (Chapter 6): Ten nationally competitive mountain bike racers undertook a three-
lap simulated cross-country mountain bike time trial using the same mountain bike
outfitted with the brake power meter and a propulsive power meter. Despite propulsive
work significantly reducing following the first lap, performance time in each lap did not
change. Brake power meter data intimated that the maintenance of lap time was due to
reductions in brake work and the time spent braking following the first lap. It was
surmised that braking efficiency increases after repeating a track at race pace, which
counterbalances performance decrements due to fatigue. Most of the braking on the track
used in this study occurred on descending and turning sections, and the determination was
made to investigate these sections more closely.
Study 4 (Chapter 7): A total of 18 volunteers participated in a trial that sought to
determine difference in braking and performance between experienced (n=8) and
inexperienced (n=10) mountain bikers. A 76.5 m track was taped to 1.5 m wide, which
went down a hill on a forest road before leading in to a 180º turn on grass. Participants
completed three trials each on the track while utilising a mountain bike outfitted with the
brake power meter but no chain to prevent propulsive work. The mean of all variables
were calculated from the second and third trials of each participant, and the track was
virtually segmented by terrain type post-hoc. Brake power had a significant negative

Chapter 3: Aims & Structure
31
association with performance time, which indicated that faster riders were completing
brake work over a shorter period of time. Sectional analysis highlighted that experienced
riders wait until longer to brake, which increased the time spent moving quickly and
ultimately reduced performance time. Moreover, it was discovered that inexperienced
riders are heavily reliant on the rear brake, which has a negative impact on overall
braking. The findings surmised that inexperienced riders may be able to perform better
on descents and turns by learning to use both brakes more evenly and waiting longer to
brake.
Study 5 (Chapter 8): It had been noted that skidding occurred during mountain biking,
which equated to 0.3% of lap time. The methods utilised to calculate power relied on the
angular velocity of each wheel; henceforth any time the wheel was skidding there was no
work being recorded which was not reflective of actual brake work being done. This study
tested the possibility of utilizing the angular velocity of the front wheel to calculate the
rear brake power during braking events with a mixture of skidding and non-skidding. One
experienced mountain biker completed 28 braking trial with a mixture of skids and non-
skids on a mixture of a flat, tar-sealed road and a flat dirt path. Correcting for rear brake
power by utilising front wheel angular velocity proved to be a valid means of calculate
the change in kinetic energy during skidding and not skidding. It was concluded that rear
brake power calculated with the present correction would reflect actual energy lost during
braking.

Chapter 3: Aims & Structure
32
Study 6 (Chapter 9): The multivariate performance models utilizing brake metric may
be difficult to assess for some uses, which could be a barrier to brake power meter
utilization. Nine mountain bikers descended mountain bike track three times using a bike
outfitted with a brake power meter to determine the efficacy of brake power meter data
to describe descending performance with a single metric. Traditional brakes measures
were calculated to determine their association with performance; additionally, a
normalized brake work algorithm was utilised which calculated brake power as a
proportion of kinetic energy. The normalized brake work was significantly associated
with performance time (r2=0.929) and had a stronger association than other measures
investigated. This study underscored the validity of the normalized brake work algorithm
to describe descending performance based on a single braking metric, which should
enhance the value of brake power meter data for training purposes.

Cha
pter
3: A
ims &
Str
uctu
re
33
Fi
gure
3.1
. The
sis st
ruct
ure
sche
mat
ic.
Stud
y 1
Obj
ectiv
e: G
ain
an
unde
rsta
ndin
g of
the
phys
iolo
gica
l dem
and
of X
CO-M
TB
desc
endi
ngFi
ndin
g: C
oast
ing
dow
n hi
lls c
an sa
ve e
nerg
y an
d be
nefit
pe
rfor
man
ce
Stud
y 2
Obj
ectiv
e: D
esig
n an
d va
lidat
e a
devi
ce to
m
easu
re b
raki
ngFi
ndin
g: T
he b
rake
po
wer
met
er is
val
id
for u
se d
urin
g cy
cling
Stud
y 3
Obj
ectiv
e: Q
uant
ify
brak
ing
durin
g XC
O-
MTB
racin
g Fi
ndin
g: B
raki
ng a
ffect
s pe
rform
ance
, and
m
ostly
occ
urs o
n de
scen
ding
sect
ions
Stud
y 4
Obje
ctiv
e: Q
uant
ify
brak
ing
diffe
renc
es
betw
een
expe
rienc
ed
and
inex
perie
nced
co
hort
sFi
ndin
g: In
expe
rienc
ed
rider
s bra
ke lo
nger
and
do
mor
e br
ake
wor
k,
whi
ch is
det
rimen
tal t
o pe
rform
ance
Stud
y 5
Obje
ctiv
e: V
alid
ate
a m
etho
d to
calcu
late
th
e en
ergy
loss
es
durin
g sk
iddi
ng
Find
ing:
Bra
ke w
ork
and
pow
er c
an b
e ca
lcula
ted
in th
e re
ar
whe
el u
sing
the
angu
lar v
eloc
ity o
f the
fro
nt w
heel
Stud
y 6
Obj
ectiv
e: V
alid
ate
an
algo
rithm
to d
escr
ibe
desc
endi
ng
perfo
rman
ce w
ith o
ne
num
ber
Find
ing:
Nor
mal
ized
brak
e w
ork
is st
rong
ly
asso
ciate
d pe
rform
ance
whi
le
desc
endi
ng

Chapter 4: Mountain bike descending strategies
34
4. Chapter 4
PERFORMANCE AND PHYSIOLOGICAL
EFFECTS OF DIFFERENT DESCENDING
STRATEGIES FOR CROSS-COUNTRY
MOUNTAIN BIKING
4.1 Abstract
This study investigated the performance-related feasibility and physiological benefits of
purposefully eliminating propulsive work while descending in mountain biking and
compared values to those measured during road descending. Participants cycled uphill on
a road at race pace before descending over three conditions (off-road pedalling; off-road
coasting; road coasting). Relatively low power output during off-road pedalling was
associated with a greater oxygen uptake (p<0.001) when compared with off-road coasting
despite no difference in vibration exposure (p>0.05). Importantly, pedalling did not
invoke a performance benefit (p>0.05) on the descent used in this study. Significantly
greater heart rate and oxygen uptake (both p<0.0001) were observed between road and
off-road descending, likely caused by the increase in terrain-induced vibrations
(p<0.0001) experienced between the bicycle and rider. Results indicate that reducing
propulsive work during descending can improve recovery without being disadvantageous
to performance. Similarly, the vibrations experienced during road descending are

Chapter 4: Mountain bike descending strategies
35
relatively low, and further reduce oxygen cost. In an effort to increase efficiency, it is
recommended that mountain bike athletes focus on skills to increase descending speed
without the addition of pedalling, and that equipment be used to decrease vibrations
nearer to those seen on the road.

Chapter 4: Mountain bike descending strategies
36
4.2 Introduction
Olympic format cross-country mountain bike racing (XCO-MTB) takes place over
varying terrains, with high-intensity high-power ascending sections separated by
relatively lower intensity descents. Despite a pattern of highly intermittent mechanical
propulsive work (Macdermid & Stannard, 2012), measured physiological variables
remain elevated (Impellizzeri et al. 2002; Stapelfeldt et al. 2004), even on the descents,
as athletes contend with technical terrain and obstacles (Gregory et al. 2007). During
sections where propulsive work requirement is low, such as on the descents, recovery is
inhibited due to non-propulsive work from the musculo-tendonous damping of vibrations
(Macdermid et al. 2014) as well as steering and postural work of the upper body (Hurst
et al. 2012). The lack of change in physiological variables on the downhill sections are in
contrast to road cycling where riders are seemingly afforded better recovery in
competition (Lucia et al.1999; Padilla et al. 2000) which is likely due to reduced vibration
exposure because of the smoother riding surface (Macdermid et al. 2015). Technological
systems designed to reduce soft impacts and vibrations (Macdermid, et al. 2014;
Macdermid et al. 2017) can potentially reduce non-propulsive work during XCO-MTB
(Macdermid et al. 2015), but physiological demands remain higher than those on the road.
As vibration exposure may be exacerbated with increases in velocity (Macdermid et al.
2014), descending parts of the course may indicate the greatest magnitude of difference
between road and off-road riding, however no attempt has been made to quantify
differences in off-road and road descending.
Chapter 4: Mountain bike descending strategies
37
Other attempts to maximize energy efficiency in cycling sports have focused on pacing
strategies. Effective road cycling time trial pacing strategies utilize increased power on
uphill portions and reduced power on descents (Atkinson & Brunskill, 2000; Atkinson et
al. 2007) to provide the best performances. These strategies appear to work because
competitors stand to gain the least time on faster parts of the course (e.g. descents) and
gain the most time on the slowest parts of the course (e.g. ascents). In practice, this
strategy enhances recovery while descending to help the athlete exercise at a higher
intensity on subsequent ascents. Such a tactic could be recommended to attenuate reduced
efficiency and benefit overall performance in XCO-MTB as uphill climbing ability
remains most important to race outcome (Abbiss et al. 2013; Martin et al. 2012). This is
corroborated by previous work showing that downhill mountain biking has decreased
dependence on propulsive work (Hurst & Atkins, 2006) and increased emphasis on rider
skill (Chidley et al. 2014; Mastroianni et al. 2000). While these findings tend to suggest
that propulsive work could be purposefully reduced during XCO-MTB descending to
help the next ascent without contributing to an overall performance decrement, scientific
investigations have yet to explore this area specifically.
Therefore, this study was conducted to investigate the performance and physiological
demand of either pedalling or not pedalling while navigating a XCO-MTB descent under
the simulated intensity of a XCO-MTB race. A secondary aim was to compare the off-
road strategies to reduce propulsive and non-propulsive work done with a road descent of
similar duration and speed. It was hypothesized that off-road coasting would not alter
performance but that the reduced propulsive work would lead to a decreased oxygen

Chapter 4: Mountain bike descending strategies
38
uptake compared to pedalling. It was also supposed that a reduction in non-propulsive
work during the road descent would further reduce oxygen uptake.

Chapter 4: Mountain bike descending strategies
39
4.3 Methods
Participants, Procedures and Equipment
Eight nationally competitive XCO-MTB athletes (mean ± SD: age= 27 ± 7 years, height=
174 ± 8 cm, mass= 70.3 ± 11.6 kg, power at respiratory compensation point (RCP)= 300.1
± 48.3 W, RCP (percent of maximal oxygen uptake)= 74.9 ± 3.7 %, VO2max= 68.1 ± 9.8
ml·min-1·kg-1) volunteered for this study which was approved by the institutional Human
Ethics Committee. Testing involved one session in the laboratory and one session on a
purpose built track (Kohitere Forest, Levin, NZ) at least 24 hours later. The laboratory
session involved a ramp-style test to exhaustion (Lode Excalibur Sport, NL) commencing
at 100 W and increasing by 25 W per minute until the participant could no longer maintain
the required power output. Throughout this test heart rate (Polar Electro, Kempele,
Finland), expired air (K4b2, Cosmed, Italy) and power output (W) were measured.
Expired air data averaged every 15 s enabled calculation of VO2peak and RCP to determine
exercise intensity for the hill climb component specific to that reported in race conditions
(Lucía et al. 2000) for the field trial.
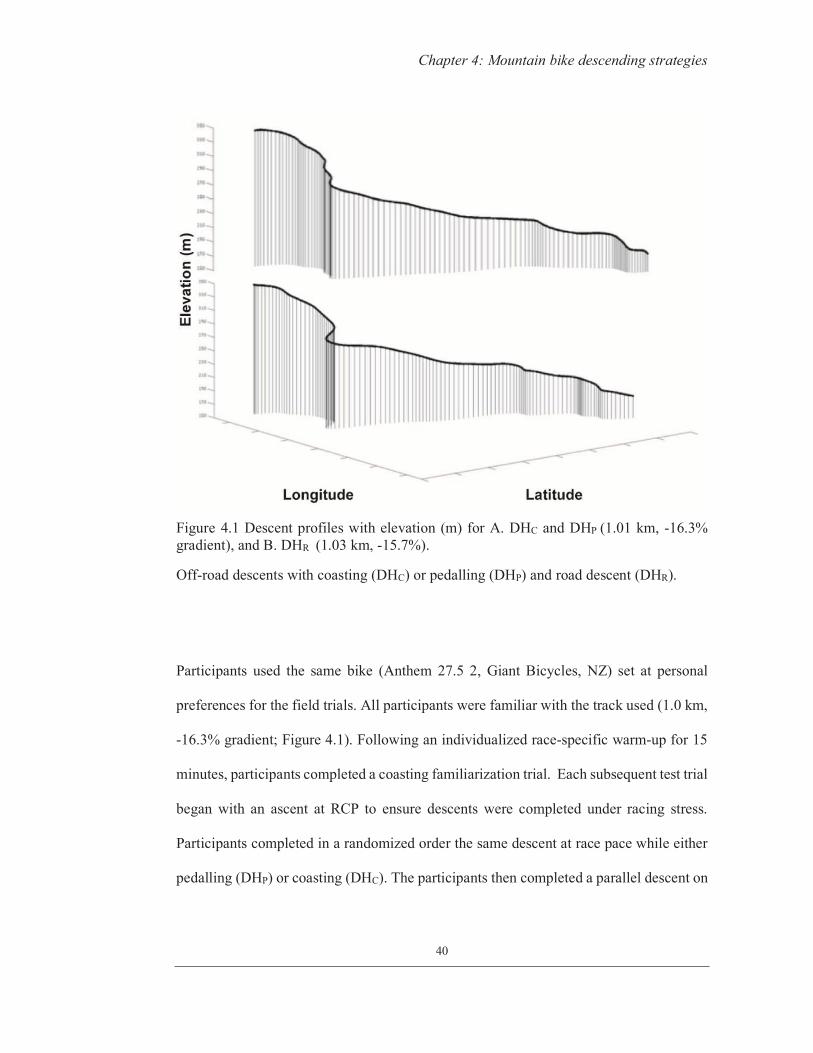
Chapter 4: Mountain bike descending strategies
40
Figure 4.1 Descent profiles with elevation (m) for A. DHC and DHP (1.01 km, -16.3% gradient), and B. DHR (1.03 km, -15.7%).
Off-road descents with coasting (DHC) or pedalling (DHP) and road descent (DHR).
Participants used the same bike (Anthem 27.5 2, Giant Bicycles, NZ) set at personal
preferences for the field trials. All participants were familiar with the track used (1.0 km,
-16.3% gradient; Figure 4.1). Following an individualized race-specific warm-up for 15
minutes, participants completed a coasting familiarization trial. Each subsequent test trial
began with an ascent at RCP to ensure descents were completed under racing stress.
Participants completed in a randomized order the same descent at race pace while either
pedalling (DHP) or coasting (DHC). The participants then completed a parallel descent on

Chapter 4: Mountain bike descending strategies
41
a forest road of comparable characteristics (DHR; 1.0 km, -15.7% gradient; Figure 1) at
the mean velocity of DHP and DHC.
Data Recording
Power output (SRAM Quarq S2275, USA) (Appendix I) and heart rate (Garmin Edge
510, USA) were continuously sampled and logged every second throughout the field trial,
while VO2 (ml·min-1·kg-1) was measured breath by breath on the Cosmed K4b2 and
reduced to 15 s averages. Data recorded from the power meter and GPS device were
transmitted to a conventional personal computer and processed with the Garmin Training
Centre software (version 3.6.5).
Wireless, tri-axial, gyroscopic accelerometers (Emerald, APDM, OR, USA) sampled at
128 Hz were used in a synchronised data logging mode to measure accelerations in
accordance with methods reported elsewhere in similar studies (Macdermid et al., 2015;
Macdermid et al., 2014, Miller & Macdermid 2015). The accelerometers were placed on
the lower left arm (frontal distal position); left lower leg (frontal, distal position); seat
post (within 10cm of saddle-rider contact area); lumbar region of lower back; and medial
forehead (Macdermid et al. 2014). The accelerometers were synchronised with the
Garmin Edge 510 and the Cosmed K4b2 enabling specific terrain sections to be marked
across all units. Data were analysed using MATLAB R2014b for total (XYZ)
accelerations (Macdermid et al. 2014).

Chapter 4: Mountain bike descending strategies
42
Statistical Analyses
Descriptive data (mean ± SD) for time (s), power (W), HR, and relative oxygen uptake
(VO2; ml·min-1·kg-1) separately for the ascent and descent of each trial and were analysed
using one-way repeated-measures analysis of variance (ANOVA). Two-way repeated-
measures ANOVA was used to compare total RMS data across each accelerometer for
each trial (condition*location) as well as to compare changes in heart rate and oxygen
uptake throughout each trial (condition*time). Correlations (Pearson’s r) were determined
comparing all performance variables. Where significant difference was found the main
effect was analysed using Bonferroni post-hoc testing. All statistical analyses were
performed using GraphPad Prism 6, significance set at p<0.05.

Chapter 4: Mountain bike descending strategies
43
4.4 Results
Uphill variables including total acceleration amplitude (F(2, 84)=1.512, p=0.2265), heart
rate (F(2, 14)=0.9831, p=0.3986), VO2 (F(2, 14)=0.4187, p=0.6659), power output (F(2,
14)=1.113, p=0.3559) and time (F(2, 14)=0.5568, p=0.5852) were not significantly different
between trials, indicating the uphill portion of this study was well controlled and that the
participants entered each descending trial in a similar physiological state.
Maximum power during DHP was 526.4 ±151.0 W, while average power was 18.8 ±11.6
W from 19.9 ±9.8 s of pedalling. The power recordings during DHP were significantly
greater (F(1, 7)=20.82, p=0.0026) than DHC and DHR, during which participants did not
pedal and thus recorded values of 0 W. However, analysis of velocity showed no
statistically significant difference (DHC= 7.3 ±1.4, DHP= 7.5 ±1.5, DHR= 7.3 ±1.4 m∙s-1;
F(2,14)=0.9014, p=0.4283), and was accompanied by no significant difference in time
(Figure 2C) to complete each trial (DHC=142.5 ±29.2, DHP=139.9 ±29.2, DHR=145.1
±29.3; F(1.135, 7.948)=2.615, p=0.1438). Results recorded for VO2 (Figure 4.2B) were
different between all trials (F(1.152, 8.062)=131.7, p<0.0001), equalling 31.7 ±3.9, 35.2 ±4.8,
and 20.1 ±2.6 ml·min-1·kg-1, corresponding with 47.4 ±6.7, 52.5 ±6.7, and 30.1 ±5.2 %
of maximal oxygen uptake for DHC, DHP and DHR, respectively. This was accompanied
by significantly different heart rate recordings (DHC= 166.8 ± 7.7, DHP= 171.8 ± 6.6,
DHR= 132.0 ± 10.4; F(1.519, 10.63)= 200.3, p<0.0001; Figure 4.2A) between trials, however

Chapter 4: Mountain bike descending strategies
44
post-hoc testing revealed there was no significant difference between DHP and DHC
(p>0.05).

Cha
pter
4: M
ount
ain
bike
des
cend
ing
stra
tegi
es
45
Figu
re 4
.2 M
ean
± SD
for v
alue
s of A
. Hea
rt R
ate
(bpm
) and
B. V
O2 (
ml·m
in-1
·kg-1
) and
C. T
ime
(s).
Post
-hoc
ana
lysi
s $$$
$ (p
<0.0
001)
whe
n co
mpa
red
with
DH
P; **
** (p
<0.0
001)
whe
n co
mpa
red
with
DH
R, #
###
(p<0
.000
1) w
hen
com
pare
d w
ith D
HC.
Off
-roa
d de
scen
ts w
ith c
oast
ing
(DH
C) o
r ped
allin
g (D
HP)
and
road
des
cent
(DH
R).

Chapter 3: Aims & Structure
46
Maximum (p=0.501) and average (p=0.489) power output were not related to time for
DHP. Time for DHP was significantly correlated (r=0.957; p<0.001) with time for DHC.
Values for oxygen uptake were significantly related between DHP and DHC (r=0.971;
p<0.0001) and between DHC and DHR (r=0.708; p=0.049) but not between DHP and DHR
(p=0.070). VO2max was related to VO2 in DHR (r=-0.674; p=0.047), but not between any
other variables.
Analysis of physiological variables averaged every 15 s (Figure 4.3) indicated a
significant main effect for condition (F(2, 184)=186.4, p<0.0001) and time (F(9, 184)=25.81,
p<0.0001) with a significant interaction between condition*time (F(18, 184)=5.748,
p<0.0001) for VO2. Analysis of heart rate also revealed significant main effects for
condition (F(2, 183)=272.7, p<0.0001) and time (F(9, 183)=31.29, p<0.0001) and a significant
interaction between condition*time (F(18, 183)=10.09, p<0.0001). Post hoc testing of O2
and heart rate (Figure 4.3) identified differences (p<0.05) at the 45 s time point when
comparing DHR and DHP, and from the 60 s time point for both DHC and DHP compared
with DHR, indicating an increased ability to recover during DHR.

Chapter 4: Mountain bike descending strategies
47
Figure 4.3 Mean ± SD of A. heart rate (bpm) and B. VO2 (ml·min-1·kg-1) continuously sampled and reduced to 15 s averages.
Post-hoc analysis * (p<0.05), **** (p<0.0001) significant difference between DHC and
DHR; ### (p<0.001), #### (p<0.0001) significant difference between DHP and DHR.
Off-road descents with coasting (DHC) or pedalling (DHP) and road descent (DHR).

Chapter 4: Mountain bike descending strategies
48
Two-way ANOVA of total accelerations (Figure 4.4) revealed a significant main effect
of location of accelerometer (F(5, 42)=39.44, p<0.0001) and downhill condition (F(2,
84)=324.3, p<0.0001) as well as a significant interaction between condition*location (F(10,
84) =22.86, p<0.0001). Post-hoc testing identified accelerations to be significantly lower
(p<0.0001) during DHR at the wrist, ankle, handlebar, and seatpost when compared with
DHP and DHC, but not significantly different at the lumbar spine or head (p>0.05),
indicating increased vibration damping demanded during DHC and DHP.

Chapter 4: Mountain bike descending strategies
49
Figure 4.4 Comparison between DHC, DHP and DHR for total accelerations.
++++ (p<0.0001) main effect of location; @@@@ (p<0.0001) main effect of condition;
oooo (p<0.0001) interaction between condition*location. Post-hoc analysis ****
(p<0.0001) when compared with DHR
Off-road descents with coasting (DHC) or pedalling (DHP) and road descent (DHR).

Chapter 4: Mountain bike descending strategies
50
4.5 Discussion
The primary aim of this study was to investigate the performance and physiological
demand of either pedalling or coasting while navigating a XCO-MTB descent at the
simulated intensity of a XCO-MTB race. A secondary aim was to compare these demands
to an equivalent road descent. The main findings were: a) downhill performance was not
changed through the absence of propulsive work; b) oxygen uptake significantly
increased with the addition of propulsive work to off-road descending; c) mechanical and
soft tissue damping associated with road descents were less than off-road, resulting in
significantly decreased oxygen uptake and heart rate.
Uphill variables such as power output, heart rate and VO2 firstly indicated the demand of
the ascent, and also highlighted that riders were stressed similarly during each downhill
trial. The key finding is that coasting on the XCO-MTB descent (Figure 4.1) used in this
study did not result in a significantly reduced velocity (DHC= 7.3 ± 1.4, DHP= 7.5 ± 1.5
m∙s-1) or increased time (Figure 4.2), indicating that this strategy did not negatively
impact performance. While oxygen uptake and heart rate were not different at 15 second
time points (Figure4. 3) during off-road descents, overall VO2 was significantly increased
when pedalling versus coasting (Figure 4.2). Maximal power during DHP (526.4 ± 151.0
W) likely exacerbated oxygen uptake, however overall VO2 increases occurred despite
relatively low average power output (18.8 ±11.6 W) and minimal time spent pedalling
(19.9 ±9.8 s). Importantly, increased VO2 was not a result of non-propulsive work from

Chapter 4: Mountain bike descending strategies
51
vibration damping (Figure 4.4), which may be explained by the similar velocity between
trials. While better recovery during intermittent exercise may be important (Tomlin &
Wenger, 2001), this study did not investigate how these two strategies affected a
subsequent high-intensity ascent which warrants further investigation.
As indicated by the non-significant difference in time (Figure 4.2) when pedalling versus
coasting and the non-significant relationship between power output and time when
pedalling, these findings agree that downhill performance has less dependence on power
output (Hurst & Atkins, 2006) and supports reports suggesting that skill is most important
to descending performance (Chidley et al. 2014; Mastroianni et al. 2000). While skill
cannot currently be quantified, its importance is corroborated by the significant
relationship between times in DHP and DHC, indicating that the fastest riders had the
fastest times whether pedalling or not. It is important to point out that despite elimination
of mechanical propulsive work (i.e. DHC), participants in this study displayed a wide
range of descending performance (142.5 ±29.2 s). While the importance of ascending
prowess for XCO-MTB performance cannot be overlooked, it can be surmised that riders
who descend the slowest are disadvantaged before the next ascent regardless of any time
they are able to make up by ascending more quickly. Considering the results of this study
and the demands of XCO-MTB, athletes can benefit from improvement in specific skills
that would allow them to decrease descending time without the addition of pedalling.
More research is required to determine these necessary skills.

Chapter 4: Mountain bike descending strategies
52
It was hypothesized that non-propulsive work would be reduced when descending on the
road and accompany a decrease in physiological variables. As expected, vibrations were
significantly reduced at the wrist, handlebar, ankle and seatpost during DHR (Figure 4.4).
This reduced vibration exposure was associated with significantly lesser (Figure 4.2)
oxygen uptake and heart rate in DHR compared with DHP and DHC. After 45 s (Figure
4.3), VO2 appears to plateau in DHP and DHC while values continue to drop throughout
the duration of DHR. Riders who are have a higher level of physical fitness tended to
recover to greater extent as seen by the negative correlation between VO2max measured in
the laboratory and VO2 measured during DHR. We surmise that the reduced vibration
exposure eventuated to a decreased musculo-tendonous work requirement (Hurst et al.
2012) which would normally absorb the accelerations in order to protect the head and
lumbar spine (Macdermid et al. 2015; Macdermid et al. 2015; Macdermid et al. 2014;
Miller & Macdermid, 2015a). However, as muscle activity was not directly measured,
this explanation remains only speculative. Nevertheless, the data do indicate that reducing
vibrations nearer to those seen on the road could further reduce metabolic demand riding
off-road and therefore it is recommended that investigations continue to explore
equipment (Macdermid et al. 2015) designs which can decrease vibration exposure.
Overall, the data support our hypothesis that physiological demand is greater during off-
road descending than on-road, and this may help explain differences in what constitutes
optimum physiological rider profiles between XCO-MTB and road competitors.

Chapter 4: Mountain bike descending strategies
53
4.6 Conclusion
This is the first study to compare different strategies for approaching descents during
XCO-MTB and also to compare off-road and road descending. On the off-road descent
used in this study, pedalling was not advantageous and resulted in an exacerbated oxygen
uptake. Therefore, it is recommended that athletes focus on skill increases that will allow
them to complete descents faster without adding pedalling, which is an area that needs
more research. Moreover, physiological responses were significantly greater during off-
road descents when compared with the road and can be partly attributed to the terrain
demanding greater vibration damping by the body. Future research should continue to
investigate equipment that can minimize vibration exposure when riding off-road nearer
to values seen on the road to ultimately reduce oxygen uptake.

Chapter 4: Mountain bike descending strategies
54

Chapter 5: Validation of a brake power meter
55
5. Chapter 5
VALIDITY OF A DEVICE DESIGNED TO
MEASURE BRAKING POWER IN BICYCLE
DISC BRAKES
5.1 Abstract
Real-world cycling performance depends not only on exercise capacities, but also on
efficiently traversing the bicycle through the terrain. The aim of this study was to
determine if it was possible to quantify the braking done by a cyclist in the field. One
cyclist performed 408 braking trials (348 on a flat road; 60 on a flat dirt path) over five
days on a bicycle fitted with brake torque and angular velocity sensors to measure brake
power. Based on Newtonian physics, the sum of brake work, aerodynamic drag, and
rolling resistance was compared with the change in kinetic energy in each braking event.
Strong linear relationships between the total energy removed from the bicycle-rider
system through braking and the change in kinetic energy were observed on the tar-sealed
road (r2=0.989; p<0.0001) and the dirt path (r2=0.952; p<0.0001). The t-tests revealed no
difference between the total energy removed and the change in kinetic energy on the road
(p=0.715) or dirt (p=0.128). This study highlights that brake torque and angular velocity
sensors are valid for calculating brake power on the disc brakes of a bicycle in field

Chapter 5: Validation of a brake power meter
56
conditions. Such a device may be useful for investigating cyclists’ ability to traverse
through various terrains.

Chapter 5: Validation of a brake power meter
57
5.2 Introduction
Performance in Olympic format cross-country mountain bike racing (XCO-MTB) is
characterised by high-intensity pedalling on flat and ascending sections of trail
interspersed with lower-intensity efforts on highly-technical or descending sections
(Macdermid & Stannard, 2012). The use of on-the-bike power meters has permitted a
good understanding of the propulsive work performed during real cycling (Abbiss et al.
2013; Impellizzeri et al. 2002; Impellizzeri & Marcora, 2007; Macdermid et al. 2014;
Macdermid & Stannard, 2012; Miller et al. 2014; Stapelfeldt et al. 2004). By measuring
the torque and angular velocity concurrently at some point on the drivetrain (Abbiss et al.
2009; Bertucci et al. 2005; Gardner et al. 2004; Appendix I), the information collected
from these power meters have been utilised to fine-tune physical training programs for
peak athletic performance and currently offer the best method to analyse race and training
data (Atkinson et al. 2007; Jobson et al. 2009; Padilla et al. 2000). However, these
measurements are strictly propulsive and do little to explain any other interaction the rider
has with the terrain or how they utilise necessary skills to efficiently complete a track.
Rider skill has been indicated as an important component of XCO-MTB performance
(Mastroianni et al. 2000), especially during the high-speed and/or technical downhill
sections where there is often little propulsive work being done (Hurst & Atkins, 2006).
To date, no literature is available describing the quantification of skill, with reports being
mostly qualitative (Chidley et al. 2014).

Chapter 5: Validation of a brake power meter
58
A possible way to begin to quantify one aspect related to skill in XCO-MTB could be to
measure rider input to the brakes of the bicycle. While often important to maintain a safe
speed to negotiate turns or obstacles, any use of the brakes reduces forward velocity and
requires subsequent positive—typically propulsive—work to regain or surpass initial
velocity. Additional propulsive work increases metabolic energy cost (Chapter 4) and
could potentially reduce the capacity to perform later on in the course of XCO-MTB
competition. However, to this point no literature has been published detailing the
measurement of brake usage in cycling.
The most intuitive method for brake measurement would be to measure brake power,
which is easily converted to a quantity of energy. Indeed, brake power can be integrated
to calculate the work done each time the brakes are used, thus indicating the energy
removed from the bicycle-rider system through braking. By estimating aerodynamic drag
and rolling resistance, it is possible to account for the majority of resistive forces acting
on a cyclist while riding in field conditions (Bertucci et al. 2013). Therefore, the sum of
aerodynamic drag, rolling resistance and work done in the brakes is indicative of the
measurable energy removed from the bicycle-rider system during each braking event. The
law of conservation of energy states that energy can neither be created nor destroyed; it
can only be changed in form. As such, the total energy removed during each braking event
is equal to the change in kinetic energy of the bicycle-rider system. By comparing these
two energy loss equations, it may be possible to determine the validity of brake power
measurements.

Chapter 5: Validation of a brake power meter
59
Therefore, the aim of this study was to add sensors to measure torque and angular velocity
at the disc brakes of a bicycle to determine if it is possible to measure braking power in
field conditions on both road and dirt surfaces. It was hypothesised that the total energy
removed from the bicycle-rider system would be similar to the change in kinetic energy
of the bicycle-rider system on both road and off-road surfaces. The determination was
made that a strong linear relationship between the two calculated variables (r>0.90) would
indicate the validity of brake power measurement.

Chapter 5: Validation of a brake power meter
60
5.3 Methods
One experienced cyclists (age=30 years; height=1.65 meters; body mass=61.90 kg; 15
years competitive cycling experience) completed 408 brake trials across five different
days. Of these trials, four days and 348 braking events were completed on a flat, tar-sealed
road, and 60 braking events were completed on a flat dirt path on a separate day. The
participant cycled on a mountain bike (Figure 5.1; Trance 1, Giant Bicycles, New
Zealand) that was equipped with a device designed by a third party to measure brake
power at both the front and rear brakes of the bicycle (Figure 5.1B-C). Hollow aluminium
blocks (Figure 5.2A) were fitted to the mountain bike on the standard brake caliper
mounting posts. Within these blocks, stainless steel rods (Figure 5.2B) were fixed (Figure
5.2C) perpendicular to the braking surface between an S-Type load cell (Figure 5.2D;
PT4000, PT Global, New Zealand) and a separate solid aluminium block (Figure 5.2E)
on which the brake caliper (Figure 5.2F; SLX, Shimano, Japan) was attached. The load
cells were fixed to the aluminium blocks on the distal end, but allowed to slide proximally
where attached to the brake caliper. This configuration allowed the load cell to sense the
movement of the brake caliper when the brake lever was squeezed and the pads were in
contact with the brake rotor, which was indicative or torque. Brake pads interacted with
203 mm brake rotors (Figure 5.2H; Alligator, Taiwan) which were attached to standard
6-bolt hubs torqued to manufacturer’s specifications. A magnetometer (Figure 5.2G)
sensed the leading edge of evenly spaced holes in the rotors for the measurement of
velocity. Data was collected on a stand-alone battery-powered data logger (Figure 1A;
DI-710-UHS, DATAQ Instruments, Akron Ohio, USA) attached to the bicycle’s

Chapter 5: Validation of a brake power meter
61
handlebar. The brake power measurements devices and data logger equated to 4.79 kg,
which brought the total bicycle mass to 17.28 kg.

Chapter 5: Validation of a brake power meter
62
Figure 5.1 Non-drive side view of bike with A: data logger; B: front brake power meter; and C: rear brake power meter.
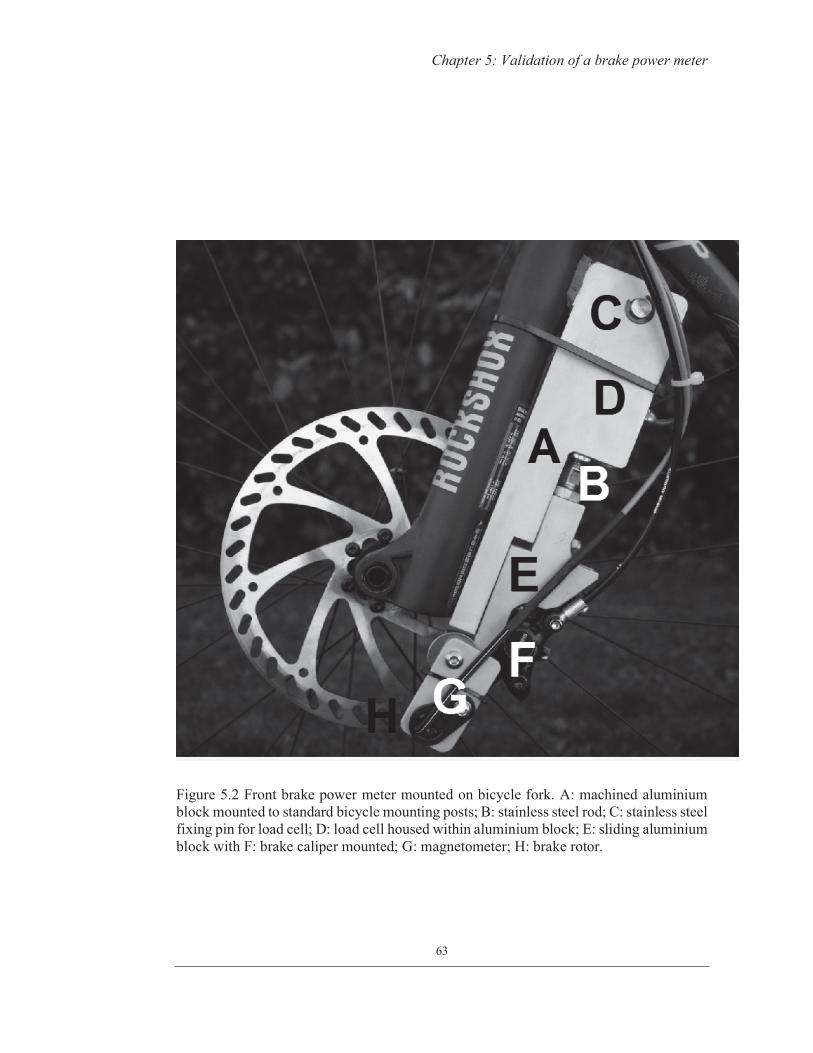
Chapter 5: Validation of a brake power meter
63
Figure 5.2 Front brake power meter mounted on bicycle fork. A: machined aluminium block mounted to standard bicycle mounting posts; B: stainless steel rod; C: stainless steel fixing pin for load cell; D: load cell housed within aluminium block; E: sliding aluminium block with F: brake caliper mounted; G: magnetometer; H: brake rotor.

Chapter 5: Validation of a brake power meter
64
Prior to all testing the participant was weighed while wearing cycling gear (1.55 kg),
which included cycling clothing, helmet and cycling shoes. The brake calipers were
manually centred and rotors torqued to manufacturer’s specification by a bicycle
mechanic. Tyre pressure was inflated to 0.34 psi per kg of the mass of the rider wearing
cycling gear based on standardisation recommendations from (Macdermid et al. 2015).
Bicycle suspension was mechanically locked out and air pressure was added to the
suspension until it did not visually move with the rider seated on the bicycle. The
participant was able to accelerate to any speed and decelerate to any speed which allowed
a wide range of measurements to be collected. All braking was completed while coasting
in a straight line, and there was no instruction on which brake to use or for how long.
The device was calibrated immediately following each trial. To calibrate torque, the
bicycle was suspended from the ceiling, which allowed the wheels to spin freely. A 20.0
kg weight was hung from the outer diameter of each tyre at right angles with respect to
the ground and axle. Each brake was applied for ten seconds with the weight attached.
Using two-point calibration with either the brake applied or not applied, a final 5 s mean
voltage signal was converted to a proportional torque given,
(Eq. 5.1)
where, is torque, F is the force due to mass of the 20.0 kg weight and strap times the
acceleration of gravity, and r is the distance between the axle centre and weight strap.

Chapter 5: Validation of a brake power meter
65
Velocity was electronically calibrated using two-point calibration such that 0 V was equal
to 0 km/h and 5 V was equal to 16.67 m/s to represent a broad range of cycling velocities
(0-60 km/h). Subsequent measures of angular velocity were derived from,
(Eq. 5.2)
where, is angular velocity, v is equal to either 0 or 16.67 m/s for the two points of
calibration, and r is the distance between the axle centre and ground with the rider on the
bicycle compressing tyres at the standard pressure.
Data were recorded at 300 Hz and stored in *.wdq format on a micro SD card. Stored
files were transferred to a PC and converted to *.xlsx format through WINDAQ
Waveform Browser (DATAQ Instruments, Akron Ohio, USA). Excel files were
transferred into LabChart version 8.1.5 (ADInstruments Ltd, Colorado Springs Colorado,
USA) for calibration. Through separate channels, brake power (Watts) was calculated at
each brake by multiplying values of τ and ω at any point when brake torque exceeded
zero. Values not exceeding 8 Nm were removed from analysis after visual inspection
indicated that these were due to noise from riding surface vibrations. Brake work (joules)
was calculated by integrating the power for the combined (front plus rear) brake power.
Initial and final velocities were recorded at the initial and final time points of each event.
The law of conservation of energy states that energy can neither be created nor destroyed;
energy is only changed in form. Therefore, the total energy removed from the bicycle-

Chapter 5: Validation of a brake power meter
66
rider system was compared with the change in kinetic energy of the bicycle-rider system
given,
∆EK (Eq. 5.3)
where, ∆EK is the change in kinetic energy, Err is energy lost due to rolling resistance,
and Ed is energy lost to aerodynamic drag.
For rolling resistance, the predicted energy loss was
(Eq. 5.4)
where, m is the mass of the rider plus bike, g is the gravitational constant, rr is the rolling
resistance coefficient , and d is the distance travelled. Velocity was integrated to calculate
d. For an estimate of the rolling resistance coefficient a value of 0.0218 was used based
on Bertucci et al. (2013).
Energy lost to aerodynamic drag was calculated as,
(Eq. 5.5)
where, cd is the drag coefficient, A is the frontal area, p is air density, v is the average
velocity during braking, and d is the distance travelled. Air density was estimated at
1.2250 kg/m3 based on the air temperature and relative humidity at the time of testing.

Chapter 5: Validation of a brake power meter
67
The effective frontal area cdA was estimated using the equation from Bertucci et al.
(2013). Air speed was assumed to be 0.
(Eq. 5.6)
where, h is the rider’s height (1.65 m).
The change in kinetic energy was calculated as
∆EK =
(Eq. 5.7)
where, m is the combined mass of rider and bike, v is the average velocity throughout the
trial, ω is angular velocity, and I is the moment of inertia. I was calculated from
(Eq. 5.8)
where, m is the combined mass of the tyre, tube and rim for both wheels and r is the
distance between the axle centre and ground when the tyre was compressed at
standardised pressure.
Statistical analysis was completed using GrapPad Prism version 5.00 (GraphPad
Software, San Diego California, USA) for all 348 trials on the tar-sealed road and
separately for the 60 trials on a dirt path. For braking events, descriptive data including
mean ± standard deviation (SD) and range (minimum and maximum) were calculated for
sample duration (s), initial and final velocities of samples (m/s), mean angular velocity

Chapter 5: Validation of a brake power meter
68
(radians/sec), mean front and rear brake torque (Newton meters), mean front and rear
brake power (Watts), brake work (joules), rolling resistance (joules), drag (joules), total
energy removed (joules) and the change in kinetic energy (joules) of the bicycle-rider
system. For each data set, the coefficient of determination (r2) was calculated between the
total energy removed and the change in kinetic energy of the bicycle-rider system. Linear
regression was performed using the total energy removed as the dependent variable, and
the change in kinetic energy as the independent variable. Paired student’s t-tests were
used to analyse the difference between these values. The mean difference between the
total energy removed and the change in kinetic energy was reported as a percentage
difference with respect to the change in kinetic energy. The p-value was set to p<0.05.

Chapter 5: Validation of a brake power meter
69
5.4 Results
Table 5.1 highlights the mean ± SD, minimum and maximum for measured braking power
and its derivatives. Calculated energy losses during braking on each surface are shown in
Table 5.2 as negative numbers. For trials completed on the tar-sealed road, the coefficient
of determination between the change in kinetic energy and the total energy removed from
the bicycle-rider system (Figure 5.3) was r2=0.989 (p<0.0001), with a slope of 1.06 and
y-intercept of 35.94. A paired t-test revealed no significant difference between the change
in kinetic energy and the total energy removed (p=0.715), with a mean difference of 0.23
± 1.24%. Similarly, there was a strong correlation coefficient between values measured
for dirt path trials (r2=0.952; slope=1.01, y-intercept=-22.67; p<0.0001). Paired t-test
results highlighted no difference between the change in kinetic energy and total energy
removed during braking trials on the dirt path (p=0.128), with a resulting mean difference
of 2.46 ± 3.18%.

Chapter 5: Validation of a brake power meter
70
Table 5.1. Mean ± SD and range for mean power and derivatives during braking.
Surface Variable Mean ± SD Minimum Maximum
Tar-sealed road
Sample duration (s) 0.9 ± 0.8 0.1 5.7
Initial velocity (m/s) 5.0 ± 1.3 2.2 10.2
Final velocity (m/s) 3.3 ± 1.0 0.9 5.8
Mean angular velocity (rad/s) 11.8 ± 2.8 4.8 21.2
Mean front torque (Nm) 20.8 ± 5.0 7.0 33.5
Mean rear torque (Nm) 26.7 ± 8.4 7.8 54.5
Front brake power (W) 244.2 ± 81.9 0.0 511.0
Rear brake power (W) 312.4 ± 119.9 0.0 884.0
Dirt path Sample duration (s) 2.1 ± 0.8 0.7 4.4
Initial velocity (m/s) 6.4 ±1.5 2.6 10.3
Final velocity (m/s) 3.1 ± 1.4 0.5 6.8
Mean angular velocity (rad/s) 13.7 ± 3.7 5.4 21.9
Mean front torque (Nm) 22.6 ± 7.2 8.1 40.2
Mean rear torque (Nm) 18.5 ± 7.6 0.0 32.5
Front brake power (W) 313.0 ± 141.1 103.8 812.1
Rear brake power (W) 252.8 ± 129.9 0.0 579.0
Note. Values were obtained from 348 braking events on a flat, tar-sealed road and 60 braking events on a
flat dirt path. Sample duration was equal to brake time. Initial velocity was the velocity at the onset of
braking, while final velocity was the velocity at the end of the braking period.

Chapter 5: Validation of a brake power meter
71
Table 5.2. Mean ± SD and range for calculated variables of energy loss during braking.
Surface Variable Mean ± SD Minimum Maximum
Tar-sealed road
Brake work (J) -490.8 ± 477.5 -76.0 -3671.0
Rolling resistance (J) -68.1 ± 74.2 -7.0 -536.7
Aerodynamic drag (J) -17.2 ± 31.8 -0.4 -262.0
Total energy removed (J) -576.2 ± 574.0 -90.2 -4307.7
Change in kinetic energy (J) -577.5 ± 538.6 -75.9 -3733.4
Dirt path Brake work (J) -1157.3 ± 631.1 -236.4 -3175.6
Rolling resistance (J) -171.8 ± 90.6 -35.0 -486.0
Aerodynamic drag (J) -50.9 ± 50.0 -1.5 -231.6
Total energy removed (J) -1380.1 ± 758.0 272.9 -3864.8
Change in kinetic energy (J) -1346.0 ± 734.0 -225.1 -3601.1
Note. Values were obtained from 348 braking events on a flat, tar-sealed road and 60 braking events on a
flat dirt path. The total energy removed from the bicycle rider system was calculated as the sum of brake
work, rolling resistance and aerodynamic drag. Paired student’s t-tests revealed no significant difference
between total energy removed and the change in kinetic energy on either surface (p=0.715 and p=0.128 for
tar-sealed road and dirt path, respectively.

Chapter 5: Validation of a brake power meter
72
Figure 5.3. Correlation between total energy removed from the bicycle-rider system and the change in kinetic energy for A: 348 braking trials completed on a flat, tar-sealed road; and B: 60 braking trials completed on a flat dirt path.

Chapter 3: Aims & Structure
73
5.5 Discussion and Implications
The aim of this study was to determine if it is possible to measure braking power in
bicycle disc brakes in field conditions. A device was developed to calculate brake power
by measuring torque and angular velocity as the brake pads interacted with the brake
rotors of each brake on a mountain bike. It was hypothesised that total energy removed
from the bicycle-rider system would be equal to the change in kinetic energy of the
bicycle-rider system given Equation 5.3. The main findings show that torque and angular
velocity sensors on disc brakes of a bicycle are valid means of calculating brake power
on road and dirt surfaces.
In this study, the majority of braking events were completed on a flat, tar-sealed road,
which was chosen due to the predictability of the riding surface. The flat terrain was
chosen because it allowed the calculation of energy losses without needing to account for
changes in potential energy due to undulating elevation. While the present study did not
account for energy losses outside of estimates of rolling resistance (Equation 5.4) and
aerodynamic drag (Equation 5.5) such as sound, work of fracture associated with damage
to the tyres or surface, or displacement of the surface in the off road test (among other
factors), we were able to explain a large portion of the energy lost while riding the bicycle
(Bertucci et al. 2013). Estimating these energy losses and adding them to measurements
of brake work demonstrated a strong linear relationship (Figure 5.3A) with the change in
kinetic energy of the bicycle-rider system during the 348 braking events completed on
the tar-sealed road. A similar significant relationship was determined for 60 braking

Chapter 5: Validation of a brake power meter
74
events on the dirt path (Figure 5.3B). These correlations highlighted the goodness of fit
for energy calculations on both surfaces, whereby braking events had linearly increasing
estimates of energy loss and change in kinetic energy.
The slopes of regression analyses were 1.01 and 1.06 for the dirt path and tar-sealed road,
respectively (Figure 5.3A-B), which supported strong linearity of energy loss equations.
However, the y-intercepts varied according to the surface ridden, which may be indicative
of error from energy loss estimations. The positive sign of the y-intercept on the tar-sealed
road (35.94) indicates that the total energy removed is being overestimated, while the
negative sign for dirt road trials (y-intercept=-22.67) indicates that the total energy
removed is underestimated. These errors may have been introduced through the
calculation of rolling resistance (Equation 5.4), which assumes that energy lost does not
change with respect to velocity nor account for the different surfaces. Similarly, it is
possible that error may have been introduced to the change in kinetic energy (Equation
5.7) given the calculation of the moment of inertia (Equation 5.8), which could not
account for the dynamic distribution of the mass of the spokes, rim, tube and tyre.
Despite the potential errors introduced by estimates of rolling resistance and the moment
of inertia, the strong linear relationships between energy calculations were corroborated
by t-test results that highlighted no difference between total energy and the change in
kinetic energy on the tar-sealed road. Therefore, these results indicate the validity of brake
work calculations from brake power during 348 on-road braking events. Similarly, t-test

Chapter 5: Validation of a brake power meter
75
results indicated no difference between energy loss calculations on the 60 dirt path
braking events. While there was a greater mean of differences between values on the dirt
path (2.46%) than on the tar-sealed road (0.23%), this may be attributable to energy lost
from additional tire deformation on the uneven surface and movement of the dirt
underneath the tyres, though this was not specifically investigated in the present study.
Nevertheless, brake power measurement appears robust in the field given these results.
For brake power measurement to be easily adopted in cycling, it is important to display
this type of information in a manner that is easily adaptable to other cycling analyses.
Figure 5.4 and 5.5 (A-F) demonstrate the readings of torque, angular velocity and brake
power in one braking event. In these figures, brake work was done in a relatively short
period of time, yet highlights the extent to which even a small braking event can reduce
velocity. With brake power readings presented graphically as in Figure 5.4 and 5.5 (E-F),
the viewer is shown braking data in a similar manner as readings of propulsive power in
cycling analysis software (e.g. TrainingPeaks) and practitioner publications (Allen &
Coggan, 2010), which could prove to be useful in future research.

Chapter 5: Validation of a brake power meter
76
Figure 5.4. Braking example using both front and rear brakes highlighting measurements of brake torque (A-B), angular velocity of the brake rotor (C-D) and resultant brake power (E-F). Initial velocity was 3.7 m/s slowing a combined mass of 79.2 kg (rider plus cycling gear and bicycle) to 2.6 m/s. Sample duration was 0.9 s with a total brake work of 231 J. Mean brake power was 166 and 106 W for the front and rear brakes, respectively.

Chapter 5: Validation of a brake power meter
77
Figure 5.5. Braking example using front brake only. Mean power was 105 and 6 W for the front and rear brakes, respectively. Sample duration was 2.9 s with a total brake work of 322.0 J. Initial velocity was 3.63 m/slowing a 79.2 kg mass to 1.7 m/s with subsequent ∆EK estimated at 316.8 J.

Chapter 5: Validation of a brake power meter
78
All braking events in this study were completed between 0.5 and 10.3 m/s (1.8 to 37.1
km/h), which supports brake power measurements within a moderate range of cycling
speeds. In the context of racing speeds, the fastest athletes at XCO-MTB races have
recorded average speeds of 21.4 km/h (Abbiss et al. 2013), though downhill riders travel
considerably faster (Hurst et al. 2013). The present study did not investigate braking
measurements above 37.1 km/h, and despite the strong validity of measurements
presented, warrants investigation into the validity of braking variable measurements at
higher speeds. A limitation to the present study is the high mass of the devices used to
calculate and record brake power, which may affect speed. In building the device, the
magnitude of values that would be seen during field riding was not well understood. As
such, the device was overbuilt, and increased the total mass of the bicycle to over 17 kg,
which is substantially heavier than many racing bicycles. While the current device is
therefore not ecologically valid for competitive use, this configuration will allow the
quantification of braking data during simulated racing, which remains unexplored.

Chapter 5: Validation of a brake power meter
79
5.6 Conclusion
This study shows that the addition of torque and angular velocity sensors on the brakes
of a bicycle are suitable to measure brake power in field conditions. The quantification of
brake work and brake power can help researchers understand how riders use brakes,
which may help describe efficiency interactions during XCO-MTB and other forms of
cycling. These measurements can lead to novel findings in cycling beyond variables of
propulsive mechanical work, and may help describe skill. Just as early descriptive studies
proved to be useful to gain good understanding of propulsive cycling performance, it is
suggested that a combination of propulsive and brake power meters be utilised in
simulated racing conditions for descriptive research of XCO-MTB and other forms of
cycling. Thereafter, it is important to compare the braking characteristics of high and low
performers, and determine if brake training interventions can positively affect
performance.

Chapter 5: Validation of a brake power meter
80

Chapter 6: Braking in XCO-MTB
81
6. Chapter 6
QUANTIFICATION OF BRAKE DATA
ACQUIRED WITH A BRAKE POWER METER
DURING SIMULATED CROSS-COUNTRY
MOUNTAIN BIKING
6.1 Abstract
There is currently a dearth of information describing cycling performance outside of
propulsive and physiological variables. The aim of the present study was to utilise a brake
power meter to quantify braking variables during a multi-lap cross-country mountain bike
time trial and to determine how brake usage affects performance. A significant negative
association was determined between lap time and brake power (800.8 ±216.4 W, r=-
0.446; p<0.05), while the total time spent braking (28.0 ±6.4 s) was positively associated
with lap time (r=0.477; p<0.05). Despite propulsive power significantly decreasing after
the first lap (p<0.01), lap time remained unchanged (p=0.25) which was attributed to both
decreased brake work (p<0.01) and brake time (p=0.02) in both the front and rear brakes
by the final lap. A multiple regression model incorporating brake work, brake time and
Chapter 6: Braking in XCO-MTB
82
relative propulsive power was able to explain more of the variance in lap time (r2=0.935)
than when utilising relative propulsive power alone (r2=0.826). The present study
highlights that riders braking contributes to mountain bike performance. As riders repeat
a cross-country mountain bike track, they are able to change braking, which in turn can
counterbalance fatigue. Further research is required to understand braking better.

Chapter 6: Braking in XCO-MTB
83
6.2 Introduction
Initial descriptive studies of Olympic format cross-country mountain bike racing (XCO-
MTB) relied on heart rate data (Impellizzeri et al. 2002; Impellizzeri & Marcora, 2007);
however, the data were not resolute enough to understand the highly variable propulsive
demands of the undulating terrain. Later, as technology advanced, researchers were able
to utilise on-the-bike propulsive power meters alongside GPS systems to gain a better
understanding of the undulating terrain and variable physiological demands of XCO-
MTB racing (Macdermid & Stannard, 2012). It soon became well understood that relative
rates of propulsive power were positively associated with XCO-MTB performance
(Gregory et al. 2007), which has led to the ubiquity of propulsive power meters for the
collection and monitoring of racing and training data. Henceforth, data have been used to
fine-tune training regimes to help athletes achieve better performances (Jobson et al.
2009).
Unfortunately, the data collected from these power meters are strictly propulsive, and
cannot explain all of the variation in performance given the technical demands of XCO-
MTB. Recent evidence has indicated that variables in addition to propulsive power output
can do a much better job at predicting XCO-MTB performance than propulsive variables
alone; for example, regression models incorporating an XCO-MTB-specific decision
making task and propulsive physiological performance ability have successfully been
used for mountain bike performance prediction (Novak et al. 2017). Along these lines, a

Chapter 6: Braking in XCO-MTB
84
recent XCO-MTB study suggested that braking is an area to investigate (Chapter 4)
which was apparent after investigating pacing strategies on XCO-MTB descents. Of
course, the latter is sensible; while braking in XCO-MTB is often necessary to maintain
a safe speed for the negotiation of obstacles or navigation of turns, any braking in excess
of that required to control the bicycle would require additional propulsive work to regain
speed. Strategies to simultaneously increase speed and also recovery have been
encouraged for XCO-MTB competitors due to the increased non-propulsive energy
demand (Macdermid et al. 2016), however excess braking could exacerbate glycogen
depletion and reduce recovery following high-intensity pedalling efforts (Chapter 4). It
is clear that XCO-MTB racers adopt some sort of inherent pacing strategy to cope with
the demands of the sport, which is evident in the small variation of lap time (Abbiss et al.
2013; Martin et al., 2012) despite maximal starting efforts (Macdermid & Morton, 2011;
Viana et al. 2013; Viana et al. 2016); however, the premise of this is not understood and
could be related to braking. Given the nature of XCO-MTB competition, some description
of braking is required to understand how it contributes to racing performance.
By using a device that can measure brake power (Chapter 5), it is possible to calculate
the same variables at the brakes that are useful and well-accepted for describing
propulsive work in cycling (Allen & Coggan, 2012). For example, the energy removed
from the bicycle-rider system through braking (i.e. brake work) is analogous to the total
energy output for propulsion (i.e. propulsive work), though each understandably has the
opposite effect on speed. For the calculation of propulsive power, a time variable is
required; one such example may be the time taken to complete a section of interest, in
Chapter 6: Braking in XCO-MTB
85
which case the propulsive work done is divided by the duration of this section. The
resulting average propulsive power is one metric that has become widely accepted in
cycling, and supports the investigation of brake power. By reporting relative rates of
propulsive power (W/kg), the effects of gravity are normalised (Gregory et al. 2007); as
such, it is possible that relative rates of brake work and brake power may be similarly
important. Overall, the lessons learned over the years of studying propulsive power data
from XCO-MTB may be highly applicable to the brakes and requires investigation.
Therefore, this study set out to quantify braking data using a brake power meter during a
multi-lap XCO-MTB simulated time trial, and to determine the relationship between
braking and XCO-MTB performance. Based on important and accepted propulsive
variables, braking variables such as brake work, brake time and resultant brake power
were calculated for each lap and each brake. It was hypothesised that performance,
defined by lap time, would be significantly associated with relative rates of propulsive
work and also the rate of work done through braking. This study also set out to understand
the change in performance by analysing braking and propulsive variables across laps. It
was hypothesised that riders would reduce propulsive power across laps following an
initial high intensity, but also reduce the amount of brake work done as they became more
accustomed to riding the lap at race pace.

Chapter 6: Braking in XCO-MTB
86
6.3 Methods
Participants and procedures
Ten nationally competitive mountain bikers (mean ± SD; age: 29.9 ±8.0; body mass: 72.9
±12.7 kg; mass of rider plus cycling gear and bike: 90.4 ±12.6 kg; VO2max: 69.4 ±7.1
ml/kg/min) volunteered as participants of this study, which was approved by the
University’s Human Ethics Committee. All participants used the same bike (Trance 1;
Giant Bicycles, New Zealand) with standardized tyre pressure (Macdermid et al. 2014)
and suspension adjusted to manufacturer’s guidelines. The bike was equipped with a
crank-based propulsive power meter (S2275; Quarq, Spearfish SD, USA) (Appendix I)
and also proprietary sensors configured to calculate brake power (Chapter 5). Propulsive
power (W) was continuously sampled based on manufacturer settings and logged onto a
portable recording device at 1 Hz (510; Garmin Ltd., Schaffhausen, Switzerland). Brake
torque and angular velocity of the brake rotor were sampled at 128 Hz on the recently
validated brake power meter and logged onto a stand-alone data logger (DATAQ
UHS710; DATAQ Instruments, Akron Ohio, USA). All equipment was manually zeroed
or calibrated immediately before each testing session according to previously used
guidelines (Chapter 5; Appendix I & II).
A purpose-built track (Figure 6.1; 1,240 m, 45 m elevation gain/loss) had not been
previously open to riders was utilised for field testing. All participants were first given
two laps on the track at a self-selected pace to serve as both a warm up and familiarisation

Chapter 6: Braking in XCO-MTB
87
of the track/equipment used. After a 5 minute rest period, participants completed three
successive laps of the track at race pace. To delineate the start and end of each lap for
data recording purposes, participants pushed the ‘LAP’ button on the Garmin 510 at the
Start/Finish area at the end of each lap.
Figure 6.1. Lap profile for XCO-MTB time trial. The track was 1,240 m long and had 45 m elevation gain per lap.
Propulsive power data were tranferred from the Garmin headunit onto a PC using
conventional software (Garmin Training Center, Garmin Ltd., Schaffhausen,
Switzerland). Measurements of brake torque and wheel velocity were tranferred from the
data logger onto a PC using proprietary software (WINDAQ; DATAQ Instruments,

Chapter 6: Braking in XCO-MTB
88
Akron Ohio, USA), then transferred to LabChart version 8.1.5 (ADInstruments Ltd,
Colorado Springs Colorado, USA) for calibration.
All braking data recorded on the data logger were synced with the Garmin device using
MatLab R2011b software (The MathWorks, Inc., Natick, MA, USA) and broken down
for analysis. Initial inspection of braking data revealed many low-torque readings while
riding, possibly from noise due to surface vibrations translated through the load cells;
accordingly, readings below 8 Nm were ignored for analysis. The threshold of 8 Nm was
chosen based on an analysis of non-braking periods during the XCO-MTB lap. During a
non-braking interval, the largest value of the noise—defined as any value that was present
for two or fewer samples—was 6.18 Nm. During a typical braking period, torques
averaged around 40 Nm. The 8 Nm threshold was selected as being large enough to
eliminate the noise while being small enough to preserve the actual braking periods.
The work (J) done through the use of the brakes was calculated by integrating the product
of brake torque and angular velocity for each wheel (front brake work for the front, rear
brake work for the rear) and for the two wheels summed together (brake work). The latter
was also taken relative to the total mass of the rider plus the gear and bike (relative brake
work; J/kg). Brake time was calculated as the total time (s) per lap that both brakes or
either brake (front brake time and rear brake time for front and rear brakes, respectively)
met or exceeded 8 N m. Brake power was a product of brake work divided by brake time
measured in each lap, and further separated into front and rear brakes. Maximum brake

Chapter 6: Braking in XCO-MTB
89
power was calculated as the highest power (W) recorded in each lap at any one time using
one or both brakes, and was also calculated for front and rear brakes, respectively.
Statistical analyses
All statistical analyses were completed using GraphPad Prism 7 (GraphPad Software, San
Diego California, USA). Mean ± standard deviation (SD) for all variables were calculated
for each lap of each particpant. The correlation coefficients was calculated between lap
time and recorded braking variables for all laps (i.e. ten particicpants who completed three
laps each). One-way reapeated measures analysis of variance (ANOVA) was completed
for lap time and propulsive power to compare between-lap (i.e. lap 1-3) differences. Brake
work, brake time and brake power were analysed separately using two-way repeated
measures ANOVA, with the aim of identifying the interaction of independent variables
of brake (i.e. front and rear, respectively) and lap (i.e. laps 1-3); henceforth, results
indicated the change of the dependent variables with respect to successive laps and also
the brake utilised. Where a main effect was observed, Bonferroni’s post-hoc testing was
used.
A linear regression model was created to determine whether a combination of brake work,
brake time and relative propulsive power could be utilised to explain the variance in lap
time. Brake work and brake time were integrated into the model based on the results of
two-way analysis. To determine the estimation error in the multiple regression model,
Chapter 6: Braking in XCO-MTB
90
mean square error (MSE) was calculated as the residual sum of squares divided by the
degrees of freedom; estimation error (Error) was calculated as the square root of MSE.
To determine significance, the alpha value was set at 0.05, which is common for use in
testing with human participants. By using p<0.05, practitioners can apply statistically
significant observations in the present study to determine how these benefit the small
performance gains desired in individual athletic performance. Actual p values have been
reported for ANOVA results.

Chapter 6: Braking in XCO-MTB
91
6.4 Results
Descriptive propulsive and braking variables for each lap (mean ± SD) are presented in
Table 6.1. The quantity of total brake work was 24.9% of the total quantity of propulsive
work per lap; accordingly, brake time equated to only 8.9% of lap time. Nevertheless,
brake time, front brake time and rear brake time, respectively, were significantly related
to lap time (Table 6.1). Similarly, braking variables of brake power, relative brake power,
front brake power and front brake max power were all significantly related to lap time
(Table 6.1).

Chapter 6: Braking in XCO-MTB
92
Table 6.1. Descriptive performance data (mean ± SD) per lap of a simulated XCO-MTB time trial.
Performance variable Mean SD r
Lap Time (s) 314.3 37.9
Propulsive Power (W) 275.8 48.1 -0.844
Propulsive Power (W/kg) 3.1 0.4 -0.909
Propulsive Work (J) 85187.5 8858.9 -0.244
Brake Work (J) 21174.9 1854.3 -0.331
Relative Brake Work (J/kg) 236.9 26.9 -0.016
Front Brake Work (J) 9931.2 1879.0 -0.333
Rear Brake Work (J) 11243.7 2510.8 0.005
Brake Time (s) 28.0 6.4 0.477
Front Brake Time (s) 22.4 5.4 0.433
Rear Brake Time (s) 25.0 5.6 0.536
Brake Power (W) 800.8 216.4 -0.446
Relative Brake Power (W/kg) 8.8 1.6 -0.566
Front Brake Power (W) 462.8 112.0 -0.680
Rear Brake Power (W) 476.7 171.1 -0.259
Maximum Brake Power (W) 2771.7 1174.9 -0.226
Maximum Front Brake Power (W) 1453.9 337.2 -0.575
Maximum Rear Brake Power (W) 1811.4 1212.3 -0.090
Average Brake Power (W) 68.5 11.2 -0.841
Note. Data were derived from three sequential XCO-MTB time trial laps completed per participant by 10 participants, for a total of 30 laps. Correlation coefficient (r) displayed is that measured between lap time and respective performance variable for all laps. Significant (p<0.05) correlation coefficients are highlighted in bold.
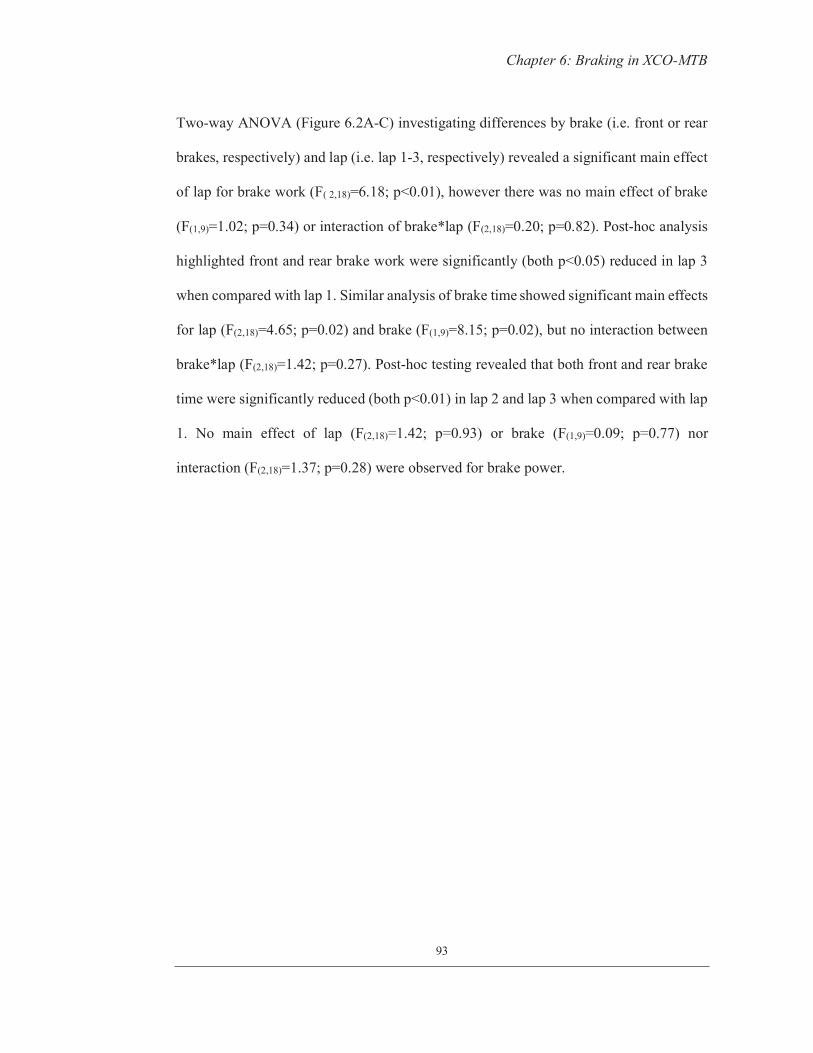
Chapter 6: Braking in XCO-MTB
93
Two-way ANOVA (Figure 6.2A-C) investigating differences by brake (i.e. front or rear
brakes, respectively) and lap (i.e. lap 1-3, respectively) revealed a significant main effect
of lap for brake work (F( 2,18)=6.18; p<0.01), however there was no main effect of brake
(F(1,9)=1.02; p=0.34) or interaction of brake*lap (F(2,18)=0.20; p=0.82). Post-hoc analysis
highlighted front and rear brake work were significantly (both p<0.05) reduced in lap 3
when compared with lap 1. Similar analysis of brake time showed significant main effects
for lap (F(2,18)=4.65; p=0.02) and brake (F(1,9)=8.15; p=0.02), but no interaction between
brake*lap (F(2,18)=1.42; p=0.27). Post-hoc testing revealed that both front and rear brake
time were significantly reduced (both p<0.01) in lap 2 and lap 3 when compared with lap
1. No main effect of lap (F(2,18)=1.42; p=0.93) or brake (F(1,9)=0.09; p=0.77) nor
interaction (F(2,18)=1.37; p=0.28) were observed for brake power.

Chapter 6: Braking in XCO-MTB
94
Figure 6.2. A. Brake Work (J), B. Brake Time (s), and C. Brake Power (W) for front
(grey) and rear (black) brakes in laps 1-3.
‘+’ denotes main effect of lap, ‘o’ denotes main effect of brake
For post-hoc testing ‘*’ denotes significant difference with lap 1.

Chapter 6: Braking in XCO-MTB
95
One-way ANOVA revealed no significant difference for lap time (Figure 6.3A; 308.3
±36.0, 317.1 ±38.8, and 317.5 ±42.1 s, respectively; p=0.25) across three laps despite a
significant reduction in relative propulsive power following lap 1 (Figure 6.3B; 3.2 ±0.4,
3.0 ± 0.4, 3.0 ±0.4 W/kg, respectively; p<0.01). Based on the overall results from
ANOVA, a multiple regression model (Table 6.2) using brake time, brake work and
relative propulsive power was generated. This model was able to significantly explain
variance in lap time (r2=0.935; p<0.01) to within 3.3%.
Table 6.2. Multiple regression model incorporating brake time, brake work and relative propulsive power to explain lap time.
Note. MSE = mean square error, calculated as the residual sum of squares divided by the degrees of freedom; Error = estimation error, calculated as the square root of MSE.
* p<0.05
Model r r2 MSE Error
Lap Time = 540.762 + (1.722 Brake Time) + (-0.002 Brake Work) + (-75.468 Relative
Propulsive Power)
0.968 0.935 104.8 10.2

Chapter 6: Braking in XCO-MTB
96
Figure 6.3. A. lap time (s) and B. average propulsive power (W) for laps 1-3.
‘*’ Denotes significant difference with lap 1.

Chapter 6: Braking in XCO-MTB
97
6.5 Discussion and Implications
This aim of this study was to quantify braking work rates using a brake power meter in
mountain biking, and specifically investigated a multi-lap simulated XCO-MTB time
trial. It was hypothesised that the fastest riders would not only produce the highest relative
propulsive power, but also brake the least. It was also hypothesised that there would be a
reduction in propulsive power throughout the time trial, however that this would not be
detrimental to performance. The novel findings of this study are that a) brake power and
brake time are significantly related to lap time; b) average propulsive power was reduced
after lap 1, however there was no significant difference in lap time, attributable to
concurrent reductions in brake work and brake time; and c) variations in performance
time on the XCO-MTB lap in this study can be explained better when accounting for
brake work, brake time and relative propulsive power when compared with relative
propulsive power alone.
Absolute and relative propulsive power recorded in each lap were strongly correlated to
lap time (Table 6.1), which reinforces the importance of pedalling ability for XCO-MTB
race performance (Costa & Fernando, 2008; Gregory et al. 2007; Lee et al. 2002;
Macdermid & Stannard, 2012; Miller & Macdermid, 2015b; Miller et al. 2014) . As a
mean, brake work equated to 24.9% of propulsive work, and the time spent braking was
8.9% of lap time; nevertheless, strong relationships were observed between braking
variables and lap time (Table 6.1). The respective associations of brake power (r=-0.446)

Chapter 6: Braking in XCO-MTB
98
and brake time (r=0.477) with lap time indicate that riders are able to navigate the track
more quickly when they are braking harder and for less time. Braking in this manner
results in a reduction of the time spent travelling at lower speeds when compared with
braking at a lower power, ultimately resulting in greater time spent travelling more
quickly. Not surprisingly, relative brake power (8.8 W/kg; r=-0.566) had a stronger
association with lap time than absolute brake power (800.8 W; r=-0.446); this is
understandable given that the kinetic energy of a rider travelling on a bicycle is scaled to
mass, and supports previous work done on propulsive power (Gregory et al. 2007). Brake
power (800.8 W) and maximum brake power (2771.7 W) observed in this study were
higher than propulsive recordings of the same values (246 and 1000 W, respectively)
(Stapelfeldt et al. 2004), which, in comparison, put the nature of braking into perspective.
Importantly, the authors noted the strong correlation between lap time and average brake
power (r=-0.841; calculated as total brake work during the lap divided by lap time),
however this was not analysed further due to it being highly influenced by lap time, and
thus, propulsive power; rather, brake power was calculated as a product of brake work
and brake time, independent of other variables.
With the exception of front brake work, all measures from the front brake were associated
with lap time, which is in contrast to measures recorded in the rear brake (Table 6.1). A
possible explanation for this could be the greater standard deviation in rear brake
measures, which point to wider differences across individuals. While mean values
highlighted in Table 6.1 indicate that measures recorded in the rear brake tended to be
greater than those in the front brake, two-way analysis did not show differences in

Chapter 6: Braking in XCO-MTB
99
measures of brake work, brake time and brake power between the front and rear brakes
(Figure 6.2A-C). These observations challenge traditional understanding of brake usage,
whereby a common notion is that the front brake is the most powerful and therefore
emphatically utilised; on the other hand, the even braking observed between brakes in the
present study may be indicative of the well-trained cohort (Lopes & McCormack, 2010),
though this needs confirming. It is important to note that the methods utilised to calculate
brake usage require the measurement of the angular velocity of the wheels, and as such
any skidding of the wheels produced values of 0 for the respective brake. Inspection of
the present data revealed that skidding was non-existent in the front brake; however,
skidding with the rear wheel was an average of 1.1 s per lap. As a mean, this was 3.9%
of the time spent braking, and therefore this is considered to not affect the present data
set. It is clear that any skidding will indeed increase the work done at the rear wheel since
a sliding tyre increases the amount of drag when compared with a tyre rolling with the
wheel; therefore, more research is required for sufficient quantification of skidding.
Upon further inspection of two-way analysis, it was revealed that riders changed the total
magnitude of brake usage across laps. To do this, firstly riders reduced both front and rear
brake work by lap 3 when compared with lap 1 (Figure 6.2A). Concomitantly, riders
reduced the total amount of brake time in both brakes following lap 1 (Figure 6.2B).
Importantly, these observations supported one-way analysis (Figure 6.3A-B) of lap
performance: as hypothesised, there was a reduction in propulsive power following lap 1,
however, lap time remained unchanged. Presently, this was due to concurrent reductions
in both brake work and brake time which effectively resulted in greater conservation of

Chapter 6: Braking in XCO-MTB
100
kinetic energy and further, an increased time spent travelling at higher speeds, which
negated the time otherwise spent travelling slower. Practically speaking, reductions in
both brake work and brake time were able to counterbalance a reduction in propulsive
power. The observation of a maintenance in lap time during XCO-MTB is not new, and
has traditionally been thought to be due to a superior ability to resist fatigue (Abbiss et
al. 2013) or from athletes adopting an effective pacing strategy (Martin et al. 2012).
However later, these interpretations were challenged by analysis of propulsive power data
which showed a reduction across laps (Viana et al. 2013). The present investigation
highlights that changes in braking could explain lap time maintenance displayed by XCO-
MTB competitors, which ultimately points to some type of learning effect as laps are
completed at race pace and warrants further investigation. It is important to note that all
participants were allowed two laps for practice and warm up on the track used in this
study, which may not have been enough to fully learn the track. Track familiarisation may
affect pacing (Martin et al. 2012), however at present the interactions between the degree
of familiarisation and braking is not fully understood.
The observations explained above allowed for better understanding of braking and
propulsion to allow for the exploration of a performance-explaining linear regression
model. As such, a combination of relative propulsive power, brake work, and brake time
(Table 2) was used to determine their combined association with lap time. The resultant
coefficient of determination (r2=0.935) indicates that the variation in braking and
propulsive variables is highly associated with lap time, and further, can explain variations
in performance to within 3.3% error. To put this in to perspective, this braking/propulsive

Chapter 6: Braking in XCO-MTB
101
model explains variation in lap time better than relative propulsive power alone
(r2=0.826) on the track used in this study. Looking further in to what this model represents
in the field, two riders who are equitable in terms of propulsive ability could complete
contrasting XCO-MTB performances simply by braking for different durations or doing
unalike amounts of brake work. Indeed, rates of propulsive work production do not
always equate to XCO-MTB performance, which is an understanding that has led to novel
approaches to gain better understanding of variations in race results. For example, while
an intermittent power field test is significantly correlated to XCO-MTB performance
(r2=0.786) (Miller et al. 2014), the combination of peak power output, handgrip strength,
and an XCO-MTB-specific decision-making task have proven more useful (r2=0.970)
(Novak et al. 2017). It should come as no surprise that sport-specific variables, in addition
to physical fitness descriptors, can help understanding of variations in performance,
however to date this has mostly been limited by the tools available. Therefore, the results
of this study are promising and highlight that the use of a brake power meter is an exciting
direction for future XCO-MTB investigations.
To provide a visual example of the interaction of braking and propulsive data, the readings
recorded from one elite XCO-MTB rider on the first and third lap are highlighted with
respect to the elevation profile in Figure 6.4A-B. The type of propulsive profile is
commonplace for XCO-MTB, and supports the intermittent nature of the sport whereby
there is a high rate of propulsive work on flat and ascending sections and reduced
propulsive work on descents. Additionally, the braking profile is made clear—it can be
seen that braking tended to coincide with lower levels of propulsive power, which tended

Chapter 6: Braking in XCO-MTB
102
to also be associated with descending sections. In this case, the braking is likely being
done to control the speed of the bicycle, which is one component comprising of qualitative
skill (Chidley et al. 2014). Some braking can also be noted in Figure 6.4A (lap 1) on flat
and/or ascending sections, though most of these instances were reduced in Figure 4B (lap
3). Overall brake work and brake time were reduced in lap 3 by 9.2% and 4.6%,
respectively; henceforth, these changes in braking counterbalanced a 6.7% reduction in
propulsive power, as highlighted by less than 1% difference in lap time.

Chapter 6: Braking in XCO-MTB
103
Figure 6.4. Example of braking and propulsive data for one participant on lap 1 (A) and lap 3 (B). The participant was a 22-year-old male weighing 68.5 kg with gear, had a VO2max of 73.1 ml/kg/min and was competitive in international races. For lap 1, braking variables were 20342 J, 28.3 s and 719 W for brake work, brake time and brake power, respectively. Average propulsive power was 328 W with resultant lap duration of 263.3 s. For lap 3, braking variables were 18461 J, 27.0 s and 683 W for brake work, brake time and brake power, respectively. Average propulsive power was 306 W with resultant lap duration of 263.8 s.

Chapter 6: Braking in XCO-MTB
104
A limitation to the present investigation is the relatively short duration of the simulated
time trial, which was due to battery power limits of the stand-alone data logger.
Nevertheless, the length of the time trial was enough to see a reduction in propulsive
power output across time which offered valuable insights on the interactions between
braking and propulsion across a multi-lap time trial. Notably, the present investigation
indicates the magnitude and importance of braking during XCO-MTB and display the
data visually in a manner similar to practitioner software for propulsive variables. Future
investigations should explore terrain-specific aspects of braking, with the ultimate goal
of determining the extent that individuals can alter braking habits for increased
performance.

Chapter 6: Braking in XCO-MTB
105
6.6 Conclusion
The time spent braking is only a small portion of total lap time, however brake work rates
are related to XCO-MTB performance. Riders reduce brake work and brake time as they
become accustomed to riding a track at race pace, which is able to counterbalance a
reduction in propulsive power. Variations in lap time can be explained by a combination
of data collected with both a propulsive power meter and a brake power meter, and the
data presented here indicate that future investigations exploring braking during mountain
biking will offer greater resolution of cycling performance analysis.

Chapter 6: Braking in XCO-MTB
106

Chapter 7: Differences in braking between training groups
107
7. Chapter 7
MAGNITUDE DIFFERENCES IN BRAKING
VARIABLES AND THEIR EFFECTS ON
PERFORMANCE WHEN COMPARING
EXPERIENCED AND INEXPERIENCED
MOUNTAIN BIKERS NAVIGATING AN
ISOLATED OFF-ROAD TURN
7.1 Abstract
Using a brake power meter, experienced and inexperienced mountain bikers were tested
on an isolated, controlled off-road cycling descent with a turn to determine how riding
experience affects the pattern of braking behaviour. Overall braking measurements such
as absolute and relative brake work and brake power, as well as brake time, were
significantly related to performance time on the track used in this study. Inexperienced
mountain bikers displayed greater absolute and relative brake work and brake time, but
had lower absolute and relative brake power when compared with experienced mountain
bikers, which resulted in a significant performance decrement for inexperienced riders.
Experienced mountain bikers concentrated braking efforts to later in the track, which
meant that they spent less time at lower speeds. Inexperienced riders displayed a greater

Chapter 7: Differences in braking between training groups
108
reliance on the rear brake, which likely contributed to their overall increased braking
variables. The results of this study highlight that differences in braking magnitude and
behaviour are attributable to reduced performance on an isolated off-road track with a
corner. Inexperienced mountain bike riders may be able to improve their performance by
learning braking patterns similar to those of experienced mountain bikers.

Chapter 7: Differences in braking between training groups
109
7.2 Introduction
Olympic-format cross-country mountain bike racing features sections of high-intensity,
low-speed ascents separated by lower-intensity, higher-speed or highly technical descents
(Macdermid & Stannard, 2012). Ascending performance is appropriately attributed to
aerobic and anaerobic energy production (Inoue et al. 2012; Impellizzeri & Marcora,
2007; Miller et al. 2014) and resultant mechanical propulsive work rates done through
pedalling (Gregory et al. 2007; Prins et al. 2007). In contrast, descending sections are
not dependent on propulsive power output (Hurst & Atkins, 2006) and have been shown
to be linked with rider skill (Chidley et al. 2015). Given the multi-lap format of racing,
XCO-MTB courses feature an equal amount of ascending and descending; however, due
to the effects of gravity, more time is spent ascending within a race (Martin et al. 2012).
Early pacing strategy descriptive studies of XCO-MTB competitions suggested that
athletes focus on training aspects that will allow them to decrease the time spent on these
ascending sections (Abbiss et al. 2013), though this overlooks the reduced ability to
recover during descending sections due to vibration damping (Macdermid et al. 2014)
and upper body work (Hurst et al. 2012). Henceforth, further investigations indicated that
training should also address aspects that will allow competitors to decrease the time spent
descending (Macdermid et al. 2016), but that these should not include an increase in
pedalling which would exacerbate energy demand. Increasing speed on descents without
adding pedalling can increase the rate of recovery before subsequent ascents, which could
benefit overall performance (Chapter 4).

Chapter 7: Differences in braking between training groups
110
Until recently, methods to assess descending ability have remained qualitative (Chidley
et al. 2014). However, a recently validated brake power meter may offer valuable non-
propulsive cycling data (Chapter 5). One exploratory manuscript investigating XCO-
MTB braking currently exists (Chapter 6); the significant negative association observed
between brake power and lap time highlighted that the fastest riders were braking harder
than slower riders, and further, spent less time using the brakes. Moreover, this study
highlighted that competitors were able to reduce the brake work done and the time spent
braking, which counterbalanced fatigue. In short, riders were able to change their braking
habits to effectively navigate the track more efficiently. While this early study was
promising in highlighting new technology, its exploratory nature lacked terrain-specific
analysis and was a specific area the authors encouraged for future research. Especially
useful would be the isolation of an area that requires braking, and to explore the
differences demonstrated between faster and slower riders.
Based on visual inspection of the findings in the original study, one terrain-specific area
to explore braking is on descents approaching turns. Specific braking strategies
approaching turns are a well-accepted means of improving performance in motor sport
racing (Casanova, 2000); however, the measured indices in motorsport are those which
quantify deceleration patterns and brake pressure (Corno et al. 2008; Toyofuku et al.
1994) rather than brake power or brake work. Nevertheless, to maintain control of the
vehicle while aiming for a minimum time to complete the section, braking should be
completed before the turn starts, which is a strategy that aids in maintaining traction
throughout the turn (Velenis et al. 2007). The same techniques have been taught for

Chapter 7: Differences in braking between training groups
111
general mountain biking when the goal is to ride fast (Lopes & McCormack, 2005), with
coaches subsequently instructing riders to “brake late and hard.” These are two things
implemented as much for control as they are for achieving overall minimum time, which
is especially true given the often unstable surfaces ridden in XCO-MTB. The well-trained
cohort in the original study also were able to utilise the front and rear brakes equally,
which is one aspect of braking taught for maintaining control (Lopes & McCormack,
2005). Unfortunately, the best braking skills during turning manoeuvres are not inherent,
and thus may be indicative of the degree of experience between riders.
Determining braking differences in groups of varying experience is important, as this may
help indicate the degree of trainability for braking strategies. This is not indifferent to
early explorative studies of physical fitness which indicated relative differences in
propulsive power output (Lee et al. 2002). Indeed, it was crucial to first understand
differences between the greatest and the least of cyclists, which in turn helped to
understand traits that can be adopted to perform better; the same is now true for braking.
Therefore, the aim of this study was to compare differences in braking variables between
experienced and inexperienced mountain bikers on a controlled off-road track with a turn
using a bicycle equipped with a brake power meter. It was hypothesized that more
experienced riders would be able to complete the track faster than inexperienced riders,
attributable to decreased time spent braking and increased braking power. The increased
time spent braking by inexperienced riders was expected to extended the braking distance
across sections of the track.

Chapter 7: Differences in braking between training groups
112
7.3 Methods
Participants
17 healthy cyclists (n=7 experienced, 85.83 ±12.67 kg; n=10 inexperienced, 95.99 ±10.77
kg) were initially weighed with cycling gear (clothing, helmet and shoes) and signed an
informed consent that also detailed their mountain biking competitive experience.
Participants were considered experienced mountain bikers if they rode off-road regularly
(>3 times per week) and inexperienced if they did not cycle off-road regularly (<1 times
per week).
Field test trials
All participants used the same bicycle (Trance 1, Giant Bicycles, New Zealand) with the
chain removed, suspension inflated to maximum and mechanically locked-out, and tire
pressure inflated to 0.34 psi/kg (Macdermid et al. 2014) of the total mass of the rider
wearing cycling gear. The bike was outfitted with a proprietary brake power meter
calibrated before testing according to previous studies (Chapter 5).
Participants completed three sequential trials on a closed test track (Figure 7.3; 77.60 m
in length, 8.10 m of elevation loss), with the goal of completing the track as quickly as
possible during each trial. The track was relatively short and incorporated a descent on
forest road leading in to a 180º left-hand turn on grass, which was taped to 1.5 meters
wide. The terrain was divided into four sections (A= 14.50 m; B= 35.80 m; C= 13.65 m;

Chapter 7: Differences in braking between training groups
113
D= 13.65 m) which allowed for the analysis of terrain-specific braking variables without
depending on GPS data (Wing et al. 2005). Participants coasted from a standing start
through sections A and B, which were downhill (-16% gradient) and delimited by a line
across the track in fluorescent paint. To ensure that participants would begin braking at a
similar speed, they were instructed to avoid braking within section A. Sections C and D
made up a 180º left turn on flat ground and were split in half at the apex.
Data collection
Brake torque and angular velocity of the brake rotor were sampled at 128 Hz on a recently
validated brake power meter and logged onto a stand-alone data logger (DI-710-UHS,
DATAQ Instruments, Akron Ohio, USA). All equipment was manually zeroed or
calibrated immediately before each testing session according to previously used
guidelines (Chapter 5). Measurements of brake torque and wheel velocity were
tranferred from the data logger onto a PC using proprietary software (WINDAQ
Waveform Browser, DATAQ Instruments, Akron Ohio, USA), then transferred to
LabChart 8.1.5 (ADInstruments Ltd, Colorado Springs Colorado, USA) for calibration.
Raw values were collated using MatLab R2011b (The MathWorks, Inc., Natick, MA,
USA) software and broken down for analysis. Similar to previous investigations, torques
below 8 Nm were set to zero to reduce the effects of noise in the signal. Brake work (J)
was calculated by integrating the product of brake torque and angular velocity for the two
wheels summed together and for each wheel (front brake work for the front, rear brake
work for the rear). The latter was also taken relative to the total mass of the rider plus

Chapter 7: Differences in braking between training groups
114
cycling gear and the bicycle (relative brake work; J/kg). Brake time was calculated as the
total time (s) per lap that either brake (front and rear brake time for front and rear brakes,
respectively) or both brakes met or exceeded 8 Nm. Average brake power (W) was a
product of brake work divided by brake time, and also calculated relative to the mass
(W/kg) of the rider plus bicycle.
Statistical analyses
Analyses were completed using GraphPad Prism version 7.00 (GraphPad Software, San
Diego California, USA). Average values of all variables recorded during the second and
third trial were taken for analysis. The correlation coefficient was determined for the
relationship with all braking variables and performance time. To determine gross
differences between groups (Experienced or Inexperienced based on results from pre-trial
questionnaire), unpaired student’s t-tests were used to analyse the mass of rider plus gear,
total time to complete the track, and variables of brake time, absolute and relative brake
work and absolute and relative brake power. Due to differences in gradient—and thus
speed and braking—of the terrain sections separated within the track, unpaired t-tests
were also utilised to determine differences between groups in each section. To identify
differences in front and rear brake usage between groups, two-way analysis of variance
(ANOVA) was used to determine the interaction of group (e.g. Experienced or
Inexperienced) *brake (e.g. front or rear) for overall values of relative brake work, brake
time and relative brake power. For all analyses the significance level was set to p<0.05;
actual p-values have been reported for ANOVA analysis.

Chapter 7: Differences in braking between training groups
115
7.4 Results
Overall investigations into braking variables identified that performance time was
significantly related to brake work (3558.23 ±760.90 J; r=0.582), relative brake work
(38.46 ±6.03 J/kg; r=0.674), brake time (5.10 ±1.51 s; r=0.765), brake power (736.16
±167.81 W; r=-0.669), and relative brake power (8.03 ±1.92 W/kg; r=-0.721) (all p<0.01).
Importantly, between-group analysis identified there was no statistical difference
(t(15)=1.78, p=0.0951) in the mass of the rider plus cycling gear and bicycle. This resulted
in no significant difference in the potential energy at the start of the trial (6820.48 and
7627.46 J; t(15)=1.78, p=0.0951) or velocity (5.76 ±0.11 versus 5.91 ±0.22 m/s; t(15)=1.59,
p=0.1327) at the end of Section A for experienced and inexperienced groups,
respectively, when coasting down the hill. Therefore, differences in braking variables
between groups can be broadly attributed to the training status of respective groups rather
than extraneous factors, and Section A was not included in section analysis. Between-
group values and differences are highlighted in Table 7.1. Performance time analysis
across the whole track revealed that experienced riders were able to complete the track
significantly faster than inexperienced riders (13.88 ±0.54 versus 15.62 ±0.77; p=0.0001).
Overall differences in braking variables between experienced and inexperienced groups
included variables of brake work, relative brake work, brake time, brake power and
relative brake power. Terrain-specific analyses for sections B-D (Table 7.1) highlighted
significant differences in braking variables and performance time between groups in

Chapter 7: Differences in braking between training groups
116
Section B and Section C. Despite no difference in braking measurements, between-group
differences in Section D were found for performance time. The velocity upon entering
each section was different between groups in Sections C and D (Table 7.2). Similarly,
there were differences for maximum velocity between groups in Sections B-D (Table
7.2).
Two-way analyses of front and rear brake utilization between groups (Figure 7.2A-C)
identified a significant main effect of brake for brake time (F(1,30)=8.54, p=0.0066) and
relative brake work (F(1,30)=5.93, p=0.0211). Significant interactions of group*brake were
identified for relative brake work (F(1,30)=12.04, p=0.0016) and brake time (F(1,30)=12.80,
p=0.0012). Post-hoc analysis revealed that the inexperienced group utilised significantly
greater relative brake work (30.95 versus 9.64 J/kg, respectively; p=0.0004) and brake
time (5.49 versus 1.69 s, respectively; p=0.0001) in the rear versus front brake. Similarly,
rear relative brake work and rear brake time were significantly greater in the
inexperienced group when compared with the experienced (13.19 J/kg, p=0.0273; 5.59 s,
p=0.0226, respectively) group. Relative front brake power was greater in the experienced
(6.64 W/kg) versus inexperienced (3.30 W/kg) groups, however there were no significant
main effects or interactions for this variable.

Cha
pter
7: D
iffer
ence
s in
brak
ing
betw
een
trai
ning
gro
ups
11
7
Tabl
e 7.
1. M
ean
± SD
of p
erfo
rman
ce a
nd b
raki
ng v
aria
bles
bet
wee
n Ex
perie
nced
and
Inex
perie
nced
mou
ntai
n bi
kers
.
Vari
able
G
roup
Se
ctio
n B
Sect
ion
C
Sect
ion
D
OVE
RALL
Perf
orm
ance
Tim
e
(s)
Expe
rienc
ed
4.41
± 0
.16*
2.
12 ±
0.2
0*
3.23
± 0
.32*
13
.88
±0.5
4*
Inex
perie
nced
5.
14 ±
0.3
4 2.
62 ±
0.3
0 3.
68 ±
0.3
4 15
.62
±0.7
7
Bra
ke W
ork
(J
) Ex
perie
nced
13
74.1
3 ±
343.
70*
1415
.03
± 40
9.31
* 97
.81
± 71
.08
2891
.47
±206
.59*
Inex
perie
nced
27
90.4
9 ±
480.
82
1000
.26
± 35
7.50
10
7.01
± 7
1.00
39
05.0
1 ±5
78.7
2
Rel
ativ
e B
rake
Wor
k
(J/k
g)
Expe
rienc
ed
16.4
1 ±
5.25
* 16
.71
± 4.
92*
1.16
± 0
.89
34.3
3 ±5
.57*
Inex
perie
nced
29
.12
± 4.
75
10.2
9 ±
2.95
1.
11 ±
0.7
6 40
.60
±3.0
2
Bra
ke T
ime
(s
) Ex
perie
nced
1.
57 ±
0.7
9*
1.68
± 0
.46
0.23
± 0
.16
3.58
±1.
06*
Inex
perie
nced
3.
67 ±
0.6
8 1.
89 ±
0.3
3 0.
29 ±
0.1
9 5.
93 ±
0.95
Bra
ke P
ower
(W)
Expe
rienc
ed
1009
.73
± 33
4.18
85
8.84
± 1
80.4
7*
290.
25 ±
121
.55
864.
49 ±
195.
77*
Inex
perie
nced
77
2.47
± 1
15.4
4 52
7.67
± 1
39.2
6 26
5.72
± 1
08.5
7 67
0.83
±11
6.92
Rel
ativ
e B
rake
Pow
er
(W/k
g)
Expe
rienc
ed
11.8
2 ±
4.01
* 9.
98 ±
1.5
4*
3.33
± 1
.29
10.0
5 ±1
.77*
Inex
perie
nced
8.
07 ±
1.0
3 5.
47 ±
1.1
9 2.
72 ±
0.9
4 7.
00 ±
1.04
Not
e. ‘*
’ sig
nifie
s sig
nific
ant d
iffer
ence
with
Inex
perie
nced
gro
up (p
<0.0
5)

Cha
pter
7: D
iffer
ence
s in
brak
ing
betw
een
trai
ning
gro
ups
11
8
Tabl
e 7.
2. M
ean
±SD
star
ting
(Sec
tions
B-D
) and
max
imum
vel
ocity
(Sec
tions
A-D
) for
Exp
erie
nced
and
Inex
perie
nced
mou
ntai
n bi
kers
.
Vari
able
G
roup
Se
ctio
n A
Sect
ion
B Se
ctio
n C
Se
ctio
n D
Star
ting
Vel
ocity
(m/s
)
Expe
rienc
ed
n/a
5.76
±0.
01
7.62
±0.
44*
5.28
±0.
35*
Inex
perie
nced
n/
a 5.
91 ±
0.05
6.
14 ±
0.34
4.
26 ±
0.16
Max
imum
Vel
ocity
(m/s
)
Expe
rienc
ed
6.22
±0.
03
9.79
±0.
30*
7.95
±0.2
8*
5.71
±0.
54*
Inex
perie
nced
6.
19 ±
0.01
8.
12 ±
0.27
6.
52 ±
0.41
4.
52 ±
0.21
Not
e. ‘*
’ sig
nifie
s sig
nific
ant d
iffer
ence
with
Inex
perie
nced
gro
up (p
<0.0
5)

Chapter 7: Differences in braking between training groups
119
Figure 7.1. Schematic representation of the off-road track and turn highlighting profiles for terrain sections (A-D= distance, gradient; A= 14.50 m, -16%; B= 35.80 m, -16%; C= 13.65 m, 0%; D= 13.65 m, 0%), which were measured with a trundle wheel. Black dots represent boundary for each section.

Chapter 7: Differences in braking between training groups
120
Figure 7.2. Two-way analyses for relative brake work (J/kg; A), brake time (s; B) and relative brake power (W/kg; C) for Experienced and Inexperienced groups.
‘#’ signifies main effect of brake (p<0.05), ‘##’ (p<0.01); ‘++’ interaction between group*brake (p<0.01).
Post-hoc differences: ‘***’ significant difference with front brake (p<0.001); ‘x’ significant difference with inexperienced group (p<0.05).

Chapter 7: Differences in braking between training groups
121
Figure 7.3. Example trace of relative brake power of one experienced (black) and one inexperienced (grey) riders throughout respective (A-D) sections of the track. The respective mass of each rider (plus cycling gear) was not overly dissimilar (63.6 and 64.8 kg, respectively). Relative brake work, brake time, and relative brake power were 33.36 J/kg, 2.46 s, and 13.57 W/kg for the experienced and 37.16 J/kg, 4.53 s, and 8.21 W/kg for the inexperienced rider, respectively. Individual braking strategies elicited performance time of 14.08 and 15.87 s for the experienced and inexperienced rider, respectively.

Chapter 7: Differences in braking between training groups
122
7.5 Discussion
The aim of this study was to quantify the magnitude of differences in braking variables
for experienced and inexperienced mountain bikers on a controlled off-road turn and to
determine where within a track braking differences may occur. It was hypothesized that
inexperienced riders would do more braking than experienced riders, which would result
in increased time to negotiate the corner. The increased braking was expected to extend
the distance of the braking, which would become evident in sectional analysis. The main
findings of this study are: a) experienced riders are able to complete an off-road turn in
less time and with a greater maximum velocity than inexperienced riders, which is
attributed with decreased brake work and brake time, and increased brake power; b)
braking variables were significantly different between groups in early and mid-sections
of the turn (sections B and C), which resulted in an increased performance time and lower
maximum velocity for the inexperienced group in all sections (sections B, C and D); and
c) inexperienced riders are more reliant on the rear brake than experienced riders, which
contributed to increased overall braking.
Not surprisingly, the data indicate that braking variables are strongly related to
performance time on a short descending track ending with a corner. Similar to results
previously reported (Chapter 6), absolute and relative brake power and brake time were
significantly related to performance time on this track. The nature of the track used in this
study also highlighted that absolute and relative brake work were related to performance

Chapter 7: Differences in braking between training groups
123
time, which may be attributed to the brevity of the track and the strictly downhill or flat
features (i.e. no ascending or dependence on propulsive power as previously investigated)
and was not shown previously. The directions of the correlations are important to note; a
decrease in brake work and brake time—but increase of brake power—were significantly
related to performance time. The correlations were supported by braking variables
analysed by group (Table 7.1; OVERALL), which helped to explain differences in
performance; indeed, inexperienced riders displayed increased brake work and brake
time, but decreased brake power across the track used in this study. The overall use of the
brakes by experienced riders in this study support practitioner publications that encourage
braking hard and spending as little time braking as possible (Lopes and McCormack,
2005).
The initial braking report highlighted decreased brake time and brake work could
counterbalance performance decrement caused by physical fatigue (Chapter 6).
However, that study lacked the resolution needed to understand braking and performance
variables independent of propulsive power, which are addressed in the present study. By
isolating and controlling a small track and partitioning it into sections, braking and
performance variables analysed by group offered a greater insight into where and how
riders of different abilities use their brakes. Table 7.1 highlights braking differences in
Sections B-D, indicating that experienced riders waited until further along the track to
brake. To achieve this performance, experienced riders did less brake work in Section
B—but greater brake work in Section C—when compared with inexperienced riders,
which supports a late-braking strategy (Lopes & McCormack, 2005). This strategy

Chapter 7: Differences in braking between training groups
124
resulted in higher maximum velocity for experienced riders in Sections B-D (Table 7.2).
The late braking strategy continued to benefit the experienced group throughout Sections
C-D, which is evident in the difference in performance time between groups (Table 7.1)
and the higher velocity upon entering each section for the experienced group (Table 7.2).
Importantly, the performance time difference noted in Section D is independent of
braking; the experienced group was able to complete Section D faster than the
inexperienced group due to the braking strategy in preceding sections and the increased
velocity at the start of this section. The effect of braking on performance can be explained
by inexperienced riders spending more time at lower speeds due to excessive braking and
is mainly linked with reduced relative brake power. Of course, a braking strategy of
braking late and hard is commonplace in motorsports (Corno et al. 2008) and not new in
MTB (Lopes and McCormack, 2005); however, this is the first time these measurements
have been shown in the literature. It’s worth noting that while the best braking strategies
in motorsports highlight that no braking should be done once turning starts, experienced
riders in this study still did a considerable amount of braking in the turn (Section C); this
may be attributable to the relatively long and gentle arc of the turn but is worth further
investigation.
Figure 7.3 highlights the magnitude and location differences of braking between groups,
with more temporally concentrated braking in experienced riders. For the sake of this sole
visual comparison, riders of similar mass were selected, which allows easy comparison
of relative brake power readings. It is this type of visual inspection that coaches will often
first utilise when trying to understand athlete’s propulsive power output (Allen & Coggan,
Chapter 7: Differences in braking between training groups
125
2012), whereby the location and magnitude of pedalling becomes apparent; henceforth,
recommendations to improve performance can be drawn. Therefore, given the findings
of this study and the data presented in Figure 7.3, the coach may implement an
intervention to modify the inexperienced rider’s braking to further down the track, which
will have a positive effect on performance time. Future research should investigate brake
strategy implementation methods as the present investigation highlights the importance
of braking strategy.
Finally, we investigated differences between experienced and inexperienced riders by the
brake used as a mean throughout the track (Figure 7.2). This was of interest because of
the safety implications of relying on one brake versus the other. Practitioner publications
suggest to avoid locking the front wheel and to brake with both brakes evenly in an effort
to maintain control (Lopes and McCormack, 2005), which seems intuitive. Similarly, in
The Art of Mountain Biking (2012), the author describes situations in which an overly
used rear brake can cause the wheel to lose traction. Two-way analyses (Figure 7.2)
indicated that experienced riders did not use the front and rear brakes differently, which
may have contributed to a sensation of greater control. Conversely, inexperienced riders
were more reliant on the rear brake, which may have negatively affected this group’s
sense of control of the bicycle. The non-significant difference in front brake values
between groups indicates that over-braking in the rear by inexperienced riders contributed
to overall increased braking and affected this group’s ability to navigate the track as
quickly as experienced riders. Considering all observations from this study, we can

Chapter 7: Differences in braking between training groups
126
surmise that reduced use of the rear brake could reduce overall brake work and brake
time, which would benefit performance.
This study is the first to directly indicate the differences in braking of experienced and
inexperienced mountain bike riders navigating a controlled off-road track. The results
presented here enhance previous investigations by focusing on a controlled, isolated track
with instances of concentrated braking efforts. While controlling the line that riders could
take in this investigation, we removed some of the practicality of XCO-MTB, per se;
however, results clearly indicate differences in performance attributable to differences in
braking. Current technology renders some manoeuvres of the bike unquantifiable, though
braking can, in the future, be one area on which there could be more focus. Future research
should investigate the trainability of braking strategy specific to XCO-MTB, particularly
on off-road tracks.

Chapter 7: Differences in braking between training groups
127
7.6 Conclusion
Inexperienced riders performed more poorly than Experienced riders, which was
attributable to differences in braking. Lower-performing riders could perform more like
better-performing riders by concentrating braking efforts at a later point for overall
reduced brake work and brake time, but increased brake power. Reduced reliance on the
rear brake my positively affect overall brake work and brake time, which should benefit
performance. More research is needed on proper off-road cycling tracks, and should
include propulsive variables in addition to braking.

Chapter 8: Calculation of brake power during skidding
128
8. Chapter 8
CALCULATION OF REAR BRAKE POWER
DURING SKIDDING IN ROAD AND OFF-ROAD
CYCLING CONDITIONS
8.1 Abstract
The use of a brake power meter at each wheel of a bicycle is a valid means to calculate
energy losses due to braking. However, methodology utilizing the torque and angular
velocity at each wheel independently are not able to reflect energy lost to braking when
the rear wheel is skidding. This study tested the possibility of using the angular velocity
of the front wheel, but the torque of the rear brake, to calculate rear brake power. One
experienced cyclist completed 34 braking trials on a mixture of road and off-road surfaces
with a mixture of skidding and non-skidding. The total energy removed from the bicycle-
rider system was adjusted utilising the calculation at question and added to estimates of
drag and rolling resistance. This adjusted energy removed displayed a strong positive
relationship with the change in kinetic energy of the bicycle-rider system during braking
(r2=0.947; p<0.0001). These findings indicate that rear brake work is underestimated
when using the angular velocity at the rear wheel during skidding, but that utilising the
angular velocity of the front wheel is a valid means of calculating rear brake power.

Chapter 8: Calculation of brake power during skidding
129
8.2 Introduction
A bicycle brake power meter has recently been validated that can measure the rate of
energy removed from the bicycle rider system through the rider-induced interaction
between the brake caliper and the rotor (Chapter 5). This brake power meter has since
been utilised to calculate the brake work and rate of brake work (braking power) during
actual cycling (Chapter 6; Chapter 7). These investigations henceforth indicated the
importance of describing and understanding braking patterns during XC Mountain Bike
cycling, and supported the idea that braking did indeed affect cycling performance.
During these analyses, there were no instances recorded of the front wheel locking up or
the front tire skidding, which was apparent by inspection of angular velocity at the front
wheel. This observance supported practitioner philosophies which contend that locking
the front wheel results in losing control of the bicycle (Lopes & McCormack, 2010).
Occasionally however, the rear wheel brake was locked which resulted in the skidding of
the rear tire. This equated to 1.1 s per lap on a 1.24 km cross-country mountain bike race
track (Chapter 5). While the benefits or detriments of skidding and performance are not
well-understood, previously described methods (Chapter 5; Chapter 6; Chapter 7)
utilised to calculate brake power were not able to account for friction-related energy
losses experienced when the rear wheel is skidding.

Chapter 8: Calculation of brake power during skidding
130
Brake power is calculated at each brake as the product of brake torque times the angular
velocity of the wheel given,
(Eq. 8.1)
Where, τ is torque and ω is angular velocity.
In this case, any time the wheel stops spinning, the resultant power is 0 W despite any
recorded torque. However, it is obvious that energy is being removed from the bicycle-
rider system during skidding, being converted to heat, noise, and physical work done on
the terrain surface. Therefore, to ensure accurate brake power and work readings, this
energy loss must be accounted for.
Since Eq. 8.1 is not accurate for calculating brake power during skidding, it may be
possible to calculate brake power as the product of force and velocity instead. In this case
a combination of measurements from both the front and rear wheels can be utilized due
to them both being connected to the same bicycle.
If we assume that the front wheel does not skid, the velocity of the bicycle can be
calculated by measuring the angular velocity of the front wheel given,
ω (Eq. 8.2)

Chapter 8: Calculation of brake power during skidding
131
Where, v is velocity, ωf is the angular velocity of the front wheel, and r is the radius of
the front wheel.
To be able to calculate the energy lost in skidding we must calculate the frictional force
at the tyre-terrain interface. This force can be calculated given,
(Eq. 8.3)
Where, F is the frictional force between the skidding tire and the ground, τr is the torque
at measured at the brake of the rear wheel and r is the radius of the rear wheel.
Therefore, since power is the product of force and velocity,
ω
(Eq. 8.4)
This can be simplified to,
(Eq. 8.5)

Chapter 8: Calculation of brake power during skidding
132
While Eq. 8.5 is theoretically valid, it is not currently known if this calculation will
provide valid rear brake power recordings during actual field use. Therefore, the aim of
the present study was to determine the validity of brake power measurements during
skidding by adjusting brake power measurement to the product of brake torque at both
the front and rear wheels, but measuring angular velocity at only the front wheel.
It was hypothesized that the adjusted brake work calculated during braking events with
skids and without skids would be strongly associated with the change in kinetic energy
of the bicycle-rider system on both road and off-road surfaces.

Chapter 8: Calculation of brake power during skidding
133
8.3 Methods
One cyclist (eight years cycling experience; 178 cm; 85.04 kg) completed 34 braking
trials on a mixture of dirt and tar-sealed flat roads while riding a bicycle outfitted with a
brake power meter. All braking was done while coasting in a straight line with the
participant seated on the saddle. The participant was instructed to complete a mixture of
skids and non-skids, but given no limitation on how to brake otherwise; this ensured that
there was a mixture of front and rear brake utilization and importantly, several non-
skidding events to add into the analysis.
Data was sampled at 128 Hz and collected on a stand-alone data logger. Data files were
converted to *.mat format and transferred to Matlab R2011b for analysis. Non-adjusted
rear brake power was calculated as the product of rear brake torque and the angular
velocity of the rear wheel, while adjusted rear brake power was calculated in accordance
with Eq. 8.5. Front brake power was calculated as the product of front wheel angular
velocity and front brake torque. Non-adjusted brake work was calculated by integrating
the product of the sum of front brake power and rear brake power, while adjusted rear
brake work instead incorporated adjusted rear brake work. To calculate the total energy
removed from the bicycle-rider system, estimates of aerodynamic drag and rolling
resistance were added to brake work, where adjusted energy removed calculated rear
brake power using Eq. 8.5. Adjusted and non-adjusted total energy removed were
compared with the change in kinetic energy given,
Chapter 8: Calculation of brake power during skidding
134
∆EK (Eq. 8.6)
Where, Err is rolling resistance, Ed is aerodynamic drag and is the change in kinetic
energy, which were calculated according to our previous work (Chapter 5).
Skidding work was calculated as the difference in adjusted and non-adjusted rear brake
work.
All analyses were completed using GraphPad Prism 7.00, with the alpha value set a 0.05.

Chapter 8: Calculation of brake power during skidding
135
8.4 Results
Mean ± SD and range of braking data are highlighted in Table 8.1. Non-adjusted and
adjusted (for skidding) energy removed from the bicycle rider system were significantly
different from each other (t(33)=5.98; p<0.0001) and this was associated with a significant
difference in non-adjusted and adjusted rear brake work (t(33)=6.06; p<0.0001). This
shows the importance of being able to account for skidding in calculating braking work
and thus power. In terms of validation of the derived equation for calculating total
braking power (including skidding), the coefficient of determination between the change
in kinetic energy and adjusted energy removed during braking was r2=0.947 (p<0.0001;
Figure 8.1).
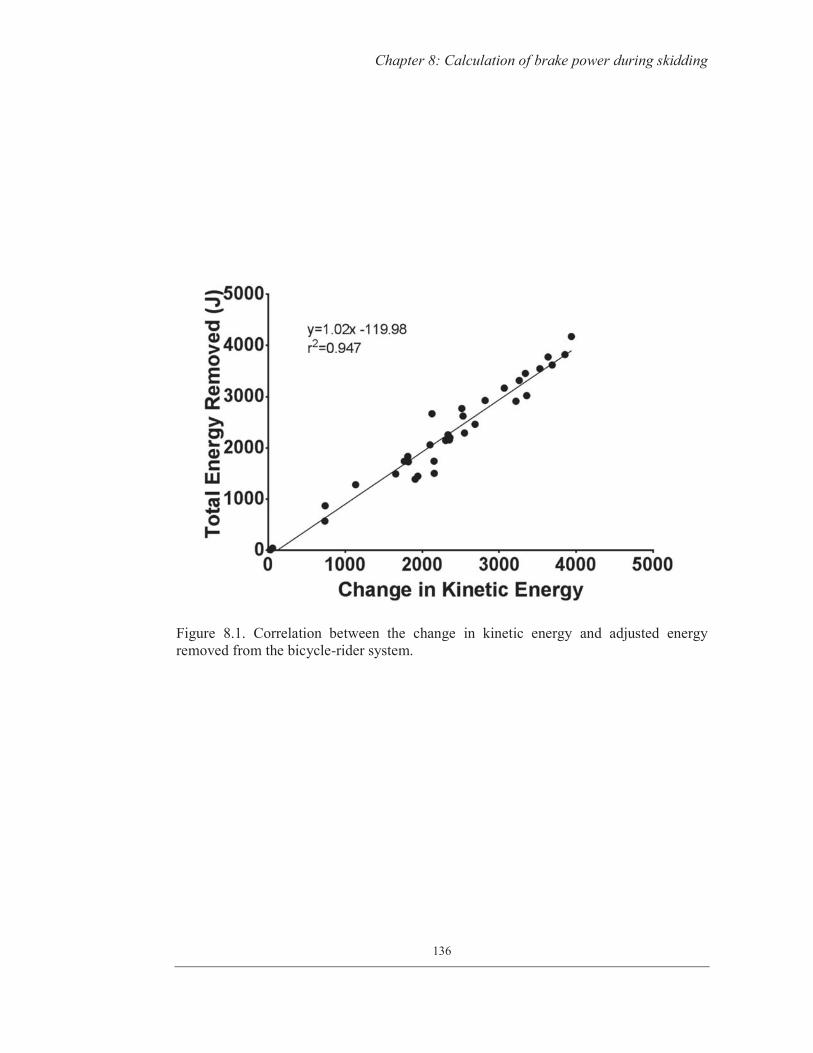
Chapter 8: Calculation of brake power during skidding
136
Figure 8.1. Correlation between the change in kinetic energy and adjusted energy removed from the bicycle-rider system.

Chapter 8: Calculation of brake power during skidding
137
Table 8.1. Mean ± SD and range for calculated variables of energy loss during braking.
Variable Mean SD Minimum Maximum
Distance (m) 6.2 3.0 0.2 11.3
Duration (s) 3.7 1.4 0.3 6.2
Rolling resistance (J) 136.0 65.6 3.6 246.7
Aerodynamic drag (J) 24.1 16.5 0 52.5
Front brake work (J) 781.4 1005.1 0 2878.5
Rear brake work, non-adjusted (J)* 273.7 169.3 0 622.3
Rear brake work, adjusted (J)* 1323.3 1123.4 0 3523.1
Skidding work (J) 1049.5 1010.1 0 3061.9
Total energy removed, non-adjusted (J) 1191.24 999.0 0 3667.0
Total energy removed, adjusted (J) 2264.7 1054.8 9.4 4175.3
Change in kinetic energy (J) 2337.3 1006.3 27.9 3938.5
Note. Values were obtained from 34 braking events on a mixture of flat, tar-sealed road and a flat dirt path.
* signifies a significant difference (p<0.0001).

Chapter 8: Calculation of brake power during skidding
138
8.5 Discussion and Implications
The aim of this study was to validate a method to calculate the energy losses during rear
wheel skidding on a bicycle equipped with a brake power meter. Rear brake power was
calculated in two ways; non-adjusted rear brake power was calculated using rear-wheel-
only measures while adjusted rear brake power was calculated as a product of rear wheel
torque and the angular velocity of the front wheel. It was hypothesized that the adjusted
total energy removed from the bicycle-rider system would not be different than the change
in kinetic energy of the bicycle-rider system, and that the two measurements would have
a strong correlation. The findings of the present investigation support the hypothesis on
both road and off-road surfaces across a range of speeds (Figure 1).
The magnitude of work done during skidding is significant, and cannot be calculated
using previously published brake power calculation (Chapter 5). Given these findings,
rear brake work is underestimated when utilizing previously used power calculation at
independent wheels during skidding (Table 8.1). It is recommended that future research
should utilize the adjusted rear brake power calculation to appropriately asses braking
during real cycling.

Chapter 8: Calculation of brake power during skidding
139
8.6 Limitations and Conclusion
A limitation to the present investigation is the low sample size of braking events. This is
indeed the case when compared with the original manuscript which incorporated over 400
braking events. However, the present investigation sought not to validate the device but
to validate the calculation of adjusted rear brake power. Given that the device has
undergone validation on both road and off-road surfaces and the similarity between the
present and past findings, the authors did not believe that more skidding samples were
necessary.
The present findings highlight that brake power can be calculated as the product or rear
wheel torque and the angular velocity of the front wheel, which is able to reflect the
energy losses during skidding. To accurately assess energy loss due to braking during real
cycling experience, the authors suggest that rear brake power be calculated as at present.
In the future, it is likely important to quantify of the amount of work done through
skidding during real cycling.

Chapter 9: Validation of a normalized brake work algorithm
140
9. Chapter 9
VALIDATION OF A NORMALIZED BRAKE
WORK ALGORITHM DESIGNED TO OUTPUT
A SINGLE METRIC TO PREDICT NON-
PROPULSIVE MOUNTAIN BIKE
PERFORMANCE
9.1 Abstract
The interaction between variables such as brake work, brake time and brake power can
be somewhat complicated, which might be a barrier to the utility of the brake power meter
as a training tool for mountain biking. The aim of this study was to determine if brake
power can be normalized to create a single-metric output more strongly related to
mountain bike descending performance. Nine nationally competitive mountain bikers
completed three trials each at race pace on a mountain bike descent using a bicycle
equipped with a brake power meter. Brake power was normalized instantaneously by
dividing it by the kinetic energy of the bicycle-rider system, and was integrated to
calculate normalized brake work. Normalized brake work (26.3 ±15.3) was more strongly
associated (r2=0.929; p<0.0001) with descending performance time (130.8 ±20.1 s) than
relative brake work (676.0 ±152.3 J/kg; r2=0.477; p<0.0001), brake time (62.3 ±21.1;
r2=0.729; p<0.0001) or relative brake power (11.4 ±2.2 W/kg; r2=0.429; p=0.0002). On

Chapter 9: Validation of a normalized brake work algorithm
141
the descent used in this study, normalized brake work was the strongest indicator of
descending performance based on braking. It is recommended that this metric be used to
quickly assess brake use, and that further analysis be done to fine-tune braking strategy.

Chapter 9: Validation of a normalized brake work algorithm
142
9.2 Introduction
Data gathered from propulsive power meters have been reasonably straight-forward for
describing the variance in ascending cycling performance. Relative rates of propulsive
work have a strong negative association with ascending ability, which means that to
reduce time on uphill sections, competitors must aim to increase rates of relative
propulsive work (i.e. relative propulsive power; W/kg). Accordingly, there has been a lot
of focus in the literature aimed at training interventions to increase relative propulsive
power.
While propulsion remains an important factor determining Olympic format cross-country
mountain bike racing (XCO-MTB) performance, new evidence utilising a brake power
meter has highlighted the importance of braking (Chapter 5; Chapter 6; Chapter 7).
Firstly, by employing a combination of propulsive and braking variables, variances in
XCO-MTB lap time were well-explained. Soon after, it was discovered that performance
time on a short descent is significantly associated with measurements of relative brake
work, brake time, and relative brake power (r2=0.34-0.59), which was the first attempt at
quantifying descending performance. It was also surmised that inexperienced XCO-MTB
riders display different braking patterns than experienced riders. Therefore, for riders to
perform better, appropriate brake training strategies could be developed to intervene in
poor braking habits. However, the magnitude of braking necessary to slow riders down is
dependent on a number of variables, which complicates the interaction between brake

Chapter 9: Validation of a normalized brake work algorithm
143
work, brake time and brake power. This means that neither one variable is great at
explaining the variances in descending performance, which may be a barrier to the ease
of brake training administration and descending performance explanation.
To highlight some of the complexities of brake data analysis, simple energy equations
can be utilised to compare braking data and effects on performance given the law of
conservation of energy. At the same time, these same equations may also help to reduce
brake power meter data to more usable and comparable metrics.
Firstly, brake work is equal to the change in kinetic energy when accounting for drag and
rolling resistance given,
∆EK (Eq. 9.1)
where, Err is rolling resistance, Ed is energy lost to aerodynamic drag, and ∆EK is the
change in kinetic energy. In the case of brake power meter utilisation, brake work is of
interest in Eq. 9.1; other energy loss calculations were explained previously (Chapter 5).
Nevertheless, the above calculation represents that brake work and kinetic energy are
easily compared with each other.

Chapter 9: Validation of a normalized brake work algorithm
144
The change in kinetic energy of the bicycle-rider system can be explained given,
∆EK =
(Eq. 9.2)
where, m is the combined mass of the rider wearing cycling gear and the bike, v is the
average velocity, I is the moment of inertia, and ω is the angular velocity of the front
wheel.
The instantaneous kinetic energy can therefore be calculated as,
EK =
(Eq. 9.3)
where, v and ω are instantaneous velocity and angular velocity, respectively.
In Eq. 9.3, m and v are important to note: firstly, assuming two riders of different mass,
the kinetic energy at any given time is not equal. More importantly, two riders of the same
mass but travelling at different velocities, will have quite different kinetic energy because
this value is proportional to velocity squared. In these two cases, the brake work required
to bring the riders to a stop is not equal and thus indicates the complexity of brake power
meter analysis. Indeed, with differences in the amount of brake work required, metrics of
brake time and thus brake power are skewed accordingly, which explains the relatively

Chapter 9: Validation of a normalized brake work algorithm
145
weak association with these traditional brake measures and descending performance. This
potential barrier to the understanding and comparison of the data must be overcome for
brake power meter measurements to have utility for training.
With this in mind, it is sensible to develop an algorithm that can calculate the amount of
braking done by the rider in relation to both the total mass and the velocity of the bicycle-
rider system. Such a metric would indicate the extent to which the braking is affecting
progression along the trail and reflect the efficiency at which the rider can negotiate the
descent. One way to do this could be to calculate the instantaneous brake power as a
percentage of the kinetic energy of the bicycle-rider system. This normalization of brake
power would eliminate the complexity of brake power being scaled by mass and velocity.
Then, normalized brake power can be integrated to account for the time component of
input to the brakes. The result of this integration would henceforth be normalized brake
work, ultimately outputting a single metric to describe the descending performance of the
rider based on braking. Therefore, this study set out to determine the validity of an
algorithm designed to calculate normalized brake work. It was hypothesized that
variations in performance time on a mountain bike descending track could be better
explained by brake readings reduced to normalized brake work than by traditional brake
metrics of relative brake work, brake time, or relative brake power, henceforth signifying
the validity of the algorithm at question.

Chapter 9: Validation of a normalized brake work algorithm
146
9.3 Methods
Nine nationally competitive mountain bikers (mean ± SD: age= 25.6 ±3.6 years; body
mass= 77.4 ±11.6 kg; height= 177.2 ±11.2 cm) volunteered for this study which was
approved by the primary university’s Human Ethics Committee. Participants all rode the
same mountain bike (Trance 1, Giant Bicycles, New Zealand), which had suspension
adjusted to manufacturer specifications pre-testing and had tires inflated to a standardized
pressure (Macdermid et al. 2014). The bike was outfitted with a brake power meter that
continuously sampled and recorded at 128 Hz, and a propulsive power meter (S2275,
Quarq, Spearfish, SD, USA) that output data at 1 Hz (Appendix I & II). Both units were
calibrated using two-point and one-point calibration, respectively, preceding testing.
Brake power meter data (brake torque and angular velocity of the rotor at each wheel,
respectively) were recorded on a data logger (DATAQ UHS710; DATAQ Instruments,
Akron Ohio, USA) attached to the bicycle handlebars while propulsive power was
recorded on a portable cycle computer (510; Garmin Ltd., Schaffhausen, Switzerland).
The total mass of the bicycle and all equipment was 18.64 kg.

Chapter 9: Validation of a normalized brake work algorithm
147
Figure 9.1. Elevation profile of the descending track used for testing in this study. The total distance was 1.01 km with a total elevation loss of 165 m (average gradient of -16.3%). This track was chosen based in its previous use which indicated that performance time was not dependent on propulsive work.
Prior to testing, each participant was weighed while wearing cycling apparel, which
included clothing, helmet and shoes. On arrival to the mountain bike park, each
participant completed a 30-minute warmup on the bicycle, which also served as a
familiarization of the equipment. Participants then underwent three test trials at race pace
on a mountain bike descent (Figure 9.1) that was chosen because of its descending nature
which eliminated performance benefits due to pedalling (Chapter 5). All participants
were given 15 min epoch between trials.
Chapter 9: Validation of a normalized brake work algorithm
148
Brake power meter data was converted to *.mat files in accordance with previous
investigations and Matlab R2011b (The MathWorks, Inc., Natick, MA, USA) was used
to calculate variables of interest. Performance time (s) to complete the descent was
determined by integrating the velocity of the front wheel across the distance of the track
which allowed the determination of performance without relying on GPS data. Front
brake power (watts) was calculated as the product of front wheel torque and the angular
velocity of the front wheel. Rear brake power (watts) was calculated as the product of
rear wheel torque and the angular velocity of the front wheel, which has recently been
validated as a method to measure rear brake power and calculates for the frictional forces
of the tire during skidding. Any measurement that did not exceed 8 Nm was removed
from analysis to reduce the effect of noise. Brake work (joules) was calculated by
integrating the product of front and rear brake power across the duration of the track, and
was reported relative to the mass of the rider wearing cycling gear plus bicycle
(joules/kg). Brake time (s) was the total time that either brake exceeded 8 Nm. Relative
brake power (watts/kg) was calculated as the product of relative brake work divided by
brake time.
Normalized brake power was calculated instantaneously given,
EK
(Eq. 9.4)

Chapter 9: Validation of a normalized brake work algorithm
149
where brake power and EK are instantaneous. The units for normalized brake power are
in Hz (1/s) since the calculation divides a rate of work (i.e. power) by work (i.e. kinetic
energy).
Normalized brake power was integrated to calculate normalized brake work across the
descent given,
(Eq. 9.5)
where normalized brake work has no unit since it is a frequency which has been integrated
over time.
Propulsive work on the descent used for testing was not a performance benefit factor, but
was calculated by multiplying the average power output collected onto the Garmin device
by the performance time of each trial. The potential energy of the descent was calculated
for each participant as the product of the mass of the bicycle-rider system times the height
of the descent (165 m) and gravity (9.81 m/s2). Due to minimal propulsive work, the
increase in kinetic energy on the descending track utilized was proportional to the
reduction in potential energy throughout the descent. This meant that no two participants
had vastly differing opportunities to gain velocity outside of differences in braking, which
gives the normalized brake work algorithm sound theoretical validity for use presently.

Chapter 9: Validation of a normalized brake work algorithm
150
Statistical analyses
Each of the 27 descent trials completed by the nine participants were included in analysis.
All statistical analyses were completed in GraphPad Prism 7.00 (GraphPad Software, San
Diego California, USA). The mean ± standard deviation (SD) was calculated for
performance time, relative brake work, brake time, relative brake power and normalized
brake work across all trials. The coefficient of determination was calculated between
performance time and normalized brake work, relative brake work, brake time and
relative brake power, respectively, for all trials completed on the mountain bike descent.
The alpha value was set to 0.05.

Chapter 9: Validation of a normalized brake work algorithm
151
9.1 Results
The potential energy at the onset of the descent was 154,578 ±18,887 J, and participants
completed an average propulsive work equating to 1,231 ±3,217 J. Descriptive data for
performance and braking variables are highlighted in Table 9.1. The relationship between
performance time and relative brake work, brake time, relative brake power and
normalized brake work, respectively, are reported in Figure 9.2A-D. Normalized brake
work on the track used in this study displayed the strongest relationship with performance
time (r2=0.929, p<0.0001). Normalized brake work was also significantly related to
traditional measurements of relative brake work (r2=0.669, p<0.0001), brake time
(r2=0.799, p<0.0001) and relative brake power (r2=0.293, p=0.0036).

Chapter 9: Validation of a normalized brake work algorithm
152
Table 9.1. Mean ± SD for performance and braking variables.
Variable Mean SD
Performance time (s) 130.8 20.1
Velocity (km/h) 28.4 3.8
Relative brake work (J/kg) 676.0 152.3
Brake time (s) 62.3 21.1
Relative brake power (W/kg) 11.4 2.2
Normalized brake work 26.3 15.3
Note. Values were obtained from 27 descending trials on a mountain bike track that was not dependent on propulsive work

Chapter 9: Validation of a normalized brake work algorithm
153
Figure 9.2. The relationship between Performance Time (s) on the mountain bike descent and A) relative brake work (J/kg); B) brake time (s); C) relative brake power (W/kg); and D) normalized brake work.

Chapter 9: Validation of a normalized brake work algorithm
154
Based on overall performance time, one trial was selected each from a high-performer
(performance time= 115.4 s; normalized brake work= 13.1; relative brake work= 529.1
J/kg) while another was selected as that of a low-performer (performance time= 169.9 s;
normalized brake work= 43.0; relative brake work= 966.5 J/kg). The relative brake power
and normalized brake power from a small section of these trials are highlighted in Figure
9.3, which was chosen due to clear visual differences for each of comparison. From each
entire trial, a histogram was created to indicate the magnitude of normalized brake power
as a percent of brake time (Figure 9.4). Normalized brake power was organized into 10
bins which were separated by 0.05 1/s. Values below 0.05 1/s were removed from analysis
since these were extremely light braking events, while values above 0.5 1/s were all
included in the same bin due to their minimal occurrences.
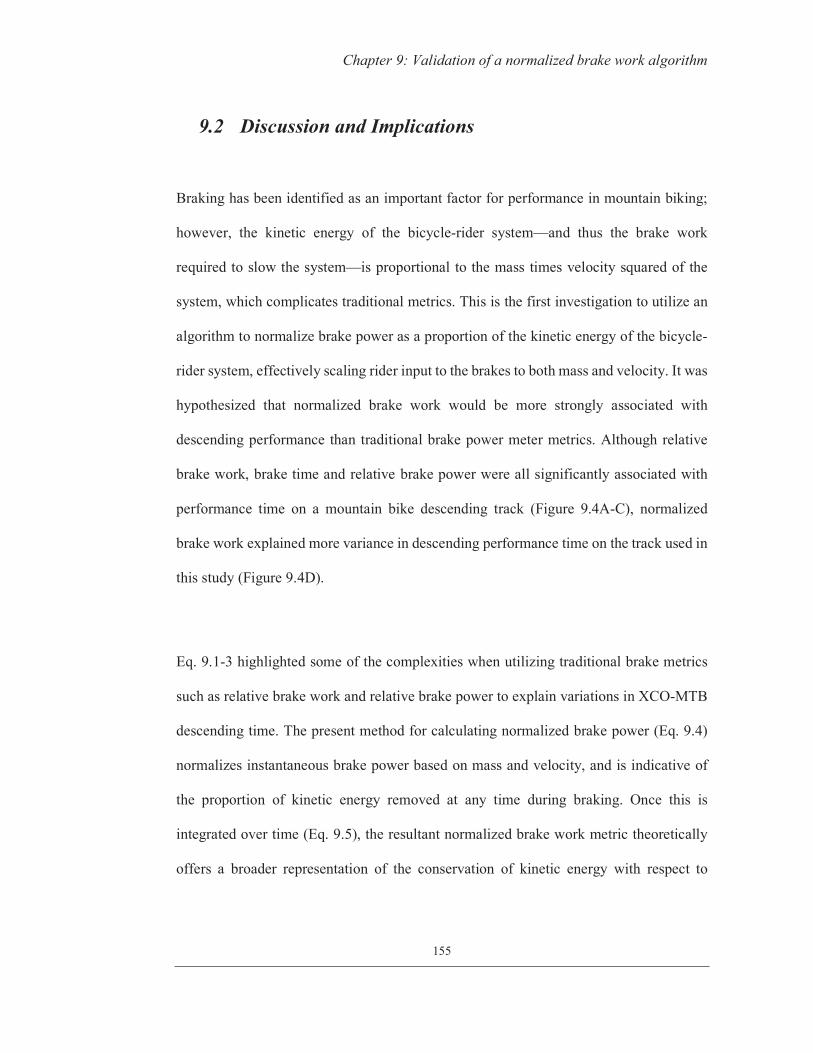
Chapter 9: Validation of a normalized brake work algorithm
155
9.2 Discussion and Implications
Braking has been identified as an important factor for performance in mountain biking;
however, the kinetic energy of the bicycle-rider system—and thus the brake work
required to slow the system—is proportional to the mass times velocity squared of the
system, which complicates traditional metrics. This is the first investigation to utilize an
algorithm to normalize brake power as a proportion of the kinetic energy of the bicycle-
rider system, effectively scaling rider input to the brakes to both mass and velocity. It was
hypothesized that normalized brake work would be more strongly associated with
descending performance than traditional brake power meter metrics. Although relative
brake work, brake time and relative brake power were all significantly associated with
performance time on a mountain bike descending track (Figure 9.4A-C), normalized
brake work explained more variance in descending performance time on the track used in
this study (Figure 9.4D).
Eq. 9.1-3 highlighted some of the complexities when utilizing traditional brake metrics
such as relative brake work and relative brake power to explain variations in XCO-MTB
descending time. The present method for calculating normalized brake power (Eq. 9.4)
normalizes instantaneous brake power based on mass and velocity, and is indicative of
the proportion of kinetic energy removed at any time during braking. Once this is
integrated over time (Eq. 9.5), the resultant normalized brake work metric theoretically
offers a broader representation of the conservation of kinetic energy with respect to

Chapter 9: Validation of a normalized brake work algorithm
156
braking than traditional brake measures. Since the potential energy of the bicycle-rider
system is a product of the mass of the system times the height of the track and gravity,
and there was negligible propulsive work completed by participants, the normalized brake
work algorithm has sound theory for use in explaining the present descending
performances.
The results presented in this study firstly reinforce the relationship between braking and
mountain bike descending performance (Figure 9.2A-C). Indeed, the fastest performance
times were associated with reduced relative brake work, reduced brake time, and
increased relative brake power. These findings are not surprising, but support the
qualitative importance of efficiently controlling the speed of the bicycle down the hill
(Chidley et al, 2014; Hurst & Atkins, 2006) and reinforce earlier braking investigations
(Chapter 6; Chapter 7). However, the main finding presently is that the normalized
brake work metric was more strongly related to performance (Figure 9.2D), and can
therefore explain more variation in descending performance than traditional measures
from a brake power meter. This finding is promising because normalized brake work can
indeed explain the variation in descending performance based on brake power meter data
alone, thus eliminating the need for qualitative measures of descending performance or
for other equipment. Moreover, the single metric output reduces the complexity of
multivariate analyses of braking performance, which eliminates a potential barrier to use
of the brake power meter.

Chapter 9: Validation of a normalized brake work algorithm
157
It is perhaps surprising that the relationship noted presently is nearly the same strength as
the previous multivariate model (r2=0.935; Chapter 6), however the normalized brake
work algorithm assesses descending performance solely. This is a strength in its own right
because it is well known that propulsive power can explain ascending performance. Just
as earlier investigations helped to understand that ascending performance can benefit
from increased propulsive power (Gregory et al. 2007), XCO-MTB athletes looking to
increase descending performance can look to reduce normalized brake work. Future
research might look at assessing performance during propulsive segments of mountain
biking (e.g. ascents) based on propulsive power, and non-propulsive performance (e.g.
descents) based on the present model, which may provide better clarity on overall
performance.
Given the validity of normalized brake work as a descriptor of descending performance,
it is important to look to training inventions that can help to reduce this value. Therefore,
two visual examples of normalized brake power are highlighted in Figure 9.3 and 9.4. By
inspection of Figure 9.3, it can be seen that the normalized brake power graph helps the
reader to visualize the proportion of kinetic energy being removed during each braking
event by each rider. It is clear in this figure that the low-performer is completing greater
normalized brake work, which is mainly due to braking across a greater distance. Figure
9.4 helps to indicate the proportion of braking done within the spectrum of normalized
brake power. The high-performing rider spends a greater proportion of brake time
conserving a greater amount of kinetic energy, whereas the low-performing rider spends
a greater proportion of brake time removing high amount of kinetic energy. Thus, the

Chapter 9: Validation of a normalized brake work algorithm
158
low-performer could be able to perform better by reducing time spent removing large
amounts of kinetic energy. Ultimately, these are examples of the observations that may
help indicate changes that can be made through brake training interventions and are in
addition to the broad representation of descending performance based on normalized
brake work.
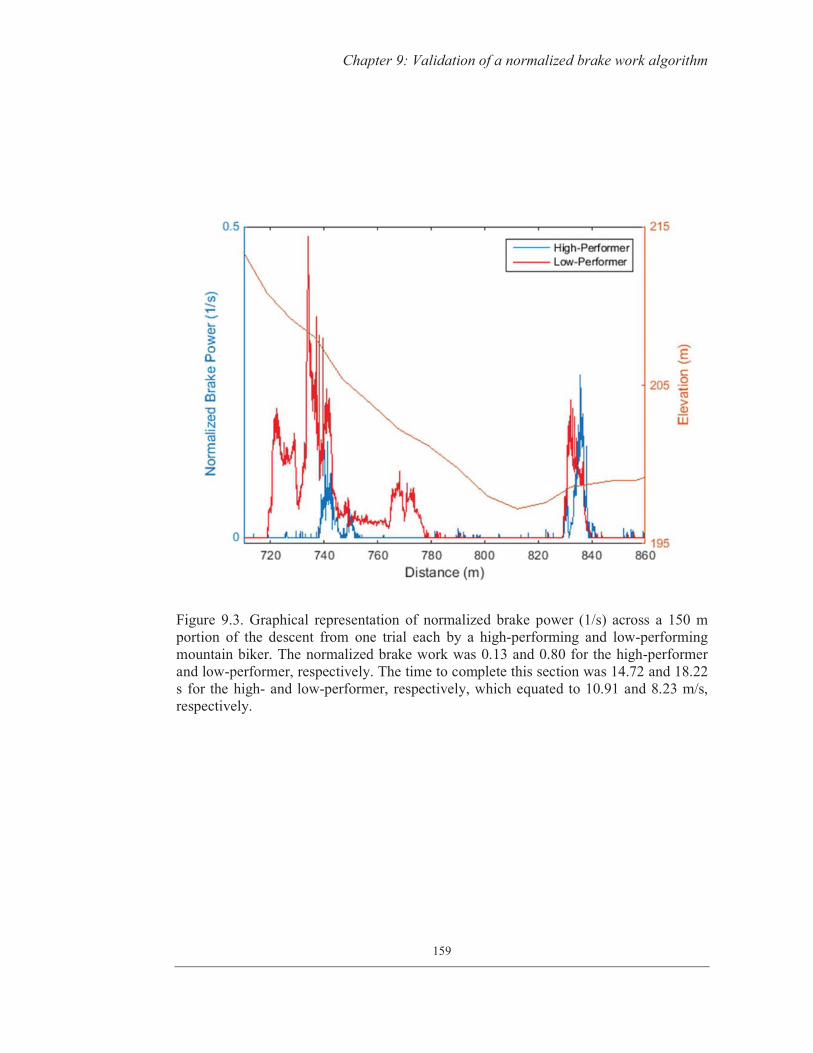
Chapter 9: Validation of a normalized brake work algorithm
159
Figure 9.3. Graphical representation of normalized brake power (1/s) across a 150 m portion of the descent from one trial each by a high-performing and low-performing mountain biker. The normalized brake work was 0.13 and 0.80 for the high-performer and low-performer, respectively. The time to complete this section was 14.72 and 18.22 s for the high- and low-performer, respectively, which equated to 10.91 and 8.23 m/s, respectively.

Chapter 9: Validation of a normalized brake work algorithm
160
Presently, the normalized brake work algorithm is not a perfect model, and the remainder
of the variation in performance is attributable to a number of extraneous braking
variables. One factor affecting performance is the location of the braking, which has been
previously been identified as a major difference between experienced and inexperienced
riders (Chapter 7). This is a factor that could likely benefit from visual inspection and
should be explored further. Another braking factor affecting descending performance in
the shape of the braking curve, as can be seen in Figure 9.3. A late-braking strategy is
displayed by the high-performing rider, and acts to reduce performance time since a
greater proportion of the time is spent moving more quickly. While the shape of the
braking curve may indeed affect performance, this is a small difference that cannot be
understood solely by looking at normalized brake work and may likely rely on visual
inspection. Similarly, line choice likely factors in to performance differences as well.
Firstly, these could be analysed based on GPS position, though these devices lack some
resolution (Coutts et al. 2010). However, it may be possible to use helmet camera video
footage analysis, which would give a better indication of location along the trail and also
the path taken.

Chapter 9: Validation of a normalized brake work algorithm
161
Figure 9.4. Frequency distribution of normalized brake power (1/s) comparing a high- and low-performing mountain biker. Normalized brake power was separated in to 10 bins in 0.05 1/s steps, with values below 0.05 1/s removed from analysis and values above 0.5 1/s combined in the same bin.

Chapter 9: Validation of a normalized brake work algorithm
162
9.3 Conclusion
This study shows that the normalized brake work algorithm has sound theoretical
reasoning for use in comparing brake data between riders going different speeds.
Normalized brake work can describe more variation in descending performance than
other braking measures, which gives the brake power meter greater utility as a training
tool. It is recommended that training interventions be utilized to enhance the braking
patterns of low-performing mountain bikers, which should come as a benefit to their
normalized brake work.

Chapter 10: Discussion
163
10. Chapter 10
DISCUSSION
10.1 General discussion
This body of work originally sought to better understand the physiological demands
XCO-MTB descending. While these descending sections within XCO-MTB
competitions are not always decisive, a deeper understanding of these was clearly
important due to the demanding nature of the terrain. Thus, Chapter 4 furthered on
from previous work by Macdermid et al (2017), and added new knowledge by
investigating physiological and vibrational differences between descending road and
off-road surfaces. Chapter 4 also investigated the differences in a coasting versus
pedaling strategy on a descent—this ended up being a turning point for the direction of
this research. When it was uncovered that riders were able to descend at the same pace
whether coasting or pedaling, it became clear that this needed to be investigated more
closely. The determination was made that a method to measure descending ability
needed developing, and the brake power was the measurement method that this body of
work focused on.
Brake power was chosen as the measurement to investigate firstly due to its acceptance
in the cycling world. Cyclists and practitioners have been groomed to understand the
basics of propulsive power, which gave brake power strong face validity. Power was

Chapter 10: Discussion
164
chosen in lieu of a measurement such torque due to its usefulness for calculating energy
losses (e.g. brake work).
With that, the novel brake power meter described in Chapter 5 was developed. By
calculating the energy losses during braking and comparing them to other equations of
energy, the device was able to be validated within the same chapter. This thesis is not
towards an engineering degree, and therefore Chapter 4 is not intended to be written as
an engineering manuscript. Chapter 5 does however fully explain how the device
works and how the device was validated, which is the main point for application in the
sports science area. As such, this Chapter does not address the time or methodology set
aside to design the brake power meter, nor does it speak too in-depth on how it works
(e.g. software, hardware, etc.) besides practically. This chapter as presented is the
product of the varied feedback received throughout an intense peer review process. It
was no easy feat to gain acceptance of this manuscript, however this stands as testament
to the study’s rigor.
From this point, it was important then to determine what a brake power trace might look
like during mountain biking, which was the focus of Chapter 6. It came as no surprise
that braking was related to XCO-MTB performance, though this finding was important
to communicate within the scientific community. Another important finding of this
study highlighted that it is possible to offset performance decrements due to fatigue
simply by braking differently. A promising inference from that finding was that it may

Chapter 10: Discussion
165
be possible to enhance performance by braking differently. It was that inference that led
to the testing protocol used in Chapter 7. Henceforth, clear differences in braking and
performance were noted between inexperienced and experienced mountain bikers.
These differences were important to note, and it is the hope that one day coaches can
use this information to train riders to brake more efficiently. It was not within the scope
of this thesis to investigate brake training strategies, mainly due to the need to focus on
quantifying other aspects of braking.
One small aspect of braking that required investigation was a method to quantify brake
power during skidding. Chapter 8 describes this method well, and offers a sound, valid
solution to brake power calculation in a non-moving wheel. Due to the time course of
this body of work, it was not seen as practical to go back and recalculate data from
Chapter 5-6. While this might be considered a limitation of this thesis, the reader is
reminded that the time spent skidding during XCO-MTB is minimal, as pointed out in
Chapter 5.
The final experimental chapter of this thesis aimed at determining practical, easy
method for assessing descending performance based on braking. It is one thing for a
sports scientist to describe differences in brake power, brake work and brake time
between individuals, and a totally different thing for a mountain bike enthusiast to
quickly compare himself to his friends after a fun ride. The scientific method was
utilized to explore the single metric output and is described in-depth in Chapter 9. The

Chapter 10: Discussion
166
hope is that this finding will make brake power meter data less intimidating and more
useful for the hopeful day that the brake power meter is available for consumers.

Chapter 10: Discussion
167
10.2 Practical applications
Overall this body of work highlights the need and importance of the brake power meter
in XCO-MTB performance analytics. This is made clear from the conclusion of
Chapter 4 when it was discovered that riders could descend at the same pace whether
coasting or pedaling, and was reinforced in each subsequent experimental chapter. It is
perhaps not surprising that braking is so strongly associated with things like descending
performance, however it is important to note that—to the Candidate’s knowledge—this
is the first time that any aspect of braking during cycling has been explored. The authors
believe that they are not the first to have thought about the importance of braking for
mountain biking, and indeed other scientific authors have been hinting at something like
this for several years (Mastroianni et al. 2000; Macdermid et al. 2016). But, what the
authors do believe is that exploring the measurement of braking was a right-place-at-
the-right-time kind of situation; indeed, there was one researcher available (in this case,
the Candidate) to dedicate several years of research in to developing and employing a
brake measuring device through sounds scientific research.
After the completion of Chapter 4 and the initial development of the first prototype,
there were a number of outstanding downhill mountain bike events in which racers rode
very well with no chain. While many racers would have given up and accepted a poor
performance, there were a number of athletes who used a broken chain mishap to their
advantage. Of note was Aaron Gwin’s (2016 Overall World Cup Winner) World Cup

Chapter 10: Discussion
168
race win in Leogang, Austria in 2015, a race in which he was the fastest competitor
despite breaking his chain at the start of the race. While this came as a surprise to many
within the sport, it came as no surprise to the researchers within this project. Though
this research program never really did get to the bottom of how riders are able to ride
downhill on select tracks whether coasting or pedaling, the data presented throughout
this thesis tend to support the reasons this might be possible. Perhaps there is an
increased ability to concentrate on technique when the effort is low? It is the
Candidate’s hope that one day this might be investigated.
One thing that has been interesting since the onset of this research program has been the
increasing use of brake measurement tools in professional mountain bike racing. Of
note are a number of teams using test-only bikes, which are not dissimilar to the test
bike used in the present investigations. These feature an on-board data logger and
proprietary brake sensors—usually pressure sensors within the brake line. It seems that
brake pressure sensors are utilized because they are more compact, and thus lighter;
however, the authors in the present investigations decided against the measurement of
brake pressure since the effectiveness of brake pressure at slowing down the rotation of
the wheels is dependent on the heat of the braking equipment at any time. What this
means is that for a given brake pressure, the effect on slowing the bike is not always the
same, which reduces the robustness of measurements. While this issue is resolved by
measuring brake power, to date it has been difficult to build lightweight brake power
measuring devices; indeed, the present device adds 5 kg to the weight of the bike. The
weight of equipment (and cyclist, for that matter) is a concern within racing, and it has

Chapter 10: Discussion
169
been noted that while data loggers and brake pressure sensors might be lightweight
enough to add to a bike for training or testing, these units are not lightweight enough to
race on (~1-2 kg additional weight for data logger and pressure sensors). As a result,
any data that has since been collected—whether within this thesis or by professional
racers—has not been from actual race performances.
Given the importance of braking noted throughout this thesis and the lack of proper
tools available, the Candidate was determined to bring a brake power meter to the
market. This led to a number of successful funding applications aimed at miniaturizing
and commercializing a bicycle brake power meter. At the time of writing this thesis, a
bicycle brake power meter has successfully been developed through our original
intellectual property with a technology partner in Denmark. It is the Candidate’s hope
that this smaller device—and the research completed herein—will encourage riders to
look deeper in to their braking habits to create for themselves informed braking
decisions for a safer and faster ride.

Chapter 10: Discussion
170
Figure 10.1 The Candidate with an early commercially viable prototype brake power meter. Photo c. David Wiltshire, Massey University.
With this in mind, it has always been a goal to collect robust, useful data. At the onset,
the data have been displayed as in practitioner software, such as in Figure 5.4. It was
clear that by using controlled trails such as the isolated turn in Chapter 7, the data were
easy to compare. For example, by controlling the line taken (by way of a narrow track),
and by starting at the top of the track in the same manner (coasting with no chain), the
distance ridden and resulting brake power trace were easily comparable. However, the
utility of these small differences were harder to notice once the brake power meter was
taken out and used more casually. For example, we tried taking beginner mountain bike
riders out and training them based on their braking patterns, by looking at data traces as
in Figure 5.4. However, the implications of braking weren’t clear to the rider until after

Chapter 10: Discussion
171
several sessions using the brake power meter. To alleviate this, we tried attaching a
video camera to the helmet of the rider, and using time-series adjustments post hoc to
align the rider’s view of the trail with the braking that had been completed (Figure
10.2). This proved useful to both the rider and the practitioner, and after a few sessions
the rider was able to ride the track more quickly. An interesting outcome of review of
the helmet camera data was that it became apparent what other skills the rider could
work on, which was based on some of the locations of excessive braking across the trail.
For example, one particular rider was completing a lot of brake work preceding the
jumps on the track. This braking was due to the rider not being confident on jumps. As
such, it was determined that the rider could focus on practicing jumps, with the hope
that this excess braking could eventually be eliminated.
Figure 10.2 An example of helmet video recording of the rider's view of the trail and the braking trace completed throughout the trial.
Chapter 10: Discussion
172
The kind of findings communicated in regards to the helmet camera are recent findings,
and are not meant to be communicated scientifically; indeed, the scientific method was
not utilised to collect these data. These highly practical data were difficult to collect [at
first], but the utility is clear—it shouldn’t take a PhD to figure out what some brake power
readings displayed on a helmet camera might mean. At the same time, the highly practical
description of the data is the most important part: brake power meter data should be easy
to collect, easy to analyse, and easy to do something about it. These are the types of
attributes that make scientific findings useful in sport! The Candidate would lament that
this helmet camera finding is also one of the most important findings of this thesis, which
is thanks to its highly relatable nature. Of course, the findings garnered scientifically were
important: hypotheses were based on previous findings, which reduces the need for data
mining and witch-hunts; there was rigour to the methodology, which means that the
protocol are repeatable; statistics were employed to guide the utility of the findings; etc.
This allows the obscure audience of readers of this thesis and the refereed publications to
have confidence in the application of what is communicated presently, which is of course
the whole point of the scientific method. However, this was an extremely long, drawn out
process, during which a lot of time was spent doing curiously tedious and regal tasks
simply to check administrative boxes. Sadly, this is not the pace of the real world; the real
world moves much more quickly than the two years it takes to bring novel findings from
the editor to the people. Sadly, in this time the industry is still moving and looking for the
next product to put in front of the people (note: this is to the benefit of both the company

Chapter 10: Discussion
173
and the people, as it were, in this case). Sadly, oftentimes science is left in the dust, and
we are stuck making corrections on our third review of old data.
It is the Candidate’s hope that the data collected scientifically is now completed, and that
time will pass much more quickly between the first brake power meter being made
available to the first athlete being coached with a brake power meter. Ultimately this
would signal a successful foray into applicable sports research.

Chapter 10: Discussion
174
10.3 Thesis limitations
This thesis offers a glimpse in to the importance of braking during XCO-MTB;
however, there are a number of limitations to the findings, but especially to the utility of
the present data. Individual limitations are discussed in each chapter, and this helps the
reader to understand minor limitations throughout the thesis. However, there are a
number of concerns never addressed; these are addressed below.
One of the first issues that may come up depending on the reader is the variables
measured herein using the brake power meter. Namely, some might find issue in the
fact that we measured brake power. As argued previously, the researchers felt that
power was an appropriate measurement to explore since it is easily converted to energy,
and power/work/energy measurements had already become well-accepted in cycling
(this is reinforced in Appendix I). However, much deliberation has remained. Some
have suggested that measurements collected with the brake power meter could have
stopped at torque, from which acceleration (m/s/s) can easily be calculated. The
argument against measuring torque stands on the basis that torque measurement itself
does not give an indication of the work done/energy removed from the bicycle-rider
system through braking. Similarly, there could be a measurable brake torque when the
bike is not moving; for example, imagine a cyclist pointing down a hill with his brakes
on, but not moving—in this case there would be a brake torque, but it is not slowing the
cyclist down nor is it something that is affecting the extent to which he is riding since he

Chapter 10: Discussion
175
is not actually moving. In that regard, there could be a high torque or a very high torque,
but neither one is slowing him down more than the other. This in itself might render the
measurement of only torque less useful for training purposes.
Another limitation to the present collection of research is that none of these manuscripts
are training manuals. At that, it is important to note that none of this research has
explored the trainability of braking to improve performance. This is perhaps in reverse
to such data as that garnered from propulsive power meters, since it had already been
well-established that training could increase propulsive power in the laboratory. This
meant that appropriate training strategies had already been established before personal
power meters made their way to the market. As it stands currently, clear differences
have been shown between experienced and inexperienced mountain bikers (Chapter 7),
and it is clear that changing braking can result in faster speeds (Chapter 6). However,
to date there is no clear training path to improve braking strategies. It is recommended
that appropriate brake training strategies be explored, both in the field and within the
science community.
Another limitation is to the algorithm used to calculate normalized brake power in
Chapter 9. It should be pointed out that this is not a standard calculation, and the ratio
of brake power to kinetic energy does not actually result in a number that is a power

Chapter 10: Discussion
176
(e.g. rate of work). Rather, since this is a rate of work taken as a proportion to an
energy, the units are 1/s. However, it should also be pointed out that by using the
calculation explained, brake power is indeed displayed as a ratio of kinetic energy,
which makes the name ‘normalized brake power’ more intuitive. Moreover, once this is
integrated to calculate normalized brake work (appropriately unitless), the coefficient of
determination explained within Chapter 9 indicates the strength of the equation used.
Thus, it is suggested that normalized brake power is suitable for use to make brake data
easier to view according to one metric, however this could likely be called by another
name.

Chapter 10: Discussion
177
10.4 Conclusions
Descending on a mountain bike is physiologically demanding, and strategies should be
taken that can reduce the physiological demand during these sections. The use of a brake
power meter offers greater insights in to mountain bike descending performance, and it
is recommended that training strategies be explored to enhance riders’ braking strategies.

Appendix
178
11. Appendices
This portion of the thesis includes an additional manuscript that was written and
published (Appendix I).
Appendix I
179
Appendix I
Agreement between the Powertap, Quarq, and Stages power meters
for cross-country mountain biking.
Matthew C Miller1, Paul W Macdermid1, Phil W Fink1, Stephen R Stannard1
1School of Sport & Exercise, Massey University, Palmerston North, New Zealand
Corresponding author:
Matthew C Miller 1Massey University, Manawatu
Private Bag 11 222
Palmerston North, 4442
New Zealand
+64 06 356 9099 ext. 83816
Running head: Comparison of power meters in XCO-MTB
Manuscript Word Count: 3049
Number of Pages (Total): 17
Number of Figures: 4

Appendix I
180
Abstract
Advances in technology have made the use of a variety of power meters ubiquitous in
road cycling along with an ever-increasing popularity during mountain biking. This study
compared data from one bicycle using three power meters: Stages (non-drive-side crank
arm); Quarq (chainring spider); and Powertap (rear wheel hub). While no differences
(P>0.05) between power meters were present during treadmill riding at high or low
cadences, dissimilarities for both power (W) and cadence (rpm) were apparent during
actual cross country mountain bike riding. Frequency distribution and analysis of
coasting indicate that the Stages records more time (P<0.001) at zero watts (6.9 ± 3.3 s)
and zero cadence (6.9 ± 3.3 s) compared with Quarq (W= 3.3 ± 1.5 s, rpm= 0.8 ± 0.7 s)
and Powertap (W= 1.1 ± 0.8 s, rpm= 3.0 ± 1.2 s). Consequently, significant interactions
(power meter*terrain, p=0.0351) and main effects (power meter P<0.0001, and terrain
P<0.0001) for power output were present and included: uphill (317.5 ± 50.7, 340.8 ± 52.6,
327.3 ± 48.6 W); downhill (127.6 ± 12.3, 147.4 ± 23.8, 160.1 ± 24.0 W); and flat (201.1
± 21.6, 225.2 ± 27.2, 224.0 ± 29.6W) for the Stages, Quarq and Powertap, respectively.
It is likely that accelerometry (Stages) compared with reed switch (Powertap and Quarq)
technology to determine cadence, resulted in the discrepancies between power meters.
However, while the reliability of the different methods appears acceptable for intermittent
exercise such as cross-country mountain biking, the validity of each in such a situation
requires confirming.
Keywords: mountain bike; power meter; cycling; cross country; power

Appendix I
181
Introduction
The use of power meters has become ubiquitous to observe competitive work
requirements and also to monitor training load in serious cyclists (Jobson, Passfield,
Atkinson, Barton, & Scarf, 2009; Pinot & Grappe, 2011). Historically reserved for use
in only elite sport and at a high cost, advances in technology have made these devices
readily available at relatively low cost. Most power meters use strain gauges to measure
strain-inferred torque and utilize various methods to measure pedal cadence (Aguilar,
2008). These values are continuously sampled, multiplied and typically reduced to 1 s
averages, with power displayed in real time on portable display units. The data can be
downloaded onto a personal computer for review and analysis of training and racing data.
While power is a relatively simple and universal measurement, power meter
manufacturers have taken different approaches in the way equipment works, each with
potential benefits (e.g. reduced weight penalty or overall cost) or shortcomings (e.g.
indirect measurements). For example, the Powertap (Saris Cycling, Madison, WI, USA)
houses strain gauges in the rear hub and estimates cadence through wheel speed. The
Quarq (Quarq, Spearfish, SD, USA) uses strain gauges in the crank’s chainring spider to
measure strain and a magnet fixed to the bicycle for cadence measurement. Others, like
the Stages (Stages Power, Boulder, CO, USA) use a strain gauge housed in only the left
crank arm to measure power with an attached accelerometer to measure cadence.
Many cycling studies have used the SRM power meter for research (Johnson, Stannard,
Chapman, & Thompson, 2006; Johnson et al., 2003; P. Macdermid & Edwards, 2010;

Appendix I
182
Pinot & Grappe, 2011; Smith, Davison, Balmer, & Bird, 2001) as this device has been
shown to be a valid means of reflecting power (Martin, Milliken, Cobb, McFadden, &
Coggan, 1998). However, frequency of use should not confer “gold standard” status
inferred to the SRM as a cycling power measuring device; even the ‘Professional’ model
with four strain gauges has a claimed ± 2% accuracy (Gardner et al., 2004). The error
associated with the Powertap is ± 2.5 % and this device has been deemed acceptable for
use in training and in road cycling following direct comparisons with the SRM (Bertucci,
Duc, Villerius, Pernin, & Grappe, 2005; Gardner et al., 2004). The claimed error
associated with the Quarq power meter is ± 2 % (Aguilar, 2008; P. W. Macdermid, P. W.
Fink, & S. R. Stannard, 2014), which is the same as for the power associated with the left
leg in the Stages power meter according to manufacturer’s claims.
There currently exists no comparison of the Quarq power meter with other acceptable
devices like the Powertap as has been done previously with other new devices (Abbiss,
Quod, Levin, Martin, & Laursen, 2009; Millet, Tronche, Fuster, Bentley, & Candau,
2003; Sparks, Dove, Bridge, Midgely, & McNaughton, 2015). Researchers should be
concerned by the assumptions made with the Stages power meter in particular, whereby
torque produced by the left leg is measured and assumed identical to that of the right leg.
In this context, power asymmetries are commonly seen between dominant and non-
dominant legs (Meylan, Nosaka, Green, & Cronin, 2010), which could introduce a source
of error in power measurement. This power meter has been reviewed once for off-road
climbing, however little attention was paid to the fact that this device also assesses

Appendix I
183
cadence differently and through the use of an accelerometer (Hurst, Atkins, Sinclair, &
Metcalfe, 2015).
In addition to fundamental differences in the way these devices work, no studies to date
have assessed the agreement of different power meters for variable-terrain cross-country
mountain biking (XCO-MTB), with investigations exclusively reviewing power meters
for use in either road or laboratory cycling, even though studies on this particular
discipline of the sport have used various power meters (Hurst & Atkins, 2006; P. W.
Macdermid et al., 2014; P. W. Macdermid & Stannard, 2012; Miller, Moir, & Stannard,
2014; Stapelfeldt, Schwirtz, Schumacher, & Hillebrecht, 2004). XCO-MTB off-road
terrain produces more intermittent demands with a higher proportion of time producing
either no power while coasting, descending, or through corners, and alternately
interspersed with supramaximal bursts of pedalling (P. W. Macdermid & Stannard, 2012;
Miller et al., 2014; Prins, Terblanche, & Myburgh, 2007; Stapelfeldt et al., 2004) when
compared with road cycling. Cadence has also been shown to be different during XCO-
MTB than in road cycling, with more time spent producing power though high-force low-
velocity pedalling than on the road (P. W. Macdermid & Stannard, 2012). The unique
demands of XCO-MTB collectively suggest it could present some of the more difficult
challenges to measuring power during cycling, especially if work in only one leg is
recorded. As power meters have been used to assess the slight differences that equipment
can have on performance in the field (P. W. Macdermid et al., 2014; MacRae, Hise, &
Allen, 2000), determine pacing (Skiba, Clarke, Vanhatalo, & Jones, 2014), and
concurrently to track training and measure fitness (Miller et al., 2014; Prins et al., 2007),

Appendix I
184
it is important that power meters be able to instantaneously and accurately reflect power,
regardless of the type of equipment used or terrain ridden. Moreover, some of these
devices function by relatively novel means (e.g. Stages), so it is important that these be
compared to equipment currently considered acceptable.
The purpose of this study therefore is to compare the recordings of power produced by
the Powertap, Quarq and Stages power meters simultaneously on one bicycle. As
fundamental differences in ability to measure steady-state power could drastically affect
any intermittent measurements in the field, this study first set about to compare power
under a controlled laboratory environment during steady cycling. The primary aim of
this study was to assess the agreement between power meters during a simulated XCO-
MTB time trial completed on varied off-road terrain. It is hypothesized that the
equipment will provide agreeable readings of both power and cadence throughout
laboratory and field trials given manufacturer’s claims and despite utilizing different
technology to measure power or cadence.

Appendix I
185
Methods
Laboratory and Field Equipment
A mountain bike (GT Zaskar, Force Carbon Construction) was built for use with three
different power meters simultaneously. A Stages Power SRAM X9 power meter (Stages
Cycling, Boulder, CO, USA) replaced the left crank arm while a Quarq Quatro (Quarq,
Spearfish, SD, USA) replaced the right crank. The rear wheel was replaced with a
Powertap Pro MTB rear hub laced to a Stan’s ZTR Olympic rim. The magnet used to
read cadence for the Quarq power meter was placed at the 6 o’clock position around the
frame’s bottom bracket shell, while no changes were made to the Stages or Powertap to
enable external cadence measurement. Tire pressure was standardized at 0.3 PSI/kg of
body mass (Paul William Macdermid, Philip W. Fink, & Stephen R. Stannard, 2014).
Participants used their own pedals and shoes and positioned the saddle position to
personal preferences. Each power meter was synchronised with a reliable, independent,
commercially available portable headunit (Garmin, Edge 510, Olathe, KS, USA) (P. W.
Macdermid & Stannard, 2012). Data were logged every second based on the maximum
recording rate of the headunit. Trials were distinguished by pressing the ‘LAP’ button
simultaneously by two technicians to eliminate differences in recording time at the
beginning and end of each trial. All participants provided a signed informed consent for
the protocols that were approved by the institution’s human ethics committee.
Study A

Appendix I
186
Four nationally competitive cyclists (64.3 ± 10.5 kg) volunteered for the laboratory study
which involved riding on a treadmill at 20 km/hour at a + 6 % gradient. Participants
cycled in two different rear cogs (either 12 or 18 tooth rear cog) chosen to elicit a low or
high cadence, respectively, for 10 min in a random order. Recording of data did not
commence until the participants were riding at a steady cadence and concluded before the
treadmill speed was reduced. Participants were allowed 15 min epoch between trials.
Study B
Eight nationally competitive XCO-MTB athletes (61.0 ± 2.6 kg) volunteered for the field
trials that were completed over one lap of a 1.67 km purpose-built off-road track (Arapuke
Forest, Palmerston North, New Zealand) of which all participants were familiar.
Following a 30 min warm-up and re-familiarization with the track, participants were
encouraged to complete the trial at race pace. Data were logged simultaneously as per
Study A.

Appendix I
187
Figure 1. XCO-MTB lap with UP, DH, and FLAT sections indicated.
The track (Figure 1) was broken down into three sections according to overwhelming
terrain trend and deemed as uphill (UP), downhill (DH) and flat (FLAT) with distances
of 348, 763, and 559 m, respectively, and elevation change of 15, -22, and 10 m,
respectively. The UP section took place on a forest road, while the DH and FLAT
sections were groomed rolling singletrack terrain in dry condition. Data were
continuously sampled and logged every second and transferred to Garmin Training
Center (version 3.6.5) on a conventional PC for analysis.
Statistical analyses
Descriptive data (mean, standard deviation and coefficient of variation where
appropriate) were calculated for power and cadence during treadmill riding in each

Appendix I
188
cadence condition and during the XCO-MTB lap by terrain section. Two-way repeated-
measures analysis of variance (ANOVA) was used to compare power within each cadence
condition during treadmill riding (power meter*cadence), and to compare power and
cadence measured off-road by terrain section (power meter*terrain). One-way repeated-
measures ANOVA was used to analyse coasting duration (seconds) for power or cadence
recorded.
Where significant difference was found the main effect was analysed using Tukey post-
hoc testing. All statistical analyses were performed using GraphPad Prism 6, significance
set at P<0.05.
Power and cadence for each terrain section were broken into 50 W and 10 rpm bins for
frequency distribution and displayed as relative frequency. The first instance of coasting
during the transition from the forest road (UP) section to the singletrack (DH) was
analysed for duration (s) of values recorded as 0 W and rpm for each power meter (Figure
6) to determine possible source for differences in recorded mean values and frequency of
measurement
Appendix I
189
Results
Study A
For treadmill riding, mean power (± CV %) was 225.6 (± 1.77%), 220.0 (± 2.47%), and
221.5 (± 3.11%) during the low cadence trial, and 233.5 (± 2.45%), 217.5 (± 2.70%),
223.1 (± 2.09%) during the high cadence trial for the Stages, Quarq and Powertap power
meters, respectively. Two-way ANOVA indicated no interaction (power meter*cadence,
F(2,12)=0.9170, P = 0.4260) in the low or high cadence conditions, or significant main
effect for cadence (F(1,6)=0.0135, P = 0.9112) thus highlighting robustness for power
measurement in the two cadence ranges within each power meter. However, there was a
significant main effect for power meter (F(2,12)=4.036, P = 0.0457) indicating differences
in equipment used. Post-hoc testing indicated no significant differences (P>0.05) between
power meters during steady riding. Mean cadence within each condition was not
significantly different (P>0.05) with the mean SD rpm equalling 59.4 ± 0.5 , 59.2 ±
0.3, and 58.8 ± 0.2, during the low cadence trial, and 88.9 ± 0.6, 88.6 ± 0.6 and 88.6 ±
0.6 during the high cadence trail for the Stages, Quarq and Powertap, respectively.

Appendix I
190
Figure 2. Mean (± SD) A. power (W) and B. cadence (rpm) in terrain section during XCO-MTB lap.
+ (P<0.05), ++++ (P<0.0001) interaction between power meter*terrain; (P<0.0001) main effect of power meter; (P<0.0001) main effect of terrain. Post hoc analysis *** (P<0.001), **** (P<0.0001) when compared to Powertap; # (P<0.05), ## (P<0.01), ### (P<0.001), #### (P<0.0001) when compared to Stages.

Appendix I
191
Study B
Analysis of power (Figure 2A) provided a significant main effect for power meter
(F(2,42)=27.1600, P <0.0001) and terrain (F(2,21)=60.2712, P<0.0001), with a significant
interaction for terrain*power meter (F(4,42)=2.8558, P =0.0351). Post-hoc analysis
revealed significant difference between the Stages and Quarq for UP (P<0.001) as well
as between the Stages and both Quarq and Powertap (P<0.01) in the DH and FLAT terrain
sections.
Analysis of cadence (Figure 2B) showed a significant main effect for power meter
(F(2,42)=129.236, P <0.0001) and terrain (F(2,21)=33.8695, P <0.0001) and a significant
interaction for terrain*power meter (F(4,42)=14.9330, P <0.0001). Post-hoc analysis
identified that the Stages was significantly different (P<0.05) in all sections compared
with Quarq and Powertap, and that the Quarq and Powertap were significantly different
(P<0.001) from each other in the DH and FLAT.

Appendix I
192
Figure 3. Frequency distribution for power (A, B, C) and cadence (D, E, F) across terrains
displayed as relative frequency for each power meter. A, D: UP; B, E: DH; and C, F:
FLAT.

Appendix I
193
Frequency distribution (Figure 3) highlights disagreement in recorded values amongst
power meters as well as a difference per terrain section. One-Way ANOVA of coasting
duration showed mean duration of 0 power (Quarq= 3.3 ± 1.5 s, Stages= 6.9 ± 3.3 s,
Powertap= 1.1 ± 0.8 s) was significantly different between the Stages and Quarq (P<0.01)
and Stages and Powertap (P<0.001), but not significantly different between the Quarq
and Powertap (P>0.05). Mean duration of 0 cadence (Quarq= 0.8 ± 0.7 s, Stages= 6.9 ±
3.3 s, Powertap= 3.0 ± 1.2 s) was significantly different between the Stages and Quarq (P
<0.001) and Stages and Powertap (P<0.01), but not significantly different between the
Quarq and Powertap (P>0.05). Recorded power and cadence coasting duration were
significantly correlated in the Quarq and Powertap (r = 0.7467 and r= 0.7161; P= 0.0333
and P=0.0457, respectively), and a perfect fit in the Stages, revealing potential sources of
error in data recording or sampling within power meters.

Appendix I
194
Figure 4. A. Power (W) and B. cadence (rpm) graphs for XCO-MTB lap with all power
meters.

Appendix I
195
Discussion
The primary aim of this study was to assess variability between power meters used in
XCO-MTB. The main findings of this study are that: a) power recordings during smooth,
steady riding are not significantly different regardless of power meter used, and are robust
regardless of cadence; b) mean power is not significantly different between the Quarq and
Powertap overall, but both are significantly different than Stages during a varied terrain
off-road lap; c) recordings reflecting the duration of coasting are significantly longer in
the Stages power meter compared with the Quarq and Powertap.
The results of this study clearly indicate some variance between different makes of power
meters rather than indicating which shows a more accurate reading, as the determination
of the most accurate power meter requires a CALRIG as used previously (Gardner et al.,
2004). Even the SRM power meter, often used to compare other power meters against
(Bertucci et al., 2005; Gardner et al., 2004; Hurst et al., 2015; Millet et al., 2003; Sparks
et al., 2015) has a manufacturer stated error of over ±2% for the ‘Professional’ model,
therefore, the SRM was not used to compare power meters against in this study. Further,
a comparison of the Powertap and SRM power meters has revealed large variation in
accuracy across individual power meters even within the same make (Gardner et al.,
2004). For these reasons, in the current study it was decided that each power meter should
be assumed as accurate as the other according to manufacturer’s claims, but that
recordings should be compared to indicate any potential difference and reasons for these.

Appendix I
196
All power meters were able to reflect average power not significantly different from the
others as well as similar average cadence during smooth riding at a fixed speed, regardless
of whether the trial was high or low cadence. This indicates that measuring power via
these three power meters should not produce significantly different results during steady
riding and suggests that any major differences would come about during intermittent
cycling. As such, it does not appear that the Stages grossly over- or under-estimates
power when power is measured at only the left leg and assumed proportional to that of
the right, nor does it suggest that either of the three power meters are less or more
acceptable for steady riding. Given previous research on the Powertap (Bertucci et al.,
2005; Gardner et al., 2004), this would tend to suggest that both the Stages and Quarq are
useful and acceptable for steady cycling. The Powertap power meter had two instances
of two seconds each which reflected zero power and cadence readings during the high
cadence trail for two participants, however this was not ignored for analysis as this has
been observed previously (Gardner et al., 2004).
Power and cadence graphs (Figure 4) indicate differences in measurements, but do not
indicate a phase delay in the Powertap as seen previously (Gardner et al., 2004). Despite
being synchronised properly, recordings in the Stages do seem to precede those of the
Quarq and Powertap. The Quarq and Powertap did not produce power recordings
different from each other in any section of the XCO-MTB lap (Figure 2), but both were
different from the Stages in all sections off-road. However similar power recordings were
Appendix I
197
between the Quarq and Powertap, the results show significant differences in cadence
between all power meters in the DH and FLAT, which may be exacerbated by a higher
frequency of coasting as seen in the frequency distribution (Figure 3). Conversely, greater
agreement in power and cadence in the UP section, illustrated by the least significant
observed differences between the Stages and both Quarq and Powertap, could be due in
part to this section having the lowest frequency of coasting. Suggestively, it does appear
that a higher frequency of coasting tends to complicate the comparison of measurements
between power meters.
Further analysis indicates that the Stages produced more zero (0) values for power and
cadence during all sections of the XCO-MTB track, reflected by lower overall mean
power and cadence off-road. Following analysis of coasting, a longer duration was found
in the Stages than the other power meters. Interestingly, the Stages was the only power
meter to have a correlation coefficient of 1.0 between cadence and power coasting
duration, indicating robustness in recorded values, while both the Powertap and Quarq
had periods of time with 0 W corresponding with > 0 rpm or 0 rpm corresponding with >
0 W. Collectively, it is surmised that a large part of the variation in the readings produced
by these power meters is based on the ability to instantaneously sense rotation of the
cranks or estimate the rotation of the cranks at the rear wheel.
Potential differences in ability to reflect actual cadence -and thus power- could be due to
the different methods utilized to measure cadence in the three power meters used in this

Appendix I
198
study. Indeed the methods of a magnet fixed on the bicycle frame (e.g. Quarq) and an
indirect measurement within the hub (e.g. Powertap) may be viewed as less
technologically advanced than an accelerometer built into the crank (e.g. Stages),
however, it is not known how this accelerometer is affected by high frequency vibrations
seen in XCO-MTB, as similar devices have been used to quantify vibrations in cycling
(P. W. Macdermid et al., 2014). It is important to point out that when riding off-road,
riders are often changing pedal position to avoid hitting obstacles or shift weight about
the bicycle to maintain traction. As these can be quick movements, it is possible that a
quick forward-backward-forward movement of the cranks could produce an artificially
over-estimated cadence reading in some or all of these devices. This warrants further
research, but does indicate that manufacturers must provide products that are accurately
able to reflect cadence.
Conclusion
Results of this study suggest that despite strong agreement during steady cycling,
differences in power readings between power meters may lie in ability to measuring
cadence, especially with respect to reducing to or surpassing zero during highly
intermittent XCO-MTB. Overall there is no reason to suggest that the Stages, Quarq, or
Powertap are better than the each other; as such, consumers should choose the device that
is most practical with low overall weight and cost. Manufacturers must focus on
providing products that are accurately able to measure cadence when used to determine
power.

Appendix I
199
Disclosure Statement
The authors maintain there is no conflict of interest in this study.

Appendix I
200

References
201
12. References Abbiss, C. R., Quod, M. J., Levin, G., Martin, D. T., & Laursen, P. B. (2009). Accuracy
of the Velotron ergometer and SRM power meter. International Journal of Sports
Medicine, 30(2), 107-112. doi: 10.1055/s-0028-1103285
Abbiss, C. R., Ross, M. L., Garvican, L. A., Ross, N., Pottgiesser, T., Gregory, J., &
Martin, D. T. (2013). The distribution of pace adopted by cyclists during a cross-country
mountain bike World Championships. Journal of Sports Sciences, 31(7), 787-794. doi:
10.1080/02640414.2012.751118
Aguilar, S., Becker, P., Gonzalez, D., Kaminski, B., Knopp, N., Jankhot, C.,... Tsosie, H.
(2008). Power Measurement for Road Bicycles: Towards a Universal Solution (Semester
Unknown) IPRO 324.
Atkinson, G., & Brunskill, A. (2000). Pacing strategies during a cycling time trial with
simulated headwinds and tailwinds. Ergonomics, 43(10), 1449-1460. doi:
10.1080/001401300750003899
Atkinson, G., Peacock, O., & Law, M. (2007). Acceptability of Power Variation during a
Simulated Hilly Time Trial. International Journal of Sports Medicin, 28(02), 157-163.
doi: 10.1055/s-2006-924209
Atkinson, G., Peacock, O., & Passfield, L. (2007). Variable versus constant power
strategies during cycling time-trials: Prediction of time savings using an up-to-date
mathematical model. Journal of Sports Sciences, 25(9), 1001-1009. doi:
10.1080/02640410600944709

References
202
Banister, E. W., & Hamilton, C. L. (1985). Variations in iron status with fatigue modelled
from training in female distance runners. European Journal of Applied Physiology and
Occupational Physiology, 54(1), 16-23.
Bertucci, W., Duc, S., Villerius, V., Pernin, J. N., & Grappe, F. (2005). Validity and
reliability of the PowerTap mobile cycling power meter when compared with the SRM
Device. International Journal of Sports Medicin, 26(10), 868-873. doi: 10.1055/s-2005-
837463
Bertucci, W. M., Rogier, S., & Reiser, R. F. (2013). Evaluation of aerodynamic and
rolling resistances in mountain-bike field conditions. Journal of Sports Sciences, 31(14),
1606-1613. doi: 10.1080/02640414.2013.792945
Casanova, D. (2000). On minimum time vehicle manoeuvring: The theoretical optimal
lap (Thesis). Retrieved from Google Scholar.
Chidley, J. B., MacGregor, A. L., Martin, C., Arthur, C., & Macdonald, J. H. (2014).
Characteristics Explaining Performance in Downhill Mountain Biking. International
Journal of Sports Physiology and Performance. doi: 10.1123/ijspp.2014-0135
Clarke, D. C., & Skiba, P. F. (2013). Rationale and resources for teaching the
mathematical modeling of athletic training and performance. Advances in Physiology
Education, 37(2), 134-152.
Corno, M., Savaresi, S. M., Tanelli, M., & Fabbri, L. (2008). On optimal motorcycle
braking. Control Engineering Practice, 16(6), 644-657.

References
203
Costa, V., & Fernando, D.-O. (2008). Physiological variable to predict performance in
cross-country mountain bike races. Journal of Exercise Physiology Online, 11(6).
Coyle, E. F., Feltner, M. E., Kautz, S. A., Hamilton, M. T., Montain, S. J., Baylor, A. M.,
... & Petrek, G. W. (1991). Physiological and biomechanical factors associated with elite
endurance cycling performance. Medicine and Science in Sports and Exercise, 23(1), 93-
107.
Fernández-García, B., Pérez-Landaluce, J., Rodríguez-Alonso, M., & Terrados, N.
(2000). Intensity of exercise during road race pro-cycling competition. Medicine and
Science in Sports and Exercise,, 32(5), 1002.
Gardner, A. S., Stephens, S., Martin, D. T., Lawton, E., Lee, H., & Jenkins, D. (2004).
Accuracy of SRM and power tap power monitoring systems for bicycling. Med Sci Sports
Exerc, 36(7), 1252-1258.
Gregory, J., Johns, D. P., & Walls, J. T. (2007). Relative vs. absolute physiological
measures as predictors of mountain bike cross-country race performance. The Journal of
Strength & Conditioning Research, 21(1), 17-22.
Hansen, E. A., Jensen, K., & Klausen, K. (1997). The work demands in cyclo-cross
racing. Cycling Science, 31-33.
Hurst, H. T., & Atkins, S. (2006). Power output of field-based downhill mountain biking.
Journal of Sports Sciences, 24(10), 1047-1053. doi: 10.1080/02640410500431997

References
204
Hurst, H., Swarén, M., Hébert-Losier, K., Ericsson, F., Sinclair, J., Atkins, S., &
Holmberg, H. (2012). Influence of course type on upper body muscle activity in elite
Cross-Country and Downhill mountain bikers during off Road Downhill
Cycling. Journal Of Science And Cycling, 1(2), 2-9.
Hurst, H. T., Atkins, S., Sinclair, J., & Metcalfe, J. (2015). Agreement Between the Stages
Cycling and SRM Power meter Systems during Field-Based Off-Road Climbing. Journal
of Science and Cycling, 4, 21–27.
Impellizzeri, F., Sassi, A., Rodriguez-Alonso, M., Mognoni, P., & Marcora, S. (2002).
Exercise intensity during off-road cycling competitions. Medicine and Science in Sports
and Exercise, 34(11), 1808-1813. doi: 10.1249/01.mss.0000036690.39627.f7
Impellizzeri, F. M., & Marcora, S. M. (2007). The physiology of mountain biking. Sports
Medicine, 37(1), 59-71.
Inoue, A., Sá Filho, A. S., Mello, F. C., & Santos, T. M. (2012). Relationship between
anaerobic cycling tests and mountain bike cross-country performance. The Journal of
Strength & Conditioning Research, 26(6), 1589-1593.
Jobson, S. A., Passfield, L., Atkinson, G., Barton, G., & Scarf, P. (2009). The Analysis
and Utilization of Cycling Training Data. Sports Medicine, 39(10), 833-844.
Johnson, N. A., Stannard, S. R., Chapman, P. G., & Thompson, M. W. (2006). Effect of
altered pre-exercise carbohydrate availability on selection and perception of effort during
prolonged cycling. European Journal of Applied Physiology, 98, 62–70.
doi:10.1007/s00421-006-0243-4
References
205
Johnson, N. A., Stannard, S. R., Mehalski, K., Trenell, M. I., Sachinwalla, T., Thompson,
C. H., & Thompson, M. W. (2003). Intramyocellular triacylglycerol in prolonged cycling
with high- and low-carbohydrate availability. Journal of Applied Physiology, 94, 1365–
1372.
Lee, H., Martin, D. T., Anson, J. M., Grundy, D., & Hahn, A. G. (2002). Physiological
characteristics of successful mountain bikers and professional road cyclists. Journal of
Sports Sciences, 20(12), 1001-1008. doi: 10.1080/026404102321011760
Lopes, B., & McCormack, L. (2010). Mastering mountain bike skills. Champaign,
Illinois: Human Kinetics.
Lucia, A., Hoyos, J., Carvajal, A., & Chicharro, J. (1999). Heart rate response to
professional road cycling: the Tour de France. International Journal of Sports Medicine,
20(3), 167-172.
Lucía, A., Hoyos, J., Pérez, M., & Chicharro, J. L. (2000). Heart rate and performance
parameters in elite cyclists: a longitudinal study. Medicine and Science in Sports and
Exercise, 32(10), 1777-1782. doi: 10.1097/00005768-200010000-00018
Macdermid, P., & Edwards, A. (2010). Influence of crank length on cycle ergometry
performance of well-trained female crosscountry mountain bike athletes. European
Journal of Applied Physiology, 108, 177–182. doi:10.1007/s00421-009-1197-0
Macdermid, P. (2015). Ergonomic Interventions, Health and Injury Prevention during
Off-Road Mountain Biking. Journal of Ergonomics, 5, e130.

References
206
Macdermid, P. (2015). Ergonomic interventions, health and injury prevention during off-
road mountain biking. Journal of Ergonomics, 05, e130.
Macdermid, P. W., Fink, P. W., & Stannard, S. R. (2015a). The effects of vibrations
experienced during road vs. off-road cycling. International Journal of Sports Medicine,
36(10), 783–8.
Macdermid, P. W., Fink, P. W., & Stannard, S. R. (2014a). The influence of tyre
characteristics on measures of rolling performance during cross-country mountain biking.
Journal of Sports Sciences, 1–9.
Macdermid, P. W., Fink, P. W., & Stannard, S. R. (2014b). Transference of 3D
accelerations during cross country mountain biking. Journal of Biomechanics, 47(8),
1829–1837.
Macdermid, P. W., Miller, M. C., Macdermid, F. M., & Fink, P. W. (2015b). Tyre volume
and pressure effects on impact attenuation during mountain bike riding. Shock and
Vibration, 2015(5), 1–10.
Macdermid, P. W., & Stannard, S. (2012). Mechanical work and physiological responses
to simulated cross country mountain bike racing. Journal of Sports Sciences, 30(14),
1491–1501.
MacRae, H.-H., Hise, K. J., & Allen, P. J. (2000). Effects of front and dual suspension
mountain bike systems on uphill cycling performance. Medicine & Science in Sports &
Exercise, 32, 1276–1280.

References
207
Martin, J. C., Milliken, D. L., Cobb, J. E., McFadden, K. L., & Coggan, A. R. (1998).
Validation of a mathematical model for road cycling power. Journal of Applied
Biomechanics, 14, 276–291.
Martin, L., Lambeth-Mansell, A., Beretta-Azevedo, L., Holmes, L. A., Wright, R., & St
Clair Gibson, A. (2012). Even between-lap pacing despite high within-lap variation
during mountain biking. International Journal of Sports Physiology and Performance,
7(3), 261-270.
Mastroianni, G. R., Zupan, M. F., Chuba, D. M., Berger, R. C., & Wile, A. L. (2000)
Voluntary pacing and energy cost of off-road cycling and running. Applied Ergonomics,
31(5), 479-485.
Meylan, C. M. P., Nosaka, K., Green, J., & Cronin, J. B. (2010). Temporal and kinetic
analysis of unilateral jumping in the vertical, horizontal, and lateral directions. Journal of
Sports Sciences, 28, 545–554. doi:10.1080/02640411003628048
Miller, M., & Macdermid, P. (2015a). Ergonomic Strategies Related To Health and
Efficiency in Mountain Biking. Journal of Ergonomics, 5, e139.
Miller, M., & Macdermid, P. (2015b). Predictive validity of critical power, the onset of
blood lactate and anaerobic capacity for cross-country mountain bike race performance.
Sport and Exercise Medicine Open Journal, 1(4), 105-110.

References
208
Miller, M. C., Macdermid, P. W., Fink, P. W., & Stannard, S. R. (2016). Agreement
between Powertap, Quarq and Stages power meters for cross-country mountain biking.
Sports Technology, 1-7. doi: 10.1080/19346182.2015.1108979
Miller, M. C., Moir, G. L., & Stannard, S. R. (2014). Validity of using functional
threshold power and intermittent power to predict cross-country mountain bike race
outcome. Journal of Science and Cycling, 3(1), 16.
Millet, G. P., Tronche, C., Fuster, N., Bentley, D. J., & Candau, R. (2003). Validity and
reliability of the Polar S710 mobile cycling power meter. International Journal of Sports
Medicine, 24, 156–161. doi:10.1055/s-2003-39083
Morton, R. H. (1997). Modelling training and overtraining. Journal of Sports
Sciences, 15(3), 335-340.
Novak, A. R., Bennett, K. J., Fransen, J., & Dascombe, B. J. (2017). A multidimensional
approach to performance prediction in Olympic distance cross-country mountain
bikers. Journal of Sports Sciences, 1-8.
Padilla, S., Mujika, I., Orbananos, J., & Angulo, F. (2000). Exercise intensity during
competition time trials in professional road cycling. Medicine & Science in Sports &
Exercise,, 32(4), 850-856.
Paton, C. D., & Hopkins, W. G. (2001). Tests of cycling performance. Sports Medicine,
31(7), 489-496.

References
209
Pinot, J., & Grappe, F. (2011). The record power profile to assess performance in elite
cyclists. International Journal of Sports Medicine, 32, 839–844. doi:10.1055/s-0031-
1279773
Prins, L., Terblanche, E., & Myburgh, K. H. (2007). Field and laboratory correlates of
performance in competitive cross-country mountain bikers. Journal of Sports Sciences,
25, 927–935. doi:10.1080/02640410600907938
Sjödin, B., & Jacobs, I. (1981). Onset of blood lactate accumulation and marathon running
performance. International Journal of Sports Medicine, 2(01), 23-26.
Skiba, P. F., Clarke, D., Vanhatalo, A., & Jones, A. M. (2014). Validation of a novel
intermittent W’ model for cycling using field data. International Journal of Sports
Physiology and Performance, 9, 900–904. doi:10.1123/ijspp.2013-0471
Smith, M. F., Davison, R. C. R., Balmer, J., & Bird, S. R. (2001). Reliability of mean
power recorded during indoor and outdoor self-paced 40 km cycling time-trials.
International Journal of Sports Medicine, 22, 270–274. doi:10.1055/s-2001-13813
Sparks, S. A., Dove, B., Bridge, C. A., Midgley, A. W., & McNaughton, L. R. (2015).
Validity and reliability of the look keo power pedal system for measuring power output
during incremental and repeated sprint cycling. International Journal of Sports
Physiology and Performance, 10, 39–45. doi:10.1123/ijspp.2013-0317
Stapelfeldt, B., Schwirtz, A., Schumacher, Y. O., & Hillebrecht, M. (2004). Workload
demands in mountain bike racing. International Journal of Sports Medicine, 25(4), 294-
300. doi: 10.1055/s-2004-819937

References
210
Tomlin, D., & Wenger, H. (2001). The Relationship Between Aerobic Fitness and
Recovery from High Intensity Intermittent Exercise. Sports Medicine, 31(1), 1-11. doi:
10.2165/00007256-200131010-00001
Toyofuku, Y., Matsushima, K., Irie, Y., Yonezawa, H., & Mizuno, K. (1994). Study on
the effects of motorcycle anti-lock-braking-system for skilled and less-skilled riders:
regarding braking in a turn. JSAE Review, 15(3), 223-228.
Velenis, E., Tsiotras, P., & Lu, J. (2007). Modeling aggressive maneuvers on loose
surfaces: The cases of trail-braking and pendulum-turn. Paper presented at the 2007
European Control Conference (ECC).
Viana, B. F., Inoue, A., & Santos, T. M. (2013). The influence of start position on even-
pacing strategy in mountain bike racing. International Journal of Sports Physiology and
Performance, 8(4), 351.
Viana, B. F., Pires, F. O., Inoue, A., Micklewright, D., & Santos, T. M. (2016). Correlates
of mood and RPE during multi-lap off-road cycling. Applied Psychophysiology and
Biofeedback, 41(1), 1-7.
Wing, M. G., Eklund, A., & Kellogg, L. D. (2005). Consumer-grade global positioning
system (GPS) accuracy and reliability. Journal of Forestry, 103(4), 169-173.