QF2D: a different way to measure Software Quality - CiteSeerX
10
1 22 - 2 -Error! Unknown switch argument. QF 2 D: a different way to measure Software Quality Luigi Buglione Alain Abran Software Engineering Management Research Laboratory Université du Québec à Montréal C.P. 8888, Succ. Centre-Ville Montréal, Québec, Canada E-mail: [email protected] Tel: (39) 338.95.46.917 Fax: (39) 06-233.208.366 E-mail: [email protected] Tel: +1 (514) 987-3000 (8900) Fax: +1 (514) 987-8477 Index – 1. Introduction - 2. Quality Models and the Quality Factor (QF) - 3. Quality Function Deployment (QFD) - 4. QF 2 D: description and advantages - 5. Conclusions & Prospects – References Abstract – Quality Function Deployment (QFD) technique has been developed in the context of Total Quality Management, and it has been experimented in the software engineering domain. This paper illustrated how key constructs from QFD contributed to an development of a second version of a Quality Factor (QF) for a qualitative software evaluation, considering three distinctive but connected areas of interest, each of them representing dimension of performance: • economic dimension, the perspective is the managers’ viewpoint; • social dimension, the perspective is the users' viewpoint; • technical dimension, the perspective is the developers' viewpoint. This new version of the original QF technique, referred to as QF 2 D (Quality Factor through QFD), has the following features: it can be used for both a priori and a posteriori evaluations of the software product; it makes usage of the set of quality sub-characteristics proposed in the new upcoming ISO/IEC 9126:2000 standard it has a variable number of elements taken into account the three viewpoints for the evaluation; it offers the visual clarity from QFD for external and internal benchmarking. An implementation of this new version of this technique in quality models is also discussed. Key words – Software Quality, Quality Function Deployment, Quality Models, Quality Factor, ISO/IEC 9126-14598 series. 1. Introduction Measurement and assessment, both of products and processes, are becoming one of the most important topics in the software engineering community. They are being increasingly recognised as being fundamental to objectively assess and to set realistic targets to improve organisational performance, with a view both to resources allocation and functional process areas implementation – or improvement, in order to reach optimal qualitative levels [1]. Measuring its own projects performance levels becomes then a strategic component for a proper planning and development of the software organisation. But in order to do that, in the evaluation you must consider the viewpoints of multiple company dimensions , all part of the software production process, such as: • the Economic one, represented by the managers’ viewpoint; • the Social one, represented by the users’ viewpoint; • the Technical one, represented by the developers’ viewpoint. Nearly the totality of software engineering literature takes into consideration only the first and the third viewpoints cited above. Because of a growing involvement of users with information technologies, the second viewpoint must now play an essential role in software assessment, because they are the real users of these products and it is increasingly necessary to meet their software quality requirements because only considering the three dimensions at the same time and with the same weight it is possible to obtain correct and complete assessments. Referring to product quality, specifically of software, it must be interpreted in the light of the concept of purpose of use, considering both internal attributes (product characteristics) and the external ones (aim of the use). From the different possible definitions of quality, we refer here to “the totality of features and characteristics of a product or service that bear on its ability to satisfy stated or implied needs” [28]. Therefore,
-
Upload
khangminh22 -
Category
Documents
-
view
3 -
download
0
Transcript of QF2D: a different way to measure Software Quality - CiteSeerX
1 22 - 2 -Error! Unknown switch argument.
QF2D: a different way to measure Software Quality
Luigi Buglione Alain Abran Software Engineering Management Research Laboratory
Université du Québec à Montréal C.P. 8888, Succ. Centre-Ville Montréal, Québec, Canada
E-mail: [email protected] Tel: (39) 338.95.46.917 Fax: (39) 06-233.208.366
E-mail: [email protected] Tel: +1 (514) 987-3000 (8900)
Fax: +1 (514) 987-8477
Index – 1. Introduction - 2. Quality Models and the Quality Factor (QF) - 3. Quality Function Deployment (QFD) - 4. QF
2D: description and advantages - 5. Conclusions & Prospects – References
Abstract – Quality Function Deployment (QFD) technique has been developed in the context of Total Quality Management, and it has been experimented in the software engineering domain. This paper illustrated how key constructs from QFD contributed to an development of a second version of a Quality Factor (QF) for a qualitative software evaluation, considering three distinctive but connected areas of interest, each of them representing dimension of performance:
• economic dimension, the perspective is the managers’ viewpoint; • social dimension, the perspective is the users' viewpoint; • technical dimension, the perspective is the developers' viewpoint.
This new version of the original QF technique, referred to as QF2D (Quality Factor through QFD), has the following features: it can be used for both a priori and a posteriori evaluations of the software product; it makes usage of the set of quality sub-characteristics proposed in the new upcoming ISO/IEC 9126:2000 standard it has a variable number of elements taken into account the three viewpoints for the evaluation; it offers the visual clarity from QFD for external and internal benchmarking. An implementation of this new version of this technique in quality models is also discussed. Key words – Software Quality, Quality Function Deployment, Quality Models, Quality Factor, ISO/IEC 9126-14598 series. 1. Introduction Measurement and assessment, both of products and processes, are becoming one of the most important topics in the software engineering community. They are being increasingly recognised as being fundamental to objectively assess and to set realistic targets to improve organisational performance, with a view both to resources allocation and functional process areas implementation – or improvement, in order to reach optimal qualitative levels [1]. Measuring its own projects performance levels becomes then a strategic component for a proper planning and development of the software organisation. But in order to do that, in the evaluation you must consider the viewpoints of multiple company dimensions , all part of the software production process, such as: • the Economic one, represented by the managers’ viewpoint; • the Social one, represented by the users’ viewpoint; • the Technical one, represented by the developers’ viewpoint. Nearly the totality of software engineering literature takes into consideration only the first and the third viewpoints cited above. Because of a growing involvement of users with information technologies, the second viewpoint must now play an essential role in software assessment, because they are the real users of these products and it is increasingly necessary to meet their software quality requirements because only considering the three dimensions at the same time and with the same weight it is possible to obtain correct and complete assessments. Referring to product quality, specifically of software, it must be interpreted in the light of the concept of purpose of use, considering both internal attributes (product characteristics) and the external ones (aim of the use). From the different possible definitions of quality, we refer here to “the totality of features and characteristics of a product or service that bear on its ability to satisfy stated or implied needs” [28]. Therefore,
2 22 - 2 -Error! Unknown switch argument.
software quality assessments take into account multiple and distinct viewpoints such as the three ones discussed above: • the management's one, who is “interested in the overall quality rather than in a specific quality
characteristic [...] and need to balance the quality improvement with management criteria” [34]; • the user's one, whereas software quality is given by all the properties right to satisfy correctly and
efficiently the present and future real needs of who buy and use it; • the developer's one, whereas software quality is given by the “conformity to functional and performance
requirements explicitly fixed, to development standards explicitly documented and to implied characteristics supposed for every software developed in a professional way” [39].
One of the most powerful tools for collecting and prioritising multiple requirement sources in Industry during last thirty years has been Quality Function Deployment (QFD) [45]. This paper presents how key concepts from QFD were used to develop a new version of the Quality Factor (QF) for software [8] which we developed to consolidate into a single value for quality, relevant to three viewpoints, using an open weight scale methodology permitting any appropriate value ranges rather than an arbitrarily set of weights. This new version is referred to as QF2D (Quality Factor through QFD). a method able For external comparability of results, we have chosen the international software engineering standards (ISO/IEC 9126 and 14598 standard series to build the tools for QF calculation. Section 2 discusses Quality Models and foundations for the QF. Section 3 presents QFD and its applications in the software field. Section 4 provides the description for the new improved technique, QF2D, and finally Section 5 summaries the state of the art and shows future directions for this study. 2. Quality Models & The Quality Factor (QF) A Quality Model (QM) is defined as “the set of characteristics and the relationships between them which provide the basis for specifying quality requirements and evaluating quality” [28] or as a “structured set of properties required for an object of a class to meet defined purposes” [19]. The goal of this paper is, as already said, to present a quality value, expressed by QF. But QF represents the output of a qualitative evaluation process based on a QM. The benefit of QMs is given by the decomposition of the valuable object (both a process, a product or an organisation) in a list of its characteristics, sub-characteristics and measures and it is applicable both to predict/assure/verify the achievement of a defined goal about the object before/while/after producing it. The best known QMs for software are those proposed by Boehm et al. [5] and McCall et al. [36], which formed a basis for the 1991 ISO standard (ISO/IEC 91261 2). It is possible to classify QMs depending on their number of layers: • 2 layers (Boehm and McCall): a set of characteristics, further subdivided into a set of sub-characteristics; • 3 layers: with specific measures for each sub-characteristic measures. In the description of their QM various the authors have used different terms, and for consistency, we use in this study the ISO terminology (Table 1).
LAYER BOEHM [5] MCCALL [36] ISO [34] IEEE [27] DROMEY [17] 1 H-Level Charact. Factor Characteristic Factor H-Level Attribute 2 Primitive Charact. Criteria Subcharacteristic Subfactor Subordinate Attribute 33 (Metric) (Metric) (Metric) Metric
Table 1 – Terminology of Quality Models
Another classification of QMs is based on the number of relationships between the first two layers: • 1:n relationship, as in ISO/IEC 9126 - every characteristic has its own set of sub-characteristics;
1 6 characteristics and 21 sub-characteristics compose the current standard, released in 1991. The new updating version (not always International Standard) has foreseen -27 sub-characteristics for Internal and External Quality against 6 characteristics plus 4 additional characteristics for the Quality in Use [29, 30, 31, 32]. 2 We have not listed IEEE Std 1061-1992 [27] in the text because it does not propose a pre-compiled checklist, but just furnishes in Annex A an example list of factors, sub-factor and metrics specifying that “these tables are not exhaustive. There are many possible sets of factors, sub-factors and metrics that can be used”. By the way, this standard lists the same six ISO characteristics and 18 sub-characteristics with a strong overlapping with the 21 ones in the ISO model. 3 The brackets for “Metric” on the third table row indicate that the model architecture does not formally mention that layer, even if it exists and is needed to make evaluations.
3 22 - 2 -Error! Unknown switch argument.
• n:m relationship, as in McCall’s Factor-Criteria Model (FCM) - every sub-characteristic is linked to one or more characteristics.
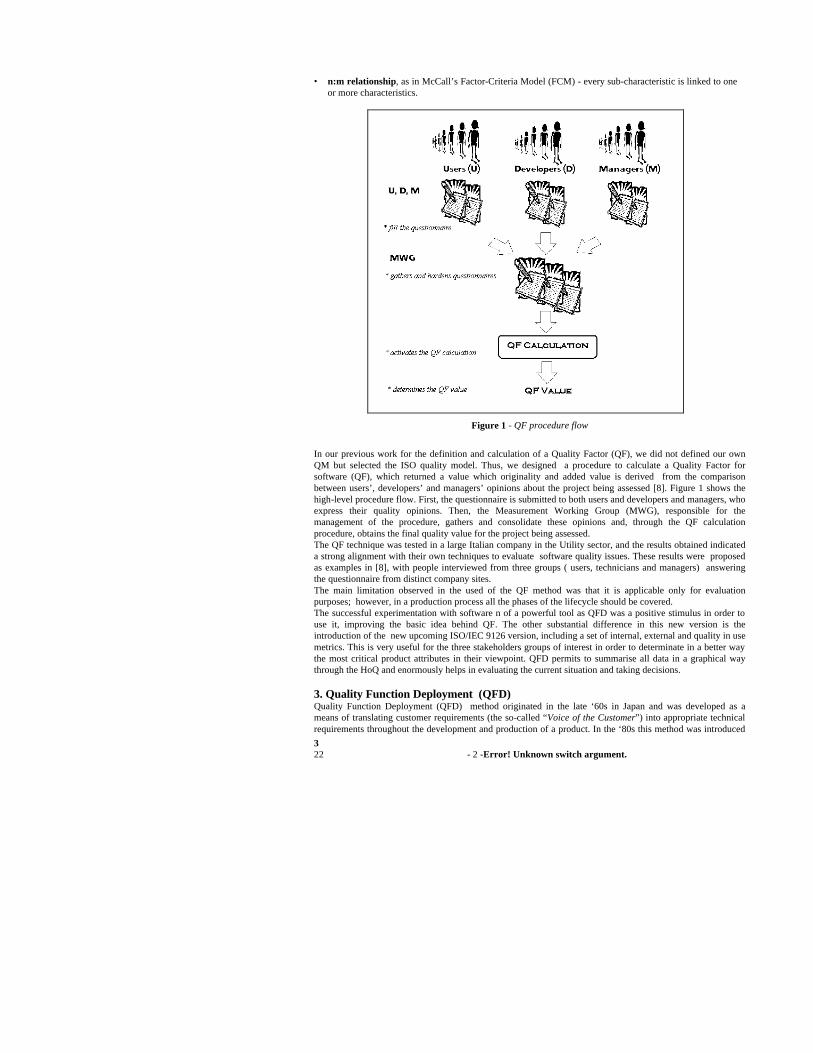
Figure 1 - QF procedure flow
In our previous work for the definition and calculation of a Quality Factor (QF), we did not defined our own QM but selected the ISO quality model. Thus, we designed a procedure to calculate a Quality Factor for software (QF), which returned a value which originality and added value is derived from the comparison between users’, developers’ and managers’ opinions about the project being assessed [8]. Figure 1 shows the high-level procedure flow. First, the questionnaire is submitted to both users and developers and managers, who express their quality opinions. Then, the Measurement Working Group (MWG), responsible for the management of the procedure, gathers and consolidate these opinions and, through the QF calculation procedure, obtains the final quality value for the project being assessed. The QF technique was tested in a large Italian company in the Utility sector, and the results obtained indicated a strong alignment with their own techniques to evaluate software quality issues. These results were proposed as examples in [8], with people interviewed from three groups ( users, technicians and managers) answering the questionnaire from distinct company sites. The main limitation observed in the used of the QF method was that it is applicable only for evaluation purposes; however, in a production process all the phases of the lifecycle should be covered. The successful experimentation with software n of a powerful tool as QFD was a positive stimulus in order to use it, improving the basic idea behind QF. The other substantial difference in this new version is the introduction of the new upcoming ISO/IEC 9126 version, including a set of internal, external and quality in use metrics. This is very useful for the three stakeholders groups of interest in order to determinate in a better way the most critical product attributes in their viewpoint. QFD permits to summarise all data in a graphical way through the HoQ and enormously helps in evaluating the current situation and taking decisions.
3. Quality Function Deployment (QFD) Quality Function Deployment (QFD) method originated in the late ‘60s in Japan and was developed as a means of translating customer requirements (the so-called “Voice of the Customer”) into appropriate technical requirements throughout the development and production of a product. In the ‘80s this method was introduced
4 22 - 2 -Error! Unknown switch argument.
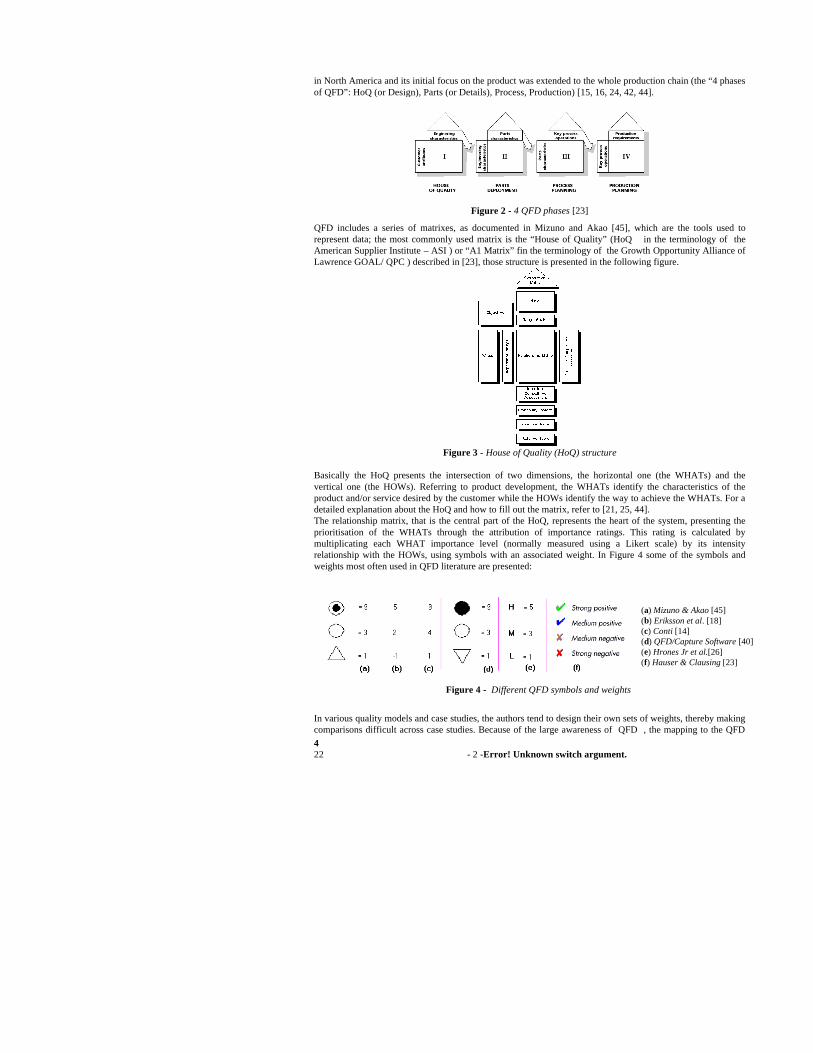
in North America and its initial focus on the product was extended to the whole production chain (the “4 phases of QFD”: HoQ (or Design), Parts (or Details), Process, Production) [15, 16, 24, 42, 44].
Figure 2 - 4 QFD phases [23]
QFD includes a series of matrixes, as documented in Mizuno and Akao [45], which are the tools used to represent data; the most commonly used matrix is the “House of Quality” (HoQ in the terminology of the American Supplier Institute – ASI ) or “A1 Matrix” fin the terminology of the Growth Opportunity Alliance of Lawrence GOAL/ QPC ) described in [23], those structure is presented in the following figure.
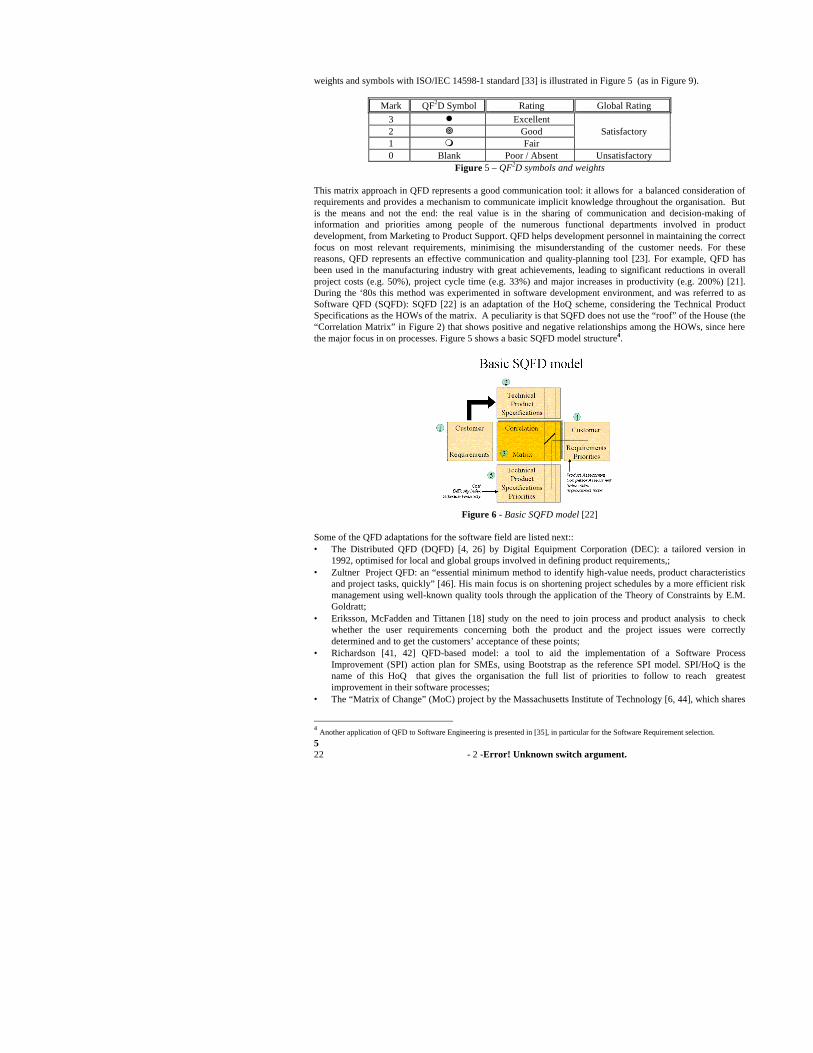
Figure 3 - House of Quality (HoQ) structure
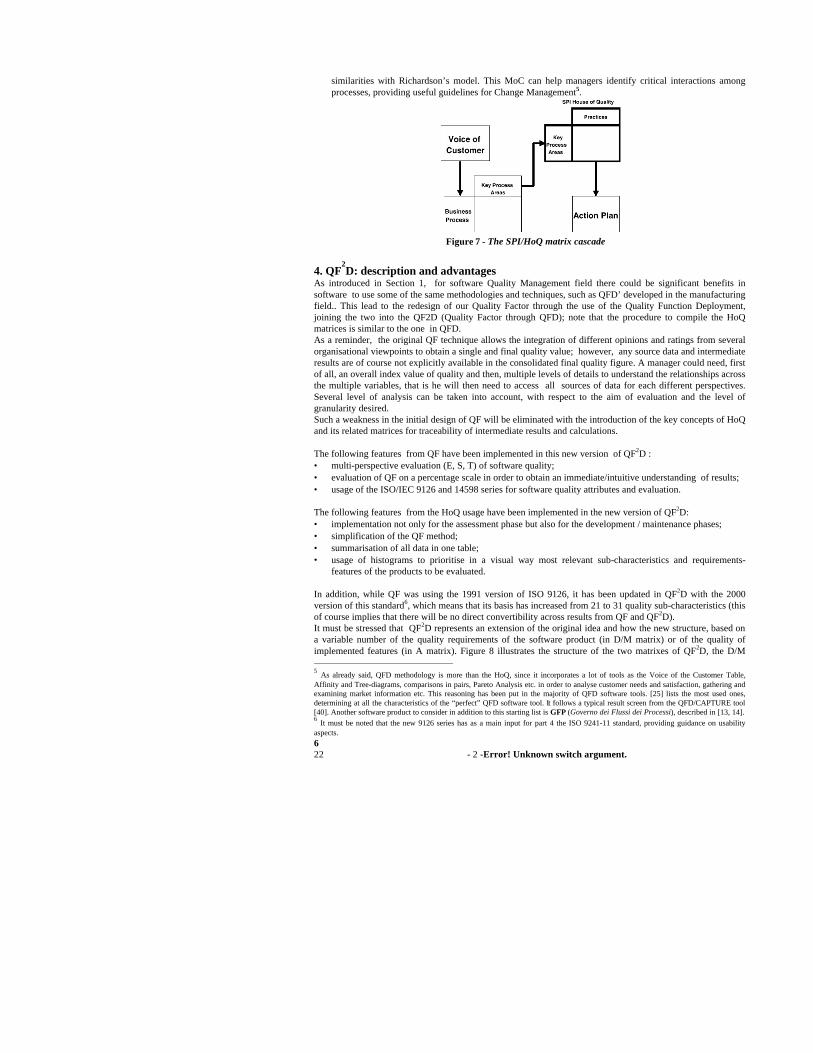
Basically the HoQ presents the intersection of two dimensions, the horizontal one (the WHATs) and the vertical one (the HOWs). Referring to product development, the WHATs identify the characteristics of the product and/or service desired by the customer while the HOWs identify the way to achieve the WHATs. For a detailed explanation about the HoQ and how to fill out the matrix, refer to [21, 25, 44]. The relationship matrix, that is the central part of the HoQ, represents the heart of the system, presenting the prioritisation of the WHATs through the attribution of importance ratings. This rating is calculated by multiplicating each WHAT importance level (normally measured using a Likert scale) by its intensity relationship with the HOWs, using symbols with an associated weight. In Figure 4 some of the symbols and weights most often used in QFD literature are presented:
Figure 4 - Different QFD symbols and weights
(a) Mizuno & Akao [45] (b) Eriksson et al. [18] (c) Conti [14] (d) QFD/Capture Software [40] (e) Hrones Jr et al.[26] (f) Hauser & Clausing [23]
In various quality models and case studies, the authors tend to design their own sets of weights, thereby making comparisons difficult across case studies. Because of the large awareness of QFD , the mapping to the QFD
5 22 - 2 -Error! Unknown switch argument.
weights and symbols with ISO/IEC 14598-1 standard [33] is illustrated in Figure 5 (as in Figure 9).
Mark QF2D Symbol Rating Global Rating
3 l Excellent 2 ¥ Good Satisfactory 1 m Fair 0 Blank Poor / Absent Unsatisfactory
Figure 5 – QF2D symbols and weights
This matrix approach in QFD represents a good communication tool: it allows for a balanced consideration of requirements and provides a mechanism to communicate implicit knowledge throughout the organisation. But is the means and not the end: the real value is in the sharing of communication and decision-making of information and priorities among people of the numerous functional departments involved in product development, from Marketing to Product Support. QFD helps development personnel in maintaining the correct focus on most relevant requirements, minimising the misunderstanding of the customer needs. For these reasons, QFD represents an effective communication and quality-planning tool [23]. For example, QFD has been used in the manufacturing industry with great achievements, leading to significant reductions in overall project costs (e.g. 50%), project cycle time (e.g. 33%) and major increases in productivity (e.g. 200%) [21]. During the ‘80s this method was experimented in software development environment, and was referred to as Software QFD (SQFD): SQFD [22] is an adaptation of the HoQ scheme, considering the Technical Product Specifications as the HOWs of the matrix. A peculiarity is that SQFD does not use the “roof” of the House (the “Correlation Matrix” in Figure 2) that shows positive and negative relationships among the HOWs, since here the major focus in on processes. Figure 5 shows a basic SQFD model structure4.
Figure 6 - Basic SQFD model [22]
Some of the QFD adaptations for the software field are listed next:: • The Distributed QFD (DQFD) [4, 26] by Digital Equipment Corporation (DEC): a tailored version in
1992, optimised for local and global groups involved in defining product requirements,; • Zultner Project QFD: an “essential minimum method to identify high-value needs, product characteristics
and project tasks, quickly” [46]. His main focus is on shortening project schedules by a more efficient risk management using well-known quality tools through the application of the Theory of Constraints by E.M. Goldratt;
• Eriksson, McFadden and Tittanen [18] study on the need to join process and product analysis to check whether the user requirements concerning both the product and the project issues were correctly determined and to get the customers’ acceptance of these points;
• Richardson [41, 42] QFD-based model: a tool to aid the implementation of a Software Process Improvement (SPI) action plan for SMEs, using Bootstrap as the reference SPI model. SPI/HoQ is the name of this HoQ that gives the organisation the full list of priorities to follow to reach greatest improvement in their software processes;
• The “Matrix of Change” (MoC) project by the Massachusetts Institute of Technology [6, 44], which shares
4 Another application of QFD to Software Engineering is presented in [35], in particular for the Software Requirement selection.
6 22 - 2 -Error! Unknown switch argument.
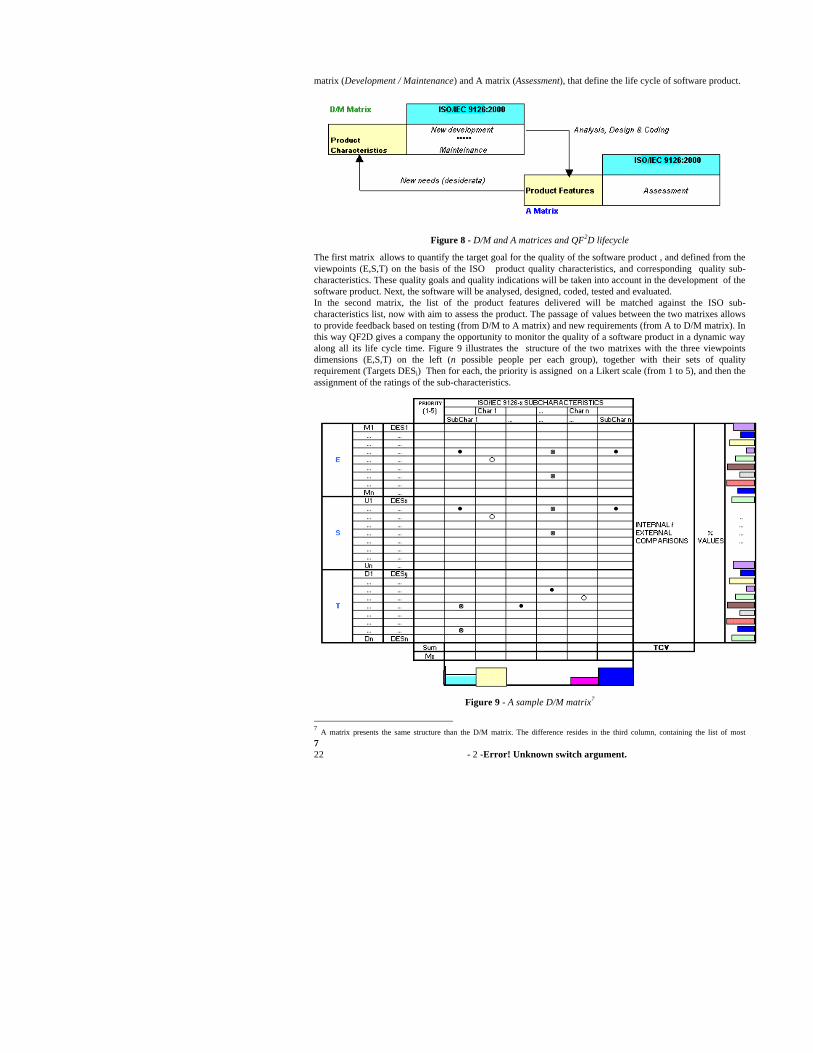
similarities with Richardson’s model. This MoC can help managers identify critical interactions among processes, providing useful guidelines for Change Management5.
Figure 7 - The SPI/HoQ matrix cascade
4. QF2D: description and advantages
As introduced in Section 1, for software Quality Management field there could be significant benefits in software to use some of the same methodologies and techniques, such as QFD’ developed in the manufacturing field.. This lead to the redesign of our Quality Factor through the use of the Quality Function Deployment, joining the two into the QF2D (Quality Factor through QFD); note that the procedure to compile the HoQ matrices is similar to the one in QFD. As a reminder, the original QF technique allows the integration of different opinions and ratings from several organisational viewpoints to obtain a single and final quality value; however, any source data and intermediate results are of course not explicitly available in the consolidated final quality figure. A manager could need, first of all, an overall index value of quality and then, multiple levels of details to understand the relationships across the multiple variables, that is he will then need to access all sources of data for each different perspectives. Several level of analysis can be taken into account, with respect to the aim of evaluation and the level of granularity desired. Such a weakness in the initial design of QF will be eliminated with the introduction of the key concepts of HoQ and its related matrices for traceability of intermediate results and calculations. The following features from QF have been implemented in this new version of QF2D : • multi-perspective evaluation (E, S, T) of software quality; • evaluation of QF on a percentage scale in order to obtain an immediate/intuitive understanding of results; • usage of the ISO/IEC 9126 and 14598 series for software quality attributes and evaluation. The following features from the HoQ usage have been implemented in the new version of QF2D: • implementation not only for the assessment phase but also for the development / maintenance phases; • simplification of the QF method; • summarisation of all data in one table; • usage of histograms to prioritise in a visual way most relevant sub-characteristics and requirements-
features of the products to be evaluated. In addition, while QF was using the 1991 version of ISO 9126, it has been updated in QF2D with the 2000 version of this standard6, which means that its basis has increased from 21 to 31 quality sub-characteristics (this of course implies that there will be no direct convertibility across results from QF and QF2D). It must be stressed that QF2D represents an extension of the original idea and how the new structure, based on a variable number of the quality requirements of the software product (in D/M matrix) or of the quality of implemented features (in A matrix). Figure 8 illustrates the structure of the two matrixes of QF2D, the D/M 5 As already said, QFD methodology is more than the HoQ, since it incorporates a lot of tools as the Voice of the Customer Table, Affinity and Tree-diagrams, comparisons in pairs, Pareto Analysis etc. in order to analyse customer needs and satisfaction, gathering and examining market information etc. This reasoning has been put in the majority of QFD software tools. [25] lists the most used ones, determining at all the characteristics of the “perfect” QFD software tool. It follows a typical result screen from the QFD/CAPTURE tool [40]. Another software product to consider in addition to this starting list is GFP (Governo dei Flussi dei Processi), described in [13, 14]. 6 It must be noted that the new 9126 series has as a main input for part 4 the ISO 9241-11 standard, providing guidance on usability aspects.
7 22 - 2 -Error! Unknown switch argument.
matrix (Development / Maintenance) and A matrix (Assessment), that define the life cycle of software product.
Figure 8 - D/M and A matrices and QF2D lifecycle
The first matrix allows to quantify the target goal for the quality of the software product , and defined from the viewpoints (E,S,T) on the basis of the ISO product quality characteristics, and corresponding quality sub-characteristics. These quality goals and quality indications will be taken into account in the development of the software product. Next, the software will be analysed, designed, coded, tested and evaluated. In the second matrix, the list of the product features delivered will be matched against the ISO sub-characteristics list, now with aim to assess the product. The passage of values between the two matrixes allows to provide feedback based on testing (from D/M to A matrix) and new requirements (from A to D/M matrix). In this way QF2D gives a company the opportunity to monitor the quality of a software product in a dynamic way along all its life cycle time. Figure 9 illustrates the structure of the two matrixes with the three viewpoints dimensions (E,S,T) on the left (n possible people per each group), together with their sets of quality requirement (Targets DESi) Then for each, the priority is assigned on a Likert scale (from 1 to 5), and then the assignment of the ratings of the sub-characteristics.
Figure 9 - A sample D/M matrix7
7 A matrix presents the same structure than the D/M matrix. The difference resides in the third column, containing the list of most
8 22 - 2 -Error! Unknown switch argument.
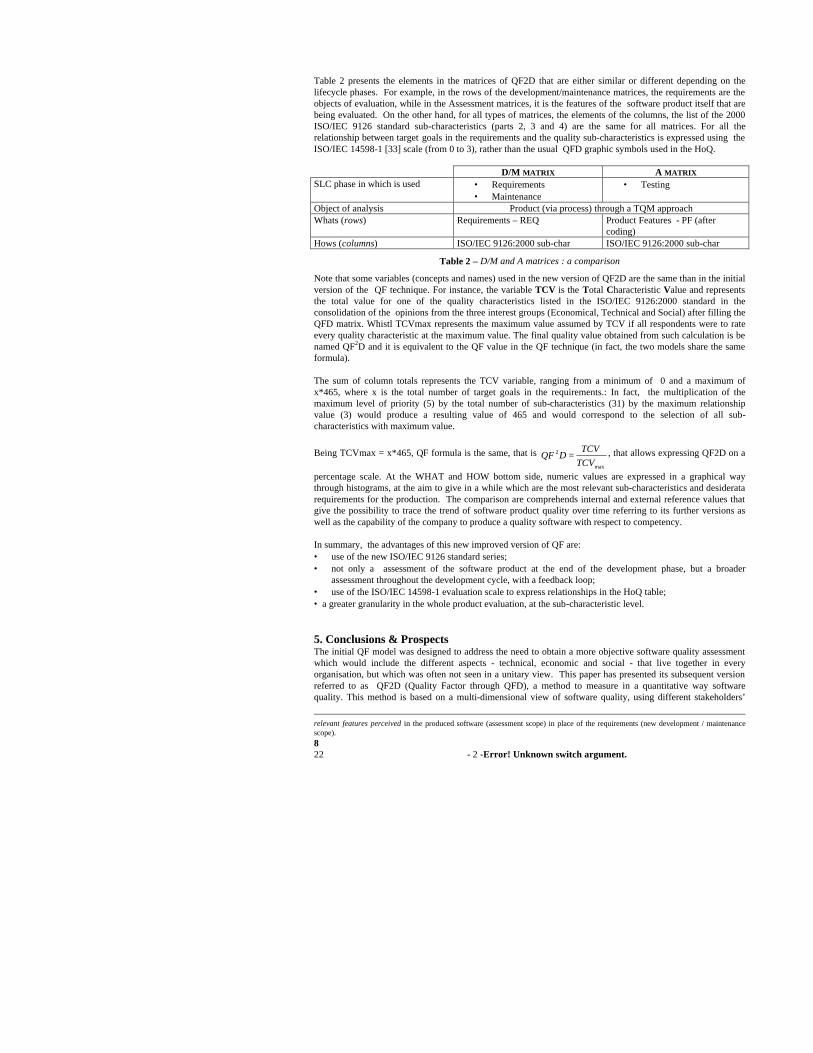
Table 2 presents the elements in the matrices of QF2D that are either similar or different depending on the lifecycle phases. For example, in the rows of the development/maintenance matrices, the requirements are the objects of evaluation, while in the Assessment matrices, it is the features of the software product itself that are being evaluated. On the other hand, for all types of matrices, the elements of the columns, the list of the 2000 ISO/IEC 9126 standard sub-characteristics (parts 2, 3 and 4) are the same for all matrices. For all the relationship between target goals in the requirements and the quality sub-characteristics is expressed using the ISO/IEC 14598-1 [33] scale (from 0 to 3), rather than the usual QFD graphic symbols used in the HoQ.
D/M MATRIX A MATRIX SLC phase in which is used • Requirements
• Maintenance • Testing
Object of analysis Product (via process) through a TQM approach Whats (rows) Requirements – REQ Product Features - PF (after
coding) Hows (columns) ISO/IEC 9126:2000 sub-char ISO/IEC 9126:2000 sub-char
Table 2 – D/M and A matrices : a comparison
Note that some variables (concepts and names) used in the new version of QF2D are the same than in the initial version of the QF technique. For instance, the variable TCV is the Total Characteristic Value and represents the total value for one of the quality characteristics listed in the ISO/IEC 9126:2000 standard in the consolidation of the opinions from the three interest groups (Economical, Technical and Social) after filling the QFD matrix. Whistl TCVmax represents the maximum value assumed by TCV if all respondents were to rate every quality characteristic at the maximum value. The final quality value obtained from such calculation is be named QF2D and it is equivalent to the QF value in the QF technique (in fact, the two models share the same formula). The sum of column totals represents the TCV variable, ranging from a minimum of 0 and a maximum of x*465, where x is the total number of target goals in the requirements.: In fact, the multiplication of the maximum level of priority (5) by the total number of sub-characteristics (31) by the maximum relationship value (3) would produce a resulting value of 465 and would correspond to the selection of all sub-characteristics with maximum value.
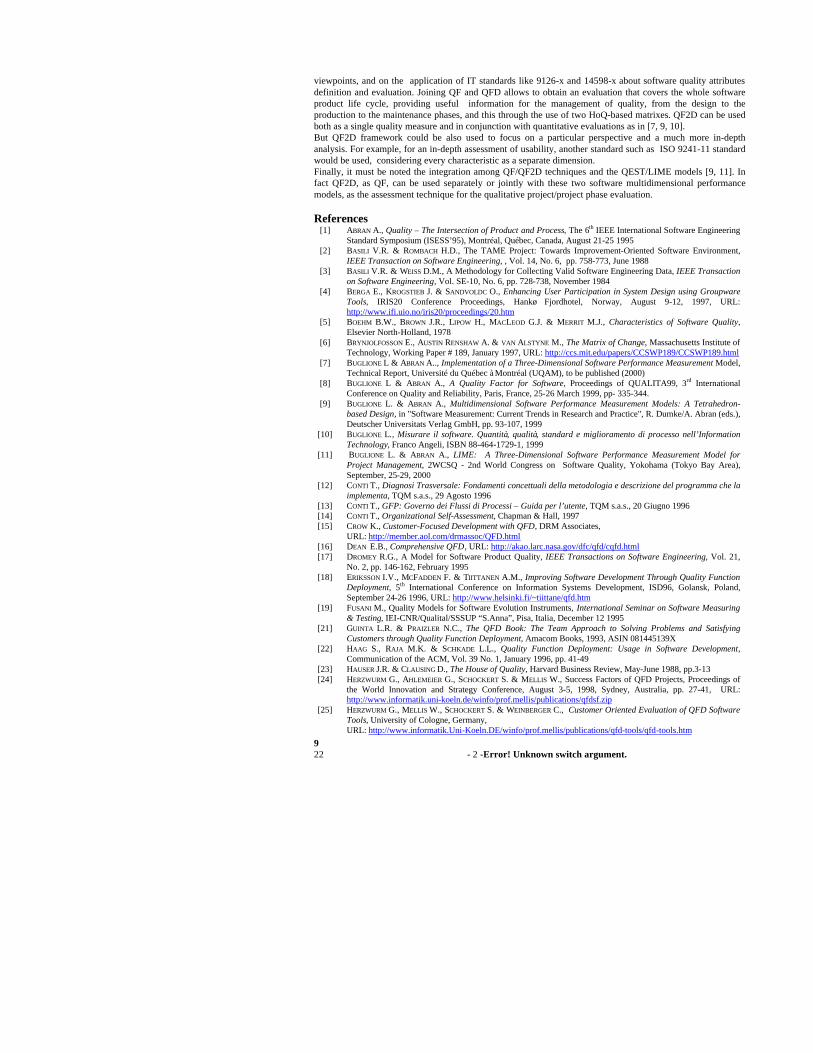
Being TCVmax = x*465, QF formula is the same, that is max
2
TCV
TCVDQF = , that allows expressing QF2D on a
percentage scale. At the WHAT and HOW bottom side, numeric values are expressed in a graphical way through histograms, at the aim to give in a while which are the most relevant sub-characteristics and desiderata requirements for the production. The comparison are comprehends internal and external reference values that give the possibility to trace the trend of software product quality over time referring to its further versions as well as the capability of the company to produce a quality software with respect to competency. In summary, the advantages of this new improved version of QF are: • use of the new ISO/IEC 9126 standard series; • not only a assessment of the software product at the end of the development phase, but a broader
assessment throughout the development cycle, with a feedback loop; • use of the ISO/IEC 14598-1 evaluation scale to express relationships in the HoQ table; • a greater granularity in the whole product evaluation, at the sub-characteristic level. 5. Conclusions & Prospects The initial QF model was designed to address the need to obtain a more objective software quality assessment which would include the different aspects - technical, economic and social - that live together in every organisation, but which was often not seen in a unitary view. This paper has presented its subsequent version referred to as QF2D (Quality Factor through QFD), a method to measure in a quantitative way software quality. This method is based on a multi-dimensional view of software quality, using different stakeholders’
relevant features perceived in the produced software (assessment scope) in place of the requirements (new development / maintenance scope).
9 22 - 2 -Error! Unknown switch argument.
viewpoints, and on the application of IT standards like 9126-x and 14598-x about software quality attributes definition and evaluation. Joining QF and QFD allows to obtain an evaluation that covers the whole software product life cycle, providing useful information for the management of quality, from the design to the production to the maintenance phases, and this through the use of two HoQ-based matrixes. QF2D can be used both as a single quality measure and in conjunction with quantitative evaluations as in [7, 9, 10]. But QF2D framework could be also used to focus on a particular perspective and a much more in-depth analysis. For example, for an in-depth assessment of usability, another standard such as ISO 9241-11 standard would be used, considering every characteristic as a separate dimension. Finally, it must be noted the integration among QF/QF2D techniques and the QEST/LIME models [9, 11]. In fact QF2D, as QF, can be used separately or jointly with these two software multidimensional performance models, as the assessment technique for the qualitative project/project phase evaluation. References
[1] ABRAN A., Quality – The Intersection of Product and Process, The 6th IEEE International Software Engineering Standard Symposium (ISESS’95), Montréal, Québec, Canada, August 21-25 1995
[2] BASILI V.R. & ROMBACH H.D., The TAME Project: Towards Improvement-Oriented Software Environment, IEEE Transaction on Software Engineering, , Vol. 14, No. 6, pp. 758-773, June 1988
[3] BASILI V.R. & WEISS D.M., A Methodology for Collecting Valid Software Engineering Data, IEEE Transaction on Software Engineering, Vol. SE-10, No. 6, pp. 728-738, November 1984
[4] BERGA E., KROGSTIEB J. & SANDVOLDC O., Enhancing User Participation in System Design using Groupware Tools, IRIS20 Conference Proceedings, Hankø Fjordhotel, Norway, August 9-12, 1997, URL: http://www.ifi.uio.no/iris20/proceedings/20.htm
[5] BOEHM B.W., BROWN J.R., LIPOW H., MACLEOD G.J. & MERRIT M.J., Characteristics of Software Quality, Elsevier North-Holland, 1978
[6] BRYNJOLFOSSON E., AUSTIN RENSHAW A. & VAN ALSTYNE M., The Matrix of Change, Massachusetts Institute of Technology, Working Paper # 189, January 1997, URL: http://ccs.mit.edu/papers/CCSWP189/CCSWP189.html
[7] BUGLIONE L & ABRAN A.., Implementation of a Three-Dimensional Software Performance Measurement Model, Technical Report, Université du Québec à Montréal (UQAM), to be published (2000)
[8] BUGLIONE L & ABRAN A., A Quality Factor for Software, Proceedings of QUALITA99, 3rd International Conference on Quality and Reliability, Paris, France, 25-26 March 1999, pp- 335-344.
[9] BUGLIONE L. & ABRAN A., Multidimensional Software Performance Measurement Models: A Tetrahedron-based Design, in "Software Measurement: Current Trends in Research and Practice", R. Dumke/A. Abran (eds.), Deutscher Universitats Verlag GmbH, pp. 93-107, 1999
[10] BUGLIONE L., Misurare il software. Quantità, qualità, standard e miglioramento di processo nell’Information Technology, Franco Angeli, ISBN 88-464-1729-1, 1999
[11] BUGLIONE L. & ABRAN A., LIME: A Three-Dimensional Software Performance Measurement Model for Project Management, 2WCSQ - 2nd World Congress on Software Quality, Yokohama (Tokyo Bay Area), September, 25-29, 2000
[12] CONTI T., Diagnosi Trasversale: Fondamenti concettuali della metodologia e descrizione del programma che la implementa, TQM s.a.s., 29 Agosto 1996
[13] CONTI T., GFP: Governo dei Flussi di Processi – Guida per l’utente, TQM s.a.s., 20 Giugno 1996 [14] CONTI T., Organizational Self-Assessment, Chapman & Hall, 1997 [15] CROW K., Customer-Focused Development with QFD, DRM Associates,
URL: http://member.aol.com/drmassoc/QFD.html [16] DEAN E.B., Comprehensive QFD, URL: http://akao.larc.nasa.gov/dfc/qfd/cqfd.html [17] DROMEY R.G., A Model for Software Product Quality, IEEE Transactions on Software Engineering, Vol. 21,
No. 2, pp. 146-162, February 1995 [18] ERIKSSON I.V., MCFADDEN F. & TIITTANEN A.M., Improving Software Development Through Quality Function
Deployment, 5th International Conference on Information Systems Development, ISD96, Golansk, Poland, September 24-26 1996, URL: http://www.helsinki.fi/~tiittane/qfd.htm
[19] FUSANI M., Quality Models for Software Evolution Instruments, International Seminar on Software Measuring & Testing, IEI-CNR/Qualital/SSSUP “S.Anna”, Pisa, Italia, December 12 1995
[21] GUINTA L.R. & PRAIZLER N.C., The QFD Book: The Team Approach to Solving Problems and Satisfying Customers through Quality Function Deployment, Amacom Books, 1993, ASIN 081445139X
[22] HAAG S., RAJA M.K. & SCHKADE L.L., Quality Function Deployment: Usage in Software Development, Communication of the ACM, Vol. 39 No. 1, January 1996, pp. 41-49
[23] HAUSER J.R. & CLAUSING D., The House of Quality, Harvard Business Review, May-June 1988, pp.3-13 [24] HERZWURM G., AHLEMEIER G., SCHOCKERT S. & MELLIS W., Success Factors of QFD Projects, Proceedings of
the World Innovation and Strategy Conference, August 3-5, 1998, Sydney, Australia, pp. 27-41, URL: http://www.informatik.uni-koeln.de/winfo/prof.mellis/publications/qfdsf.zip
[25] HERZWURM G., MELLIS W., SCHOCKERT S. & WEINBERGER C., Customer Oriented Evaluation of QFD Software Tools, University of Cologne, Germany, URL: http://www.informatik.Uni-Koeln.DE/winfo/prof.mellis/publications/qfd-tools/qfd-tools.htm
10 22 - 2 -Error! Unknown switch argument.
[26] HRONES JR. J.A., JEDREY JR. B.C. & ZAAF D., Defining Global Requirements with Distributed QFD, Digital Technical Journal, Vol. 5 No.4, Fall 1993
[27] IEEE, Std 1061-1992: Standard for a Software Quality Metrics Methodology, 1992 [28] ISO, International Standard 8402: Quality - Vocabulary, 1986 [34] ISO/IEC, International Standard 9126: Information Technology - Software product evaluation – Quality
characteristics and guidelines for their use (1991) [32] ISO/IEC JTC1/SC7/WG6 FDIS 9126-1: Software Engineering Product Quality - Part 1: Quality Model,
N2228, 19/11/1999 [30] ISO/IEC JTC1/SC7/WG6 PDTR 9126-2: Software Engineering Product Quality - Part 2: External Metrics,
N2263, 31/01/2000 [31] ISO/IEC JTC1/SC7/WG6 PDTR 9126-3: Software Engineering Product Quality - Part 3: Internal Metrics,
N2265, 31/01/2000 [29] ISO/IEC JTC1/SC7/WG6 PDTR 9126-4: Software Engineering Product Quality - Part 4: Quality in Use
Metrics, N2268, 02/02/2000 [33] ISO/IEC JTC1/SC7/WG6, DIS 14598-1: Information Technology - Software product evaluation – Part 1:
General Overview, 3/6/97 [35] KARLSSON J., Towards a Strategy for Software Requirement Selection, Department of Computer and Information
Science, University of Linköping, Sweden, Thesis, 1995 [36] MCCALL J.A., RICHARDS P.K. & WALTERS G.F., Factors in Software Quality, Voll. I, II, III: Final Tech.
Report, RADC-TR-77-369, Rome Air Development Center, Air Force System Command, Griffiss Air Force Base, NY, 1977
[37] NATALE D., Qualità e quantità nei sistemi software: teoria ed esperienze , Franco Angeli Informatica, 1995 [38] OUYANG S., FAI J., WANG Q. & JOHNSON K., Quality Function Deployment, Technical Report, University of
Calgary, Alberta, Canada, URL: http://www.cpsc.ucalgary.ca/~johnsonk/SENG/SENG613/Project/report.htm [39] PRESSMAN R., Software Engineering: a beginner's guide, McGraw Hill, 1988 [40] QFD/CAPTURE HOMEPAGE (http://www.qfdcapture.com) [41] RICHARDSON I., Quality Function Deployment: A Software Process Tool?, 3rd Annual International QFD
Symposium, Linkoping, Sweden, October 1997, URL: http://www.csis.ul.ie/staff/ItaRichardson/intlqfd.htm
[42] RICHARDSON I., Using QFD to Develop Action Plans for Software Process Improvement, SEPG98 Conference Proceedings, April 1998
[43] SORLI M. & RUIZ J., QFD: una herramienta de futuro, Labein, 1994 [44] The Matrix of Change (MOC) Homepage, http://ccs.mit.edu/moc/ [45] VV.AA., QFD: The customer-driven approach to Quality Planning and Deployment, S.Mizuno &Y.Akao
(Eds.), APD, 1994 [46] ZULTNER R.E., Blitz QFD: Better, Faster and Cheaper Forms of QFD, American Programmer, Vol. 8, October
1995, pp. 24-36