Push Factors, Household Support & Effects of Communal land
17
Push Factors, Household Support and Effects of Communal Land Distribution, EJSS Vol. 5, No. 1, May, 2019. 1 Push Factors, Household Support and Effects of Communal Land Distribution in Gozamin Distric, Ethiopia Ermiyas Derseh 1 and Mehretie Belay 2 Abstract Nowadays, communal land distribution (CLD) in Ethiopia causes complaints in rural areas. This study describes the push factors, household support and effects of CLD in Gozamin district, Ethiopia. Data were gathered using questionnaires, focus groups, interviews and observations. Descriptive and inferential statistics were used in data analysis. Youth unemployment, farmland shortage, land laws, illegal encroachments and awareness gaps were identified as main drivers of CLD. Support to CLD was found significantly differing with sex, age, farmland, livestock, income and dependency levels of household groups. Youth employment opportunity was the positive effect of CLDs. Rising farmer conflicts, contraction of indigenous wildlife and grazing pastures, decline of livestock products and tenure insecurity were adverse impacts of CLDs. It is suggested that land laws promoting CLD be revised to reduce encroachments and conflicts. Alternative employment, livestock feeding and fuel options should be introduced to minimize farmland shortages and the pressure on communal resources. Keywords: Communal lands, Land allocation, Push factors, Household support, Effects, Ethiopia 1. Introduction 1.1. The Conception of Land as a Fixed Physical Asset Land is one of the main factors of production and a major source of asset (basis of material wealth) in both rural and urban areas of the world (Zerga, 2016). It is the primary means of production to generate the income required for the livelihood of a family. Evidence from literature reveals that land in developing countries in general, and in sub-Saharan Africa (SSA) in particular, forms among the main sources of livelihood to the majority of the people. Policy 1 Corresponding Author Department of Geography and Environmental Studies Debremarkos University Ethiopia 2 Department of Geography and Environmental Studies Bahirdar University Ethiopia Email: [email protected]
-
Upload
khangminh22 -
Category
Documents
-
view
1 -
download
0
Transcript of Push Factors, Household Support & Effects of Communal land

Push Factors, Household Support and Effects of Communal Land Distribution, EJSS Vol. 5, No. 1, May, 2019.
1
Push Factors, Household Support and Effects of Communal Land Distribution in Gozamin Distric, Ethiopia
Ermiyas Derseh1 and Mehretie Belay2
Abstract
Nowadays, communal land distribution (CLD) in Ethiopia causes complaints in rural areas. This study describes the push factors, household support and effects of CLD in Gozamin district, Ethiopia. Data were gathered using questionnaires, focus groups, interviews and observations. Descriptive and inferential statistics were used in data analysis. Youth unemployment, farmland shortage, land laws, illegal encroachments and awareness gaps were identified as main drivers of CLD. Support to CLD was found significantly differing with sex, age, farmland, livestock, income and dependency levels of household groups. Youth employment opportunity was the positive effect of CLDs. Rising farmer conflicts, contraction of indigenous wildlife and grazing pastures, decline of livestock products and tenure insecurity were adverse impacts of CLDs. It is suggested that land laws promoting CLD be revised to reduce encroachments and conflicts. Alternative employment, livestock feeding and fuel options should be introduced to minimize farmland shortages and the pressure on communal resources.
Keywords: Communal lands, Land allocation, Push factors, Household support, Effects, Ethiopia
1. Introduction
1.1. The Conception of Land as a Fixed Physical Asset
Land is one of the main factors of production and a major source of asset (basis of material wealth) in both rural and urban areas of the world (Zerga, 2016). It is the primary means of production to generate the income required for the livelihood of a family. Evidence from literature reveals that land in developing countries in general, and in sub-Saharan Africa (SSA) in particular, forms among the main sources of livelihood to the majority of the people. Policy
1 Corresponding Author Department of Geography and Environmental Studies Debremarkos University Ethiopia 2 Department of Geography and Environmental Studies Bahirdar University Ethiopia Email: [email protected]

Push Factors, Household Support and Effects of Communal Land Distribution, EJSS Vol. 5, No. 1, May, 2019.
2
related to land in these countries is thus considered as the crucial part of the overall development that governments need to stress on for rapid economic growth and poverty alleviation (Grover and Anteneh, 2006).
Similar to other developing countries, land as a fixed physical asset holds important place in both the political and socio-economic spheres of the community in Ethiopia (Belay et al., 2017). Particularly in rural areas, land not only plays the role of a physical agricultural property; its ownership has rather a priceless spiritual worth. Hence, it draws significant socio-economic, cultural and political attention from the government and the entire community of the country. That explains the emphasis given to the issue of land in the 1995 constitution. The Derg’s 1975 land to the tiller proclamation № 31 (Zerga, 2016; Nega et al., 2003) and the explicit articulation regarding the land issue in the 1995 constitution are signals of the economic and political importance of land in Ethiopia (Gebreselassie, 2006). Article 40/3 (FDRE, 1995) of the 1995 Constitution declares that all land is the property of the state and that it cannot be sold or exchanged. This constitution (Article 40/4) grants Ethiopian farmers the right to hold land free of charge. Nevertheless, it provides only usufruct rights; it does not include the right to sell or exchange the land. Transfers and exchanges of land among the community are therefore limited due to the constitutional restrictions.
Following the 1975 land reform and the 1995 constitution, farmland parcels have been extremely fragmented in Ethiopia due to repeated land redistributions. The successive land redistributions were induced by the rapidly increasing populations, severe land degradation, low land productivity and limited use of agricultural technology (Alemu, 2011; USAID, 2009; Abab & Monchuk, 2018). These factors not only cause diminution of plots but also result in the scarcity of agricultural lands among the rural community. Thus today, many landless households (HHs) are emerging in greater numbers in the rural villages of the country due to farmland shortages (e.g. see Belay et al., 2017). For instance, in Bodurtha et al. (2011), 43% of the rural people in Ethiopia are reported landless and land-poor. The Amhara National Regional State (ANRS) Land Registration and Certification (LRC) Report (ANRS, 2010) indicated that landlessness especially among the youth is a serious growing problem in the countryside. In a study conducted in three lower government units in the northwestern highlands of Ethiopia (Belay and Bewket, 2013a, b, 2015; Belay et al., in 2017), 99 young people aged 18 years and above were found landless within 201 HHs (indicating ≈ one dependent landless youngster per two HHs). The same study reported that 14% of the 201 HHs were landless in addition to the 99 dependent young people.
During the past decades, the land shortages and landlessness problems such as those mentioned above were addressed through periodic land redistributions. Recently however, it is found difficult to ease the problem of farmland shortage through redistribution of available parcels for it causes more fragmentation. Due to this, nowadays provding agricultural land to the landless farmers especially to the youth has become a critical agenda for local administrations in rural Ethiopia. Hence, the only option implemented by most of the governments in rural Ethiopia to solve the land shortage problem is diverted to the allocation of communal lands (CLs) to the landless HHs and to emerging youth population. For instance, communally owned forest, bush and grasslands previously used for livestock grazing were distributed to the youth by local governments to partially stabilize the growing land demands (e.g. see Belay et al., 2017; Abab & Monchuk, 2018). The allocation of such communally owned lands in fact has played significant role to minimize the land shortage constraints. However, the massive distribution of these

Push Factors, Household Support and Effects of Communal Land Distribution, EJSS Vol. 5, No. 1, May, 2019.
3
resources causes serious social conflicts, contraction of pasture fields and livestock feed shortages in the rural communities. During the CL allocation, pasture fields are often converted into crop farms. This leads to livestock feed shortages and a decline in agricultural productivity as is observed in northwest and southern parts of Ethiopia. Communal land distribution (CLD) may sometimes also agitate the surrounding farmers to encroach into the marginal wastelands that may in turn result in the vicious circle of land mismanagement (Bezu and Holden, 2014a, b; Belay et al., 2017).
1.2. Communal Lands (CLs)
Wily (2018) considers lands owned and managed by indigenous and rural people as CLs. According to this author, the global size of CL estates managed and used by about 2.5-3 billion community landholder inhabitants is greater than 6 billion ha. In his Global CL study, Wily (2018) identified that 55% of the world countries have strong legal access to community landholding schemes in contrast to other 17% world countries without such legal provisions. Another 18 and 10% of the world countries were also identified as having weak and very weak legal access to community landholdings, respectively. Ethiopia belongs to the category of countries with weak legal framework for community landholding in Wily’s (2018) study.
The Ethiopian land law, proclamation № 456/2005/12 (FDRE, 2005) defines communal landholdings as rural lands provided by government to the local community for mutual grazing, forestry and other ecological services. Conversely, the Amhara Region Proclamation N0 133/2006:2/5 (ANRS, 2006) defines communal landholdings as the rural land not owned by the government or private holders offering a common service to the local people for grazing, forestry and other ecological functions.
According to EPA (2003), the mixed-crop-livestock system in the mid-and-high altitude areas of Ethiopia comprise around 57,000 km2 rangelands. The lowland pastoral areas on the other hand have about 500,000 km2. These CLs are largely controlled by informal indigenous management systems. Yeraswork (2001) in his study of the Wollo highlands stated that grazing lands and other communal resources have been sustained by the supervision of informal institutions although their physical attributes (unsuitability for cultivation) might have also contributed for their existence. This indicates that the formal CL management in Ethiopia is somewhat meager. Wily (2018) identified that the Ethiopian legal access to community landholding management is quite weak. A study conducted in 98 villages in the north-central highlands of Ethiopia (Benin and Pender, 2002) indicate that the restricted village level CL management has contributed to the alleviation of livestock feed shortages.
Although Ethiopia holds 1,104,300 km2 area (with ≈13.19% arable, 1% water and 18.6% protected area cover) (USAID, 2009) and (≈11, 4 & 6% grazing, fallow & woodlands) in 2013/2014 (CSA, 2014) the CLs are highly affected by large livestock pressure and increased resource exploitation. The natural communal grazing lands are about 80-85% of the primary feed sources for the large livestock population (Gebremedhin et al., 2002; Alemayehu, 2003) and they are frequently encroached by the subsistent farmers. This implies that communal grazing lands are the patrons of mixed agriculture; they directly influence the livestock sector and indirectly crop production through their influence on soil productivity. The increased pressures driven by human actions on the aforementioned resources can accelerate a widespread land cover change

Push Factors, Household Support and Effects of Communal Land Distribution, EJSS Vol. 5, No. 1, May, 2019.
4
that may impact humans (Agarwal et al., 2002) and their socio-economic patterns. The dynamics in turn can alter the availability of varied biophysical resources including soil, vegetation, water, animal feed stocks, and economic and social amenities. Consequently, the land use/ land cover dynamics could lead to a decreased availability of different products and services for humans, livestock and agricultural production and damage to the environment as well.
In this study, CLs are operationally defined as grassed wastelands occupying riversides, forested hill-slopes and ridge sides collectively owned, managed and used by the immediate local community for various purposes. Thus, it is these specific CLs that are the targets of this study. In the study area, these lands are extensively allocated and distributed to landless households. This often provokes complaints from the local community; implying that there are adverse effects. The aforementioned studies (e. g. Benin and Pender, 2002; Gebremedhin et al., 2002; Alemayehu, 2003; Alemu, 1999, 2011; Nega et al., 2003; Gebreselassie, 2006; Bodurtha et al.; 2011; Bezu and Holden, 2014a; Zerga, 2016; Belay et al., 2017; Abab & Monchuk, 2018) focus on livestock feed sources, land tenure, youth land access and on land contracts. The push factors, HH support and effect of CLD is thus become the main focus of this study.
This paper examines the push factors, HHs’ support and effect of CLD in Gozamin district, in the northwestern highlands of Ethiopia.
2. The Study Area and Research Methods
2.1. Description of the Study Area
The study was conducted in Gozamin district which is located between 10˚01'46'' and 10˚35'12'' North latitude and 37˚23'45'' and 37˚55'52'' East longitude (Figure 1).The district comprises of one urban and 25 rural kebele administrations (RKAs)3 and covers a total area of 116,288 ha (Gozamin District Agriculture and Rural Development Office/GDARDO, 2012). Its altitude ranges from 800-3,800 meters above mean sea level. According to GDARDO (2012), the agro-ecology of the district is classified as: 16% Kola (tropical), 74% Woyna-Dega (sub-tropical), 9% Dega (temperate), and 1% Wurch (cool temperate). The temperature of the district ranges from 11- 25 0C with mean annual rainfall of 1448 and 1808 mm. The area is drained by 31 permanent streams and 206 springs. There are also 7,241 hand-dug wells in the district. The most dominant soil types of the district include Nitosols, Vertisols and Cambisols whilst Pheazomes, Acrisols and Leptosols are associate soil types in different parts of the district (GDARDO, 2012).
The estimated mid-year population of the district in July 2016 was 155,012 persons (CSA, 2013). From these 76,914 were males and 78,098 females of which 97.1% lived in rural areas and the rest 2.9% in towns.
From the total area of the district, cultivated land covers 46,952 ha (40.38%), grazing land 18,276 ha (15.72%), natural forests and shrubs 20,659 ha (17.77%), forest cover 704ha (0.60%), built up area 1526 ha (1.31%) and other land uses cover 28,171 ha (24.22 %) (GDEPLAUO,
3 Lower government units in Ethiopia

Push Factors, Household Support and Effects of Communal Land Distribution, EJSS Vol. 5, No. 1, May, 2019.
5
2012). Mixed agriculture is the conventional and major economic sources of livelihood in the district where crop production and livestock rearing are undertaken in an integrated manner by the rural HHs. The cropping system is both rainfed and irrigation. Cereals - Teff (Eragrostis tef), Wheat (Triticum spp.), Maize (Zea mays), Barley (Hordium spp.) and oil seeds – such as Sesame (Sesamum indicum) are dominantly grown in the area. Of the total 46,952 ha cultivated land, 11,846 ha is irrigated during the dry season by using 274 motor and 137 pedal pumps and seven drip irrigation systems (GDARDO, 2012). Crop production is strongly dependent on animals for both draught power and manure. The livestock in the district is composed of cattle, equines, sheep, goats, and poultry, and this subsector contributes to crop production via the provision of draught power, manure, and transportation services.
Figure 1 Map of the study area (Adapted from Ethio-GIS, 2007)
2.2. Research Methods
2.2.1. Research design and sampling
The study followed the mixed methods research design involving the concurrent acquisition and analysis of both quantitative and qualitative data.
A two stage sampling was adopted to determine the sample RKAs and target HHs. First, three RKAs (two from Woyna-Dega and one from Dega) were purposively identified taking into consideration transport accessibility, time and budget availability. These sample RKAs from which sample HHs were identified were Enerata, Leklekita and Shebalima (Figure 1) constituting 1,168; 557; and 1,012 HHs, respectively (Table 1). Then finally, 132 sample HHs

Push Factors, Household Support and Effects of Communal Land Distribution, EJSS Vol. 5, No. 1, May, 2019.
6
(56 from Enerata, 27 from Leklekita and 49 from Shebalima) were proportionally selected through systematic sampling procedure (Table 1). Sample units (list of HH heads from which the sample respondents are drawn) were obtained from the RKA offices.
Fifteen Key informants (five from each RKA) and 24 elders (eight from each RKA) were also purposively identified for in-depth interviews and FGDs, respectively. These samples were selected from agricultural experts, community elders, RKA leaders, Development Agents (DAs), and from members of the social courts.
Table 1 Total and sample HHs by the study RKAs
RKA
Total HHs *
Sample HHs № %
Enerata 1,168 56 42 Leklekita 557 27 20 Shembalima 1,012 49 38 Total 2,737 132 100
*Source: RKA offices (March, 2015)
2.2.2. Data sources and instruments
Data for the study were collected from both primary and secondary sources. The primary data were gathered using HH questionnaire surveys; key informant interviews (KIIs), focus group discussions (FGDs), and field observations.
Structured questions focusing on demographic, socioeconomic and CLD issues were organized for questionnaire survey. The instrument was then pre-tested using a pilot survey of 10 HHs. Based on the feedback from the pre-test improvements were made on the instrument before it was finally administered to the 132 sample HHs by three DAs working in the area from February to May 2015.
KIIs and FGDs were undertaken parallel to the survey to generate qualitative data. The sessions were facilitated by the principal researcher. Field observations were also conducted to triangulate and enhance the reliability of the information obtained from different sources.
The secondary data were gathered from both published and unpublished documents accessed from different government offices, internet sources, books, office reports and archives.
2.2.3. Data analysis methods
Data were analyzed using both quantitative and qualitative methods. Once checked for its accuracy and completeness, the quantitative data were encoded into the Statistical Package of the Social Scientists (SPSS, version 20) and then analyzed by descriptive statistical analysis and the Chi-square test and independent samples T-test. The Chi-square test was used to detect the presence of any systematic association between sex and dependency level of HHs with the support of CLD. The independent sample T-test was also used to examine the mean age, family

Push Factors, Household Support and Effects of Communal Land Distribution, EJSS Vol. 5, No. 1, May, 2019.
7
size, farmland size, and livestock number and annual income difference between HHs who support and those who contest the CLD. The qualitative information garnered from KIIs, FGDs and field observations were used in collaboration with the quantitative analysis to substantiate the numerical data.
3. Results and Discussion
3.1. Communal Land Distribution and its push factors in the Study Area
3.1.1. The communal land distribution evidence in the study areas
According to Gozamin District Environmental Protection Land Administration and Use Office (GDEPLAUO, 2014), there are about 193 CLs in the district. Most of them are located near streams, on the hillsides and mountain ridges. A total of 107 (1678.7 ha) land plots were also identified in the study RKAs (Table 2). The majority of these CLs (623 ha) were found in Shembalima RKA and the rest (598.7 & 457 ha) were from Leklekita and Enerata, respectively. Of the total 107 CLs identified, 44 (218 ha or ≈13%) were distributed to 610 landless HHs between 2012 and 2014. Nearly half (23 of 51 & 12 of 14 in Shembalima & Leklekita, respectively) but only 9 of the 42 CLs in Enerata were allocated to landless HHs during the mentioned years. With this distribution, 240, 214 and 156 landless HHs were made beneficiaries in Shembalima, Enerata & Leklekita RKAs, respectively.
Table 2 Size of CLs distributed to landless people by RKA (2012-2014)
RKA
Total CL by RKA Size distributed № of beneficiaries № ha № ha % №
Enerata 42 457 9 52 11.3 214 Leklekita 14 598.7 12 61 10.2 156 Shebalima 51 623 23 105 16.8 240 Total 107 1678.7 44 218 12.9 610
Source: GDEPLAUO (March, 2015)
3.1.2. The push factors of communal land distribution in the study areas
During data collection, proxy questions were presented to the HHs to get information on factors pushing CLD in the study RKAs. In this regard, land shortages, emergence of large number landless youth populations in the rural areas, land laws, illegal encroachments and lack of awareness were identified as major push factors for CLD in the study areas.
As shown in Table 3, over 80% of the HHs reported that farmland scarcity has initiated the CLD in the area. Other 86.4% HHs likewise indicated that the CLDs are precipitated by the increasing number of many landless youth populations in the rural areas. According to these HHs, the local authorities use CLs as an alternative form of employment (job opportunity) to the emerging

Push Factors, Household Support and Effects of Communal Land Distribution, EJSS Vol. 5, No. 1, May, 2019.
8
young people and as a means of minimizing the pressure emanating from farmland shortages. Similar practices were reported in northwest Ethiopia by Belay et al. (2017).
Table 3 Pushing factors for initiating CLD in the study areas
Pushing factors (Multiple response items)
Responses (N=132) № %
Land shortages 108 81.8 Emergence of many youth populations 114 86.4 Land laws 107 81.1 Illegal encroachments 86 65.2 Awareness gaps 105 79.5
As an alternative perspective into the issue, some 81.1% of the HHs complained that the current land administration laws and legal institutions caused the distribution of their CLs. In contrast, the remaining 19 % respondents declined to agree with such a view (Table 3). Information obtained from the KIIs indicated also that land administration laws opened the opportunity for the distribution of CLs. For instance, the Federal land law (FDRE, 2005) Proclamation № 456/2005:5/3 declares that the communal rural lands can be converted into private holdings when found necessary. Likewise, the land laws enacted by the ANRS: Proclamation № 133/2006:8/2 (ANRS, 2006) and Regulation № 51/2007:6/1 (ANRS, 2007) allow land redistributions/allocations with the consent of not less than 80% of the local landholders. Although the rural land administration laws have given the community some degree of autonomy to decide on these valuable resources, they indirectly exacerbated the CLDs and snatched-off their rights according to FGD arguments.
Other respondents (65.2%) perceive that illegal encroachments are among the major drivers of CLD (Table 3). FGD participants explained that illegal encroachments of CLs and changing the type of use have perhaps become the norm in many rural areas of Ethiopia and in the study areas. Alemayehu (2003) indicated that the current land tenure system of Ethiopia does not strictly control the encroachment to and security of community grazing lands. Mismanagement coupled with disregard for indigenous knowledge has made grazing and bush land encroachment one of the major problems in many parts of Ethiopia. In line with this, Ali (2009) notes that the cultivated land in Ethiopia has shown an increase due to the encroachment into communally owned lands such as the grasslands, shrub/bush lands. According to this author, the increased land shortage leads to encroachment of CLs and it causes the closing-up of fallowing structures. In the study RKAs, there is strong community request urging the land administration office to conduct CLD, particularly in areas where sever CL encroachments are common.
Another important cause for CLD identified by about 80% of the studied households is the lack of awareness on the management and contribution of the CLs among the user community (Table 3). This can necessarily be associated with the lack of awareness trainings and in-depth education on the issue. For instance, FGD participants reported that there were no training opportunities on CL management and use for the community in the study areas except for members of the land administration and use committee. Key informants explained that trainings on land administration were given only for land administration committee members, RKA leaders, and few selected community elders. Local land users are yet to get the opportunity. This

Push Factors, Household Support and Effects of Communal Land Distribution, EJSS Vol. 5, No. 1, May, 2019.
9
condition might have inhibited the community in the study areas from utilizing its land related resources properly. KII and FGD participants in general argue that decisions on CL use can be improved if only the community gets training on land administration and management. This is because land related rights and decisions are directly related to awareness.
To sum-up, all the aforementioned push factors of CLD were fully endorsed by FGDs and KIIs. The FGD participants and key informants in addition argue that government and community development demands sometimes initiate encroachment to CLs. For instance, land demand for social service projects (schools, health posts, offices, community irrigation, etc.). Community land demands for village associations and establishment of religious buildings also aggravate the encroachment into CLs. The KIIs and FGDs farther remarked that land grants for the organized youth groups take a considerable part of the CLs. Different authors have reported that CLs are frequently distributed to organized youth groups in Ethiopia (e.g. Wily, 2018; Abab & Monchuk, 2018).
3.2. Households’ Perceived Support to Communal Land Distribution
The support and contest provided from the beneficiary community to CLD activities can have its own influence on the development of CLs. With this understanding, this section of the results presents the perceived support and contest of the study HHs on CLD through comparison of some demographic and socioeconomic variables., So as to deepen our understanding, the perceived support and contest of the respondents on CLD are compared within sex, age, family size, education level, farmland size, livestock size and income groups and fuel dependency level of HHs on CLs.
3.2.1. Support from household sex groups
Sex is an important variable in HH decision making. Hence, it can play relevant role in HHs’ supporting and contesting decisions of CLDs in rural areas. The sex distribution data (Table 4) indicates that 72.7% of the HHs studied were headed by men whereas the rest 27.3% by women. The same data indicates that all the HHs headed by women supported the CLD in contrast to only 32% of the male-headed HHs that support the action. Of the total 67 HHs who support CLD, 46.3% were male-headed and 53.7% female-headed. This indicates that the majority of the male-headed HHs (68%) contest the CLD compared to the female-headed HHs; implying the existence of a statistical difference between the two groups regarding the distribution of CLs. The Chi-square test (χ2 =48.02; P =0.000) also confirms the existence of a significance difference between male-headed and female-headed HHs on the perceived support of CLD in the study areas. The support to CLD from all the female-headed households might have emanated from their limited access to and use of the CL resources.
Table 4 Perceived support and contest of CLD by different HH groups (N=132)
Variables
Type of perceived support Total
χ2 Value
P value
Support Contest № % № % № %
Push Factors, Household Support and Effects of Communal Land Distribution, EJSS Vol. 5, No. 1, May, 2019.
10
Sex of the head
Male 31 32 65 68 96 72.7 48.022 0.000 Female 36 100 0 0 36 27.3 Total 67 51 65 49 132 100
Education of the head
Illiterate 21 47.7 23 52.3 44 33.3 Read and write 26 42.6 35 57.4 61 46.2 Primary school & + 20 74.1 7 25.9 27 20.4
Dependency level on CLs
Fully dependent 13 17 65 83 78 59.1 88.66 0.000 Partly dependent 52 100 0 0 52 39.4 Not dependent 2 100 0 0 2 1.5 Total 67 51 65 49 132 100
Dependency on CL for fuel
Fully dependent 11 26 32 74 43 32.6 Partially dependent 56 63 33 37 89 67.4 Total 67 51 65 49 132 100
Source: Field survey (March, 2015)
3.2.2. Support from households with different age groups
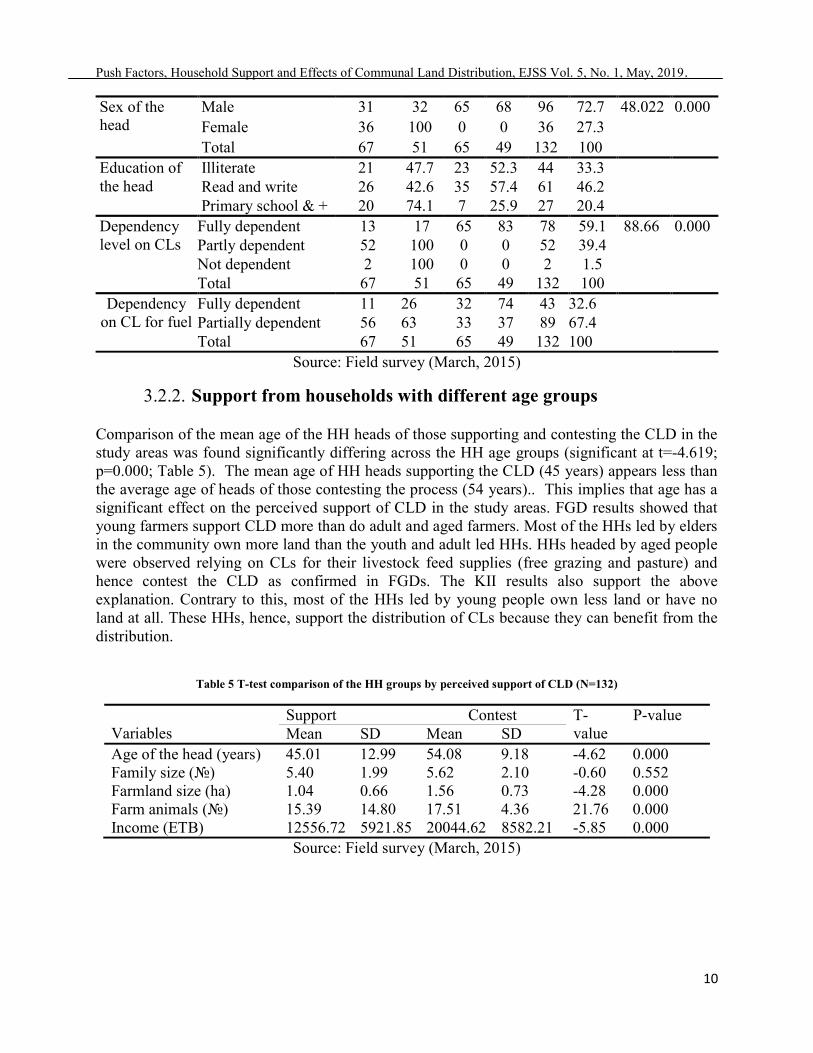
Comparison of the mean age of the HH heads of those supporting and contesting the CLD in the study areas was found significantly differing across the HH age groups (significant at t=-4.619; p=0.000; Table 5). The mean age of HH heads supporting the CLD (45 years) appears less than the average age of heads of those contesting the process (54 years).. This implies that age has a significant effect on the perceived support of CLD in the study areas. FGD results showed that young farmers support CLD more than do adult and aged farmers. Most of the HHs led by elders in the community own more land than the youth and adult led HHs. HHs headed by aged people were observed relying on CLs for their livestock feed supplies (free grazing and pasture) and hence contest the CLD as confirmed in FGDs. The KII results also support the above explanation. Contrary to this, most of the HHs led by young people own less land or have no land at all. These HHs, hence, support the distribution of CLs because they can benefit from the distribution.
Table 5 T-test comparison of the HH groups by perceived support of CLD (N=132)
Variables
Support Contest T-value
P-value Mean SD Mean SD
Age of the head (years) 45.01 12.99 54.08 9.18 -4.62 0.000 Family size (№) 5.40 1.99 5.62 2.10 -0.60 0.552 Farmland size (ha) 1.04 0.66 1.56 0.73 -4.28 0.000 Farm animals (№) 15.39 14.80 17.51 4.36 21.76 0.000 Income (ETB) 12556.72 5921.85 20044.62 8582.21 -5.85 0.000
Source: Field survey (March, 2015)
Push Factors, Household Support and Effects of Communal Land Distribution, EJSS Vol. 5, No. 1, May, 2019.
11
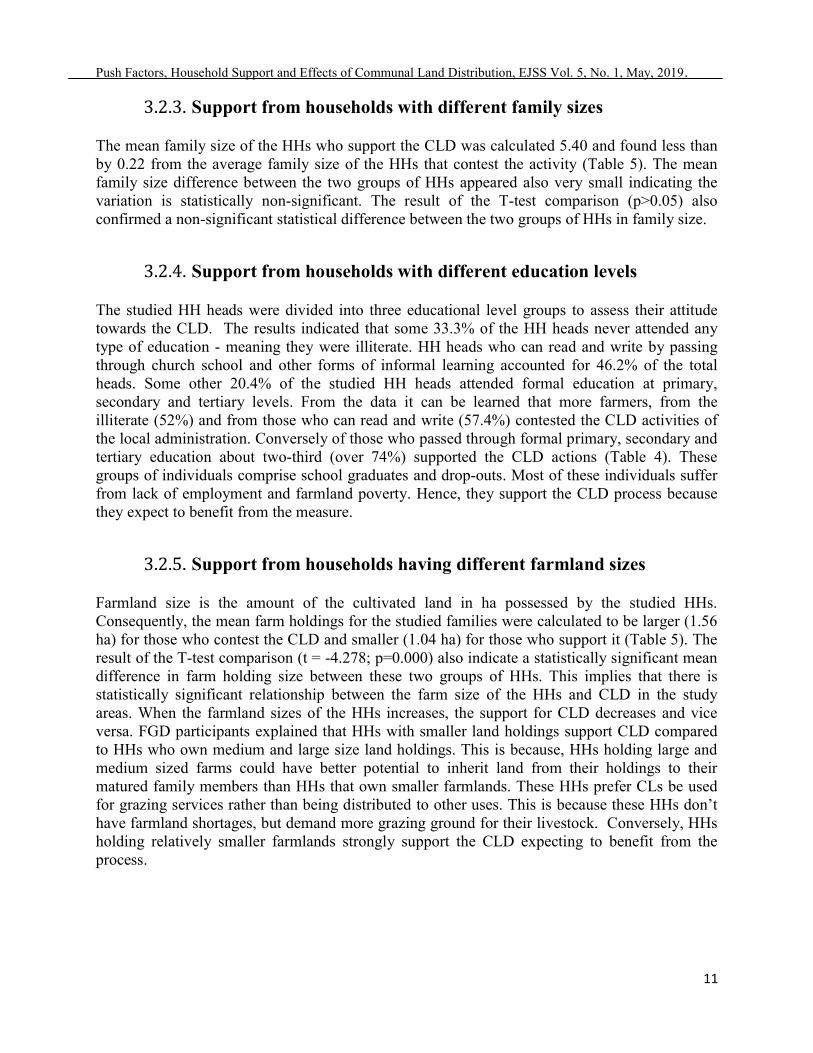
3.2.3. Support from households with different family sizes
The mean family size of the HHs who support the CLD was calculated 5.40 and found less than by 0.22 from the average family size of the HHs that contest the activity (Table 5). The mean family size difference between the two groups of HHs appeared also very small indicating the variation is statistically non-significant. The result of the T-test comparison (p>0.05) also confirmed a non-significant statistical difference between the two groups of HHs in family size.
3.2.4. Support from households with different education levels
The studied HH heads were divided into three educational level groups to assess their attitude towards the CLD. The results indicated that some 33.3% of the HH heads never attended any type of education - meaning they were illiterate. HH heads who can read and write by passing through church school and other forms of informal learning accounted for 46.2% of the total heads. Some other 20.4% of the studied HH heads attended formal education at primary, secondary and tertiary levels. From the data it can be learned that more farmers, from the illiterate (52%) and from those who can read and write (57.4%) contested the CLD activities of the local administration. Conversely of those who passed through formal primary, secondary and tertiary education about two-third (over 74%) supported the CLD actions (Table 4). These groups of individuals comprise school graduates and drop-outs. Most of these individuals suffer from lack of employment and farmland poverty. Hence, they support the CLD process because they expect to benefit from the measure.
3.2.5. Support from households having different farmland sizes
Farmland size is the amount of the cultivated land in ha possessed by the studied HHs. Consequently, the mean farm holdings for the studied families were calculated to be larger (1.56 ha) for those who contest the CLD and smaller (1.04 ha) for those who support it (Table 5). The result of the T-test comparison (t = -4.278; p=0.000) also indicate a statistically significant mean difference in farm holding size between these two groups of HHs. This implies that there is statistically significant relationship between the farm size of the HHs and CLD in the study areas. When the farmland sizes of the HHs increases, the support for CLD decreases and vice versa. FGD participants explained that HHs with smaller land holdings support CLD compared to HHs who own medium and large size land holdings. This is because, HHs holding large and medium sized farms could have better potential to inherit land from their holdings to their matured family members than HHs that own smaller farmlands. These HHs prefer CLs be used for grazing services rather than being distributed to other uses. This is because these HHs don’t have farmland shortages, but demand more grazing ground for their livestock. Conversely, HHs holding relatively smaller farmlands strongly support the CLD expecting to benefit from the process.

Push Factors, Household Support and Effects of Communal Land Distribution, EJSS Vol. 5, No. 1, May, 2019.
12
3.2.6. Support from households having different livestock sizes
Livestock are the strong pillars of livelihood in the study RKAs. Whether the numbers are small or large, almost all respondent HHs have livestock. The mean livestock number (≈18) for HHs that contest CLD was found larger than the average number owned (≈15) by HHs who support the mentioned land distribution. This implies that there is a mean livestock ownership difference between HHs supporting and contesting CLD. The T-test result (t= 21.760; p=0.000, Table 5) showed also the existence of a significant mean livestock ownership difference between the two groups of HHs. This is again confirmed by the evidence presented in Table 4. The data in this table (Table 4) confirms that 59.1% and 39.4 % of the studied HHs correspondingly replied that they fully and partially depend on CLs for their livestock feed supplies. Similarly, about 83% of those HHs who entirely depend on the communal resources for their livestock feed sources contest the distribution of CLs, but those who do not totally rely on the resources fully support the activities. The Chi-square test (χ2=88.657; p=0.000; Table 4) indicate a systematic statistical association between dependency on CLs for collecting livestock feed supplies and perceived support of CLD in the study areas.
FGD participants argue that almost all the community in the study areas depends on CLs for feeding livestock; although with different degrees of dependency. However, they underscored that HHs with large livestock holdings entirely depend on the CLs for their feed sources. This implies that the more the number of the livestock that the HH owns the more dependent it becomes on CLs for feeding the livestock and contest against the CLD. Therefore, contest on CLD increases with increasing in the number of livestock in the HH. This finding has support from Zemen (2013) who remarked that in the absence of livestock rearing activities; CL users do not have other sufficient mechanisms to benefit from the resources offered by CLs; so, support CLD. FGD participants suggested that improved forage introduction and adaptation practices were not performed efficiently. This failure of government agencies to introduce and produce improved forage for animals has left the community tightly attached to communal grazing lands in the study areas. The KII findings also support this claim.
3.2.7. Support from households with different income sizes
The mean annual incomes of HHs who support and contest CLD were ETB 12,556.72 and 20,044.62, respectively (Table 5). The independent sample T-test result (t=-5.849; p=0.000) showed the prevalence of a statistically significant mean income difference between the two groups of HHs in the study areas. This shows that the mean income of the HHs has significant influence on the perceived support of CLD in the study areas. FGD participants explained that HHs with lower annual incomes support the distribution of CLs more than do the others. This is because they expect to improve their living conditions from the cultivation of additional land obtained from the CLDs. HHs who annually earn high income contest the CLD than those earning low incomes. These HHs contest the action because they directly and indirectly benefit from the CLs through livestock development.
Push Factors, Household Support and Effects of Communal Land Distribution, EJSS Vol. 5, No. 1, May, 2019.
13
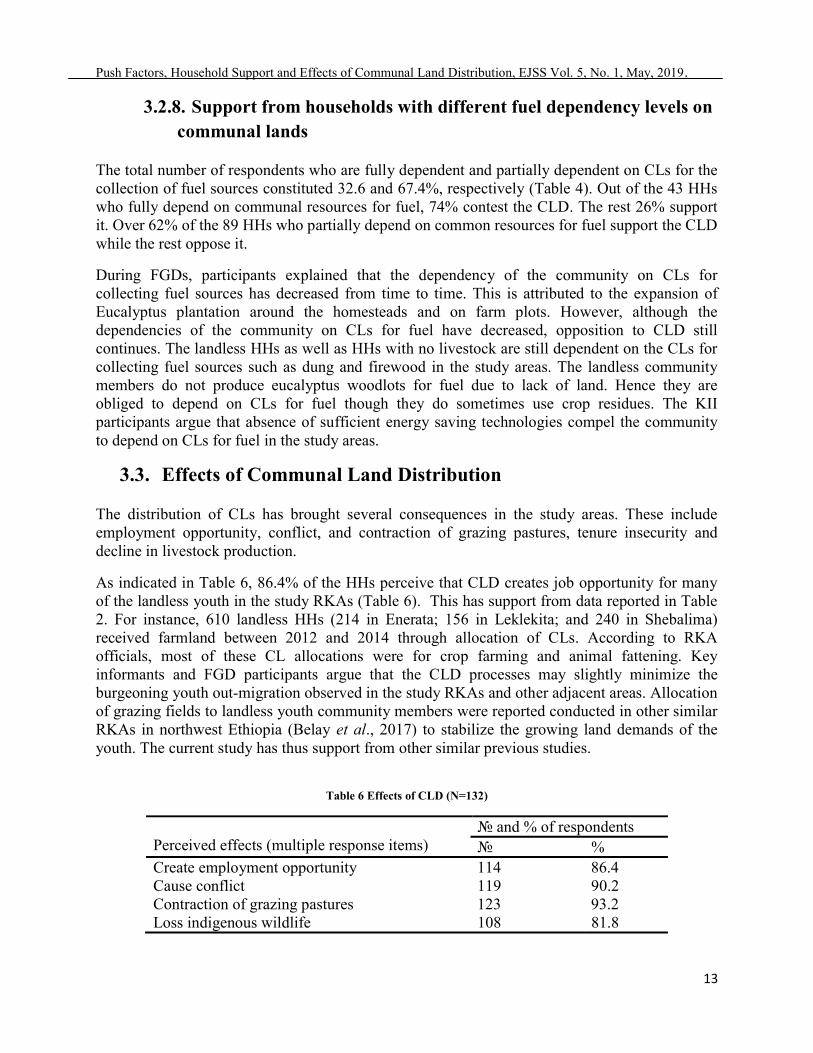
3.2.8. Support from households with different fuel dependency levels on communal lands
The total number of respondents who are fully dependent and partially dependent on CLs for the collection of fuel sources constituted 32.6 and 67.4%, respectively (Table 4). Out of the 43 HHs who fully depend on communal resources for fuel, 74% contest the CLD. The rest 26% support it. Over 62% of the 89 HHs who partially depend on common resources for fuel support the CLD while the rest oppose it.
During FGDs, participants explained that the dependency of the community on CLs for collecting fuel sources has decreased from time to time. This is attributed to the expansion of Eucalyptus plantation around the homesteads and on farm plots. However, although the dependencies of the community on CLs for fuel have decreased, opposition to CLD still continues. The landless HHs as well as HHs with no livestock are still dependent on the CLs for collecting fuel sources such as dung and firewood in the study areas. The landless community members do not produce eucalyptus woodlots for fuel due to lack of land. Hence they are obliged to depend on CLs for fuel though they do sometimes use crop residues. The KII participants argue that absence of sufficient energy saving technologies compel the community to depend on CLs for fuel in the study areas.
3.3. Effects of Communal Land Distribution
The distribution of CLs has brought several consequences in the study areas. These include employment opportunity, conflict, and contraction of grazing pastures, tenure insecurity and decline in livestock production.
As indicated in Table 6, 86.4% of the HHs perceive that CLD creates job opportunity for many of the landless youth in the study RKAs (Table 6). This has support from data reported in Table 2. For instance, 610 landless HHs (214 in Enerata; 156 in Leklekita; and 240 in Shebalima) received farmland between 2012 and 2014 through allocation of CLs. According to RKA officials, most of these CL allocations were for crop farming and animal fattening. Key informants and FGD participants argue that the CLD processes may slightly minimize the burgeoning youth out-migration observed in the study RKAs and other adjacent areas. Allocation of grazing fields to landless youth community members were reported conducted in other similar RKAs in northwest Ethiopia (Belay et al., 2017) to stabilize the growing land demands of the youth. The current study has thus support from other similar previous studies.
Table 6 Effects of CLD (N=132)
Perceived effects (multiple response items)
№ and % of respondents № %
Create employment opportunity 114 86.4 Cause conflict 119 90.2 Contraction of grazing pastures 123 93.2 Loss indigenous wildlife 108 81.8

Push Factors, Household Support and Effects of Communal Land Distribution, EJSS Vol. 5, No. 1, May, 2019.
14
Contrary to its role in the creation of employment opportunity to the youth, CLD is blamed for causing conflict; tenure insecurity and livestock production constraints through reducing grazing grounds and pasture shortages. Over 90% of the HHs believe that CLD caused conflict in the community (Table 6). FGD participants support this blame and argue that boundary disputes have significantly increased among CL users with implementation of the CLD in the area. Key informants also reported that land use conflicts frequently occur among the new landholders. In his boundary conflict resolution study in East Godjam, Ethiopia, Sayeh (2007) indicated that 75% of the land cases presented to social courts in the past five consecutive years were boundary conflicts. This blame has thus support from other studies conducted in the area.
Similarly, over 93% of the respondents noted that CLD has caused severe grazing land shortages and aggravated the challenges of livestock rearing in the study areas (Tables 6 & 7). According to the FGD participants, shortage of grazing lands became a growing problem for livestock raisers after the distribution of CLs. Livestock production had decreased after the CLs were distributed to landless people according to 94% of the HH respondents. Field observation and KIIs revealed that suitable grazing lands near the streams and water bodies were distributed to landless youth HHs for irrigation purposes. These conditions minimized livestock feed supplies (pasture & water) and in turn the amount of milk, meat, drought power and manure products obtained from the livestock sector. FGD participants remarked that the long established free grazing habit and deep-rooted dependency on CLs for grazing livestock has led to increased dissatisfactions and complaints among a significant number of the rural community in the study areas. Constraints related to grazing land shortage due to CLDs were reported in Belay and Bewket (2013a) for similar rural areas of northwest Ethiopia.
Table 7 Status of tenure security and livestock production after CLD
Perceived status
№ and % of respondents by issue (N=132) Tenure security Livestock production № % № %
Increased 9 6.8 2 1.14 Decreased 116 87.9 124 93.6 No change 7 5.3 6 4.6
As can be referred from Table 6, many HHs (≈88%) perceive that the recently implemented CLD has affected the tenure security of farmers. In support of this perceived effect, FGD participants reiterated that the state of tenure security and sense of belongingness on land declined specially after the CLD in the study areas. Similar findings were reported in Alemu (1999). CLD was also reported to have been the cause for the loss of indigenous plant and animal species in the area. This was among the major issues emphasized during FGDs and KIIs.
4. Conclusion
This study examined the factors pushing towards CLD, household support to the implementation of the system and its environmental effects in the Gozamin district, in the northwestern highlands of Ethiopia. Data were collected from February to March 2015 through a questionnaire survey of 132 households, 15 KIIs, three FGDs and multiple field observations. The results indicated that a total of 44 (218 ha) CLs were allocated to 610 HHs in three RKAs between 2010 and 2014.

Push Factors, Household Support and Effects of Communal Land Distribution, EJSS Vol. 5, No. 1, May, 2019.
15
Farmland shortages, emergence of many landless youth HHs, land related laws and proclamations, illegal encroachments and awareness gaps were identified as main push factors of CLD; reported by over 81, 86, 81, 65 and 75% of the studied HHs, respectively. Perceived support to CLDs was found to significantly differ with the sex, age, farmland and livestock size and income size groups and on dependency level of HHs on CLs (significant at p≤0.05). Youth employment opportunity was the positive effect of CLDs as reported by 86.4% of the studied HHs. Rising incidence in farmer conflicts, contraction of indigenous wildlife and grazing pastures, decline of livestock products and tenure insecurity were adverse impacts of CLD reported by 90.2, 81.8, 93.2, 93.6 & 87.9% respondents, respectively. It is suggested that land laws promoting CLDs be revised to reduce encroachments and farmer conflicts. Alternative employment opportunities, livestock feeding options and fuel sources need to be introduced to minimize farmland shortages and the pressure on communal resources. Improved livestock breeds, forage plants and feeding strategies and use of alternative energy saving technologies can minimize the dependency of the community on CLs for livestock feed and fuel sources.
Acknowledgements
We would like to express our gratitude to all persons who directly and indirectly participated in this study. Our particular thanks go to the farmers, DAs and RKA officials who provided the necessary information used in the study.
References
Abab, S. & Monchuk, D. (2018). Land Governance in an Interconnected World: Assessing Livelihood and Environmental Impacts of Secure Access to Land for Landless Youth under the Ethiopian Sustainable Land Management Program. Paper prepared for presentation at the “2018 World Bank Conference on Land and Poverty”, March 19-23. The World Bank, Washington DC, USA , 14pp. Agarwal, C., Green, G. M., Grove, J. M., Evans, T. P., & Schweik, C. M. (2002). A Review and Assessment of Land-Use Change Models: Dynamics of Space, Time, and Human Choice. General Technical Report NE-297. Newtown Square, Pennsylvania: U.S. Department of Agriculture, Forest Service, Northeastern Research Station. 61 pp. Alemayehu, M. (2003). Conservation Community Based Forage Development , 83 Self Help Development. International Institute for Sustainable Development Addis Ababa. Ethiopia. (2oo3) Country Pasture/Forage Resource Profiles.http:www.fao.org/ 34pp. Alemu, T. (1999). Land Tenure and Soil Conservation: Evidence from Ethiopia. Goteborg University, Sweden. Alemu, G. (2011). Rural Land Policy, Rural Transformation and Recent Trends in Large-scale Rural Land Acquisitions in Ethiopia. European Report on Development. Overseas Development Institute (ODI), 28pp. Ali, O. (2009). Land Use and Land Cover Change, Drivers and Its Impact: A comparative study from Kuhar Michael and Lenche Dima of Blue Nile and Awash Basins of Ethiopia MA Thesis, Cornell University, 29pp. Amhara National Regional State (ANRS) (2006). The Revised Rural Land Administration and Use Determination. Proclamation № 133/2006, Zikre-Hig 11th Year, № 18, May 29/2006,
Push Factors, Household Support and Effects of Communal Land Distribution, EJSS Vol. 5, No. 1, May, 2019.
16
Bahir-Dar Ethiopia, 33pp. Amhara National Regional State (ANRS). (2007). Rural Land Administration and Use System Implementation, Council of Regional Government Regulation № 51/2007. Zikre-Hig 12th Year № 14, 11 May/2007, Bahir-Dar, 60pp.Amhara National Regional State (ANRS). (2010). Land Registration and Certification, Magazine prepared by Bureau of Environmental Protection Land Administration Use in collaboration with Sida Amhara Rural Development Program, Bahir Dar, Ethiopia.78pp. Belay, M., & Bewket, W. (2013a). Farmers’ Livelihood Assets and Adoption of Sustainable Land Management Practices in Northwestern Highlands of Ethiopia. International Journal of Environmental Studies (70): 284–301. Belay, M. & Bewket, W. (2013b). Stakeholder Linkages for Sustainable Land Management in Dangila Woreda, Amhara Region, Ethiopia. Ethiopian Journal of Environmental Studies and Management (6):253–262. Belay, M. & Bewket, W. (2015). Enhancing Rural Livelihoods through Sustainable Land Management in Northwest Ethiopia. Geography, Environment & Sustainability 8(2): 79–100. Belay, M., Abegaz, A. & Bewket, W. (2017). Livelihood Options of Landless Households and Land Contracts in Northwest Ethiopia. Environment, Development & Sustainability, 19:141- 164. Benin, S. & Pender, J. (2002). Community Management of Grazing lands and Impact on Environmental Degradation in the Ethiopian Highlands. The ninth conference of International Association for The study of Common Property, Vitoria Falls, Zimbabwe URL: http/dlc.dlib.indiana.edu./archive/00000079/00/beniss/23052/.pdf Gebremedhin, B., John, P. & Girmay, T. (2002). Community resource Management: The Case of Grazing Lands in crop-Livestock mixed system in the highlands of northern Ethiopia. Presented at The commons in the Age of globalization. The ninth conference of the international association for the study of common property. Victoria Falls. Bezu, S. & Holden S. (2014a). Are Rural Youth in Ethiopia Abandoning Agriculture? World Development (64): 259–272. Bezu, S. & Holden, S. (2014b). Demand for Second-Stage Land Certification in Ethiopia: Evidence from Household Panel Data. Land Use Policy (41): 193–2005. Bodurtha, P. J., Caron, J., Chemeda, J., Shakhmetova, D. & V., L. (2011). Land Reform in Ethiopia: Recommendations for Reform. Document Prepared for Solidarity Movement for a New Ethiopia (SMNE).79pp. Central Statistics Authority (CSA). (2013). Federal Democratic Republic of Ethiopia Population Census Commission. Population Projection of Ethiopia for all Regions at Woreda Level From 2014-2017. August 2013, Addis Ababa, Ethiopia, 118pp Central Statistics Authority (CSA). (2014). Agricultural Sample Survey 2013/2014. Volume IV, Statistical Bulletin 446, June/2014, Addis Ababa, 133pp. Environmental Protection Authority ( EPA). (2003). Federal Democratic Republic of Ethiopia Environmental Protection Authority. Addis Ababa, Ethiopia. Federal Democratic Republic of Ethiopia (FDRE). (1995). Constitution of the Federal Democratic Republic of Ethiopia. Addis Ababa, 40pp. Federal Democratic Republic of Ethiopia (FDRE). (2005). Rural Land Administration and Land Use Proclamation № 456/2005. FEDRAL NEGARIT GAZETA, 11th Year № 44, 5th July 2005. Addis Ababa., 12pp. Gebreselassie, S. (2006). Land, Land Policy and Smallholder Agriculture in Ethiopia. A Policy

Push Factors, Household Support and Effects of Communal Land Distribution, EJSS Vol. 5, No. 1, May, 2019.
17
Brief Paper prepared for and presented at the Future Agricultures Consortium Meeting at Institute of Development Studies, UK, 20-22 march 2006. www.futureagricultures.org. Grover, D. & Anteneh, T. (2006). Enhancing Land-Use-Efficiency through Appropriate Land Policies in Ethiopia. Poster paper prepared for presentation at the International Association of Agricultural Economists Conference, Gold Coast, Australia, August 12-18, 2006. Gozamin District Agriculture and Rural Development Office (GARDO). (2012). Annual Physical Plan of the office document, Debre Markos Ethiopia, 102pp. Gozamin District Environmental Protection Land Administration and Use Office (2012). Gozamin District Environmental Resource Inventory Report of 2012, Debre Markos, Ethiopia, 54pp. Gozamin District Environmental Protection Land Administration and Use Office (GDEPLAU). (2014). Environmental Protection Land Administration and Use Office of the Gozamin District, Annual Good Governance Report. Debre Markos, Ethiopia, 25pp. Nega, B., Adenew, B. & Gebreselassie, S. (2003). Current Land Policy Issues in Ethiopia. Ethiopian Economic Policy Research Institute, Addis Ababa.52pp. Sayeh, K. (2007). Boundary Conflict Resolution Mechanisms in Amhara Region of Ethiopia: The Case of East Gojjam Administrative Zone, January 2007, KTH University, Sweden USAID (2009) Country Profile: Property Rights and Resource Governance, Ethiopia. http://usaidlandtenure.net/ethiopia, 28pp. Wily, L. A. (2018). Collective Land Ownership in the 21st Century: Overview of Global Trends. Land 7 (68):1-26. doi:10.3390/land7020068 Yeraswork, A. (2001). Twenty Years to Nowhere: Property Rights, Land Management and Conservation in Ethiopia. Traditional Resource Management in Ethiopia in Alula (ed). NRM in Ethiopia Institute of Social Studies Addis Ababa and University of Sussex UK. (2001b). Characteristics of Traditional Forest Management. InfoRM Ethiopia. Thematic Briefing No.10 FSS, 79pp. Zemen, H. (2013). Towards Improved Transactions of Land Use Rights in Ethiopia. Paper prepared for presentation at the “Annual World Bank Conference on Land and Poverty, World Bank - Washington DC, April 8-11, 2013, 17pp. Zerga, B. (2016). Land Resource, Uses, and Ownership in Ethiopia: Past, Present and Future. International Journal of Scientific Research Engineering Technology, 2 (1): 2395-566X