Pūrongo Ārai Mate Pukupuku Cancer Prevention Report
116
Pūrongo Ārai Mate Pukupuku Cancer Prevention Report
-
Upload
khangminh22 -
Category
Documents
-
view
3 -
download
0
Transcript of Pūrongo Ārai Mate Pukupuku Cancer Prevention Report
IPūrongo Ārai Mate Pukupuku | Cancer Prevention Report
Pūrongo Ārai Mate Pukupuku Cancer Prevention Report

Citation: Te Aho o Te Kahu. 2022. Pūrongo Ārai Mate Pukupuku, Cancer Prevention Report. Wellington: Te Aho o Te Kahu, Cancer Control Agency.
Published in February 2022 by Te Aho o Te Kahu, Cancer Control Agency PO Box 5013, Wellington 6140, New Zealand
ISBN: 978-1-99-110001-6 (Print) ISBN: 978-1-99-110000-9 (Online)
HP 8001
This document is available at teaho.govt.nz
This work is licensed under the Creative Commons Attribution 4.0 International licence. In essence, you are free to: share ie, copy and redistribute the material in any medium or format; adapt ie, remix, transform and build upon the material. You must give appropriate credit, provide a link to the licence and indicate if changes were made.
IIIPūrongo Ārai Mate Pukupuku | Cancer Prevention Report
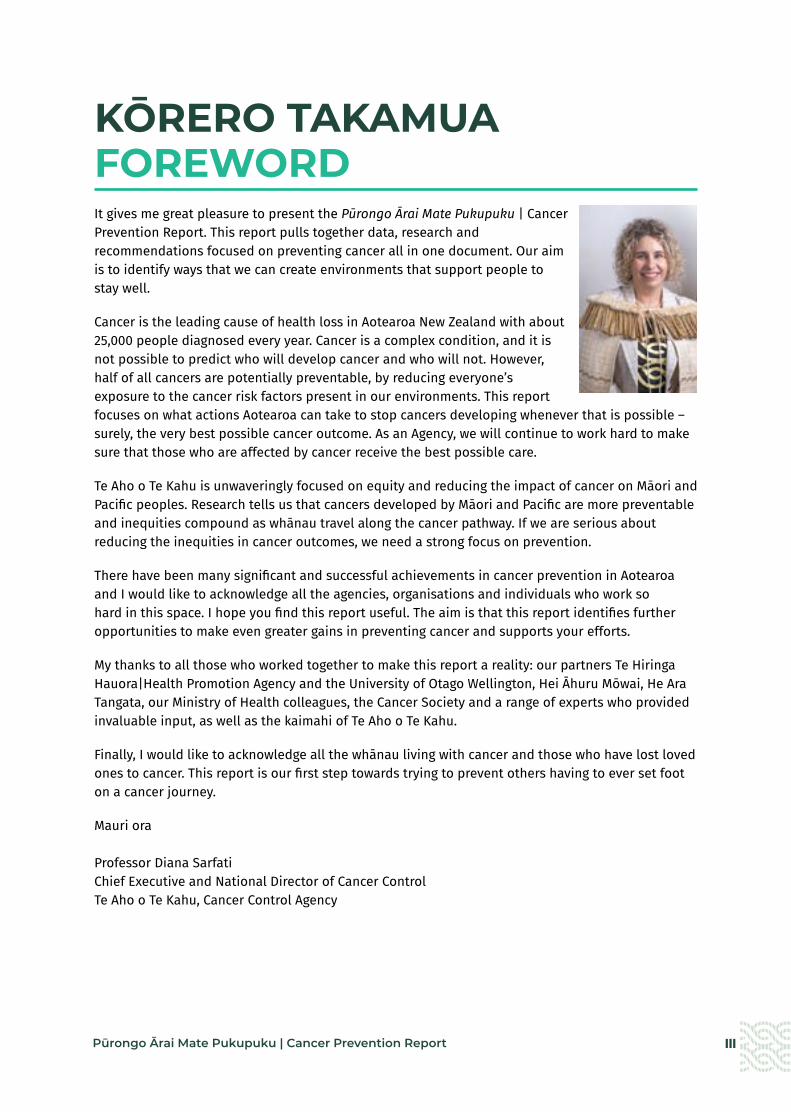
KŌRERO TAKAMUA FOREWORDIt gives me great pleasure to present the Pūrongo Ārai Mate Pukupuku | Cancer Prevention Report. This report pulls together data, research and recommendations focused on preventing cancer all in one document. Our aim is to identify ways that we can create environments that support people to stay well.
Cancer is the leading cause of health loss in Aotearoa New Zealand with about 25,000 people diagnosed every year. Cancer is a complex condition, and it is not possible to predict who will develop cancer and who will not. However, half of all cancers are potentially preventable, by reducing everyone’s exposure to the cancer risk factors present in our environments. This report focuses on what actions Aotearoa can take to stop cancers developing whenever that is possible – surely, the very best possible cancer outcome. As an Agency, we will continue to work hard to make sure that those who are affected by cancer receive the best possible care.
Te Aho o Te Kahu is unwaveringly focused on equity and reducing the impact of cancer on Māori and Pacific peoples. Research tells us that cancers developed by Māori and Pacific are more preventable and inequities compound as whānau travel along the cancer pathway. If we are serious about reducing the inequities in cancer outcomes, we need a strong focus on prevention.
There have been many significant and successful achievements in cancer prevention in Aotearoa and I would like to acknowledge all the agencies, organisations and individuals who work so hard in this space. I hope you find this report useful. The aim is that this report identifies further opportunities to make even greater gains in preventing cancer and supports your efforts.
My thanks to all those who worked together to make this report a reality: our partners Te Hiringa Hauora|Health Promotion Agency and the University of Otago Wellington, Hei Āhuru Mōwai, He Ara Tangata, our Ministry of Health colleagues, the Cancer Society and a range of experts who provided invaluable input, as well as the kaimahi of Te Aho o Te Kahu.
Finally, I would like to acknowledge all the whānau living with cancer and those who have lost loved ones to cancer. This report is our first step towards trying to prevent others having to ever set foot on a cancer journey.
Mauri ora Professor Diana SarfatiChief Executive and National Director of Cancer ControlTe Aho o Te Kahu, Cancer Control Agency
IV Pūrongo Ārai Mate Pukupuku | Cancer Prevention Report
NGĀ MIHI ACKNOWLEDGEMENTSWe would like to firstly acknowledge our partners Te Hiringa Hauora|Health Promotion Agency and University of Otago, Wellington who supported the collaborative development of the Cancer Prevention Report.
We take this opportunity to acknowledge Hei Āhuru Mōwai, Māori Cancer Leadership Group, who have provided considerable thought and input to this report. We also thank members of He Ara Tangata, our consumer reference group, for their valuable input from a lived-experience perspective.
Thank you also to all those who contributed their time and expertise in reviewing drafts of the report:
Ministry of Health; Cancer Society; Boyd Swinburn (University of Auckland); Nicki Jackson (Alcohol Healthwatch); Bronwen McNoe (University of Otago); Sport New Zealand; Martin Gledhill (EMF Services).
VPūrongo Ārai Mate Pukupuku | Cancer Prevention Report
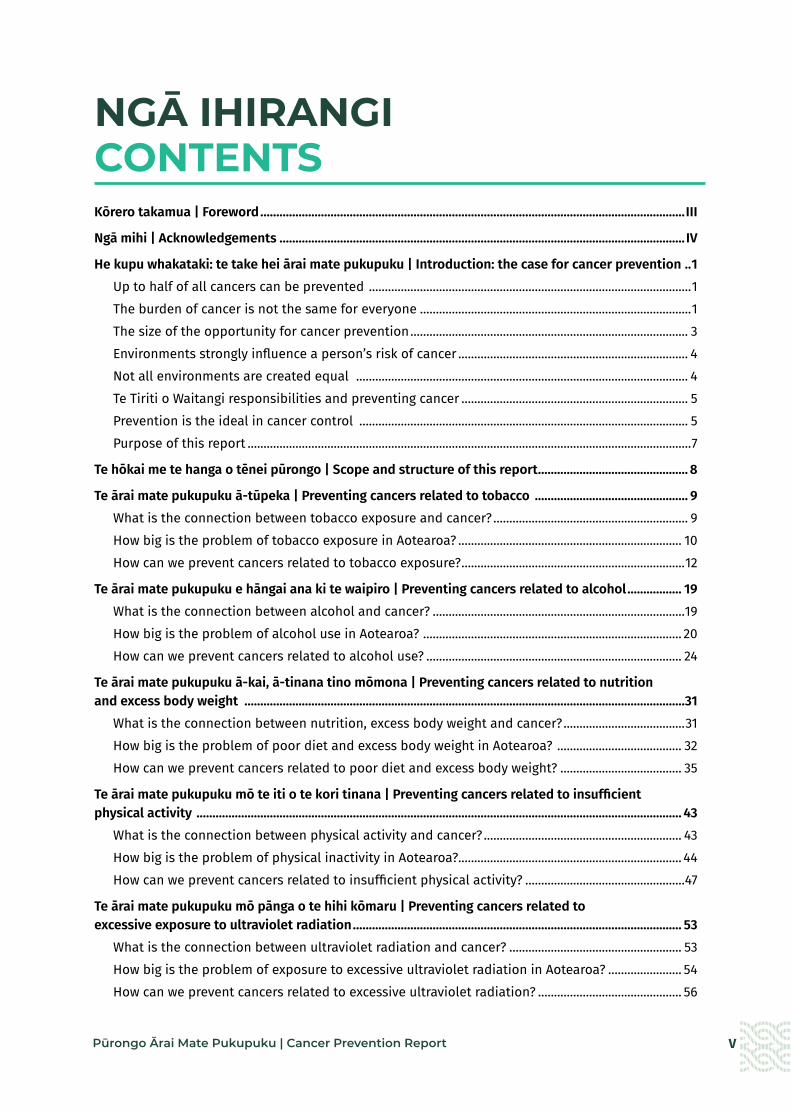
NGĀ IHIRANGI CONTENTSKōrero takamua | Foreword .....................................................................................................................................III
Ngā mihi | Acknowledgements ............................................................................................................................... IV
He kupu whakataki: te take hei ārai mate pukupuku | Introduction: the case for cancer prevention ..1Up to half of all cancers can be prevented .....................................................................................................1The burden of cancer is not the same for everyone .....................................................................................1The size of the opportunity for cancer prevention ....................................................................................... 3Environments strongly influence a person’s risk of cancer ........................................................................ 4Not all environments are created equal ........................................................................................................ 4Te Tiriti o Waitangi responsibilities and preventing cancer ....................................................................... 5Prevention is the ideal in cancer control ....................................................................................................... 5Purpose of this report ...........................................................................................................................................7
Te hōkai me te hanga o tēnei pūrongo | Scope and structure of this report ............................................... 8
Te ārai mate pukupuku ā-tūpeka | Preventing cancers related to tobacco ................................................ 9What is the connection between tobacco exposure and cancer? ............................................................. 9How big is the problem of tobacco exposure in Aotearoa? ...................................................................... 10How can we prevent cancers related to tobacco exposure? ......................................................................12
Te ārai mate pukupuku e hāngai ana ki te waipiro | Preventing cancers related to alcohol ................. 19What is the connection between alcohol and cancer? ...............................................................................19How big is the problem of alcohol use in Aotearoa? ................................................................................. 20How can we prevent cancers related to alcohol use? ................................................................................ 24
Te ārai mate pukupuku ā-kai, ā-tinana tino mōmona | Preventing cancers related to nutrition and excess body weight ..........................................................................................................................................31
What is the connection between nutrition, excess body weight and cancer? ......................................31How big is the problem of poor diet and excess body weight in Aotearoa? ....................................... 32How can we prevent cancers related to poor diet and excess body weight? ...................................... 35
Te ārai mate pukupuku mō te iti o te kori tinana | Preventing cancers related to insufficient physical activity ........................................................................................................................................................ 43
What is the connection between physical activity and cancer? .............................................................. 43How big is the problem of physical inactivity in Aotearoa?...................................................................... 44How can we prevent cancers related to insufficient physical activity? ..................................................47
Te ārai mate pukupuku mō pānga o te hihi kōmaru | Preventing cancers related to excessive exposure to ultraviolet radiation ....................................................................................................... 53
What is the connection between ultraviolet radiation and cancer? ...................................................... 53How big is the problem of exposure to excessive ultraviolet radiation in Aotearoa? ....................... 54How can we prevent cancers related to excessive ultraviolet radiation? ............................................. 56
VI Pūrongo Ārai Mate Pukupuku | Cancer Prevention Report
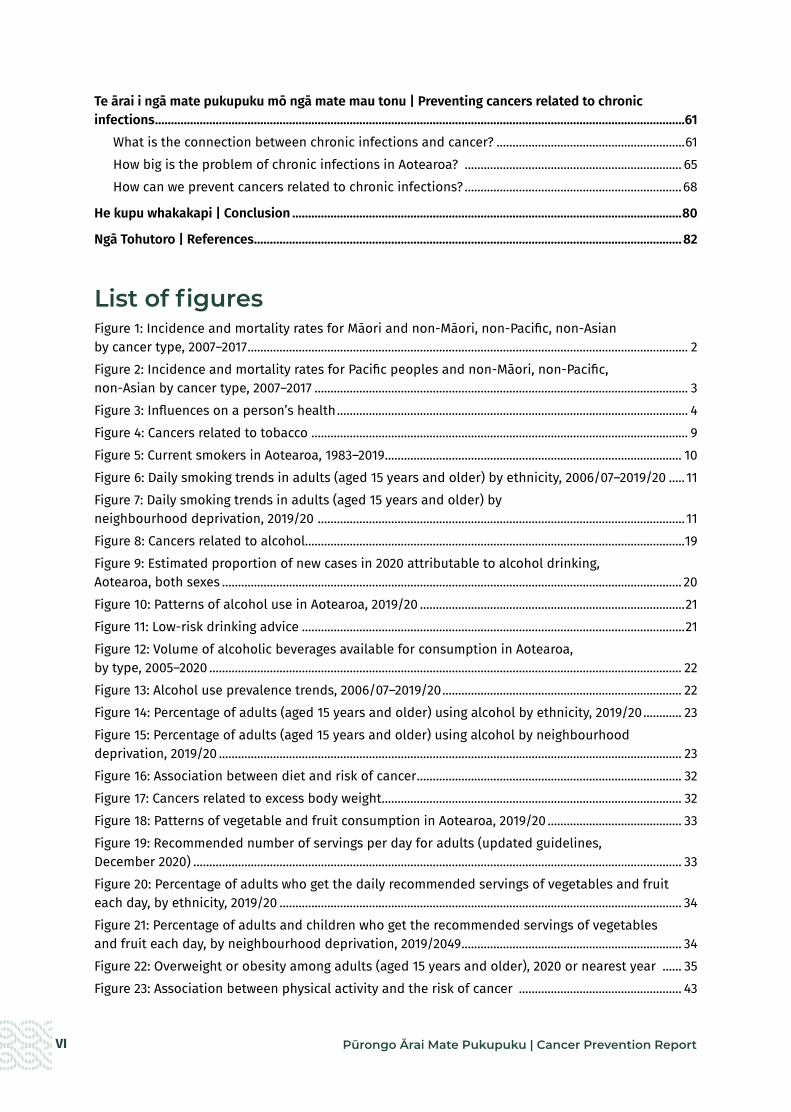
Te ārai i ngā mate pukupuku mō ngā mate mau tonu | Preventing cancers related to chronic infections ......................................................................................................................................................................61
What is the connection between chronic infections and cancer? ...........................................................61How big is the problem of chronic infections in Aotearoa? .................................................................... 65How can we prevent cancers related to chronic infections? ....................................................................68
He kupu whakakapi | Conclusion ..........................................................................................................................80
Ngā Tohutoro | References ......................................................................................................................................82
List of figuresFigure 1: Incidence and mortality rates for Māori and non-Māori, non-Pacific, non-Asian by cancer type, 2007–2017 .......................................................................................................................................... 2Figure 2: Incidence and mortality rates for Pacific peoples and non-Māori, non-Pacific, non-Asian by cancer type, 2007–2017 ..................................................................................................................... 3Figure 3: Influences on a person’s health .............................................................................................................. 4Figure 4: Cancers related to tobacco ...................................................................................................................... 9Figure 5: Current smokers in Aotearoa, 1983–2019 ............................................................................................. 10Figure 6: Daily smoking trends in adults (aged 15 years and older) by ethnicity, 2006/07–2019/20 ..... 11Figure 7: Daily smoking trends in adults (aged 15 years and older) by neighbourhood deprivation, 2019/20 ................................................................................................................... 11Figure 8: Cancers related to alcohol.......................................................................................................................19Figure 9: Estimated proportion of new cases in 2020 attributable to alcohol drinking, Aotearoa, both sexes ................................................................................................................................................ 20Figure 10: Patterns of alcohol use in Aotearoa, 2019/20 ...................................................................................21Figure 11: Low-risk drinking advice ........................................................................................................................21Figure 12: Volume of alcoholic beverages available for consumption in Aotearoa, by type, 2005–2020 .................................................................................................................................................... 22Figure 13: Alcohol use prevalence trends, 2006/07–2019/20 ........................................................................... 22Figure 14: Percentage of adults (aged 15 years and older) using alcohol by ethnicity, 2019/20 ............ 23Figure 15: Percentage of adults (aged 15 years and older) using alcohol by neighbourhood deprivation, 2019/20 ................................................................................................................................................. 23Figure 16: Association between diet and risk of cancer ................................................................................... 32Figure 17: Cancers related to excess body weight .............................................................................................. 32Figure 18: Patterns of vegetable and fruit consumption in Aotearoa, 2019/20 .......................................... 33Figure 19: Recommended number of servings per day for adults (updated guidelines, December 2020) ......................................................................................................................................................... 33Figure 20: Percentage of adults who get the daily recommended servings of vegetables and fruit each day, by ethnicity, 2019/20 .............................................................................................................................. 34Figure 21: Percentage of adults and children who get the recommended servings of vegetables and fruit each day, by neighbourhood deprivation, 2019/2049 ..................................................................... 34Figure 22: Overweight or obesity among adults (aged 15 years and older), 2020 or nearest year ...... 35Figure 23: Association between physical activity and the risk of cancer ................................................... 43
VIIPūrongo Ārai Mate Pukupuku | Cancer Prevention Report
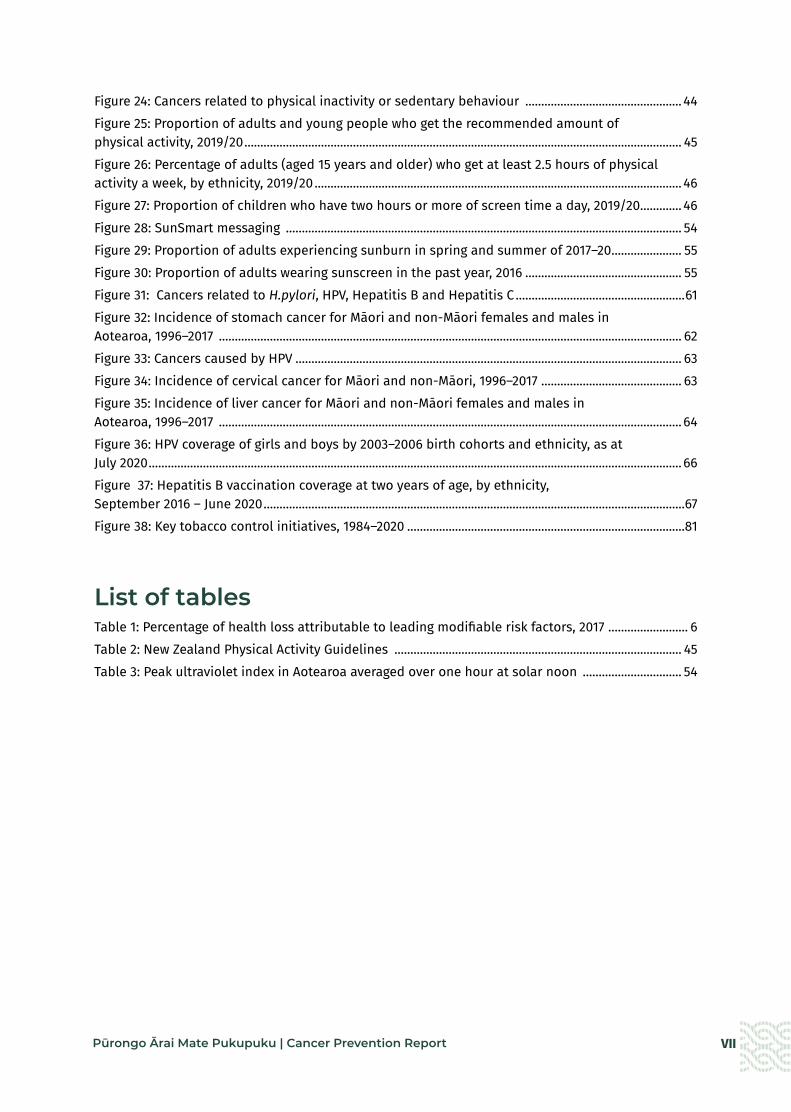
Figure 24: Cancers related to physical inactivity or sedentary behaviour ................................................. 44Figure 25: Proportion of adults and young people who get the recommended amount of physical activity, 2019/20 ......................................................................................................................................... 45Figure 26: Percentage of adults (aged 15 years and older) who get at least 2.5 hours of physical activity a week, by ethnicity, 2019/20 ................................................................................................................... 46Figure 27: Proportion of children who have two hours or more of screen time a day, 2019/20 ............. 46Figure 28: SunSmart messaging ............................................................................................................................ 54Figure 29: Proportion of adults experiencing sunburn in spring and summer of 2017–20 ...................... 55Figure 30: Proportion of adults wearing sunscreen in the past year, 2016 ................................................. 55Figure 31: Cancers related to H.pylori, HPV, Hepatitis B and Hepatitis C .....................................................61Figure 32: Incidence of stomach cancer for Māori and non-Māori females and males in Aotearoa, 1996–2017 ................................................................................................................................................. 62Figure 33: Cancers caused by HPV ......................................................................................................................... 63Figure 34: Incidence of cervical cancer for Māori and non-Māori, 1996–2017 ............................................ 63Figure 35: Incidence of liver cancer for Māori and non-Māori females and males in Aotearoa, 1996–2017 ................................................................................................................................................. 64Figure 36: HPV coverage of girls and boys by 2003–2006 birth cohorts and ethnicity, as at July 2020 ....................................................................................................................................................................... 66Figure 37: Hepatitis B vaccination coverage at two years of age, by ethnicity, September 2016 – June 2020 ....................................................................................................................................67Figure 38: Key tobacco control initiatives, 1984–2020 .......................................................................................81
List of tablesTable 1: Percentage of health loss attributable to leading modifiable risk factors, 2017 ......................... 6Table 2: New Zealand Physical Activity Guidelines .......................................................................................... 45Table 3: Peak ultraviolet index in Aotearoa averaged over one hour at solar noon ............................... 54

VIII Pūrongo Ārai Mate Pukupuku | Cancer Prevention Report
Hāpaitia te ara tika pūmau ai te rangatiratanga mō ngā uri
whakatipu
Foster the pathway of knowledge to strength, independence and growth for future generations

1Pūrongo Ārai Mate Pukupuku | Cancer Prevention Report
HE KUPU WHAKATAKI: TE TAKE HEI ĀRAI MATE PUKUPUKU INTRODUCTION: THE CASE FOR CANCER PREVENTION Up to half of all cancers can be prevented Cancer care is a rapidly evolving area of health care. This is a good thing. The frequent advances in cancer diagnosis and treatment present continual opportunities to do better for people diagnosed with cancer. However, in the face of rapid cancer innovation, it is easy to forget that it is possible to stop people developing cancer in the first place. Cancer can be prevented: not always and not fully, but much more than most people realise.
Cancer is incredibly complex and we cannot tell which individual will develop cancer and which individual won’t. However, across the whole population, preventing many cancers is possible by reducing or removing everyone’s exposure to the cancer risk factors present in our lives and environments: tobacco, alcohol, poor nutrition, physical inactivity, excess body weight, excessive ultraviolet radiation and chronic infections.
About 30–50 percent of cancers globally are preventable.1 If we applied that proportion to the 26,000 people diagnosed with cancer in Aotearoa New Zealand in 2018,2 that would mean 7,800 to 13,000 fewer people would have developed cancer that year. It is difficult to adequately describe the stress and upheaval that cancer brings to the lives of people diagnosed with it and their whānau. It is even more difficult to capture the far-reaching and intergenerational impact of a loved one dying of cancer. If we can prevent such suffering for up to 13,000 people and their whānau each year, we should.
The burden of cancer is not the same for everyoneCancer does not affect all groups in Aotearoa evenly. Inequities exist at every step of the cancer continuum – from how likely a person is to develop cancer to how quickly they are diagnosed, how accessible and appropriate their treatment is, and how they and their whānau are supported through the cancer journey. Inequities interact and compound, resulting in significant disadvantage for some compared to others. Māori are 20 percent more likely to develop cancer than non-Māori and twice as likely to die, with poorer survival across nearly all the most common cancers.3 Pacific peoples in Aotearoa are also more likely to develop certain cancers and less likely to survive some of them.4-6 Similar inequities exist (or are likely to exist) across a range of factors including by levels of deprivation,7 living with mental illness,8,9 living with disability,10-12 sexual orientation,13,14 and geography or rurality.15

2 Pūrongo Ārai Mate Pukupuku | Cancer Prevention Report
The cancers that are more common for Māori (including liver, lung, stomach and pancreas) (Figure 1) tend to be highly preventable. Pacific peoples in Aotearoa are also more likely to develop several cancers (including liver, lung, stomach and uterus) (Figure 2) that have a high preventable component. The pattern of preventable cancers is similar for those living in deprived areas, to the extent that poverty has been described as a cancer-causing risk factor or carcinogen.16
The burden of cancer is not the same for everyone. If we do not do enough to prevent cancer now, responding to the predicted increase in the number of people with cancer will require much greater cancer service capacity and the increase may also exacerbate the cancer inequities that exist today. For both those reasons, doing more to prevent cancer is imperative and urgent. Aotearoa has untapped potential for cancer prevention strategies to reduce inequities in cancer, but to realise this potential we need prevention activities that are led and delivered by Māori, Pacific peoples and other populations experiencing disparities, recognising that what works for one group will not necessarily work for others. This report supports the commitment to achieving equitable health outcomes for Māori and Pacific peoples as set out in the New Zealand Cancer Action Plan 2019-2029 – Te Mahere mō te Mate Pukupuku o Aotearoa 2019-2029,17 Whakamaua: Māori Health Action Plan 2020–2025,18 and Ola Manuia: Pacific Health and Wellbeing Action Plan 2020–2025.19
Figure 1: Incidence and mortality rates for Māori and non-Māori, non-Pacific, non-Asian by cancer type, 2007–2017
Māori Non-Māori/Non-Pacific peoples/Non-Asian
Mortality
State of cancer Fig 2.4Incidence
Breast
Lung
Prostate
Bowel
Leukaemia
Uterus
StomachNon-Hodgkin’s
lymphoma
Liver
Pancreas
60 50 40 30 20 10 0Age- and sex-standardised incidence rate per 100,000
0 5 10 15 20 25 30 35 40Age- and sex-standardised mortality rate per 100,000
3Pūrongo Ārai Mate Pukupuku | Cancer Prevention Report
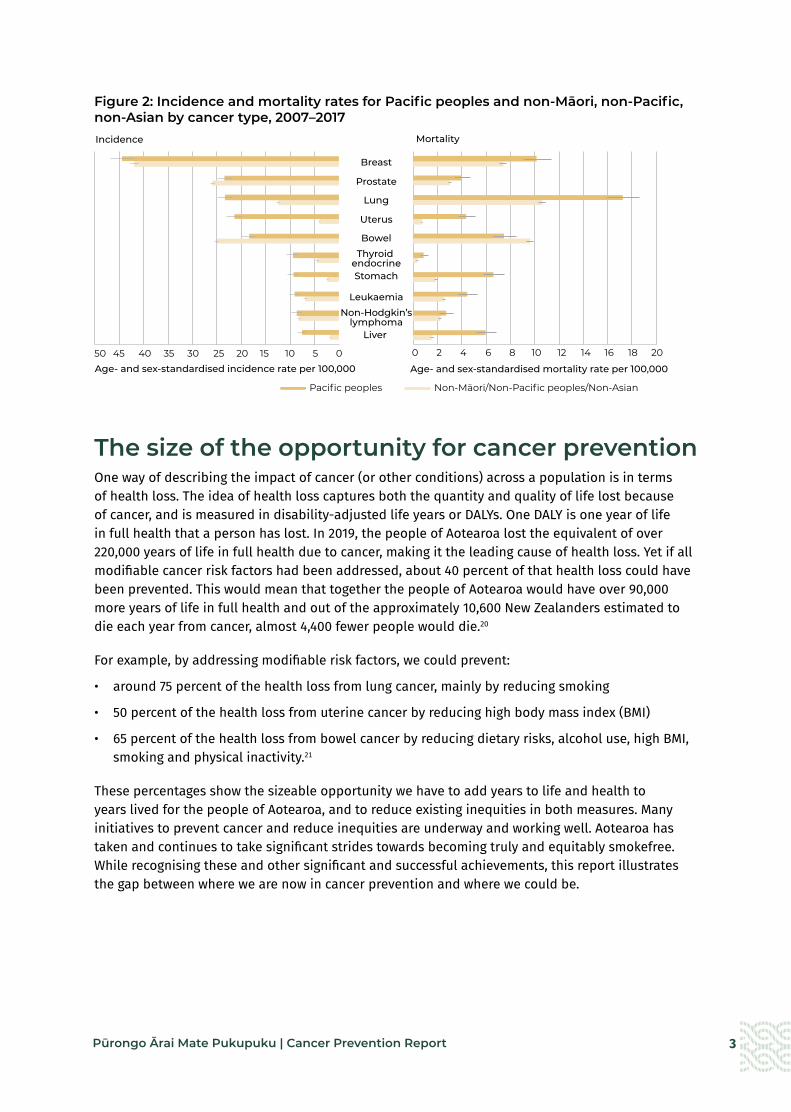
Figure 2: Incidence and mortality rates for Pacific peoples and non-Māori, non-Pacific, non-Asian by cancer type, 2007–2017
The size of the opportunity for cancer preventionOne way of describing the impact of cancer (or other conditions) across a population is in terms of health loss. The idea of health loss captures both the quantity and quality of life lost because of cancer, and is measured in disability-adjusted life years or DALYs. One DALY is one year of life in full health that a person has lost. In 2019, the people of Aotearoa lost the equivalent of over 220,000 years of life in full health due to cancer, making it the leading cause of health loss. Yet if all modifiable cancer risk factors had been addressed, about 40 percent of that health loss could have been prevented. This would mean that together the people of Aotearoa would have over 90,000 more years of life in full health and out of the approximately 10,600 New Zealanders estimated to die each year from cancer, almost 4,400 fewer people would die.20
For example, by addressing modifiable risk factors, we could prevent:
• around 75 percent of the health loss from lung cancer, mainly by reducing smoking
• 50 percent of the health loss from uterine cancer by reducing high body mass index (BMI)
• 65 percent of the health loss from bowel cancer by reducing dietary risks, alcohol use, high BMI, smoking and physical inactivity.21
These percentages show the sizeable opportunity we have to add years to life and health to years lived for the people of Aotearoa, and to reduce existing inequities in both measures. Many initiatives to prevent cancer and reduce inequities are underway and working well. Aotearoa has taken and continues to take significant strides towards becoming truly and equitably smokefree. While recognising these and other significant and successful achievements, this report illustrates the gap between where we are now in cancer prevention and where we could be.
Pacific peoples Non-Māori/Non-Pacific peoples/Non-Asian
Mortality
State of cancer Fig 2.5
Breast
Prostate
Lung
Uterus
BowelThyroid
endocrineStomach
LeukaemiaNon-Hodgkin’s
lymphomaLiver
0 2 4 6 8 10 12 14 16 18 20
Age- and sex-standardised mortality rate per 100,000
Incidence
50 45 40 35 30 25 20 15 10 5 0Age- and sex-standardised incidence rate per 100,000

4 Pūrongo Ārai Mate Pukupuku | Cancer Prevention Report
Environments strongly influence a person’s risk of cancerEnvironmental factors play a big role in shaping health outcomes generally22,23 and cancer outcomes specifically.15,19,24 Social, political and economic factors (which sit outside of the health system) are especially influential – including the role of colonisation and racism in creating and perpetuating inequities.25-27 When looking at behaviours such as smoking, alcohol use and poor nutrition, it is important to consider the major role of environmental factors.
Although we have some degree of control over living our lives in a way that reduces the risk of cancer, the environments we live in heavily shape our actions and decisions (Figure 3). For example, what a person eats does not just depend on what they choose to eat. It also depends on what healthy or unhealthy food options are close by, how much fruit and vegetables cost relative to convenience foods and how those foods are advertised. Providing a nutritious home-cooked meal is not just a matter of will or skill. It requires the income to afford healthy ingredients, time to cook and space to cook. Clearly what a person eats is shaped by factors far beyond their control: everything from which foods are taxed or subsidised and how the food industry behaves, through to income, employment, education, working conditions and living conditions.
This report focuses mainly on how to improve environments in which people live, work, learn and play so that those environments can help to prevent cancer (and other conditions) for everyone. This report is less about what each individual can do to reduce their personal risk of cancer, recognising that building healthier environments can empower individuals and communities to determine their own futures.
Figure 3: Influences on a person’s health28
Not all environments are created equal Not all environments are created equal. This is important – it means some groups and communities have higher exposure to cancer risk factors through no action of their own. For example, there are more fast food29 and alcohol outlets30 in socioeconomically deprived areas, where more whānau
Gen
eral s
ocioeconomic, cultural and environmental conditions
Agricultureand food
production
Education
Living andworking
conditions
Water andsanitation
Health careservices
Housing
Social and community networks
Work environment
Unemployment
Individual lifestyle factors
Age, sex and hereditary factors

5Pūrongo Ārai Mate Pukupuku | Cancer Prevention Report
Māori and Pacific families live. Supermarkets in low-income areas stock a higher ratio of unhealthy to healthy foods compared with high-income areas.31 Māori also have poorer access to public transport than other ethnic groups, which means they have less opportunity to be physically active in a regular day.32 These differences in environment have real downstream consequences; for example, Māori and Pacific peoples have a higher proportion of obesity-related cancers.33,34
Māori and Pacific peoples are more exposed to cancer risk factors due to social, political and economic influences, including colonisation and racism. These influences also drive poorer access to and through the health system, contributing to unjust inequities in health outcomes.25-27
Making healthy choices is infinitely harder, and unfairly so, for some groups and communities. Where this report identifies known and avoidable differences in people’s exposure to cancer risk factors (particularly by ethnicity or socioeconomic deprivation), it uses a vertical apricot line .
Te Tiriti o Waitangi responsibilities and preventing cancerThe principles of Te Tiriti provide the foundation for stronger action on preventing cancer in Aotearoa and reducing inequitable cancer outcomes.
The principle of tino rangatiratanga is the realisation of Māori self-determination and Māori aspirations. We can support tino rangatiratanga by deconstructing racist systems and structures and increasing environments that encourage hauora and can remove unjust obstacles.
The principle of equity is fundamental to cancer prevention. Inequities in cancer are prominent: Māori are 20 percent more likely to develop cancer than non-Māori and twice as likely to die from cancer. Inequities occur along every step of the cancer continuum; for example, Māori have higher exposure to cancer risk factors, poorer access to the health system and then, once diagnosed, poorer access through it. The cancers that disproportionately affect Māori tend to both be highly preventable and have poorer outcomes.
The principle of active protection requires the Crown to act to the fullest extent practicable to achieve equitable health outcomes for Māori. For this reason, maximum effort at every step of the cancer journey is needed, but the biggest gains in achieving equitable cancer outcomes for Māori will come from stronger cancer prevention. While cancer prevention strategies are a powerful tool for reducing cancer disparities, they need to be led, designed, delivered and monitored in a way that realises this potential for Māori.
The principle of Crown and Māori working in partnership and the Crown’s obligation to provide culturally appropriate health services according to hauora Māori models of care (options) apply to cancer prevention strategies in the same way as any other health service.
Prevention is the ideal in cancer control It will always be vital to provide the best care possible for people with cancer and their whānau, across cancer screening, diagnosis, treatment, survivorship, surveillance, palliative care, end-of-life care, and cancer research. At the same time, with up to half of all cancers being preventable, a significant proportion of deaths and suffering due to cancer can be avoided. That is reason enough to maximise cancer prevention efforts in Aotearoa, but there are also other reasons.

6 Pūrongo Ārai Mate Pukupuku | Cancer Prevention Report
This report outlines evidence-based, internationally accepted, best-practice interventions to address six cancer risk factors – tobacco exposure, alcohol use, poor nutrition and excess body weight, physical inactivity, excessive exposure to ultraviolet (UV) radiation and chronic infections – and assesses how well Aotearoa is doing in each of these areas. These interventions are backed up by research and modelling, widely accepted by international and national experts, and shown to be effective when implemented well in other jurisdictions.
While the focus of this report is on cancer, stronger prevention efforts will bring substantial benefits beyond cancer alone. Most cancer risk factors are not unique to cancer and are shared by other chronic diseases such as diabetes, heart disease and strokes (Table 1). The more we do for cancer prevention, the more we do for these other conditions that also cause loss of life, preventable suffering and significant inequities in Aotearoa.
Table 1: Percentage of health loss attributable to leading modifiable risk factors, 201721
Tobacco use
8.6% of total health loss
Mainly associated with cancers, cardiovascular diseases and chronic respiratory conditions.
High body mass index 8.2%
of total health loss
Mainly associated with cardiovascular diseases. Also contributes to cancers, diabetes and musculoskeletal conditions.
Alcohol use 5.3%
of total health lossMainly associated with cancers and injuries.
Generally, prevention interventions that focus on populations and environmental influences on health have a larger impact, greater potential for equity and tend to be more cost-effective (or even cost-saving) than interventions focused on particularly high-risk individuals.35-37 For example, a volumetric tax on alcohol will have a bigger impact and be more cost-effective than residential treatment for alcohol dependence.36 This does not mean that we should only have population-based cancer prevention efforts. Action at multiple levels and by multiple stakeholders is necessary and valuable. However, getting the right mix of interventions is important. District health boards, public health units, primary care providers, non-governmental organisations and Māori and Pacific providers already work to prevent cancer (and other conditions) with individuals and communities. Stronger population-based, environment-focused interventions can amplify and sustain the impact of their work rather than undermine it. Environment-focused interventions are also more resilient when crises occur as they are less reliant on individual efficacy or a fully functional health system. Some of the parallels between cancer prevention and COVID-19 prevention efforts are discussed in the conclusion of this report, as an example.
Each year, approximately 25,000 people are diagnosed with cancer* in Aotearoa.38 By 2040, this number is predicted to increase by 40 percent.39 The higher rate will in turn increase the demand for cancer services, which will be difficult for services to meet over an extended period and may exacerbate inequities in cancer care for Māori and other population groups that already experience inequity. In the words of the immediate past Director of the International Agency for Research on Cancer (IARC), Chris Wild, ‘No country can afford to treat their way out of the cancer crisis.’
Lung
Oesophagus
* Excluding keratinocytic/non-melanoma skin cancers.

7Pūrongo Ārai Mate Pukupuku | Cancer Prevention Report
This report outlines evidence-based, internationally accepted, best-practice interventions to address six cancer risk factors – tobacco exposure, alcohol use, poor nutrition and excess body weight, physical inactivity, excessive exposure to ultraviolet (UV) radiation and chronic infections – and assesses how well Aotearoa is doing in each of these areas. These interventions are backed up by research and modelling, widely accepted by international and national experts, and shown to be effective when implemented well in other jurisdictions.
While the focus of this report is on cancer, stronger prevention efforts will bring substantial benefits beyond cancer alone. Most cancer risk factors are not unique to cancer and are shared by other chronic diseases such as diabetes, heart disease and strokes (Table 1). The more we do for cancer prevention, the more we do for these other conditions that also cause loss of life, preventable suffering and significant inequities in Aotearoa.
Table 1: Percentage of health loss attributable to leading modifiable risk factors, 201721
Tobacco use
8.6% of total health loss
Mainly associated with cancers, cardiovascular diseases and chronic respiratory conditions.
High body mass index 8.2%
of total health loss
Mainly associated with cardiovascular diseases. Also contributes to cancers, diabetes and musculoskeletal conditions.
Alcohol use 5.3%
of total health lossMainly associated with cancers and injuries.
Generally, prevention interventions that focus on populations and environmental influences on health have a larger impact, greater potential for equity and tend to be more cost-effective (or even cost-saving) than interventions focused on particularly high-risk individuals.35-37 For example, a volumetric tax on alcohol will have a bigger impact and be more cost-effective than residential treatment for alcohol dependence.36 This does not mean that we should only have population-based cancer prevention efforts. Action at multiple levels and by multiple stakeholders is necessary and valuable. However, getting the right mix of interventions is important. District health boards, public health units, primary care providers, non-governmental organisations and Māori and Pacific providers already work to prevent cancer (and other conditions) with individuals and communities. Stronger population-based, environment-focused interventions can amplify and sustain the impact of their work rather than undermine it. Environment-focused interventions are also more resilient when crises occur as they are less reliant on individual efficacy or a fully functional health system. Some of the parallels between cancer prevention and COVID-19 prevention efforts are discussed in the conclusion of this report, as an example.
Each year, approximately 25,000 people are diagnosed with cancer* in Aotearoa.38 By 2040, this number is predicted to increase by 40 percent.39 The higher rate will in turn increase the demand for cancer services, which will be difficult for services to meet over an extended period and may exacerbate inequities in cancer care for Māori and other population groups that already experience inequity. In the words of the immediate past Director of the International Agency for Research on Cancer (IARC), Chris Wild, ‘No country can afford to treat their way out of the cancer crisis.’
Lung
Oesophagus
Purpose of this reportThis report outlines evidence-based, best-practice interventions to prevent cancer across six key cancer risk factors and summarises how Aotearoa is doing in addressing each of those factors. In doing so, it aims to place renewed value on strengthening cancer prevention work to achieve the goals of fewer cancers, better survival and equity for all.
8 Pūrongo Ārai Mate Pukupuku | Cancer Prevention Report
TE HŌKAI ME TE HANGA O TĒNEI PŪRONGO SCOPE AND STRUCTURE OF THIS REPORTEach of the following sections in this report focuses on a major cancer risk factor:
• tobacco
• alcohol
• poor nutrition and excess body weight
• insufficient physical activity
• excessive exposure to ultraviolet (UV) radiation (sun)
• chronic infections (Helicobacter pylori, human papillomavirus, hepatitis B and hepatitis C, human immunodeficiency virus)
It was beyond the scope of this report to address actions to reduce workplace carcinogens and the role of formal screening programmes in cancer prevention. For a summary of both these areas, see He Pūrongo Mate Pukupuku o Aotearoa 2020: The State of Cancer in New Zealand 2020.38
For each cancer risk factor, this report answers the following questions.
• What is the connection between the risk factor and cancer?
• How big is the problem of exposure to the cancer risk factor in Aotearoa?
• How can we reduce exposure to the cancer risk factor in order to prevent cancers?
The recommendations outlined in the report are evidence-based and internationally accepted as best practice. Options that support each recommendation are accompanied by evidence of effectiveness, international precedent from other jurisdictions where available, evidence of public and/or expert support, and an assessment of how well Aotearoa is performing in that area.
9Pūrongo Ārai Mate Pukupuku | Cancer Prevention Report
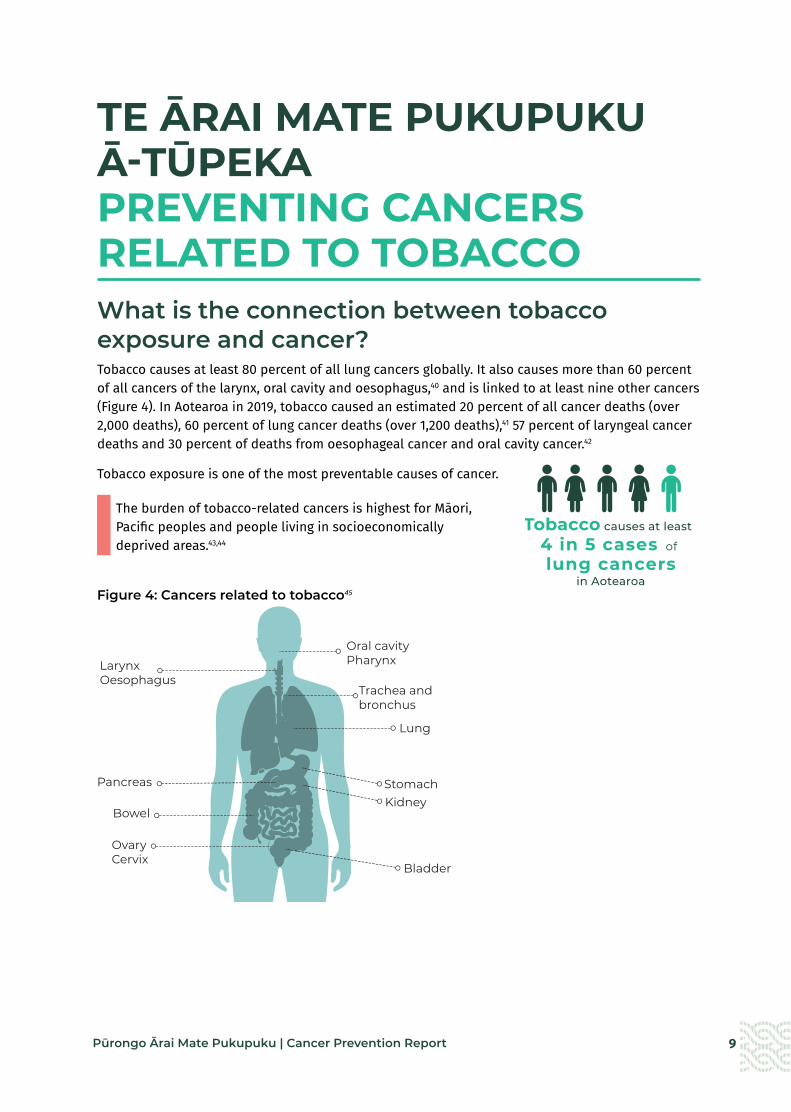
TE ĀRAI MATE PUKUPUKU Ā-TŪPEKA PREVENTING CANCERS RELATED TO TOBACCO What is the connection between tobacco exposure and cancer?Tobacco causes at least 80 percent of all lung cancers globally. It also causes more than 60 percent of all cancers of the larynx, oral cavity and oesophagus,40 and is linked to at least nine other cancers (Figure 4). In Aotearoa in 2019, tobacco caused an estimated 20 percent of all cancer deaths (over 2,000 deaths), 60 percent of lung cancer deaths (over 1,200 deaths),41 57 percent of laryngeal cancer deaths and 30 percent of deaths from oesophageal cancer and oral cavity cancer.42
Tobacco exposure is one of the most preventable causes of cancer.
The burden of tobacco-related cancers is highest for Māori, Pacific peoples and people living in socioeconomically deprived areas.43,44
Figure 4: Cancers related to tobacco45
4 in 5 cases of Tobacco causes at least
lung cancers in Aotearoa
Oesophagus
Oesophagus
Stomach
Stomach
Bowel
Bowel
Larynx
Oesophagus
Trachea and bronchus
Oesophagus
Bladder
Bowel
Stomach
Bladder
Lung
LarynxOesophagus
Bowel
Pancreas
OvaryCervix
Kidney
Oral cavityPharynx
Trachea andbronchus
10 Pūrongo Ārai Mate Pukupuku | Cancer Prevention Report
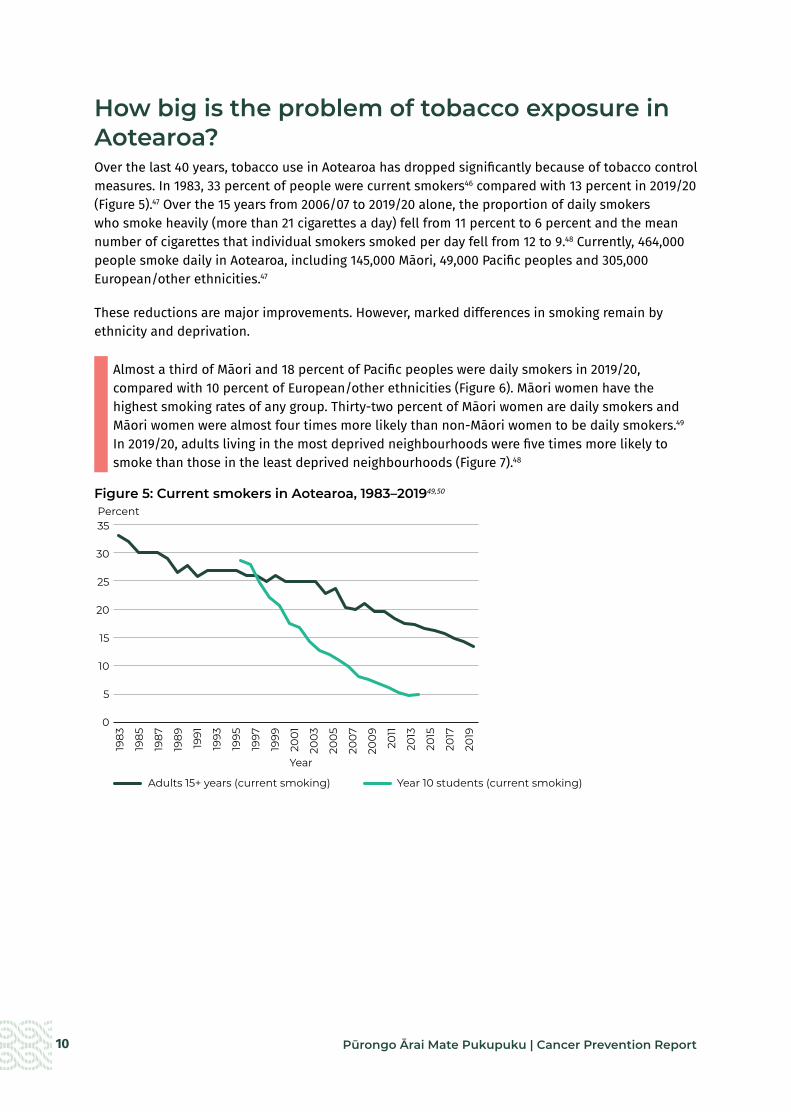
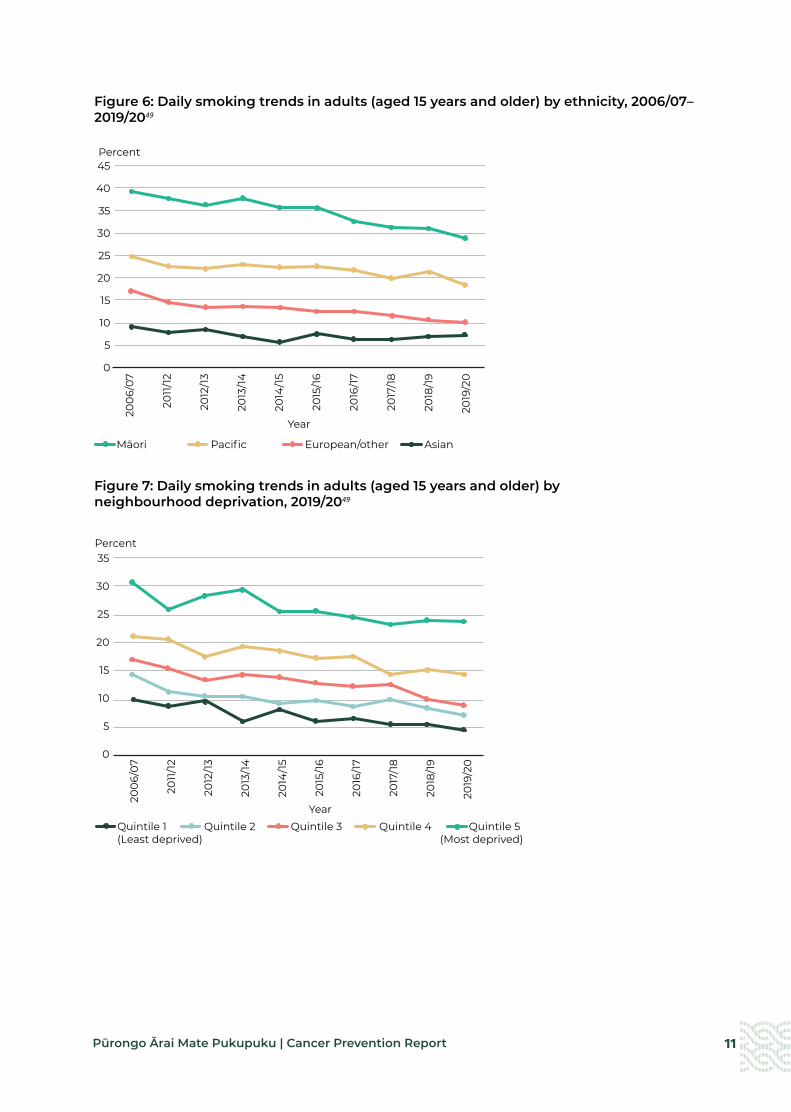
How big is the problem of tobacco exposure in Aotearoa?Over the last 40 years, tobacco use in Aotearoa has dropped significantly because of tobacco control measures. In 1983, 33 percent of people were current smokers46 compared with 13 percent in 2019/20 (Figure 5).47 Over the 15 years from 2006/07 to 2019/20 alone, the proportion of daily smokers who smoke heavily (more than 21 cigarettes a day) fell from 11 percent to 6 percent and the mean number of cigarettes that individual smokers smoked per day fell from 12 to 9.48 Currently, 464,000 people smoke daily in Aotearoa, including 145,000 Māori, 49,000 Pacific peoples and 305,000 European/other ethnicities.47
These reductions are major improvements. However, marked differences in smoking remain by ethnicity and deprivation.
Almost a third of Māori and 18 percent of Pacific peoples were daily smokers in 2019/20, compared with 10 percent of European/other ethnicities (Figure 6). Māori women have the highest smoking rates of any group. Thirty-two percent of Māori women are daily smokers and Māori women were almost four times more likely than non-Māori women to be daily smokers.49 In 2019/20, adults living in the most deprived neighbourhoods were five times more likely to smoke than those in the least deprived neighbourhoods (Figure 7).48
Figure 5: Current smokers in Aotearoa, 1983–201949,50
1983
1985
1987
1989
1991
1993
1995
1997
1999
200
1
200
3
200
5
200
7
200
9
2011
2013
2015
2017
2019
35
30
25
20
15
10
5
0
Percent
Adults 15+ years (current smoking) Year 10 students (current smoking)
Year
11Pūrongo Ārai Mate Pukupuku | Cancer Prevention Report
Figure 6: Daily smoking trends in adults (aged 15 years and older) by ethnicity, 2006/07–2019/2049
Figure 7: Daily smoking trends in adults (aged 15 years and older) by neighbourhood deprivation, 2019/2049
200
6/0
7
2011
/12
2012
/13
2013
/14
2014
/15
2015
/16
2016
/17
2017
/18
2018
/19
2019
/20
45
40
35
30
25
20
15
10
5
0
Percent
Māori Pacific European/other Asian
Cancer Prevention Fig 7
Year
200
6/0
7
2011
/12
2012
/13
2013
/14
2014
/15
2015
/16
2016
/17
2017
/18
2018
/19
2019
/20
35
30
25
20
15
10
5
0
Percent
Quintile 1 Quintile 2 Quintile 3 Quintile 4 Quintile 5(Least deprived) (Most deprived)
Cancer Prevention Fig 8
Year

12 Pūrongo Ārai Mate Pukupuku | Cancer Prevention Report
How can we prevent cancers related to tobacco exposure?The interventions summarised below (and expanded on under the focus areas that follow) are those considered most likely to allow Aotearoa to become smokefree. They are in line with the recommendations of the ASPIRE2025 group of Aotearoa tobacco control experts,51 national and international organisations. Implementing these options would also mean fulfilment of our obligations under the World Health Organization (WHO) Framework Convention on Tobacco Control.52
In December 2021, the New Zealand government launched the Smokefree Aotearoa 2025 Action Plan, setting out the actions Aotearoa will take over the next four years and beyond to achieve Smokefree Aotearoa 2025.53 Te Aho o Te Kahu fully supports the actions outlined in the smokefree plan.
Summary of options to prevent cancers related to tobacco exposure
a Reduce the availability of tobacco.
• Restrict the number and density of outlets that can sell tobacco.
a Reduce the addictiveness and palatability of tobacco.
• Introduce legislative restrictions on the amount of nicotine in cigarettes and the use of additives, flavours, filters and design innovations.
a Reduce the appeal and accessibility of tobacco for youth and young adults.
• Increase the purchasing age for tobacco by one year each year (creating a smokefree/tobacco-free generation).
• Prohibit smoking in outdoor areas of bars and restaurants.
• Restrict tobacco product placement across all media forms.
a Decrease acceptability of (or denormalise) smoking in outdoor spaces.
• Introduce comprehensive restrictions on smoking in outdoor spaces.

13Pūrongo Ārai Mate Pukupuku | Cancer Prevention Report
Focus area: Reduce the availability of tobacco
What do we know about the impact of tobacco being widely available?
Adolescent smoking becomes more common as the density of tobacco retailers increases,54,55 especially with greater density around schools.56 Higher outlet density normalises tobacco use, increases its acceptability, and can reduce the likelihood of successful smoking cessation.57,58
Nationally and internationally, socioeconomically deprived areas tend to have more tobacco outlets than other areas.57,59,60
Action: Restrict the number and density of outlets that can sell tobacco
What is the evidence?
Interventions to reduce tobacco outlet density include using a mix of strategies together, such as reducing the number of outlets, licensing and restricting tobacco sales to specific outlets. For example, licensing can reduce tobacco outlet density when it involves a higher fee and can restrict the number or location of outlets.61,62 Aotearoa modelling studies show that interventions to reduce tobacco outlet density are highly likely to reduce smoking prevalence, improve health outcomes and be cost-saving.63-66
Hungary enacted legislation in 2013 mandating that tobacco could only be sold at a limited number of government-licensed outlets, reducing the number of tobacco outlets from 42,000 to 7,000.67 In 2020, the Netherlands passed legislation to ban tobacco sales in supermarkets and petrol stations.68 Many countries (such as Canada, Australia, Scotland and Ireland) and some states in the USA require tobacco outlets to be licensed.61,62,69
What is Aotearoa doing currently?
Currently Aotearoa has no restrictions on who can sell tobacco and where tobacco can be sold. Retailers are not required to have a licence to sell tobacco.
A key action in the Smokefree Aotearoa 2025 Action Plan is to introduce an amendment Bill to only allow smoked tobacco products to be sold by authorised retailers, in order to decrease the number of retailers and ensure retail supply is not concentrated in the most deprived neighbourhoods.53
14 Pūrongo Ārai Mate Pukupuku | Cancer Prevention Report
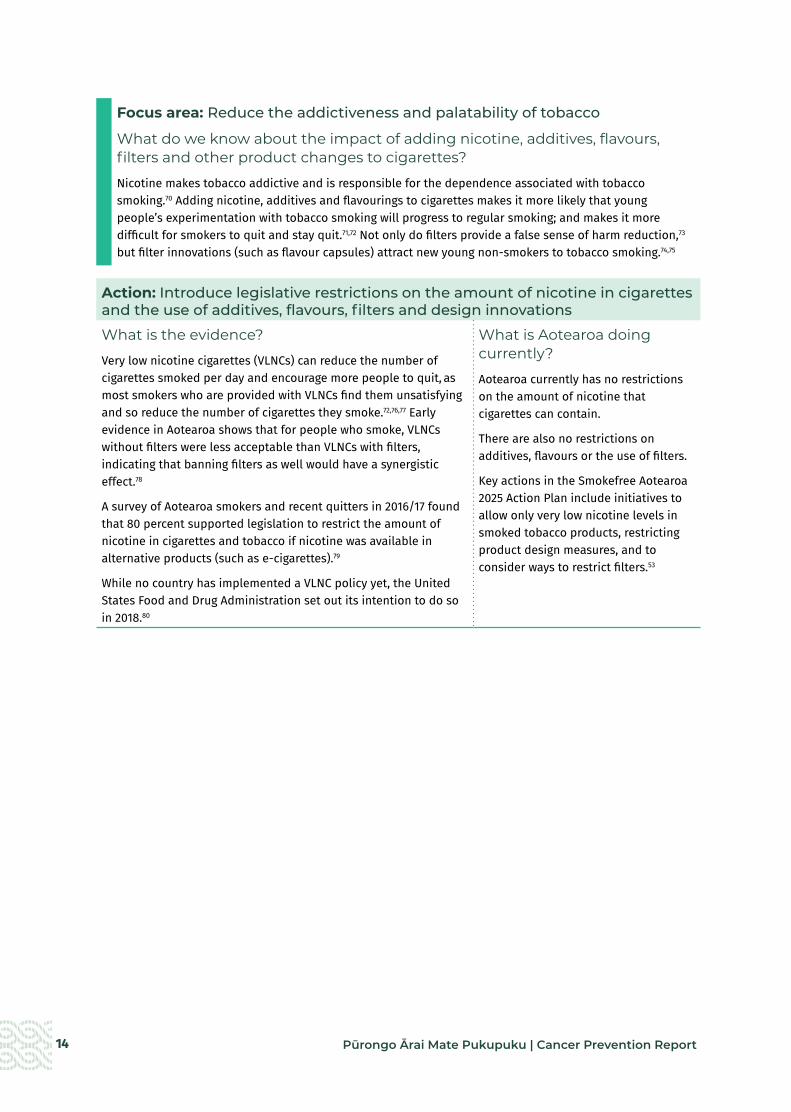
Focus area: Reduce the addictiveness and palatability of tobacco
What do we know about the impact of adding nicotine, additives, flavours, filters and other product changes to cigarettes?
Nicotine makes tobacco addictive and is responsible for the dependence associated with tobacco smoking.70 Adding nicotine, additives and flavourings to cigarettes makes it more likely that young people’s experimentation with tobacco smoking will progress to regular smoking; and makes it more difficult for smokers to quit and stay quit.71,72 Not only do filters provide a false sense of harm reduction,73 but filter innovations (such as flavour capsules) attract new young non-smokers to tobacco smoking.74,75
Action: Introduce legislative restrictions on the amount of nicotine in cigarettes and the use of additives, flavours, filters and design innovations
What is the evidence?
Very low nicotine cigarettes (VLNCs) can reduce the number of cigarettes smoked per day and encourage more people to quit, as most smokers who are provided with VLNCs find them unsatisfying and so reduce the number of cigarettes they smoke.72,76,77 Early evidence in Aotearoa shows that for people who smoke, VLNCs without filters were less acceptable than VLNCs with filters, indicating that banning filters as well would have a synergistic effect.78
A survey of Aotearoa smokers and recent quitters in 2016/17 found that 80 percent supported legislation to restrict the amount of nicotine in cigarettes and tobacco if nicotine was available in alternative products (such as e-cigarettes).79
While no country has implemented a VLNC policy yet, the United States Food and Drug Administration set out its intention to do so in 2018.80
What is Aotearoa doing currently?
Aotearoa currently has no restrictions on the amount of nicotine that cigarettes can contain.
There are also no restrictions on additives, flavours or the use of filters.
Key actions in the Smokefree Aotearoa 2025 Action Plan include initiatives to allow only very low nicotine levels in smoked tobacco products, restricting product design measures, and to consider ways to restrict filters.53

15Pūrongo Ārai Mate Pukupuku | Cancer Prevention Report
Focus area: Reduce the appeal and accessibility of tobacco for youth and young adults
What do we know about the impact for young people of having appealing and accessible tobacco products?
Although daily smoking rates in young people aged under 25 years have fallen substantially over the last 15 years, smoking rates increase rapidly with age: they rise from 3 percent of those aged 15–17 years to 13 percent of those aged 18–24 years and 17 percent of those aged 25–34 years.47 Young people are continuing to start smoking, and almost all smoking starts before the age of 25 years.81,82
There are significant inequities in the prevalence of smoking in youth and young adults, with higher prevalence in young Māori and Pacific peoples. In 2019/20, a quarter of Māori and 15 percent of Pacific peoples aged 15–24 years were daily smokers compared with 9.7 percent European/other.49
Action: Increase the purchasing age for tobacco by one year each year (creating a smokefree/tobacco-free generation)
What is the evidence?
Preventing young people from starting to smoke will have the biggest impact on smoking prevalence in the long term and the biggest impact on reducing ethnic inequities in smoking prevalence.66,83-85
The tobacco-free generation (TFG) policy effectively bans tobacco sales to individuals born after a certain set year. Aotearoa modelling shows that a TFG policy would reduce smoking rates significantly (as much as halving smoking prevalence in those aged under 45 years within 14 years) and reduce ethnic disparities in smoking.66,85
In the USA, early evaluations of the impact of banning sales of tobacco to people younger than 21 years have shown a small reduction in smoking in those aged 18–20 years.84
No country has introduced a TFG policy. It was introduced in Balanga City in the Philippines in 2016, but faced legal challenges from the tobacco industry.86
A 2017 Aotearoa survey of adult smokers and recent quitters found that 78 percent of respondents, including 70 percent of those aged 18–24 years, supported a TFG policy.85
What is Aotearoa doing currently?
Since 1997, it has been illegal to sell tobacco to anyone younger than 18 years in a public place. Aotearoa has no TFG policy currently.
A key action in the Smokefree Aotearoa 2025 Action Plan includes introducing an amendment Bill to prohibit the sale, delivery and supply of smoked tobacco products to persons born after a certain date to a create a smokefree generation.53
16 Pūrongo Ārai Mate Pukupuku | Cancer Prevention Report
Action: Prohibit smoking in outdoor areas of bars and restaurants
What is the evidence?
Nationally and internationally, use of tobacco and alcohol together is common in youth and young adults,81,87,88 particularly in social settings such as bars and restaurants.87 Providing comfortable outdoor smoking spaces in bars facilitates smoking and contributes to normalising smoking for young adults in Aotearoa.Importantly, smokers who did not smoke daily (self-identifying themselves as ‘social smokers’ or non-smokers) indicated that they would not smoke when out drinking if there were no comfortable spaces to smoke.87
Many jurisdictions in other countries (such as the USA, Australia and Canada) have comprehensive laws for a range of smokefree outdoor areas.89 For example, since 2006, Queensland has had a smokefree law for outdoor dining businesses.90
A survey in Auckland in 2013 found 73 percent support for smokefree outdoor dining.91
What is Aotearoa doing currently?
The Smokefree Environments and Regulated Products Act 1990 prohibits smoking inside hospitality venues. However, it does not restrict smoking in ‘open areas’ or outdoor environments of bars and restaurants.
Many councils have policies or bylaws prohibiting smoking in outdoor dining areas on council footpaths.92-95 Some councils have introduced discounts for outdoor dining and bar venues on the fees for using public space, if they are smokefree.96 These measures are not mandated nationally, however.
Action: Restrict tobacco product placement across all media forms
What is the evidence?
Internationally, it is common for media popular with youth and young adults – such as TV and streaming services, movies, music videos and videogames – to show tobacco use and this trend is increasing.97-101 This serves to normalise tobacco smoking and conveys the idea that the prevalence of smoking is much higher than it is in reality.97
More than 80 percent of New Zealanders aged 14–15 years had noticed people or characters smoking in media in 2018. Those who had never smoked were twice as likely to be considered susceptible to smoking (ie, appearing less committed to remain smokefree in the future) if they had noticed smoking in the media.102
What is Aotearoa doing currently?
The Smokefree Environments and Regulated Products Act 1990 prohibits all advertising, marketing and sponsorship of tobacco products. However, depicting tobacco or having product placements in many common forms of media would be exempt from this advertising prohibition.
The process of classifying movies and television programmes in Aotearoa does not currently consider their tobacco-related content.103

17Pūrongo Ārai Mate Pukupuku | Cancer Prevention Report
Focus area: Decrease acceptability of (or denormalise) smoking in outdoor spaces
What do we know about the impact of smoking being allowed in outdoor spaces?
Exposure to smoking in outdoor spaces, such as in hospitality settings, contributes to normalising smoking and providing cues to smoke.87,95 It is also associated with a reduced likelihood of a successful quit attempt.104
In Aotearoa, seeing smoking around you at a neighbourhood level increases the likelihood of starting smoking.105
Action: Introduce comprehensive restrictions on smoking in outdoor spaces
What is the evidence?
Outdoor smoking bans help to normalise non-smoking and are associated with reduced smoking prevalence, increased quit rates and fewer relapses.89,104,106
Many jurisdictions in other countries (such as the USA, Australia and Canada) have comprehensive laws for a range of smokefree outdoor areas.89
There is widespread public support in Aotearoa for smokefree outdoor spaces such as greenspaces, entrances to buildings, transport waiting areas and venues with outdoor dining.95,107
What is Aotearoa doing currently?
Currently, legislation only prohibits smoking in outdoor areas around schools and early childhood centres. It does not prohibit smoking in any other outdoor spaces.
Many local councils, district health boards, universities, iwi and some commercial enterprises have voluntarily implemented smokefree outdoor policies.95,108 These measures, however, are inconsistent and not nationally mandated.
The actions described above would occur in addition to intensifying existing tobacco control actions, as part of a comprehensive, multi-faceted tobacco control strategy. Existing tobacco control strategies are effective and cost-saving,71 but they have been less effective for Māori, Pacific peoples and low-income communities.47,48 For this reason, it is necessary to intensify and innovate with current activities in ways that are appropriate to these groups, including by supporting Māori to find and build solutions (by Māori, for Māori initiatives). The following three supporting actions would enhance or extend existing tobacco control activity.
• Undertake enhanced mass and social media campaigns. Mass media campaigns can effectively and cost-effectively reduce smoking prevalence and uptake among adults and young people, and is likely to have similar impacts on priority groups.109 Aotearoa has a history of campaigns focusing on the priority populations, including QuitStrong, which has been in the market since 2019.110 A 2014 review of mass media campaigns in Aotearoa found they were poorly funded and most of them failed to include approaches that have the greatest impact on promoting quit attempts and reducing smoking initiation.111 The Smokefree Aotearoa 2025 Action Plan includes commitment to increasing health promotion and community mobilisation, with leadership from the Smokefree Aotearoa 2025 Taskforce as well as Pacific communities.53
• Introduce additional measures to increase the price of tobacco products, such as setting a minimum unit price to make them less affordable for low-income smokers. In Aotearoa, the availability and sales of budget-brand tobacco products have increased.112,113 The evidence on the impact of minimum price regulation, a relatively new policy measure, is promising when it is part of a multifaceted strategy.109

18 Pūrongo Ārai Mate Pukupuku | Cancer Prevention Report
• Provide enhanced targeted smoking cessation support and advice for priority groups. Smokers have several options for accessing support to stop smoking in Aotearoa currently, including the national Quitline service and community-based stop smoking services.114 Evaluations have consistently found Quitline to be effective at stimulating quit attempts, particularly for Māori and those living in the most deprived communities.115,116 The Smokefree Aotearoa 2025 Action Plan has a strong focus and multiple initiatives to increase evidence-based smoking services.53
The actions in the Smokefree Aotearoa 2025 Action Plan53 offer an unprecedented opportunity to eliminate smoking disparities and tackle one of the most preventable causes of cancer. If the action plan is implemented with strong Māori governance and a focus on equity, it will save thousands of lives and change the face of cancer for Aotearoa.
19Pūrongo Ārai Mate Pukupuku | Cancer Prevention Report
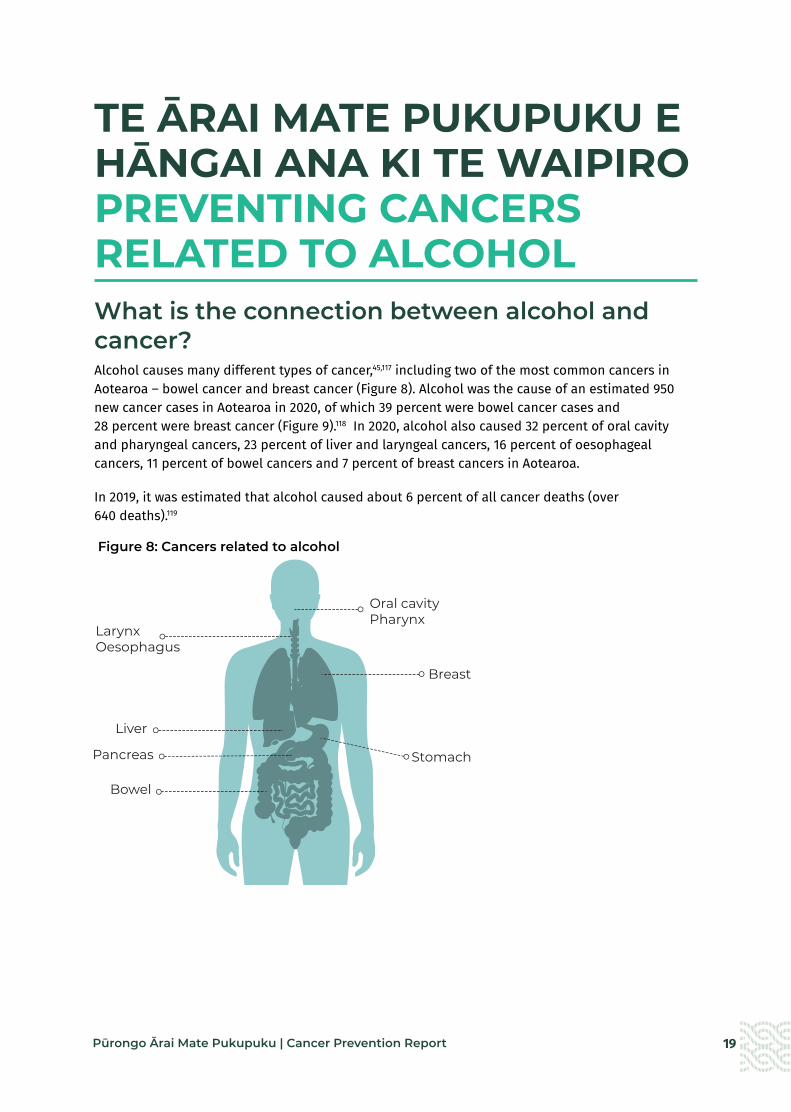
TE ĀRAI MATE PUKUPUKU E HĀNGAI ANA KI TE WAIPIRO PREVENTING CANCERS RELATED TO ALCOHOLWhat is the connection between alcohol and cancer?Alcohol causes many different types of cancer,45,117 including two of the most common cancers in Aotearoa – bowel cancer and breast cancer (Figure 8). Alcohol was the cause of an estimated 950 new cancer cases in Aotearoa in 2020, of which 39 percent were bowel cancer cases and 28 percent were breast cancer (Figure 9).118 In 2020, alcohol also caused 32 percent of oral cavity and pharyngeal cancers, 23 percent of liver and laryngeal cancers, 16 percent of oesophageal cancers, 11 percent of bowel cancers and 7 percent of breast cancers in Aotearoa.
In 2019, it was estimated that alcohol caused about 6 percent of all cancer deaths (over 640 deaths).119
Figure 8: Cancers related to alcohol
Stomach
Breast
LarynxOesophagus
Bowel
Pancreas
Liver
Oral cavityPharynx

20 Pūrongo Ārai Mate Pukupuku | Cancer Prevention Report
Figure 9: Estimated proportion of new cases in 2020 attributable to alcohol drinking, Aotearoa, both sexes118
All types of alcohol – beer, wine and spirits – increase the risk of developing cancer. The risk increases with the average amount of alcohol consumed each day and adds up over a lifetime. As any amount of alcohol consumption increases the risk of cancer, there is no safe minimum level of alcohol use.120 For example, consuming even one standard drink of alcohol each day increases the risk of developing breast cancer by around 7–10 percent.117, 121 Because more people are light or moderate drinkers rather than heavy drinkers, a large part of the alcohol-related cancer burden occurs among light or moderate drinkers.120
Māori experience a higher burden of alcohol-related cancers. In 2012, Māori lost an average of 12.7 years of life from alcohol-attributable cancers compared with 10.1 years for non-Māori.122
How big is the problem of alcohol use in Aotearoa? Most adults (82 percent) in Aotearoa drink alcohol (Figure 10).49 Almost two in five adults (37 percent) in Aotearoa drink above the low-risk drinking recommendations (Figure 11).123 New Zealanders drink more alcohol each year (10.7 litres per person aged 15 years and older) than both the global average (5.8 litres per person) and the average for high-income countries (10 litres per person).124 In 2019, enough alcohol was available for consumption for every adult in Aotearoa to consume two standard drinks per day,125 which is equivalent to almost two bottles of wine per person each week.126
The volume of alcohol available for consumption has not changed significantly since 2005 (Figure 12).127 Furthermore, surveys show that no change has occurred in the prevalence of past-year drinkers since 2006 or in the prevalence of hazardous and heavy episodic drinking since 2015 (when data began to be collected) (Figure 13).49
Other6.4%
Oesophagus6%
Liver10.1%
Oral cavity10.6%
Breast28%
Bowel39%
950new
cancers
2 in 5 cases of bowel cancers in Aotearoa
Alcohol causes

21Pūrongo Ārai Mate Pukupuku | Cancer Prevention Report
Figure 10: Patterns of alcohol use in Aotearoa, 2019/2049,123
Figure 11: Low-risk drinking advice128
No more than . . . No more than . . . No alcohol
Reduce your long-term health risks Pregnant women Reduce your risk of injury
2standard drinks
3standard drinks
4standard drinks
5standard drinks
0standard drinks
Daily On any single occasion and no more
than 10 a week and no more
than 15 a week
and at least 2 alcohol-free
days per week
There is no known safe
level of alcohol use at any stage
of pregnancy
Four in five adults (aged 15 and over) drank alcohol in
the last year
Two in five adults (aged 18 years and older) drank above the recommended low-risk drinking
advice

22 Pūrongo Ārai Mate Pukupuku | Cancer Prevention Report
Figure 12: Volume of alcoholic beverages available for consumption in Aotearoa, by type, 2005–2020125
200
5
200
6
200
7
200
8
200
9
2010
2011
2012
2013
2014
2015
2016
2017
2018
2019
2020
500
400
300
200
100
0
Litres (million)
Beer Wine Spirit and spirit-based
Cancer Prevention Fig 12
Year
Figure 13: Alcohol use prevalence trends, 2006/07–2019/2049
The amount of alcohol consumed varies by gender, ethnicity, age and deprivation. Drinking alcohol in the past week was more common among New Zealand Europeans/other, men aged 45–64 years and those living in the least deprived areas.129 Pacific peoples, Asian men and those from high-deprivation areas are less likely to have consumed alcohol in the past year. However, Māori and Pacific peoples, those aged 18–24 years and those from the most deprived areas are more likely to drink more than the daily low-risk drinking recommendations129 and consume alcohol hazardously (Figure 14 and Figure 15).49 Although the legal age for purchasing alcohol is 18 years, over half of those aged 15–17 years drank alcohol in the past year.49
90
80
70
60
50
40
30
20
10
0
Past year drinkers Heavy episodic drinking at least monthly-Hazardous drinkers Heavy episodic drinking at least weekly
Percent
200
6/0
7
200
7/0
8
200
8/0
9
200
9/10
2010
/11
2011
/12
2012
/13
2013
/14
2014
/15
2015
/16
2016
/17
2017
/18
2018
/19
2019
/20
Year

23Pūrongo Ārai Mate Pukupuku | Cancer Prevention Report
Figure 14: Percentage of adults (aged 15 years and older) using alcohol by ethnicity, 2019/2049
Figure 15: Percentage of adults (aged 15 years and older) using alcohol by neighbourhood deprivation, 2019/2049
100
90
80
70
60
50
40
30
20
10
0
Drank in the past year Drank hazardously in the past year
Ethnicity
Māori Pacific Asian New Zealand European/Other
Percent
100
90
80
70
60
50
40
30
20
10
0
Drank in the past year Drank hazardously in the past year
Neighbourhood deprivation
Quintile 1 Quintile 2 Quintile 3 Quintile 4 Quintile 5(Least deprived) (Most deprived)
Percent
24 Pūrongo Ārai Mate Pukupuku | Cancer Prevention Report
How can we prevent cancers related to alcohol use?The interventions summarised below (and expanded on under the focus areas that follow) are those considered most likely to substantially reduce alcohol consumption and ultimately prevent alcohol-related cancers. They are in line with evidence-based recommendations for Aotearoa from the 2010 Law Commission review of the alcohol laws in Aotearoa,130 the 2014 Ministerial Forum on Alcohol Advertising and Sponsorship,131 the 2018 Mental Health and Addiction Inquiry,132 and Alcohol Healthwatch.133 They are also consistent with recommendations from the World Health Organization SAFER initiative to reduce alcohol-related harm,134 as well as those of other national and international organisations. These recommendations broadly align with the district health board joint position statement on the Sale and Supply of Alcohol Act released in August 2021.135
Summary of options to prevent cancers related to alcohol use
a Reduce the affordability of alcohol.
• Increase alcohol excise tax.
• Introduce a minimum unit price (a mandatory lowest retail price per standard drink of alcohol).
a Reduce the availability and accessibility of alcohol.
• Decrease the number and density of licensed premises.
• Decrease trading hours – particularly for off-licence outlets.
• Increase the legal purchase age for alcohol from 18 years to 20 years.
a Reduce alcohol advertising, marketing and sponsorship.
• Enact and enforce comprehensive restrictions on volume and content of alcohol advertising and sponsorship across all environments.
a Support health services to reduce harm from alcohol.
• Strengthen screening and brief interventions to reduce alcohol consumption.
25Pūrongo Ārai Mate Pukupuku | Cancer Prevention Report
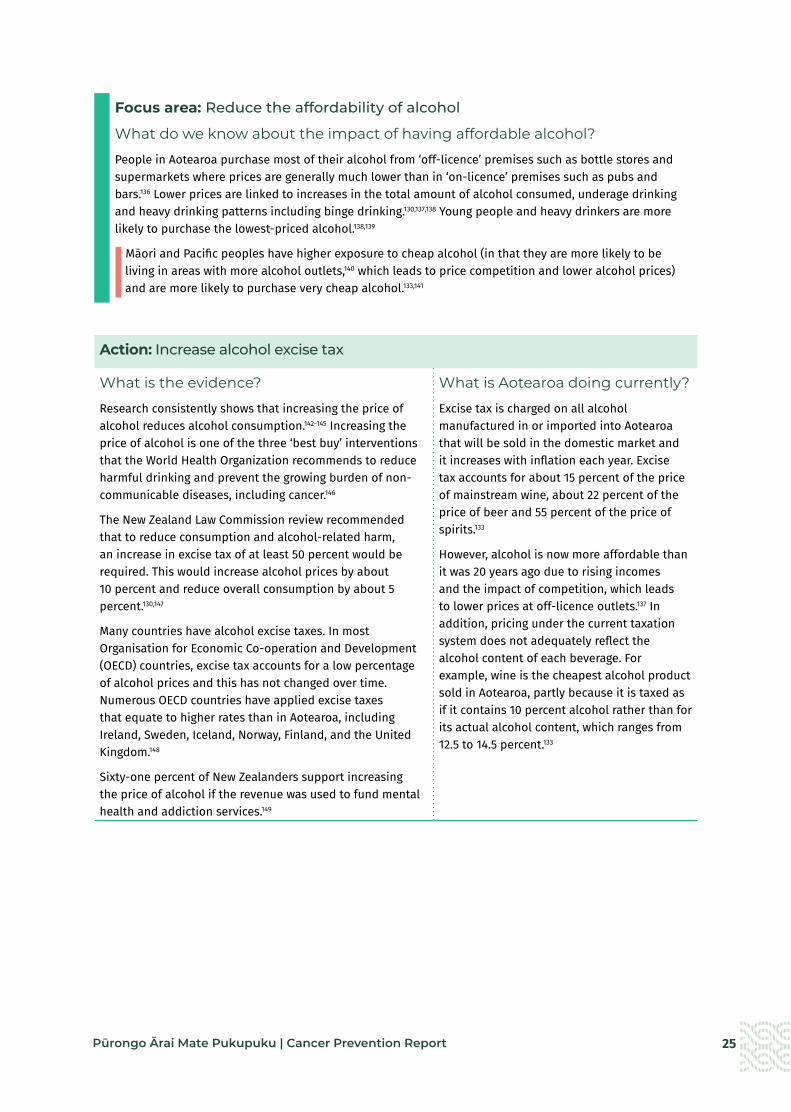
Focus area: Reduce the affordability of alcohol
What do we know about the impact of having affordable alcohol?
People in Aotearoa purchase most of their alcohol from ‘off-licence’ premises such as bottle stores and supermarkets where prices are generally much lower than in ‘on-licence’ premises such as pubs and bars.136 Lower prices are linked to increases in the total amount of alcohol consumed, underage drinking and heavy drinking patterns including binge drinking.130,137,138 Young people and heavy drinkers are more likely to purchase the lowest-priced alcohol.138,139
Māori and Pacific peoples have higher exposure to cheap alcohol (in that they are more likely to be living in areas with more alcohol outlets,140 which leads to price competition and lower alcohol prices) and are more likely to purchase very cheap alcohol.133,141
Action: Increase alcohol excise tax
What is the evidence?
Research consistently shows that increasing the price of alcohol reduces alcohol consumption.142-145 Increasing the price of alcohol is one of the three ‘best buy’ interventions that the World Health Organization recommends to reduce harmful drinking and prevent the growing burden of non-communicable diseases, including cancer.146
The New Zealand Law Commission review recommended that to reduce consumption and alcohol-related harm, an increase in excise tax of at least 50 percent would be required. This would increase alcohol prices by about 10 percent and reduce overall consumption by about 5 percent.130,147
Many countries have alcohol excise taxes. In most Organisation for Economic Co-operation and Development (OECD) countries, excise tax accounts for a low percentage of alcohol prices and this has not changed over time. Numerous OECD countries have applied excise taxes that equate to higher rates than in Aotearoa, including Ireland, Sweden, Iceland, Norway, Finland, and the United Kingdom.148
Sixty-one percent of New Zealanders support increasing the price of alcohol if the revenue was used to fund mental health and addiction services.149
What is Aotearoa doing currently?
Excise tax is charged on all alcohol manufactured in or imported into Aotearoa that will be sold in the domestic market and it increases with inflation each year. Excise tax accounts for about 15 percent of the price of mainstream wine, about 22 percent of the price of beer and 55 percent of the price of spirits.133
However, alcohol is now more affordable than it was 20 years ago due to rising incomes and the impact of competition, which leads to lower prices at off-licence outlets.137 In addition, pricing under the current taxation system does not adequately reflect the alcohol content of each beverage. For example, wine is the cheapest alcohol product sold in Aotearoa, partly because it is taxed as if it contains 10 percent alcohol rather than for its actual alcohol content, which ranges from 12.5 to 14.5 percent.133
26 Pūrongo Ārai Mate Pukupuku | Cancer Prevention Report
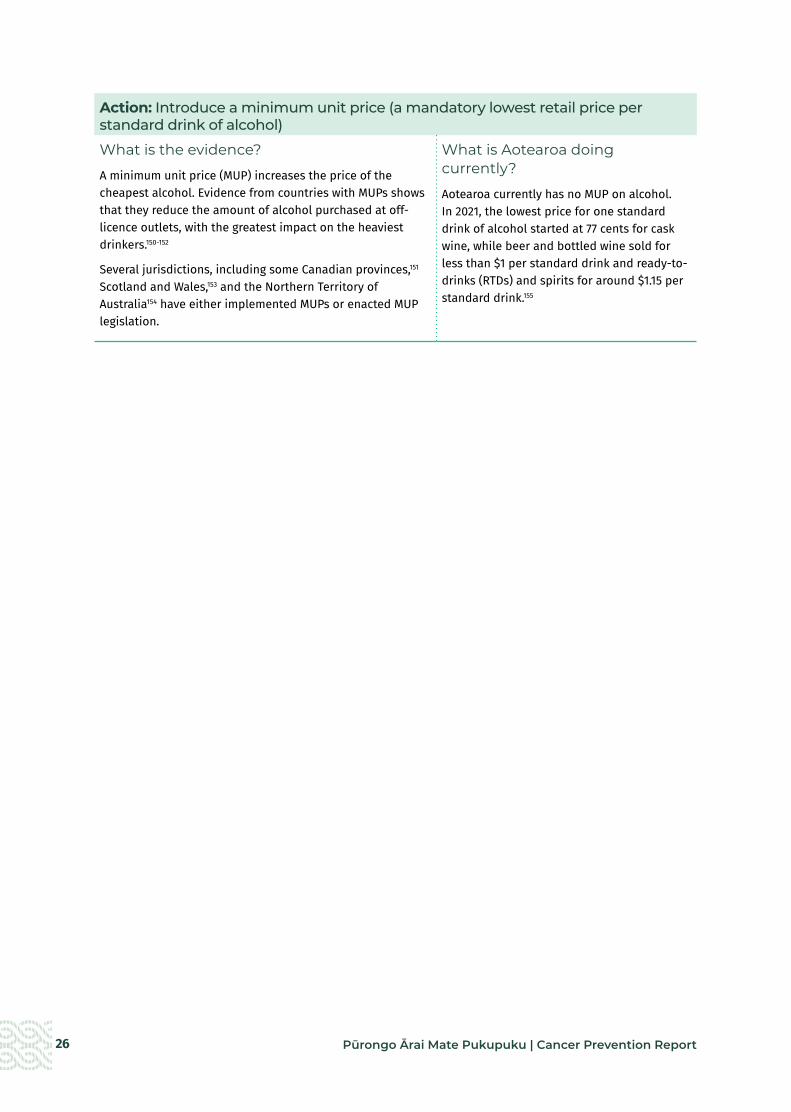
Action: Introduce a minimum unit price (a mandatory lowest retail price per standard drink of alcohol)
What is the evidence?
A minimum unit price (MUP) increases the price of the cheapest alcohol. Evidence from countries with MUPs shows that they reduce the amount of alcohol purchased at off-licence outlets, with the greatest impact on the heaviest drinkers.150-152
Several jurisdictions, including some Canadian provinces,151 Scotland and Wales,153 and the Northern Territory of Australia154 have either implemented MUPs or enacted MUP legislation.
What is Aotearoa doing currently?
Aotearoa currently has no MUP on alcohol. In 2021, the lowest price for one standard drink of alcohol started at 77 cents for cask wine, while beer and bottled wine sold for less than $1 per standard drink and ready-to-drinks (RTDs) and spirits for around $1.15 per standard drink.155

27Pūrongo Ārai Mate Pukupuku | Cancer Prevention Report
Focus area: Reduce the availability and accessibility of alcohol
What do we know about the impact of having widely available and easily accessible alcohol?
A higher number and density of outlets (particularly off-licence outlets),156,157 and longer trading hours are linked to higher levels of alcohol consumption and higher rates of hazardous drinking.130,139,158 A lower minimum alcohol purchasing age is associated with more frequent drinking and higher rates of hazardous drinking and alcohol-related harm in young people.159 Nationally and internationally, it is also clear that drinking habits established in adolescence and early adulthood persist over a person’s lifetime,160,161 and starting drinking at an earlier age increases the likelihood of heavy and binge drinking patterns.162
More outlets are in socioeconomically deprived areas, which is also where disproportionate numbers of whānau Māori and Pacific families live. Young Māori and Pacific males, young European females, and middle-aged and older males experience the most harm related to high density of alcohol outlets or living in close proximity to alcohol outlets.163,164
Action: Decrease the number and density of licensed premises
What is the evidence?
Good evidence indicates that increases in outlet density lead to higher alcohol consumption.157,165,166 More limited evidence links reductions in the number and/or density of off-licence outlets to lower alcohol consumption.167
In Australia and the United Kingdom, cumulative impact policies (in places where there is concern about the impacts from existing alcohol outlets) have been implemented to try to limit the growth of alcohol availability.168 In Baltimore, USA, land use regulation has been changed to prohibit off-licence premises in residential zones, which has included the closure of over 200 outlets.169
Fifty-four percent of New Zealanders supported having fewer places that sell alcohol in local communities.170
What is Aotearoa doing currently?
The Sale and Supply of Alcohol Act 2012 (SSAA) allows for councils to develop local alcohol policies (LAPs) to restrict outlet location, density and trading hours. It also allows licensing committees to reject new licences and restrict trading hours if there is sufficient evidence of acute health or social harms.
However, LAPs are voluntary and are subject to appeal. In 2020, 41 of 67 (61%) councils had adopted a LAP but this did not include Auckland, Hamilton, Wellington or Christchurch (the biggest population centres).133 Cumbersome statutory processes and a litigious industry have prevented or delayed some councils from adopting LAPs. Additionally, the SSAA does not provide for Māori input into LAPs or licensing decisions. LAPs apply to new licences and have limited ability to reduce the number or density of existing alcohol outlets.133
In 2017, few LAPs contained strong restrictions to alcohol outlet availability, with many restrictions weakened or removed during the appeals process.133 For example, no adopted LAPs included restrictions to the location of outlets (beyond those in local district plans) and very few included a cap on the total number of outlets.163 Very few applications for new licences are refused each year.171
A review of the SSAA in 2018 found that it has had only limited impact on alcohol availability, with no change seen in the total number of licensed premises from 2013 to 2015.172 In 2020 more than 11,000 businesses sold alcohol in Aotearoa,133 which is similar to the number of outlets in 2014.173

28 Pūrongo Ārai Mate Pukupuku | Cancer Prevention Report
Action: Decrease trading hours – particularly for off-licence outlets
What is the evidence?
Restricting trading hours reduces consumption of alcohol.145,167 It can also result in fewer assaults.174,175
Aotearoa surveys show that over 60 percent of people support reducing the hours that alcohol can be sold.176
What is Aotearoa doing currently?
The SSAA sets the following maximum default opening hours:
• off-licence premises (such as supermarkets and bottle stores): 7 am to 11 pm
• clubs and on-licence premises: 8 am to 4 am.
In 2017, only one out of 29 adopted LAPs had a more restrictive opening time for off-licences than the maximum prescribed in the SSAA, but most had more restrictive closing times. For on-licence premises, closing times were generally between 1 and 3 am for residential areas and were between 2 and 3 am for urban areas. For off-licence premises, most closing times were either 9–9.30 pm (32 percent) or 10 pm (45 percent). Closing times for supermarkets and bottle stores generally became later following appeals.133
Action: Increase the legal purchase age for alcohol from 18 years to 20 years
What is the evidence?
Internationally, a higher minimum drinking age is associated with starting to drink alcohol at an older age and a decrease in the frequency of heavy drinking.159
The USA 1984 National Minimum Purchase Age Act encouraged states to adopt a purchase age of 21 years. In settings where this was adopted, the percentage of alcohol-related motor vehicle fatalities among young adults decreased.177
What is Aotearoa doing currently?
It is illegal for those aged under 18 years to purchase alcohol but Aotearoa has no restrictions on the age at which alcohol can be consumed.
The purchasing age for alcohol was reduced from 20 years to 18 years in 1999. In the five years following the change, the proportion of drinkers aged 18–19 years increased, as did the frequency of drinking and drinking-related problems in this age group. Similarly those aged 16–17 years consumed alcohol more frequently and in greater quantities.178
Focus area: Reduce alcohol advertising, marketing and sponsorship
What we know about the impact of widespread advertising and marketing of alcohol?
Children and adolescents are especially susceptible to alcohol advertising. Exposure to advertising is associated with starting to drink alcohol at a younger age and an increase in the amount of alcohol that young people consume.138,179-181 Being exposed to alcohol sponsorship of sports is linked to increased alcohol consumption by children and adult sporting participants.182
Children in Aotearoa are regularly exposed to alcohol marketing (for example, outside shops, in sporting venues and on sporting merchandise). On average, children were exposed to 4.5 items of marketing each day (excluding screen advertising).183
Māori and Pacific children, and children living in more deprived neighbourhoods have higher levels of exposure to alcohol marketing.145,184 Daily levels of exposure are five times greater for Māori children, and three times greater for Pacific children, than those of other children. Boys also have more exposure to alcohol marketing than girls.183

29Pūrongo Ārai Mate Pukupuku | Cancer Prevention Report
Action: Enact and enforce comprehensive restrictions on volume and content of alcohol advertising and sponsorship across all environments
What is the evidence?
Modelling studies indicate that alcohol advertising bans are effective at reducing alcohol-related harm.145 Industry self-regulation of alcohol marketing is ineffective at protecting minors from exposure to alcohol advertising,185,186 instead, it is likely that establishing an independent authority to regulate alcohol advertising and sponsorship will be required.
Based on 2016 WHO reporting, the proportion of countries with a partial restriction or stronger on beer advertising is, by media types: national television (81 percent of countries), private television (78 percent), national radio (75 percent), local radio (77 percent), print (57 percent), billboards (52 percent), point of sale (47 percent), cinema (52 precent), internet (37 percent), and social media (35 percent).187
Finland has alcohol advertising legislation which takes an explicit focus on reducing harm for young people. The legislation places restrictions on the time and placement of alcohol ads by banning advertising on television during certain hours and in cinemas. Finland’s social media alcohol advertisement ban was one of the first in the world, and includes provisions that prevent brands from using user-generated content or product content explicitly intended for sharing (eg, pictures, reviews, videos).187
France and Norway prohibit sports sponsorship by alcohol companies and more recently Ireland has banned alcohol advertising on sporting grounds and alcohol sponsorship of certain events.188
Eighty percent of people in Aotearoa support increasing restrictions on alcohol advertising, and 68 percent support banning alcohol sponsorship of events attended by under 18-year-olds.176
What is Aotearoa doing currently?
The Sale and Supply of Alcohol Act 2012 prohibits irresponsible promotion of alcohol such as encouraging people to drink excessive amounts of alcohol or promoting alcohol aimed at or appealing to minors.
Aotearoa has a voluntary code for alcohol advertising and promotion, which is administered by the Advertising Standards Authority, a self-regulatory body of advertisers, agencies and the media.189 Self-regulation typically relies on the industry developing, monitoring and enforcing its codes of good marketing practice.186 The code permits alcohol advertising (including sponsorship) where children and youth make up less than 20 percent of the audience. It has very few restrictions on the amount of alcohol advertising and includes no enforceable penalties for breaches of the code.131 Newer technologies and marketing techniques, such as advertising on social and digital media, also highlight the inadequacy of a voluntary code.190
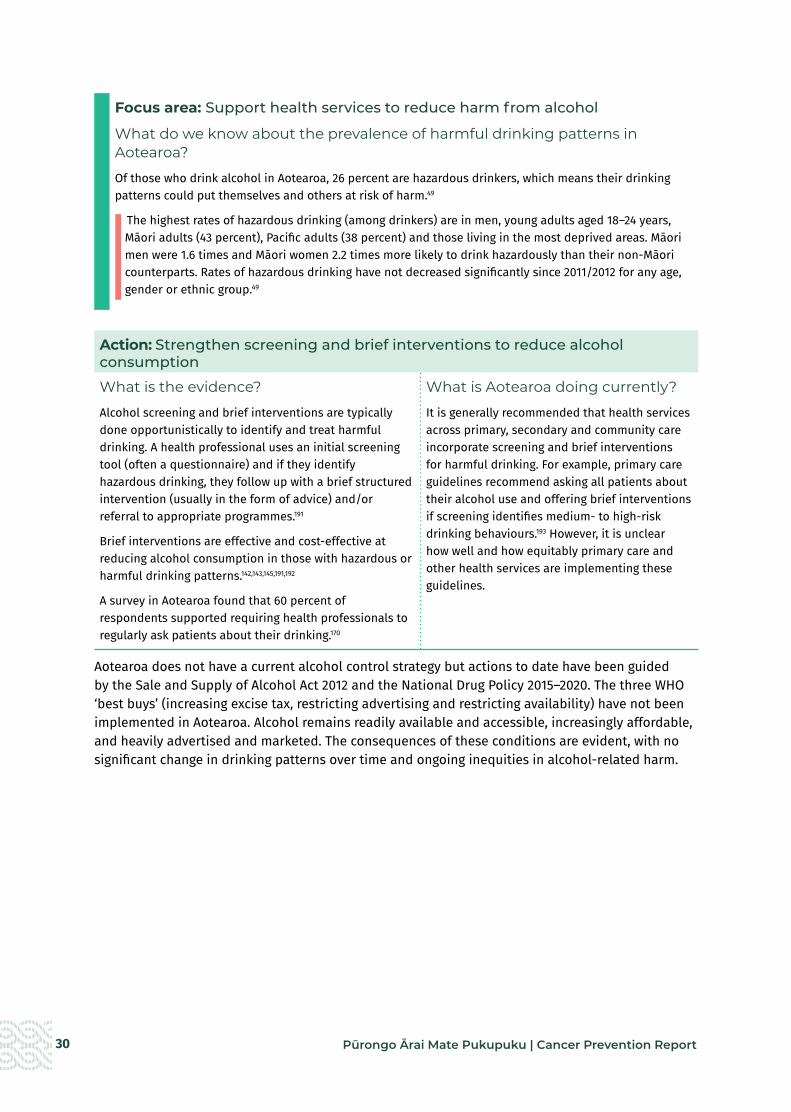
30 Pūrongo Ārai Mate Pukupuku | Cancer Prevention Report
Focus area: Support health services to reduce harm from alcohol
What do we know about the prevalence of harmful drinking patterns in Aotearoa?
Of those who drink alcohol in Aotearoa, 26 percent are hazardous drinkers, which means their drinking patterns could put themselves and others at risk of harm.49
The highest rates of hazardous drinking (among drinkers) are in men, young adults aged 18–24 years, Māori adults (43 percent), Pacific adults (38 percent) and those living in the most deprived areas. Māori men were 1.6 times and Māori women 2.2 times more likely to drink hazardously than their non-Māori counterparts. Rates of hazardous drinking have not decreased significantly since 2011/2012 for any age, gender or ethnic group.49
Action: Strengthen screening and brief interventions to reduce alcohol consumption
What is the evidence?
Alcohol screening and brief interventions are typically done opportunistically to identify and treat harmful drinking. A health professional uses an initial screening tool (often a questionnaire) and if they identify hazardous drinking, they follow up with a brief structured intervention (usually in the form of advice) and/or referral to appropriate programmes.191
Brief interventions are effective and cost-effective at reducing alcohol consumption in those with hazardous or harmful drinking patterns.142,143,145,191,192
A survey in Aotearoa found that 60 percent of respondents supported requiring health professionals to regularly ask patients about their drinking.170
What is Aotearoa doing currently?
It is generally recommended that health services across primary, secondary and community care incorporate screening and brief interventions for harmful drinking. For example, primary care guidelines recommend asking all patients about their alcohol use and offering brief interventions if screening identifies medium- to high-risk drinking behaviours.193 However, it is unclear how well and how equitably primary care and other health services are implementing these guidelines.
Aotearoa does not have a current alcohol control strategy but actions to date have been guided by the Sale and Supply of Alcohol Act 2012 and the National Drug Policy 2015–2020. The three WHO ‘best buys’ (increasing excise tax, restricting advertising and restricting availability) have not been implemented in Aotearoa. Alcohol remains readily available and accessible, increasingly affordable, and heavily advertised and marketed. The consequences of these conditions are evident, with no significant change in drinking patterns over time and ongoing inequities in alcohol-related harm.

31Pūrongo Ārai Mate Pukupuku | Cancer Prevention Report
TE ĀRAI MATE PUKUPUKU Ā-KAI, Ā-TINANA TINO MŌMONA PREVENTING CANCERS RELATED TO NUTRITION AND EXCESS BODY WEIGHT What is the connection between nutrition, excess body weight and cancer?What we eat can affect our risk of developing a wide range of cancers.194 What we eat also affects our body weight, which can increase the risk of developing cancers associated with excess body weight. A diet that includes a lot of fruit and vegetables, whole grains and plant proteins and a low amount of red and processed meat, refined carbohydrates and ultra-processed foods can reduce the risk of developing cancer (Figure 16).45 In addition, reducing sugar-sweetened beverages, refined carbohydrates and ultra-processed foods can reduce the risk of cancers related to weight gain and excess body weight (Figure 17).45
In 2019, it was estimated that ‘dietary risks’* (used here to approximate poor nutrition) caused almost 8 percent of all cancer deaths in Aotearoa (over 800 deaths), including 38 percent of all deaths from bowel cancer. Similarly, it was estimated that high body mass index (used here as an approximation for excess body weight) caused over 6 percent of all cancer deaths in Aotearoa (666 deaths), including 11 percent of bowel cancer deaths and 29 percent of oesophageal cancer deaths.20
Māori and Pacific peoples have a higher burden of obesity-related cancers, such as uterine and breast cancers.4 Pacific women have over 2.5 times the rate of uterine cancer compared with European/other women and they also have the most rapidly increasing rates over time, especially in younger women.196,197 The higher rates of obesity, physical inactivity and diabetes are one reason why the incidence rate of uterine cancer was 79 percent higher among Pacific women than European/other women in the 2001–2004 cohort.196
Ultra-processed foods are typically energy-dense foods that are high in sugar, unhealthy fats and salt. They are often low in dietary fibre, protein, vitamins and minerals. Common examples of ultra-processed foods are packaged snacks, carbonated drinks, reconstituted meat products and confectionery.
* Dietary risks are the aggregate risk factor that includes a diet low in whole grains, fruit, fibre, legumes, nuts and seeds, omega-3 fatty acids, polyunsaturated fats, vegetables, milk and calcium; and a diet high in sodium, trans fats, red or processed meat and sugar-sweetened beverages.195

32 Pūrongo Ārai Mate Pukupuku | Cancer Prevention Report
Figure 16: Association between diet and risk of cancer45,194
Figure 17: Cancers related to excess body weight45
How big is the problem of poor diet and excess body weight in Aotearoa? We do not regularly collect detailed information on diet in Aotearoa. The last nutritional surveys were conducted over 10 years ago among adults and nearly 20 years ago for children. However, we know from some national surveys that only one-third (36 percent) of adults and less than half (44 percent) of all children get the recommended five servings of vegetables and fruit each day* (Figure 18).49 Adults and children living in the most deprived areas, men, and adults of Māori, Pacific and Asian ethnicity are less likely to consume enough vegetables and fruit (Figure 20 and Figure 21).49 Many children in Aotearoa regularly have fast foods and fizzy drinks: over half (54 percent) eat fast foods and a quarter (26 percent) drink fizzy drinks at least weekly.49
Wholegrains, non-starchy fruits/vegetables, dietary fibre, and diary products can reduce the risk of these cancers.
Bowel BreastOesophageal KidneyBladder LiverOral cavity – pharyngeal, laryngeal
Ultra-processed foods, high intake of red meat, foods preserved by salting, and grilled or barbequed meat/fish can increase the risk of these cancers.
Bowel BreastGastric LungOral cavity – pharyngeal, laryngeal
Myeloma, Diffuse large B-cell lymphoma
Stomach
Bladder
Breast
LarynxOesophagus
Bowel
Kidney
Prostate
UterusOvaryCervix
Pancreas
Oval cavityPharynxThyroid
Meningioma
LiverGall bladder
* Based on dietary recommendations for adults prior to December 2020. See Figure 19 for updated dietary recommendations.

33Pūrongo Ārai Mate Pukupuku | Cancer Prevention Report
Figure 18: Patterns of vegetable and fruit consumption in Aotearoa, 2019/2049
Figure 19: Recommended number of servings per day for adults* (updated guidelines, December 2020)198
Vegetables Fruit Grain foods
Legumes, nuts, seeds, fish and other seafood,
eggs, poultry or red meat with fat removed
Milk and millk
products
Approximate number of additional servings
from the five food groups**
Men 19–50 0–3
51–70 0–2.5
70+ 0–2.5
Women 19–50 0–2.5
51–70 0–2.5
70+ 0–2
Pregnant 0–2.5
Lactating
0–2.5
one serving half serving
* Includes an allowance for unsaturated spreads or oils, nuts or seeds (4 servings [28–40g] per day for men less than 70 years of age; 2 servings [14–20g] per day for women and older men)
** Additional servings may be needed for taller or more active men and women
Around one-third of adults get the recommended five servings of
vegetables and fruit each day
Less than half of all children get
the recommended five servings of
vegetables and fruit each day
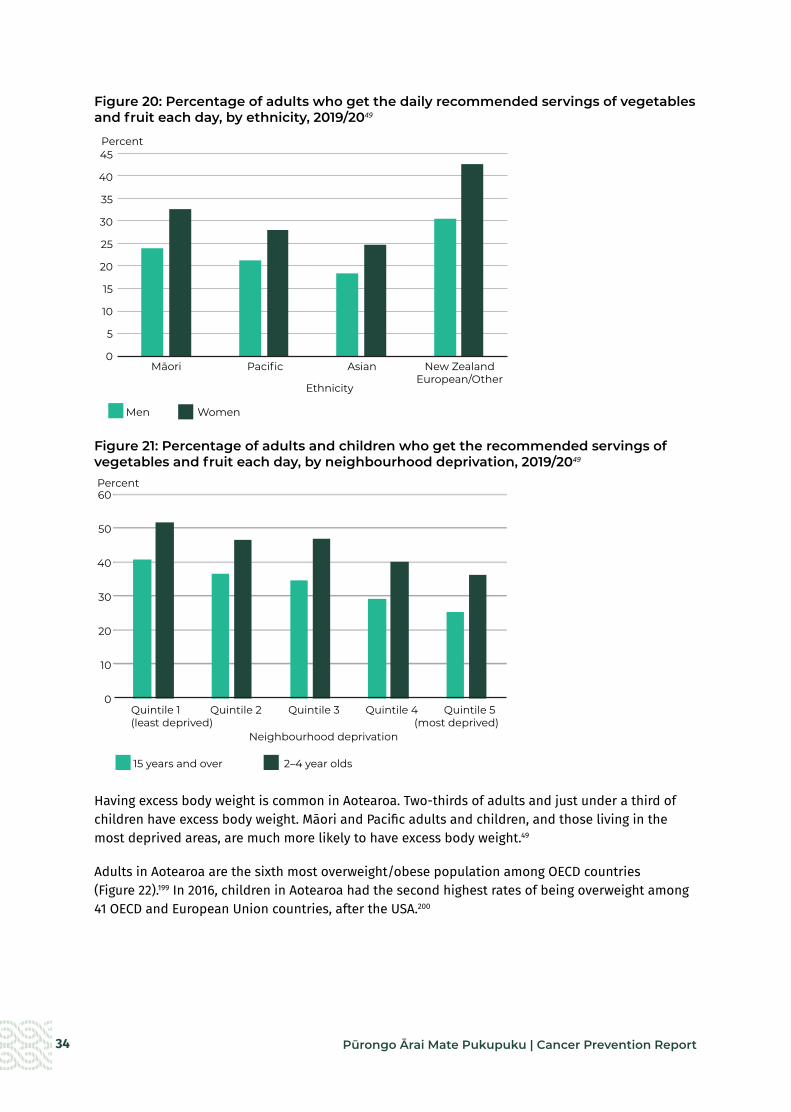
34 Pūrongo Ārai Mate Pukupuku | Cancer Prevention Report
Figure 20: Percentage of adults who get the daily recommended servings of vegetables and fruit each day, by ethnicity, 2019/2049
Figure 21: Percentage of adults and children who get the recommended servings of vegetables and fruit each day, by neighbourhood deprivation, 2019/2049
Having excess body weight is common in Aotearoa. Two-thirds of adults and just under a third of children have excess body weight. Māori and Pacific adults and children, and those living in the most deprived areas, are much more likely to have excess body weight.49
Adults in Aotearoa are the sixth most overweight/obese population among OECD countries (Figure 22).199 In 2016, children in Aotearoa had the second highest rates of being overweight among 41 OECD and European Union countries, after the USA.200
45
40
35
30
25
20
15
10
5
0
Men Women
Cancer Prevention Fig 19
Ethnicity
Māori Pacific Asian New Zealand European/Other
Percent
60
50
40
30
20
10
0
15 years and over 2–4 year olds
Neighbourhood deprivation
Quintile 1 Quintile 2 Quintile 3 Quintile 4 Quintile 5(least deprived) (most deprived)
Percent
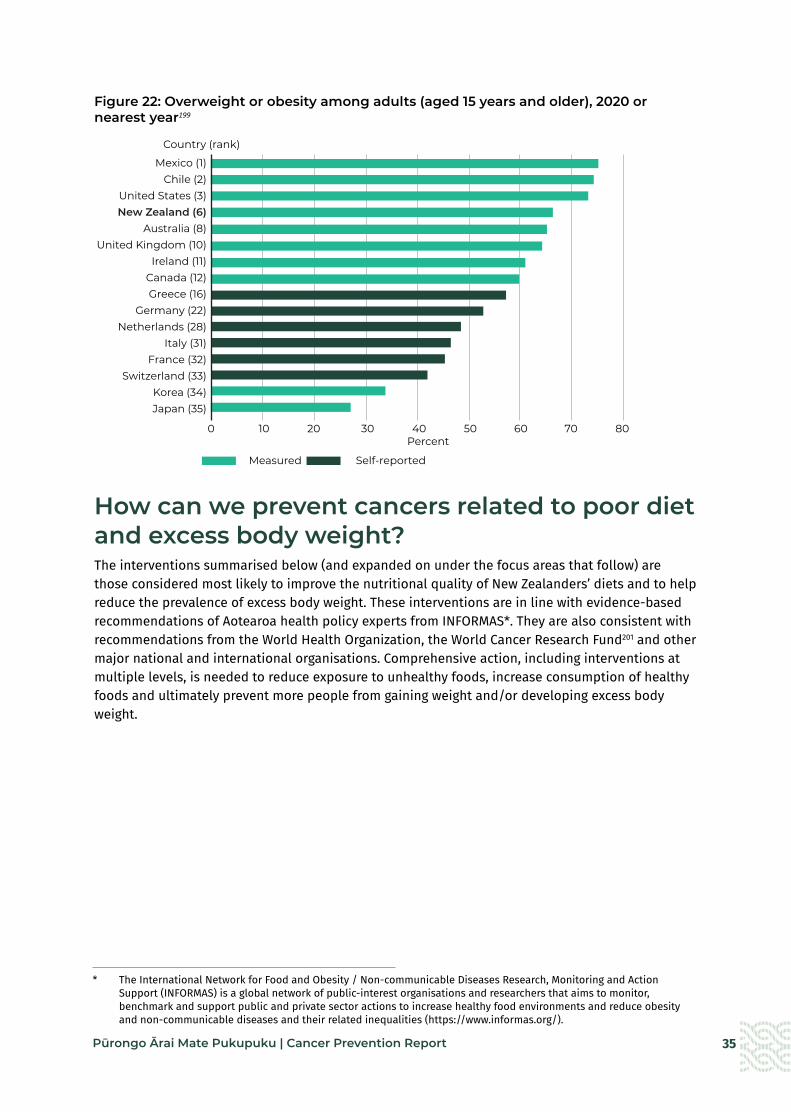
35Pūrongo Ārai Mate Pukupuku | Cancer Prevention Report
Figure 22: Overweight or obesity among adults (aged 15 years and older), 2020 or nearest year199
How can we prevent cancers related to poor diet and excess body weight?The interventions summarised below (and expanded on under the focus areas that follow) are those considered most likely to improve the nutritional quality of New Zealanders’ diets and to help reduce the prevalence of excess body weight. These interventions are in line with evidence-based recommendations of Aotearoa health policy experts from INFORMAS*. They are also consistent with recommendations from the World Health Organization, the World Cancer Research Fund201 and other major national and international organisations. Comprehensive action, including interventions at multiple levels, is needed to reduce exposure to unhealthy foods, increase consumption of healthy foods and ultimately prevent more people from gaining weight and/or developing excess body weight.
Cancer Prevention Fig 21
Measured Self-reported
0 10 20 30 40 50 60 70 80 Percent
Mexico (1)Chile (2)
United States (3)New Zealand (6)
Australia (8)United Kingdom (10)
Ireland (11)Canada (12) Greece (16)
Germany (22)Netherlands (28)
Italy (31)France (32)
Switzerland (33)Korea (34)Japan (35)
Country (rank)
* The International Network for Food and Obesity / Non-communicable Diseases Research, Monitoring and Action Support (INFORMAS) is a global network of public-interest organisations and researchers that aims to monitor, benchmark and support public and private sector actions to increase healthy food environments and reduce obesity and non-communicable diseases and their related inequalities (https://www.informas.org/).
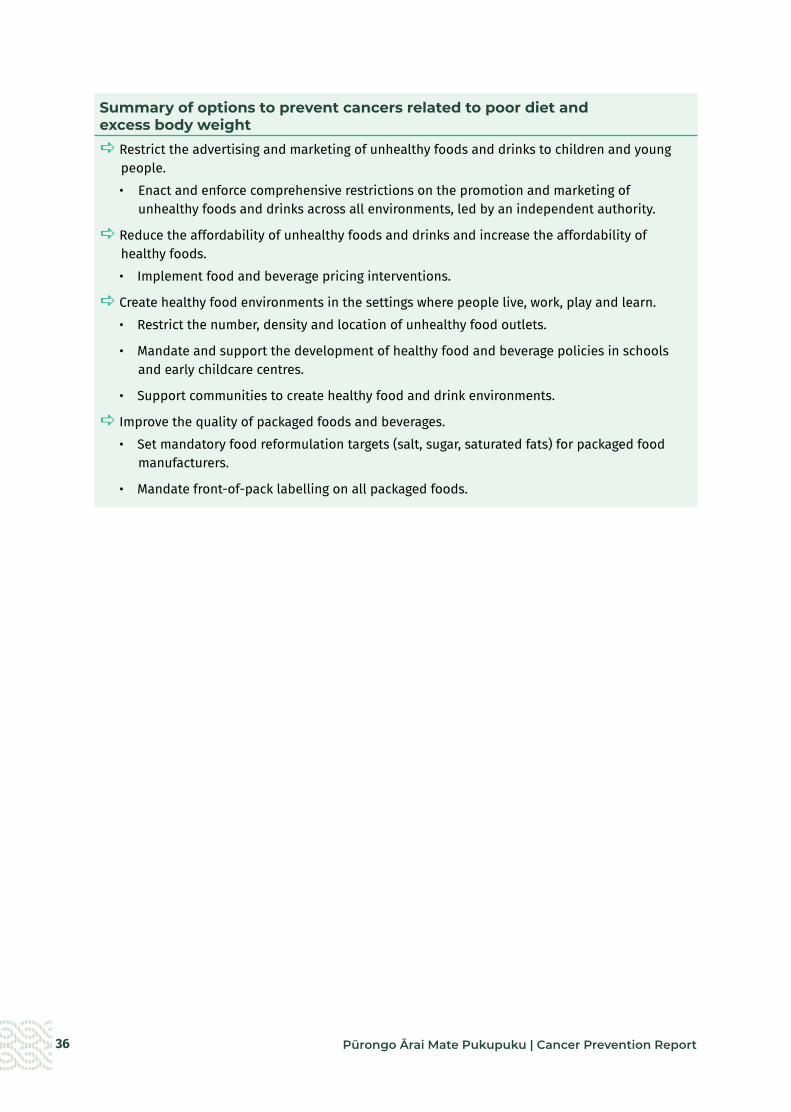
36 Pūrongo Ārai Mate Pukupuku | Cancer Prevention Report
Summary of options to prevent cancers related to poor diet and excess body weighta Restrict the advertising and marketing of unhealthy foods and drinks to children and young
people.• Enact and enforce comprehensive restrictions on the promotion and marketing of
unhealthy foods and drinks across all environments, led by an independent authority.
a Reduce the affordability of unhealthy foods and drinks and increase the affordability of healthy foods. • Implement food and beverage pricing interventions.
a Create healthy food environments in the settings where people live, work, play and learn.• Restrict the number, density and location of unhealthy food outlets.
• Mandate and support the development of healthy food and beverage policies in schools and early childcare centres.
• Support communities to create healthy food and drink environments.
a Improve the quality of packaged foods and beverages. • Set mandatory food reformulation targets (salt, sugar, saturated fats) for packaged food
manufacturers.
• Mandate front-of-pack labelling on all packaged foods.

37Pūrongo Ārai Mate Pukupuku | Cancer Prevention Report
Focus area: Restrict the advertising and marketing of unhealthy foods and drinks to children and young people
What do we know about the impact of food and drink marketing on children and young people?
In Aotearoa, unhealthy foods are heavily marketed, and children and young people are particularly susceptible to unhealthy food marketing messages.202 Children in Aotearoa are exposed to unhealthy food marketing on average 27 times per day, which is twice the amount of their exposure to healthy food advertising.203 This occurs in multiple settings, and is not limited to marketing directed at or to children.204
Marketing and advertising of unhealthy foods and beverages can influence children’s food preferences, encourage repeated purchase and consumption, increase the amount of food eaten immediately after viewing an advertisement and contribute to excess body weight in children.205-210 Childhood food preferences and excess body weight can continue through to adulthood.206,211 Some evidence indicates that advertising of unhealthy foods also influences adults’ purchases and consumption of these foods.212
Advertising in digital games increases consumption of unhealthy foods and beverages by children and young people.206 Unhealthy food and drink companies continue to sponsor popular adult sports teams and competitions.205
Māori children are exposed to outdoor advertising of unhealthy food 1.5 times more than New Zealand European children and to fast food advertising at almost double the rate of New Zealand European children.203
Action: Enact and enforce comprehensive restrictions on the promotion and marketing of unhealthy foods and drinks across all environments, led by an independent authority
What is the evidence?
Comprehensive and mandatory marketing restrictions are effective at reducing the exposure of children and young people to unhealthy food marketing.213-215 Countries with restrictions on junk food broadcast marketing have reduced sales of junk food per person compared with countries that have no such restrictions.216 Non-mandatory regulation of unhealthy food advertising and marketing has limited or no impact on children’s exposure to marketing of these products,215,217 even when adherence to these advertising codes is very high.218
Internationally, support for advertising bans and restrictions is increasing. Forty-five countries have introduced legislation to limit the exposure of children and young people to advertising and marketing of unhealthy foods.219
The United Kingdom has recently moved to completely ban advertising of unhealthy foods and drinks on television and online before 9 pm and to restrict two-for-one food promotions from the end of 2022.220 The initiative has the support of over 70 percent of the public.221
What is Aotearoa doing currently?
A voluntary, self-regulatory Children and Young People’s Advertising (CYPA) Code was introduced in 2017, which puts some voluntary restrictions on the advertising of unhealthy foods and drinks to children and young people.215 However, the CYPA Code does not include any restrictions on the amount or the spread of advertising, and does not cover product packaging, bona fide news, reviews, editorial and broadcast programmes, social and digital media or sponsorship.222 A recent review concluded that the system is not ‘effective, transparent or sufficiently accountable to protect New Zealand children and young people’.215
Unhealthy food and drink companies sponsor popular adult sports teams and competitions such as the All Blacks (Gatorade) and Super Rugby (KFC). Companies also sponsor children’s sports such as football (McDonald’s) and use marketing activities, such as merchandise and player of the day certificates, to repeatedly expose children to their brands.205

38 Pūrongo Ārai Mate Pukupuku | Cancer Prevention Report
Focus area: Reduce the affordability of unhealthy foods and drinks and increase the affordability of healthy foods
What do we know about the impact of price and affordability on purchase and consumption of food and beverages?
Cost and affordability influence the amount of fruit and vegetables people eat.223-225 The purchase and consumption of sugary drinks has decreased and bottled water use has increased in countries where sugar-sweetened beverage excise taxes have made sugary drinks more expensive.226
Changes in food and beverage prices have a greater impact on people on low incomes.227
Action: Implement food and beverage pricing interventions
What is the evidence?
Making unhealthy foods less affordable and making healthy foods more affordable has the potential, if designed carefully, to improve health and be pro-equity.228
Targeted food subsidies can influence dietary behaviour, with a greater effect if used in combination with taxation of unhealthy food and beverages.229,230 In Australia, research has shown that subsidising fruits and vegetables increases purchases of these foods among indigenous populations in rural or remote communities.231 A subsidy on fruit and vegetables in Aotearoa can improve diet quality,232 improve health and reduce cancer-related mortality.232,233
Sugar-sweetened beverage (SSB) taxes reduce consumption of these beverages,226,228 although there is a lack of consensus as to whether overall sugar consumption is reduced. There are other mechanisms of benefit, including incentivising the industry to reformulate (reduce sugar content in drinks).234
Countries with taxes on unhealthy foods and beverages include Hungary235 and Mexico.236 About 50 countries have introduced a SSB tax (as at August 2021).237
What is Aotearoa doing currently?
Aotearoa has no taxes on unhealthy foods or beverages.
Fruits and vegetables are not subsidised in Aotearoa and incur goods and services tax.
The Ministry of Health funds a Fruit in Schools programme, which provides children in low-decile schools with one piece of fruit each day.238
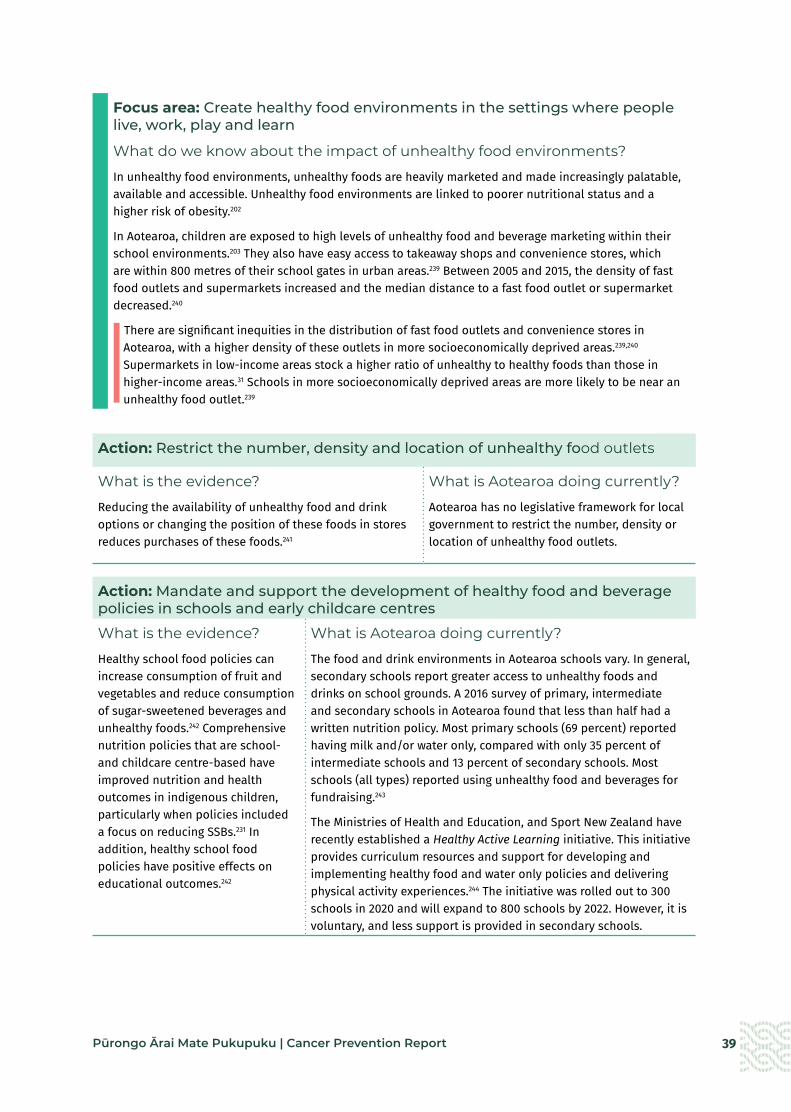
39Pūrongo Ārai Mate Pukupuku | Cancer Prevention Report
Focus area: Create healthy food environments in the settings where people live, work, play and learn
What do we know about the impact of unhealthy food environments?
In unhealthy food environments, unhealthy foods are heavily marketed and made increasingly palatable, available and accessible. Unhealthy food environments are linked to poorer nutritional status and a higher risk of obesity.202
In Aotearoa, children are exposed to high levels of unhealthy food and beverage marketing within their school environments.203 They also have easy access to takeaway shops and convenience stores, which are within 800 metres of their school gates in urban areas.239 Between 2005 and 2015, the density of fast food outlets and supermarkets increased and the median distance to a fast food outlet or supermarket decreased.240
There are significant inequities in the distribution of fast food outlets and convenience stores in Aotearoa, with a higher density of these outlets in more socioeconomically deprived areas.239,240 Supermarkets in low-income areas stock a higher ratio of unhealthy to healthy foods than those in higher-income areas.31 Schools in more socioeconomically deprived areas are more likely to be near an unhealthy food outlet.239
Action: Restrict the number, density and location of unhealthy food outlets
What is the evidence?
Reducing the availability of unhealthy food and drink options or changing the position of these foods in stores reduces purchases of these foods.241
What is Aotearoa doing currently?
Aotearoa has no legislative framework for local government to restrict the number, density or location of unhealthy food outlets.
Action: Mandate and support the development of healthy food and beverage policies in schools and early childcare centres
What is the evidence?
Healthy school food policies can increase consumption of fruit and vegetables and reduce consumption of sugar-sweetened beverages and unhealthy foods.242 Comprehensive nutrition policies that are school- and childcare centre-based have improved nutrition and health outcomes in indigenous children, particularly when policies included a focus on reducing SSBs.231 In addition, healthy school food policies have positive effects on educational outcomes.242
What is Aotearoa doing currently?
The food and drink environments in Aotearoa schools vary. In general, secondary schools report greater access to unhealthy foods and drinks on school grounds. A 2016 survey of primary, intermediate and secondary schools in Aotearoa found that less than half had a written nutrition policy. Most primary schools (69 percent) reported having milk and/or water only, compared with only 35 percent of intermediate schools and 13 percent of secondary schools. Most schools (all types) reported using unhealthy food and beverages for fundraising.243
The Ministries of Health and Education, and Sport New Zealand have recently established a Healthy Active Learning initiative. This initiative provides curriculum resources and support for developing and implementing healthy food and water only policies and delivering physical activity experiences.244 The initiative was rolled out to 300 schools in 2020 and will expand to 800 schools by 2022. However, it is voluntary, and less support is provided in secondary schools.

40 Pūrongo Ārai Mate Pukupuku | Cancer Prevention Report
Action: Support communities to create healthy food and drink environments
What is the evidence?
In environments created with easy access to places to buy and grow healthy food options (such as supermarkets, farmers’ markets and community gardens), drinking-water in public spaces and breastfeeding-friendly spaces, people make healthier food and drink choices.24
What is Aotearoa doing currently?
The Ministry of Health funds Healthy Families New Zealand, which works with communities to create environments that support healthy eating and physical activity. An initial evaluation found the design of the programme prioritised equity, Māori ownership and participation and had strengthened prevention efforts in most of those communities.246 The programme can make additional gains by responding to the evaluation results and expanding into other areas of high need.
Healthy Auckland Together is an example of collaboration between multiple agencies (health agencies, local government, iwi and non-governmental organisations) to create environments that encourage physical activity and good nutrition.247 The partners work together to influence regional policy, infrastructure design and planning decisions such as investment in cycleways and walkways.
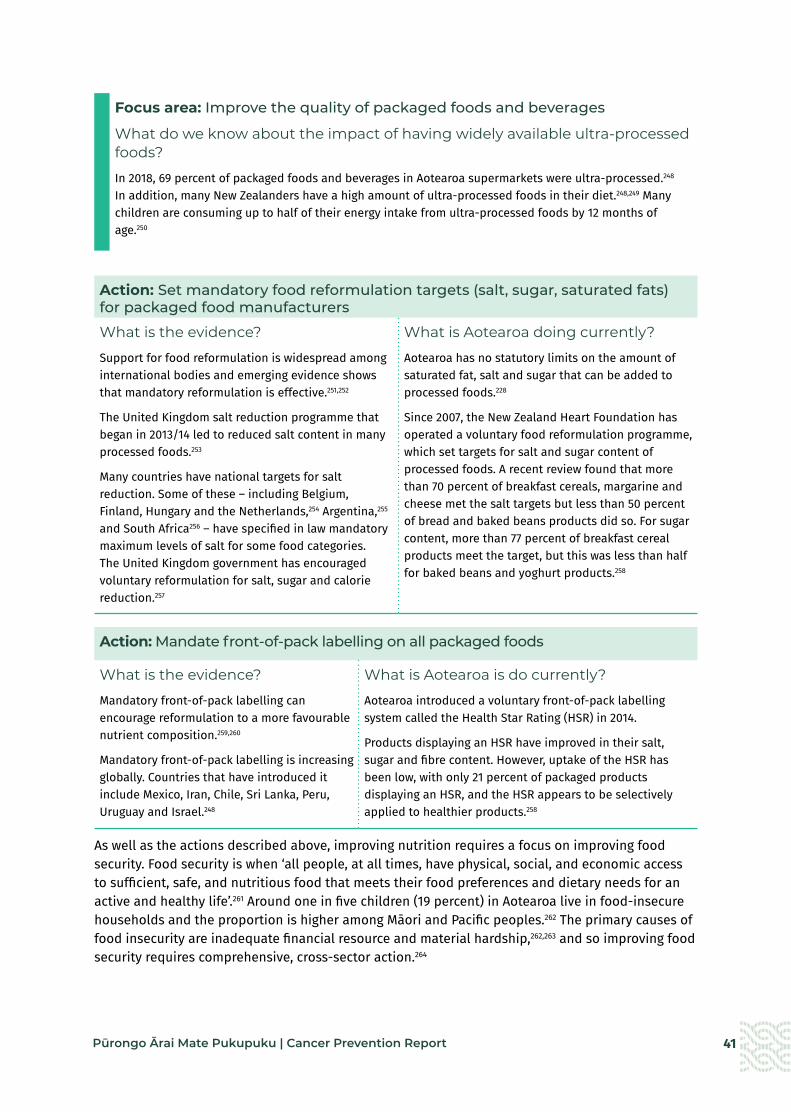
41Pūrongo Ārai Mate Pukupuku | Cancer Prevention Report
Focus area: Improve the quality of packaged foods and beverages
What do we know about the impact of having widely available ultra-processed foods?
In 2018, 69 percent of packaged foods and beverages in Aotearoa supermarkets were ultra-processed.248 In addition, many New Zealanders have a high amount of ultra-processed foods in their diet.248,249 Many children are consuming up to half of their energy intake from ultra-processed foods by 12 months of age.250
Action: Set mandatory food reformulation targets (salt, sugar, saturated fats) for packaged food manufacturers
What is the evidence?
Support for food reformulation is widespread among international bodies and emerging evidence shows that mandatory reformulation is effective.251,252
The United Kingdom salt reduction programme that began in 2013/14 led to reduced salt content in many processed foods.253
Many countries have national targets for salt reduction. Some of these – including Belgium, Finland, Hungary and the Netherlands,254 Argentina,255 and South Africa256 – have specified in law mandatory maximum levels of salt for some food categories. The United Kingdom government has encouraged voluntary reformulation for salt, sugar and calorie reduction.257
What is Aotearoa doing currently?
Aotearoa has no statutory limits on the amount of saturated fat, salt and sugar that can be added to processed foods.228
Since 2007, the New Zealand Heart Foundation has operated a voluntary food reformulation programme, which set targets for salt and sugar content of processed foods. A recent review found that more than 70 percent of breakfast cereals, margarine and cheese met the salt targets but less than 50 percent of bread and baked beans products did so. For sugar content, more than 77 percent of breakfast cereal products meet the target, but this was less than half for baked beans and yoghurt products.258
Action: Mandate front-of-pack labelling on all packaged foods
What is the evidence?
Mandatory front-of-pack labelling can encourage reformulation to a more favourable nutrient composition.259,260
Mandatory front-of-pack labelling is increasing globally. Countries that have introduced it include Mexico, Iran, Chile, Sri Lanka, Peru, Uruguay and Israel.248
What is Aotearoa is do currently?
Aotearoa introduced a voluntary front-of-pack labelling system called the Health Star Rating (HSR) in 2014.
Products displaying an HSR have improved in their salt, sugar and fibre content. However, uptake of the HSR has been low, with only 21 percent of packaged products displaying an HSR, and the HSR appears to be selectively applied to healthier products.258
As well as the actions described above, improving nutrition requires a focus on improving food security. Food security is when ‘all people, at all times, have physical, social, and economic access to sufficient, safe, and nutritious food that meets their food preferences and dietary needs for an active and healthy life’.261 Around one in five children (19 percent) in Aotearoa live in food-insecure households and the proportion is higher among Māori and Pacific peoples.262 The primary causes of food insecurity are inadequate financial resource and material hardship,262,263 and so improving food security requires comprehensive, cross-sector action.264

42 Pūrongo Ārai Mate Pukupuku | Cancer Prevention Report
If Aotearoa is to systematically change our food environment to promote good health, substantial action is needed at a national level. Developing a multi-sectoral food systems and nutrition strategy would provide an overarching framework for the initiatives described above, and others. Aotearoa currently has no food system plan or strategy. The 2015 Child Obesity Plan focused largely on initiatives to support individual behaviour change rather than initiatives to address the obesogenic environments and did not lead to significant change in the prevalence of excess body weight in children.49 An additional gap that could be filled is in collecting regular nutritional surveys, vital to monitor the impact of existing and future interventions.
By implementing interventions that can improve food environments, Aotearoa has the opportunity to protect children and young people, reduce inequities and fulfil Te Tiriti responsibilities.
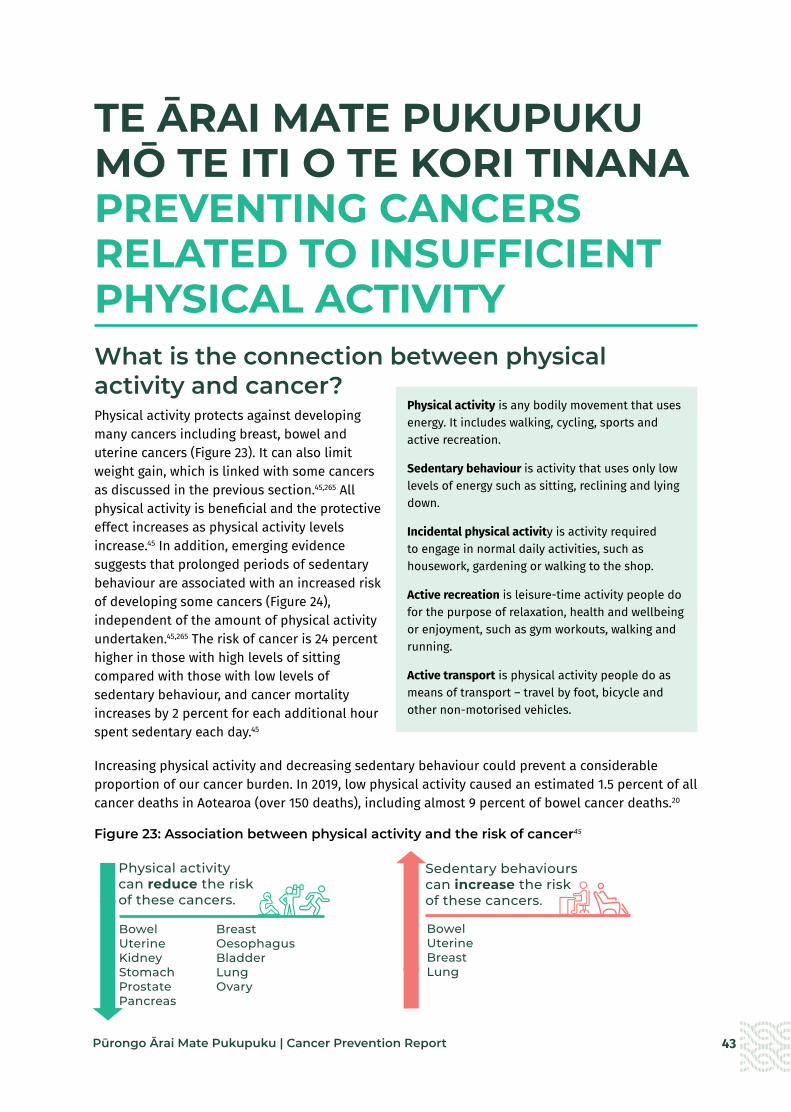
43Pūrongo Ārai Mate Pukupuku | Cancer Prevention Report
TE ĀRAI MATE PUKUPUKU MŌ TE ITI O TE KORI TINANA PREVENTING CANCERS RELATED TO INSUFFICIENT PHYSICAL ACTIVITY What is the connection between physical activity and cancer?Physical activity protects against developing many cancers including breast, bowel and uterine cancers (Figure 23). It can also limit weight gain, which is linked with some cancers as discussed in the previous section.45,265 All physical activity is beneficial and the protective effect increases as physical activity levels increase.45 In addition, emerging evidence suggests that prolonged periods of sedentary behaviour are associated with an increased risk of developing some cancers (Figure 24), independent of the amount of physical activity undertaken.45,265 The risk of cancer is 24 percent higher in those with high levels of sitting compared with those with low levels of sedentary behaviour, and cancer mortality increases by 2 percent for each additional hour spent sedentary each day.45
Increasing physical activity and decreasing sedentary behaviour could prevent a considerable proportion of our cancer burden. In 2019, low physical activity caused an estimated 1.5 percent of all cancer deaths in Aotearoa (over 150 deaths), including almost 9 percent of bowel cancer deaths.20
Figure 23: Association between physical activity and the risk of cancer45
Physical activity is any bodily movement that uses energy. It includes walking, cycling, sports and active recreation.
Sedentary behaviour is activity that uses only low levels of energy such as sitting, reclining and lying down.
Incidental physical activity is activity required to engage in normal daily activities, such as housework, gardening or walking to the shop.
Active recreation is leisure-time activity people do for the purpose of relaxation, health and wellbeing or enjoyment, such as gym workouts, walking and running.
Active transport is physical activity people do as means of transport – travel by foot, bicycle and other non-motorised vehicles.
Bowel
Breast
Uterine
Oesophagus
Kidney
Bladder
Stomach
Lung
Prostate
Ovary
Pancreas
Physical activitycan reduce the risk of these cancers.
Bowel Breast Uterine Oesophagus Kidney Bladder Stomach Lung Prostate Ovary Pancreas
Sedentary behaviourscan increase the risk of these cancers.
Bowel UterineBreast Lung
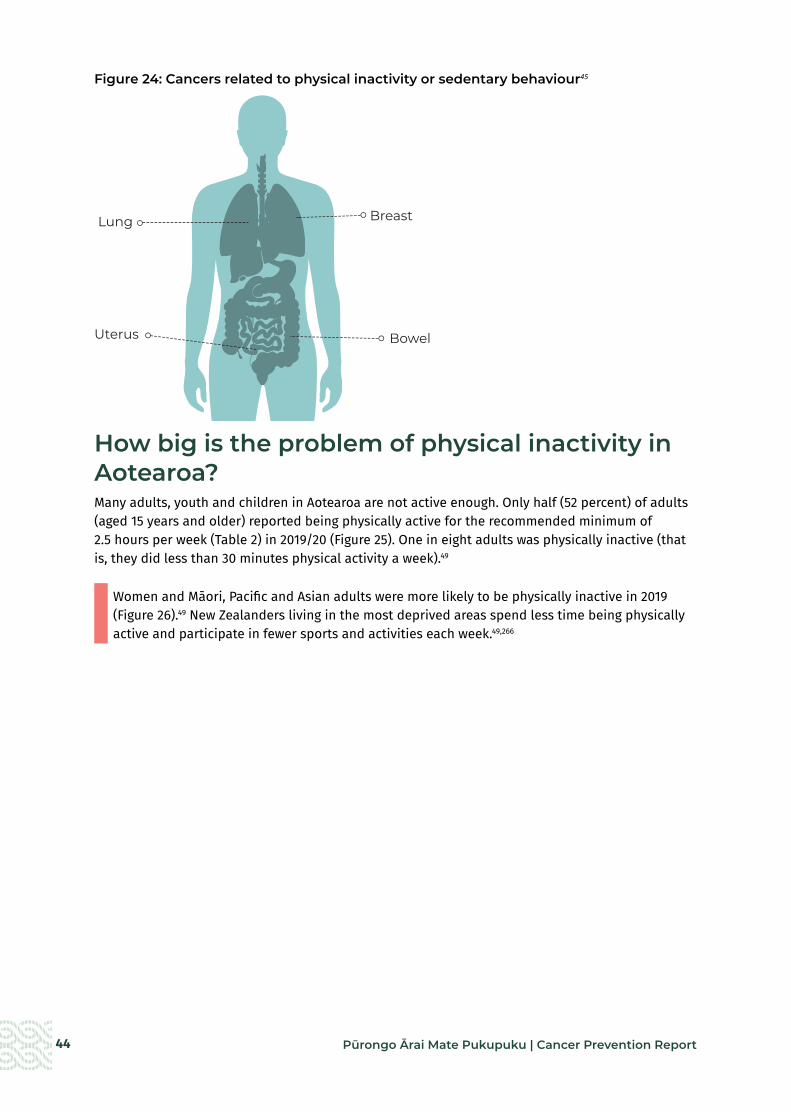
44 Pūrongo Ārai Mate Pukupuku | Cancer Prevention Report
Figure 24: Cancers related to physical inactivity or sedentary behaviour45
How big is the problem of physical inactivity in Aotearoa?Many adults, youth and children in Aotearoa are not active enough. Only half (52 percent) of adults (aged 15 years and older) reported being physically active for the recommended minimum of 2.5 hours per week (Table 2) in 2019/20 (Figure 25). One in eight adults was physically inactive (that is, they did less than 30 minutes physical activity a week).49
Women and Māori, Pacific and Asian adults were more likely to be physically inactive in 2019 (Figure 26).49 New Zealanders living in the most deprived areas spend less time being physically active and participate in fewer sports and activities each week.49,266
Lung
Stomach
Bowel
Stomach
Lung
Bowel
Breast
Uterus
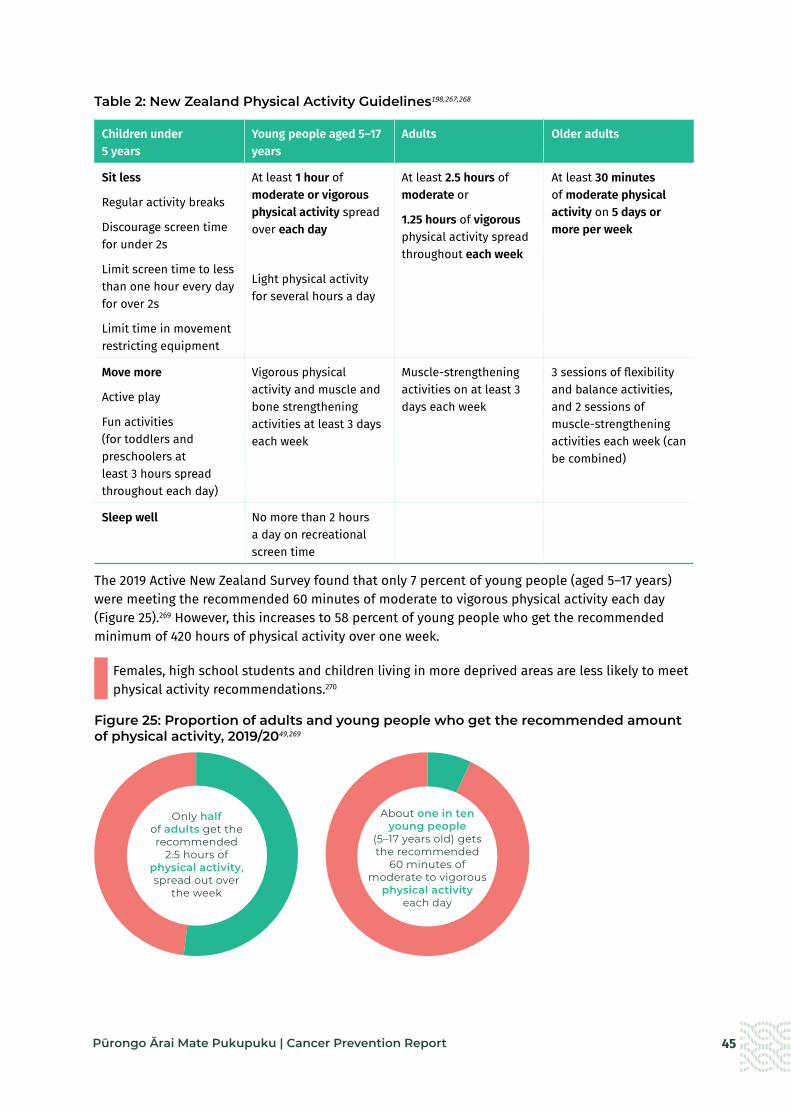
45Pūrongo Ārai Mate Pukupuku | Cancer Prevention Report
Figure 24: Cancers related to physical inactivity or sedentary behaviour45
How big is the problem of physical inactivity in Aotearoa?Many adults, youth and children in Aotearoa are not active enough. Only half (52 percent) of adults (aged 15 years and older) reported being physically active for the recommended minimum of 2.5 hours per week (Table 2) in 2019/20 (Figure 25). One in eight adults was physically inactive (that is, they did less than 30 minutes physical activity a week).49
Women and Māori, Pacific and Asian adults were more likely to be physically inactive in 2019 (Figure 26).49 New Zealanders living in the most deprived areas spend less time being physically active and participate in fewer sports and activities each week.49,266
Lung
Stomach
Bowel
Stomach
Lung
Bowel
Breast
Uterus
Table 2: New Zealand Physical Activity Guidelines198,267,268
Children under 5 years
Young people aged 5–17 years
Adults Older adults
Sit less
Regular activity breaks
Discourage screen time for under 2s
Limit screen time to less than one hour every day for over 2s
Limit time in movement restricting equipment
At least 1 hour of moderate or vigorous physical activity spread over each day
Light physical activity for several hours a day
At least 2.5 hours of moderate or
1.25 hours of vigorous physical activity spread throughout each week
At least 30 minutes of moderate physical activity on 5 days or more per week
Move more
Active play
Fun activities (for toddlers and preschoolers at least 3 hours spread throughout each day)
Vigorous physical activity and muscle and bone strengthening activities at least 3 days each week
Muscle-strengthening activities on at least 3 days each week
3 sessions of flexibility and balance activities, and 2 sessions of muscle-strengthening activities each week (can be combined)
Sleep well No more than 2 hours a day on recreational screen time
The 2019 Active New Zealand Survey found that only 7 percent of young people (aged 5–17 years) were meeting the recommended 60 minutes of moderate to vigorous physical activity each day (Figure 25).269 However, this increases to 58 percent of young people who get the recommended minimum of 420 hours of physical activity over one week.
Females, high school students and children living in more deprived areas are less likely to meet physical activity recommendations.270
Figure 25: Proportion of adults and young people who get the recommended amount of physical activity, 2019/2049,269
Only half of adults get the recommended
2.5 hours of physical activity, spread out over
the week
About one in ten young people
(5–17 years old) gets the recommended
60 minutes of moderate to vigorous
physical activity each day
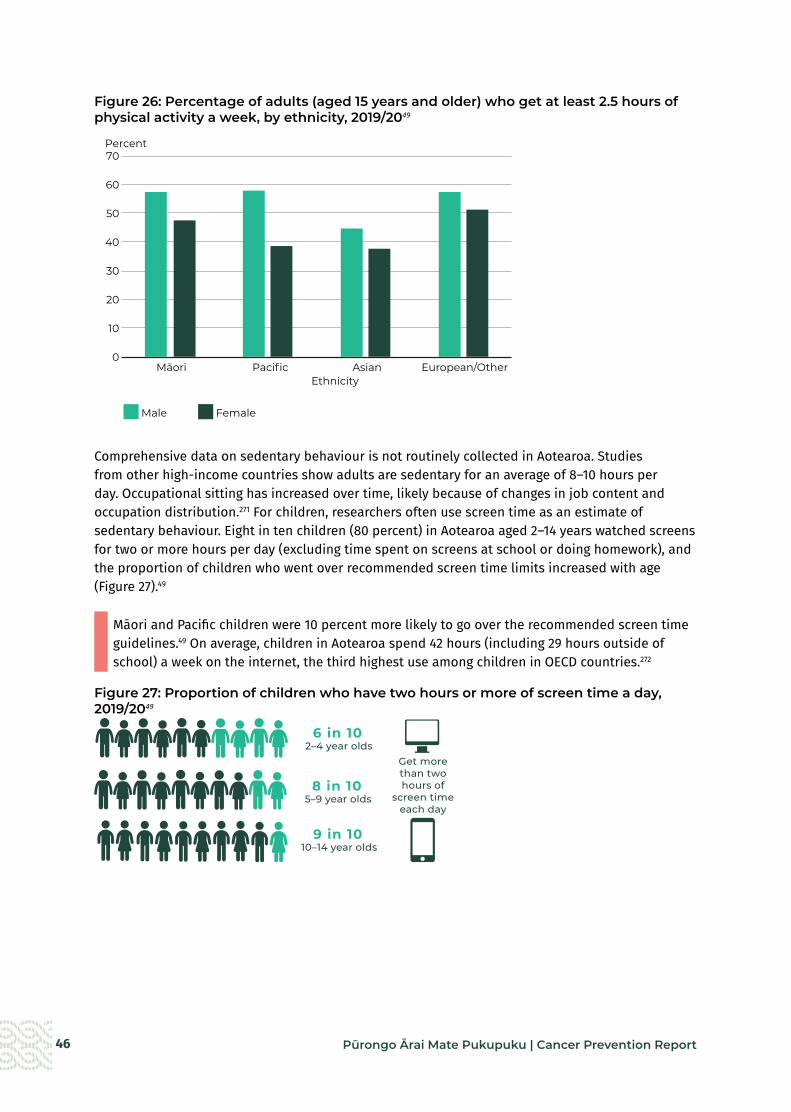
46 Pūrongo Ārai Mate Pukupuku | Cancer Prevention Report
Figure 26: Percentage of adults (aged 15 years and older) who get at least 2.5 hours of physical activity a week, by ethnicity, 2019/2049
Comprehensive data on sedentary behaviour is not routinely collected in Aotearoa. Studies from other high-income countries show adults are sedentary for an average of 8–10 hours per day. Occupational sitting has increased over time, likely because of changes in job content and occupation distribution.271 For children, researchers often use screen time as an estimate of sedentary behaviour. Eight in ten children (80 percent) in Aotearoa aged 2–14 years watched screens for two or more hours per day (excluding time spent on screens at school or doing homework), and the proportion of children who went over recommended screen time limits increased with age (Figure 27).49
Māori and Pacific children were 10 percent more likely to go over the recommended screen time guidelines.49 On average, children in Aotearoa spend 42 hours (including 29 hours outside of school) a week on the internet, the third highest use among children in OECD countries.272
Figure 27: Proportion of children who have two hours or more of screen time a day, 2019/2049
70
60
50
40
30
20
10
0
Male Female
Cancer Prevention Fig 25
EthnicityMāori Pacific Asian European/Other
Percent
6 in 10 2–4 year olds
Get more than two hours of
screen time each day
8 in 10 5–9 year olds
9 in 10 10–14 year olds
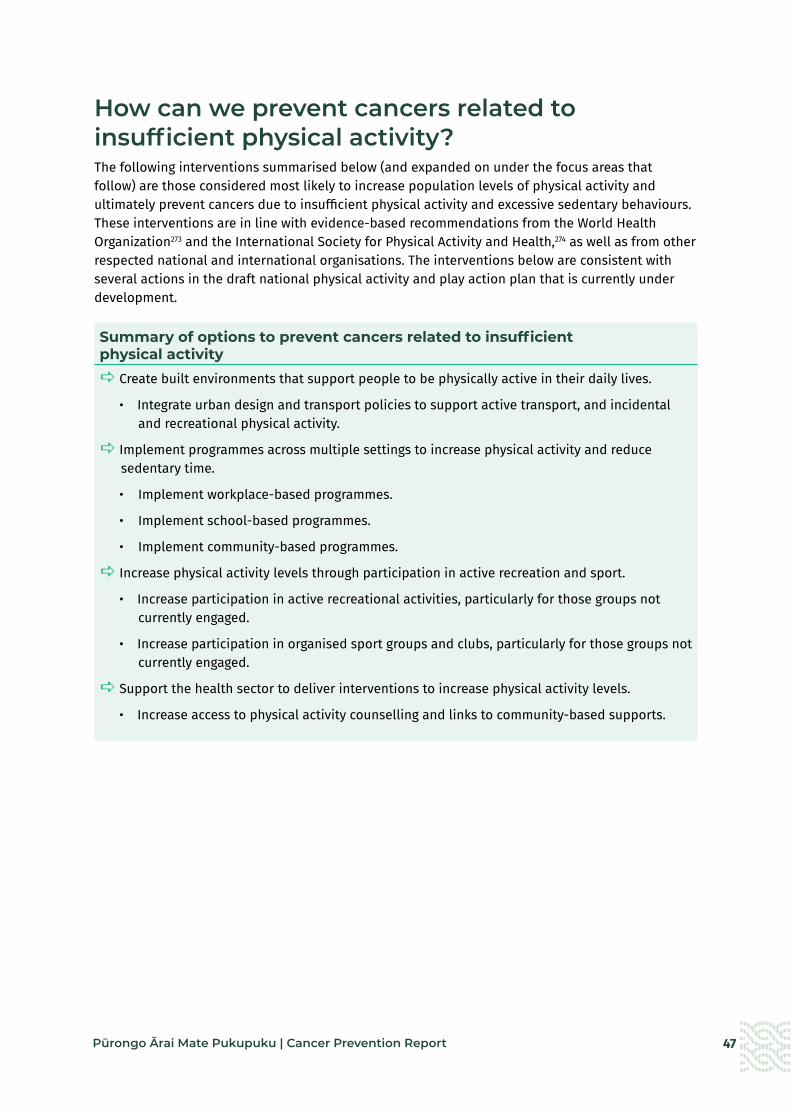
47Pūrongo Ārai Mate Pukupuku | Cancer Prevention Report
How can we prevent cancers related to insufficient physical activity?The following interventions summarised below (and expanded on under the focus areas that follow) are those considered most likely to increase population levels of physical activity and ultimately prevent cancers due to insufficient physical activity and excessive sedentary behaviours. These interventions are in line with evidence-based recommendations from the World Health Organization273 and the International Society for Physical Activity and Health,274 as well as from other respected national and international organisations. The interventions below are consistent with several actions in the draft national physical activity and play action plan that is currently under development.
Summary of options to prevent cancers related to insufficient physical activitya Create built environments that support people to be physically active in their daily lives.
• Integrate urban design and transport policies to support active transport, and incidental and recreational physical activity.
a Implement programmes across multiple settings to increase physical activity and reduce sedentary time.
• Implement workplace-based programmes.
• Implement school-based programmes.
• Implement community-based programmes.
a Increase physical activity levels through participation in active recreation and sport.
• Increase participation in active recreational activities, particularly for those groups not currently engaged.
• Increase participation in organised sport groups and clubs, particularly for those groups not currently engaged.
a Support the health sector to deliver interventions to increase physical activity levels.
• Increase access to physical activity counselling and links to community-based supports.

48 Pūrongo Ārai Mate Pukupuku | Cancer Prevention Report
Focus area: Create built environments that support people to be physically active in their daily lives
What do we know about the impact of built environments on physical activity levels?
Characteristics of our built environments, such as street layout, land use, the location of recreation facilities, parks and public buildings and the transport system, can either encourage or discourage physical activity.219,273,275-279 For example, poor street connectivity, lack of footpaths, poor access to shops and concerns about crime are associated with low levels of physical activity.280
There are significant differences in access to active and public transport by gender and ethnicity. Māori have poorer access to active or public transport than other ethnic groups.32 Between 2002 and 2014, 75 percent of cyclists were men, and men were twice as likely as women to be regular cyclists.281
Action: Integrate urban design and transport policies to support active transport, and incidental and recreational physical activity
What is the evidence?
Improvements to the built environment of towns and cities (such as improved street connectivity, increased residential density, facilities for pedestrians and cyclists, mixed land use, access to public transport and access to parks, playgrounds and green spaces) have positive effects on active transport use and overall physical activity levels in children and adults.219,277-279,282
Urban design that supports more active travel is linked to increased physical activity283-286 and less sedentary time.278 Active transport is easier to integrate into daily life than organised sports or recreational physical activity.287,288 Children who walk or cycle to school, and adults who cycle for travel purposes (e.g., to get to work rather than for recreation) are more likely to meet physical activity guidelines.289,290
Positive perceptions of neighbourhood desirability (such as for its aesthetics, traffic and safety) and quality of recreational destinations (such as green space and parks) are associated with increased recreational walking.277-279
Low-traffic neighbourhoods (LTNs), which have protected cycle lanes and bus priority lanes, are increasing in cities worldwide. In London, LTNS are associated with an increase in active travel and reduction in car ownership.291
What is Aotearoa doing currently?
Local and regional councils can create environments that support or inhibit physical activity through their decision-making about walking and cycling infrastructure, urban design, neighbourhood planning and access to green spaces. They also provide facilities for organised sport and active recreation.276
Aotearoa has no legislative requirement for local or regional councils to assess the impacts of planning decisions on physical activity opportunities.
The 2021 Government Policy Statement on Land Transport identifies providing better travel options (including public and active transport options) as a strategic priority.292
In 2019, Waka Kotahi New Zealand Transport Agency published its plan for increasing the proportion of travel using public and active transport.293 It has three focus areas: shaping urban form; making shared and active travel modes more attractive; and influencing travel demand and transport choices. To date, Waka Kotahi has worked with local and regional councils in six regions to develop plans to increase the share of travel by walking, cycling and public transport.294
Healthy Auckland Together is a collaboration between multiple agencies (health agencies, local government, iwi and non-governmental organisations).247 The partners work together to influence regional policy, infrastructure design and planning decisions such as investment in cycleways and walkways.

49Pūrongo Ārai Mate Pukupuku | Cancer Prevention Report
Focus area: Implement programmes across multiple settings to increase physical activity and reduce sedentary time
What do we know about the impact of settings, such as the workplace, school or community on physical activity levels?
Common settings where people spend most of their time are important opportunities for implementing interventions to increase levels of physical activity and reduce sedentary behaviour.273 Occupational sitting is a major contributor to overall sedentary behaviour, accounting for more than half of total exposures for workers.271 Similarly, adolescents can spend over 60 percent of their school day sitting.295
Action: Implement workplace-based programmes
What is the evidence?
Multicomponent workplace programmes are effective at increasing physical activity levels296-298 and reducing sitting time for office workers.271 In addition, workplace physical activity programmes brings co-benefits for both the organisation and individuals, including better staff morale, greater productivity and less absenteeism.277,299
What is Aotearoa doing currently?
Aotearoa has no legislative requirements for workplaces to reduce sedentary behaviour or physical inactivity.
Te Hiringa Hauora | Health Promotion Agency has developed guidance for workplaces on supporting employees to increase their physical activity (wellplace.nz website).300
Te Hiringa Hauora has partnered with other agencies, including Toi Te Ora, to develop workplace wellbeing programmes that include actions to increase physical activity in the workplace. There is potential to scale up these programmes and implement them across the public and private sectors.
Action: Implement school-based programmes
What is the evidence?
Multicomponent whole-of-school initiatives in childcare and school settings can be effective at increasing physical activity in children.219,298,301
Aotearoa modelling shows that providing school-based physical education for 2.5 hours per week will significantly reduce the proportion of minimally active young people and increase the proportion of sufficiently active young people.302 Furthermore, regular physical education and supportive school environments can contribute to long-lasting healthy, active lifestyles.273
What is Aotearoa doing currently?
The Ministries of Health and Education, and Sport New Zealand have recently established a voluntary Healthy Active Learning initiative. This initiative provides curriculum resources, support and a trained workforce for delivering physical activity experiences, creating active learning environments and better linkages to the local community.244 The initiative was rolled out to 300 schools in 2020 and will expand to 800 schools by 2022.

50 Pūrongo Ārai Mate Pukupuku | Cancer Prevention Report
Action: Implement community-based programmes
What is the evidence?
Community-based physical activity programmes are effective when they are tailored to the needs of the community they are operating in and harness local partnerships and strengths to create synergistic benefits.275 Researchers recommend that such programmes include the following features: community-wide education campaigns; family-based interventions, settings-based programmes, technology-based interventions and health care and environmental policy change.298
What is Aotearoa doing currently?
Healthy Families New Zealand is an innovative large-scale prevention initiative funded by the Ministry of Health that currently operates in 10 communities in Aotearoa. It focuses on systems change and supports community leaders to work together to create healthier environments (addressing food, physical activity, alcohol and tobacco) in a range of community settings. An initial evaluation found the programme had successfully prioritised equity, Māori ownership and participation and had strengthened prevention efforts in all communities.246 However, the impact of the programme is limited by the small number of communities involved.
There are community-based initiatives currently operational, including Māori- and Pacific-led physical activity programmes, outside of the Healthy Families New Zealand initiative.
Focus area: Increase physical activity levels through participation in active recreation and sport
What do we know about the impact of participating in active recreation and/or sport?
As well as increasing physical activity, participation in both active recreation activities and organised sport has wide-ranging benefits to health and wellbeing.275 People who are involved in sport are more likely to achieve recommended levels of physical activity each week.303,304
In Aotearoa, adults and children living in the most socioeconomically deprived communities are less likely to participate in active recreation or sport than those from less deprived areas.266
Action: Increase participation in active recreational activities, particularly for those groups not currently engaged
What is the evidence?
Because people often undertake active recreational activities for the purpose of enjoyment or wellbeing, this form of activity can potentially increase their physical activity levels without them being aware of it.305 In addition, uptake of active recreation may be higher among certain groups as participants can do the activity when, with whom, how and where they want.306
Active play and recreation are important for healthy growth and development in early childhood through to adolescence.268 For older people, regular physical activity in the form of active recreation supports healthy ageing.267
In Aotearoa, most adults prefer to participate in physical activity casually, either on their own or with others. Walking is by the far the most common type of physical activity that people participate in across all ethnicities and levels of deprivation.307
What is Aotearoa doing currently?
Sport New Zealand’s strategy Every Body Active aims to increase the physical activity levels of New Zealanders. In 2020/21, priority populations for Sport New Zealand included high-deprivation communities, girls and young women aged 5–18 years and disabled tamariki and rangatahi. Sport New Zealand collaborates with local, national and international partners in the active recreation sector.
There are a range of initiatives underway to implement this strategy. For example, Tū Manawa Active Aotearoa allocates funding to promote play, active recreation and sport for school-aged children and the Young Women’s Activation fund focuses on initiatives to help more young women get and stay active.

51Pūrongo Ārai Mate Pukupuku | Cancer Prevention Report
Action: Increase participation in organised sport groups and clubs, particularly for those groups not currently engaged
What is the evidence?
Sport-related interventions are effective and cost-effective at increasing population levels of physical activity across the life course.146
Children who participate in youth sports have higher levels of physical activity than those who don’t and these higher levels of participation may persist for many years, including into adulthood.304,308 In Aotearoa, participation in organised sports and activities peaks at age 12–14 years and then declines steeply between 15 and 17 years.269
Sport interventions targeting inactive individuals or groups are associated with increased physical activity levels.309
Having culturally specific recreational activities and sport is critical for engaging Māori and Pacific peoples.310 For example, participation in waka ama as a sport has grown in Aotearoa, with a 34 percent increase in the number of clubs over five years.311
What is Aotearoa doing currently?
Sport New Zealand has a range of work underway with a focus on youth sports. It is working with national sports organisations on a Balance is Better campaign to support the culture change needed to provide quality sport opportunities for tamariki (5–11 years) and rangatahi (12–18 years).
52 Pūrongo Ārai Mate Pukupuku | Cancer Prevention Report
Focus area: Support the health sector to deliver interventions to increase physical activity levels
What do we know about the impact of health sector interventions on physical activity levels?
The health sector can be effective in supporting individuals and whānau to be more physically active and less sedentary. Health professionals are a trusted source of information, have skills and experience in supporting behavioural change in their patients274,312 and engage with a high proportion of individuals in a community on a regular basis.275
Action: Increase access to physical activity counselling and linkages to community-based supports
What is the evidence?
Brief interventions in primary care can increase short- to medium-term self-reported physical activity,312,313 while follow-up sessions increase the effectiveness of these interventions.312 Wearable devices (such as activity monitoring watches) may provide additional benefits in health care settings.298
In addition, brief interventions for physical activity in health care settings can be adapted to be culturally appropriate and are cost-effective for adults.314,315
What is Aotearoa doing currently?
Currently, health professionals can refer adults, children and whānau (who meet certain criteria) to community-based programmes for nutrition and physical activity support, either through Green Prescriptions316 or Active Families.317
In 2018, more than 85 percent of families participating in the Active Families programme reported improvements in their diet and physical activity.317 Participants in the Green Prescription programme have reported more regular physical activity up to three years after completing the programme.313
The options discussed above are focused on creating environments and settings where being physically active is part of everyday life. Reducing the burden of cancers related to physical inactivity requires comprehensive and coordinated action across multiple sectors including local government, transport, health, education and employment. To be effective, interventions should include a focus on active transport, incidental physical activity and urban design, rather than focusing only on increasing participation in organised sport. Regular monitoring and evaluation of the effectiveness of any interventions will allow for continuous improvement, and ensure Aotearoa is doing all it can to prevent cancers related to physical inactivity.

53Pūrongo Ārai Mate Pukupuku | Cancer Prevention Report
TE ĀRAI MATE PUKUPUKU MŌ PĀNGA O TE HIHI KŌMARU PREVENTING CANCERS RELATED TO EXCESSIVE EXPOSURE TO ULTRAVIOLET RADIATIONWhat is the connection between ultraviolet radiation and cancer?Skin cancers are the most commonly diagnosed cancers in Aotearoa. Ultraviolet (UV) radiation, either from the sun or from sunbeds, causes 90 percent of all skin cancers.318 The risk of developing skin cancer increases with the number and severity of sunburn episodes (at any age) and with higher cumulative exposure to UV radiation.319,320
The two main categories of skin cancer are melanoma and keratinocytic (basal cell and squamous cell) cancer. Melanoma is less common than keratinocytic cancer but is more likely to result in death.
In 2018, 2,738 New Zealanders were diagnosed with melanoma, including 51 Māori, and there were 310 deaths.2 It is estimated that over 90,000 New Zealanders are diagnosed with keratinocytic skin cancer each year.321-323 The figure for keratinocytic skin cancer is an estimate because cases of these cancers are not recorded on the New Zealand Cancer Registry. What is known, however, is that the incidence of melanoma among our young people is 37 percent lower than it was a decade ago, which is likely due to successful public health campaigns around SunSmart practices and early warning signs.324,325 The number of cases of skin cancer is projected to increase due to population ageing and ongoing exposure to high levels of UV radiation.
Aotearoa has one of the highest rates of melanoma in the world.
Source: Ministry of Health cancer data (incidence and mortality) and Gurney et al. 2020.
2,738 New Zealanders
were diagnosed with melanoma in 2018, including 51 Māori.
310 New Zealanders
died frommelanoma in 2017, including 3 Māori.
Melanoma rates are nearly six times higher for non-Māori than for Māori;
however, Māori are more than twice as likely
to die of their melanoma.

54 Pūrongo Ārai Mate Pukupuku | Cancer Prevention Report
Skin cancer is more common in those of European ethnicity and the mortality rate is higher for men than for women.322 Melanoma incidence and mortality are substantially lower among Māori and Pacific peoples than among those of European ethnicity.7
However, Māori and Pacific peoples who are affected have a higher than expected risk of more advanced melanoma, with poorer prognosis.3,326
In 2007 the annual direct health care costs of treating skin cancer in Aotearoa were an estimated $NZ123.10 million, equivalent to $NZ1,785 per case.327 The direct health care costs are substantially higher for keratinocytic skin cancers due to the higher number of cases.328
How big is the problem of excessive exposure to ultraviolet radiation in Aotearoa?Most parts of Aotearoa experience high UV radiation levels, particularly in the summer months (Table 3). Maximum ultraviolet index (UVI) levels in Aotearoa are generally about 12.329 Sun protection is recommended when the UVI is 3 or higher.330
Table 3: Peak ultraviolet index in Aotearoa averaged over one hour at solar noon* 331
Jan Feb Mar Apr May Jun Jul Aug Sep Oct Nov Dec
Auckland 13 11 7 4 2 2 3 5 6 8 11 13
Wellington 13 9 6 3 2 1 2 4 5 8 11 12
Christchurch 12 8 5 3 1 1 2 3 4 8 10 11
Central Otago 10 8 5 2 1 1 1 3 4 7 10 11
Invercargill 8 7 4 2 1 1 1 2 3 5 9 10
Figure 28: SunSmart messaging332
In Aotearoa, exposure to excessive UV radiation is estimated through regular population-based surveys of the proportion of people experiencing sunburn.333,334
In 2018, more than half (52 percent) of all adults (aged 15 years or over) had experienced at least one episode of sunburn in the preceding spring or summer, including 12 percent who had severe sunburn (with blisters and/or pain for two or more days) (Figure 29).333
Be SunSmart
sunsmart.org.nz
SS077 | SEP 2016
Being SunSmart is about protecting skin and eyes from damaging UV
radiation – especially when outdoors from September to April.
Slip on a shirtSlip on a shirt with long sleeves. Fabrics with a tighter weave and darker colours will give you better protection from the sun.
Slip into the shadeSlip into the shade of an umbrella or a leafy tree. Plan your outdoor activities for early or later in the day when the sun’s UV levels are lower.
30SPF
Slop on sunscreenSlop on plenty of broad spectrum sunscreen of at least SPF 30. Apply 20 minutes before going outside and reapply every two hours and especially after being in water or sweating.
Slap on a hatWith a wide brim or a cap with flaps. More people are sunburnt on the face and neck than any other part of the body.
Wrap on sunglassesChoose close fitting, wrap around style sunglasses. Not all sunglasses protect against UV radiation, so always check the label for sun protection rating.
* In cloudless conditions 1–1.30 pm during daylight saving
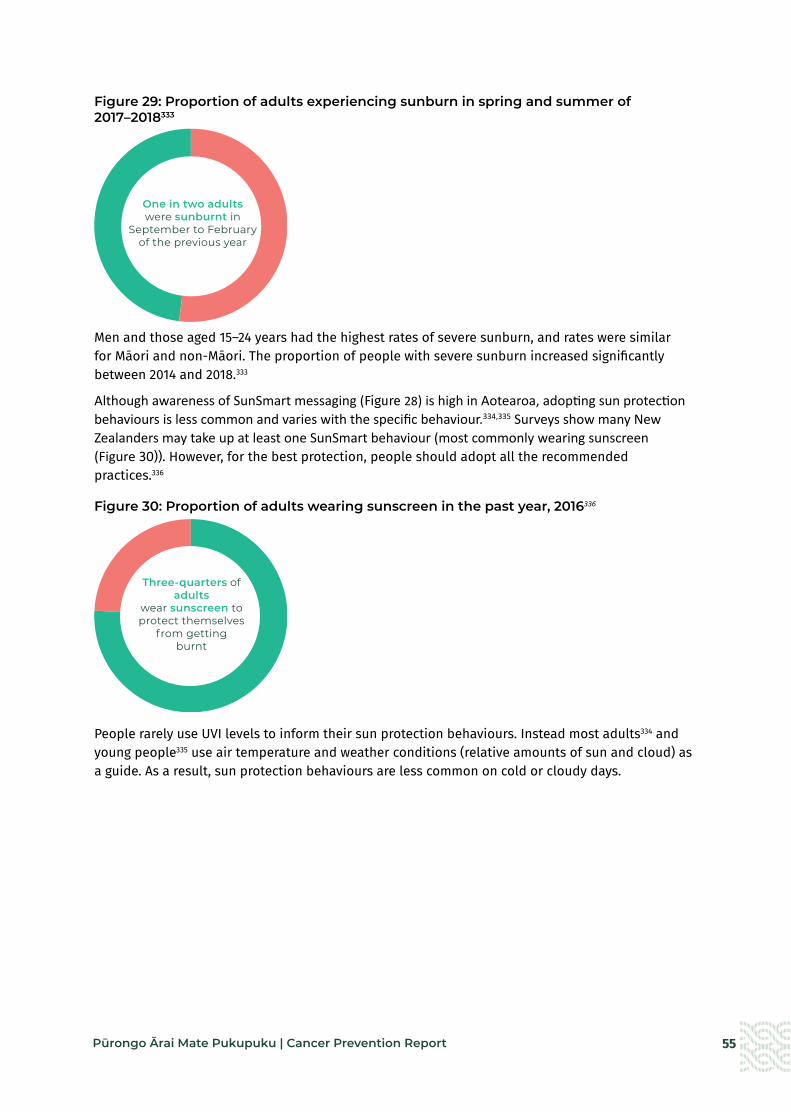
55Pūrongo Ārai Mate Pukupuku | Cancer Prevention Report
Figure 29: Proportion of adults experiencing sunburn in spring and summer of 2017–2018333
Men and those aged 15–24 years had the highest rates of severe sunburn, and rates were similar for Māori and non-Māori. The proportion of people with severe sunburn increased significantly between 2014 and 2018.333
Although awareness of SunSmart messaging (Figure 28) is high in Aotearoa, adopting sun protection behaviours is less common and varies with the specific behaviour.334,335 Surveys show many New Zealanders may take up at least one SunSmart behaviour (most commonly wearing sunscreen (Figure 30)). However, for the best protection, people should adopt all the recommended practices.336
Figure 30: Proportion of adults wearing sunscreen in the past year, 2016336
People rarely use UVI levels to inform their sun protection behaviours. Instead most adults334 and young people335 use air temperature and weather conditions (relative amounts of sun and cloud) as a guide. As a result, sun protection behaviours are less common on cold or cloudy days.
One in two adults were sunburnt in
September to February of the previous year
Three-quarters of adults
wear sunscreen to protect themselves
from getting burnt
56 Pūrongo Ārai Mate Pukupuku | Cancer Prevention Report
How can we prevent cancers related to excessive ultraviolet radiation?The interventions summarised below (and expanded on under the focus areas that follow) are those considered most likely to reduce exposure to excessive UV radiation and ultimately reduce skin cancer risk. They are focused on creating supportive environments and settings to support the adoption of sun protection (SunSmart) behaviours. The interventions are in line with recommendations outlined in the New Zealand Skin Cancer Primary Prevention and Early Detection Strategy 2017–2022337 and with recommendations of national organisations, including the New Zealand Cancer Society.338 The interventions draw on the Australian SunSmart programme, which is a successful multicomponent, community-wide skin cancer prevention programme that has been operating for over 30 years.339,340
Summary of options to prevent cancers related to excessive UV radiationa Create healthy outdoor environments that provide protection from excessive UV radiation.
• Require local government to develop and implement comprehensive UV radiation protection policies, including increasing availability of and access to good-quality shade outdoors.
a Create supportive school environments that protect children and young people from excessive UV radiation.
• Implement comprehensive sun protection policies and monitoring in all education settings.
a Create supportive work environments that protect people from exposure to excessive UV radiation.
• Ensure employers are meeting their legal obligations to protect workers from sun exposure.
a Increase access to affordable, high-quality sunscreen.
• – Increase access to affordable sunscreen.
• – Regulate sunscreen to ensure all sunscreens meet accepted standards for safety, quality and effectiveness.

57Pūrongo Ārai Mate Pukupuku | Cancer Prevention Report
Focus area: Create healthy outdoor environments that provide protection from excessive UV radiation
What do we know about the impact of shade on exposure to UV radiation?
Good-quality shade fabrics can reduce UV radiation exposure by up to 75 percent341 and trees with heavy dense canopy can provide up to 90 percent UV radiation protection.342 Ultraviolet radiation levels are not affected by air temperature, so shade that provides protection from heat does not automatically provide protection from UV radiation.343
Children and adolescents in Aotearoa are often not adequately protected from exposure to UV radiation in outdoor recreation spaces.344,345 Only 40 percent of Aotearoa playgrounds provide adequate shade protection, although Waikato, Whangarei and Wairarapa have higher levels of shade in outdoor recreational spaces than other parts of Aotearoa.345
Playgrounds in more socioeconomically deprived areas have less shade than those in less deprived areas.344
mary of options to prevent cancers related to UV radiation
Action: Require local government to develop and implement comprehensive UV radiation protection policies, including increasing availability of and access to good-quality shade outdoors What is the evidence?
Comprehensive sun protection policies should include key components: guidelines for specific groups (such as outdoor workers), events and areas (such as parks, gardens and sports facilities), shade considerations in building codes, urban design/landscape, and community and sporting facilities.
Adding built shade (such as shade sails over play and eating areas) to schools, parks and outdoor recreation areas increases the use of shade in outdoor spaces.346-348
The Australian SunSmart programmes provide guidance and support to local government for developing comprehensive sun protection policies.349 As part of the Australian SunSmart programmes, the Victorian government established a shade grants programme in 2014 to increase shade availability and sun protection practices. In 2018, $10 million in shade grants were made available to the programme.350
In a 2013 survey in Aotearoa, more than 75 percent of respondents agreed that their council should use money from rates to provide shade in public places.351
What is Aotearoa doing currently?
Aotearoa has no legislative requirement for shade provision or for shade provision policies. No public funding is available for installing appropriate shade.
Some councils have developed sun protection policies as part of their role in providing their communities with safe and healthy environments,352,353 although there is no legislative requirement for them to do so. Five local councils had a sun protection policy in 2021. Where they exist, local policies vary nationwide.
A guide for developing and implementing seasonally and regionally appropriate sun protection policies is available on the SunSmart website (https://www.sunsmart.org.nz/learn-more/sunsmart-councils-and-workplaces).354
The SunSmart website covers shade provision in the design of community and sporting facilities. This includes sun protection considerations in building codes and planning requirements and adopting a systematic process for planning shade for locations where the public could be at risk of over-exposure to UV radiation.
The Cancer Society has produced guidelines for developing shade that is appropriate for the different climate zones in Aotearoa and provides sufficient protection from UV radiation.355

58 Pūrongo Ārai Mate Pukupuku | Cancer Prevention Report
Focus area: Create supportive school environments that protect children and young people from excessive UV radiation
What do we know about school environments and UV radiation?
Children are at school or early childhood centres during peak UV radiation times.356 However, children and adolescents in Aotearoa are often not adequately protected from sun exposure while at school.357-359 The cost of shade provision is recognised as a key barrier to improving access to shade in schools in Aotearoa360 and overseas.361
Action: Implement comprehensive sun protection policies and monitoring in all education settings
What is the evidence?
Comprehensive school-based sun protection programmes (education plus environmental and policy change) are effective at increasing sun protection behaviours, decreasing UV radiation exposure and decreasing sunburn.362
Aotearoa schools enrolled in the Cancer Society’s SunSmart schools programme have better sun protection practices and are more likely to have a better policy (on wearing hats) than schools not enrolled.363
As part of the Australian SunSmart schools programme, early childhood centres are required to have a sun protection policy for accreditation.356 In Queensland, all schools are required to develop and implement a sun safety policy. Schools must supply sunscreen with a sun protection factor (SPF) of 30 or higher for students to use for all outdoor activities.361
What is Aotearoa doing currently?
Sun protection policies are not mandatory in Aotearoa education settings. Schools do not receive public funding to develop or implement sun protection policies or to provide shade structures.364,365 Although most primary schools (94 percent) and half of secondary schools report that they have a sun protection policy, these policies are not necessarily comprehensive or followed.357,366
The Cancer Society of New Zealand delivers a SunSmart schools programme that is broadly consistent with the Australian programme. It is Aotearoa’s only national sun protection intervention but does not receive any government funding. The programme is voluntary and is only available in primary and intermediate schools.363 Only about 36 percent of children of primary and intermediate age in Aotearoa attend a SunSmart accredited school.367 The programme also provides policy and support for early childhood centres.
59Pūrongo Ārai Mate Pukupuku | Cancer Prevention Report
Focus area: Create supportive work environments that protect people from exposure to excessive UV radiation
What do we know about the impact of work environments on exposure to UV radiation?
Workers in outdoor occupations such as agriculture, horticulture, farming, forestry and construction are exposed to high levels of UV radiation while at work.368 Outdoor workers are exposed to UV radiation more often and for longer periods than indoor workers. As a result, they have higher cumulative levels of UV radiation exposure and a higher risk of developing skin cancer.368 It is estimated that outdoor workers receive five to ten times more UV exposure each year than indoor workers.369
Action: Ensure employers are meeting their legal obligations to protect workers from sun exposure
What is the evidence?
Workplace skin cancer prevention programmes are effective at increasing outdoor workers’ sun protective behaviours and reducing sunburns.370 In Aotearoa, better workplace safety culture in workplaces is associated with better personal sun protection practices.371
Australian work health and safety laws require employers to eliminate or minimise the risks to workers from exposure to UV radiation.372 Safe Work Australia and the Australian Cancer Council have produced clear guidelines for employers and employees on how to meet their obligations and reduce UV radiation exposure for outdoor workers.
What is Aotearoa doing currently?
The Health and Safety at Work Act 2015 places obligations on employers to protect workers from exposure to hazards such as UV radiation.373 Businesses are required to identify and manage potential health risks, monitor and minimise levels of exposure, and monitor the health of workers to enable early diagnosis of any work-related diseases. Several organisations – including WorkSafe, Te Hiringa Hauora | Health Promotion Agency (wellplace.nz), the Cancer Society of New Zealand and Business.govt.nz – offer support, including guidelines and information.
It is unclear how many workplaces have implemented sun protection policies, whether current programmes provide sufficient protection from UV radiation exposure and how compliance is monitored.
Focus area: Increase access to affordable, high-quality sunscreen
What do we know about the impact of affordability on sunscreen use?
Cost has been identified as a barrier to regular sunscreen use in Aotearoa373 and internationally.374,378
Action: Increase access to affordable sunscreen
What is the evidence?
When applied correctly, sunscreen with an SPF of more than 30 is highly effective for preventing skin cancer.377 Daily sunscreen use is more effective and cost-effective than early detection programmes.377,378
In Australia, sunscreen is subsidised for veterans under the Pharmaceutical Benefits scheme379 and is tax deductible for outdoor workers.
What is Aotearoa doing currently?
Aotearoa has no regular monitoring and reporting of the availability, accessibility and affordability of sunscreen.
In Aotearoa, the price of sunscreen varies significantly between different brands and retailers. Access to free or subsidised sunscreen is available in some situations. For example, the Pharmaceutical Management Agency Ltd (PHARMAC) fully subsidises sunscreen for people with medical conditions that make them highly sensitive to UV radiation. Sunscreen and other sun protection are tax deductible for employers in some industries. Employers should provide their outdoor workers with sunscreen. Some schools provide sunscreen to students and staff prior to outdoor activities, although this is not a requirement in Aotearoa schools.
60 Pūrongo Ārai Mate Pukupuku | Cancer Prevention Report
Action: Regulate sunscreen to ensure all sunscreens meet accepted standards for safety, quality and effectiveness
What is the evidence?
Australia has adopted into law the joint Australian/New Zealand Sunscreen Standard (AS/NZS 2604:2012), which sets out performance, testing and labelling requirements.380 Also in Australia, sunscreen products with an SPF of more than 4 are regulated as therapeutic goods by the Therapeutic Goods Administration. Manufacturers must provide evidence of testing in accordance with the mandatory sunscreen standard.380
Submissions from the general public and health professionals on the draft Therapeutic Products Bill and the Sunscreen (Product Safety Standard) Bill supported mandatory regulation of sunscreens.380,381 Many experts indicated that regulation of sunscreens as a therapeutic product would be their preferred option.
What is Aotearoa doing currently?
Sunscreens are currently classified as cosmetics rather than therapeutic products in Aotearoa. This means Medsafe (the medicines regulator of Aotearoa) does not assess their safety, quality and effectiveness so these factors cannot be assured.382 Although Aotearoa has adopted the joint Australia/New Zealand Sunscreen Standard (AS/NZ 2604:2021), compliance with the standard is voluntary. However, Consumer testing has consistently found that many sunscreens do not meet the SPF claims on their labels.383
Options for regulating sunscreens in Aotearoa are currently being considered. These include:
• the Sunscreen (Product Safety Standard) Bill, a private member’s bill for mandatory regulation of sunscreen under the Fair Trading Act 1986, which is currently at Select Committee.380
• the draft Therapeutic Products Bill, which will replace the Medicines Act 1981 and will enable sunscreens to be declared a therapeutic product and be regulated as such. Consultation was completed in 2019 but the Bill has not yet entered the parliamentary process as at January 2022.381
In addition to the options outlined above, there is room to strengthen existing or previous initiatives. For example, little investment in SunSmart national campaigns has occurred in the last decade.384 Sunbed use for those aged under 18 years has been banned since 2017, but beyond this only voluntary guidelines are available for sunbed operators in most of Aotearoa and compliance with them is demonstrably poor.385 Additionally, while we have good data on melanoma, it is challenging to get equivalent data on keratinocytic skin cancers, which are numerous and mostly managed in primary care. This information gap limits our ability to target resources and evaluate the impact of prevention initiatives.
In general, efforts to reduce exposure to UV radiation in Aotearoa have largely focused on education and encouraging individuals to adopt appropriate sun protection behaviours. Although some comprehensive approaches have been used in some settings (including educational settings and workplaces), initiatives are fragmented across agencies and poorly funded.386 A comprehensive, multisectoral skin cancer prevention programme that is adequately resourced would provide a strategic and coordinated response to skin cancer prevention across the life course. The Australian SunSmart programme is a good example of such an approach, with proven results.384

61Pūrongo Ārai Mate Pukupuku | Cancer Prevention Report
TE ĀRAI I NGĀ MATE PUKUPUKU MŌ NGĀ MATE MAU TONU PREVENTING CANCERS RELATED TO CHRONIC INFECTIONSWhat is the connection between chronic infections and cancer?Globally, it is estimated that infections cause at least 12 percent of all cancers.385 Four types of infections in particular – Helicobacter pylori (H. pylori), human papillomavirus (HPV), and hepatitis B and hepatitis C viruses – account for 90 percent of all infection-related cancers.386
Most people who get these infections do not develop cancer. However, cancer can develop if the infection remains in the body for a long period of time (known as a chronic infection) and is not cleared by the immune system or if other risk factors, such as alcohol and smoking, are present.
Infection with human immunodeficiency virus (HIV) also increases the risk of several cancers (including Kaposi sarcoma, certain lymphomas, cervical cancer, lung cancer, liver cancer and non-melanoma skin cancer). Cancers associated with HIV are also linked to co-infection with HPV, hepatitis B and hepatitis C.387
Figure 31: Cancers related to H.pylori, HPV, Hepatitis B and Hepatitis C386
Oropharyngeal
HPV
Cervical
Anal
VaginalVulvalPenile
Liver
Hepatitis B & C
Stomach
H.pylori
Helicobacter pylori (H. pylori) infectionHelicobacter pylori (H. pylori) is a bacterium that infects the stomach lining. It causes over 90 percent of cancers of the lower part of the stomach.386 Without treatment, chronic infection with H. pylori may develop. Most people will not develop cancer with a chronic infection alone but
Cervical
Cervical
Anal
Anal

62 Pūrongo Ārai Mate Pukupuku | Cancer Prevention Report
research suggests that if an infected person also has other risk factors, such as tobacco smoking, they are at greater risk for stomach cancer.388 An estimated 1–2 percent of people infected with H. pylori will develop stomach cancer in their lifetime.389
In Aotearoa, the burden of stomach cancer has halved in the last 20 years (Figure 32). In 2018, 408 New Zealanders were diagnosed with stomach cancer, including 82 Māori.2 Stomach cancer is associated with poor survival, with only around 29 percent of people surviving for five years after their diagnosis.38 In 2017, 288 New Zealanders died from stomach cancer, including 47 Māori.
Māori, Pacific peoples and those living in the most socioeconomically deprived areas continue to have much higher rates of stomach cancer.4,388,390,391 Māori diagnosed with stomach cancer are 22 percent more likely to die than non-Māori with stomach cancer.3
Figure 32: Incidence of stomach cancer for Māori and non-Māori females and males in Aotearoa, 1996–2017
1996
1999
200
2
200
5
200
8
2011
2014
2017
Age standardised incidence rate (per 100,000)
Female Male
1996
1999
200
2
200
5
200
8
2011
2014
2017
Age standardised incidence rate (per 100,000)12
10
8
6
4
2
0
181614121086420
Māori Non-Māori Trend
A large proportion of stomach cancer is caused by Helicobacter pylori infection, usually contracted during childhood.
408 New Zealanders
were diagnosed with stomach cancer in 2018,
including 82 Māori.
288 New Zealanders died from
stomach cancer in 2017, including
47 Māori.
Source: Ministry of Health cancer data (incidence and mortality) and Signal et al 2020b
Poverty and household overcrowding are risk
factors for H. pylori.
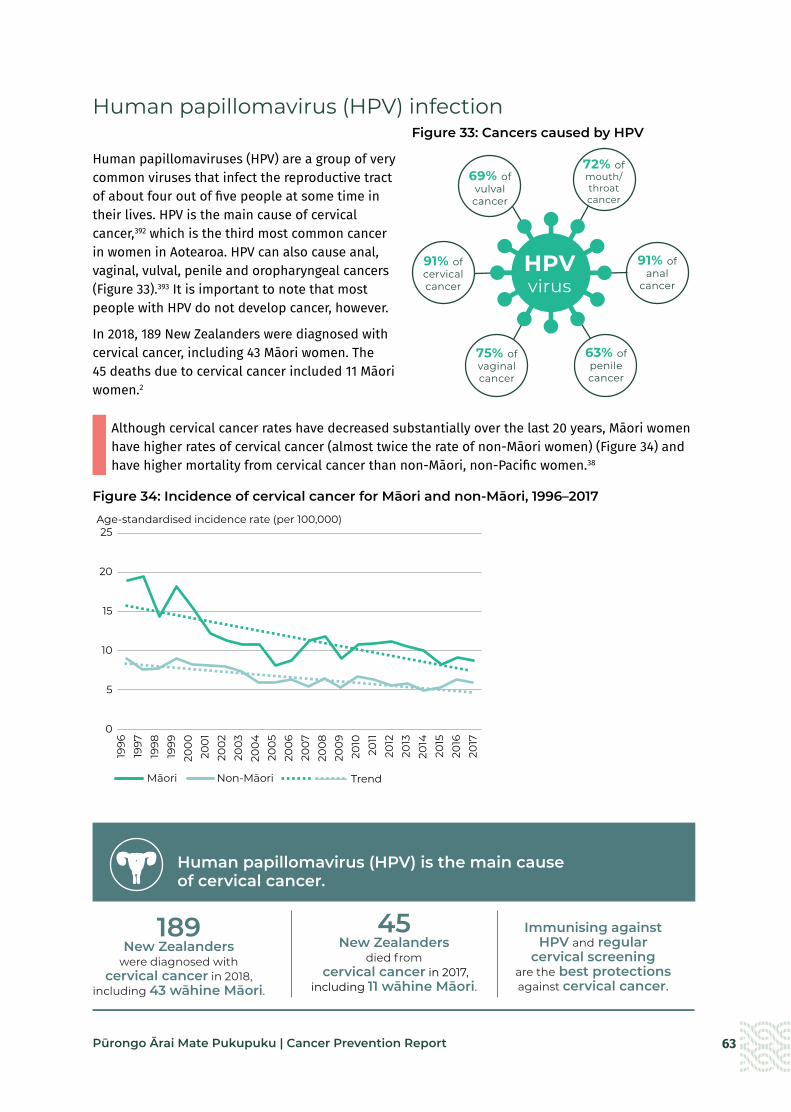
63Pūrongo Ārai Mate Pukupuku | Cancer Prevention Report
Human papillomavirus (HPV) infection Figure 33: Cancers caused by HPV
Human papillomaviruses (HPV) are a group of very common viruses that infect the reproductive tract of about four out of five people at some time in their lives. HPV is the main cause of cervical cancer,392 which is the third most common cancer in women in Aotearoa. HPV can also cause anal, vaginal, vulval, penile and oropharyngeal cancers (Figure 33).393 It is important to note that most people with HPV do not develop cancer, however.
In 2018, 189 New Zealanders were diagnosed with cervical cancer, including 43 Māori women. The 45 deaths due to cervical cancer included 11 Māori women.2
Although cervical cancer rates have decreased substantially over the last 20 years, Māori women have higher rates of cervical cancer (almost twice the rate of non-Māori women) (Figure 34) and have higher mortality from cervical cancer than non-Māori, non-Pacific women.38
Figure 34: Incidence of cervical cancer for Māori and non-Māori, 1996–2017
75% ofvaginalcancer
72% ofmouth/throatcancer
91% ofcervicalcancer
69% ofvulvalcancer
63% ofpenilecancer
91% ofanal
cancer
HPVvirus
1996
1997
1998
1999
200
020
01
200
220
0320
04
200
520
06
200
720
08
200
920
1020
1120
1220
1320
1420
1520
1620
17
25
20
15
10
5
0
Age-standardised incidence rate (per 100,000)
State of cancer Fig 1.10 Cervical incidence
Māori Non-Māori Trend
Human papillomavirus (HPV) is the main cause of cervical cancer.
189 New Zealanders
were diagnosed with cervical cancer in 2018,
including 43 wāhine Māori.
45 New Zealanders
died from cervical cancer in 2017,
including 11 wāhine Māori.
Immunising against HPV and regular
cervical screening are the best protections against cervical cancer.
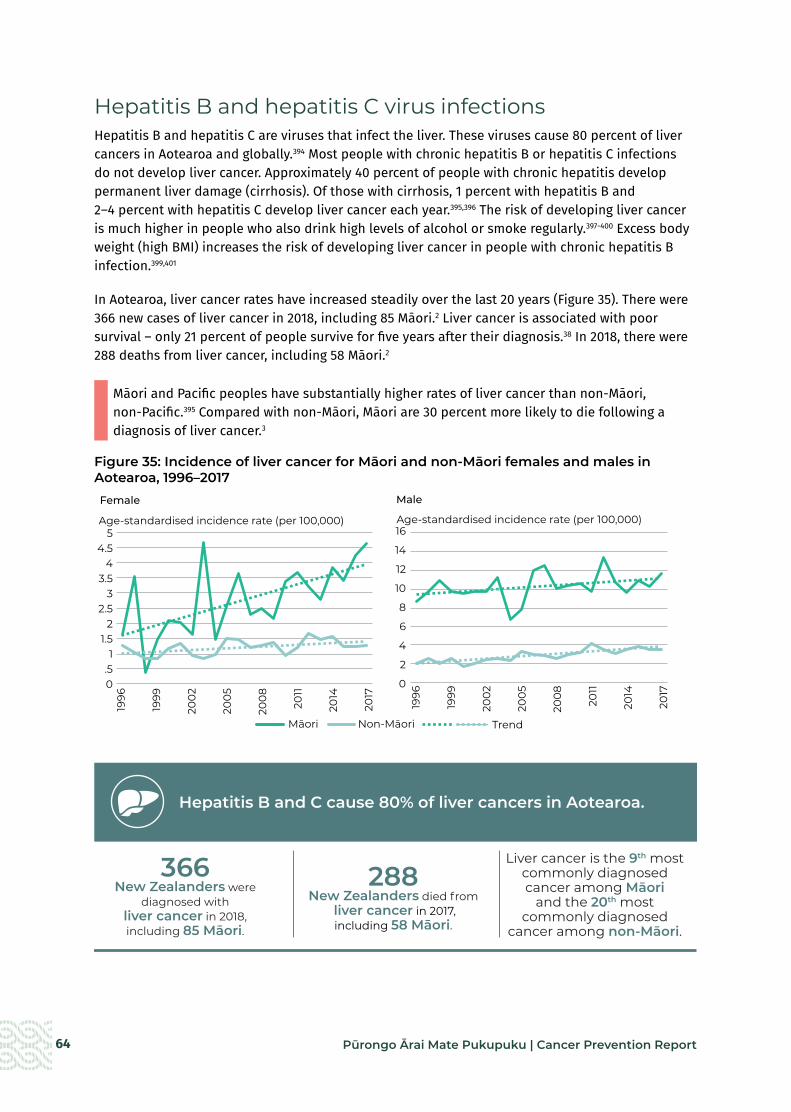
64 Pūrongo Ārai Mate Pukupuku | Cancer Prevention Report
Hepatitis B and hepatitis C virus infections Hepatitis B and hepatitis C are viruses that infect the liver. These viruses cause 80 percent of liver cancers in Aotearoa and globally.394 Most people with chronic hepatitis B or hepatitis C infections do not develop liver cancer. Approximately 40 percent of people with chronic hepatitis develop permanent liver damage (cirrhosis). Of those with cirrhosis, 1 percent with hepatitis B and 2–4 percent with hepatitis C develop liver cancer each year.395,396 The risk of developing liver cancer is much higher in people who also drink high levels of alcohol or smoke regularly.397-400 Excess body weight (high BMI) increases the risk of developing liver cancer in people with chronic hepatitis B infection.399,401
In Aotearoa, liver cancer rates have increased steadily over the last 20 years (Figure 35). There were 366 new cases of liver cancer in 2018, including 85 Māori.2 Liver cancer is associated with poor survival – only 21 percent of people survive for five years after their diagnosis.38 In 2018, there were 288 deaths from liver cancer, including 58 Māori.2
Māori and Pacific peoples have substantially higher rates of liver cancer than non-Māori, non-Pacific.395 Compared with non-Māori, Māori are 30 percent more likely to die following a diagnosis of liver cancer.3
Figure 35: Incidence of liver cancer for Māori and non-Māori females and males in Aotearoa, 1996–2017
1996
1999
200
2
200
5
200
8
2011
2014
2017
Age-standardised incidence rate (per 100,000)
Female Male
1996
1999
200
2
200
5
200
8
2011
2014
2017
Age-standardised incidence rate (per 100,000)5
4.54
3.53
2.52
1.51
.50
16
14
12
10
8
6
4
2
0
State of cancer Fig 1.5 liver cancer incidence
Māori Non-Māori Trend
Hepatitis B and C cause 80% of liver cancers in Aotearoa.
366 New Zealanders were
diagnosed with liver cancer in 2018, including 85 Māori.
288 New Zealanders died from
liver cancer in 2017, including 58 Māori.
Liver cancer is the 9th most commonly diagnosed cancer among Māori
and the 20th most commonly diagnosed
cancer among non-Māori.
Source: Ministry of Health cancer data (incidence and mortality) and Gurney et al 2020
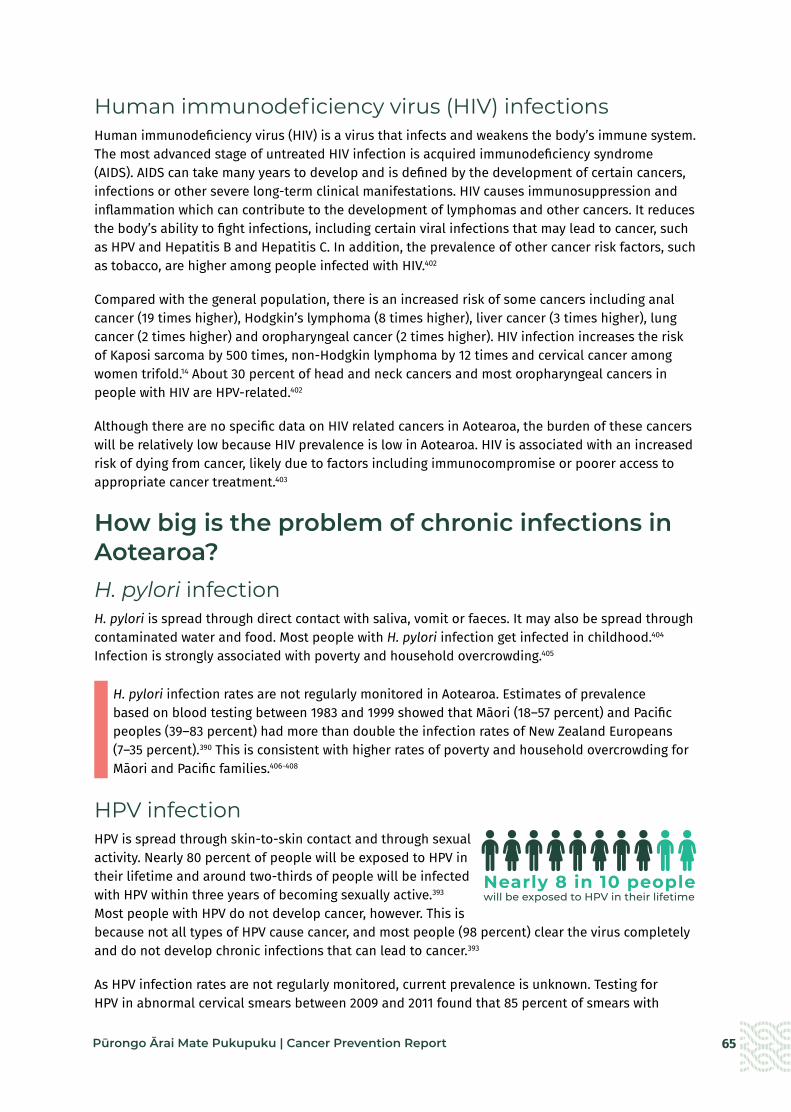
65Pūrongo Ārai Mate Pukupuku | Cancer Prevention Report
Human immunodeficiency virus (HIV) infections Human immunodeficiency virus (HIV) is a virus that infects and weakens the body’s immune system. The most advanced stage of untreated HIV infection is acquired immunodeficiency syndrome (AIDS). AIDS can take many years to develop and is defined by the development of certain cancers, infections or other severe long-term clinical manifestations. HIV causes immunosuppression and inflammation which can contribute to the development of lymphomas and other cancers. It reduces the body’s ability to fight infections, including certain viral infections that may lead to cancer, such as HPV and Hepatitis B and Hepatitis C. In addition, the prevalence of other cancer risk factors, such as tobacco, are higher among people infected with HIV.402
Compared with the general population, there is an increased risk of some cancers including anal cancer (19 times higher), Hodgkin’s lymphoma (8 times higher), liver cancer (3 times higher), lung cancer (2 times higher) and oropharyngeal cancer (2 times higher). HIV infection increases the risk of Kaposi sarcoma by 500 times, non-Hodgkin lymphoma by 12 times and cervical cancer among women trifold.14 About 30 percent of head and neck cancers and most oropharyngeal cancers in people with HIV are HPV-related.402
Although there are no specific data on HIV related cancers in Aotearoa, the burden of these cancers will be relatively low because HIV prevalence is low in Aotearoa. HIV is associated with an increased risk of dying from cancer, likely due to factors including immunocompromise or poorer access to appropriate cancer treatment.403
How big is the problem of chronic infections in Aotearoa? H. pylori infection H. pylori is spread through direct contact with saliva, vomit or faeces. It may also be spread through contaminated water and food. Most people with H. pylori infection get infected in childhood.404 Infection is strongly associated with poverty and household overcrowding.405
H. pylori infection rates are not regularly monitored in Aotearoa. Estimates of prevalence based on blood testing between 1983 and 1999 showed that Māori (18–57 percent) and Pacific peoples (39–83 percent) had more than double the infection rates of New Zealand Europeans (7–35 percent).390 This is consistent with higher rates of poverty and household overcrowding for Māori and Pacific families.406-408
HPV infectionHPV is spread through skin-to-skin contact and through sexual activity. Nearly 80 percent of people will be exposed to HPV in their lifetime and around two-thirds of people will be infected with HPV within three years of becoming sexually active.393 Most people with HPV do not develop cancer, however. This is because not all types of HPV cause cancer, and most people (98 percent) clear the virus completely and do not develop chronic infections that can lead to cancer.393
As HPV infection rates are not regularly monitored, current prevalence is unknown. Testing for HPV in abnormal cervical smears between 2009 and 2011 found that 85 percent of smears with
Nearly 8 in 10 peoplewill be exposed to HPV in their lifetime

66 Pūrongo Ārai Mate Pukupuku | Cancer Prevention Report
evidence of precancerous or invasive lesions were positive for HPV infection.393 In Aotearoa, HPV immunisation has been available for girls since 2008 and for boys since 2017. Currently, recommended levels of vaccine coverage (75 percent) have not been achieved for any ethnic group. Sixty-nine percent of girls and 70 percent of boys born in 2006 have completed their course of HPV vaccines (Figure 36).
Māori have the lowest coverage (53 percent of both females and males for the 2006 birth cohort), compared with Pacific and total population coverage of around 65–70 percent for females and males (Figure 36).
Figure 36: HPV coverage of girls and boys by 2003–2006 birth cohorts and ethnicity, as at July 202038
Percent
MalesState of cancer Fig 4.4
2003 2004 2005 2006
PercentFemales
1009080706050403020100
2003 2004 2005 2006
1009080706050403020100
Māori Pacific peoples Total Māori Pacific peoples Total
Birth cohort year Birth cohort year
Hepatitis B and C infections Both hepatitis B and C can be spread through exposure to infected blood and body fluids. Hepatitis B is transmitted primarily from an infected mother to baby during delivery, through sexual contact with an infected person, and through sharing contaminated needles, syringes and other drug-injecting equipment. Hepatitis C is transmitted primarily through sharing contaminated drug-injecting equipment.409 Intravenous drug use is a major risk factor for developing hepatitis C in Aotearoa.410 Not everyone who is infected with hepatitis B or hepatitis C will develop a chronic infection. For hepatitis B, the younger you are when you are infected, the higher the risk is that it will become chronic. For example, more than 30 percent of babies and young children develop chronic hepatitis B but only 5 percent of adults do.409 There is an effective vaccine for hepatitis B (providing lifelong immunity in 95 percent of people), but no vaccine for hepatitis C.409
In Aotearoa, hepatitis B vaccination coverage is highest for Pacific peoples at 97 percent, compared with 93 percent for the total population and 90 percent for Māori. Coverage has been declining steadily for Māori since 2018 (Figure 37).
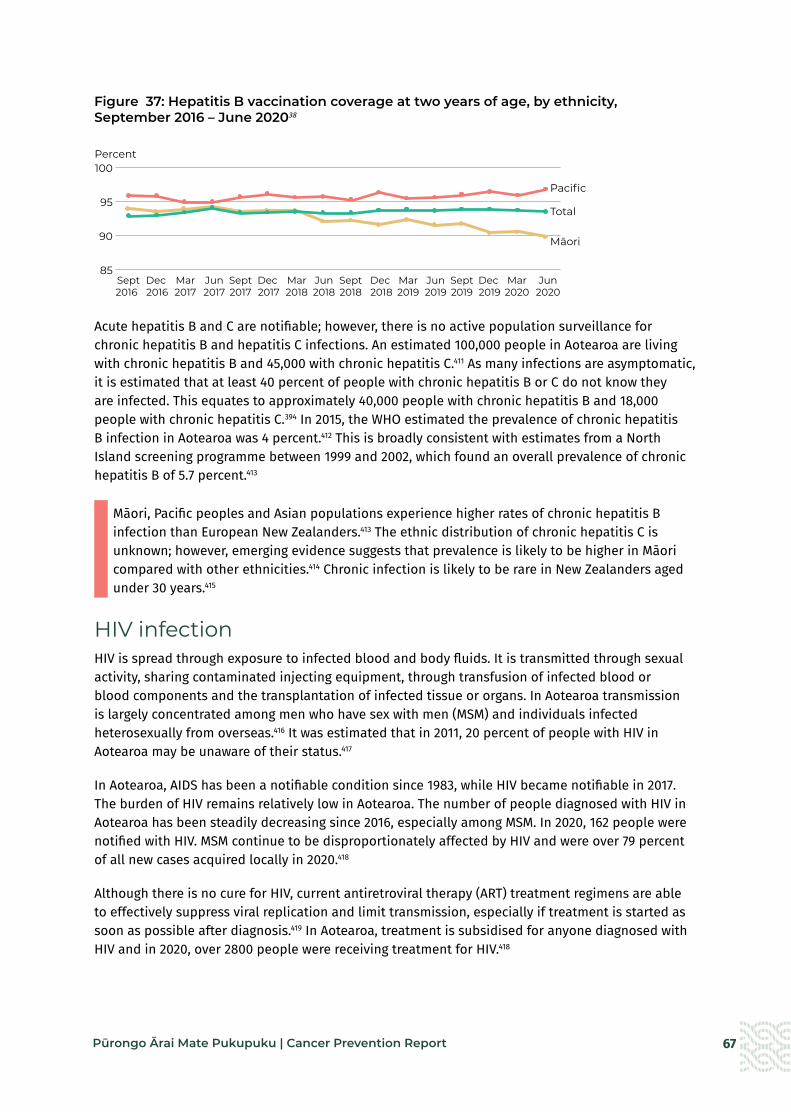
67Pūrongo Ārai Mate Pukupuku | Cancer Prevention Report
Figure 37: Hepatitis B vaccination coverage at two years of age, by ethnicity, September 2016 – June 202038
Acute hepatitis B and C are notifiable; however, there is no active population surveillance for chronic hepatitis B and hepatitis C infections. An estimated 100,000 people in Aotearoa are living with chronic hepatitis B and 45,000 with chronic hepatitis C.411 As many infections are asymptomatic, it is estimated that at least 40 percent of people with chronic hepatitis B or C do not know they are infected. This equates to approximately 40,000 people with chronic hepatitis B and 18,000 people with chronic hepatitis C.394 In 2015, the WHO estimated the prevalence of chronic hepatitis B infection in Aotearoa was 4 percent.412 This is broadly consistent with estimates from a North Island screening programme between 1999 and 2002, which found an overall prevalence of chronic hepatitis B of 5.7 percent.413
Māori, Pacific peoples and Asian populations experience higher rates of chronic hepatitis B infection than European New Zealanders.413 The ethnic distribution of chronic hepatitis C is unknown; however, emerging evidence suggests that prevalence is likely to be higher in Māori compared with other ethnicities.414 Chronic infection is likely to be rare in New Zealanders aged under 30 years.415
HIV infectionHIV is spread through exposure to infected blood and body fluids. It is transmitted through sexual activity, sharing contaminated injecting equipment, through transfusion of infected blood or blood components and the transplantation of infected tissue or organs. In Aotearoa transmission is largely concentrated among men who have sex with men (MSM) and individuals infected heterosexually from overseas.416 It was estimated that in 2011, 20 percent of people with HIV in Aotearoa may be unaware of their status.417
In Aotearoa, AIDS has been a notifiable condition since 1983, while HIV became notifiable in 2017. The burden of HIV remains relatively low in Aotearoa. The number of people diagnosed with HIV in Aotearoa has been steadily decreasing since 2016, especially among MSM. In 2020, 162 people were notified with HIV. MSM continue to be disproportionately affected by HIV and were over 79 percent of all new cases acquired locally in 2020.418
Although there is no cure for HIV, current antiretroviral therapy (ART) treatment regimens are able to effectively suppress viral replication and limit transmission, especially if treatment is started as soon as possible after diagnosis.419 In Aotearoa, treatment is subsidised for anyone diagnosed with HIV and in 2020, over 2800 people were receiving treatment for HIV.418
Sept Dec Mar Jun Sept Dec Mar Jun Sept Dec Mar Jun Sept Dec Mar Jun2016 2016 2017 2017 2017 2017 2018 2018 2018 2018 2019 2019 2019 2019 2020 2020
Percent
Fig 4.5 HEP B
100
95
90
85
Pacific
Total
Māori

68 Pūrongo Ārai Mate Pukupuku | Cancer Prevention Report
How can we prevent cancers related to chronic infections?Reducing the burden of cancers related to chronic infections requires both primary prevention and secondary prevention strategies. The primary prevention actions are aimed at preventing an infection before it ever occurs, whereas secondary prevention involves intervening early to manage the chronic infection with the aim of preventing progression to cancer.
The following evidence-based recommendations are considered most likely to reduce exposure to chronic infections and ultimately reduce cancer risk. They are in line with recommendations from the World Health Organization and major national and international experts and researchers. The interventions addressing hepatitis B and C broadly align with the recommendations set out in the WHO’s Global Health Sector Strategy on Viral Hepatitis 2016–21420 adopted by Aotearoa, as well as with the recent National Hepatitis C Action Plan for Aotearoa New Zealand, which has the overarching goal of eliminating hepatitis C as a major public health threat by 2030.414 Although screening programmes are beyond the scope of this report, the change to HPV primary screening (with the option of self-testing) within the national cervical screening programme will be a significant step, alongside HPV immunisation, towards eliminating cervical cancer.421,422
Primary prevention recommendations
a Prevent exposure to conditions that increase the risk of acquiring and transmitting infections (H. pylori).
• Reduce child poverty.
• Reduce children’s exposure to household crowding.
a Reduce risk of transmission of infection through contaminated blood and body fluids (HPV, hepatitis B and C, HIV).
• Promote safe sex practices such as consistent condom use.
• Prevent transmission through transfusion of contaminated blood products.
• Ensure appropriate infection control practices for blood-prone procedures.
• Ensure access to safe injecting for people who inject drugs.
a Ensure equitable access to immunisation against HPV and hepatitis B.
• Ensure equitable HPV immunisation coverage for all population groups.
• Ensure equitable hepatitis B immunisation coverage for all population groups.
a Ensure equitable access to pre-exposure and post-exposure prophylaxis for HIV
• Ensure equitable access to pre-exposure and post-exposure prophylaxis for HIV.

69Pūrongo Ārai Mate Pukupuku | Cancer Prevention Report
Secondary prevention recommendations
a Improve identification of individuals with cancer causing chronic infections to facilitate access to treatment and ongoing medical care.
• Screen all pregnant women for chronic hepatitis B infection and HIV, and provide appropriate treatment to mother and baby.
• Improve how individuals with chronic hepatitis B infection can be identified, treated, monitored and followed up.
• Improve how individuals with chronic hepatitis C infection can be identified, treated, monitored and followed up.
• Improve how individuals with H. pylori infection can be identified and treated.
• Improve how individuals with HIV can be identified, treated, monitored and followed up.
Focus area: Prevent exposure to conditions that increase the risk of acquiring and transmitting infections (primary prevention – H. pylori)
What is the impact of poverty and household crowding on acquiring and transmitting infections?
Poverty and household crowding are strongly linked to a higher risk of many infectious diseases, particularly those spread through close person-to-person contact.405,423-425 In Aotearoa, an estimated 10 percent of hospital admissions each year are due to household crowding.405 Children are the most vulnerable to infection with H. pylori and are also more likely to live in poverty and overcrowded housing than adults.
In 2020, of the 210,500 children living in poverty,426 21 percent were Māori and Pacific compared with 14.8 percent who were New Zealand European.407 In 2018, 40 percent of Pacific families and 20 percent of Māori families were living in overcrowded housing.408 Infection rates also involve substantial inequities, with Māori and Pacific children significantly more likely to be infected with H. pylori.427
Action: Reduce child poverty
What is the evidence?
Poverty (socioeconomic deprivation) is strongly associated with many infectious diseases in children and young people, including H. pylori infection in those aged under 20 years.428
What is Aotearoa doing currently?
The Child Poverty Reduction Act 2018 set targets for reducing child poverty and required annual reporting on progress. From July 2018, targeted support for low- and middle-income families with children (known as the Families Package) has gradually been implemented.
In 2021, the Government’s Budget included significant increases to benefits, which are likely to contribute to reduced child poverty rates.

70 Pūrongo Ārai Mate Pukupuku | Cancer Prevention Report
Action: Reduce children’s exposure to household crowding
What is the evidence?
Because H. pylori is spread primarily through oral-oral or faecal-oral routes, close household contact is a key risk factor for transmission of infection.428
H. pylori infection is clearly associated with household crowding in children and young people aged under 20 years.405,428 Interventions that reduce household crowding reduce the risk of gastrointestinal and respiratory infections, including H. pylori.423 Reducing household crowding can reduce hospital admissions for close-contact infectious diseases,405 although impacts on H. pylori infection rates were not specifically assessed.
What is Aotearoa doing currently?
Aotearoa established the Healthy Homes Initiatives* between 2013 and 2015 to improve children’s access to warm, dry, uncrowded homes.429 The initiative is a partnership between many different agencies, including the Ministry of Health, District Health Boards, Housing New Zealand and the Ministry for Social Development. Initially, the programme only provided housing support to children and whānau with (or at risk of developing) acute rheumatic fever.429 In 2016, it was extended to children from low income whānau with any housing related illness.
A recent evaluation of the programme showed it effectively reduced hospital admissions and GP visits for infectious illnesses, although its impact on H. pylori acquisition was not assessed.429
* For more information, see the Ministry of Health website at: www.health.govt.nz/our-work/preventative-health-wellness/healthy-homes-initiative

71Pūrongo Ārai Mate Pukupuku | Cancer Prevention Report
Focus area: Reduce risk of transmission of infection through contaminated blood and body fluids (primary prevention – HPV, hepatitis B and C, HIV)
What is the impact of contaminated blood and body fluids on transmission of infections?
Hepatitis B and C and HIV are transmitted through exposure to contaminated blood and body fluids. HPV is mainly transmitted through sexual contact.
In 2018, almost 20 percent of cases of acute hepatitis B in Aotearoa reported sexual contact with a confirmed case of acute or chronic hepatitis B infection.430
International studies show inadequate infection control practices have resulted in transmission of hepatitis B and hepatitis C from health workers to patients and vice versa in health care settings,431 and following tattooing in prison and non-prison settings.432-434
Intravenous (IV) drug use is now the main risk factor for hepatitis C infection in Aotearoa410 and internationally,435 and remains a key risk for transmission of hepatitis B. Sharing syringes and other drug-injecting equipment increases the risk of contracting hepatitis C in injecting drug users.435
Action: Promote safe sex practices such as consistent condom use (HPV, hepatitis B and C, HIV)
What is the evidence?
Consistent use of condoms reduces the risk of infection with HPV for both men436 and women, and is protective against the development of cervical cancer in women.437
Condom use can also reduce the transmission of hepatitis B.438
For HIV, the correct and consistent use of condoms decreases the risk of infection by about 90 percent.439
What is Aotearoa doing currently?
The Ministry of Health, the New Zealand Sexual Health Society, New Zealand Family Planning and other organisations have produced resources for the public and for health professionals on sexually transmitted infections (STIs), including HPV, hepatitis B, and HIV, and preventing STIs through safe sex and condom use.406 Sexuality education, including teaching about STIs and safe sex, is compulsory in schools in Aotearoa through to the end of year 10.
Action: Prevent transmission through transfusion of contaminated blood products (hepatitis B and C, HIV)
What is the evidence?
Transfusion-associated hepatitis and HIV are now rare in most developed countries.440,441 Before screening of donors and blood products was introduced, the prevalence of transfusion-associated hepatitis was as high as 30 percent in the USA.440
However, transfusion associated heatitis and HIV remain high in countries that have inadequate screening of blood products and high prevalence of infection in blood donors.441,442 In Sub-Saharan Africa, unsafe blood transfusion accounted for 5-10 percent of HIV infections.443
Despite screening, a small risk of transmitting infection remains if the donor has an occult hepatitis B infection with DNA levels that are undetectable by assays.441
What is Aotearoa doing currently?
The New Zealand Blood Service reduces the risk of transfusion-related infections by excluding donors at high risk of hepatitis B or C infections and HIV, by having only volunteer donors who do not receive payment for donation, and by screening every unit of blood for these viruses and discarding any product that tests positive.444
No cases of transfusion-associated hepatitis B or C infection have been reported in Aotearoa since the introduction of blood screening.445 However, modelling suggests that one case of infection could be expected every two to three years in Aotearoa.446
Since 1996, no cases of transfusion-associated HIV infection have been detected in Aotearoa.418

72 Pūrongo Ārai Mate Pukupuku | Cancer Prevention Report
Action: Ensure appropriate infection control practices for blood-prone procedures (hepatitis B and C, HIV)
What is the evidence?
Strict infection prevention and control practices (including cleaning of premises and appropriate sterilisation of equipment) are recommended for all procedures that could result in exposure to blood. This includes procedures that pierce the skin (eg, blood tests, injections, tattoos, body piercing) or damage the skin (eg, skin exfoliation and nail care).447
What is Aotearoa doing currently?
Under the Health and Safety at Work Act 2015, employers are required to take all practicable steps to mitigate risk and protect workers from exposure to infectious diseases such as hepatitis B and C and HIV.448
Health care settings
Health care workers are legally obliged to comply with established infection control practices to minimise the risk of transmission of hepatitis B or C and HIV.449
Other settings
Aotearoa has no legislation requiring beauty therapists or tattooists to be licensed or to comply with infection control practices.450
Some councils have introduced (or are planning to introduce) bylaws to protect people from contracting infectious diseases through services that pierce or break the skin.450 These bylaws outline which business/services must be licensed and what minimum health and hygiene standards they must meet.
Some professional bodies, such as the New Association of Registered Beauty Professionals, have published health and hygiene guidelines that outline required infection control practices to reduce the risk of exposure to blood-borne viruses such as hepatitis B and hepatitis C.451
Action: Ensure access to safe injecting for people who inject drugs (hepatitis B and C, HIV)
What is the evidence?
An evaluation of the impact of Australian needle and syringe programmes between 2000 and 2009 estimated that the programmes had prevented more than 32,000 new hepatitis C infections and almost 100,000 new HIV cases. It further assessed the programmes as being highly cost-effective and cost-saving to the health sector.452
What is Aotearoa doing currently?
Needle exchange programmes were introduced in Aotearoa in the late 1980s. The programmes provide clean needles and injecting equipment to IV drug users to reduce the risk of blood-borne infections.453
A review of the programme four to six years after its implementation showed a reduction in needle sharing behaviours and a lower proportion of hepatitis C infections in those who started using IV drugs since the programme was introduced.454
Aotearoa has sustained low levels of HIV transmission among people who inject drugs, with only 2.9 percent of HIV cases in this group between 1996 – 2018.455
73Pūrongo Ārai Mate Pukupuku | Cancer Prevention Report
Focus area: Ensure equitable access to immunisation against HPV and hepatitis B (primary prevention)
What is the impact of immunisation for HPV and hepatitis B on cancers related to chronic infections?
Immunisation is the most effective population-based strategy for preventing cancers related to HPV and chronic hepatitis B infections. Universal infant vaccination is considered the most effective way of decreasing chronic hepatitis B infection rates.456
Māori have lower coverage rates for both HPV and hepatitis B immunisation.38
Action: Ensure equitable HPV immunisation coverage for all population groups
What is the evidence?
Clinical studies have demonstrated effective antibody responses in 99 percent of those who received the HPV vaccine409 and 98 percent protection against development of HPV-related precancerous lesions.409
HPV vaccination reduces the incidence of invasive cervical cancer in women aged 30 years or under.457 Cancer risk fell by 78 percent for women vaccinated before the age of 17 and by 53 percent for women vaccinated between the ages of 17 and 30 years in a Swedish study.457
HPV vaccination has effectively reduced diagnoses of HPV infections and genital warts in vaccinated populations.458 Additionally, there is evidence of herd immunity in unvaccinated men and women.458
What is Aotearoa doing currently?
In Aotearoa, HPV immunisation has been available for girls since 2008 and for boys since 2017. The vaccine protects against the types of HPV responsible for around 90 percent of cervical and other HPV-related cancers.409 HPV immunisation is free for all young people aged 9 to 26 years, including non-residents under 18 years old. A school-based immunisation programme for students in Year 8 is available in most areas of Aotearoa.
Since 2008, rates of HPV-related genital wart infection have fallen substantially, suggesting it is likely that an overall reduction in HPV prevalence in Aotearoa has occurred.459 Although cervical cancer rates have reduced substantially over the last 20 years, it is too early to attribute this to the immunisation programme. This is because it takes 10–15 years for such cancers to develop.
Currently, recommended levels of vaccine coverage (75 percent) have not been achieved for any ethnic group. Immunisation rates are significantly lower for Māori girls and boys compared with other ethnic groups (Figure 36).

74 Pūrongo Ārai Mate Pukupuku | Cancer Prevention Report
Action: Ensure equitable hepatitis B immunisation coverage for all population groups
What is the evidence?
Hepatitis B vaccines are highly effective and provide lifelong immunity for 85–95 percent of people who receive the vaccine.409
Children and adolescents who are fully immunised against hepatitis B have a significantly lower risk of liver cancer than their unimmunised cohorts.460
Seroprevalence surveys in the Western Pacific and Taiwan show a substantial reduction in the prevalence of chronic hepatitis B infection in children following the introduction of universal hepatitis B vaccination programmes.460,461 However, more follow-up is needed to find out whether this initial lower prevalence continues for these children into late adulthood.
What is Aotearoa doing currently?
In 1988, Aotearoa introduced hepatitis B immunisation for infants. Presently, infants receive their hepatitis B vaccination (DTaP-IPV-HepB/Hib) at six weeks, three months and five months of age as part of the national immunisation schedule. Hepatitis B vaccination is also subsidised for unimmunised under 18-year-olds, household or sexual contacts of people with hepatitis B infection, people with HIV or hepatitis C infection, and those who have had a needlestick injury.395
Since 1988, the number of notifications of new hepatitis B infections in Aotearoa has fallen dramatically.38 However, as many infections do not cause symptoms, this may underestimate the true burden of disease.
As Aotearoa does not routinely conduct seroprevalence surveys, the impact of immunisation on the prevalence of chronic infections is unknown. To date, the number of liver cancer cases has not decreased. However, because it takes many decades for cancer to develop, it is predicted that it will be about 2030 before Aotearoa has a significant reduction in the number of liver cancer cases.409
Currently, immunisation rates are high, with more than 90 percent of two-year olds fully immunised between 2016 and 2018. Immunisation rates for Māori infants have fallen from 94 percent in 2018 to 90 percent in 2020 (Figure 37).

75Pūrongo Ārai Mate Pukupuku | Cancer Prevention Report
Focus area: Ensure equitable access to pre-exposure and post-exposure prophylaxis for HIV
What is the impact of pre-exposure and post-exposure prophylaxis treatments on acquiring HIV infections?
Pre-exposure prophylaxis (PrEP) and post-exposure prophylaxis (PEP) are medications taken by people who do not have HIV to prevent infection. PrEP can reduce the risk of acquiring HIV during unprotected sexual activity by up to 99 percent if taken daily as prescribed.462 There is some evidence that PEP may be able to prevent infection in people who may have been exposed to HIV if taken within 72 hours (ideally as soon as possible).463
Action: Ensure equitable access to pre-exposure and post-exposure prophylaxis for HIV
What is the evidence?
PrEP is effective at reducing HIV transmission. There was a 32 percent decline in newly acquired HIV diagnoses following implementation of a large PrEP project combined with increased HIV testing and prompt treatment of those infected in London.464 Overseas, non-European MSM are less likely to access and adhere to PrEP.465,466
The effectiveness of PEP depends on factors such as the time between exposure and treatment, the type of exposure, and the HIV viral load of the sexual contact.463
What is Aotearoa doing currently?
PrEP and PEP medicines are currently available in Aotearoa.
Aotearoa became one of the first countries to publicly fund PrEP in March 2018 for high-risk individuals.466 People must test negative for HIV prior to starting PrEP and every 3 months while taking it. It is estimated that over 5,800 people in Aotearoa will be eligible for PrEP, including 18 percent of all sexually active MSM.467
PEP is usually sought through the emergency department or another urgent care service. There is a cost for PEP (approximately $80-100) for those that do not meet certain criteria.468
76 Pūrongo Ārai Mate Pukupuku | Cancer Prevention Report
Focus area: Improve identification of individuals with cancer causing chronic infections to facilitate access to treatment and ongoing medical care (secondary prevention)
What is the impact of early identification and management of chronic infections on developing cancer?
Many people with chronic H. pylori, HPV, hepatitis B, hepatitis C infections and HIV do not have symptoms so they are not aware that they are infected and have a higher risk of developing cancer. As it can take many decades for cancer to develop, starting effective treatment for a chronic infection early reduces the risk of developing cancer.
Stigma and discrimination associated with infections such as HIV and hepatitis C can also prevent or delay people from accessing treatment and ongoing medical care.
Action: Screen all pregnant women for chronic hepatitis B infection and HIV and provide appropriate treatment to mother and baby
What is the evidence?
Hepatitis B is easily transmitted from mother to baby at birth. An estimated 90 percent of babies born to mothers with a high level of hepatitis B virus in their blood will become infected.469 Infection in infancy and early childhood is associated with the highest risk of developing chronic hepatitis B infection.470
Conducting antenatal screening for hepatitis B infection and administering hepatitis B vaccine and immunoglobulin at birth effectively reduces the risk of babies developing chronic hepatitis B infection.469-471
Antiviral treatment in pregnancy provides additional protection for pregnant women with high blood concentrations of virus.469,470,472
HIV can be passed from mother to baby during pregnancy, the birth or through breastfeeding. The transmission rate from mother to baby is up to 25 percent for HIV infection and declines to less than 2 percent with antiretroviral treatment.473
What is Aotearoa doing currently?
All pregnant women in Aotearoa are offered antenatal testing for hepatitis B. Aotearoa guidelines recommend giving antiviral therapy to pregnant women with hepatitis B infection and giving their babies hepatitis B immunoglobulins and a vaccine dose within 24 hours of birth.395
HIV testing is recommended for all pregnant women.474 Women with HIV are offered treatment and it is recommended by the Ministry of Health that women do not breastfeed.475
Since 2007, there has been no children with perinatally-acquired HIV born in Aotearoa.418

77Pūrongo Ārai Mate Pukupuku | Cancer Prevention Report
Action: Improve how individuals with chronic hepatitis B infection can be identified, treated, monitored and followed up
What is the evidence?
Most people with chronic hepatitis B are asymptomatic.395 This puts them at risk of transmitting the infection to others and developing complications such as liver cancer.469,476-478
A 2017 USA modelling study showed that identifying and appropriately treating 90 percent of chronic hepatitis B cases would prevent one-third of new cases of liver cancer by 2030.469
There is limited evidence for population-based screening for chronic hepatitis B. Opportunistic screening is effective at identifying cases of infection that had not previously been diagnosed and is likely to be cost-effective in high-prevalence countries.478 However, no studies have evaluated differences in liver cancer outcomes between screened and unscreened populations.478
Antiviral treatment of hepatitis B reduces viral load, improves liver function and decreases the risk of developing complications such as liver cancer.395 No available treatments cure chronic hepatitis B and many patients need lifelong treatment.395
What is Aotearoa doing currently?
Opportunistic screening for chronic hepatitis B is recommended for people at higher risk of infection. This includes people born before 1988 (when the immunisation programme started), migrants from countries with a high prevalence of hepatitis B, people who have been exposed to blood (eg, through sports or assaults) and anyone with a history of tattooing or body piercing in unlicensed premises (eg, prison) or overseas.395 All pregnant women and all people entering prison are offered testing for hepatitis B.
PHARMAC funds antiviral medicines for hepatitis B that effectively reduce viral load in patients with chronic hepatitis B.395
All patients with chronic hepatitis B infection should be referred to the Hepatitis Foundation for support and ongoing monitoring and follow-up. This is a free service.479 Currently, only 25 percent of the estimated 100,000 people with chronic hepatitis B are enrolled.479
Action: Improve how individuals with chronic hepatitis C infection can be identified, treated, monitored and followed up
What is the evidence?
With early diagnosis of chronic hepatitis C, people can receive effective treatment to cure the infection and prevent progression to liver cancer.420,476 Antiviral therapy cures hepatitis C in over 95 percent of people.396 Curing the infection is associated with lower rates of liver fibrosis and reduced risk of developing liver cancer.396,469
Many European countries and more recently the USA have adopted universal testing of adults for hepatitis C.
What is Aotearoa doing currently?
Opportunistic screening for chronic hepatitis C in primary care is recommended for people at high risk of infection including those who have a history of injectable drug use, have migrated from a region with high hepatitis C prevalence, have spent time in prison, have had a blood transfusion before 1992 or have a history of tattooing or body piercing in unlicensed premises (eg, prison) or overseas.410 As at least 20 percent of people with hepatitis C do not have identifiable risk factors, this approach is likely to miss cases of infection.469 While universal testing has been adopted elsewhere, further assessment of cost-effectiveness and feasibility would be needed before introducing it in Aotearoa.414
Since February 2019, PHARMAC has funded an effective antiviral treatment (Maviret) for hepatitis C without restriction.396

78 Pūrongo Ārai Mate Pukupuku | Cancer Prevention Report
Action: Improve how individuals with H. pylori infection can be identified and treated
What is the evidence?
Screening for H. pylori and treating the infection with antibiotics reduces the incidence of stomch cancer in the short and long term.480-482
In 2014, IARC and WHO recommended that countries explore the possibility of introducing population-based H. pylori screening and treatment programmes for people without symptoms.483,484
Stomach cancer screening, often including H. pylori screening and treatment occurs in several high risk populations, including in Japan and some parts of China.485 For example, on Matsu island, Taiwan, mass screening and treatment of H. pylori from 2004–2018 resulted in 79 percent eradication of H. pylori and a decrease in stomach cancer incidence and mortality.486
What is Aotearoa doing currently?
Guidelines for Aotearoa recommend H. pylori testing and treatment for people with symptoms of dyspepsia (indigestion, heartburn or reflux) who are at higher risk of infection (such as Māori and Pacific patients).404 As most people with H. pylori do not have symptoms, the current approach to testing is likely to miss many cases of infection.
Aotearoa modelling studies show that screening for H. pylori (for example, taking stool samples or conducting breath tests) in Māori and Pacific peoples who do not have symptoms is likely to be cost-effective in Aotearoa487 and could reduce the risk of stomach cancer by one-third.388,487 However, more information, including up-to-date estimates of H. pylori prevalence rates, is needed before such a programme could be implemented in Aotearoa.388
Action: Improve how individuals with HIV infection can be identified, treated, monitored and followed-up
What is the evidence?
Early detection of HIV and prompt management can result in good outcomes for the individual. Timely access to antiretroviral therapy (ART) and support to remain on treatment can result in suppressed viral load, prevent HIV transmission and result in people with HIV leading long healthy lives.419
Since 2016, WHO has recommended that all people living with HIV be provided with lifelong ART, regardless of clinical status or CD4 cell count. ART should be offered on the same day as diagnosis to those ready to start treatment.419
What is Aotearoa doing currently?
In Aotearoa, guidelines recommend that regular HIV testing (at least annually) should be considered for those at risk of HIV exposure, including sexual partners of people known to be HIV positive, MSM, any other person with a history of sexual exposure that could result in HIV transmission, recent migrants from a high-risk country, and people with a history of injecting drug use. Testing is also offered to pregnant women.488
The New Zealand AIDS Foundation offers various testing options to increase access including home testing kits (using oral swabs) and rapid finger prick testing at selected centres.489
In Aotearoa, several classes of ART are available and treatment is subsidised for anyone diagnosed with HIV. It is estimated that 95 percent of people living with HIV were on ART and 82 percent had a suppressed viral load between 2006 and 2017. However, this does not include those with HIV whose current treatment status is unknown and may be an overestimate.490
79Pūrongo Ārai Mate Pukupuku | Cancer Prevention Report
Although Aotearoa does not yet have an overarching strategy for addressing chronic infections, several positive measures have been introduced to reduce the burden of H. pylori, HPV, hepatitis B, hepatitis C and HIV infections, including the recent National Hepatitis C Action Plan for Aotearoa New Zealand – Māhere Mahi mō te Ate Kakā C 2020–2030 and HPV vaccination and screening.414 All work will need to be supported by surveillance and equity-focused monitoring of infection rates, as well as the evaluation of existing and future interventions.
Cancers caused by chronic infections bridge the false separation that is sometimes made between communicable diseases and non-communicable diseases. These cancers are characterised by stark inequities and yet have the potential to be reduced or eliminated,420,422 as long as the interventions we put in place work disproportionately well for Māori, Pacific and other priority populations. Stigma and discrimination remain significant barriers to achieving progress in certain chronic infections, such as hepatitis B and C and HIV and need to be challenged.

80 Pūrongo Ārai Mate Pukupuku | Cancer Prevention Report
HE KUPU WHAKAKAPI CONCLUSIONThis report brings together a description of key cancer risk factors and the options available to reduce the adverse impacts of those risk factors in Aotearoa. The options described for strengthening cancer prevention are many and, at first glance, varied. There is much that can be done. However, many themes are common across cancer risk factors. In a nutshell, Aotearoa can prevent cancer by:• reducing the availability and accessibility of harmful products that increase the risk of cancer,
such as by reducing the number of outlets selling tobacco or alcohol, or introducing minimum unit prices for them
• increasing the availability and accessibility of commodities that can reduce the risk of cancer, such as by providing adequate housing to reduce household crowding or subsidising fruit and vegetables
• improving physical environments or settings such as by providing enough shade from the sun, improving public transport or restricting smoking in outdoor spaces
• restricting the advertising or marketing of some products such as alcohol and unhealthy food and drinks
• regulating the contents of certain products such as the amount of nicotine in cigarettes, the quality of sunscreens or the amount of salt, sugar and fat in packaged foods
• improving health services for those particularly at risk such as by ensuring access to safe injecting for people who inject drugs, and effectively identifying and treating individuals with chronic infections.
Implementing the options in this report in a successful and sustainable way will depend on a range of enablers, which were beyond the scope of this report to discuss in detail but are nonetheless important. Such enablers include (but are not limited to) strong Māori leadership and governance, good data and monitoring, purposeful research and evaluation, effective cross-sector collaboration (particularly to address issues like housing and child poverty), support for communities to have more control over their environment, sufficient compliance and enforcement activities, and adequate resourcing for all these elements.
Many of the options for cancer prevention involve extending or strengthening existing initiatives, while a few are new. Because almost all options are about improving the environments that people live in, they are mostly within the sphere of influence of central government and local government. Many of the initiatives will be delivered in a range of settings (schools, workplaces, health services and communities) and by a range of skilled providers (Māori and Pacific providers, primary care, non-governmental organisations, public health units and district health boards). These settings and providers will require supportive central and local government policies to amplify and sustain their efforts. It is also important not to underestimate how much public support such policies have. For example, almost 80 percent of adult smokers and recent quitters supported a tobacco-free generation policy85 and 80 percent of people in another survey supported increasing restrictions on alcohol advertising.176
This report focuses on changing environments rather than relying solely on changing individual behaviour-basically, what Aotearoa can do to make healthy choices easy choices. Tobacco control
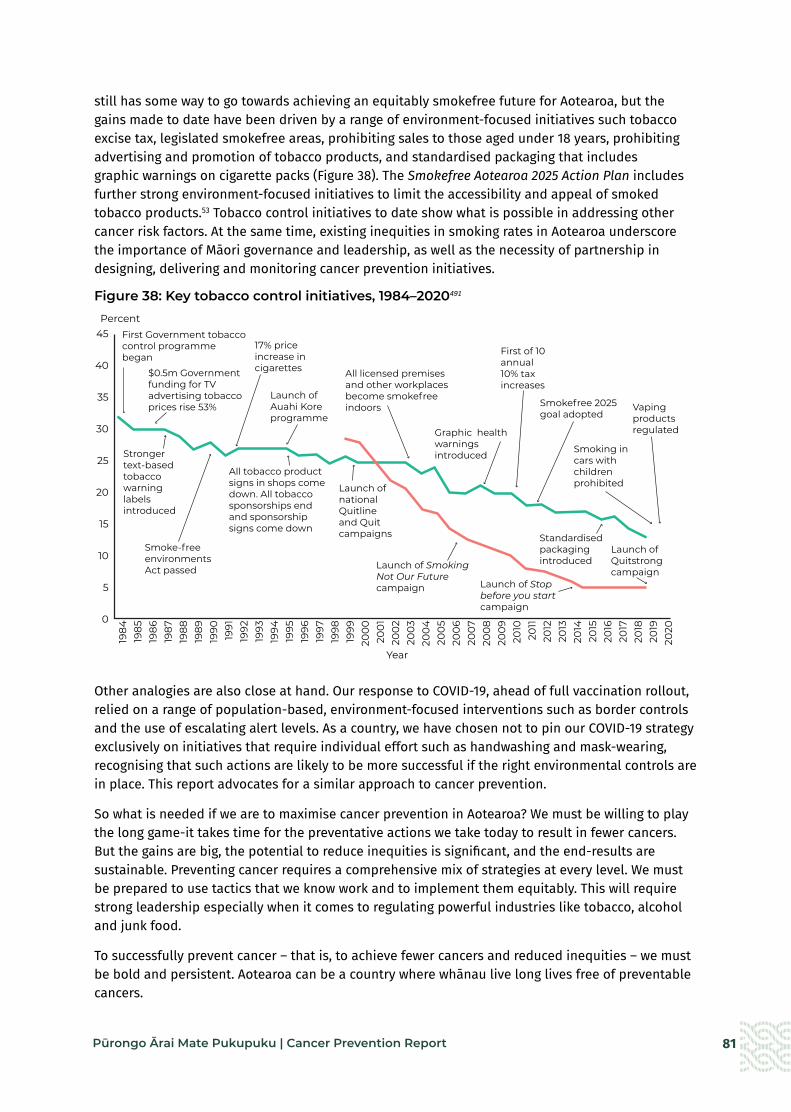
81Pūrongo Ārai Mate Pukupuku | Cancer Prevention Report
still has some way to go towards achieving an equitably smokefree future for Aotearoa, but the gains made to date have been driven by a range of environment-focused initiatives such tobacco excise tax, legislated smokefree areas, prohibiting sales to those aged under 18 years, prohibiting advertising and promotion of tobacco products, and standardised packaging that includes graphic warnings on cigarette packs (Figure 38). The Smokefree Aotearoa 2025 Action Plan includes further strong environment-focused initiatives to limit the accessibility and appeal of smoked tobacco products.53 Tobacco control initiatives to date show what is possible in addressing other cancer risk factors. At the same time, existing inequities in smoking rates in Aotearoa underscore the importance of Māori governance and leadership, as well as the necessity of partnership in designing, delivering and monitoring cancer prevention initiatives.
Figure 38: Key tobacco control initiatives, 1984–2020491
Other analogies are also close at hand. Our response to COVID-19, ahead of full vaccination rollout, relied on a range of population-based, environment-focused interventions such as border controls and the use of escalating alert levels. As a country, we have chosen not to pin our COVID-19 strategy exclusively on initiatives that require individual effort such as handwashing and mask-wearing, recognising that such actions are likely to be more successful if the right environmental controls are in place. This report advocates for a similar approach to cancer prevention.
So what is needed if we are to maximise cancer prevention in Aotearoa? We must be willing to play the long game-it takes time for the preventative actions we take today to result in fewer cancers. But the gains are big, the potential to reduce inequities is significant, and the end-results are sustainable. Preventing cancer requires a comprehensive mix of strategies at every level. We must be prepared to use tactics that we know work and to implement them equitably. This will require strong leadership especially when it comes to regulating powerful industries like tobacco, alcohol and junk food.
To successfully prevent cancer – that is, to achieve fewer cancers and reduced inequities – we must be bold and persistent. Aotearoa can be a country where whānau live long lives free of preventable cancers.
1984
1985
1986
1987
1988
1989
1990
1991
1992
1993
1994
1995
1996
1997
1998
1999
200
020
01
200
220
0320
04
200
520
06
200
720
08
200
920
1020
1120
1220
1320
1420
1520
1620
1720
1820
1920
20
Percent
Cancer Prevention Fig 38
45
40
35
30
25
20
15
10
5
0
First Government tobacco control programme began
$0.5m Government funding for TV advertising tobacco prices rise 53%
17% price increase in cigarettes
Launch of Auahi Koreprogramme
All licensed premises and other workplaces become smokefree indoors
Graphic health warnings introduced
First of 10annual10% tax increases
Smokefree 2025goal adopted
Smoking in cars with children prohibited
Vaping products regulated
Stronger text-basedtobacco warninglabels introduced
Smoke-free environmentsAct passed
Launch of Stop before you start campaign
Launch of Smoking Not Our Future campaign
Launch of national Quitline and Quit campaigns
All tobacco product signs in shops come down. All tobacco sponsorships end and sponsorship signs come down
Standardisedpackaging introduced
Launch ofQuitstrong campaign
Year

82 Pūrongo Ārai Mate Pukupuku | Cancer Prevention Report
NGĀ TOHUTORO REFERENCES1. WHO. 2020. WHO Report on Cancer: Setting priorities, investing wisely and providing care for all. Geneva:
World Health Organization. URL: https://apps.who.int/iris/handle/10665/330745 (accessed 30 October 2021).
2. Ministry of Health. 2020. New cancer registrations 2018. URL: https://www.health.govt.nz/publication/new-cancer-registrations-2018 (accessed 29 October 2021).
3. Gurney J, Stanley J, McLeod M, et al. 2020. Disparities in cancer-specific survival between Māori and non-Māori New Zealanders, 2007–2016. JCO Global Oncology 6: 766–74. DOI: 10.1200/go.20.00028 (accessed 29 October 2021).
4. Teng AM, Atkinson J, Disney G, et al. 2016. Ethnic inequalities in cancer incidence and mortality: census-linked cohort studies with 87 million years of person-time follow-up. BMC Cancer 16(1): 755. DOI: 10.1186%2Fs12885-016-2781-4 (accessed 30 October 2021).
5. Tin Tin S, Elwood JM, Brown C, et al. 2018. Ethnic disparities in breast cancer survival in New Zealand: which factors contribute? BMC Cancer 18(1): 58. DOI: 10.1186/s12885-017-3797-0 (accessed 30 October 2021).
6. Sharples KJ, Firth MJ, Hinder VA, et al. 2018. The New Zealand PIPER Project: colorectal cancer survival according to rurality, ethnicity and socioeconomic deprivation-results from a retrospective cohort study. New Zealand Medical Journal 131(1476): 24–39.
7. Ministry of Health. 2016. Cancer: New Registrations and Deaths 2013. Wellington: Ministry of Health.
8. Cunningham R, Sarfati D, Stanley J, et al. 2015. Cancer survival in the context of mental illness: a national cohort study. General Hospital Psychiatry 37(6): 501–6. DOI: 10.1016/j.genhosppsych.2015.06.003 (accessed 29 October 2021).
9. Davis LE, Bogner E, Coburn NG, et al. 2020. Stage at diagnosis and survival in patients with cancer and a pre-existing mental illness: a meta-analysis. Journal of Epidemiology and Community Health 74(1): 84. DOI: 10.1136/jech-2019-212311 (accessed 29 October 2021).
10. Floud S, Barnes I, Verfürden M, et al. 2017. Disability and participation in breast and bowel cancer screening in England: a large prospective study. British Journal of Cancer 117(11): 1711–4. DOI: 10.1038/bjc.2017.331 (accessed 29 October 2021).
11. Merten JW, Pomeranz JL, King JL, et al. 2015. Barriers to cancer screening for people with disabilities: a literature review. Disability and Health Journal 8(1): 9–16. DOI: 10.1016/j.dhjo.2014.06.004 (accessed 29 October 2021).
12. Stats NZ. 2020. Measuring inequality for disabled New Zealanders: 2018. Stats NZ. URL: https://www.stats.govt.nz/reports/measuring-inequality-for-disabled-new-zealanders-2018 (accessed 30 October 2021).
13. Gonzales G, Przedworski J, Henning-Smith C. 2016. Comparison of health and health risk factors between lesbian, gay, and bisexual adults and heterosexual adults in the United States: results from the National Health Interview Survey. JAMA Internal Medicine 176(9): 1344–51. DOI: 10.1001/jamainternmed.2016.3432 (accessed 29 October 2021).
14. National Cancer Institute. 2017. HIV infection and cancer risk. URL: https://www.cancer.gov/about-cancer/causes-prevention/risk/infectious-agents/hiv-fact-sheet (accessed 30 October 2021).
15. Robson B, Purdie G, Cormack D. 2010. Unequal Impact II: Māori and Non-Māori cancer statistics by deprivation and rural-urban status, 2002–2006. Wellington: Ministry of Health. URL: https://www.health.govt.nz/publication/unequal-impact-ii-maori-and-non-maori-cancer-statistics-deprivation-and-rural-urban-status-2002-2006 (accessed 23 October 2021).
83Pūrongo Ārai Mate Pukupuku | Cancer Prevention Report
16. Vaccarella S, Lortet-Tieulent J, Saracci R, et al (eds). 2019. Reducing social inequalities in cancer: evidence and priorities for research. Lyon: International Agency for Research on Cancer, WHO. URL: https://publications.iarc.fr/Book-And-Report-Series/Iarc-Scientific-Publications/Reducing-Social-Inequalities-In-Cancer-Evidence-And-Priorities-For-Research-2019 (accessed 23 September 2020).
17. Ministry of Health. 2019. New Zealand Cancer Action Plan 2019–2029 – Te Mahere mō te Mate Pukupuku o Aotearoa 2019–2029. Wellington: Ministry of Health.
18. Ministry of Health. 2020. Whakamaua: Māori Health Action Plan 2020–2025. Wellington: Ministry of Health.
19. Ministry of Health. 2020. Ola Manuia: Pacific Health and Wellbeing Action Plan 2020–2025. Wellington: Ministry of Health.
20. IHME. 2019. GBD Results Tool –For all ages and sexes; risk factor mortality for all cancer (neoplasms), New Zealand. Institute for Health Metrics and Evaluation. URL: http://ghdx.healthdata.org/gbd-results-tool?params=gbd-api-2019-permalink/2bf916c6c5fc6390404cc2bedf64add9 (accessed 24 October 2021).
21. Ministry of Health. 2020. Longer, Healthier Lives: New Zealand’s Health 1990–2017. Wellington: Ministry of Health. URL: https://www.health.govt.nz/system/files/documents/publications/longer-healthier-lives-new-zealands-health-1990-2017.pdf (accessed 29 October 2021).
22. Walsh M, Grey C. 2019. The contribution of avoidable mortality to the life expectancy gap in Māori and Pacific populations in New Zealand-a decomposition analysis. New Zealand Medical Journal 132(1492): 46–60.
23. Health and Disability System Review. 2019. Health and Disability System Review: Interim Report. Hauora Manaaki ki Aotearoa Whānui: Pūrongo mō Tēnei Wā. URL: https://www.systemreview.health.govt.nz/interim-report (accessed 24 October 2021).
24. Hill S, Sarfati D, Blakely T, et al. 2010. Survival disparities in Indigenous and non-Indigenous New Zealanders with colon cancer: the role of patient comorbidity, treatment and health service factors. Journal of Epidemiology and Community Health 64(2): 117–23. DOI: 10.1136/jech.2008.083816 (accessed 29 October 2021).
25. Sarfati D, Robson B, Garvey G, et al. 2020. Cancer in indigenous populations: focusing on inequalities that are sometimes invisible. In EWC Wild, B Stewart (eds), World Cancer Report: Cancer research for cancer prevention. International Agency for Research on Cancer.
26. Health Quality & Safety Commission. 2021. Bula Sautu – A Window on Quality 2021: Pacific health in the year of COVID-19. Wellington: Health Quality & Safety Commission.
27. Health Quality & Safety Commission. 2019. A Window on the Quality of Aotearoa New Zealand’s Health Care 2019. Wellington: Health Quality & Safety Commission.
28. Dahlgren G, Whitehead M. 1991. Policies and Strategies to Promote Social Equity in Health. Stockholm, Sweden: Institute for Future Studies. URL: www.iffs.se/media/1326/20080109110739filmZ8UVQv2wQFShMRF6cuT.pdf (accessed 8 November 2021).
29. Vandevijvere S, Sushil Z, Exeter DJ, et al. 2016. Obesogenic retail food environments around New Zealand schools: a national study. American Journal of Preventive Medicine 51(3): e57–e66.
30. Morrison C, Ponicki WR, Smith K. 2015. Social disadvantage and exposure to lower priced alcohol in off-premise outlets. Drug and Alcohol Review 34(4): 375–8. DOI: 10.1111/dar.12256 (accessed 30 October 2021).
31. Vandevijvere S, Mackay S, D’Souza E, et al. 2019. The first INFORMAS national food environments and policies survey in New Zealand: a blueprint country profile for measuring progress on creating healthy food environments. Obesity Reviews 20: 141–60.
32. Raerino K, Macmillan AK, Jones RG. 2013. Indigenous Māori perspectives on urban transport patterns linked to health and wellbeing. Health & Place 23: 54–62.
33. Wilson N, Morenga LT, Mackay S, et al. 2020. Food taxes and subsidies to protect health: relevance to Aotearoa New Zealand. New Zealand Medical Journal 133(1511): 71–85.

84 Pūrongo Ārai Mate Pukupuku | Cancer Prevention Report
34. Teng AM, Atkinson J, Disney G, et al. 2016. Ethnic inequalities in cancer incidence and mortality: census-linked cohort studies with 87 million years of person-time follow-up. BMC Cancer 16(1): 755. DOI: 10.1186%2Fs12885-016-2781-4 (accessed 30 October 2021).
35. WHO. 2007. Cancer Control: Knowledge into Action: WHO Guide for Effective Programmes: Module 2: Prevention. Geneva: World Health Organization.
36. Vos T, Carter R, Barendregt J, et al. 2010. Assessing Cost-Effectiveness in Prevention (ACE–Prevention): Final Report. Brisbane and Melbourne: University of Queensland and Deakin University. URL: https://public-health.uq.edu.au/files/571/ACE-Prevention_final_report.pdf (accessed 30 October 2021).
37. Wilson N, Grout L, Summers J, et al. 2021. Should prioritising health interventions be informed by modelling studies? The case of cancer control in Aotearoa New Zealand. New Zealand Medical Journal 134(1531): 101–13.
38. Te Aho o Te Kahu. 2021. He Pūrongo Mate Pukupuku o Aotearoa 2020: The State of Cancer in New Zealand 2020. Wellington: Te Aho o Te Kahu | Cancer Control Agency. URL: https://teaho.govt.nz/reports/cancer-state (accessed 30 October 2021).
39. Global Cancer Observatory. nd. Cancer Tomorrow. URL: https://gco.iarc.fr/tomorrow/en (accessed 25 October 2021).
40. Whiteman DC, Webb PM, Green AC, et al. 2015. Cancers in Australia in 2010 attributable to modifiable factors: summary and conclusions. Australian and New Zealand Journal of Public Health 39(5): 477–84. DOI: 10.1111/1753-6405.12471 (accessed 30 October 2021).
41. IHME. 2019. GBD Results Tool –For all ages and sexes; risk factor mortality for all cancer (neoplasms), New Zealand. Institute for Health Metrics and Evaluation. URL: http://ghdx.healthdata.org/gbd-results-tool?params=gbd-api-2019-permalink/2bf916c6c5fc6390404cc2bedf64add9 (accessed 24 October 2021).
42. IHME. 2019. GBD Results Tool – For all ages and sexes; tobacco-attributable mortality for esophageal, laryngeal and oral cancer. Institute for Health Metrics and Evaluation. URL: http://ghdx.healthdata.org/gbd-results-tool?params=gbd-api-2019-permalink/ba7e36a69e3c24ab21c8938845d6eecf (accessed 24 October 2021).
43. Wilson N, Blakely T, Tobias M. 2006. What potential has tobacco control for reducing health inequalities? The New Zealand situation. International Journal for Equity in Health 5(1): 14. DOI: 10.1186/1475-9276-5-14 (accessed 25 October 2021).
44. Shaw C, Blakely T, Sarfati D, et al. 2005. Varying evolution of the New Zealand lung cancer epidemic by ethnicity and socioeconomic position (1981–1999). New Zealand Medical Journal 118(1213): U1411.
45. Wild C, Weiderpass E, Stewart B (eds). 2020. World Cancer Report: Cancer research for cancer prevention. Lyon: International Agency for Research on Cancer. URL: http://publications.iarc.fr/586 (accessed 25 October 2021).
46. Te Hiringa Hauora | Health Promotion Agency. 2020. Overview of key tobacco control trends. Tobacco Control Data Repository. Wellington: Te Hiringa Hauora | Health Promotion Agency. URL: https://tcdata.org.nz/TobaccoSectorOverview.html (accessed 30 October 2021).
47. Ministry of Health. 2020. Tier 1 Statistics 2019/20: New Zealand Health Survey. URL: https://www.health.govt.nz/publication/tier-1-statistics-2019-20-new-zealand-health-survey (accessed 29 October 2021).
48. Edwards R, Hoek J, Wilson N, et al. 2020. What does the 2019/20 NZ Health Survey tell us about progress towards a Smokefree Aotearoa? Public Health Expert 14 December. URL: https://blogs.otago.ac.nz/pubhealthexpert/what-does-the-2019-20-nz-health-survey-tell-us-about-progress-towards-a-smokefree-aotearoa/ (accessed 26 October 2021).
49. Ministry of Health. 2020. Annual Data Explorer 2019/20: New Zealand Health Survey [Data File]. URL: https://minhealthnz.shinyapps.io/nz-health-survey-2019-20-annual-data-explorer/ (accessed 26 October 2021).

85Pūrongo Ārai Mate Pukupuku | Cancer Prevention Report
50. Te Hiringa Hauora | Health Promotion Agency. nd. Tobacco Control Data Repository. URL: https://tcdata.org.nz/Misc%20data/Misc_01.html (accessed 25 October 2021).
51. ASPIRE2025. 2021. ASPIRE2025: Research for a tobacco-free Aotearoa. URL: https://aspire2025.org.nz/ (accessed 25 October 2021).
52. WHO. 2003. WHO Framework Convention on Tobacco Control. Geneva: World Health Organization.
53. Ministry of Health. 2021. Smokefree Aotearoa 2025 Action Plan - Auahi Kore Aotearoa Mahere Rautaki 2025. Wellington: Ministry of Health.
54. Finan LJ, Lipperman-Kreda S, Abadi M, et al. 2019. Tobacco outlet density and adolescents’ cigarette smoking: a meta-analysis. Tobacco Control 28(1): 27–33.
55. Marsh L, Vaneckova P, Robertson L, et al. 2021. Association between density and proximity of tobacco retail outlets with smoking: a systematic review of youth studies. Health Place 67: 102275. DOI: 10.1016/j.healthplace.2019.102275 (accessed 29 October 2021).
56. Marsh L, Ajmal A, McGee R, et al. 2016. Tobacco retail outlet density and risk of youth smoking in New Zealand. Tobacco Control 25(e2): e71–e74.
57. Greenhalgh E, Parnell S. 2021. Tobacco retailer density. In EM Greenhalgh, MM Scollo and MH Winstanley (eds) Tobacco in Australia: Facts and issues. Melbourne: Cancer Council Victoria. URL: https://www.tobaccoinaustralia.org.au/chapter-11-advertising/11-9-retail-promotion-and-access#x11.9.6 (accessed 29 October 2021).
58. Pearce J, Rind E, Shortt N, et al. 2015. Tobacco retail environments and social inequalities in individual-level smoking and cessation among Scottish adults. Nicotine & Tobacco Research; 18(2): 138-46.
59. Marsh L, Doscher C, Robertson LA. 2013. Characteristics of tobacco retailers in New Zealand. Health & Place 23: 165–70.
60. Shortt NK, Tisch C, Pearce J, et al. 2015. A cross-sectional analysis of the relationship between tobacco and alcohol outlet density and neighbourhood deprivation. BMC Public Health 15(1): 1–9.
61. Bowden JA, Dono J, John DL, et al. 2014. What happens when the price of a tobacco retailer licence increases? Tobacco Control 23(2): 178–80.
62. Lawman HG, Henry KA, Scheeres A, et al. 2020. Tobacco retail licensing and density 3 years after license regulations in Philadelphia, Pennsylvania (2012–2019). American Journal of Public Health 110(4): 547–53.
63. Pearson AL, van der Deen FS, Wilson N, et al. 2015. Theoretical impacts of a range of major tobacco retail outlet reduction interventions: modelling results in a country with a smoke-free nation goal. Tobacco Control 24(e1): e32–e38.
64. Pearson AL, Cleghorn CL, van der Deen FS, et al. 2017. Tobacco retail outlet restrictions: health and cost impacts from multistate life-table modelling in a national population. Tobacco Control 26(5): 579–85.
65. Robertson L, Marsh L. 2019. Estimating the effect of a potential policy to restrict tobacco retail availability in New Zealand. Tobacco Control 28(4): 466–8.
66. van der Deen FS, Wilson N, Cleghorn CL, et al. 2018. Impact of five tobacco endgame strategies on future smoking prevalence, population health and health system costs: two modelling studies to inform the tobacco endgame. Tobacco Control 27(3): 278–86.
67. Robertson L, Marsh L, Edwards R, et al. 2016. Regulating tobacco retail in New Zealand: what can we learn from overseas? New Zealand Medical Journal 129(1432): 74–9.
68. van Lier B, de Kanter W. 2020. Netherlands: Move to phase out tobacco sales in supermarkets and petrol stations. Tobacco Control 29(247). URL: https://tobaccocontrol.bmj.com/content/29/3/247 (accessed 24 October 2021).
69. Glasser A, Roberts M. 2021. Retailer density reduction approaches to tobacco control: a review. Health & Place 67:102342.

86 Pūrongo Ārai Mate Pukupuku | Cancer Prevention Report
70. Benowitz NL. 2010. Nicotine addiction. New England Journal of Medicine 362(24): 2295–303.
71. Edwards R, Wilson N, Hoek J, et al. 2021. Five strategic approaches to achieving the Smokefree Aotearoa 2025 goal. Public Health Expert 28 January. URL: https://blogs.otago.ac.nz/pubhealthexpert/five-strategic-approaches-to-achieving-the-smokefree-aotearoa-2025-goal/ (accessed 25 October 2021).
72. Apelberg BJ, Feirman SP, Salazar E, et al. 2018. Potential public health effects of reducing nicotine levels in cigarettes in the United States. New England Journal of Medicine 378(18): 1725–33.
73. Harris B. 2011. The intractable cigarette ‘filter problem’. Tobacco Control 20(Suppl 1): i10. DOI: 10.1136/tc.2010.040113 (accessed 29 October 2021).
74. Hoek J, Gendall P, Eckert C, et al. 2019. Young adult susceptible non-smokers’ and smokers’ responses to capsule cigarettes. Tobacco Control 28(5): 498. DOI: 10.1136/tobaccocontrol-2018-054470 (accessed 29 October 2021).
75. Hoek J, Gendall P, Novotny T, et al. 2021. The case for banning cigarette filters: addressing a consumer fraud, smoking decoy and environmental hazard. Public Health Expert 21 October. URL: https://blogs.otago.ac.nz/pubhealthexpert/the-case-for-banning-cigarette-filters-addressing-a-consumer-fraud-smoking-decoy-and-environmental-hazard/ (accessed 26 October 2021).
76. Berman ML, Glasser AM. 2019. Nicotine reduction in cigarettes: literature review and gap analysis. Nicotine & Tobacco Research 21(Suppl 1): S133–S144.
77. Donny EC, Walker N, Hatsukami D, et al. 2017. Reducing the nicotine content of combusted tobacco products sold in New Zealand. Tobacco Control 26(e1): e37–e42.
78. Edwards R, Hoek J, Wilson N, et al. 2021. Reducing nicotine in smoked tobacco products: A pivotal feature of the proposals for achieving Smokefree Aotearoa 2025. Public Health Expert 30 April. URL: https://blogs.otago.ac.nz/pubhealthexpert/reducing-nicotine-in-smoked-tobacco-products-a-pivotal-feature-of-the-proposals-for-achieving-smokefree-aotearoa-2025/ (accessed 25 October 2021).
79. McKiernan A, Stanley J, Waa AM, et al. 2019. Beliefs among adult smokers and quitters about nicotine and de-nicotinized cigarettes in the 2016-17 ITC New Zealand Survey. Tobacco Regulatory Science 5(5): 400–9.
80. Food and Drug Administration. 2018. Tobacco Product Standard for Nicotine Level of Combusted Cigarettes. URL: https://www.federalregister.gov/documents/2018/03/16/2018-05345/tobacco-product-standard-for-nicotine-level-of-combusted-cigarettes (accessed 29 October 2021).
81. Edwards R, Carter K, Peace J, et al. 2013. An examination of smoking initiation rates by age: results from a large longitudinal study in New Zealand. Australian and New Zealand Journal of Public Health 37(6): 516–9.
82. Terry-McElrath YM, O’Malley PM. 2015. Trends and timing of cigarette smoking uptake among US young adults: survival analysis using annual national cohorts from 1976 to 2005. Addiction 110(7): 1171–81.
83. Heris CL, Chamberlain C, Gubhaju L, et al. 2020. Factors influencing smoking among indigenous adolescents aged 10–24 years living in Australia, New Zealand, Canada, and the United States: a systematic review. Nicotine & Tobacco Research 22(11): 1946–56.
84. Edwards R. 2020. Has the time come to focus on (young adult) smoking uptake prevention? Nicotine & Tobacco Research. 22(7): 1061–2.
85. Ball J, Berrick J, Edwards R, et al. 2021. Phasing out smoking: the Tobacco-Free Generation policy. Public Health Expert 31 August. URL: https://blogs.otago.ac.nz/pubhealthexpert/phasing-out-smoking-the-tobacco-free-generation-policy/ (accessed 27 October 2021).
86. WHO. nd. Philippines: Balanga City. World Health Organization. URL: https://www.who.int/ncds/publications/Balanga-Case-Study-final.pdf (accessed 26 October 2021).
87. Brillinger J, Marsh L, Hoek J. 2020. Bar atmospherics and smoking: a qualitative analysis of New Zealand young adult smokers. Nicotine & Tobacco Research 23(4): 724–31.
88. Jiang N, Ling PM. 2011. Reinforcement of smoking and drinking: tobacco marketing strategies linked with alcohol in the United States. American Journal of Public Health 101(10): 1942–54.
87Pūrongo Ārai Mate Pukupuku | Cancer Prevention Report
89. Thomson G, Wilson N. 2021. Smokefree outdoor areas: a missing part of Government’s new Smokefree 2025 proposals. Public Health Expert 22 April. URL: https://blogs.otago.ac.nz/pubhealthexpert/smokefree-outdoor-areas-a-missing-part-of-governments-new-smokefree-2025-proposals/ (accessed 30 October 2021).
90. Grace C, Smith L. 2019. Legislation to ban smoking in public spaces. In EM Greenhalgh, MM Scollo and MH Winstanley (eds) Tobacco in Australia: Facts and issues. Melbourne: Cancer Council Victoria.
91. Wyllie A. 2013. Public Support for Tobacco Control Policies in the Auckland Council region [full version]. Report prepared for Cancer Society Auckland Division. Auckland: Wyllie & Associates.
92. Auckland Council. 2021. Kaupapa Here Auahi Kore. Smokefree Policy. URL: https://www.aucklandcouncil.govt.nz/plans-projects-policies-reports-bylaws/our-policies/Pages/smokefree-policy.aspx (accessed 27 October 2021).
93. Palmerston North City Council. 2020. Auahi Kore Smokefree and Vapefree Policy. Palmerston North City Council. URL: https://www.pncc.govt.nz/council-city/official-documents/policies/auahi-kore-smokefree-and-vapefree-policy/ (accessed 30 October 2021).
94. Christchurch City Council. 2020. Smokefree and Vapefree Public Places Policy. URL: https://www.ccc.govt.nz/the-council/plans-strategies-policies-and-bylaws/policies/health-policies/smokefree-public-places-policy/ (accessed 26 October 2021).
95. Thomson G, Wilson N. 2017. Local and regional smokefree and tobacco-free action in New Zealand: highlights and directions. New Zealand Medical Journal 130(1462): 89.
96. Wellington City Council. nd. Smokefree Wellington Action Plan. ‘Kia wātea te ātea’ – me auahi kore a Pōneke. Wellington: Wellington City Council. URL: https://wellington.govt.nz/~/media/your-council/plans-policies-and-bylaws/plans-and-policies/a-to-z/smokefree-wellington-action-plan/smokefree-wellington-action-plan-web.pdf (accessed 30 October 2021).
97. Truth Initiative. 2019. While You Were Streaming: Smoking on demand. Washington, DC: Truth Initiative.
98. Eagle L, Dahl S. 2018. Product placement in old and new media: examining the evidence for concern. Journal of Business Ethics 147(3): 605–18.
99. Rath JM, Bennett M, Vallone D, et al. 2020. Content analysis of tobacco in episodic programming popular among youth and young adults. Tobacco Control 29(4): 475–9.
100. Centers for Disease Control. 2020. Smoking and tobacco use fact sheet: smoking in movies. URL: https://www.cdc.gov/tobacco/data_statistics/fact_sheets/youth_data/movies/index.htm#additional-2019-findings (accessed 26 October 2021).
101. Tynan M, Polansky JR, Driscoll D, et al. 2019. Tobacco use in top-grossing movies – United States, 2010–2018. Morbidity and Mortality Weekly Report 6843. URL: https://www.cdc.gov/mmwr/volumes/68/wr/mm6843a4.htm?s_cid=mm6843a4_w (accessed 30 October 2021).
102. Lucas N, Graham N. 2020. Susceptibility to Smoking among 14 and 15-year-olds: Results from the 2018 Youth Insights Survey. Wellington: Te Hiringa Hauora | Health Promotion Agency. URL: https://www.hpa.org.nz/research-library/research-publications/susceptibility-to-smoking-among-14-and-15-year-olds (accessed 29 October 2021).
103. Marsh L, McGee R, Robertson L, et al. 2016. Little change in tobacco imagery on New Zealand television: 10 years on. Australian and New Zealand Journal of Public Health 40(3): 218–20.
104. Chaiton M, Diemert L, Zhang B, et al. 2016. Exposure to smoking on patios and quitting: a population representative longitudinal cohort study. Tobacco Control 25(1): 83–8.
105. Ivory V, Blakely T, Richardson K, et al. 2015. Do changes in neighborhood and household levels of smoking and deprivation result in changes in individual smoking behavior? A large-scale longitudinal study of New Zealand adults. American Journal of Epidemiology 182(5): 431–440.
106. Zablocki R, Edland S, Myers M, et al. 2014. Smoking ban policies and their influence on smoking behaviors among current California smokers: a population-based study. Preventive Medicine 59: 73–8.

88 Pūrongo Ārai Mate Pukupuku | Cancer Prevention Report
107. Wilson N, Gurram N, Grout L, et al. 2021. A survey of the smokefree status of pedestrian-only spaces in 10 New Zealand local government areas. New Zealand Medical Journal. 135(1544):69–86.
108. Te Hiringa Hauora | Health Promotion Agency. 2020. Smokefree in your community. Protecting our families and breathing easy in our communities. URL: www.smokefree.org.nz/smokefree-environments/smokefree-in-your-community (accessed 30 October 2021).
109. Thornley L, Edwards R, Thomson G, et al. 2017. Evidence and Feasibility Review Summary Report. Wellington: University of Otago, ASPIRE2025, Quitline and Hāpai Te Hauora.
110. Te Hiringa Hauora | Health Promotion Agency. 2021. QuitStrong. URL: https://www.hpa.org.nz/campaign/quitstrong (accessed 30 October 2021).
111. Edwards R, Hoek J, van der Deen F. 2014. Smokefree 2025 – use of mass media in New Zealand lacks alignment with evidence and needs. Australian and New Zealand Journal of Public Health 38(4): 395–6. DOI: 10.1111/1753-6405.12246 (accessed 29 October 2021).
112. Marsh L, Cameron C, Quigg R, et al. 2016. The impact of an increase in excise tax on the retail price of tobacco in New Zealand. Tobacco Control 25(4): 458–63. DOI: 10.1136/tobaccocontrol-2015-052259 (accessed 29 October 2021).
113. Action on Smoking and Health. 2013. ASH New Zealand Tobacco Returns Analysis 2013. Action on Smoking and Health. URL: https://d3n8a8pro7vhmx.cloudfront.net/ashnz/pages/41/attachments/original/1504152901/TOBACCO-RETURNS-ANALYSIS-2013.pdf?1504152901 (accessed 26 October 2021).
114. Ministry of Health. 2021. The New Zealand Guidelines for Helping People to Stop Smoking: 2021. Wellington: Ministry of Health.
115. Nghiem N, Cleghorn CL, Leung W, et al. 2018. A national quitline service and its promotion in the mass media: modelling the health gain, health equity and cost–utility. Tobacco Control 27(4): 434–41.
116. Wilson N, Weerasekera D, Borland R, et al. 2010. Use of a national quitline and variation in use by smoker characteristics: ITC Project New Zealand. Nicotine & Tobacco Research 12(Suppl 1): S78–S84.
117. World Cancer Research Fund and American Institute for Cancer Research. 2018. Continuous Update Project Expert Report. Alcoholic drinks and the risk of cancer. URL: https://www.wcrf.org/diet-and-cancer/ (accessed 30 October 2021).
118. Global Cancer Observatory. 2020. Cancers attributable to alcohol. URL: https://gco.iarc.fr/causes/alcohol/home (accessed 26 October 2021).
119. IHME. 2019. GBD Results Tool – For all ages and sexes; alcohol-attributable mortality for all cancer (neoplasms). Institute for Health Metrics and Evaluation. URL: http://ghdx.healthdata.org/gbd-results-tool?params=gbd-api-2019-permalink/b16c0de6ade500aab013457335003363 (accessed 1 November 2021).
120. Rehm J, Shield KD. 2021. Alcohol use and cancer in the European Union. European Addiction Research 27(1): 1–8.
121. Health Promotion Agency. 2013. Cancer & alcohol. AlcoholNZ 3(1): 18–21. URL: https://www.hpa.org.nz/sites/default/files/documents/AlcoholNZ_June_2013_LR_spreads.pdf (accessed 29 October 2021).
122. Connor J, Kydd R, Maclennan B, et al. 2017. Alcohol-attributable cancer deaths under 80 years of age in New Zealand. Drug and Alcohol Review 36(3): 415–23.
123. Nielsen. 2021. Alcohol Use in New Zealand Survey (AUiNZ) 2019/20: High-level results. Wellington: Te Hiringa Hauora | Health Promotion Agency.
124. WHO. nd. The Global Health Observatory: Alcohol, total per capita (15+) consumption (in litres of pure alcohol) (SDG Indicator 3.5.2). World Health Organization. URL: https://www.who.int/data/gho/data/indicators/indicator-details/GHO/total-(recorded-unrecorded)-alcohol-per-capita-(15-)-consumption (accessed 26 October 2021).

89Pūrongo Ārai Mate Pukupuku | Cancer Prevention Report
125. Stats NZ. 2020. Alcohol available for consumption: Year ended December 2019. URL: https://www.stats.govt.nz/information-releases/alcohol-available-for-consumption-year-ended-december-2019#:~:text=up%201.7%20percent-,The%20total%20volume%20of%20alcoholic%20beverages%20availa-ble%20for%20consumption%20rose,percent%20to%20298%20million%20litres (accessed 28 October 2021).
126. Te Hiringa Hauora | Health Promotion Agency. 2016. The Straight Up Guide to Standard Drinks. Wellington: Te Hiringa Hauora | Health Promotion Agency.
127. Stats NZ. 2021. Alcohol available for consumption: Year ended December 2020. URL: https://www.stats.govt.nz/information-releases/alcohol-available-for-consumption-year-ended-december-2020 (accessed 30 October 2021).
128. Te Hiringa Hauora | Health Promotion Agency. nd. Low-risk alcohol drinking advice. URL: https://www.alcohol.org.nz/help-advice/advice-on-alcohol/low-risk-alcohol-drinking-advice (accessed 30 October 2021).
129. Te Hiringa Hauora | Health Promotion Agency. nd. Kupe Data Explorer. Alcohol. Te Hiringa Hauora/Health Promotion Agency. URL: https://kupe.hpa.org.nz/#!/alcohol (accessed 30 October 2021).
130. Law Commission. 2010. Alcohol in Our Lives: Curbing the Harm. A report on the review of the regulaory framework for the sale and supply of liquor. Wellington: Law Commission. URL: https://www.lawcom.govt.nz/sites/default/files/projectAvailableFormats/NZLC%20R114.pdf (accessed 29 October 2021).
131. Ministerial Forum on Alcohol Advertising and Sponsorship. 2014. Ministerial Forum on Alcohol Advertising and Sponsorship: Recommendations on alcohol advertising and sponsorship. Wellington: Ministry of Health. URL: https://www.health.govt.nz/publication/ministerial-forum-alcohol-advertising (accessed 29 October 2021).
132. Government Inquiry into Mental Health and Addiction. 2018. He Ara Oranga: Report of the Government Inquiry into Mental Health and Addiction. Wellington: Government Inquiry into Mental Health and Addiction.
133. Alcohol Healthwatch. 2020. Evidence-based Alcohol Policies: Building a fairer and healthier future for Aotearoa New Zealand. Auckland: Alcohol Healthwatch. URL: https://www.ahw.org.nz/Portals/5/Resources/Briefing%20papers/2021/Evidence-based%20alcohol%20policies-Alcohol%20Healthwatch%20Nov%202020.pdf (accessed 1 November 2021).
134. WHO. nd. The SAFER initiative: a world free from alcohol related harm. World Health Organization. URL: https://www.who.int/initiatives/SAFER (accessed 26 October 2021).
135. Chamberlain N. 2021. DHB Position Statement on the Sale and Supply of Alcohol Act.
136. M.E Consulting. 2018. New Zealand Alcohol Supply and Demand Structures: Research report. Wellington: Te Hiringa Hauora | Health Promotion Agency.
137. Te Hiringa Hauora | Health Promotion Agency. 2018. Trends in Affordability of Alcohol in New Zealand. Wellington: Te Hiringa Hauora | Health Promotion Agency.
138. Wall M, Casswell S, Yeh LC. 2017. Purchases by heavier drinking young people concentrated in lower priced beverages: implications for policy. Drug and Alcohol Review 36(3): 352–8.
139. Casswell S, Huckle T, Wall M, et al. 2014. International alcohol control study: pricing data and hours of purchase predict heavier drinking. Alcoholism: Clinical and experimental research 38(5), 1425–31.
140. Hay GC, Whigham PA, Kypri K, et al. 2009. Neighbourhood deprivation and access to alcohol outlets: a national study. Health & Place 15(4): 1086–93. DOI: 10.1016/j.healthplace.2009.05.008 (accessed 29 October 2021).
141. National Research Bureau. 2012. The Alcohol Purchasing Patterns of Heavy Drinkers in NZ. Wellington: Ministry of Health.
142. Chisholm D, Moro D, Bertram M, et al. 2018. Are the ‘best buys’ for alcohol control still valid? An update on the comparative cost-effectiveness of alcohol control strategies at the global level. Journal of Studies on Alcohol and Drugs 79(4): 514–22.

90 Pūrongo Ārai Mate Pukupuku | Cancer Prevention Report
143. Martineau F, Tyner E, Lorenc T, et al. 2013. Population-level interventions to reduce alcohol-related harm: an overview of systematic reviews. Preventive Medicine 57(4): 278–96.
144. Wagenaar A, Salois M, Komro K. 2009. Effects of beverage alcohol price and tax levels on drinking: a meta-analysis of 1003 estimates from 112 studies. Addiction 104(2): 179–90.
145. Burton R, Henn C, Lavoie D, et al. 2017. A rapid evidence review of the effectiveness and cost-effectiveness of alcohol control policies: an English perspective. The Lancet 389(10078): 1558–80.
146. WHO. 2017. Tackling NCDs: ‘Best buys’ and other recommended interventions for the prevention and control of noncommunicable diseases. Geneva: World Health Organization. URL: https://apps.who.int/iris/bitstream/handle/10665/259232/WHO-NMH-NVI-17.9-eng.pdf?sequence=1&isAllowed=y (accessed 30 October 2021).
147. Jackson N, U E, Admans J. 2020. A Road Map for Alcohol Pricing Policies: Creating a fairer and healthier Aotearoa New Zealand. Auckland: Alcohol Healthwatch. URL: https://www.ahw.org.nz/Portals/5/Resources/Documents-other/2020/Road_map_for_alcohol_pricing_policies-Final_version_Aug_6_2020.pdf (accessed 29 October 2021).
148. Ngo AP, Wang X, Slater S, et al. 2021. Alcohol excise taxes as a percentage of retail alcohol prices in 26 OECD countries. Drug and Alcohol Dependence 219: 108415. DOI: 10.1016/j.drugalcdep.2020.108415 (accessed 30 October 2021).
149. Alcohol Healthwatch. 2019. UMR public opinion poll: support for alcohol policies. Auckland: Alcohol Healthwatch.
150. O’Donnell A, Anderson P, Jané-Llopis E, et al. 2019. Immediate impact of minimum unit pricing on alcohol purchases in Scotland: controlled interrupted time series analysis for 2015-18. BMJ 366: l5274.
151. Stockwell T, Auld MC, Zhao J, et al. 2012. Does minimum pricing reduce alcohol consumption? The experience of a Canadian province. Addiction 107(5): 912–20.
152. Jiang H, Livingston M, Room R, et al. 2020. Modelling the effects of alcohol pricing policies on alcohol consumption in subpopulations in Australia. Addiction 115(6): 1038–49.
153. Anderson P, O’Donnell A, Kaner E, et al. 2021. Impact of minimum unit pricing on alcohol purchases in Scotland and Wales: controlled interrupted time series analyses. The Lancet Public Health; 6(8): e557-e65.
154. Coomber K, Miller PG, Taylor N, et al. 2020. Investigating the introduction of the alcohol minimum unit price in the Northern Territory. Summary report. Deakin University, Geelong Australia. Prepared for Northern Territory Department of Health.
155. Alcohol Healthwatch. 2021. Cheap Drinks: An exploratory audit of alcohol prices at off-licences across Tāmaki Makaurau / Auckland. Auckland: Alcohol Healthwatch.
156. Foster S, Trapp G, Hooper P, et al. 2017. Liquor landscapes: does access to alcohol outlets influence alcohol consumption in young adults? Health & Place 45: 17–23.
157. Connor JL, Kypri K, Bell ML, et al. 2011. Alcohol outlet density, levels of drinking and alcohol-related harm in New Zealand: a national study. Journal of Epidemiology and Community Health 65(10): 841–6.
158. Cameron MP, Cochrane W, Livingston M. 2019. The Relationship Between Alcohol Outlets and Harm. A spatial panel analysis for New Zealand, 2007–2014. Wellington: Health Promotion Agency. URL: http://www.hpa.org.nz/research-library (accessed 28 October 2021).
159. Carpenter C, Dobkin C. 2011. The minimum legal drinking age and public health. Journal of Economic Perspectives 25(2): 133–56.
160. Plunk AD, Cavazaos-Rehg P, Bierut LJ, et al. 2013. The persistent effects of minimum legal drinking age laws on drinking patterns later in life. Alcoholism: Clinical and Experimental Research 37(3): 463–9.
161. Towers A, Sheridan J, Newcombe D, et al. 2018. New Zealanders’ alcohol consumption patterns across the lifespan. Te Hiringa Hauora | Health Promotion Agency. URL: https://www.hpa.org.nz/sites/default/files/New%20Zealanders%20alcohol%20consumption%20across%20the%20lifespan%20September%202018.pdf (accessed 30 October 2021).

91Pūrongo Ārai Mate Pukupuku | Cancer Prevention Report
162. Liang W, Chikritzhs T. 2015. Age at first use of alcohol predicts the risk of heavy alcohol use in early adulthood: a longitudinal study in the United States. International Journal of Drug Policy 26(2): 131–4.
163. Jackson N, Robertson H. 2017. Review of Territorial Authority Progress towards Local Alcohol Policy Development (2nd edition). Auckland: Alcohol Healthwatch. URL: http://www.ahw.org.nz/Portals/5/Resources/Documents-other/2017/LAPReport_2017_WEB_amended%2020_3_18.pdf (accessed 26 October 2021).
164. Ayuka F, Barnett R, Pearce J. 2014. Neighbourhood availability of alcohol outlets and hazardous alcohol consumption in New Zealand. Health & Place 29: 186–99.
165. Bryden A, Roberts B, McKee M, et al. 2012. A systematic review of the influence on alcohol use of community level availability and marketing of alcohol. Health & Place 18(2): 349–57.
166. Campbell CA, Hahn RA, Elder R, et al. 2009. The effectiveness of limiting alcohol outlet density as a means of reducing excessive alcohol consumption and alcohol-related harms. American Journal of Preventive Medicine 37(6): 556–69.
167. Sherk A, Stockwell T, Chikritzhs T, et al. 2018. Alcohol consumption and the physical availability of take-away alcohol: systematic reviews and meta-analyses of the days and hours of sale and outlet density. Journal of Studies on Alcohol and Drugs 79(1): 58–67.
168. Wilkinson C, MacLean S, Room R. 2020. Restricting alcohol outlet density through cumulative impact provisions in planning law: challenges and opportunities for local governments. Health & Place 61: 102227. DOI: 10.1016/j.healthplace.2019.102227 (accessed 25 October 2021).
169. Furr-Holden C, Milam A, Nesoff E, et al. 2020. Using zoning as a public health tool to reduce alcohol outlet oversaturation, promote compliance, and guide future enforcement: a preliminary analysis of Transform Baltimore. Journal of Urban Health 97(4): 568–82. DOI: 10.1007/s11524-020-00453-7 (accessed 29 October 2021).
170. Aron A, Allen K. 2021. Public Attitudes on Policy Interventions to Reduce Alcohol Harm: Results from the 2019/20 Alcohol Use in New Zealand Survey (AUiNZ). Wellington: Te Hiringa Hauora | Health Promotion Agency.
171. Alcohol Regulatory and Licensing Authority. 2019. Report of the Alcohol Regulatory and Licensing Authority for the 12 months ended 30 June 2019. Alcohol Regulatory and Licensing Authority. URL: https://www.parliament.nz/resource/en-NZ/PAP_92971/d73ab2acc835b7dee35797f8eab3a1685972c4a0 (accessed 27 October 2021).
172. Randerson S, Casswell S, Huckle T. 2018. Changes in New Zealand’s alcohol environment following implementation of the Sale and Supply of Alcohol Act (2012). New Zealand Medical Journal 131(1476): 14–23.
173. Cameron M, Cochrane W, Livingston M. 2016. The Relationship Between Alcohol Outlets and Harms: A spatial panel analysis for New Zealand, 2007–2014. Wellington: Health Promotion Agency.
174. Connor J, Maclennan B, Huckle T, et al. 2021. Changes in the incidence of assault after restrictions on late-night alcohol sales in New Zealand: evaluation of a natural experiment using hospitalization and police data. Addiction 116(4): 788–98. DOI: 10.1111/add.15206 (accessed 29 October 2021).
175. Kypri K, McElduff P, Miller P. 2014. Restrictions in pub closing times and lockouts in Newcastle, Australia five years on. Drug and Alcohol Review 33(3): 323–6. DOI: 10.1111/dar.12123 (accessed 29 October 2021).
176. Te Hiringa Hauora | Health Promotion Agency. 2018. Alcohol-related Attitudes over Time: Results from the Health and Lifestyles Survey. Wellington: Te Hiringa Hauora | Health Promotion Agency.
177. Wechsler H, Nelson TF. 2010. Will Increasing Alcohol Availability By Lowering the Minimum Legal Drinking Age Decrease Drinking and Related Consequences Among Youths? American Journal of Public Health 100(6): 986-92.
178. Gruenewald P, Treno A, Ponicki W, et al. 2015. Impacts of New Zealand’s lowered minimum purchase age on context-specific drinking and related risks. Addiction 110(11): 1757–66.
92 Pūrongo Ārai Mate Pukupuku | Cancer Prevention Report
179. Jernigan D, Noel J, Landon J, et al. 2017. Alcohol marketing and youth alcohol consumption: a systematic review of longitudinal studies published since 2008. Addiction 112: 7–20.
180. Anderson P, De Bruijn A, Angus K, et al. 2009. Impact of alcohol advertising and media exposure on adolescent alcohol use: a systematic review of longitudinal studies. Alcohol and Alcoholism 44(3): 229–43.
181. Snyder LB, Milici FF, Slater M, et al. 2006. Effects of alcohol advertising exposure on drinking among youth. Archives of Pediatrics & Adolescent Medicine 160(1): 18–24.
182. Brown K. 2016. Association between alcohol sports sponsorship and consumption: a systematic review. Alcohol and Alcoholism 51(6): 747–55. DOI: 10.1093/alcalc/agw006 (accessed 28 October 2021).
183. Chambers T, Stanley J, Signal L, et al. 2018. Quantifying the nature and extent of children’s real-time exposure to alcohol marketing in their everyday lives using wearable cameras: children’s exposure via a range of media in a range of key places. Alcohol and Alcoholism 53(5): 626–33.
184. Chambers T, Pearson A, Kawachi I, et al. 2018. Children’s home and school neighbourhood exposure to alcohol marketing: using wearable camera and GPS data to directly examine the link between retailer availability and visual exposure to marketing. Health & Place 54: 102–9.
185. Noel JK, Babor TF. 2017. Does industry self-regulation protect young people from exposure to alcohol marketing? A review of compliance and complaint studies. Addiction 112: 51–6.
186. Noel JK, Babor TF, Robaina K. 2017. Industry self-regulation of alcohol marketing: a systematic review of content and exposure research. Addiction 112: 28–50.
187. WHO. 2018. Global status report on alcohol and health 2018. Geneva: World Health Organization. URL: https://apps.who.int/iris/bitstream/handle/10665/274603/9789241565639-eng.pdf (accessed 10 January 2022).
188. WHO. 2020. Alcohol marketing in the WHO European Region. Update report on the evidence and recommended policy actions. Copenhagen: World Health Organization, 2020. URL: https://apps.who.int/iris/bitstream/handle/10665/336178/WHO-EURO-2020-1266-41016-55678-eng.pdf?sequence=1&isAllowed=y (accessed 10 January 2022).
189. Advertising Standards Authority. 2020. Code for Advertising and Promotion of Alcohol. URL: http://www.asa.co.nz/wp-content/uploads/2019/10/CODE-FOR-ADVERTISING-AND-PROMOTION-OF-ALCOHOL.pdf (accessed 26 October 2021).
190. Jackson N, Cowie N, Robinson A. 2021. Ineffective, meaningless, inequitable: analysis of complaints to a voluntary alcohol advertising code. New Zealand Medical Journal 134(1530): 118–22.
191. Maynard K, Paton S. 2012. Increasing the use of alcohol screening and brief intervention in New Zealand. Kōtuitui: New Zealand Journal of Social Sciences Online 7(2): 72–82. DOI: 10.1080/1177083X.2012.725418 (accessed 29 October 2021).
192. McQueen J, Howe TE, Allan L, et al. 2011. Brief interventions for heavy alcohol users admitted to general hospital wards. Cochrane Database of Systematic Reviews (8).
193. BPAC. 2018. Assessment and management of alcohol misuse by primary care. Best Practice Advisory Centre. URL: https://bpac.org.nz/2018/alcohol.aspx#3 (accessed 27 October 2021).
194. World Cancer Research Fund and American Institute for Cancer Research. 2018. Diet, Nutrition, Physical Activity and Cancer: A global perspective. Continuous Update Project Expert Report 2018. World Cancer Research Fund International. URL: https://www.wcrf.org/sites/default/files/Summary-of-Third-Expert-Report-2018.pdf (accessed 26 October 2021).
195. IHME. 2019. Dietary risks – Level 2 risk. Institute for Health Metrics and Evaluation. URL: http://www.healthdata.org/results/gbd_summaries/2019/dietary-risks-level-2-risk (accessed 24 October 2021).
196. Meredith I, Sarfati D, Ikeda T, et al. 2012. High rates of endometrial cancer among Pacific women in New Zealand: the role of diabetes, physical inactivity, and obesity. Cancer Causes & Control 23(6): 875–85. DOI: 10.1007/s10552-012-9956-3 (accessed 29 October 2021).
93Pūrongo Ārai Mate Pukupuku | Cancer Prevention Report
197. Scott OW, Tin Tin S, Bigby SM, et al. 2019. Rapid increase in endometrial cancer incidence and ethnic differences in New Zealand. Cancer Causes & Control 30(2): 121–7. DOI: 10.1007/s10552-019-1129-1 (accessed 30 October 2021).
198. Ministry of Health. 2020. Eating and Activity Guidelines for New Zealand Adults: Updated 2020. Wellington: Ministry of Health.
199. OECD. 2021. Overweight or obese population. URL: https://data.oecd.org/healthrisk/overweight-or-obese-population.htm (accessed 30 October 2021).
200. UNICEF. 2019. The State of the World’s Children 2019. Children, Food and Nutrition: Growing well in a changing world. New York: UNICEF.
201. Hawkes C, Jewell J, Allen K. 2013. A food policy package for healthy diets and the prevention of obesity and diet-related non-communicable diseases: the NOURISHING framework. Obesity Reviews 14: 159–68.
202. Swinburn BA, Sacks G, Hall KD, et al. 2011. The global obesity pandemic: shaped by global drivers and local environments. The Lancet 378(9793): 804–14.
203. Signal L, Stanley J, Smith M, et al. 2017. Children’s everyday exposure to food marketing: an objective analysis using wearable cameras. International Journal of Behavioral Nutrition and Physical Activity 14(1): 137.
204. Signal L, personal communication, September 16, 2021.
205. Signal L, Barr M, Smith M. 2018. Evidence Snapshot. What Can be Done to Protect Our Children from Unhealthy Food Marketing? Activity and Nutrition Aotearoa and the Auckland Regional Public Health Service. URL: https://healthyaucklandtogether.org.nz/assets/Marketing-to-children/Evidence-Snapshot.pdf (accessed 27 October 2021).
206. Smith R, Kelly B, Yeatman H, et al. 2019. Food marketing influences children’s attitudes, preferences and consumption: a systematic critical review. Nutrients 11(4): 875.
207. Halford JC, Boyland EJ, Hughes GM, et al. 2008. Beyond-brand effect of television food advertisements on food choice in children: the effects of weight status. Public Health Nutrition 11(9): 897–904.
208. Halford JC, Gillespie J, Brown V, et al. 2004. Effect of television advertisements for foods on food consumption in children. Appetite 42(2): 221–5.
209. Boyland EJ, Nolan S, Kelly B, et al. 2016. Advertising as a cue to consume: a systematic review and meta-analysis of the effects of acute exposure to unhealthy food and nonalcoholic beverage advertising on intake in children and adults, 2. The American Journal of Clinical Nutrition 103(2): 519–33.
210. Kelly B, King L, Chapman K, et al. 2015. A hierarchy of unhealthy food promotion effects: identifying methodological approaches and knowledge gaps. American Journal of Public Health 105(4): e86–e95.
211. Garde A, Byrne S, Gokani N, et al. 2018. A Child Rights-based Approach to Food Marketing: A guide for policy makers. United Nations Children’s Fund (UNICEF). URL: https://www.unicef.org/csr/files/A_Child_Rights-Based_Approach_to_Food_Marketing_Report.pdf (accessed 27 October 2021).
212. Vukmirovic M. 2015. The effects of food advertising on food-related behaviours and perceptions in adults: a review. Food Research International 75: 13–9. DOI: 10.1016/j.foodres.2015.05.011 (accessed 30 October 2021).
213. Carpentier FRD, Correa T, Reyes M, et al. 2020. Evaluating the impact of Chile’s marketing regulation of unhealthy foods and beverages: preschool and adolescent children’s changes in exposure to food advertising on television. Public Health Nutrition 23(4): 747.
214. Mediano Stoltze F, Reyes M, Smith TL, et al. 2019. Prevalence of child-directed marketing on breakfast cereal packages before and after chile’s food marketing law: a pre- and post-quantitative content analysis. International Journal of Environmental Research and Public Health 16(22): 4501.
215. Sing F, Mackay S, Culpin A, et al. 2020. Food advertising to children in New Zealand: a critical review of the performance of a self-regulatory complaints system using a public health law framework. Nutrients 12(5): 1278.
94 Pūrongo Ārai Mate Pukupuku | Cancer Prevention Report
216. Kovic Y, Noel JK, Ungemack J, et al. 2018. The impact of junk food marketing regulations on food sales: an ecological study. Obesity Reviews 19(6): 761–9.
217. Mackay S, Sing F, Gerritsen S, et al. 2020. Benchmarking Food Environments 2020: Progress by the New Zealand Government on implementing recommended food environment policies & priority recommendations. Auckland: The University of Auckland.
218. Galbraith-Emami S, Lobstein T. 2013. The impact of initiatives to limit the advertising of food and beverage products to children: a systematic review. Obesity Reviews 14(12): 960–74.
219. McGill B, Sweeting J, Surkalim D, et al. 2020. New Developments in the Prevention of Obesity among Children and Young People Aged 0–18 Years: Rapid evidence review update. Sydney: Physical Activity Nutrition Obesity Research Group, The University of Sydney.
220. Department of Health and Social Care and Department for Digital, Culture, Media & Sport. 2021. Consultation Outcome: Introducing a total online advertising restriction for products high in fat, sugar and salt (HFSS). UK Government. URL: https://www.gov.uk/government/consultations/total-restriction-of-online-advertising-for-products-high-in-fat-sugar-and-salt-hfss/introducing-a-total-online-advertising-restriction-for-products-high-in-fat-sugar-and-salt-hfss#fnref:7 (accessed 27 October 2021).
221. Department of Health and Social Care and Department for Digital, Culture, Media & Sport. 2020. Press release: New public consultation on total ban of online advertising for unhealthy foods. URL: https://www.gov.uk/government/news/new-public-consultation-on-total-ban-of-online-advertising-for-unhealthy-foods (accessed 27 October 2021).
222. Advertising Standards Authority. 2019. Children and Young People’s Advertising Code. URL: https://www.asa.co.nz/codes/codes/children-and-young-people/ (accessed 26 October 2021).
223. Chapman K, Goldsbury D, Watson W, et al. 2017. Exploring perceptions and beliefs about the cost of fruit and vegetables and whether they are barriers to higher consumption. Appetite 113: 310–9.
224. Krølner R, Rasmussen M, Brug J, et al. 2011. Determinants of fruit and vegetable consumption among children and adolescents: a review of the literature. Part II: qualitative studies. International Journal of Behavioral Nutrition and Physical Activity 8(1): 1–38.
225. Rasmussen M, Krølner R, Klepp K-I, et al. 2006. Determinants of fruit and vegetable consumption among children and adolescents: a review of the literature. Part I: quantitative studies. International Journal of Behavioral Nutrition and Physical Activity 3(1): 1–19.
226. Teng A, Jones A, Mizdrak A, et al. 2019. Impact of sugar-sweetened beverage taxes on purchases and dietary intake: systematic review and meta-analysis. Obesity Reviews 20(9): 1187–204.
227. WHO. 2016. Fiscal Policies for Diet and Prevention of Noncommunicable Diseases. Geneva: World Health Organization. URL: https://apps.who.int/iris/bitstream/handle/10665/250131/9789241511247-eng.pdf;jsessionid=8D83E6DD03C1634251363798AFD9B045?sequence=1 (accessed 30 October 2021).
228. Wilson N, Morenga LT, Mackay S, et al. 2020. Food taxes and subsidies to protect health: relevance to Aotearoa New Zealand. New Zealand Medical Journal 133(1511): 71–85.
229. Niebylski ML, Redburn KA, Duhaney T, et al. 2015. Healthy food subsidies and unhealthy food taxation: a systematic review of the evidence. Nutrition 31(6): 787–95. DOI: 10.1016/j.nut.2014.12.010 (accessed 30 October 2021).
230. Afshin A, Peñalvo JL, Del Gobbo L, et al. 2017. The prospective impact of food pricing on improving dietary consumption: a systematic review and meta-analysis. PLOS One 12(3): e0172277. DOI: 10.1371/journal.pone.0172277 (accessed 26 October 2021).
231. Browne J, Lock M, Walker T, et al. 2020. Effects of food policy actions on Indigenous Peoples’ nutrition-related outcomes: a systematic review. BMJ Global Health 5(8): e002442.
232. Ni Mhurchu C, Eyles H, Genc M, et al. 2015. Effects of Health-Related Food Taxes and Subsidies on Mortality from Diet-Related Disease in New Zealand: An Econometric-Epidemiologic Modelling Study. PLOS One 10(7): e0128477.

95Pūrongo Ārai Mate Pukupuku | Cancer Prevention Report
233. Blakely T, Cleghorn C, Mizdrak A et al. 2020. The effect of food taxes and subsidies on population health and health costs: A modelling study. The Lancet Public Health 5(7): e404-e413
234. Hashem K, Feng H, MacGregor G. 2019. Labelling changes in response to a tax on sugar-sweetened beverages, United Kingdom of Great Britain and Northern Ireland. Bulletin of the World Health Organization 97(12):818-27.
235. WHO Regional Office for Europe. 2015. Public health product tax in Hungary: An example of successful intersectoral action using a fiscal tool to promote healthier food choices and raise revenues for public health. World Health Organization Regional Office for Europe. URL: https://www.euro.who.int/__data/assets/pdf_file/0004/287095/Good-practice-brief-public-health-product-tax-in-hungary.pdf (accessed 27 October 2021).
236. Batis C, Rivera JA, Popkin BM, et al. 2016. First-year evaluation of Mexico’s tax on nonessential energy-dense foods: an observational study. PLOS Medicine 13(7): e1002057. DOI: 10.1371/journal.pmed.1002057 (accessed 27 October 2021).
237. Obesity Evidence Hub. 2021. Prevention: Tax and Pricing: Countries that have taxes on sugar-sweetened beverages (SSBs). URL: https://www.obesityevidencehub.org.au/collections/prevention/countries-that-have-implemented-taxes-on-sugar-sweetened-beverages-ssbs (accessed 30 October 2021).
238. Watts C. 2018. External Evaluation of Fruit in Schools Final Report. Prepared for 5+ A Day Charitable Trust. 5+ A Day Charitable Trust. URL: www.5aday.co.nz/media/213674/final-fruit-vegetables-in-schools-research-report-august-2018.pdf (accessed 30 October 2021).
239. Vandevijvere S, Sushil Z, Exeter DJ, et al. 2016. Obesogenic retail food environments around New Zealand schools: a national study. American Journal of Preventive Medicine 51(3): e57–e66.
240. Hobbs M, Mackenbach JD, Marek L, et al. 2020. Investigating change in the food environment over 10 years in urban New Zealand: a longitudinal and nationwide geospatial study. Social Science & Medicine 113522.
241. Hollands GJ, Carter P, Anwer S, et al. 2019. Altering the availability or proximity of food, alcohol, and tobacco products to change their selection and consumption. Cochrane Database of Systematic Reviews (9).
242. Micha R, Karageorgou D, Bakogianni I, et al. 2018. Effectiveness of school food environment policies on children’s dietary behaviors: a systematic review and meta-analysis. PLOS One 13(3): e0194555.
243. DSouza E. 2017. School-FERST: Preliminary results for schools. Auckland: The University of Auckland. URL: https://figshare.com/articles/journal_contribution/School-FERST_-_Preliminary_results_for_primary_schools/5673469 (accessed 27 October 2021).
244. Ministry of Education. 2019. Healthy Active Learning. URL: https://www.education.govt.nz/our-work/changes-in-education/healthy-active-learning/ (accessed 29 October 2021).
245. Institute of Medicine and National Research Council. 2009. Local Government Actions to Prevent Childhood Obesity. Washington, DC: National Academies Press.
246. Massey University Evaluation Team. 2018. Summative Evaluation Report: Healthy Families NZ. Wellington: Ministry of Health.
247. Healthy Auckland Together. 2017. The Healthy Auckland Together Plan 2015–2020. URL: https://www.healthyaucklandtogether.org.nz/assets/Uploads/HAT-actionplan.pdf (accessed 29 October 2021).
248. Mackay S, Ni Mhurchu C, Swinburn B, et al. 2019. State of the Food Supply: New Zealand 2019 Auckland: The University of Auckland. URL: https://www.nzdoctor.co.nz/sites/default/files/2019-08/State%20of%20the%20Food%20Supply%202019%20report.pdf (accessed 29 October 2021).
249. Afshin A, Sur PJ, Fay KA, et al. 2019. Health effects of dietary risks in 195 countries, 1990–2017: a systematic analysis for the Global Burden of Disease Study 2017. The Lancet 393(10184): 1958–72.
250. Fangupo L, Haszard J, Taylor B, et al. 2021. Ultra-processed food intake and associations with demographic factors in young New Zealand children. Journal of the Academy of Nutrition and Dietetics 121(2): 305–13. DOI: 10.1016/j.jand.2020.08.088 (accessed 29 October 2021).

96 Pūrongo Ārai Mate Pukupuku | Cancer Prevention Report
251. WHO Regional Office for Europe. 2020. Improving Dietary Intake and Achieving Food Improvement. Copenhagen: WHO Regional Office for Europe.
252. FAO, IFAD, UNICEF, WFP and WHO. 2020. The State of Food Security and Nutrition in the World (SOFI). Rome: Food and Agriculture Organization.
253. Gressier M, Sassi F, Frost G. 2021. Contribution of reformulation, product renewal, and changes in consumer behavior to the reduction of salt intakes in the UK population between 2008/2009 and 2016/2017. The American Journal of Clinical Nutrition 114 (3): 1092–1099.
254. Webster J, Trieu K, Dunford E, et al. 2014. Target salt 2025: a global overview of national programs to encourage the food industry to reduce salt in foods. Nutrients 6(8): 3274–87. DOI: 10.3390/nu6083274 (accessed 30 October 2021).
255. Campbell N, Legowski B, Legetic B, et al. 2014. Targets and timelines for reducing salt in processed food in the Americas. Journal of Clinical Hypertension 16(9): 619–23. DOI: 10.1111/jch.12379 (accessed 29 October 2021).
256. Charlton K, Webster J, Kowal P. 2014. To legislate or not to legislate? A comparison of the UK and South African approaches to the development and implementation of salt reduction programs. Nutrients 6(9): 3672–95. DOI: 10.3390/nu6093672 (accessed 26 October 2021).
257. UK Parliament Post. 2021. Food and drink reformulation to reduce fat, sugar and salt. Postnote 638. URL: https://researchbriefings.files.parliament.uk/documents/POST-PN-0638/POST-PN-0638.pdf (accessed 30 October 2021).
258. Mackay S, Eyles H, Gontijo de Castro T, et al. 2021. Which companies dominate the packaged food supply of New Zealand and how healthy are their products? PLOS One 16(1): e0245225. URL: https://www.ncbi.nlm.nih.gov/pmc/articles/PMC7837499/pdf/pone.0245225.pdf (accessed 29 October 2021).
259. van der Bend D L, Jansen L, van der Velde G, et al. 2020. The influence of a front-of-pack nutrition label on product reformulation: a ten-year evaluation of the Dutch Choices programme. Food Chemistry: X 6: 100086.
260. Ni Mhurchu C, Eyles H, Choi Y-H. 2017. Effects of a voluntary front-of-pack nutrition labelling system on packaged food reformulation: the health star rating system in New Zealand. Nutrients 9(8): 918.
261. FAO. 2002. The State of Food Insecurity in the World 2001. Rome: Food and Agriculture Organization.
262. Ministry of Health. 2019. Household Food Insecurity Among Children inNew Zealand. Wellington: Ministry of Health.
263. Bowden M. 2020. Understanding Food Insecurity in Australia. Melbourne: Australian Institute of Family Studies.
264. McKerchar C, Lacey C, Abel G, et al. 2021. Ensuring the right to food for indigenous children: a case study of stakeholder perspectives on policy options to ensure the rights of tamariki Māori to healthy food. International Journal for Equity in Health 20(1): 1–13.
265. World Cancer Research Fund and American Institute for Cancer Research. 2018a. Continuous Update Project Expert Report 2018. Physical Activity and the risk of cancer. URL: https://www.wcrf.org/sites/default/files/Physical-activity.pdf (accessed 26 October 2021).
266. Sport New Zealand. 2019. Spotlight on Deprivation. Key Findings. Wellington: Sport New Zealand. URL: https://sportnz.org.nz/media/1294/spotlight-on-deprivation-key-findings2.pdf (accessed 30 October 2021).
267. Ministry of Health. 2013. Guidelines on Physical Activity for Older People (aged 65 years and over). Wellington: Ministry of Health.
268. Ministry of Health. 2017. Sit Less, Move More, Sleep Well: Active play guidelines for under-fives. Wellington: Ministry of Health.
269. Sport New Zealand. 2020. Active NZ 2019 Participation Report. Wellington: Sport New Zealand. URL: https://sportnz.org.nz/media/3639/active-nz-year-3-main-report-final.pdf (accessed 30 October 2021).

97Pūrongo Ārai Mate Pukupuku | Cancer Prevention Report
270. Mizdrak A. 2019. Determinants of Physical Activity in Young People: A report on the Active Young People NZ Survey. URL: https://sportnz.org.nz/media/1289/determinants-of-physical-activity-in-young-people.pdf (accessed 29 October 2021).
271. Straker L, Coenen P, Dunstan D, et al. 2016. Sedentary Work – Evidence on an Emergent Work Health and Safety Issue – Final Report. Canberra: Safe Work Australia. URL: https://www.safeworkaustralia.gov.au/system/files/documents/1702/literature-review-of-the-hazards-of-sedentary-work.pdf (accessed 30 October 2021).
272. OECD. 2021. 21st-Century Readers: Developing literacy skills in a digital world. Paris: OECD Publishing. DOI: 10.1787/a83d84cb-en (accessed 30 October 2021).
273. WHO. 2018. Global Action Plan on Physical Activity 2018–2030: More active people for a healthier world. Geneva: World Health Organization. URL: https://apps.who.int/iris/bitstream/handle/10665/272722/9789241514187-eng.pdf?ua=1 (accessed 30 October 2021).
274. ISPAH. 2020. ISPAH’s Eight Investments that Work for Physical Activity. International Society for Physical Activity and Health. URL: https://www.ispah.org/wp-content/uploads/2020/11/English-Eight-Investments-That-Work-FINAL.pdf (accessed 23 October 2021).
275. Reece L, Foley BC, Bauman AE, et al. 2017. Towards Best Practice in Promoting Participation in Physical Activity, Sport and Active Recreation: A rapid evidence review. Sydney: SPRINTER Research Group, The University of Sydney. URL: https://www.sport.nsw.gov.au/sites/default/files/2021-04/towards_best_practice_kd9_final.pdf (accessed 30 October 2021).
276. Quigley and Watts Ltd. 2014. Evidence Snapshot. Promoting Physical Activity at the Local Government Level: Literature review. Agencies for Nutrition Action. URL: https://ana.org.nz/wp-content/uploads/2016/10/Literature-Review-Local-Govt-and-Physical-Activity-Final.pdf (27 October 2021).
277. Devarajan R, Prabhakaran D, Goenka S. 2020. Built environment for physical activity: an urban barometer, surveillance, and monitoring. Obesity Reviews 21(1): e12938.
278. Giles-Corti B, Vernez-Moudon A, Reis R, et al. 2016. City planning and population health: a global challenge. The Lancet 388(10062): 2912–24.
279. Kärmeniemi M, Lankila T, Ikäheimo T, et al. 2018. The built environment as a determinant of physical activity: a systematic review of longitudinal studies and natural experiments. Annals of Behavioral Medicine 52(3): 239–51.
280. Sivam A, Karuppannan S, Koohsari MJ, et al. 2012. Does urban design influence physical activity in the reduction of obesity? A review of evidence. Open Urban Studies Journal 5: 14–21.
281. Shaw C, Russell M, Keall M, et al. 2020. Beyond the bicycle: seeing the context of the gender gap in cycling. Journal of Transport & Health 18: 100871.
282. Smith M, Hosking J, Woodward A, et al. 2017. Systematic literature review of built environment effects on physical activity and active transport – an update and new findings on health equity. International Journal of Behavioral Nutrition and Physical Activity 14(1): 1–27.
283. Mizdrak A, Blakely T, Cleghorn CL, et al. 2019. Potential of active transport to improve health, reduce healthcare costs, and reduce greenhouse gas emissions: a modelling study. PLOS One 14(7): e0219316.
284. Zapata-Diomedi B, Boulangé C, Giles-Corti B, et al. 2019. Physical activity-related health and economic benefits of building walkable neighbourhoods: a modelled comparison between brownfield and greenfield developments. International Journal of Behavioral Nutrition and Physical Activity 16(1): 1–12.
285. Zapata-Diomedi B, Herrera AMM, Veerman JL. 2016. The effects of built environment attributes on physical activity-related health and health care costs outcomes in Australia. Health & Place 42 19–29.
286. Veerman JL, Zapata-Diomedi B, Gunn L, et al. 2016. Cost-effectiveness of investing in sidewalks as a means of increasing physical activity: a RESIDE modelling study. BMJ Open 6(9): e011617.
287. Jones RA, Blackburn NE, Woods C, et al. 2019. Interventions promoting active transport to school in children: a systematic review and meta-analysis. Preventive Medicine 123: 232–41.
98 Pūrongo Ārai Mate Pukupuku | Cancer Prevention Report
288. Schönbach DM, Altenburg TM, Marques A, et al. 2020. Strategies and effects of school-based interventions to promote active school transportation by bicycle among children and adolescents: a systematic review. International Journal of Behavioral Nutrition and Physical Activity 17(1): 1–17.
289. Stewart G, Anokye NK, Pokhrel S. 2016. Quantifying the contribution of utility cycling to population levels of physical activity: an analysis of the Active People Survey. Journal of Public Health 38(4): 644–52.
290. Larouche R, Saunders TJ, Faulkner GEJ, et al. 2014. Associations between active school transport and physical activity, body composition, and cardiovascular fitness: a systematic review of 68 studies. Journal of Physical Activity and Health 11(1): 206–27.
291. Laverty AA, Goodman A, Aldred R. 2021. Low traffic neighbourhoods and population health. BMJ 372: n443. DOI: 10.1136/bmj.n443 (accessed 29 October 2021).
292. New Zealand Government. 2020. Government Policy Statement on Land Transport 2021/2022 - 2030/2031. Wellington: New Zealand Government. URL: https://www.transport.govt.nz//assets/Uploads/Paper/GPS2021.pdf (accessed 1 November 2021).
293. Waka Kotahi NZ Transport Agency. 2019. Keeping Cities Moving: Increasing the wellbeing of New Zealand’s cities by rowing the share of travel by public transport, walking and cycling. Wellington: Waka Kotahi NZ Transport Agency. URL: https://www.nzta.govt.nz/assets/resources/keeping-cities-moving/Keeping-cities-moving.pdf (accessed 30 October 2021).
294. Waka Kotahi NZ Transport Agency. 2021. Keeping cities moving. URL: https://www.nzta.govt.nz/walking-cycling-and-public-transport/keeping-cities-moving/ (accessed 30 October 2021).
295. Arundell L, Salmon J, Koorts H, et al. 2019. Exploring when and how adolescents sit: cross-sectional analysis of activPAL-measured patterns of daily sitting time, bouts and breaks. BMC Public Health 19(1): 653. DOI: 10.1186/s12889-019-6960-5 (accessed 27 October 2021).
296. Reed JL, Prince SA, Elliott CG, et al. 2017. Impact of workplace physical activity interventions on physical activity and cardiometabolic health among working-age women: a systematic review and meta-analysis. Circulation: Cardiovascular Quality and Outcomes 10(2): e003516.
297. Murray JM, Brennan SF, French DP, et al. 2017. Effectiveness of physical activity interventions in achieving behaviour change maintenance in young and middle aged adults: a systematic review and meta-analysis. Social Science & Medicine 192: 125–33.
298. Bellew B, Nau T, Smith B, et al (eds). 2020. Getting Australia Active III: A systems approach to physical activity for policy makers. Sydney: Australian Prevention Partnership Centre and The University of Sydney.
299. Van Dongen J, Proper K, Van Wier M, et al. 2011. Systematic review on the financial return of worksite health promotion programmes aimed at improving nutrition and/or increasing physical activity. Obesity Reviews 12(12): 1031–49.
300. Te Hiringa Hauora | Health Promotion Agency. nd. A Guide to Sitting Less and Moving More For Office Workplaces. Te Hiringa Hauora | Health Promotion Agency. URL: https://wellplace.nz/assets/Uploads/Resource-files/Move-more-resources/A-guide-to-sitting-less-and-moving-more-in-your-workplace-WEB.pdf (accessed 30 October 2021).
301. Messing S, Rütten A, Abu-Omar K, et al. 2019. How can physical activity be promoted among children and adolescents? A systematic review of reviews across settings. Frontiers in Public Health 7: 55.
302. Mizdrak A, Shaw C, Lynch B, et al. 2021. The potential of school-based physical education to increase physical activity in Aotearoa New Zealand children and young people: a modelling study. New Zealand Medical Journal 134(1531): 23–35.
303. Ooms L, Veenhof C, Schipper-van Veldhoven N, et al. 2015. Sporting programs for inactive population groups: factors influencing implementation in the organized sports setting. BMC Sports Science, Medicine and Rehabilitation 7(1): 1–14.

99Pūrongo Ārai Mate Pukupuku | Cancer Prevention Report
304. Mooses K, Kull M. 2020. The participation in organised sport doubles the odds of meeting physical activity recommendations in 7–12-year-old children. European Journal of Sport Science 20(4): 563–9.
305. Robinson TN. 2010. Stealth interventions for obesity prevention and control: motivating behavior change. In L Dubé, A Bechara, A Dagher, et al (eds) Obesity Prevention (pp 319–27). Academic Press. DOI: 10.1016/B978-0-12-374387-9.00025-8 (accessed 30 October 2021).
306. Sport New Zealand. 2016. Future Proofing the Active Recreation Sector: A planning framework. Wellington: Sport New Zealand.
307. Sport New Zealand. 2015. Sport and Active Recreation in the Lives of New Zealand Adults: 2013/14 Active New Zealand Survey Results. Wellington: Sport New Zealand.
308. Lee JE, Pope Z, Gao Z. 2018. The role of youth sports in promoting children’s physical activity and preventing pediatric obesity: a systematic review. Behavioral Medicine 44(1): 62–76.
309. Cavill N, Richardson D, Foster DC. 2012. Improving Health through Participation in Sport: A review of research and practice. Oxford: British Heart Foundation Health Promotion Research Group.
310. Signal LN, Walton MD, Ni Mhurchu C, et al. 2013. Tackling ‘wicked’ health promotion problems: a New Zealand case study. Health Promotional International 28(1): 84–94. DOI: 10.1093/heapro/das006 (accessed 27 October 2021).
311. Sport New Zealand. nd. Growth of waka ama case study. URL: https://sportnz.org.nz/resources/growth-of-waka-ama/ (accessed 27 October 2021).
312. Lamming L, Pears S, Mason D, et al. 2017. What do we know about brief interventions for physical activity that could be delivered in primary care consultations? A systematic review of reviews. Preventive Medicine 99: 152–63.
313. Hamlin MJ, Yule E, Elliot CA, et al. 2016. Long-term effectiveness of the New Zealand Green Prescription primary health care exercise initiative. Public Health 140: 102–8. DOI: 10.1016/j.puhe.2016.07.014 (accessed 29 October 2021).
314. Abu-Omar K, Rütten A, Burlacu I, et al. 2017. The cost-effectiveness of physical activity interventions: a systematic review of reviews. Preventive Medicine Reports 8: 72–8.
315. Harling M, Stephens K. 2016. Making Every Contact Count (MECC): Consensus statement. NHS England, Public Health England, Health Education England and the national MECC advisory group. URL: https://assets.publishing.service.gov.uk/government/uploads/system/uploads/attachment_data/file/769486/Making_Every_Contact_Count_Consensus_Statement.pdf (accessed 29 October 2021).
316. Ministry of Health. 2016. Green Prescriptions. Wellington: Ministry of Health.
317. Research New Zealand. 2018. Green Prescription Active Families Survey Report: May 2018. Wellington: Ministry of Health.
318. Armstrong BK. 2004. How sun exposure causes skin cancer: an epidemiological perspective. In D Hill, JM Elwood, D English (eds) Prevention of Skin Cancer (pp 89–116). Springer.
319. Kennedy C, Willemze R, de Gruijl FR, et al. 2003. The influence of painful sunburns and lifetime sun exposure on the risk of actinic keratoses, seborrheic warts, melanocytic nevi, atypical nevi, and skin cancer. Journal of Investigative Dermatology 120(6): 1087–93.
320. Dennis L, Vanbeek M, Freeman L, et al. 2008. Sunburns and risk of cutaneous melanoma: does age matter? A comprehensive meta-analysis. Annals of Epidemiology 18(8): 614–27.
321. Sneyd M, Gray A. 2018. Expected Non-melanoma skin (Keratinocytic) Cancer Incidence in New Zealand for 2018. Te Hiringa Hauora | Health Promotion Agency.
322. EHINZ. 2020. Melanoma cancer registrations [Factsheet]. Wellington: Environmental Health Indicators New Zealand, Massey University.
323. Ministry of Health. 2019. Selected Cancers 2015, 2016, 2017. URL: https://www.health.govt.nz/publication/selected-cancers-2015-2016-2017 (accessed 29 October 2021).

100 Pūrongo Ārai Mate Pukupuku | Cancer Prevention Report
324. Ballantine K, Moss R, Watson H. 2020. Adolescent and Young Adult Cancer Incidence and Survival in Aotearoa 2008–2017. Auckland: AYA Cancer Network Aotearoa.
325. NZCCR. 2020. NZCCR Annual Report 2019. Auckland: New Zealand Children’s Cancer Registry (NZCCR) Working Group.
326. Te Hiringa Hauora | Health Promotion Agency and Melanoma Network of New Zealand. 2017. Skin Cancer Primary Prevention and Early Detection Strategy 2017 to 2022. Wellington and Auckland: Te Hiringa Hauora | Health Promotion Agency and Melanoma Network of New Zealand. URL: https://www.sunsmart.org.nz//sites/default/files/documents/FINAL-Strategy-2017-to-2022.PDF (accessed 28 October 2021).
327. O’Dea D. 2009. The Costs of Skin Cancer to New Zealand. Wellington: Cancer Society of New Zealand.
328. Cancer Society Social and Behavioural Research Unit. 2018. Skin cancer in New Zealand [Factsheet]. Dunedin: Cancer Society Social and Behavioural Research Unit. URL: https://www.otago.ac.nz/sbru/otago687389.pdf (accessed 28 October 2021).
329. NIWA. 2020. UV and ozone. URL: https://niwa.co.nz/our-services/online-services/uv-ozone (accessed 30 October 2021).
330. Allinson S, Asmuss M, Baldermann C, et al. 2012. Validity and use of the UV index: report from the UVI working group, Schloss Hohenkammer, Germany, 5–7 December 2011. Health Physics 103(3): 301–6.
331. NIWA. 2020. Geographical and seasonal variation in peak UVI – NZ. URL: https://niwa.co.nz/sites/niwa.co.nz/files/sites/default/files/import/attachments/Web_plots.pdf (accessed 30 October 2021).
332. Te Hiringa Hauora | Health Promotion Agency. nd. Be Sunsmart. URL: https://www.sunsmart.org.nz (accessed 30 October 2021).
333. Te Hiringa Hauora | Health Promotion Agency. nd. Kupe Data Explorer. Health and Lifestyle Survey. Sun exposure – sunburn. Te Hiringa Hauora | Health Promotion Agency. URL: https://kupe.hpa.org.nz/#!/sun-exposure/sunburn (accessed 30 October 2021).
334. Trowland H, Thimasarn-Anwar T, Dallas S, et al. 2016. Sun Exposure Survey 2016: Adult Topline Time Series Report. Wellington: Research and Evaluation Unit, Te Hiringa Hauora | Health Promotion Agency.
335. Kingstone S, Nicolson M. 2020. Sunsmart Behaviours – Outdoor socialisers. Wellington: Te Hiringa Hauora | Health Promotion Agency. URL: https://www.hpa.org.nz/sites/default/files/Outdoor%20Socialisers%20SunSmart%20Behaviours.pdf (accessed 29 October 2021).
336. Te Hiringa Hauora | Health Promotion Agency. nd. Kupe Data Explorer. Health and Lifestyle Survey. Sun exposure - Sun protective behaviours (and skin checks). Te Hiringa Hauora | Health Promotion Agency. URL: https://kupe.hpa.org.nz/#!/sun-exposure/sun-protective-behaviours-and-skin-checks (accessed 30 October 2021).
337. Cancer Society. 2021. Sunsmart. URL: https://www.cancer.org.nz/cancer/reducing-your-cancer-risk/sunsmart/ (accessed 21 December 2021).
338. Tabbakh T, Volkov A, Wakefield M, et al. 2019. Implementation of the SunSmart program and population sun protection behaviour in Melbourne, Australia: results from cross-sectional summer surveys from 1987 to 2017. PLOS Medicine 16(10): e1002932.
339. Arnold M, de Vries E, Whiteman DC, et al. 2018. Global burden of cutaneous melanoma attributable to ultraviolet radiation in 2012. International Journal of Cancer 143(6), 1305–14.
340. Parsons PG, Neale R, Wolski P, et al. 1998. The shady side of solar protection. Medical Journal of Australia 168(7): 327–30.
341. Australian Radiation Protection and Nuclear Safety Agency. nd. Sun protection using shade. URL: https://www.arpansa.gov.au/understanding-radiation/radiation-sources/more-radiation-sources/sun-protection-shade (accessed 27 October 2021).
342. Holman DM, Kapelos GT, Shoemaker M, et al. 2018. Shade as an environmental design tool for skin cancer prevention. American Journal of Public Health 108(12): 1607–12.
101Pūrongo Ārai Mate Pukupuku | Cancer Prevention Report
343. Gage R, Barr M, Stanley J, et al. 2018a. Sun protection and shade availability in New Zealand’s outdoor recreation spaces. New Zealand Medical Journal 131: 30–7.
344. Gage R, Wilson N, Signal L, et al. 2019. Shade in playgrounds: findings from a nationwide survey and implications for urban health policy. Journal of Public Health 27(5): 669–74.
345. Dobbinson SJ, Simmons J, Chamberlain JA, et al. 2020. Examining health-related effects of refurbishment to parks in a lower socioeconomic area: the ShadePlus natural experiment. International Journal of Environmental Research and Public Health 17(17): 6102.
346. Dobbinson SJ, White V, Wakefield MA, et al. 2009. Adolescents’ use of purpose built shade in secondary schools: cluster randomised controlled trial. BMJ 338:695.
347. Buller DB, English DR, Buller MK, et al. 2017. Shade sails and passive recreation in public parks of Melbourne and Denver: a randomized intervention. American Journal of Public Health 107(12): 1869–75.
348. SunSmart. nd. Local government. URL: https://www.sunsmart.com.au/advice-for/local-government (accessed 28 October 2021).
349. Victoria State Government. 2021. Shade Grants Program. URL: https://www.health.vic.gov.au/preventive-health/shade-grants-program (accessed 30 October 2021).
350. Dallas S, Kruse K. 2015. Public opinion on councils’ role to provide shade in public places. In Fact: Research facts from the HPA 4(3). Wellington: Te Hiringa Hauora | Health Promotion Agency. URL: https://www.hpa.org.nz/research-library/research-publications/public-opinion-on-councils%E2%80%99-role-to-provide-shade-in-public-places-in-fact (accessed 29 October 2021).
351. Napier City Council. 2016. Shade Policy. Napier City Council. URL: https://www.napier.govt.nz/assets/Document-Library/Policies/Shade-Policy.pdf (accessed 28 October 2021).
352. Palmerston North City Council. 2010. Sun Protection Policy. Palmerston North City Council. URL: https://www.pncc.govt.nz/media/3131377/sun_protection_policy_2010.pdf (accessed 28 October 2021).
353. Te Hiringa Hauora | Health Promotion Agency. nd. SunSmart councils and workplaces. URL: https://www.sunsmart.org.nz/learn-more/sunsmart-councils-and-workplaces (accessed 21 July 2021).
354. Greenwood JS, Soulos GP, Thomas ND. 2000. Under Cover: Guidelines for shade planning and design. NSW Cancer Council and NSW Health Department Sydney, 1998. Adapted for New Zealand use by the Cancer Society of New Zealand. URL: https://www.cancer.org.nz/cancer/reducing-your-cancer-risk/sunsmart/sunsmart-communities-schools-and-workplaces/ (accessed 28 October 2021).
355. Ettridge KA, Bowden JA, Rayner JM, et al. 2011. The relationship between sun protection policy and associated practices in a national sample of early childhood services in Australia. Health Education Research 26(1): 53–62.
356. McNoe BM, Reeder AI. 2019. Sun protection policies and practices in New Zealand primary schools. New Zealand Medical Journal 132(1497): 46–54.
357. McNoe BM, Reeder AI. 2016. Adolescent sun protection at secondary school athletic sporting events – a misnomer. Australian and New Zealand Journal of Public Health 40(4): 313–5.
358. Gage R, Leung W, Stanley J, et al. 2018. Sun protection among New Zealand primary school children. Health Education & Behavior 45(5): 800–7.
359. Reeder A, Jopson J, Gray A. 2012. Sun protection policies and practices in New Zealand primary schools. New Zealand Medical Journal 125(1349): 70–82.
360. Queensland Government. nd. Sun safety in state schools procedure. Effective from 24 January 2022. https://ppr.qed.qld.gov.au/attachment/Sun-safety-in-state-school-procedure.pdf (accessed 29 October 2021).
361. Community Preventive Services Task Force. 2012. Preventing skin cancer: primary and middle school-based interventions. The Community Guide. URL: https://www.thecommunityguide.org/findings/skin-cancer-primary-and-middle-school-based-interventions (accessed 28 October 2021).

102 Pūrongo Ārai Mate Pukupuku | Cancer Prevention Report
362. Reeder A, de Lange M, McNoe B. 2018. SunSmart schools: a New Zealand skin cancer primary prevention intervention blueprint for primary school settings. British Journal of Dermatology 179(4): 963-964.
363. Gies P, Mackay C. 2004. Measurements of the Solar UVR Protection Provided by Shade Structures in New Zealand Primary Schools. Photochemistry and Photobiology 80: 334-339.
364. Ministry of Education. 2021. Shade structures at schools. URL: https://www.education.govt.nz/school/property-and-transport/projects-and-design/design/design-standards/shade-structures/ (accessed 29 October 2021).
365. Reeder A, McNoe B, Iosua E. 2016. Sun protection practices in New Zealand secondary schools: a 2014 baseline study. Preventive medicine reports 3: 257-263.
366. Cancer Society of New Zealand. 2019. Annual Report. Wellington: Cancer Society of New Zealand. URL: https://www.cancer.org.nz/about-us/find-a-cancer-society-office-near-you/national-office/annual-reports-2/ (accessed 28 October 2021).
367. Hammond V, Reeder A, Gray A. 2009. Patterns of real-time occupational ultraviolet radiation exposure among a sample of outdoor workers in New Zealand. Public Health 123(2): 182–7.
368. Australian Radiation Protection and Nuclear Safety Agency. 2003. Resource Guide for UVR Protective Products. Yallambie, Vic: Australian Radiation Protection and Nuclear Safety Agency.
369. Community Preventive Services Task Force. 2020. Guide to community preventive services: skin cancer: interventions in outdoor occupational settings. The Community Guide. URL: https://www.thecommunityguide.org/findings/skin-cancer-interventions-outdoor-occupational-settings (accessed 29 October 2021).
370. Reeder A, Gray A, McCool J. 2013. Occupational sun protection: workplace culture, equipment provision and outdoor workers’ characteristics. Journal of Occupational Health 55(2): 84–97.
371. Safe Work Australia. 2019. Guide on exposure to solar ultraviolet radiation (UVR): National guidance. Canberra: Safe Work Australia. URL: https://www.safeworkaustralia.gov.au/system/files/documents/2001/guide-exposure-solar-ultraviolet-radiation_1.pdf (accessed 30 October 2021).
372. WorkSafe New Zealand. 2017. Health and Safety at Work Act 2015. URL: https://worksafe.govt.nz/laws-and-regulations/acts/hswa/ (accessed 28 October 2021).
373. Dodd A, Marceau J. 2018. Sun Protection Practices in Equity-funded Early Childhood Education Settings in Christchurch. Christchurch: Cancer Society and Canterbury District Health Board. URL: https://www.cph.co.nz/wp-content/uploads/ecesunprotectionsurveyreport.pdf (accessed 29 October 2021).
374. Bray K. 2018. Sunscreen: consumer attitudes and concerns. Australian Skin and Skin Cancer Research Centre. URL: http://www.assc.org.au/wp-content/uploads/2018/03/K-Bray-Choice-Sunscreen-Summit-presentation-unverified.pdf (accessed 28 October 2021).
375. Holman DM, Berkowitz Z, Guy Jr GP, et al. 2015. Patterns of sunscreen use on the face and other exposed skin among US adults. Journal of the American Academy of Dermatology 73(1): 83–92. e81.
376. Whiteman DC, Neale RE, Aitken J, et al. 2019. When to apply sunscreen: a consensus statement for Australia and New Zealand. Australian and New Zealand Journal of Public Health 43(2): 171–5.
377. Gordon L, Olsen C, Whiteman DC, et al. 2020. Prevention versus early detection for long-term control of melanoma and keratinocyte carcinomas: a cost-effectiveness modelling study. BMJ Open 10(2): e034388.
378. Australian Government Department of Health. 2021. The Pharmaceutical Benefits Scheme: About the PBS. URL: https://www.pbs.gov.au/info/about-the-pbs (accessed 28 October 2021).
379. New Zealand Parliament. nd. Sunscreen (Product Safety Standard) Bill. URL: https://www.parliament.nz/en/pb/bills-and-laws/bills-proposed-laws/document/BILL_109343/tab/submissionsandadvice (accessed 28 October 2021).
103Pūrongo Ārai Mate Pukupuku | Cancer Prevention Report
380. Ministry of Health. 2019. Therapeutic Products Regulatory Scheme Consultation. Key themes from submissions on the Therapeutic Products Bill. Wellington: Ministry of Health. URL: https://www.health.govt.nz/publication/therapeutic-products-regulatory-scheme-consultation (accessed 29 October 2021).
381. Medsafe. 2014. Guideline on the Regulation of Therapeutic Products in New Zealand. Part 1: Overview of therapeutic product regulatrion. Edition 1.0. Wellington: Medsafe. URL: https://www.medsafe.govt.nz/regulatory/Guideline/GRTPNZ/overview-of-therapeutic-product-regulation.pdf (accessed 29 October 2021).
382. Consumer New Zealand. 2021. Why sunscreens should be regulated. Hot from the lab: our latest sunscreen test results. Consumer 12 May. URL: https://www.consumer.org.nz/articles/why-sunscreens-should-be-regulated/full-test-results (accessed 28 October 2021).
383. McNoe B. 2021. Prevention is better than cure: we can do better in skin cancer control in New Zealand! New Zealand Medical Journal. 134(1544):138–144.
384. Castles B. 2020. Why sunbeds should be banned. Consumer 7 April. URL: https://www.consumer.org.nz/articles/sunbeds (accessed 29 October 2021).
385. Rositch AF. 2020. Global burden of cancer attributable to infections: the critical role of implementation science. The Lancet Global Health 8(2): e153–e154.
386. de Martel C, Georges D, Bray F, et al. 2020. Global burden of cancer attributable to infections in 2018: a worldwide incidence analysis. The Lancet Global Health 8(2): e180–e190.
387. Goncalves PH, Montezuma-Rusca JM, Yarchoan R, et al. 2016. Cancer prevention in HIV-infected populations. Seminars in Oncology 43(1): 173–88. DOI: 10.1053/j.seminoncol.2015.09.011 (accessed 29 October 2021).
388. Signal V, Gurney J, Inns S, et al. 2020. Helicobacter pylori, stomach cancer and its prevention in New Zealand. Journal of the Royal Society of New Zealand 50(3): 397–417.
389. Chang AH, Parsonnet J. 2010. Role of bacteria in oncogenesis. Clinical Microbiology Reviews 23(4): 837–57.
390. McDonald AM, Sarfati D, Baker MG, et al. 2015. Trends in Helicobacter pylori infection among Māori, Pacific, and European birth cohorts in New Zealand. Helicobacter 20(2): 139–45.
391. Signal V. 2016. Making sense of stomach cancer inequities in Aotearoa New Zealand. PhD thesis, University of Otago, Dunedin.
392. de Martel C, Plummer M, Vignat J, et al. 2017. Worldwide burden of cancer attributable to HPV by site, country and HPV type. International Journal of Cancer 141(4): 664–70.
393. Immunisation Advisory Centre. 2020. Human papillomavirus (HPV). URL: https://www.immune.org.nz/diseases/human-papillomavirus-hpv (accessed 28 October 2021).
394. Schauer C, Mules T, van Rijnsoever M, et al. 2020. Increasing burden of advanced hepatocellular carcinoma in New Zealand-the need for better surveillance. New Zealand Medical Journal 133(1515): 25–34.
395. BPAC. 2018. Hepatitis B: treatments now available for primary care. Best Practice Advisory Centre. URL: https://bpac.org.nz/2018/hepb.aspx (accessed 27 October 2021).
396. BPAC. 2019. Hepatitis C management in primary care has changed. Best Practice Advisory Centre. URL: https://bpac.org.nz/2019/hepc/docs/hepc.pdf (accessed 28 October 2021).
397. Matsushita H, Takaki A. 2019. Alcohol and hepatocellular carcinoma. BMJ Open Gastroenterology 6(1): e000260.
398. Abdel-Rahman O, Helbling D, Schöb O, et al. 2017. Cigarette smoking as a risk factor for the development of and mortality from hepatocellular carcinoma: an updated systematic review of 81 epidemiological studies. Journal of Evidence-Based Medicine 10(4): 245–54.
399. Alqahtani SA, Colombo M. 2020. Viral hepatitis as a risk factor for the development of hepatocellular carcinoma. Hepatoma Research 6: 58.

104 Pūrongo Ārai Mate Pukupuku | Cancer Prevention Report
400. Iida-Ueno A, Enomoto M, Tamori A, et al. 2017. Hepatitis B virus infection and alcohol consumption. World Journal of Gastroenterology 23(15): 2651.
401. Kim K, Choi S, Park SM. 2018. Association of high body mass index and hepatocellular carcinoma in patients with chronic hepatitis B virus infection: a Korean population-based cohort study. JAMA Oncology 4(5): 737–39.
402. Yarchoan R, Uldrick TS. 2018. HIV-Associated Cancers and Related Diseases. The New England Journal of Medicine 378(11): 1029-41.
403. Coghill AE, Shiels MS, Suneja G, et al. 2015. Elevated Cancer-Specific Mortality Among HIV-Infected Patients in the United States. Journal of Clinical Oncology 33(21): 2376-83.
404. BPAC. 2014. The changing face of Helicobacter pylori testing. Best Tests 23: 20–25. URL: https://bpac.org.nz/BT/2014/May/docs/BT23-h-pylori.pdf (accessed 27 October 2021).
405. Baker M, McDonald A, Zhang J, et al. 2013. Infectious Diseases Attributable to Household Crowding in New Zealand: A systematic review and burden of disease estimate (vol 1). Wellington: He Kainga Oranga/Housing and Health Research.
406. Ministry of Health. 2019. Sexual and reproductive health: information and resources on sexual and reproductive health. URL: https://www.health.govt.nz/our-work/preventative-health-wellness/sexual-and-reproductive-health (accessed 29 October 2021).
407. Stats NZ. 2021. Child poverty statistics: Year ended June 2020 – corrected. URL: https://www.stats.govt.nz/information-releases/child-poverty-statistics-year-ended-june-2020 (accessed 30 October 2021).
408. Stats NZ. 2020. Almost 1 in 9 people live in a crowded house. URL: http://www.stats.govt.nz/news/almost-1-in-9-people-live-in-a-crowded-house (accessed 28 October 2021).
409. Ministry of Health. 2020. Immunisation Handbook. Wellington: Ministry of Health.
410. BPAC. 2019. Testing for hepatitis C virus (HCV) in patients at high risk of infection. URL: https://bpac.org.nz/2019/hepc/testing.aspx.
411. Hassan I, Gane E. 2019. Improving survival in patients with hepatocellular carcinoma related to chronic hepatitis C and B but not in those related to non-alcoholic steatohepatitis or alcoholic liver disease: a 20-year experience from a national programme. Internal Medicine Journal 49(11): 1405–11.
412. Schweitzer A, Horn J, Mikolajczyk RT, et al. 2015. Estimations of worldwide prevalence of chronic hepatitis B virus infection: a systematic review of data published between 1965 and 2013. The Lancet 386(10003): 1546–55.
413. Robinson T, Bullen C, Humphries W, et al. 2005. The New Zealand Hepatitis B Screening Programme: screening coverage and prevalence of chronic hepatitis B infection. New Zealand Medical Journal 118: 1–11.
414. Ministry of Health. 2021. National Hepatitis C Action Plan for Aotearoa New Zealand – Māhere Mahi mō te Ate Kakā C 2020–2030. Wellington: Ministry of Health.
415. Hepatitis Foundation of New Zealand. nd. Hepatitis B. URL: https://www.hepatitisfoundation.org.nz/hepatitis/hepatitis-b (accessed 28 October 2021).
416. Dickson N, Lee B, Foster T, et al. 2015. The first 30 years of HIV in New Zealand: Review of the epidemiology. The New Zealand Medical Journal 128(1426): 31-48.
417. Saxton PJW, Dickson NP, Griffiths R, et al. 2012. Actual and undiagnosed HIV prevalence in a community sample of men who have sex with men in Auckland, New Zealand. BMC Public Health 12(1): 92.
418. AIDS Epidemiology Group. 2021. AIDS - New Zealand, May 2021. Dunedin: University of Otago. URL: https://www.otago.ac.nz/aidsepigroup/otago827752.pdf (accessed 14 January 2022)
419. WHO. 2021. HIV/AIDS. URL: https://www.who.int/news-room/fact-sheets/detail/hiv-aids (accessed 14 January 2022).
105Pūrongo Ārai Mate Pukupuku | Cancer Prevention Report
420. WHO. 2016. Global Health Sector Strategy on Viral Hepatitis 2016–2021. Towards ending viral hepatitis. Geneva: World Health Organization. URL: https://apps.who.int/iris/handle/10665/246177 (accessed 30 October 2021).
421. National Screening Unit. 2021. HPV primary screening. URL: https://www.nsu.govt.nz/health-professionals/national-cervical-screening-programme/hpv-primary-screening (accessed 30 October 2021).
422. WHO. 2020. Launch of the Global Strategy to Accelerate the Elimination of Cervical Cancer. World Health Organization. URL: https://www.who.int/news-room/events/detail/2020/11/17/default-calendar/launch-of-the-global-strategy-to-accelerate-the-elimination-of-cervical-cancer (accessed 1 November 2021).
423. WHO. 2018. WHO Housing and Health Guidelines. Geneva: World Health Organization. URL: https://apps.who.int/iris/bitstream/handle/10665/276001/9789241550376-eng.pdf (accessed 30 October 2021).
424. Mitchell H, Katelaris P. 2016. Epidemiology, clinical impacts and current clinical management of Helicobacter pylori infection. The Medical Journal of Australia 204(10): 376–80.
425. Herrero R, Park JY, Forman D. 2014. The fight against gastric cancer – the IARC Working Group report. Best Practice & Research: Clinical Gastroenterology 28(6): 1107–14.
426. Duncanson M, Richardson G, Oben G, et al. 2020. Child Poverty Monitor 2020. Dunedin: University of Otago. URL: http://www.nzchildren.co.nz/ (accessed 29 October 2021).
427. Fraser AG, Scragg R, Metcalf P, et al. 1996. Prevalence of Helicobacter pylori infection in different ethnic groups in New Zealand children and adults. Australian and New Zealand Journal of Medicine 26(5): 646-51.
428. Krueger W, Hilborn E, Converse R, et al. 2015. Environmental risk factors associated with Helicobacter pylori seroprevalence in the United States: a cross-sectional analysis of NHANES data. Epidemiology & Infection 143(12): 2520–31.
429. Pierse N, White M, Riggs L. 2019. Healthy Homes Initiative Outcomes Evaluation Service: Initial analysis of health outcomes (Interim Report). Wellington: Ministry of Health.
430. ESR. 2020. Notifiable Diseases in New Zealand: Annual Report 2018. Porirua: Institute of Environmental Science and Research Ltd. URL: https://surv.esr.cri.nz/PDF_surveillance/AnnualRpt/AnnualSurv/2018/2018AnnualNDReport_FINAL.pdf (accessed 28 October 2021).
431. Ogunremi T, Defalco K, Johnston B, et al. 2019. Preventing healthcare transmission of bloodborne viruses. Canada Communicable Disease Report 45: 12.
432. Jafari S, Copes R, Baharlou S, et al. 2010. Tattooing and the risk of transmission of hepatitis C: a systematic review and meta-analysis. International Journal of Infectious Diseases 14(11), e928-e940.
433. Jafari S, Buxton JA, Afshar K, et al. 2012. Tattooing and risk of hepatitis B: a systematic review and meta-analysis. Canadian Journal of Public Health 103(3): 207–12.
434. Khodadost M, Maajani K, Arabsalmani M, et al. 2017. Is tattooing a risk factor for hepatitis c transmission? An updated systematic review and meta-analysis. Hepatitis Monthly 17(9).
435. Pouget ER, Hagan H, Des Jarlais DC. 2012. Meta-analysis of hepatitis C seroconversion in relation to shared syringes and drug preparation equipment. Addiction 107(6): 1057–65.
436. Pierce Campbell CM, Lin HY, Fulp W, et al. 2013. Consistent condom use reduces the genital human papillomavirus burden among high-risk men: the HPV infection in men study. The Journal of Infectious Diseases 208(3): 373–84.
437. Lam JUH, Rebolj M, Dugue PA, et al. 2014. Condom use in prevention of Human Papillomavirus infections and cervical neoplasia: systematic review of longitudinal studies. Journal of Medical Screening 21(1): 38–50.
438. Bernabe-Ortiz A, Carcamo CP, Scott JD, et al. 2011. HBV infection in relation to consistent condom use: a population-based study in Peru. PloS one 6(9): e24721-e.
439. UNAIDS. 2004. Making condoms work for HIV prevention: cutting-edge perspectives. Geneva: Joint United Nations Programme on HIV/AIDS.

106 Pūrongo Ārai Mate Pukupuku | Cancer Prevention Report
440. Alter HJ, Klein HG. 2008. The hazards of blood transfusion in historical perspective. Blood 112(7): 2617–26.
441. Fong I. 2020. Blood transfusion-associated infections in the twenty-first century: new challenges. Current Trends and Concerns in Infectious Diseases 191–215.
442. Abdella Y, Riedner G, Hajjeh R, et al. 2018. Blood transfusion and hepatitis: what does it take to prevent new infections? Eastern Mediterranean Health Journal 24(6): 595–7.
443. Yooda AP, Sawadogo S, Soubeiga ST, et al. 2019. Residual risk of HIV, HCV, and HBV transmission by blood transfusion between 2015 and 2017 at the Regional Blood Transfusion Center of Ouagadougou, Burkina Faso. Journal of Blood Medicine 10: 53-8.
444. New Zealand Blood Service. 2016. Transfusion Medicine Handbook Third Edition, 2016. A guide to the clinical use of blood components, blood products and blood transfusion procedures in New Zealand. Auckland: New Zealand Blood Service. URL: https://www.nzblood.co.nz/assets/Transfusion-Medicine/PDFs/111G122.pdf (accessed 28 October 2021).
445. New Zealand Blood Service. 2016. NZBS 10th Annual Haemovigilance Report 2014: a summary. Blood Issues (29): 1–2. URL: https://www.nzblood.co.nz/assets/Transfusion-Medicine/Blood-Issues/Blood-Issues-Newsletter-April-2016.pdf (accessed 28 October 2021).
446. New Zealand Blood Service. 2017. Residual risk of transmission of major blood borne viruses. Blood Issues (30): 2–3. URL: https://www.nzblood.co.nz/assets/Transfusion-Medicine/Blood-Issues/Blood-Issues-Newsletter-November-2017.pdf (accessed 28 October 2021).
447. Ministry of Health. 1998. Guidelines for the Safe Piercing of Skin. Wellington: Ministry of Health.
448. WorkSafe New Zealand. 2017. Germs and infections. URL: https://www.worksafe.govt.nz/topic-and-industry/health-and-hygiene/germs-and-infections/ (accessed 25 October 2021).
449. Health Regulatory Authorities of New Zealand. 2005. HRANZ Joint Guidelines for registered health care workers on transmissible major viral infections. URL: https://www.podiatristsboard.org.nz/Portals/0/Uploads/TMVI%20-%20HRANZ%20guidelines.pdf (accessed 23 October 2021).
450. Hutt City Council. nd. Statement of proposal: Appearance Industries Bylaw. URL: http://iportal.huttcity.govt.nz/Record/ReadOnly?Tab=3&Uri=5441466 (accessed 28 October 2021).
451. New Zealand Association of Registered Beauty Professionals. 2020. Health and Hygiene Guidelines. Auckland: New Zealand Association of Registered Beauty Professionals. URL: https://www.beautynz.org.nz/files/3216/0046/5302/Health_and_Hygiene_Vol_2_0._2020.09.pdf (accessed 28 October 2021).
452. National Centre in HIV Epidemiology and Clinical Research. 2009. Return on Investment 2: Evaluating the cost-effectiveness of needle and syringe programs in Australia. .Department of Health and Ageing and National Centre in HIV Epidemiology and Clinical Research. URL: https://www.acon.org.au/wp-content/uploads/2015/04/Evaluating-the-cost-effectiveness-of-NSP-in-Australia-2009.pdf (accessed 30 October 2021).
453. New Zealand Needle Exchange Programme. nd. About Us. URL: https://www.nznep.org.nz/about-us (accessed 14 November 2021).
454. Robinson G, Reynolds J, Robinson B. 1995. Hepatitis C prevalence and needle/syringe sharing behaviours in recent onset injecting drug users. New Zealand Medical Journal 108(996): 103-5.
455. Saxton P, McAllister S, Noller G, et al. 2020. Injecting drug use among gay and bisexual men in New Zealand: Findings from national human immunodeficiency virus epidemiological and behavioural surveillance. Drug and Alcohol Review 39(4): 365-74.
456. Ortiz E, Scanlon B, Mullens A, et al. 2020. Effectiveness of interventions for Hepatitis B and C: a systematic review of vaccination, screening, health promotion and linkage to care within higher income countries. Journal of Community Health 45(1): 201–18.
457. Lei J, Ploner A, Elfström KM, et al. 2020. HPV vaccination and the risk of invasive cervical cancer. New England Journal of Medicine 383(14): 1340–8.
107Pūrongo Ārai Mate Pukupuku | Cancer Prevention Report
458. Oliveira CR, Niccolai LM. 2021. Monitoring HPV vaccine impact on cervical disease: status and future directions for the era of cervical cancer elimination. Preventive Medicine 144: 106363.
459. ESR. 2019. Sexually Transmitted Infections in New Zealand: Annual surveillance report 2016. Porirua: Institute of Environmental Science and Research Ltd.
460. Ni YH, Chang MH, Wu JF, et al. 2012. Minimization of hepatitis B infection by a 25-year universal vaccination program. Journal of Hepatology 57(4): 730–5.
461. Wiesen E, Diorditsa S, Li X. 2016. Progress towards hepatitis B prevention through vaccination in the Western Pacific, 1990–2014. Vaccine 34(25): 2855–62.
462. Anderson PL, Glidden DV, Liu A, et al. 2012. Emtricitabine-tenofovir concentrations and pre-exposure prophylaxis efficacy in men who have sex with men. Science Translational Medicine 4(151): 151ra25.
463. DeHaan E, McGowan J, Fine S, et al. 2021. PEP to Prevent HIV Infection. Baltimore: Johns Hopkins University, URL: https://www.ncbi.nlm.nih.gov/books/NBK562734/ (accessed 14 January 2022)
464. Brown AE, Mohammed H, Ogaz D, et al. 2017. Fall in new HIV diagnoses among men who have sex with men (MSM) at selected London sexual health clinics since early 2015: testing or treatment or pre-exposure prophylaxis (PrEP)? Euro Surveillance 22(25): 30553.
465. Liu AY, Cohen SE, Vittinghoff E, et al. 2016. Preexposure Prophylaxis for HIV Infection Integrated With Municipal- and Community-Based Sexual Health Services. JAMA Internal Medicine 176(1): 75-84.
466. Saxton P, Giola M, Coughlan E, et al. 2018. Implementing HIV pre-exposure prophylaxis (PrEP): let’s not get caught with our pants down. The New Zealand Medical Journal 131(1481): 64-73.
467. Saxton PJW, McAllister SM. 2019. Enumerating the population eligible for funded HIV pre-exposure prophylaxis (PrEP) in New Zealand. Sexual Health 16(1): 63-9.
468. New Zealand AIDS Foundation. nd. Post-exposure Prophylaxis (PEP). URL: https://www.nzaf.org.nz/awareness-and-prevention/prevention/post-exposure-prophylaxis-pep/ (accessed 14 January 2022).
469. National Academies of Sciences, Engineering and Medicine. 2017. A National Strategy for the Elimination of Hepatitis B and C: Phase two report. Washington, DC: National Academies Press.
470. WHO. 2015. Guidelines for the Prevention, Care and Treatment of Persons with Chronic Hepatitis B Infection. Geneva: World Health Organization. URL: http://apps.who.int/iris/bitstream/handle/10665/154590/9789241549059_eng.pdf?sequence=1 (accessed 30 October 2021).
471. Chen HL, Lin LH, Hu FC, et al. 2012. Effects of maternal screening and universal immunization to prevent mother-to-infant transmission of HBV. Gastroenterology 142(4): 773–81. e772.
472. Chang M-H, Chen D-S. 2015. Prevention of hepatitis B. Cold Spring Harbor Perspectives in Medicine 5(3): a021493.
473. Irshad U, Mahdy H, Tonismae T. 2022. HIV In Pregnancy. StatPearls. Treasure Island (FL): StatPearls Publishing
474. Ministry of Health. 2018. HIV testing in pregnancy. URL: https://www.health.govt.nz/your-health/pregnancy-and-kids/services-and-support-during-pregnancy/pregnancy-screening-tests/blood-tests-pregnancy/hiv-testing-pregnancy (accessed 14 January 2022).
475. Ministry of Health. 2020. Pregnancy and breastfeeding with HIV. URL: https://www.health.govt.nz/your-health/conditions-and-treatments/diseases-and-illnesses/hiv-aids/pregnancy-and-breastfeeding-hiv (accessed 14 January 2022).
476. Momin B, Millman AJ, Nielsen DB, et al. 2018. Promising practices for the prevention of liver cancer: a review of the literature and cancer plan activities in the National Comprehensive Cancer Control Program. Cancer Causes & Control 29(12): 1265–75.
477. Papatheodoridis GV, Lampertico P, Manolakopoulos S, et al. 2010. Incidence of hepatocellular carcinoma in chronic hepatitis B patients receiving nucleos(t)ide therapy: a systematic review. Journal of Hepatology 53(2): 348–56.
108 Pūrongo Ārai Mate Pukupuku | Cancer Prevention Report
478. Sarin S, Kumar M, Lau G, et al. 2016. Asian-Pacific clinical practice guidelines on the management of hepatitis B: a 2015 update. Hepatology International 10(1): 1–98.
479. Hepatitis Foundation of New Zealand. nd. Hepatitis B for health professionals. URL: https://www.hepatitisfoundation.org.nz/healthcare-professionals/hepatitis-b-health-professionals (accessed 28 October 2021).
480. Sugano K. 2019. Effect of Helicobacter pylori eradication on the incidence of gastric cancer: a systematic review and meta-analysis. Gastric Cancer 22(3): 435–45.
481. Lee Y-C, Chiang T-H, Chou C-K, et al. 2016. Association between Helicobacter pylori eradication and gastric cancer incidence: a systematic review and meta-analysis. Gastroenterology 150(5): 1113–24. e1115.
482. Ford AC, Yuan Y, Moayyedi P. 2020. Helicobacter pylori eradication therapy to prevent gastric cancer: systematic review and meta-analysis. Gut 69(12): 2113–21.
483. Park JY, Von Karsa L, Herrero R. 2014. Prevention strategies for gastric cancer: a global perspective. Clinical Endoscopy 47(6): 478.
484. Herrero R, Park JY, Forman D. 2014. The fight against gastric cancer – the IARC Working Group report. Best Practice & Research: Clinical Gastroenterology 28(6): 1107–14.
485. Sugano K. 2016. Screening of gastric cancer in Asia. Best Practice & Research Clinical Gastroenterology. 29(6): 895-905.
486. Chiang T, Chang W, Chen SL, et al. 2021. Mass eradication of Helicobacter pylori to reduce gastric cancer incidence and mortality: a long-term cohort study on Matsu Islands. Gut 70: 243-250.
487. Teng AM, Kvizhinadze G, Nair N, et al. 2017. A screening program to test and treat for Helicobacter pylori infection: cost-utility analysis by age, sex and ethnicity. BMC Infectious Diseases 17(1): 156.
488. BPAC. 2009. Non-occupational exposure to Human Immunodeficiency Virus (HIV). URL: https://bpac.org.nz/BPJ/2009/December/docs/bpj25_hiv_pages28-35.pdf (accessed 14 January 2022).
489. New Zealand AIDS Foundation. nd. All about Testing. URL: https://www.nzaf.org.nz/awareness-and-prevention/getting-tested/all-about-testing/ (accessed 14 January 2022).
490. McAllister S, van Asten H, Anglemyer A, et al. 2021. Cascade of care of people diagnosed with HIV in New Zealand between 2006 and 2017. HIV Medicine 22(2): 122-30.
491. Ministry of Health. 2021. Proposals for a Smokefree Aotearoa 2025 Action Plan: Discussion document. Wellington: Ministry of Health.