Effects of environmental pollution in caged mussels (Mytilus galloprovincialis)
Upload
independentCategory
view
0download
0
Biochem. J. (1976) 159,409-422Printed in Great Britain
Purification and Characterization ofthe Catalytic Subunit ofAdenosine 3': 5'-Cyclic Monophosphate-Dependent Protein Kinase
from Bovine Liver
By PETER H. SUGDEN,*t LESLIE A. HOLLADAY,t ERWIN M. REIMANN§and JACKIE D. CORBIN*II
*Departments ofPhysiology and iBiochemistry, Vanderbilt UniversitySchool of Medicine, Nashville, TN 37232, U.S.A., and
§Department of Biochemistry, Medical College of Ohio, Toledo, OH 43416, U.S.A.
(Received 12 May 1976)
1. The catalytic subunit ofbovine liver cyclic AMP-dependent protein kinase (EC 2.7.1.37)was purified essentially by the method of Reimann & Corbin [(1976) Fed. Proc. Fed. Am.Soc. Exp. Biol. 35, 1384]. 2. Sodium dodecyl sulphate/polyacrylamide-gel electrophoresis,sedimentation-velocity centrifugation and sedimentation-equilibrium centrifugationshowed that the catalytic subunit was monodisperse. Polyacrylamide-gel isoelectric-focus-ing electrophoresis revealed the presence of at least three isoenzyme forms of catalyticsubunit activity with slightly different pI values (6.72, 7.04 and 7.35). 3. Physical propertiesof the catalytic subunit were determined by several different methods. It had mol.wt.39000-42000, Stokes radius 2.73-3.08nm, s%O.w 3.14S, flfo 1.19-1.23 and, assuming aprolate ellipsoid, axial ratio 4-5. 4. Amino acid analysis was performed on the catalyticsubunit. It had one cysteine residue/molecule which was essential for activity. Inhibitionby thiol-specific reagents was partially prevented by the presence of ATP-Mg2+. 5. Thecircular-dichroic spectrum showed the catalytic subunit contained 29% a-helical form,18% fl-form and 53% aperiodic form. Near-u.v. circular dichroism showed the presenceof aromatic residues whose equivalent molar ellipticity was greatly altered by the additionof ATP-Mg2+. 6. Kinetic experiments showed that the catalytic subunit had an apparentKm for ATP of 7pM. 5'-Adenylyl imidodiphosphate inhibited competitively with ATPwith a K1 of 604uM. The kinetic plot for histone (Sigma, type II-A) was biphasic showing'high'- and 'low'-Km segments. Under assay conditions the specific activity of the catalyticsubunit was 3 x 10⁶ units/mg of protein. Of various metal ions tested, the catalytic subunitwas most active with Mg2+. 7. When assayed with histone (Sigma, type II-A) as substrate,the activity ofthe catalytic subunit was increased by non-ionic detergents or urea. No suchactivation was observed with casein as substrate.
In mammalian tissues, the only well-defined effectof cyclic AMP and hence, indirectly, of certain hor-mones is to dissociate cyclic AMP-dependent proteinkinase¶ (EC 2.7.1.37) into its catalytic (C) and regula-tory (R) subunits (Soderling et al., 1973; Keely et al.,1975) according to the equation (Brostrom et al.,1971 ; Rubin etal., 1972; Rosen et al., 1973; Bechtel &Beavo, 1974):R2C2+2 cyclic AMP = R2 (cyclic AMP)2+2C
t Present address: Nuffield Department of ClinicalBiochemistry, Radcliffe Infirnary, Oxford OX2 6HE,U.K.
11 To whom reprint requests should be addressed.Abbreviations: in this paper, the term protein kinase
refers to cyclic AMP-dependent protein kinase holo-enzyme. PPO, 2,5-diphenyloxazole; dimethyl-POPOP,1,4-bis-(4-methyl-5-phenyloxazol-2-yl)benzene; c.d., cir-cular dichroism.
Vol. 159
When the catalytic subunit is combined with the regu-latory subunit in the holoenzyme, its catalytic activityis inhibited. However, when the holoenzyme is dis-sociated by cyclic AMP, the catalytic subunit is ableto catalyse ATP-dependent phosphorylation of cer-tain enzymes (and possibly other proteins) and there-by cause alterations in their enzymic activities (seeKrebs, 1972; Rubin & Rosen, 1975; Corbin et al.,1976, for reviews). The catalytic subunit is thereforeimportant in the regulation of the activity of certainenzymes and in the manifestation of some hormonaleffects in vivo. In the present paper, we describe thepurification to homogeneity of the catalytic subunitof a 'type II' isoenzyme (see, Corbin et al., 1975;Sugden & Corbin, 1976) of a protein kinase frombovine liver essentially by the method of Reimann &Corbin (1976). Some of its physical and kineticproperties are also described.
409
P. H. SUGDEN, L. A. HOLLADAY, E. M. REIMANN AND J. D. CORBIN
Materials and Methods
Materials
Carrier-free [32P]phosphoric acid was obtainedfrom I. C. N. Pharmaceuticals, C and R Division,P.O. Box 80739, Los Angeles, CA 90080, U.S.A.[y-32P]ATP was prepared by the method of Glynn &Chappell (1964) as modified by Walsh et al. (1971).Inorganic chemicals and ethylenediamine were fromFisher Scientific Co., St. Louis, MO 63132, U.S.A.Reagents for electrophoresis and Bio-Gel HTPhydroxyapatite were from Bio-Rad Laboratories,Richmond, CA 94804, U.S.A. Whatman DE-1lDEAE-cellulose was from H. Reeve-Angel, Clifton,NJ, U.S.A., and was washed with 0.5M-NaOH andwater until the pH was 8, then 0.5M-HCI and wateruntil the pH increased to 5, before equilibration withbuffer. Gel-filtration materials were from PharmaciaFine Chemicals, Piscataway, NJ 08854, U.S.A. Allother chemicals and enzymes were from Signa, St.Louis, MO 63178, U.S.A. except for the following:4,4'-bis(dimethylaminodiphenylcarbinol) was fromPierce, Box 117, Rockford, IL 61105, U.S.A.; bovinehaemoglobin and serum albumin were from N.B.C.,Cleveland, OH 44128, U.S.A.; cyclic AMP was fromCalbiochem, La Jolla, CA 92037, U.S.A.; humantransferrin was from Miles Laboratories, Elkhart,IN 46514, U.S.A. 5'-Adenylyl imidodiphosphatewas from I.C.N. Pharmaceuticals, Cleveland, OH44128, U.S.A., and was purified as its Na+ salt essenti-ally by the method ofYount et al. (1971). Histone F2bfrom calf thymus was prepared by the method ofJohns (1964). Bovine liver and calf thymus were ob-tained immediately post mortem from a localslaughterhouse and stored in ice during transport.All potassium or sodium phosphate buffers were pre-pared by mixing equimolar solutions ofK2HPO4 andKH2PO4 or Na2HPO4 and NaH2PO4 to give thedesired pH. EDTA was neutralized to pH6.8 withNaOH before use.
MethodsProtein kinase assay. The protein kinase assay was
based on the phosphorylation of histone and carriedout as a routine essentially as described earlier(Corbin & Reimann, 1974). The reaction was initi-ated by the addition of 20,ul of suitably diluted en-zyme solution to 50,cc ofa mixture containing 17mM-potassium phosphate (pH6.8), 0.33mM-[y-'32P]ATP(25-30c.p.m./pmol), 6mM-magnesium acetate and0.5mg of histone (Sigma, type IH-A). The reactionmixture was incubated at 30°C for various times afterwhich the reaction was terminated by pipetting a50u1 sample on to a rectangle (Icm x 2cm) ofWhatman 3MM filter paper, which was immediatelydropped into ice-cold 10% (w/v) trichloroacetic acid(lOml/filter paper). The filter papers were washed
and dried by the method of Wastila et al. (1971) andcounted for radioactivity in lOml ofa fluor containing2.88 litre of toluene, 0.96 litre of ethylene glycolmonomethyl ether, 16g of PPO and 0.4g of dimethyl-POPOP. In some experiments, protamine (7.1 mg/ml)was used as substrate in the reaction mixture. In thiscase, the reaction was terminated with 20% (w/v) tri-chloroacetic acid. Protein kinase activity is expressedin terms of units where one unit of enzyme activitycatalysed the incorporation of 1 pmol of 32P from[y-2P]ATP into histone per min at 30°C. Enzymesolutions were diluted when necessary immediatelybefore assay in 50-1 10mM-potassium phosphatebuffer, pH6.8, containing 0.1 mM-dithiothreitol.
Analytical ultracentrifugation. Sedimentation-equi-librium experiments were carried out by the short-column method (Van Holde & Baldwin, 1958) at15000rev./min and the meniscus-depletion method(Yphantis, 1964) at 28000rev./min at 7.1°C by usinga Beckman model E ultracentrifuge equipped withphotoelectric scanner optics and electronic speedcontrol. The catalytic subunit was dialysed overnightat 4°C against 2000vol. of 20mM-potassium phos-phate/lOOmM-KCI, pH6.5, before centrifugation.An AN-H rotor with 12mm Kel-F centrepiece cellassembly was used. FC-43 oil provided a visible lowermeniscus. At equilibrium, two to four scans weremade at the slowest scan speed. The data wereanalysed by calculating the cell weight-average andz-average molecular weights and the point averageweight-average molecular weight at 0.15mm inter-vals within the cell. The entire ln(E280) against r2curve was also fitted to a parabola in r2 and it wasdetermined whether the coefficient of the (r2)2 termwas significantly different from zero at a 95% con-fidence level in order to detect curvature.
Sedimentation-velocity experiments were carriedout at 56000rev./min at 20°C in an AN-H rotor anda 12mm Kel-F centrepiece cell assembly. Scans weremade at 8 min intervals until the plateau region van-ished. Sedimentation coefficients were calculatedfrom least-squares slopes of plots of ln(r) againsttime. In addition, the expected plateau protein con-centration, as estimated from the radial square dilu-tion law, was plotted against the actual plateau con-centration as a function of the time of sedimentation.
Sucrose-density-gradient centrifugation. Sedimen-tation coefficients were determined by the method ofMartin & Ames (1961). Sucrose gradients (5-20%,w/v) were formed in 5mM-Tris/HCl/1 mM-EDTA atpH7.5. Bovine haemoglobin (SO,ul of 15mg/ml) andrabbit muscle phosphorylase b (50,ul of 5mg/ml)were used as standards. Centrifugation was carriedout in a Beckman L5-65 ultracentrifuge in aBeckman SW 41 rotor at 1900O0g (at ray 10.93cm)at 4°C for 18-24h. Fractions (0.6ml) were collectedand assayed for phosphorylase b (Cori et al., 1943)and catalytic subunit activity. Haemoglobin was
1976
410
CATALYTIC SUBUNIT OF BOVINE LIVER PROTEIN KINASE
determined from its E411. Sedimentation coefficientsof 8.2S for phosphorylase (Keller & Cori, 1953) and4.6S for haemoglobin (Schachman & Edelstein, 1966)were used to calculate sedimentation coefficients.
Gel filtration. Stokes radii were determined bychromatography on a column (2.6cmx 58 cm) ofSephadex G-100 (superfine grade; void volume107ml) equilibrated with 350mM-potassium phos-phate, pH6.8. Samples (lml) were placed on thecolumn in 350mM-potassium phosphate, pH6.8,containing 10% (w/v) sucrose, and fractions (2-4ml)were collected by downward flow (rate 6ml/h). Thecolumn was standardized with the following proteinsfor which Stokes radii had been calculated by stan-dard equations (see, Siegel & Monty, 1966): bovineserum albumin (Stokes radius 3.5nm; Creeth, 1952);bovine serum albumin dimer (4.75nm; Hughes,1950; Creeth, 1952); soya-bean trypsin inhibitor(2.45 nm; Rackis et al., 1962); bovine pancreas ribo-nuclease (1.92nm; Rothen, 1940); cytochrome c(1.7nm; Margoliash & Lustgarten, 1962); ovalbumin(2.95nm; Kegeles & Gulter, 1951; Castellino &Barker, 1968). Exclusion and inclusion volumes weredetermined with Blue Dextran and BromophenolBlue respectively. All protein standards were appliedto the column separately as described above at aconcentration of 10mg/ml and were determinedspectrophotometrically. Data were plotted by themethod ofLaurent & Killander (1964); see also Siegel& Monty (1966).
Circular dichroism. C.d. spectra of the catalyticsubunit were taken in a Cary 60 spectropolarimeterwith model 6002 CD attachment. The cell tempera-ture was regulated at 25°C by means ofajacketed cellholder and circulating-water bath. Catalytic subunitwas in 20mM-potassium phosphate/100mM-KCl atpH6.5. Cells with path-lengths of 1.0cm for near-u.v.measurements and 0.05cm for far-u.v. measurementswere used. The mean residue weight was taken to be114.9. For each spectrum, two to three scans weremade for the sample and for the baseline. The far-u.v.c.d. spectrum was analysed for the secondary struc-ture content of the catalytic subunit protein by eqn.(1)andthec.d. reference data for the a-helical, f8-formand aperiodic conformation were given by Chen et al.(1974):
[OiA =fJ[6]a+fp,(O0]l +fR[O]R (1)
where [0]k is the equivalent molar ellipticity. Theexperimental [6]A from 243nm to 204nm was usedwith eqn. (1) to estimatef,, the fraction of residues inthe a-helical conformation and fo, the fraction ofresidues in the fl-sheet conformation by using thecriterion of least squares, subject to the constraintthat 1-fa-fe =fR, wherefR is the fraction of residuesin the aperiodic structure.The near-u.v. c.d. spectrum for the catalytic sub-
unit was also recorded in the presence of 20mM-
Vol. 159
potassium phosphate, 100mM-KCl, 0.033mM-ATPand 6mM-magnesium acetate at pH6.5. At thisconcentration of protein (0.81 mg/ml) and ATP(0.033mM), the protein-binding site for ATP-Mg2+was approx. 75% saturated, as estimated from theapparent Km for ATP-Mg2+ and assuming that theapparent Km for ATP was a true dissociation con-stant. The c.d. difference spectra (in terms of molarellipticity) were calculated by using mol.wt. 41700.The observed ellipticity of 0.033 mM-ATP-Mg2+ wasfound to be less than one-tenth of the increase inellipticity observed for the catalytic subunit on addi-tion of the ATP-Mg2+ and therefore the c.d. differ-ence spectrum was not corrected for the ellipticity ofATP-Mg2+ itself.Gel electrophoresis. Sodium dodecyl sulphate/
polyacrylamide-gel electrophoresis was done atpH7.2 in 100mM-sodium phosphate buffer containing0.1 % (w/v) sodium dodecyl sulphate at room tem-perature (21°C) at 6mA/tube. Gels (0.5cmx 11cm;7.5%Y) were prepared by the method of Weber &Osborn (1969) with solutions degassed under vacuumand were pre-electrophoresed at 6mA/tube for 30minbefore use. Electrophoresis was carried out in aBuchler Instruments Division (Fort Lee, NJ 07024,U.S.A.) electrophoresis apparatus. Protein sampleswere heated at 65-70'C in 10mM-sodium phosphate,0.1 % (w/v) sodium dodecyl sulphate, 140mM-2-mercaptoethanol, 10% (v/v) glycerol, 0.002% (w/v)Bromophenol Blue at pH7.2 for 10min and appliedto the gels. Gels were standardized with 10-20,ug ofthe following proteins of known molecular weight:bovine serum albumin (mol.wt. 68000); bovine serumalbumin dimer (mol.wt.136000); pepsin (mol.wt.35000) (see Weber & Osborn, 1969); human trans-ferrin (mol.wt. 88000; Schulze et al., 1955).
Polyacrylamide-gel isoelectric-focusing electro-phoresis was performed by a method similar to thatof Catsimpoolas (1968). To 6.25ml of acrylamide(292g/1) containing methylenebisacrylamide (7.5g/1)the following were added in order: 1.25g of glycerol,lOml of water, 1.25ml of Biolyte 3/10 carrier ampho-lytes (Bio-Rad), 0.5ml of riboflavin 5'-phosphate(0.2g/1) and 6ml of water. Gels (10cm) were over-layered with water and formed overnight in tubes(0.Scmx 11.5 cm) by irradiation under a desk lampwith a fluorescent tube. Electrophoresis was carriedout in a Buchler Instruments Division electrophoresisapparatus. Samples (100pu) were applied in solutionscontaining 25% (w/v) sucrose and overlayered withI00,ul of 20% (w/v) sucrose and l00,ul of 10% (w/v)sucrose. The gel tubes were then filled with 5% (v/v)H3PO4. The upper electrolyte was 5% (v/v) H3PO4and the lower electrolyte was 5% (v/v) ethylenedi-amine. The anode was in the upper reservoir. Electro-phoresis was carried out for 15h at constant voltage(150-200V) in the cold-room with ice-cold watercirculating through the cooling jacket. The lower
411
P. H. SUGDEN, L. A. HOLLADAY, E. M. REIMANN AND J. D. CORBIN
electrolyte was stirred with a magnetic stirrer. Bovinehaemoglobin (1 mg) was applied to a separate gel as acontrol in all electrophoreses. After completion ofelectrophoresis, gels were sliced with a Bio-Radmodel 190 electrophoresis gel slicer, and catalyticsubunit activity was eluted overnight in 200p1 of55mM-potassium phosphate buffer, pH 6.8, contain-ing 0.1mg of bovine serum albumin/ml, 0.1 mm-dithiothreitol. Duplicate gels were sliced and elutedwith 100ul of water for pH determinations with aMI-410 micro-combination pH probe (Microelec-trodes, Grenier Industrial Village, Londonderry,NH 03052, U.S.A.).
Protein was stained by immersion of sodiumdodecyl sulphate/polyacrylamide gels in 0.1 % (w/v)Coomassie Brilliant Blue R-250 in ethanol/aceticacid/water (5:1:5, by vol.) for 1 h. Gels were de-stained in a diffusion destainer (Bio-Rad model 172)in ethanol/acetic acid/water (5:1:5, by vol.). Proteinwas measured at 580nm in an InstrumentationSpecialities Co. model UA-5 absorbance monitorwith a model 659 gel-scanner attachment.Amino acid composition. Amino acid composition
of catalytic subunit (0.5mg) in 80,1 of 350mM-potassium phosphate, pH6.8, was determined in aBeckman model 121 amino acid analyser after a 20hhydrolysis with 6M-HCI (2ml) at 110°C in a sealedtube. Tryptophan content was determined similarlyafter a 22h hydrolysis in 4M-methanesulphonic acid(2ml) at 115°C. Cysteine in catalytic subunit wasdetermined by the method of Rohrbach et al. (1973)in 40mM-sodium acetate/6M-guanidinium hydrochlo-ride, pH 5.1. Under such conditions, E of 4,4'-bis(dimethylaminodiphenylcarbinol) was 113125 litre-mol-' *cm-' at 614nm. Values for v and the extinctioncoefficient of catalytic subunit were calculated fromthe amino acid composition by the methods of Cohn& Edsall (1943a) and data given in Sober (1968).Protein determination. Protein was determined
essentially as described by Lowry et al. (1951), withcrystalline bovine serum albumin as a standard, or bymeasurements of E280.
Results and Discussion
Purification of the catalytic subunit of bovine liverprotein kinaseThe catalytic subunit of cyclic AMP-dependent
protein kinase was purified in high yield essentially bythe method of Reimann & Corbin (1976). The resultsof purification are shown in Table 1.
(i) DEAE-cellulose chromatography. Unless other-wise stated, all operations were carried out at 0-40C.Fresh bovine liver (6kg) was homogenized in aWaringBlendor in 0.25kg batches for five 10s intervals in atotal of 12 litres of10mM-potassium phosphate buffer,pH6.8, containing 1 mM-EDTA and 0.1 mM-dithio-threitol. The homogenate was centrifuged at 100OOg(at ra. = 9.8cm) for 30min. The resulting supernatantwas filtered through glass wool and added to 4 litresof packed DEAE-cellulose (Whatman DE-1 1) equili-brated with homogenization buffer. The resultingslurry was left for 1 h with frequent stirring and wasthen poured into a column (7.5cmx 90cm). Thecolumn was washed with 55mM-potassium phos-phate buffer, pH 6.8, containing 1 mM-EDTA and0.1 mM-dithiothreitol until the E280 of the eluate fell to0.1 (about 55 litres was required). It was then washedwith 12 litres of 45mM-potassium phosphate buffercontaining 0.1 mM-dithiothreitol and 0.1 mM-cyclicAMP at pH 6.8. The flow rate was approx. 1 litre/h.Fractions (30-35 ml) were collected until the E254 ofthe fractions was greater than 1, indicating that cyclicAMP had started to be eluted and elution of thecatalytic subunit was complete.
(ii) Hydroxyapatite chromatography. Fractionscontaining catalytic subunit activity were pooled andapplied by downward flow (flow rate approx.200ml/h) to a column (5cm x 5cm) of hydroxyapatite(Bio-Rad Bio-Gel HTP) previouslywashed repeatedlywith water to remove fines, and equilibrated with50mM-potassium phosphate /0.1 mM-dithiothreitol,pH6.8. The column was washed with 100mM-potassium phosphate/0.1 mM-dithiothreitol, pH6.8(400ml), and eluted with a linear gradient (I litre) of
Table 1. Purification ofcatalytic subunitfrom bovine liver
StepWhole homogenate1OOOOg supernatantDEAE-cellulose chromatography and
elution with cyclic AMPHydroxyapatite chromatography IHydroxyapatite chromatography II
Sephadex G-100 chromatographyHydroxyapatite chromatography III
Volume(ml)18000120007450
40016205
Protein(mg/ml)60410.034
0.0951.920.471.62
Activity(units/ml)
375059806400
1060003088000864000
3000000
Specific activity(units/mg of protein)
63146
188000
1116000160800018380001852000
Yield
(100)10671
63732622
1976
412
CATALYTIC SUBUNIT OF BOVINE LIVER PROTEIN KINASE
100-350mM-potassium phosphate buffer, pH6.8,containing 0.1 mM-dithiothreitol. Fractions (5 ml)were collected and assayed for catalytic subunitactivity, which was eluted at about 200mM-potassiumphosphate, and protein. Fractions containing cata-lytic subunit activity were pooled, diluted 1:1 with5mM - potassium phosphate /0.1 mM - dithiothreitol,pH6.8, and applied to a second hydroxyapatitecolumn (2.6cm x 2cm) equilibrated as describedabove. The column was washed with 350mM-potas-sium phosphate/0.1 mM-dithiothreitol, pH6.8 (30ml),and fractions (0.8 ml) were collected.
(iii) Sephadex G-100 chromatography. Fractionscontaining catalytic subunit activity were pooled andapplied to a column (2.6cmx58cm) of SephadexG-100 (superfine grade) equilibrated with 350mM-potassium phosphate, pH6.8. The flow rate wasabout lOml/h. Fractions (4ml) were collected andthose containing catalytic subunit activity werepooled, diluted with 2vol. of water and applied to acolumn (0.9cm x 1.5cm) of hydroxyapatite (Bio-GelHTP washed as above) equilibrated with 100mM-potassium phosphate, pH6.8. Catalytic subunit waseluted with 350mM-potassium phosphate, pH6.8(20ml), and fractions (1 ml) were collected.The simple method described above is particularly
useful for tissues containing 'type II' protein kinaseisoenzymes (Corbin et al., 1975) that are elutedfrom DEAE-cellulose at relatively high (>0.15M)ionic strengths. Although there is no evidence thatthe catalytic subunits of 'type I' and 'type II' proteinkinase isoenzymes differ (Corbin et al., 1976), the'type I' isoenzyme would not be retained by DEAE-cellulose by the method of purification describedabove. The availability of large quantities of catalyticsubunit should prove useful in investigations of therole of protein phosphorylation in vitro. Studies ofthis type are being done in a number of laboratories.The catalytic subunit could also be used to prepareaffinity columns for purification and binding studiesof protein kinase subunits and protein substrates.
Criteria ofpurity
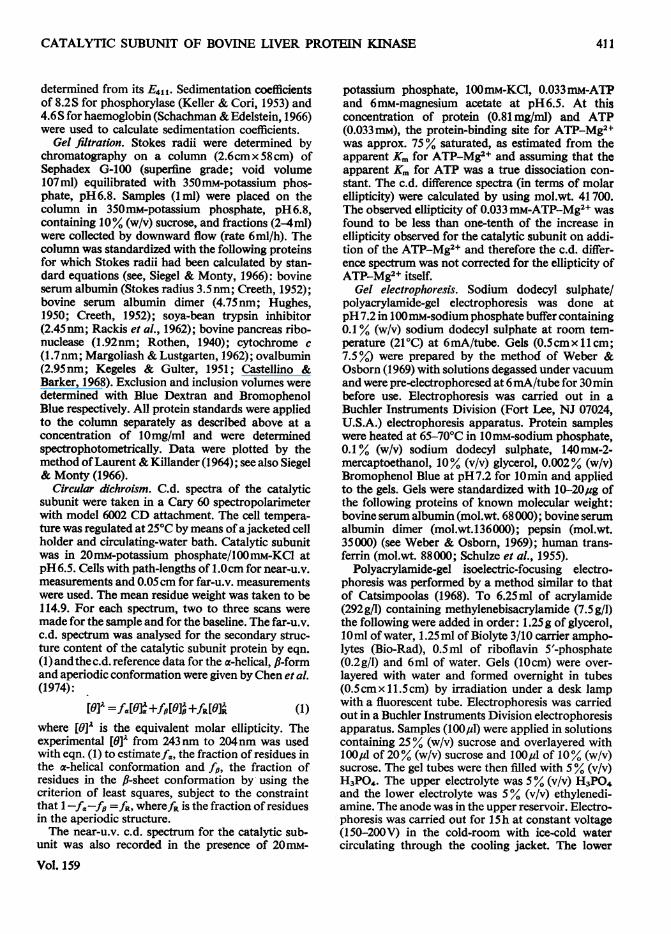
Catalytic subunit migrated as a single band of pro-tein on sodium dodecyl sulphate/polyacrylamide-gel electrophoresis (Fig. 1). From sedimentation-velocity centrifugation, the plateau concentration ofcatalytic subunit was level and decreased with time ofsedimentation strictly according to the radial squaredilution law (see, Bowen, 1970) within experimentalerror (results not shown). The derivative of the E280of the protein boundary was symmetrical throughoutthe experiments (results not shown). Such criteriaindicate monodispersity.By sedimentation-equilibrium centrifugation, both
at 15000 and 28000 rev./min, the catalytic subunitwas monodisperse as judged by two criteria. First,
Vol. 159
the point weight-average molecular weight wasinvariant with increasing concentration. Secondly,for both the high-speed (see, e.g., Fig. 2) and low-speed equilibrium runs, the overall plots of ln(E280)against r2 appeared to be linear within experimentalerror, as judged by the finding that the coefficient ofthe (r2)2 term was not statistically different from zerowhen the data were fitted to a parabola in r2, i.e.ln(E280) = ao+a1r2+a2(r2)2. Further, for the low-speed equilibrium run, the z-average and weight-average molecular weights were equal within experi-mental error.A single symmetrical peak of catalytic subunit
activitywas obtainedafter SephadexG-100 chromato-graphy, hydroxyapatite chromatography or sucrose-density-gradient centrifugation (results not shown).Previous studies have shown that a single symmetricalpeak of activity was eluted on phosphocellulose ion-exchange chromatography of catalytic subunit from
+.
0
x5
I0
(a)
I Transferrin
- Albumin \dimer
/ CatalyticAlbumin subunit
Pepsin
0 0.1 0.2 0.3 0.4
Relative migration0.5
0.4
0.3
LL02
0.5
0.1I
0 1 2 3 4 5 6 7 8 9 10Migration from origin (cm)
Fig. 1. Sodium dodecylsulphate/polyacrylamide-gel electro-phoresis ofcatalytic subunit
Gel electrophoresis of catalytic subunit (Sug) was per-formed as described in the Materials and Methods section.A standard curve of molecular weight against relativemigration (ratio of migration from top of the gel of pro-tein-band front relative to Bromophenol Blue front) wasconstructed (a). From this curve, the molecular weight ofcatalytic subunit was calculated. A scan ofa gel ofcatalyticsubunit (stained and scanned as described in the Materialsand Methods section) is shown in (b). Albumin refers tobovine serum albumin.
413
I.T
P. H. SUGDEN, L. A. HOLLADAY, E. M. REIMANN AND J. D. CORBIN
0
-1
4-2
4- -3
-4
-5
"46
.9
x
0
47 48 49r2 (cm2)
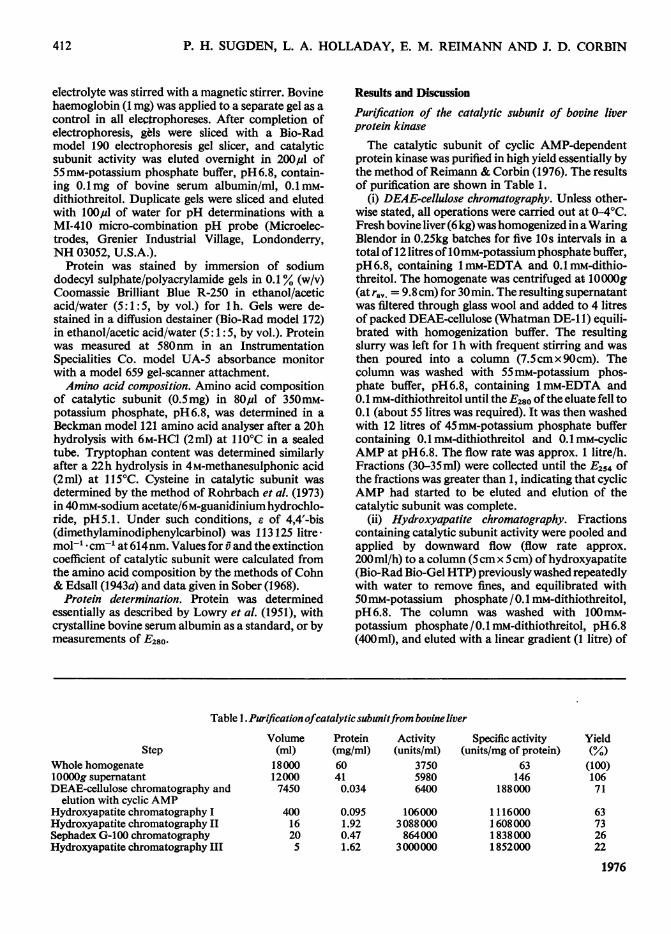
Fig. 2. Sedimentation-equilibrium centrifugation of cata-lytic subunit by the method of Yphantis (1964)
Sedimentation was performed at 28000rev./min and7.1°C. Molecular weight was determined from a plot ofln(E280) against r2 and the least-squares line correspondedto mol.wt. 39592. The error bars represent the S.D. forIn(E28o) at the various values of r2.
6 1 1 16 21 26 31 36 41
Sliceno.
10
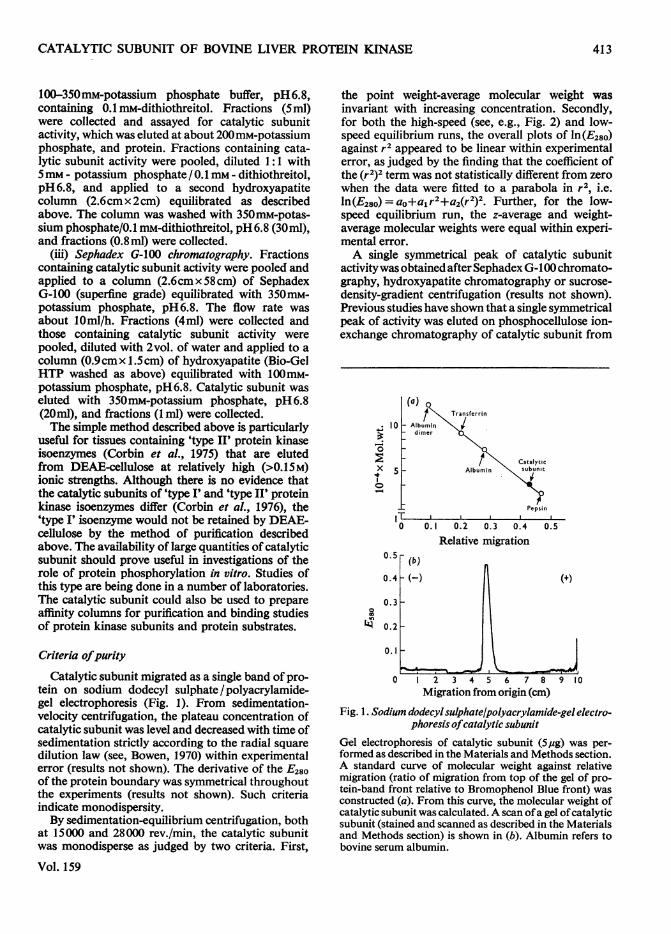
Fig. 3. Polyacrylamide-gel isoelectric focusing of catalyticsubunit
Samples (25-50,ug) of catalytic subunit were applied togels and electrophoresed as described in the Materials andMethods section. Gels were sliced and catalytic subunitactivity (o) and pH (0) in the slices determined asdescribed in the Materials and Methods section. Slice 1is the top (anode end) of the gel and slice 47 is the bottom(cathode end) of the gel.
rat tissues (Corbin et at., 1976). Thus the catalyticsubunit appeared to be monodisperse by thesecriteria.
Polyacrylamide-gel isoelectric focusingThree major bands ofcatalytic subunit activity were
resolved by polyacrylamide-gel isoelectric focusing(Fig. 3). The pI value for each peak, with activity aspercentage of total activity recovered in parentheses,was 6.72 (20 %), 7.04 (33 %) and 7.35 (36 %). Preincu-bation of catalytic subunit with 70mM-potassiumphosphate, 2mM-ATP and 20mM-magnesium acetateatroom temperature for 1 h before isoelectric focusingdid not significantly alter the activity profile (resultsnot shown). Since the catalytic subunit isoenzymesdiffered in pl values by less than 0.6pH unit, they maydiffer only slightly in their amino acid composition.Because the enzyme was monodisperse by other cri-teria (see above) any difference in molecular weightsof the isoenzymes must be small. The significance, ifany, of these multiple catalytic subunit isoenzymesin vivo is not known, although they may differ inprotein substrate specificity or some other importantproperty.
Stability ofcatalytic subunitCatalytic subunit activity was stable for at least
3 months when stored in 350mM-potassium phos-phate buffer, pH6.8, at 4°C. However, on storage,it was noticed that the enzyme no longer migrated asa single protein on sodium dodecyl sulphate/poly-acrylamide-gel electrophoresis, but that one or twofaint bands of higher molecular weight appeared(results not shown). Such bands disappeared after
Sephadex G-100 chromatography and are thought tobe caused by polymerization of the catalytic subunitinto higher-molecular-weight forms. At low catalyticsubunit (<5,cg/ml) and/or phosphate (<50mM) con-centrations, the enzyme was,relatively unstable andwas assayed as rapidly as possible after dilution.
Reassociation of catalytic subunit with regulatorysubunit
Catalytic subunit reassociated with and was inhi-bited by the freshly prepared regulatory subunit ofprotein kinase from bovine liver (see, Sugden &Corbin, 1976).
Physical propertiesThe physical properties of the catalytic subunit are
shown in Table 2.(i) Molecular weight by sedimentation-equilibrium
centrifugation. From the slope of the plot of ln(E280)against r2 for the meniscus-depletion experiment at28000rev./min (Fig. 2), a value for mol.wt. of 39592was obtained. From the sedimentation-equilibriumdata obtained at 15000rev./min, a value of43 796 wascalculated by eqn. (2) (see Van Holde & Baldwin,1958):
A, cell, mass = Cb 1-2I 1 (2)where A7f, is weight-average molecular weight, Ca isprotein concentration at upper meniscus, Cb is proteinconcentration at lower meniscus, CO is initial proteinconcentration, a is radial distance to upper meniscus,b is radial distance to lower meniscus and A is
1976
414
CATALYTIC SUBUNIT OF BOVINE LIVER PROTEIN KINASE4
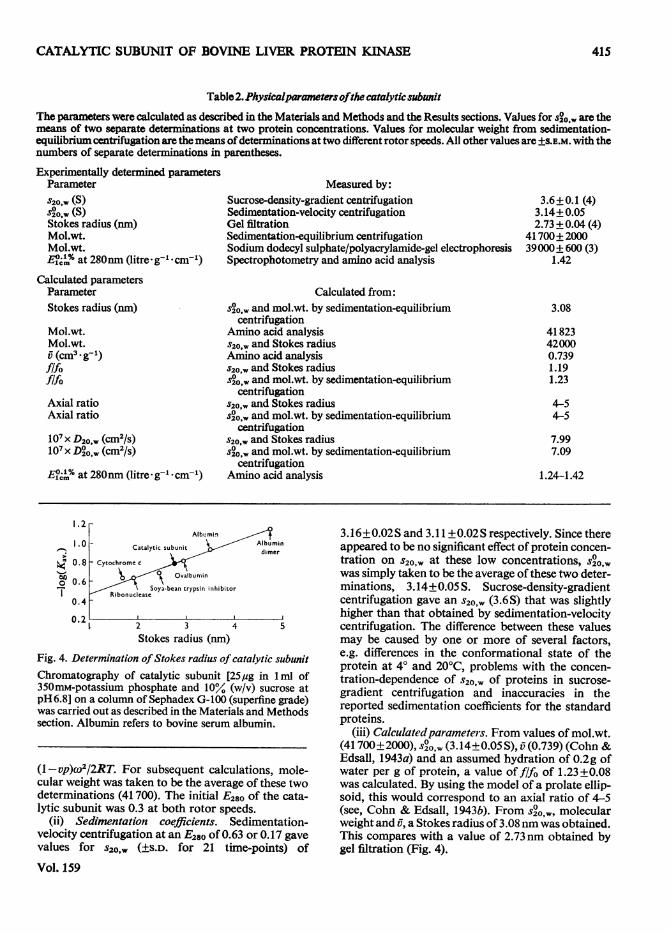
Table2.Physicalparametersofthe catalytic subnitThe parameters were calculated as described in the Materials and Methods and the Results sections. Values for s%,w are themeans of two separate determinations at two protein concentrations. Values for molecular weight from sedimentation-equilibrium centrifugation are the means ofdeterminations at two different rotor speeds. All other values are ±S.E.M. with thenumbers of separate determinations in parentheses.
Experimentally determined parametersParameters20,w (S)S%,v (S)Stokes radius (nm)Mol.wt.Mol.wt.E?,2l'o at 280nm (litre- g- cmn1)
Measured by:Sucrose-density-gradient centrifugationSedimentation-velocity centrifugationGel filtrationSedimentation-equilibrium centrifugationSodium dodecyl sulphate/polyacrylamide-gel electrophoresisSpectrophotometry and amino acid analysis
3.6+0.1 (4)3.14±0.052.73+0.04 (4)
41700±200039000+600 (3)
1.42
Calculated parametersParameterStokes radius (nm)
Mol.wt.Mol.wt.V (Cm3 -g1)flfofifoAxial ratioAxial ratio
107x D20,, (cm2/s)107 x D%O. (cm2/s)
EI1X/o at 280nm (litre*g- l.cmn1)
Calculated from:S2o%w and mol.wt. by sedimentation-equilibrium
centrifugationAmino acid analysiss20,w and Stokes radiusAmino acid analysiss20ow and Stokes radiuss20,w and mol.wt. by sedimentation-equilibrium
centrifugations20,w and Stokes radiuss20,w and mol.wt. by sedimentation-equilibrium
centrifugations2o,w and Stokes radiuss2%.w and mol.wt. by sedimentation-equilibrium
centrifugationAmino acid analysis
bO
0.6
0.4
Albumin / t
Catalytic subunit diAbminCytochrome c
i Ovalbumin
Soya-bean trypsin inhibitorRibonuclease
W. A.1 2 3 4 5Stokes radius (nm)
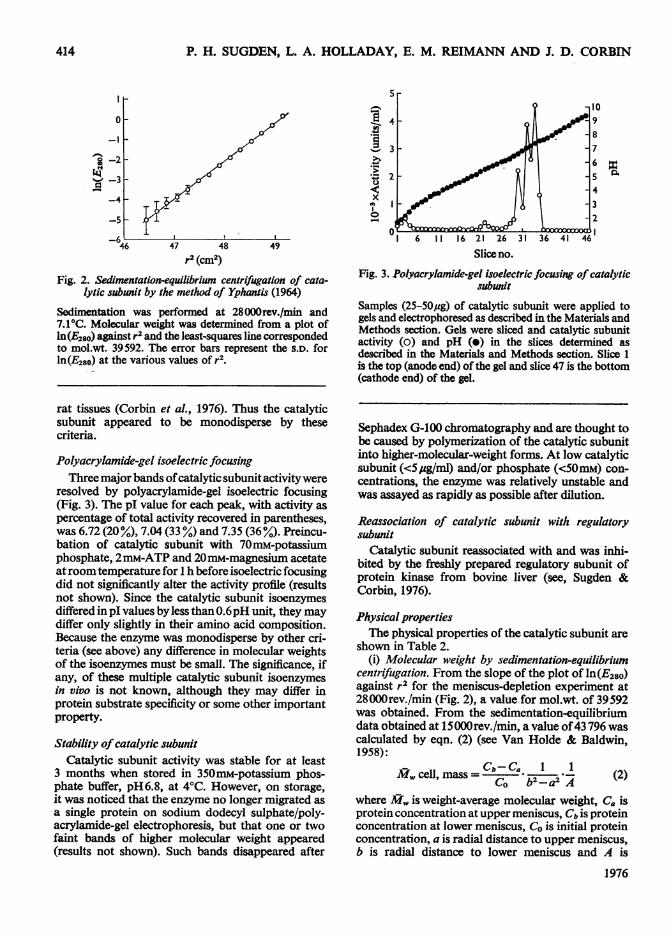
Fig. 4. Determination of Stokes radius ofcatalytic subunitChromatography of catalytic subunit [25,ug in 1ml of350mM-potassium phosphate and 10% (w/v) sucrose atpH6.8] on a column of Sephadex G-100 (superfine grade)was carried out as described in the Materials and Methodssection. Albumin refers to bovine serum albumin.
(1 -vp)w2/2RT. For subsequent calculations, mole-cular weight was taken to be the average of these twodeterminations (41700). The initial E280 of the cata-lytic subunit was 0.3 at both rotor speeds.
(ii) Sedimentation coefficients. Sedimentation-velocity centrifugation at an E280 of 0.63 or 0.17 gavevalues for s20oW (±S.D. for 21 time-points) of
Vol. 159
3.16±0.02S and 3.11 ±0.02S respectively. Since thereappeared to be no significant effect of protein concen-tration on S20,w at these low concentrations, s20,wwas simply taken to be the average of these two deter-minations, 3.14±0.05S. Sucrose-density-gradientcentrifugation gave an s20o, (3.6S) that was slightlyhigher than that obtained by sedimentation-velocitycentrifugation. The difference between these valuesmay be caused by one or more of several factors,e.g. differences in the conformational state of theprotein at 40 and 20°C, problems with the concen-tration-dependence of s20,w of proteins in sucrose-gradient centrifugation and inaccuracies in thereported sedimentation coefficients for the standardproteins.
(iii) Calculatedparameters. From values of mol.wt.(41700±2000), soo,, (3.14±0.05S), v (0.739) (Cohn &Edsall, 1943a) and an assumed hydration of 0.2g ofwater per g of protein, a value of flfo of 1.23±0.08was calculated. By using the model of a prolate ellip-soid, this would correspond to an axial ratio of 4-5(see, Cohn & Edsall, 1943b). From s ,w, molecularweight and v, a Stokes radius of 3.08nm was obtained.This compares with a value of 2.73nm obtained bygel filtration (Fig. 4).
3.08
41823420000.7391.191.23
4-54-5
7.997.09
1.24-1.42
415
.2
.o II
P. H. SUGDEN, L. A. HOLLADAY, E. M. REIMANN AND J. D. CORBIN
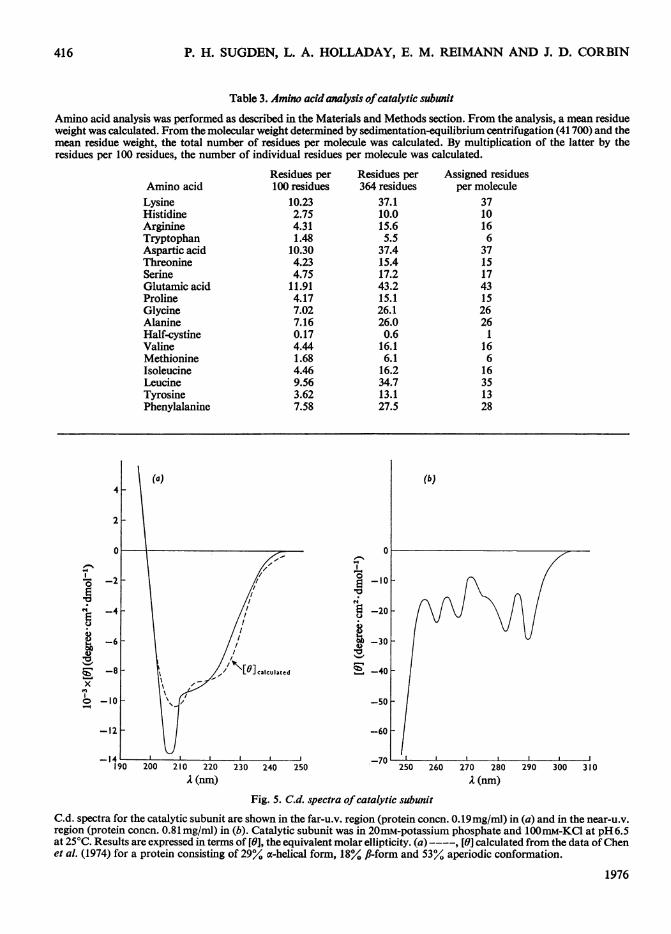
Table 3. Amino acid analysis ofcatalytic subunit
Amino acid analysis was performed as described in the Materials and Methods section. From the analysis, a mean residueweight was calculated. From the molecular weight determined by sedimentation-equilibrium centrifugation (41 700) and themean residue weight, the total number of residues per molecule was calculated. By multiplication of the latter by theresidues per 100 residues, the number of individual residues per molecule was calculated.
Residues per Residues per Assigned residuesAmino acid 100 residues 364 residues per moleculeLysine 10.23 37.1 37Histidine 2.75 10.0 10Arginine 4.31 15.6 16Tryptophan 1.48 5.5 6Aspartic acid 10.30 37.4 37Threonine 4.23 15.4 15Serine 4.75 17.2 17Glutamic acid 11.91 43.2 43Proline 4.17 15.1 15Glycine 7.02 26.1 26Alanine 7.16 26.0 26Half-cystine 0.17 0.6 1Valine 4.44 16.1 16Methionine 1.68 6.1 6Isoleucine 4.46 16.2 16Leucine 9.56 34.7 35Tyrosine 3.62 13.1 13Phenylalanine 7.58 27.5 28
4 |l (a) (b)4-
2-
0 0
/~~~~'0 -2 -/a-10
-~4 -20-
-6 --30-
. -8 [0]calculated -40x
o6 -10 -50
-12 --60-
-14 -70190 200 210 220 230 240 250 250 260 270 280 290 300 310
A (nm) A (nm)
Fig. 5. C.d. spectra of catalytic subunit
C.d. spectra for the catalytic subunit are shown in the far-u.v. region (protein concn. 0.19mg/mi) in (a) and in the near-u.v.region (protein concn. 0.81 mg/ml) in (b). Catalytic subunit was in 20mM-potassium phosphate and l00mM-KCl at pH 6.5at 25°C. Results are expressed in terms of [0], the equivalent molar ellipticity. (a) ----, [9] calculated from the data of Chenet al. (1974) for a protein consisting of 29%Y a-helical form, 18%. fl-form and 53%4 aperiodic conformation.
1976
416

CATALYTIC SUBUNIT OF BOVINE LIVER PROTEIN KINASE
From the s20,, value from sucrose-gradient-centri-fugation, the Stokes radius from gel filtration (Fig. 4)and v, the molecular weight, flfo and axial ratio maybe calculated (see, Cohn & Edsall, 1943b; Siegel &Monty, 1966). Such parameters showed close simi-larity to the parameters obtained by sedimentation-equilibrium and -velocity centrifugation. The mol-ecular weight calculated from sucrose-density-gradient-centrifugation and gel-filtration data agreedclosely with that obtained by sedimentation-equili-brium centrifugation, supporting the validity of thetechnique of Siegel & Monty (1966).
Physical properties of the catalytic subunit (Table2) were similar to those obtained previously for thebovine heart catalytic subunit (Erlichman et al.,1973; see also, Rubin & Rosen, 1975). Comparisonof molecular-weight data from sodium dodecyl sul-phate/polyacrylamide-gel electrophoresis and othertechniques indicate that the catalytic subunit, as iso-lated, was a monomer.
Amino acid analysis
Amino acid analysis ofcatalytic subunit is shown inTable 3. No glucosamine or galactosamine was de-tected. By the method of Rohrbach et al. (1973), itwas shown that catalytic subunit contained 1.09molof thiol group/mol of enzyme and on this basis avalue of 1 cysteine residue/molecule was assigned.Such an analysis did not preclude the possibility thatthe enzyme contained a cystine residue(s), since alarge loss could have occurred during analysis.From the amino acid analysis, a value of
0.739 cm3* g-1 was calculated for v [see Cohn &Edsall(1943a) and Table 2].Avalue ofE0C"/o at 280nm(Table2) was calculated from data in Sober (1968) and theamino acid composition. The value of 1.24 litre *g-1cm-l was calculated by assuming that all aromaticresidues were exposed to the aqueous solvent, and avalue of 1.42 litre - g-1 *cm-' was calculated by assum-ing that all aromatic residues were not exposed tosolvent (taken from spectral data for amino acids inethanol).
Extinction coefficient of catalytic subunit
A value of 1.42 litre g- -cm-' was obtained forEu"/o at280nm. Protein concentration was calculatedfrom the amino acid composition after measuringalanine, glycine, asparagine and glutamine residues.The empirical value of E'-,"/o agrees closely with thecalculated value (see above).
Circular dichroism
The far- and near-u.v. c.d. spectra of the catalyticsubunit are shown in Fig. 5. The dashed curve in Fig.5(a) gives the calculated spectrum for f, =0.29,Vol. 159
f., = 0.18 andfR = 0.53. The root mean square deriva-tion between the experimental and theoretical curveswas 1171 degree cm2 dmol-1. The catalytic subunitthus appears to have a considerable amount of secon-dary structure. In general, the fit of the least-squarestheoretical spectrum was fairly good, except for the204-210nm region. The disparity between experi-mental and theoretical curves in this area may resultfrom the far-u.v. c.d. of the aromatic chromophores.With 13% of the residues being tryptophan, tyrosineand phenylalanine residues, the combined contribu-tion of the aromatic residues to the far-u.v. c.d. spec-trum of the catalytic subunit could be as large as2000-3000 degree cm2 dmol-l in the 200-220nmwavelength region (Sears & Beychock, 1973; Holla-day & Puett, 1976). This contribution may wellaccount for some of the lack of fit between the calcu-lated and the theoretical c.d. spectra.The near-u.v. c.d. spectrum (Fig. Sb) appears to
have contributions from tryptophan residues (peaksat 283 and 290nm) and phenylalanine residues (peaksat 260 and 267nm). The peak at 290nm indicates thatat least some of the tryptophan residues are in arelatively hydrophilic environment. If each of thefive or six tryptophan residues contributes equallyto the 290nm peak, a value of about -1900 degreecm2 dmol-' for each tryptophan residue results. In
1-%
-4
'0e~IO
'0 1
<>, -20
x
0n-30
250 260 270 280 290 300 310A (n)
Fig. 6. C.d. difference spectrum for catalytic subunit in thepresence ofATP-Mg2+
The c.d. difference spectrum was calculated by subtractionof the c.d. spectrum in Fig. 5(b) from that of catalytic sub-unit in the presence of 0.033nM-ATP and 6mM-magne-sium acetate, and multiplying by the number ofresidues togive A[O] in molecular ellipticity.
0
417

P. H. SUGDEN, L. A. HOLLADAY, E. M. REIMANN AND J. D. CORBIN
absolute magnitude, this value is about twice thatobserved for tryptophan residues in short peptides(Holladay et al., 1976). The 13 tyrosine residues donot appear to contribute appreciably to the spectrumin the 260-285nm region.The c.d. difference spectrm resulting from the
addition of ATP-Mg2+ to the catalytic subunit isshown in Fig. 6. The spectrurm was not corrected forthe spectrum ofATP-Mg2+ alone since the contribu-tion to 10] was small. There is a complete lack ofsimi-larityin the dfference spectrum to thec.d. spectrumofATP-Mg2+ (Heyn & Bretz, 1975). At least part of theinaease in ellipticity between 260 and 285nm whichoccurred on binding ATP-Mg+ may result from oneor mnore tyrosine residues. The changes observed inthe spectrum in the 300-285nm wavelength region onATP-Mg2+ binding are small. These results suggestthat the orientation andfor environment of tyrosine
and phenylalanine residues are more affected bybinding of ATP-Mg2+ than are tryptophan residues.
Inhibition ofcatalytic subunit by thiol-specific reagents
Because amino acid analysis indicated I mol ofcysteine/mol of enzyme, it was decided to investigatewhether that residue was essential for enzymic acti-vity. It was found that catalytic subunit was inhibitedby iodoacetamide (Fig. 7a). Similar results were ob-served with the other thiol.specific reagents p-hydroxymercuribenzoate and N-ethylmaleimide (re-sults not shown). Histone F2b was used as substrate inthis series ofexperiments, since it does not contain freethiol groups (Iwai et al., 1970) and hence problems ofthiol-specific reagents alkylating the substrate may beavoided. Inhibition was dependent both on time andinhibitor concentration. Similar results (not shown)were obtained when the substrate was protamine,which also does not contain free thiol groups (Ando& Watanabe, 1969). ATP-Mg2+ partially protectedcatalytic subunit activity against inhibition by iodo-acetamide (Fig. 7b) or N-ethylmaleimide (results notshown), Mg2+ or ATP plus EDTA did not protectsignificantly. Such results indicate that binding ofATP-Mg2+ to the enzyne prevents access of thiol-specific reagents to the sesitive thiol group either bya conformational change in the enzyme structum or
Fig. 7. Inhibition of catalytic subunit activity by iodoacet-amide andprotection against inhibition by iodoacetamide by
ATP-Mgz+(a) Catalytic subunit (5kg) was preincubated at OC inlOniM-Tris/HCI, pH8.5, containing the following con-centrations of iodoacetamide: O.5mM (A), 2.5mM (E),5mM (*) and 12.5mM (A). The final volume was 2ml. A
30 control in the absene of iodoaoeetmide was run con-currently (o). After each of the indicated preincubationtimes, a sample (20pd) was withdrawn and assayed forcatalytic subunit activity by incubation for 5min at 300Cwith a 50u1 sample containing 24mM-potassium phos-phate, 8.4mM-magnesium acetate, 0.35mM-[y-32P]ATP(specific radioactivity 20-30c.p.m./pmol) and 0.5mg ofhistone F2b at pH6.8. The incorporation of 32p into his-tone was determined as described in the Materials andMethods section. Activity is expressed as a percentage ofazero-time control perforned in the absence of inhibitor.
0 0(b) Catalytic subunit (l.254g) was preincubated at WCwith 1OmM-Tris/HCI and 12.5m-iodoacetamie atp118.5 containing 0.IlM-ATP and lOmim-magnesiumnacetate (o), 0.1mm-ATP and lmm-EDTA (l) or 10mm-magnesium acetate (0); A, no addition. The final volumewas 0.5ml. After each indicated preincubation time, asample (20,u1) was withdrawn and assayed for catalyticsubunit activity as described in (a). Results are expressed
__J as a percentage of the appropriate controls preincubated30 at 0OC for the same timne and with the same additions as
the tests but in the absence of iodoacetamide.
1976
I-0
.-40a)
. 0
15
Incubation time (min)
418
CATALYTIC SUBUNIT OF BOVINE LIVER PROTEIN KINASE
14
(b) 0
N
0 8 o
0.2 0.4 0.6 0.8 1.0 ° 50 lZ 150 2040
2 ~~~~~~~~~~~~~~~~~2
0 0.2 0.4 0.6 0.8 1.0 0 50 100 50O 200
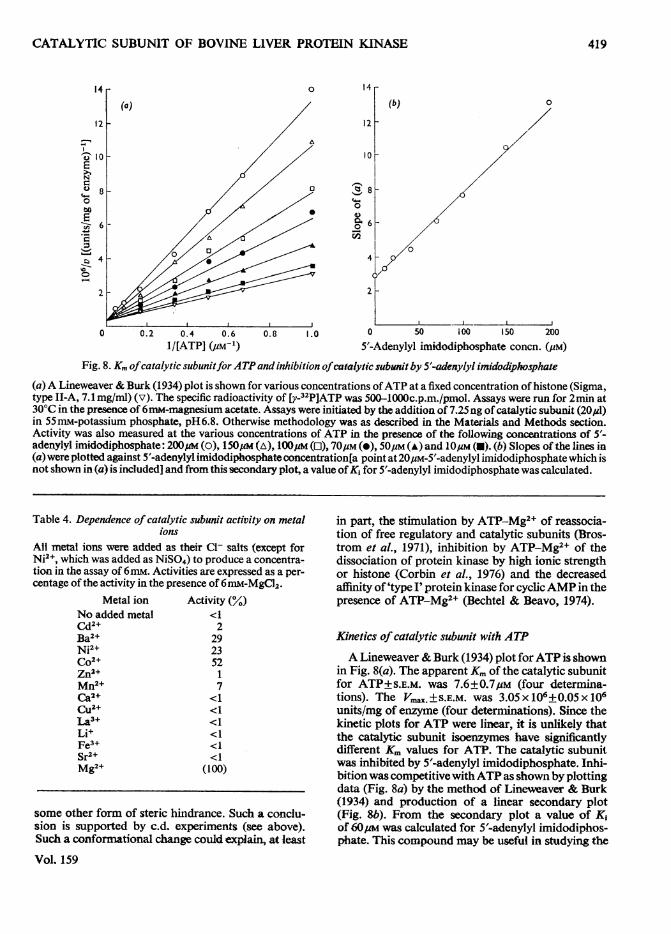
1/[ATP] (pM-') 5'-Adenylyl imidodiphosphate concn. (pM)Fig. 8. Km ofcatalytic subunitfor ATPand inhibition ofcatalytic subunitby 5'-adenylyl imidodiphosphate
(a)A Lineweaver & Burk (1934) plot is shown for various concentrations ofATP at a fixed concentration of histone (Sigma,type 1I-A, 7.1 mg/ml) (v). The specific radioactivity of [y-32P]ATP was 500-1000c.p.m./pmol. Assays were run for 2min at30°C in the presence of 6mM-magnesium acetate. Assays were initiated by the addition of 7.25ng of catalytic subunit (20p1)in 55mM-potassium phosphate, pH6.8. Otherwise methodology was as described in the Materials and Methods section.Activity was also measured at the various concentrations of ATP in the presence of the following concentrations of 5'-adenylyl imidodiphosphate: 200um (o), 150pM (A), 100pM (O), 70uM (e), 50,M (A) and 10/4M (U). (b) Slopes of the lines in(a) were plotted against 5'-adenylyl imidodiphosphateconcentration[a point at 20pM-5'-adenylyl imidodiphosphate which isnot shown in (a) is included] and from this secondary plot, a value ofK, for 5'-adenylyl imidodiphosphate was calculated.
Table 4. Dependence of catalytic subunit activity on metalions
All metal ions were added as their Cl- salts (except forNi2+, which was added as NiSO4) to produce a concentra-tion in the assay of 6nim. Activities are expressed as a per-centage of the activity in the presence of 6mM-MgCI2.
Metal ionNo added metalCd2+Ba2+Nj2+Ni2+Co2+Zn2+Mn24Ca2+4C&+14a3+Li+Fe3+Sr2+Mg2+
Activity (Y.)<12
29235217
<1<1<1<1<1<1
(100)
some other form of steric hindrance. Such a conclu-sion is supported by c.d. experiments (see above).Such a conformational change could explain, at least
Vol. 159
in part, the stimulation by ATP-Mg2+ of reassocia-tion of free regulatory and catalytic subunits (Bros-trom et al., 1971), inhibition by ATP-Mg2+ of thedissociation of protein kinase by high ionic strengthor histone (Corbin et al., 1976) and the decreasedaffinity of 'type I' protein kinase for cyclicAMP in thepresence of ATP-Mg2+ (Bechtel & Beavo, 1974).
Kinetics of catalytic subunit with ATP
A Lineweaver & Burk (1934) plot forATP is shownin Fig. 8(a). The apparent Km of the catalytic subunitfor ATP±S.E.M. was 7.6±0.7/uM (four determina-tions). The VUax.±S.E.M. was 3.05x10⁶+0.05x10⁶units/mg of enzyme (four determinations). Since thekinetic plots for ATP were linear, it is unlikely thatthe catalytic subunit isoenzymes have significantlydifferent Km values for ATP. The catalytic subunitwas inhibited by 5'-adenylyl imidodiphosphate. Inhi-bition was competitive withATP as shown by plottingdata (Fig. 8a) by the method of Lineweaver & Burk(1934) and production of a linear secondary plot(Fig. 8b). From the secondary plot a value of K,of 60 was calculated for 5'-adenylyl imidodiphos-phate. This compound may be useful in studying the
419
P. H. SUGDEN, L. A. HOLLADAY, E. M. REIMANN AND J. D. CORBIN
0
0
rj,
x
0
241
1,
0
4-
4.&*_!4-
0 2 4 6 8 10 12[10-6 x v]/S (units/ml permg ofhistone
permg ofenzyme)Fig. 9. Eadie (1942) plot for catalytic subunit at various
histone concentrations
Methodology was generally similar to that described inFig. 8(a) in the absence of 5'-adenylyl imidodiphosphate.Mixed histone (Sigma, type II-A) was the substrate. The[y-32P]ATP concentration was 0.25mM and the specificradioactivity was 100-200c.p.m./pmol.
binding properties of the catalytic subunit and alsoin affinity chromatography.
0 0.001 0.01 0.1 .0 10.0
Lubrol PX or Triton X-100 concn. (% w/v)or urea concn. (M)
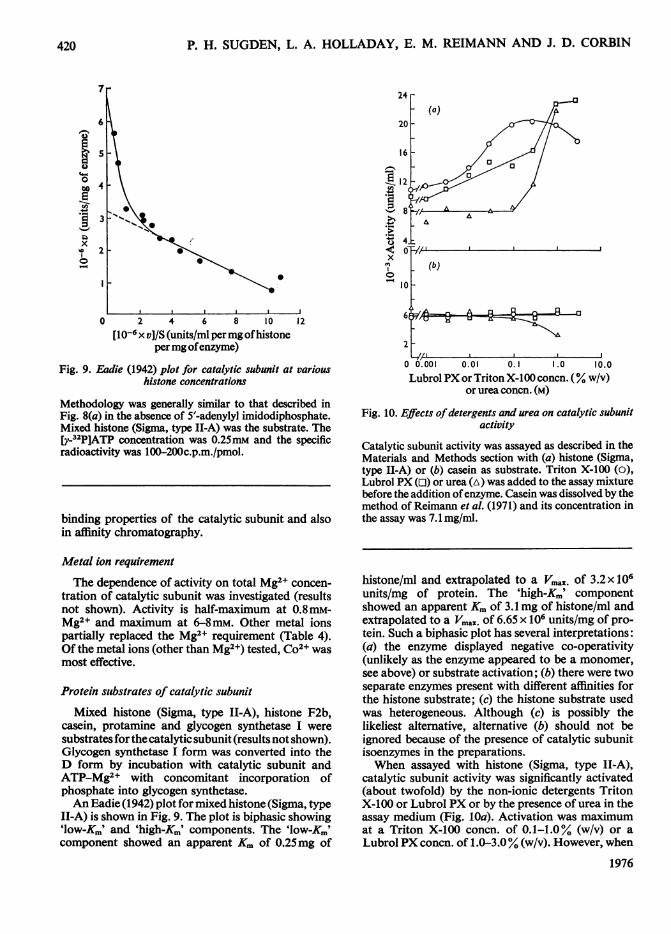
Fig. 10. Effects ofdetergents and urea on catalytic subunitactivity
Catalytic subunit activity was assayed as described in theMaterials and Methods section with (a) histone (Sigma,type II-A) or (b) casein as substrate. Triton X-100 (o),Lubrol PX (o) or urea (A) was added to the assay mixturebefore the addition ofenzyme. Casein was dissolved by themethod of Reimann et al. (1971) and its concentration inthe assay was 7.1 mg/ml.
Metal ion requirement
The dependence of activity on total Mg2+ concen-tration of catalytic subunit was investigated (resultsnot shown). Activity is half-maximum at 0.8mM-Mg2+ and maximum at 6-8mM. Other metal ionspartially replaced the Mg2+ requirement (Table 4).Of the metal ions (other than Mg2+) tested, Co2+ wasmost effective.
Protein suibstrates of catalytic subunit
Mixed histone (Sigma, type II-A), histone F2b,casein, protamine and glycogen synthetase I weresubstrates forthe catalytic subunit (results not shown).Glycogen synthetase I form was converted into theD form by incubation with catalytic subunit andATP-Mg2+ with concomitant incorporation ofphosphate into glycogen synthetase.An Eadie (1942) plot for mixed histone (Sigma, type
II-A) is shown in Fig. 9. The plot is biphasic showing'low-K.' and 'high-Km' components. The 'low-Ki'component showed an apparent Km of 0.25mg of
histone/ml and extrapolated to a V,,,.. of 3.2 x10⁶units/mg of protein. The 'high-Ki' componentshowed an apparent Km of 3.1 mg of histone/ml andextrapolated to a Vmax. of 6.65 x 10⁶ units/mg of pro-tein. Such a biphasic plot has several interpretations:(a) the enzyme displayed negative co-operativity(unlikely as the enzyme appeared to be a monomer,see above) or substrate activation; (b) there were twoseparate enzymes present with different affinities forthe histone substrate; (c) the histone substrate usedwas heterogeneous. Although (c) is possibly thelikeliest alternative, alternative (b) should not beignored because of the presence of catalytic subunitisoenzymes in the preparations.When assayed with histone (Sigma, type II-A),
catalytic subunit activity was significantly activated(about twofold) by the non-ionic detergents TritonX-100 or Lubrol PX or by the presence of urea in theassay medium (Fig. 10a). Activation was maximumat a Triton X-100 concn. of 0.1-1.0% (w/v) or aLubrol PX concn. of 1.0-3.0% (w/v). However, when
1976
420
CATALYTIC SUBUNIT OF BOVINE LIVER PROTEIN KINASE 421
catalytic subunit was assayed with casein as substrate,no stimulation of activity was observed (Fig. lOb).Such an observation is technically important, sincesome investigators have used histone (Sigma, typeII-A) as substrate and Triton X-100 to solubilizecatalytic subunit bound to particulate fractions(Korenman et al., 1974). An activation of proteinkinase-catalysed histone phosphorylation by NaClhas been observed (Corbin etal., 1972). It is suggestedthat these agents (detergents, urea, NaCI) alter his-tone conformation so as to increase its rate ofphosphorylation.
Note Added in Proof (Received 9 September 1976)
Since completion of the c.d. experiments in thepresence of ATP-Mg2+, it has been discovered thatthe catalytic subunit may possess ATPase activity.In the c.d. experiments, it is possible that a con-siderable proportion of the ATP may be hydrolysedto ADP. Although this does not materially affect theexperimental conclusions, it should be noted thatchanges in the c.d. spectra may be being caused bythe binding of ATP-Mg2+ and/or ADP.
We thank Miss Lila Clack for performing amino acidanalyses, Dr. Roger A. Johnson for purification of 5'-adenylyl imidodiphosphate, Dr. Thomas R. Soderlingfor performing the experiments of glycogen synthetase,and Dr. Charles R. Park for his interest and encourage-ment. This work was supported by Research GrantsAM 15988 and 15611 from the National Institutes ofHealth, United States Public Health Service. P. H. S.acknowledges the receipt of a U.K. Science ResearchCouncil-NATO Post-doctoral Fellowship. J. D. C. is aninvestigator ofthe Howard Hughes Medical Institute.
References
Ando, T. & Watanabe, S. (1969) Int. J. Protein Res. 1,221-224
Bechtel, P. J. & Beavo, J. A. (1974) Fed. Proc. Fed. Am.Soc. Exp. Biol. 33, 1362
Bowen, T. J. (1970) An Introduction to Ultracentrifugation,pp. 138-140, Wiley-Interscience, London, New York,Sydney and Toronto
Brostrom, C. O., Corbin, J. D., King, C. A. & Krebs,E. G. (1971)Proc. Natl. Acad. Sci. U.S.A. 68,2444-2447
Castellino, F. J. & Barker, R. (1968) Biochemistry 7,2207-2217
Catsimpoolas, N. (1968) Anal. Biochem. 26, 480-482Chen, Y.-H., Yang, J. T. & Chau, K. H. (1974) Bio-
chemistry 13, 3350-3359Cohn, E. J. & Edsall, J. T. (1943a) Proteins, Amino Acidsand Peptides as Ions and Dipolar Ions, pp. 370-375,Reinhold Publishing Corp., New York
Cohn, E. J. & Edsall, J. T. (1943b) Proteins, Amino Acidsand Peptides as Ions and Dipolar Ions, pp. 424-425,Reinhold Publishing Corp., New York
Corbin, J. D. & Reimann, E. M. (1974) Methods Enzymol.38, 287-299
Corbin, J. D., Brostrom, C. O., Alexander, R. L. &Krebs,E. G. (1972) J. Biol. Chem. 247, 3736-3743
Corbin, J. D., Keely, S. L. & Park, C. R. (1975) J. Biol.Chem. 250, 218-225
Corbin, J. D., Soderling, T. R., Sugden, P. H., Keely, S. L.& Park, C. R. (1976) in Eukaryotic Cell Function andGrowth: Regulation by Intracellular Cyclic Nucleotides(Dumont, J. E., Brown, B. & Marshall, N., eds.),Plenum Press, New York, in the press
Con, C. F., Cori, G. T. & Green, A. A. (1943) J. Biol.Chem. 151, 39-55
Creeth, J. M. (1952) Biochem. J. 51, 10-17Eadie, G. S. (1942) J. Biol. Chem. 146, 85-93Erlichman, J., Rubin, C. S. & Rosen, 0. M. (1973)J. Biol.
Chem. 248, 7607-7609Glynn, I. M. & Chappell, J. B. (1964) Biochem. J. 90,
147-149Heyn, M. P. & Bretz, R. (1975) Biophys. Chem. 3, 35-45Holladay, L. A. & Puett, D. (1976) Biopolymers 15,43-59
Holladay, L. A., Savage, C. R., Jr., Cohen, S. & Puett, D.(1976) Biochemistry 15, 2624-2633
Hughes, W. L., Jr. (1950) Cold Spring Harbor Symp.Quant. BioL 14, 79-84
Iwai, K., Ishikawa, K. & Hayashi, H. (1970) Nature(London) 226, 1056-1058
Johns, E. W. (1964) Biochem. J. 92, 55-59Keely, S. L., Corbin, J. D. & Park, C. R. (1975) J. Biol.
Chem. 250, 4832-4840Kegeles, G. & Gulter, F. J. (1951) J. Am. Chem. Soc. 73,
3770-3777Keller, P. J. & Cori, G. T. (1953) Biochim. Biophys. Acta
12, 235-238Korenman, S. G., Bhalla, R. C., Sanborn, B. M. &
Stevens, R. H. (1974) Science 183, 430432Krebs, E. G. (1972) Curr. Top. Cell. Regul. 5, 99-133Laurent, T. C. & Killander, J. (1964) J. Chromatogr. 14,
317-330Lineweaver, H. & Burk, D. (1934) J. Am. Chem. Soc. 56,
658-666Lowry, 0. H., Rosebrough, N. J., Farr, A. L. & Randall,
R. J. (1951) J. Biol. Chem. 193, 265-275Margoliash, E. & Lustgarten, J. (1962) J. Biol. Chem. 237,3397-3405
Martin, R. G. & Ames, B. N. (1961) J. Biol. Chem. 236,1372-1379
Rackis, J. J., Sasame, H. A., Mann, R. K., Anderson, R. L.& Smith, A. K. (1962) Arch. Biochem. Biophys. 98,471478
Reimann, E. M. & Corbin, J. D. (1976) Fed. Proc. Fed.Am. Soc. Exp. Biol. 35, 1384
Reimann, E. M., Walsh, D. A. & Krebs, E. G. (1971) J.Biol. Chem. 246, 1986-1995
Rohrbach, M. S., Humphries, B. A., Yost, F. J., Jr.,Rhodes, W. G., Boatman, S., Hiskey, R. G. & Harrison,J. H. (1973) Anal. Biochem. 52, 127-142
Rosen, 0. M., Rubin, C. S. & Ehrlichman, J. (1973) Proc.Miami Winter Symp. 5, 67-82
Rothen, A. (1940) J. Gen. Physiol. 24, 203-211Rubin, C. S. & Rosen, 0. M. (1975) Annu. Rev. Biochem.
44, 831-887
Vol. 159
422 P. H. SUGDEN, L. A. HOLLADAY, E. M. REIMANN AND J. D. CORBIN
Rubin, C. S., Erlichman, J. & Rosen, 0. M. (1972) J.Biol. Chem. 247, 3644
Schacbman. H. K. & Edelstein, S. J. (1966) Biochemistry5, 2681-2705
Schuie, H. E., G6llner, I., Heide, K., Schonenberger,M. & Schwick, G. (1955) Z. Naturforsch. Teil B 10,463-473
Sears, D. W. & Beychok, S. (1973) in Physical Principlesand Techniques of Protein Chemistry, Part C (Leach,S. J., ed.), pp. 541-554, Academic Press, New York andLondon
Siegel, L. M. & Monty, K. J. (1966) Biochim. Blophys.Acta 112, 346-362
Sober, H. A. (1968) C.R.C. Handbook of Biochemistry,p. B18, Chemical Rubber Publishing Co., Cleveland
Soderling, T. R., Corbin, J. D. & Park, C. R. (1973) J.Biol. Chem. 248,1822-1829
Sugden, P. H. & Corbin, J. D. (1976) Biochem. J. 159,423-437
Van Holde, K. E. & Baldwin, R. L. (1958) J. Phys. Chem.62, 734-743
Walsh, D. A., Perkins, J. P., Brostrom, C. O., Ho, E. S. &Krebs, E. G. (1971) J. Biol. Chem. 246, 1968-1976
Wastila, W. B., Stull, J. T., Mayer, S. E. & Walsh, D. A.(1971) J. Biol. Chem. 246, 1996-2003
Weber, K. & Osborn, M. (1969) J. Biol. Chem. 244,4406-4412
Yount, R. G., Babcock, D., Ballantyne, W. & Ojala, D.(1971) Biochemistry 10, 2484-2489
Yphantis, D. A. (1964) Biochemistry 3, 297-317
1976
Copyright © 2022 FDOKUMEN