Punjab 5% Sample Check(2007-08).pdf
49
-
Upload
khangminh22 -
Category
Documents
-
view
1 -
download
0
Transcript of Punjab 5% Sample Check(2007-08).pdf

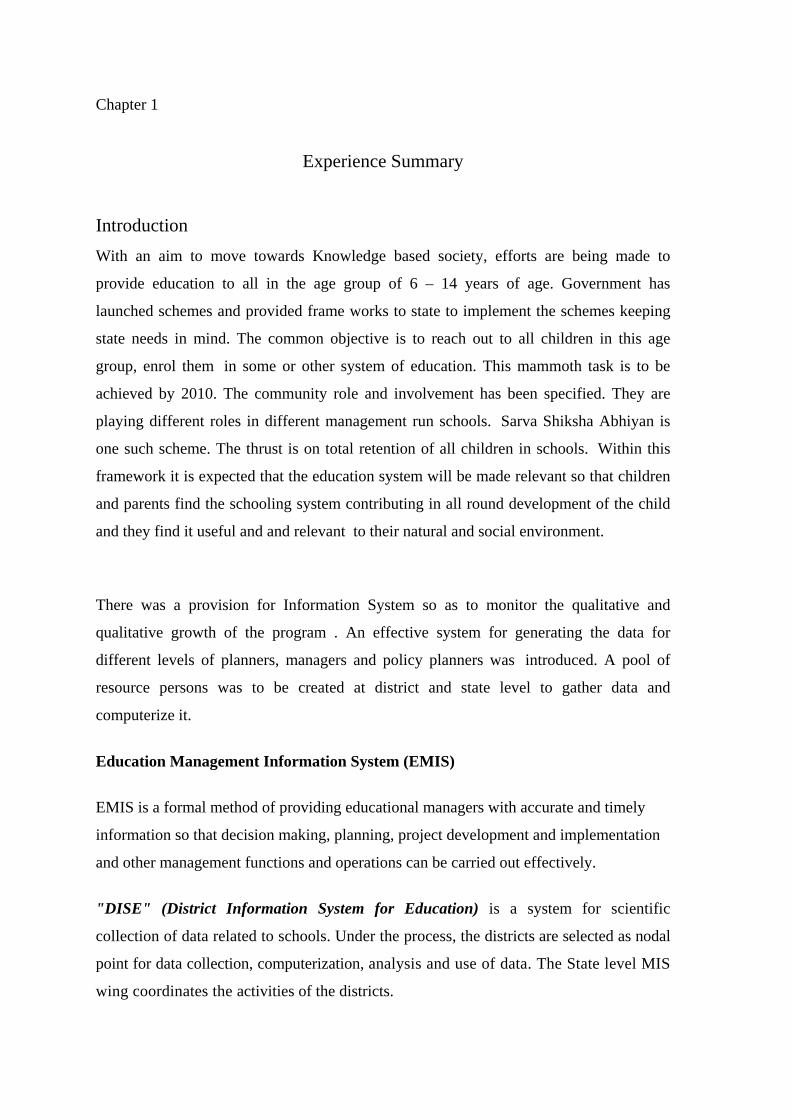
Chapter 1
Experience Summary
Introduction With an aim to move towards Knowledge based society, efforts are being made to
provide education to all in the age group of 6 – 14 years of age. Government has
launched schemes and provided frame works to state to implement the schemes keeping
state needs in mind. The common objective is to reach out to all children in this age
group, enrol them in some or other system of education. This mammoth task is to be
achieved by 2010. The community role and involvement has been specified. They are
playing different roles in different management run schools. Sarva Shiksha Abhiyan is
one such scheme. The thrust is on total retention of all children in schools. Within this
framework it is expected that the education system will be made relevant so that children
and parents find the schooling system contributing in all round development of the child
and they find it useful and and relevant to their natural and social environment.
There was a provision for Information System so as to monitor the qualitative and
qualitative growth of the program . An effective system for generating the data for
different levels of planners, managers and policy planners was introduced. A pool of
resource persons was to be created at district and state level to gather data and
computerize it.
Education Management Information System (EMIS)
EMIS is a formal method of providing educational managers with accurate and timely
information so that decision making, planning, project development and implementation
and other management functions and operations can be carried out effectively.
"DISE" (District Information System for Education) is a system for scientific
collection of data related to schools. Under the process, the districts are selected as nodal
point for data collection, computerization, analysis and use of data. The State level MIS
wing coordinates the activities of the districts.
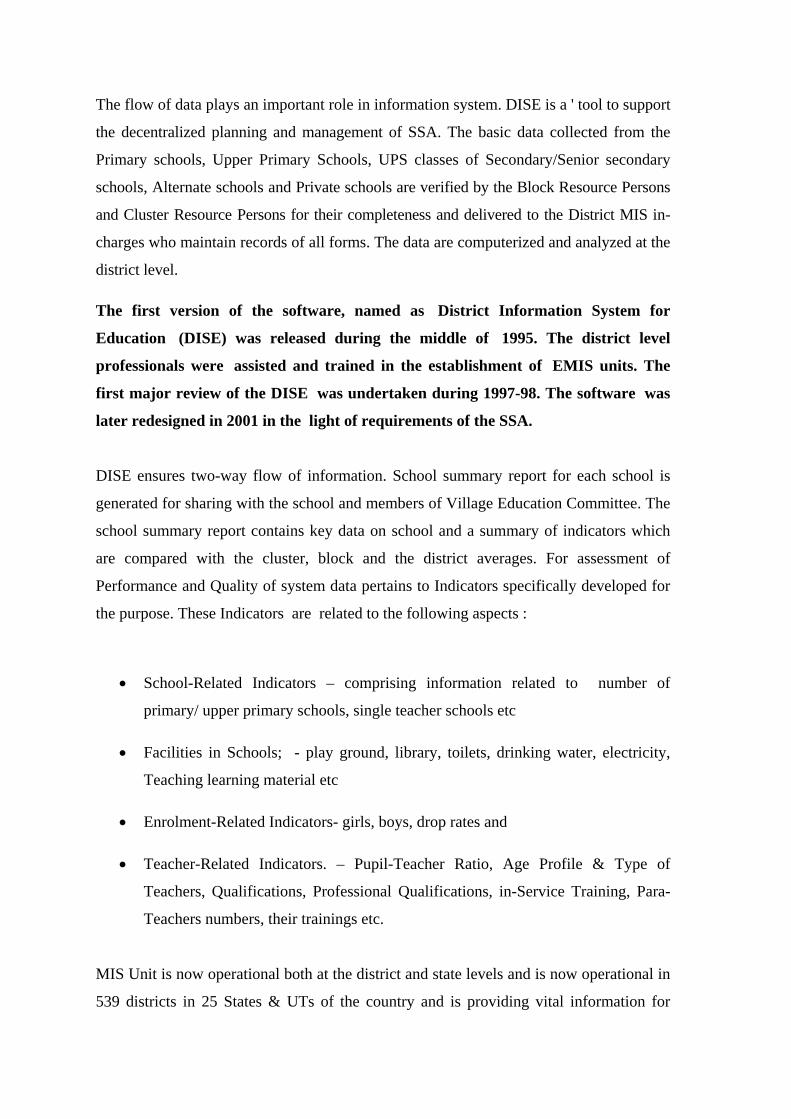
The flow of data plays an important role in information system. DISE is a ' tool to support
the decentralized planning and management of SSA. The basic data collected from the
Primary schools, Upper Primary Schools, UPS classes of Secondary/Senior secondary
schools, Alternate schools and Private schools are verified by the Block Resource Persons
and Cluster Resource Persons for their completeness and delivered to the District MIS in-
charges who maintain records of all forms. The data are computerized and analyzed at the
district level.
The first version of the software, named as District Information System for
Education (DISE) was released during the middle of 1995. The district level
professionals were assisted and trained in the establishment of EMIS units. The
first major review of the DISE was undertaken during 1997-98. The software was
later redesigned in 2001 in the light of requirements of the SSA.
DISE ensures two-way flow of information. School summary report for each school is
generated for sharing with the school and members of Village Education Committee. The
school summary report contains key data on school and a summary of indicators which
are compared with the cluster, block and the district averages. For assessment of
Performance and Quality of system data pertains to Indicators specifically developed for
the purpose. These Indicators are related to the following aspects :
• School-Related Indicators – comprising information related to number of
primary/ upper primary schools, single teacher schools etc
• Facilities in Schools; - play ground, library, toilets, drinking water, electricity,
Teaching learning material etc
• Enrolment-Related Indicators- girls, boys, drop rates and
• Teacher-Related Indicators. – Pupil-Teacher Ratio, Age Profile & Type of
Teachers, Qualifications, Professional Qualifications, in-Service Training, Para-
Teachers numbers, their trainings etc.
MIS Unit is now operational both at the district and state levels and is now operational in
539 districts in 25 States & UTs of the country and is providing vital information for

policy formulation and preparation of district elementary education plans and has helped
in eliminating time lag in educational statistics.
At the time when the Sarva Shiksha Abhiyan was launched in 2001, the scope of DISE
was extended to the entire elementary level of education. In view of this, a number of
DPEP states have expanded the coverage of DISE to the non-DPEP districts of their
state. During 2003-04, the coverage was further widened to cover as many as 539
districts (including bifurcated districts) across 25 States & UTs of the country. It was for
the first time that seven non-DPEP states adopted DISE during 2003-04. These states
are Chandigarh, Manipur, Meghalaya, Mizoram, Nagaland, Punjab and Tripura.
The system is yet to be adopted. Punjab submitted data only in case of government
schools.
The software captures two types of information base:
at the village and
the school level.
Village level data comprises variables related to the access to educational facilities of
various types, identification of habitation without access to primary and upper primary
schools based on distance norms, inventory of all types of educational institutions including
recognized and un recognized schools in the village, selected data on the number,
enrolment and teachers/instructors in NFE/EGS and alternative schools, pre-primary
education including Anganwadis and Balwadis. Data on age specific population and out of
school children generated through household surveys forms part of the village data.
The School Data is submitted by the School Head Master/Head Teacher through the
District and State level authorities. Before further submission it is supposed to be checked
at the cluster level by the Cluster Resource Centre Coordinator. The MIS In-charge at the
district level then runs the consistency module to check the inconsistency in the data. The
School Report Cards are based on the data received by end September, of the
corresponding year.
The most important and crucial part is data collection. Because of involvement of
multiple data collection agencies; and lack of coordination among them it is difficult to
meet dead lines. There is lack staff, specially at lower level, which has understanding of
the concept and definitions of educational statistics to fill in the Data Capture Forms (

DCF). The whole system can not be computerised as there is lack of equipments
(computers) at lower levels. There is on and off threat of creation of new districts and
changes in boundaries of the existing districts. The basic problem of attitudes and lack of
accountability at all levels, has become a common feature.
The post enumeration 5% validation of data thus plays a vital role in finding consistency
and validity of data. While doing the study Datamation, New Delhi felt the following
limitations
LIMITATIONS OF THIS STUDY
1. There can be no conclusions drawn as such the sample size was too
small. From the sample schools selected percentages of the scale have
been compared. Taking the assumption that schools selected in sample
may belong to a particular category, the results may vary,
2. In certain cases there has been non-cooperation reported by the enumerators of
this study, thus reducing the sample size further
3. The allocation of school codes on DISE sample formats and those reported by the
school authorities have been found to be different.
4. The soft copy of School data was not available so proper comparison could not be
made. For 5% post enumeration validation some forms were filled in Gurumukhi,
which caused delay in comparison. Soft copy would have hastened the process.
SUGGESTIONS
Based on the field experience the following suggestions are being made
• Enumerators should not be asked to fill name of the school and school code every
year. The formats should be complete in –itself giving the above mentioned
details and if possible the School grades. DISE should provide printed formats
to each school every year ( at-least question no. 1-9 of DISE format ). This will
help the headmaster or teacher.
• Access of on line-updation for certain data fields could be provided to Block
Resource Centre. The coordinators of BRC/CRC should be trained to collect the
information. Collecting relevant information at block/ cluster level would be
much easier. As such improvement of school infrastructure facilities and School
grading is their responsibility.
• Has there been any attempt been made to compare the school grading data
( specially physical infrastructure part) with this DISE data? Same persons could
be given responsibility of data collection after proper training, though the
chances of data manipulation at various levels does not get eliminated. In the
present scenario the school remains responsible for the correctness of the data
supplied
• Some fields may be updated after a period of 5 years ( old schools by
Management). Directorate of Education giving permissions for up-gradation of
schools, appointment of teachers etc. should share some fields on-line with DISE.
This may reduce disparities.
• Certain fields in Table 1.9 (Number of schools by year of establishment ) may be
checked after a time period. Else field for schools after 2005 be introduced for
getting information about new schools, specially private.
• SSA Authority should provide have given the school list Education Development
Block (ED) wise. In place of Community Development wise (CD) to make the
validation study easier for the organization chosen from other than DISE state. If
possible the study should be initiated well in time and soft copy of the school
data be given to the Organization asked for validation, after they have
completed the study. One to one comparison is only possible when soft
data for schools is available. Else it is comparing percentages and find
glaring mistakes and then going in for one to one comparison which is
time consuming.
• The sequence of information in DISE format and 5% sample checking
format should be same to make the comparison easy.
The district-wise major observations are mentioned in Chapter 3.
Chapter 2
WHY THIS STUDY?
It is mandatory for all the States and UTs to check the DISE data on sample basis. From
the year 2006-07 onwards each state has to draw a sample of 10 per cent of Districts with
a minimum of at least 2 districts for random checking of data. Within each sample
districts schools from 5 per cent post enumeration data from each block is required to be
selected for verification.
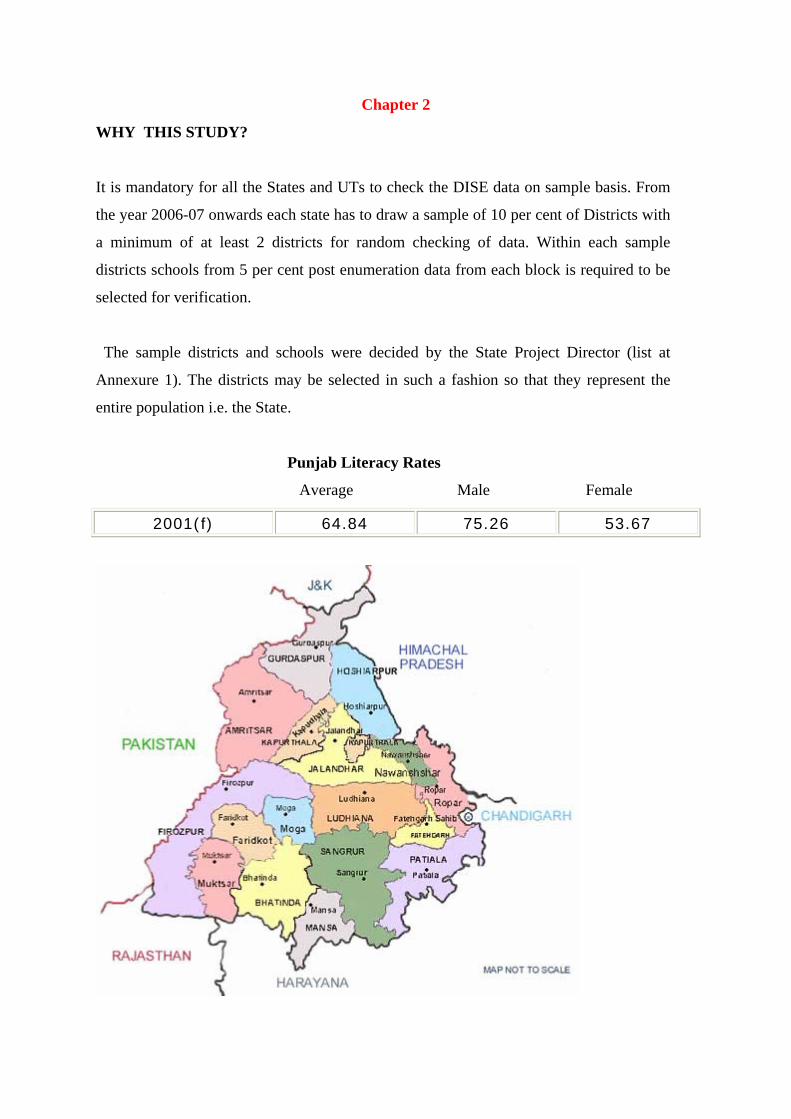
The sample districts and schools were decided by the State Project Director (list at
Annexure 1). The districts may be selected in such a fashion so that they represent the
entire population i.e. the State.
Punjab Literacy Rates
Average Male Female
2001(f) 64.84 75.26 53.67
Basic preliminary information about the districts – the spread over state, population,
urban/ rural composition and literacy rate etc) selected is as follows:
Bhatinda
Bathinda district located in Southern part of state, ranks 6TH in terms of size and 9 th in
terms of a population of the state. According to 2001 Census of India, it has population
of 1183295 which is 4.86 % of the total population of Punjab State. It consists of 384
villages, having 39.4% urban population and 1126 schools recorded as per 2001 census
data. The SC population is sizeable in Bhatinda having 30% mark. The district ranks at
14 th place in the field of literacy in the state. 61.51% population is literate where as the
rate for male and female literacy is 68.31 % and 53.76% respectively.
Gurdaspur
The district Gurdaspur is located in Northern part of state. The total number of villages
are 1140. According to 2001 Census of India, it has population of 2104000 which is
% of the total population of Punjab State. It consists of 16 blocks consisting of 25.4 %
urban population and 1479 schools recorded as per 2001 census data. The nearly 25%
has been reported to be SC population. The literacy levels are better as overall literacy
rate is 73.8% and female literacy rate is 67.2%.
Hoshiarpur
Hoshiarpur district is located in the north-east part of the State. The district is sub-
mountainous and stretches of river Beas in the north-west. At present, it has an area of
3365 Sq. Kms. and a population ( as per 2001 Census) of 1478045. More of a rural
district and has 19.7 % people located in 9 towns and rest of them in 1267 villages. The
population of SC is high ( 34.3%) but literacy rates are good. ( over all average 81 % and
female literacy 75.3 %). There seem to be number of schools ( 2133 as per 2001 census
data) catering towards improvement in literacy rates.
Special focus was on district having literacy rate below and above the state level etc. and
schools located both in urban areas as well as rural areas may be the possible criteria to
draw sample.
The Datamation Research Analyst, New Delhi was assigned for 5% Post Enumeration
Survey for sample checking of data.
METHODOLOGY
Sarva Shiksha Abhiyan is an intervention to universalise elementary education by
community-ownership of the school system. It is supposed to provide an opportunity for
improving human capabilities to all children, through provision of community-owned
quality education in a mission mode.
In primary and upper primary education level attendance of children and their learning
attainments in school are major concerns and hypothesized to be influenced by the
regularity / irregularity behavior of teachers. Higher the regularity of teachers, higher
should be the learning attainment of children; this is an expected outcome of the study;
statistical control of personal variables of children, 'facilities' variables of schools needs
to be regulated while relating teacher absenteeism, student absenteeism with dependent
variables.
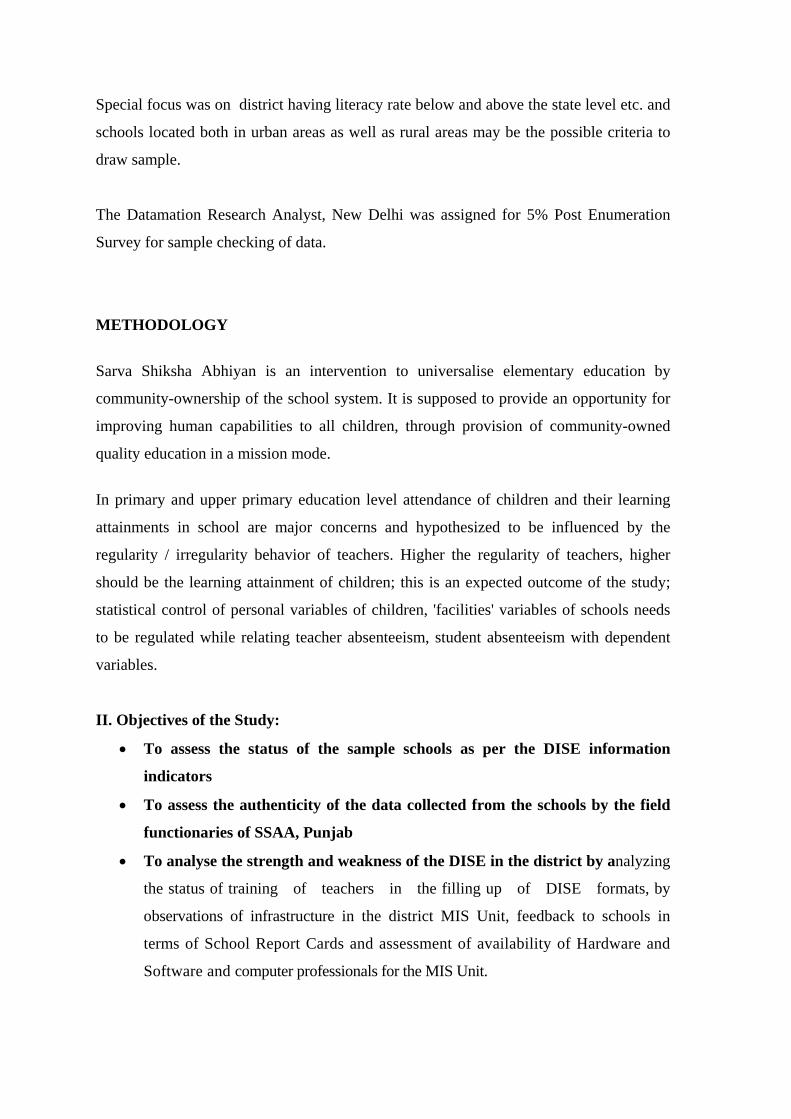
II. Objectives of the Study:
• To assess the status of the sample schools as per the DISE information
indicators
• To assess the authenticity of the data collected from the schools by the field
functionaries of SSAA, Punjab
• To analyse the strength and weakness of the DISE in the district by analyzing
the status of training of teachers in the filling up of DISE formats, by
observations of infrastructure in the district MIS Unit, feedback to schools in
terms of School Report Cards and assessment of availability of Hardware and
Software and computer professionals for the MIS Unit.

• To project the authenticity of the 5% post Enumeration Survey
• To find out ways and means for improvement of quality of collection of data
III. Design of the Study:
The study is based on utilization of all types of secondary data available with the
EMIS section of Directorate of Education, Gov. of Punjab for all the schools that get
into the sample. The selection of 5% sample schools and basic elements of data
collection ( DCF ) were discussed and finalized after discussion with SSA Punjab.
Tools deployed for the Evaluation of DISE data on 5% sample checking basis under
SSA Punjab:
SAMPLE SIZE AND SAMPLE SELECTION FOR CHECKING OF DISE DATA
The schools selected are located both in rural and urban areas and also include all types
of schools across school managements
District Total
schools
Sample Urban
Pop. %
SC
pop.
%
Avg.
Literacy
Level %
Bhatinda 1126 50 39.4 30 61.51
Gurdaspur 1479 115 25.4 20 73.8
Hoshiarpur 2133 110 19.7 34.3 81
Punjab Literacy Rates
Average Male Female
Punjab (2001) 64.84 75.26 53.67
Bhatinda 61.51% 68.31 % 53.76%
Gurdaspur 73.8 % 67.2%
Hoshiarpur 81% 75.3%

The questionnaire developed for meeting the objectives of the study the Post-enumerator
survey, the questionnaire contained two major parts –
Part I – contained all basis elements desired to measure the indicators related to
schools, facilities available in schools, teachers and their inputs for quality
improvement. This format was in line with the formats being used by DISE at
local level.
Part 2 - A separate format was developed for Review of the EMIS and DISE and
the collection mechanism being used by them.
For collection of primary data from the grass root level in addition to Structured
observations, interviews also formed part of the methodology. Enumerators were
oriented and briefed about collection of primary data from sample schools through,
planned but unannounced school visits, observations of school organizational work,
interviews with school authorities and other stakeholders and maintenance of field
diaries.
The other relevant information is picked from District Report card 2005-06, 2006-07 and
the official website of Punjab Education department.
Data Collection
IV. Field Work:
The survey conducted by our team of trained & experienced Surveyors. The survey teams
interviewed the Principals as well in order to understand their perspective on different
issues. We also conducted few random interviews amongst the students of the selected
schools to help understand the impact of various parameters identified above.
V. Analysis, Assessment of Data and Finalization of the field data.
Based on extensive DISE data verification; we conducted a very structured, systematic
and focused analysis based on 5% DISE booklets provided by SSA-Punjab.
Both quantitative and qualitative analysis of data was done to evolve optimum inferences.
The preliminary findings presented are after systematic analysis of the DCF and
observations of the Team leaders. The inputs have been taken into account before
finalization of the findings. The quality, consistency of the data has been ensured though
review of each questionnaire by Supervisors.
The data analysed applying SPSS and other quantitative tools to help process data
analytically and accurately.
Random verification and comparison of data was also taken up, specifically in the cases
where observations of this study and that reported in DISE study were too obvious.
Discrepancies and total non-cooperation of some school authorities have been mentioned
in the next chapter.

Chapter 3
District based Observations
Punjab government has made efforts to raise the literacy levels of the state ( numbers mentioned in the Table below ) but still lot more needs to be done. Up keep of information system has also been not very up date in Punjab. In 5% post enumeration validation of the data has indicated certain gap areas. Though the study it self has certain limitations mentioned below
1. The comparative tables are attached herewith. The softcopy of DISE data of the
current year is not available. Some of the hardcopies are filled in Gurumukhi
which makes is difficult for comparison.
2. The questionnaires are too long and primary school teachers find it rather difficult
to fill in the format.
Number of Schools in Punjab
2003-04 2006-07
Level of Schools State Govt.
State Govt.
Primary schools 12972 13179
High schools 1739 2328
Sr. Secondary schools
1382 3006
This study was to cover 3 districts of Punjab namely Bhatind, Gurdaspur and Hoshiarpur.
District-wise observations while comparing data collected through the present study and
data provided by DISE, are as follows –
SOME OBSERVATIONS BASED ON BHATINDA DATA
3. There is difference in number of computers mentioned in certain places. Missing
hardware facilities needs checking up. School no 10, 23, 45, 4 of the attached list

4. The percentage of schools under a particular kind of Management also differ, the
reason could be number of schools in the sample may be belonging to a particular
category.
5. The number of teachers in position is another area where there are discrepancies.
DISE records show more number of teachers in position than found as per this
survey. Cooking staff is also shown as teacher at places.
6. The other observation is about understanding the term ( SC, ST and how they
differ from OBC). Many a places % of SC enrolled seem to be more as per our
enumerators than mentioned by DISE enumerators.
7. Percentage of Schools By Management and Tables on Percentage of Schools by
Category also show variation ( Table 1.2 and 1.4). There is no school falling in
primary to senior secondary category where as DISE format and our data
indicates 2 such schools in Bhatinda, ( School code 0400503 , Bucho, Nathana
and Jhatuke, Rampura )
8. Another important observation is about availability of infrastructure and
availability of basic facilities in schools where more number of SC enrollment.
School numbers 9, 46 and 48 of the list annexed.
9. Non filled formats and non cooperation from schools ( specifically listed at 9, 25
and 45 of the list ) are other problem areas.

BHATINDA DATA TABLES PLEASE NOTE The table with all 3 districts is the taken from the DISE data provided. The other table just below it is from this survey.
Table No. 1.1
Percentage of Schools By Year of Establishment
Year of Establishment District Name Before & In
1990 1991 To 1995 1996 To 2000 2001 To 2005
Total Govt.
Schools
BATHINDA 79.37 6.14 7.56 5.51 635 BATHINDA 82% 4% 4% 8% 50 This percentage is for the sample of 50 schools hence can not be compared and does not
even raise a caution signal.
Table No. 1.2
Percentage of Schools By Management
School Management
District Name Department Of School
Education Tribal/Social
Welfare Local Body PRI
Total Govt Schools
BATHINDA 74.02 0.16 0.63 25.20 635
BATHINDA 84.3 3.9 7.8 2.9 50 More schools set up by state government have been found. Data needs comparison of total forms of Bhatinda.

Table No. 1.4
Percentage of Schools by Category
School Category
District Name Primary
Pry with Upper
Pry
Pry with Upper Pry and
Sec/Sen Secondary
Upper Pry
Only
Upper Pry with Sec/Hr Secondary
BATHINDA 60.94 0.00 0.00 14.02 25.04
BATHINDA 58% 10% 10% 12% 8%
There is a need to update the information as formats indicate presence of Primary
schools with Upper Primary section and even Secondary section. Nos. are given at 5
above.
Table No. 1.6
Percentage of Schools By School Type
Type of School District Name
Boys Girls Co-Education
BATHINDA 3.78 3.31 92.91
BATHINDA 2% 2% 96%
This percentage is for the sample of 50 schools hence can not be compared and does not
even raise a caution signal.

Table No. 1.8
Percentage of Schools By Type of Building
Type of School Building
District Name Private Rented Government
Govt. School In Rent Free Building
No Building
Total Govt.
Schools
BATHINDA 1.42 0.16 95.43 2.52 0.31 635
PUNJAB 0.23 0.26 96.32 1.91 0.38
Table No. 1.12
Percentage of Schools By Number of Teachers
Number of Teachers District Name
0 1 2 3 > 3
Total Govt.
Schools
BATHINDA 1.42 7.72 20.47 29.29 41.10 635
BATHINDA 6% 10% 16% 68%
The figures indicate improvement though can not be said to be conclusive. As sample size is small.
Table No. 1.14
Percentage of Schools By Number of Classrooms
Number of Classrooms District Name
0 1 2 3 > 3
Total Govt.
Schools

BATHINDA 0.79 0.63 6.61 17.48 74.49 635
BATHINDA 4% 4% 2% 4% 84%
The zero class room data in is inclusive of NO RESPONSE hence could be misleading.
Table No. 1.16
Percentage of Schools with Facilities
Facilities
District Name Playground Common
Toilet Girls Toilet
Drinking Water Ramp Electricity Fire
Safety
Separate Staff Toilet
BATHINDA 69.76 91.34 87.72 38.58 35.59 97.32 83.46
BATHINDA 82 78% 88% 98% 94% 56%
Ramp and Fire safety data was not included in Post enumeration survey and a new field for separate toilet facilities for teachers was included. Data shows improvement in Drinking water facilities.
Table No.1.18
Percentage of Schools By PTR (Pupil Teacher Ratio)
PTR (Pupil Teacher Ratio) District Name
>40 >50 >60 >70 >100
Total Govt.
Schools
BATHINDA 44.25 26.14 10.39 8.19 10.55 635
BATHINDA 48% 28% 4% 10% 2% 50

Over all improvement in pupil teacher ratio which is a good sign but as mentioned above
the number of teachers in position need to be improved. ( School no. 11, 12, 16, 22, 24,
26, 37, 47, 48)
Table No. 1.20
Percentage of Classrooms By Condition
Classrooms District Name Good
Condition Need Minor
Repair Need Major
Repair Total
BATHINDA 79.41 6.34 14.24 3405
BATHINDA 85.27% 11.36% 3.36%
It seems major repairs have been taken up and now more schools have shifted to schools requiring minor repairs from those requiring major repairs. The same needs to be updated in DISE records and feed back be given to BRCC..
Table No. 1.22
Percentage of Single Teacher Schools Category-wise
School Category
District Name Primary
Pry with
Upper Pry
Pry with Upper Pry
and Sec/Sen Secondary
Upper Pry
Only
Upper Pry with Sec/Hr Secondary
No Response
All Schools
Total Govt.
Schools
BATHINDA 6.93 0.00 0.00 0.31 0.47 0.00 7.72 635
BATHINDA 2% 0 0 0 0 0 0 50
There could be other schools in Bhatinda which were not part of the study and are listed under Single Teacher schools. The data is not comparable.

Table No. 1.24
Percentage of Single Classroom Schools Category-wise
School Category
District Name Primary
Pry with
Upper Pry
Pry with Upper Pry
and Sec/Sen
Secondary
Upper Pry
Only
Upper Pry with Sec/Hr Secondary
No Response
All Schools
Total Govt.
Schools
BATHINDA 0.31 0.00 0.00 0.31 0.00 0.00 0.63 635
Table No. 2.12
Percentage of Male/Female Teachers by School Management
School Management
Pvt. Aided (A) Pvt. Un-Aided (B) Total (A+B) District Name
M F M F M F
Total Teachers
BATHINDA 1.27 3.30 7.24 28.37 8.51 31.67 2362
GURDASPUR 1.25 2.08 4.13 11.47 5.38 13.56 5909
HOSHIARPUR 2.24 3.33 3.25 8.01 5.49 11.35 6214
Table No. 2.2
Number and Percentage of Teachers By Category District Name Teachers' Category
Teachers Part time
Community para
teachers Others Total Teachers BATHINDA 257 7 38 302 Percentage 85% 2% 13%
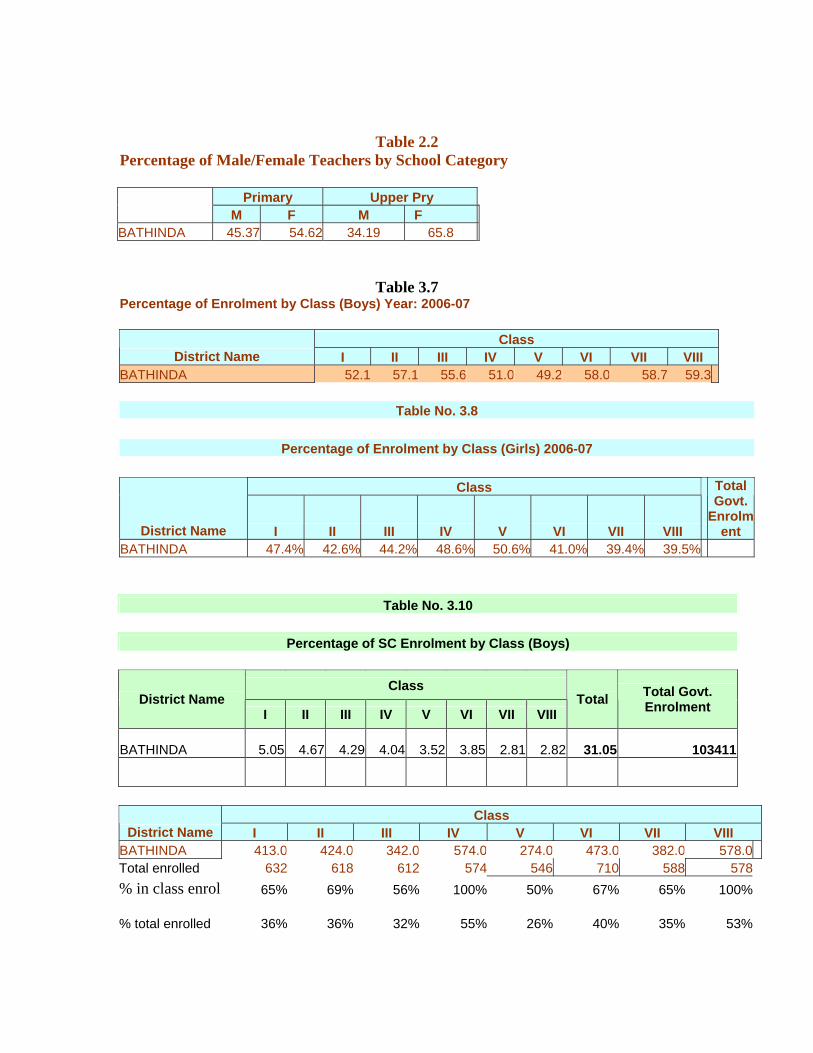
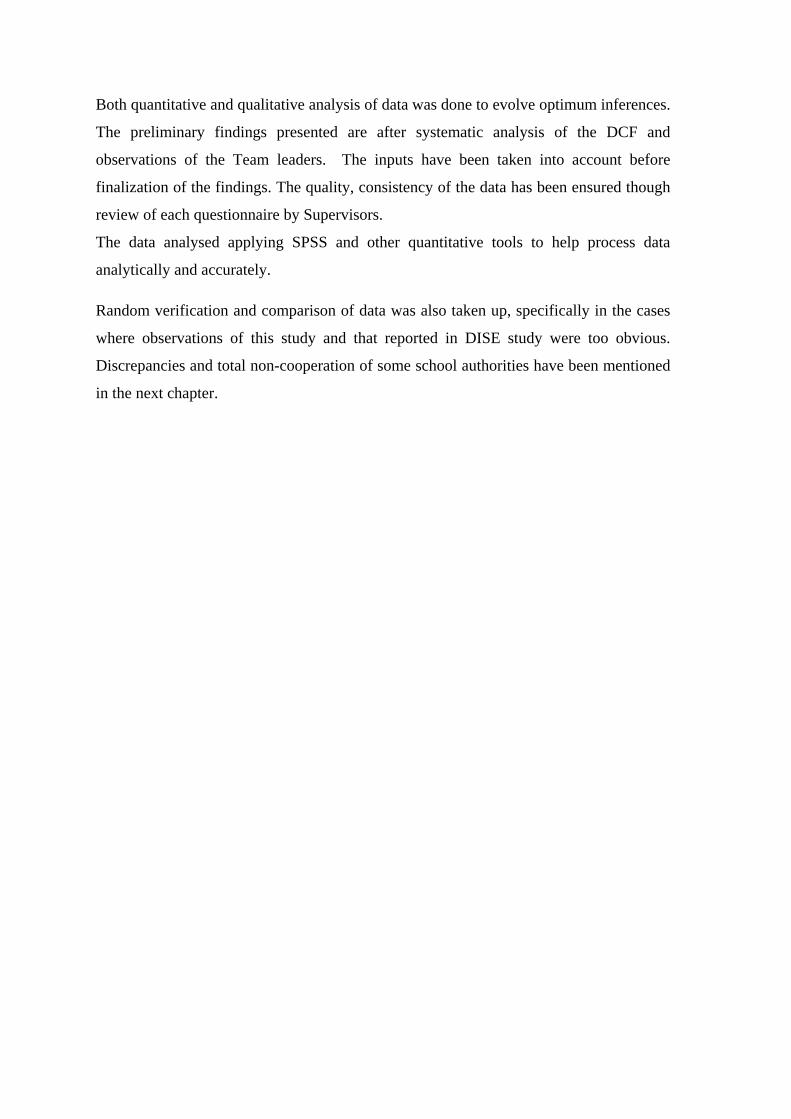
Table 2.2 Percentage of Male/Female Teachers by School Category
Primary Upper Pry M F M F
BATHINDA 45.37 54.62 34.19 65.8
Table 3.7 Percentage of Enrolment by Class (Boys) Year: 2006-07
Class District Name I II III IV V VI VII VIII
BATHINDA 52.1 57.1 55.6 51.0 49.2 58.0 58.7 59.3
Table No. 3.8
Percentage of Enrolment by Class (Girls) 2006-07
Class
District Name I II III IV V VI VII VIII
Total Govt.
Enrolment
BATHINDA 47.4% 42.6% 44.2% 48.6% 50.6% 41.0% 39.4% 39.5%
Table No. 3.10
Percentage of SC Enrolment by Class (Boys)
Class District Name
I II III IV V VI VII VIII Total Total Govt.
Enrolment
BATHINDA 5.05 4.67 4.29 4.04 3.52 3.85 2.81 2.82 31.05 103411
Class District Name I II III IV V VI VII VIII
BATHINDA 413.0 424.0 342.0 574.0 274.0 473.0 382.0 578.0 Total enrolled 632 618 612 574 546 710 588 578% in class enrol 65% 69% 56% 100% 50% 67% 65% 100% % total enrolled 36% 36% 32% 55% 26% 40% 35% 53%

Table No. 3.12
Percentage of SC Enrolment by Class (Girls)
Class District Name
I II III IV V VI VII VIII Total Total Govt.
Enrolment
BATHINDA 4.24 4.06 3.78 3.75 3.39 3.32 2.71 2.72 27.98 103411
Class District Name I II III IV V VI VII VIII BATHINDA 371.0 384.0 252.0 420.0 169.0 388.0 319.0 425.0 Total enrolled 514 562 461 477 488 485 498 514 Percentage (G) 72% 68% 55% 88% 35% 80% 64% 83% % total enrolled 32% 33% 23% 40% 16% 32% 29% 39%
Table No. 3.16
Percentage of Enrolment of Disabled Children (Boys) 2007-08
Class District Name I II III IV V VI VII VIII
BATHINDA 0.0% 23.1% 15.4% 23.1% 15.4% 0.0% 15.4% 7.7% GURDASPUR 16.7% 8.3% 16.7% 16.7% 8.3% 16.7% 0.0% 16.7% HOSHIARPUR 1.2% 2.5% 1.2% 3.7% 3.7% 28.4% 21.0% 38.3%
Table No. 3.17
Percentage of Enrolment of Disabled Children (Girls) 2007-08
Class District Name I II III IV V VI VII Total
BATHINDA 12.5% 37.5% 12.5% 12.5% 0.0% 0.0% 0.0% 25.0% GURDASPUR 11.8% 5.9% 23.5% 17.6% 23.5% 5.9% 5.9% 5.9%
HOSHIARPUR 12.5% 37.5% 12.5% 12.5% 0.0% 23.5% 23.5% 25.0%

Table No. 3.18
Percentage of Enrolment by Caste
SC ST OBC GEN Total District Name
Boys Girls Boys Girls Boys Girls Boys Girls Boys Girls Total
Enrolment
BATHINDA 30.99 27.90 0.06 0.08 6.34 5.90 15.46 13.27 52.85 47.15 103411
Table No. 3.20
Percentage of Primary & U Primary Enrolment (Aided & Un-Aided)
Pvt. Aided Pvt. Un-Aided Total
Class I-V Class VI-VIII Class I-V Class VI-VIII I-V VI-VIIIDistrict Name
Boys Girls Boys Girls Boys Girls Boys Girls Boys Girls
Total Enrolment
BATHINDA 6.50 5.94 6.80 4.48 34.35 23.94 11.27 6.73 58.92 41.08 36534
GURDASPUR 5.64 4.06 4.44 3.46 33.49 21.65 16.63 10.63 60.20 39.80 35008
HOSHIARPUR 3.94 3.44 10.35 9.64 27.52 18.15 16.15 10.81 57.96 42.04 47385
Percentage of Enrolment of Disabled Children (Girls) 2006-07
Class District Name I II III IV V VI VII VIII BATHINDA 19.0% 4.8% 0.0% 9.5% 4.8% 0.0% 38.1% 23.8%
Table No. 3.10 Percentage of Enrolment of Disabled Children (Boys) 2006-07
in a class Class
District Name I II III IV V VI VII VIII BATHINDA 3.7% 7.4% 7.4% 11.1% 3.7% 0.0% 40.7% 25.9%
GurdasPur Observations
1. In Gurdaspur district the enumerators were given the list provided to us. the
specific observations are
2. Total non-cooperation by
Dinanagar - GSSS, Chounta -
Kahnuwal - GSSS Jagowal
Kahnuwal - GMS Ladhupur
3. No school found as per address -
Shri HariGobind Nagar - GPS, Dhiman
Quadian - GSSS, Wadala
4. The list of codes were not provided for sample schools in the district of
Gurdaspur. The codes have been picked up from the forms provided. But the
formats do not tally with the schools covered in the study. Your formats for
school no.9 ( Batala, Dialgarh), 96 (Quadian, Dhiwan) and 99 (Quadian proper)
are not part of the formats provided by your office. The schools which have been
covered and were not part of the list are not available but have been covered in
the sample ( 2 schools in N J Singh block have been covered instead of 1
mentioned in the list ( mentioned - Codes 110201; not mentioned -. 110202).
5. DISE form listed at 66 and 68 code 1207401 and 1200101 in Kahnuwan have not
been covered.
6. No DISE forms available for schools mentioned at 40, 41, 42, 84, 85, 87,88, 94,
95, 96, 97, 99, 101, 102, 114, 115. Data for 87 needs to be checked as teachers
details are not available.
7. CD Block Quadian listed at 100 if the list and having school code 0209404 no. of
sanctioned teachers are 30. As per DISE data only 7 in place but as per this study
21 are in place. Needs to be doubly checked as details of only 8 are available. No
non teaching staff has been found as per this study.

8. CD block Shri Hargobindpur, listed at 108 with school code 1507701 DISE data –
2 teachers in place and no non-teaching staff where as this study shows presence
of 1 teacher, 2 cooking staff,, 2 non teaching staff is in place.
9. CD District Kahunwan, Primary school , School code 1215801 2 posts of
teachers sanctioned and non in position. School listed at 75 in N J Singh
Block with school code 1102701 is another no teacher school.
10. School code 1102401 in N J Singh Primary school as per DISE 2 teachers in
position. As per this study only 1 in position another is a cook.
11. Code 0503601 belongs to a High School and not middle school as mentioned(
Dharkalan Shahpur khandi; 0108101 in Surdaspur, Bariar is a Primary school and
not Middle as listed).
12. The codes mentioned in forms sent by your office and collected by Datamation
also vary in certain cases. Where ever available your information has been used to
correct codes. In the above mentioned schools the codes from Datamation study
have been retained. You will have to confirm which one is correct. Wrong school
codes have been reported by schools listed at 11, 12,14, 21, 25, 28, 29, 30, 31, 32,
37, 38, 39, 4043-47, 53, 77, 91, 93, 109, 110, 112 of the attached list)
GURDASPUR DATA TABLES
Table No. 1.1
Percentage of Schools By Year of Establishment
Year of Establishment District Name Before & In
1990 1991 To 1995 1996 To 2000 2001 To 2005
Total Govt.
Schools
GURDASPUR 85.55 4.59 6.31 2.24 1917
61.9% 2.7% 7.1% 5.3%
No response
23.9%
Table

Percentage Schools by Management
School Management
Department Of School Educati
on
Tribal/Social Welfare Local Body PRI-
unaided No
responseTotal Schools
Gurdaspur 74.49 0.00 0.10 25.40 1917
61.7 0
23.5 4.3 8.7
Table No. 1.4
Percentage of Schools by Category
School Category
District Name Primary
Pry with Upper
Pry
Pry with Upper Pry and
Sec/Sen Secondary
Upper Pry
Only
Upper Pry with Sec/Hr Secondary
GURDASPUR 77.67 0.42 0.16 11.01 10.75
64.35 1.74 3.48 9.6 14.8
Table No. 1.6
Percentage of Schools By School Type
Type of School District Name
Boys Girls Co-Education
GURDASPUR 1.30 1.67 97.03
1.74 3.48 87.82
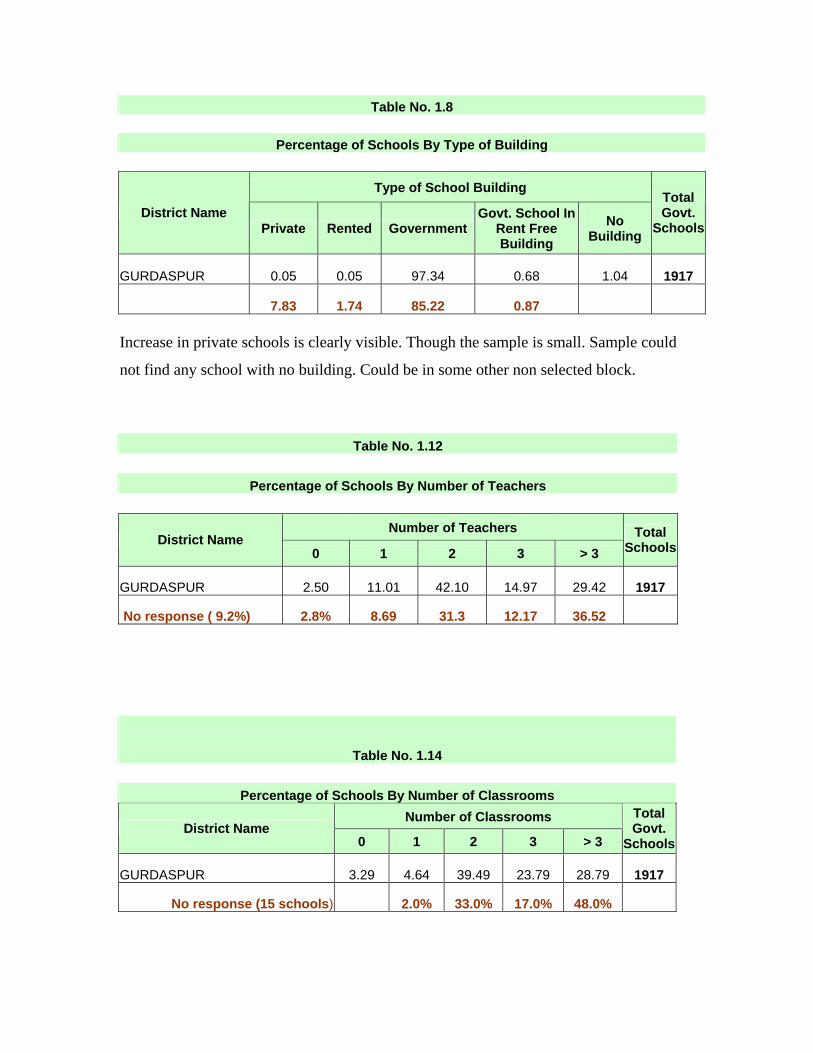
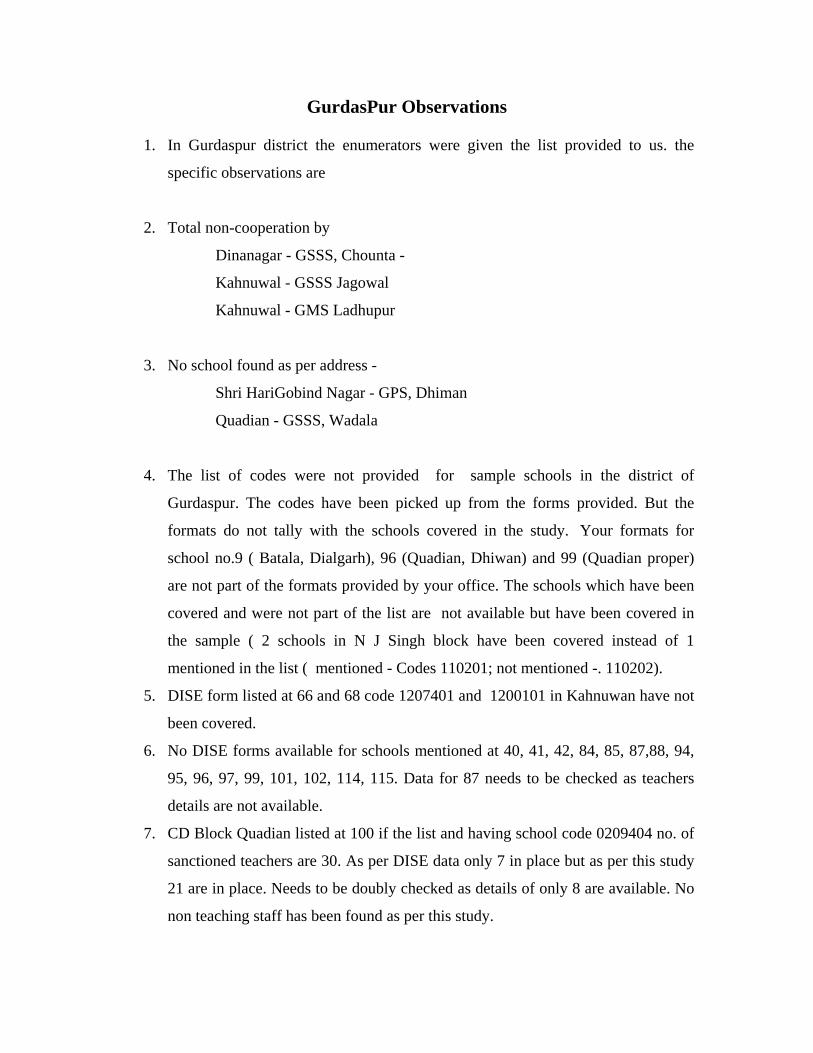
Table No. 1.8
Percentage of Schools By Type of Building
Type of School Building
District Name Private Rented Government
Govt. School In Rent Free Building
No Building
Total Govt.
Schools
GURDASPUR 0.05 0.05 97.34 0.68 1.04 1917
7.83 1.74 85.22 0.87 Increase in private schools is clearly visible. Though the sample is small. Sample could
not find any school with no building. Could be in some other non selected block.
Table No. 1.12
Percentage of Schools By Number of Teachers
Number of Teachers
District Name 0 1 2 3 > 3
Total Schools
GURDASPUR 2.50 11.01 42.10 14.97 29.42 1917
No response ( 9.2%) 2.8% 8.69 31.3 12.17 36.52
Table No. 1.14
Percentage of Schools By Number of Classrooms Number of Classrooms
District Name 0 1 2 3 > 3
Total Govt.
Schools
GURDASPUR 3.29 4.64 39.49 23.79 28.79 1917
No response (15 schools) 2.0% 33.0% 17.0% 48.0%
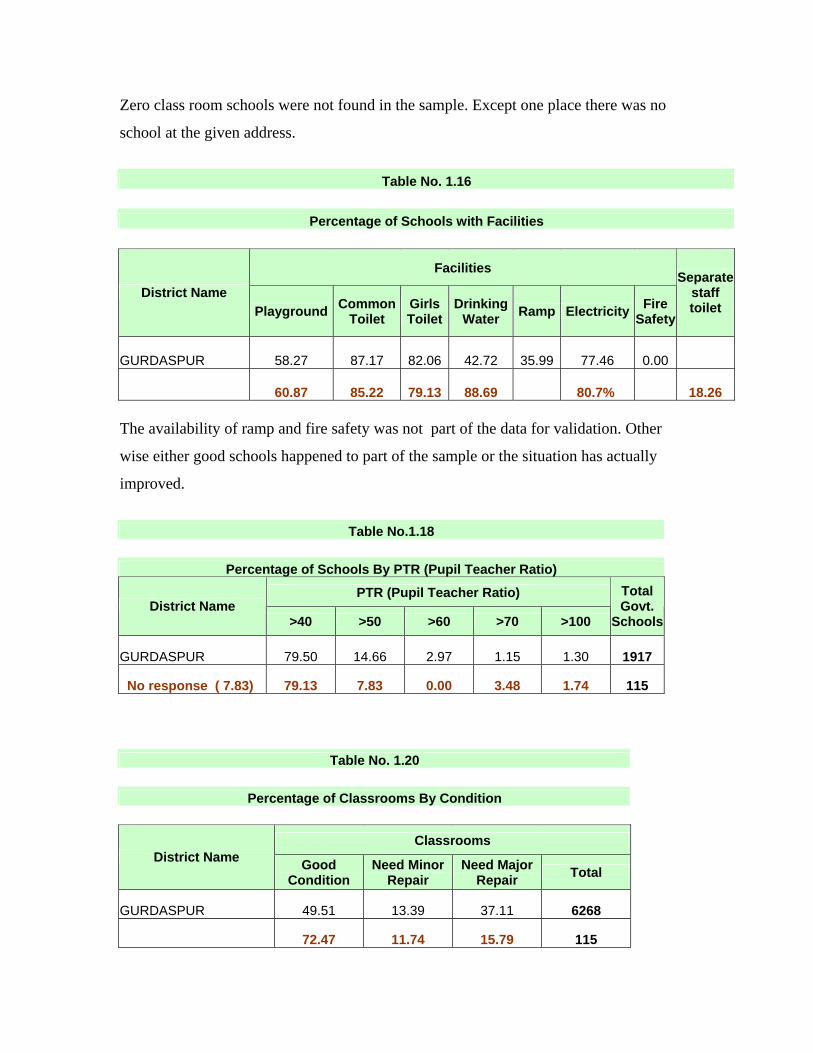
Zero class room schools were not found in the sample. Except one place there was no
school at the given address.
Table No. 1.16
Percentage of Schools with Facilities
Facilities
District Name Playground Common
Toilet Girls Toilet
Drinking Water Ramp Electricity Fire
Safety
Separate staff toilet
GURDASPUR 58.27 87.17 82.06 42.72 35.99 77.46 0.00
60.87 85.22 79.13 88.69 80.7% 18.26 The availability of ramp and fire safety was not part of the data for validation. Other
wise either good schools happened to part of the sample or the situation has actually
improved.
Table No.1.18
Percentage of Schools By PTR (Pupil Teacher Ratio)
PTR (Pupil Teacher Ratio) District Name
>40 >50 >60 >70 >100
Total Govt.
Schools
GURDASPUR 79.50 14.66 2.97 1.15 1.30 1917
No response ( 7.83) 79.13 7.83 0.00 3.48 1.74 115
Table No. 1.20
Percentage of Classrooms By Condition
Classrooms District Name Good
Condition Need Minor
Repair Need Major
Repair Total
GURDASPUR 49.51 13.39 37.11 6268
72.47 11.74 15.79 115
Effort put by VEC to improve the infrastructure of schools is appreciated. But those
needing major repairs also need some attention.
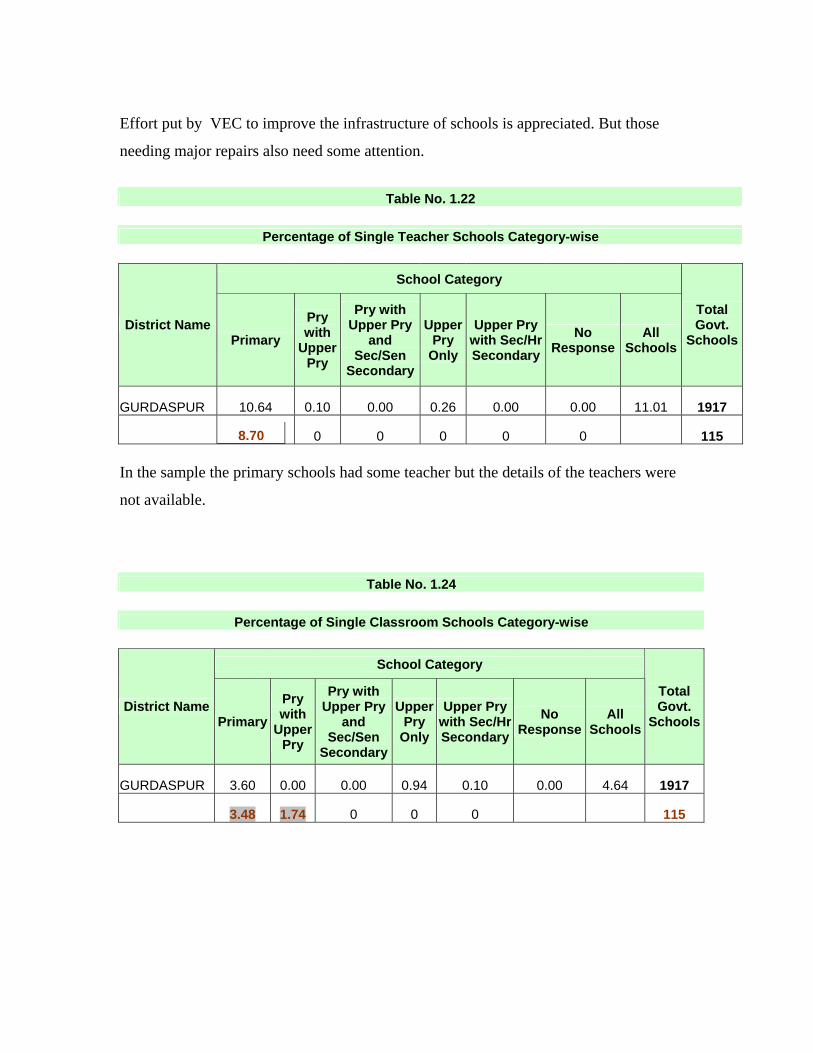
Table No. 1.22
Percentage of Single Teacher Schools Category-wise
School Category
District Name Primary
Pry with
Upper Pry
Pry with Upper Pry
and Sec/Sen
Secondary
Upper Pry
Only
Upper Pry with Sec/Hr Secondary
No Response
All Schools
Total Govt.
Schools
GURDASPUR 10.64 0.10 0.00 0.26 0.00 0.00 11.01 1917
8.70 0 0 0 0 0 115 In the sample the primary schools had some teacher but the details of the teachers were
not available.
Table No. 1.24
Percentage of Single Classroom Schools Category-wise
School Category
District Name Primary
Pry with
Upper Pry
Pry with Upper Pry
and Sec/Sen
Secondary
Upper Pry
Only
Upper Pry with Sec/Hr Secondary
No Response
All Schools
Total Govt.
Schools
GURDASPUR 3.60 0.00 0.00 0.94 0.10 0.00 4.64 1917
3.48 1.74 0 0 0 115
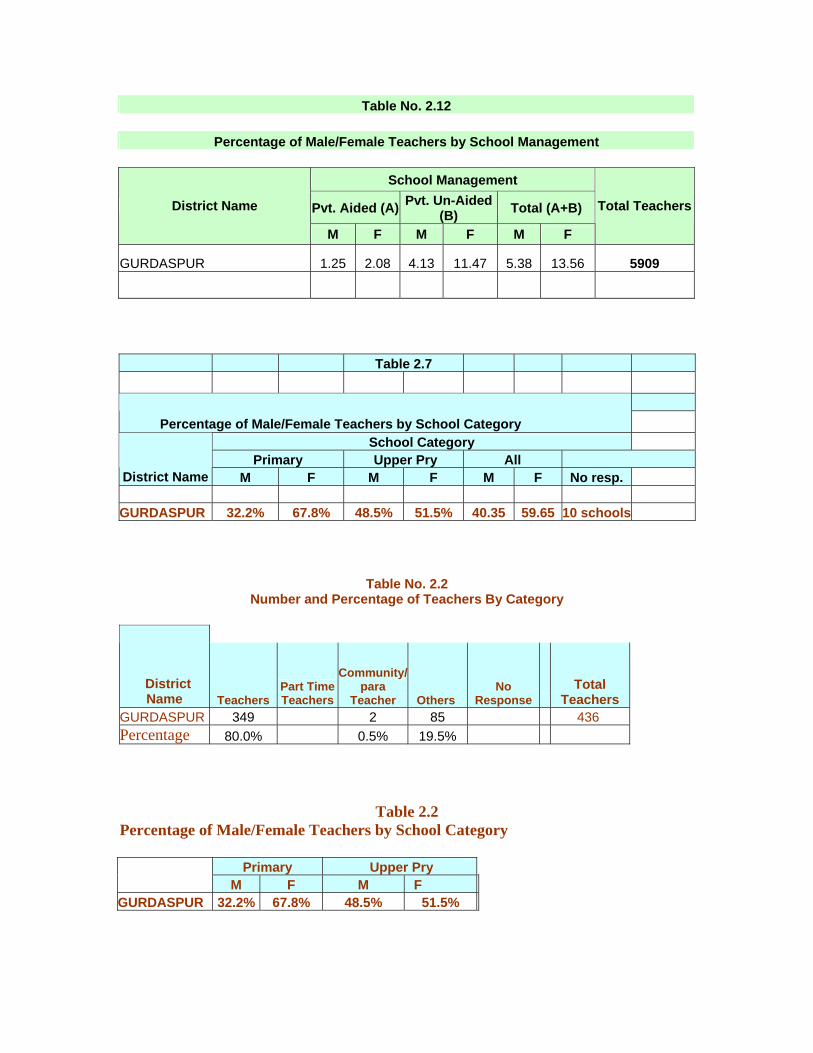
Table No. 2.12 Percentage of Male/Female Teachers by School Management
School Management
Pvt. Aided (A) Pvt. Un-Aided (B) Total (A+B) District Name
M F M F M F
Total Teachers
GURDASPUR 1.25 2.08 4.13 11.47 5.38 13.56 5909
Table 2.7
Percentage of Male/Female Teachers by School Category
School Category Primary Upper Pry All
District Name M F M F M F No resp. GURDASPUR 32.2% 67.8% 48.5% 51.5% 40.35 59.65 ols 10 scho
Table No. 2.2 Number and Perce hers By Category ntage of Teac
District Name Teachers
Part Time Teachers
Community/ para
T r eache Others No
Res se ponTotal
Te s acherGURDASPUR 349 2 85 436 Percentage 80.0% 0.5% 19.5%
Table 2.2 Percentage of Male/Female Teachers by School Category
Primary Upper Pry M F M F
GURDASPUR 32 67 48 1.5% .2% .8% .5% 5
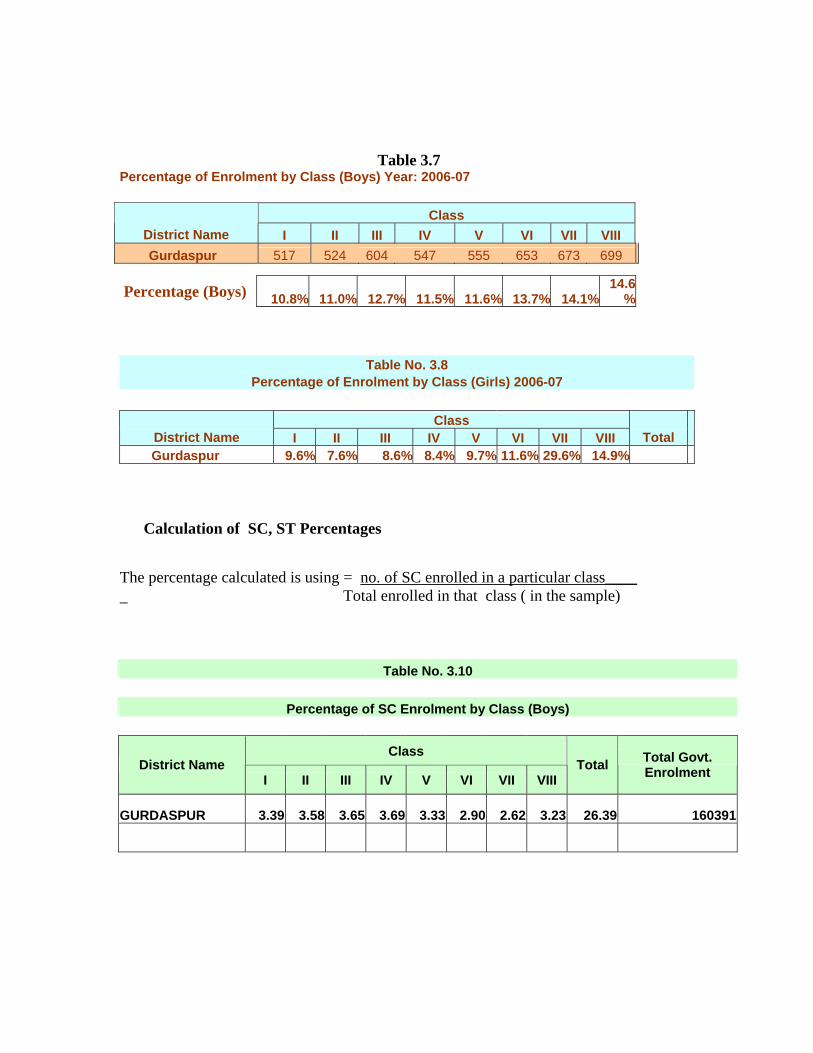
Table 3.7 Percentage of Enrolment by Class (Boys) Year: 2006-07
Class District Name I II III IV V VI VII VIII Gurdaspur 517 524 604 547 555 653 673 699
10.8% 11.0% 12.7% 11.5% 11.6% 13.7% 14.1%
14.6% Percentage (Boys)
Table No. 3.8 Percentage of Enrolment by Class (Girls) 2006-07
Class
District Name I II III IV V VI VII VIII Total Gurdaspur 9.6% 7.6% 8.6% 8.4% 9.7% 11.6% 29.6% 14.9%
Calculation of SC, ST Percentages
The percentage calculated is using = no. of SC enrolled in a particular class____ Total enrolled in that class ( in the sample)
Table No. 3.10
Percentage of SC Enrolment by Class (Boys)
Class District Name
I II III IV V VI VII VIII Total Total Govt.
Enrolment
GURDASPUR 3.39 3.58 3.65 3.69 3.33 2.90 2.62 3.23 26.39 160391
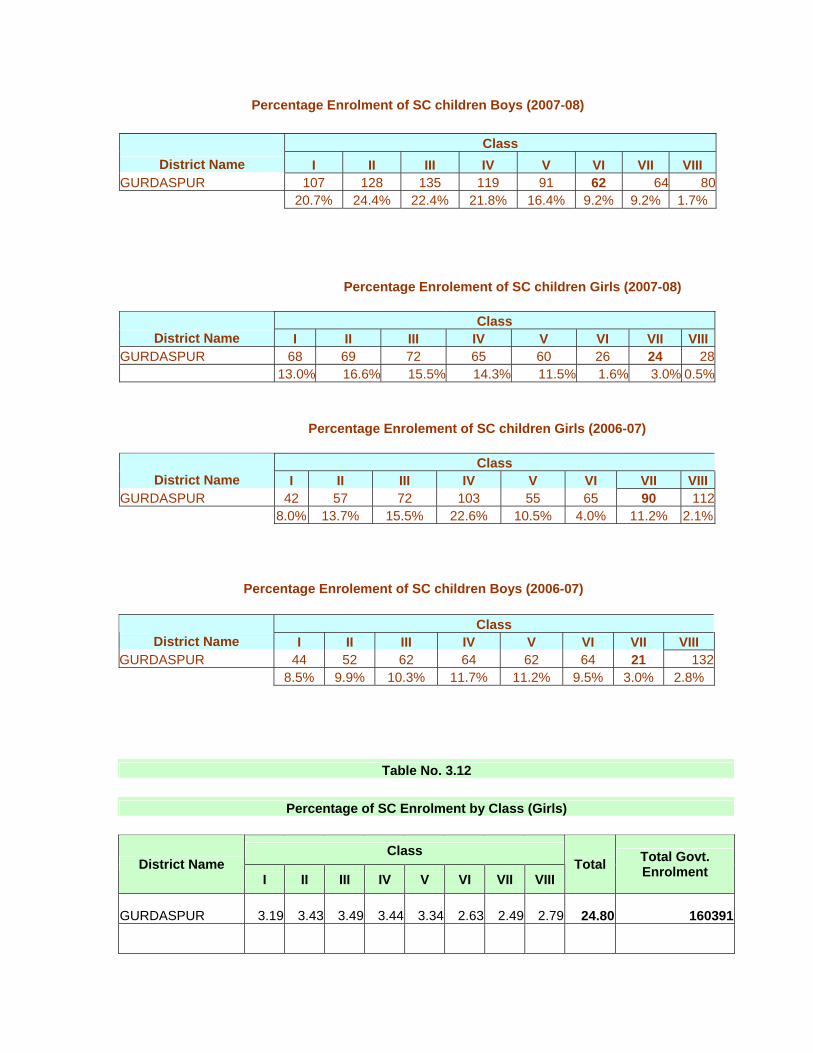
Percentage Enrolment of SC children Boys (2007-08)
Class District Name I II III IV V VI VII VIII
GURDASPUR 107 128 135 119 91 62 64 80 20.7% 24.4% 22.4% 21.8% 16.4% 9.2% 9.2% 1.7% Percentage Enrolement of SC children Girls (2007-08)
Class District Name I II III IV V VI VII VIII
GURDASPUR 68 69 72 65 60 26 24 28 13.0% 16.6% 15.5% 14.3% 11.5% 1.6% 3.0% 0.5% Percentage Enrolement of SC children Girls (2006-07)
Class District Name I II III IV V VI VII VIII
GURDASPUR 42 57 72 103 55 65 90 112 8.0% 13.7% 15.5% 22.6% 10.5% 4.0% 11.2% 2.1% Percentage Enrolement of SC children Boys (2006-07)
Class District Name I II III IV V VI VII VIII
GURDASPUR 44 52 62 64 62 64 21 132 8.5% 9.9% 10.3% 11.7% 11.2% 9.5% 3.0% 2.8%
Table No. 3.12
Percentage of SC Enrolment by Class (Girls)
Class District Name
I II III IV V VI VII VIII Total Total Govt.
Enrolment
GURDASPUR 3.19 3.43 3.49 3.44 3.34 2.63 2.49 2.79 24.80 160391
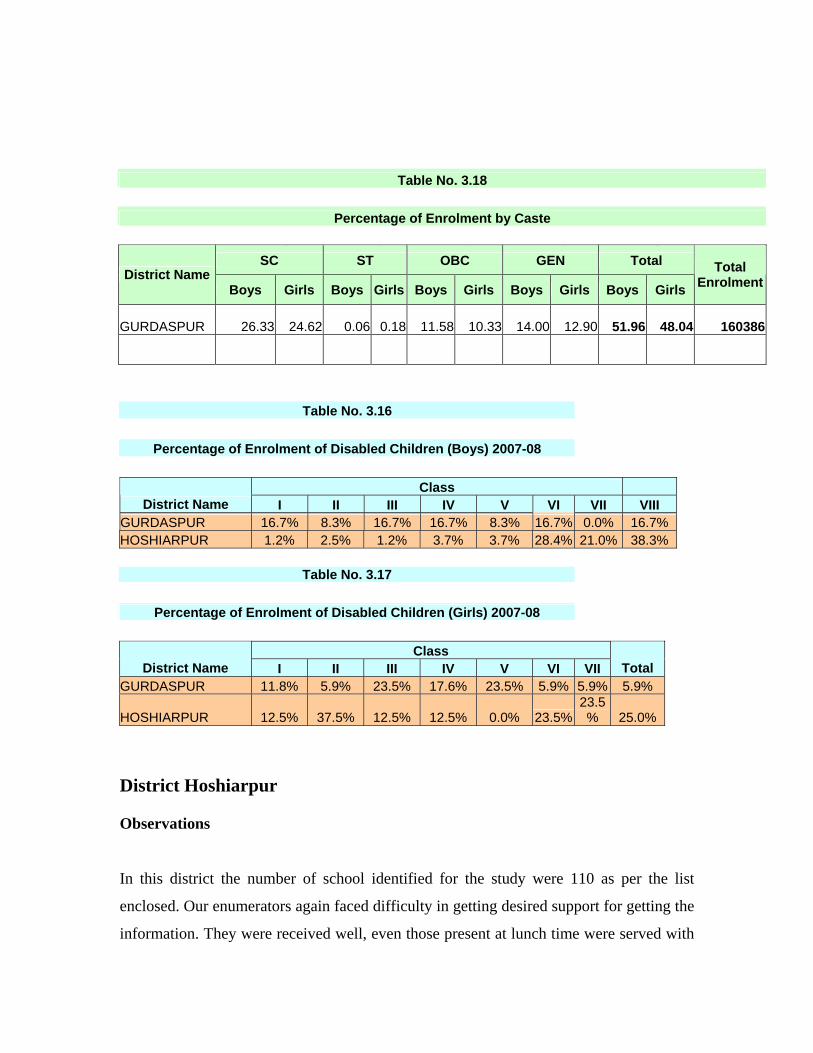
Table No. 3.18
Percentage of Enrolment by Caste
SC ST OBC GEN Total District Name
Boys Girls Boys Girls Boys Girls Boys Girls Boys Girls Total
Enrolment
GURDASPUR 26.33 24.62 0.06 0.18 11.58 10.33 14.00 12.90 51.96 48.04 160386
Table No. 3.16
Percentage of Enrolment of Disabled Children (Boys) 2007-08
Class District Name I II III IV V VI VII VIII
GURDASPUR 16.7% 8.3% 16.7% 16.7% 8.3% 16.7% 0.0% 16.7% HOSHIARPUR 1.2% 2.5% 1.2% 3.7% 3.7% 28.4% 21.0% 38.3%
Table No. 3.17
Percentage of Enrolment of Disabled Children (Girls) 2007-08
Class District Name I II III IV V VI VII Total
GURDASPUR 11.8% 5.9% 23.5% 17.6% 23.5% 5.9% 5.9% 5.9%
HOSHIARPUR 12.5% 37.5% 12.5% 12.5% 0.0% 23.5% 23.5% 25.0%
District Hoshiarpur Observations
In this district the number of school identified for the study were 110 as per the list
enclosed. Our enumerators again faced difficulty in getting desired support for getting the
information. They were received well, even those present at lunch time were served with

mid day meal , which they have appreciated. But no body could find time for providing
the desired information. The schools listed at 11, 50, 51, 55 did not provide any
information.
The incomplete information was available from the school listed at 22, 31, 32, 33, 41, 56,
60, 68, 74, 75, 77 and 85.
The major difference is about enrolment of SC/ ST and OBC which was not part of
the earlier DISE formats and was provided in percentage in your soft copy.
Hoshiarpur Data Tables
NOTE – The data in the lower row ( in brown print) belongs to this study. The
major problem has been no response from many schools identified to be part of
study. There details are given in the beginning remarks.
Table No. 1.1
Percentage of Schools By Year of Establishment
Year of Establishment
District Name Before & In 1990
1991 To 1995 1996 To 2000 2001 To
2005
Total Govt. Schools No response
HOSHIARPUR 89.64 2.94 4.47 2.65 1699
74.55 0.00 3.64 3.64 18.2% The variation could be because of sample.
Table Percentage Schools by Management
School Management
Department Of School Education
Tribal/Social Welfare
Local Body PRI
Priv. Unaided Total Schools
Hoshiarpur 65.45 0.06 1.00 33.49
1699
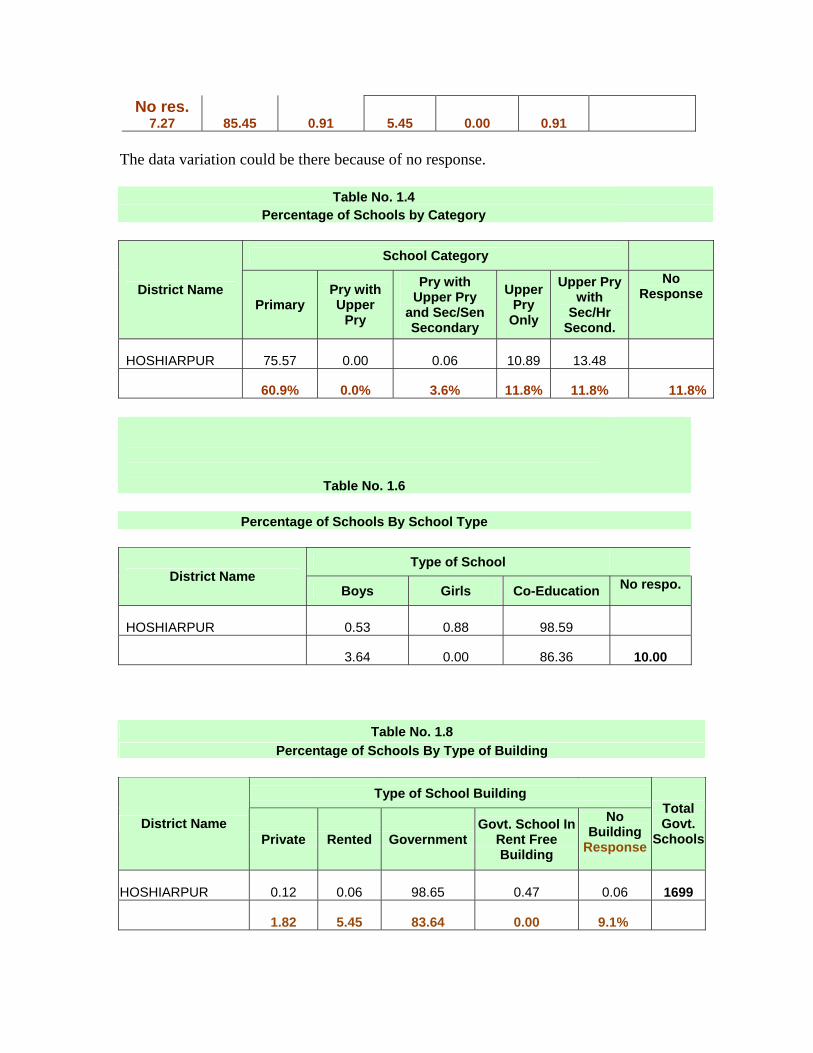
No res. 7.27 85.45 0.91 5.45 0.00 0.91
The data variation could be there because of no response.
Table No. 1.4 Percentage of Schools by Category
School Category
District Name Primary
Pry with Upper
Pry
Pry with Upper Pry
and Sec/Sen Secondary
Upper Pry
Only
Upper Pry with
Sec/Hr Second.
No Response
HOSHIARPUR 75.57 0.00 0.06 10.89 13.48
60.9% 0.0% 3.6% 11.8% 11.8% 11.8%
Table No. 1.6
Percentage of Schools By School Type
Type of School District Name
Boys Girls Co-Education No respo.
HOSHIARPUR 0.53 0.88 98.59
3.64 0.00 86.36 10.00
Table No. 1.8 Percentage of Schools By Type of Building
Type of School Building
District Name Private Rented Government
Govt. School In Rent Free Building
No Building
Response
Total Govt.
Schools
HOSHIARPUR 0.12 0.06 98.65 0.47 0.06 1699
1.82 5.45 83.64 0.00 9.1%

Table No. 1.12
Percentage of Schools By Number of Teachers
Number of Teachers District Name
0 1 2 3 > 3
Total Govt.
Schools
HOSHIARPUR 3.47 9.83 40.73 14.60 31.37 1699
No response (10%) 0 8.0% 35.0% 11.0% 46.0% 110
Table No. 1.14
Percentage of Schools By Number of Classrooms
Number of Classrooms District Name
0 1 2 3 > 3
Total Govt.
Schools
HOSHIARPUR 1.00 4.18 32.08 26.66 36.08 1699
No resp. 13.4% 4.1% 6.2% 15.5% 20.6% 53.6% 97
Table No. 1.16
Percentage of Schools with Facilities
Facilities
District Name Playground Common
Toilet Girls Toilet
Drinking Water Ramp Electricity Staff
toilet
Total Govt.
Schools
HOSHIARPUR 67.39 87.82 84.46 35.90 58.56 83.93 83.76 1699
No response 10 schools 64.5 73.6 78.2 86.4 0.0 87.0 79.1 110

Table No.1.18
Percentage of Schools By PTR (Pupil Teacher Ratio)
PTR (Pupil Teacher Ratio) District Name
>40 >50 >60 >70 >100
Total Govt.
Schools
HOSHIARPUR 86.87 9.48 2.30 0.71 0.65 1699
70.00 3.64 1.82 1.82 0.91
Table No. 1.20
Percentage of Classrooms By Condition
Classrooms District Name Good
Condition Need Minor
Repair Need Major
Repair Total
HOSHIARPUR 67.57 7.92 24.51 6454
82.2% 10.9% 6.9%
Table No. 1.22
Percentage of Single Teacher Schools Category-wise
School Category
District Name Primary
Pry with
Upper Pry
Pry with Upper Pry
and Sec/Sen Secondary
Upper Pry
Only
Upper Pry with Sec/Hr Secondary
No Response
All Schools
Total Govt.
Schools
HOSHIARPUR 9.65 0.00 0.00 0.18 0.00 0.00 9.83 1699
1.82 0.00 0.00 0.00 0.00 11.8
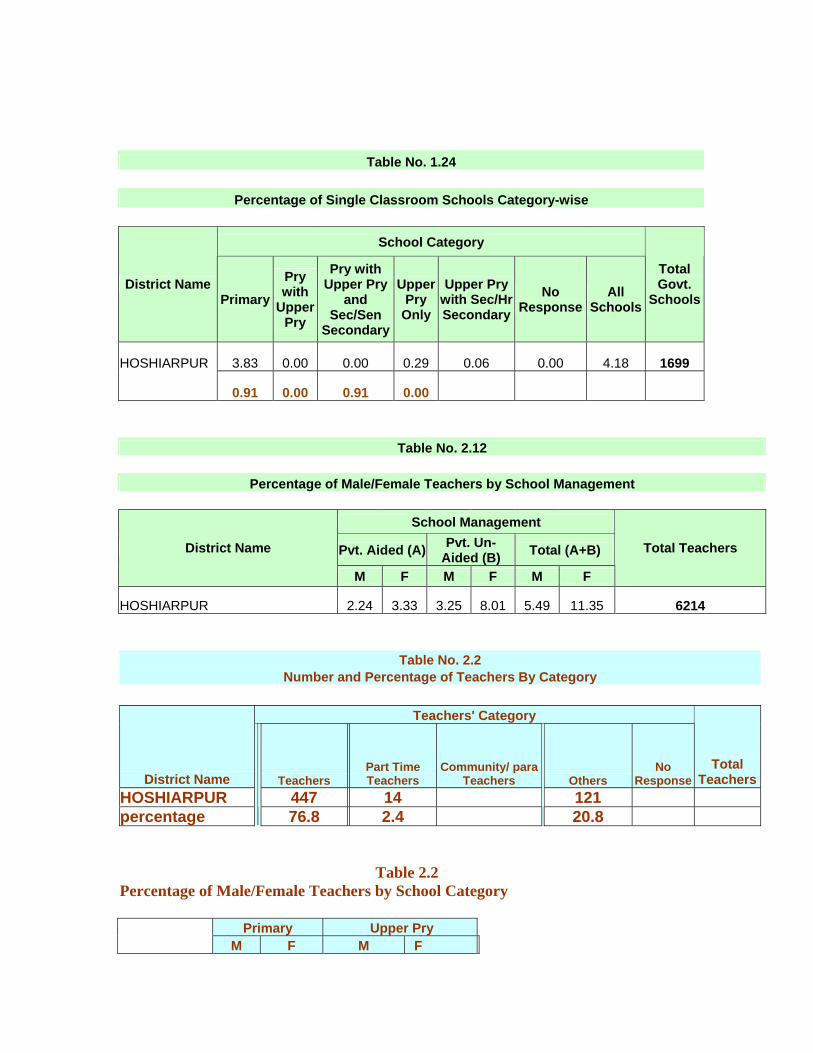
Table No. 1.24
Percentage of Single Classroom Schools Category-wise
School Category
District Name Primary
Pry with
Upper Pry
Pry with Upper Pry
and Sec/Sen
Secondary
Upper Pry
Only
Upper Pry with Sec/Hr Secondary
No Response
All Schools
Total Govt.
Schools
HOSHIARPUR 3.83 0.00 0.00 0.29 0.06 0.00 4.18 1699
0.91 0.00 0.91 0.00
Table No. 2.12
Percentage of Male/Female Teachers by School Management
School Management
Pvt. Aided (A) Pvt. Un-Aided (B) Total (A+B) District Name
M F M F M F
Total Teachers
HOSHIARPUR 2.24 3.33 3.25 8.01 5.49 11.35 6214
Table No. 2.2 Number and Percentage of Teachers By Category
Teachers' Category
District Name Teachers Part Time Teachers
Community/ para Teachers Others
No Response
Total Teachers
HOSHIARPUR 447 14 121 percentage 76.8 2.4 20.8
Table 2.2 Percentage of Male/Female Teachers by School Category
Primary Upper Pry M F M F
HOSHIARPUR 35.3% 64.7% 62.8% 37.2%
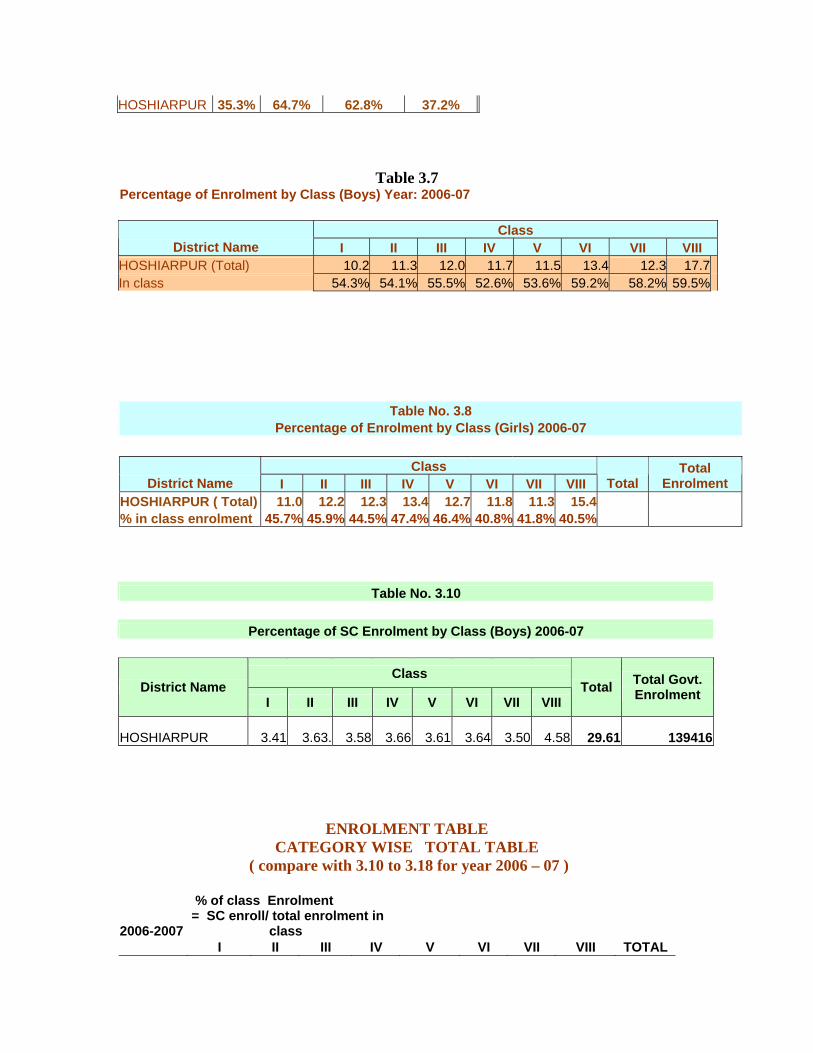
Table 3.7 Percentage of Enrolment by Class (Boys) Year: 2006-07
Class District Name I II III IV V VI VII VIII
HOSHIARPUR (Total) 10.2 11.3 12.0 11.7 11.5 13.4 12.3 17.7 In class 54.3% 54.1% 55.5% 52.6% 53.6% 59.2% 58.2% 59.5%
Table No. 3.8 Percentage of Enrolment by Class (Girls) 2006-07
Class
District Name I II III IV V VI VII VIII Total Total
Enrolment HOSHIARPUR ( Total) 11.0 12.2 12.3 13.4 12.7 11.8 11.3 15.4 % in class enrolment 45.7% 45.9% 44.5% 47.4% 46.4% 40.8% 41.8% 40.5%
Table No. 3.10
Percentage of SC Enrolment by Class (Boys) 2006-07
Class District Name
I II III IV V VI VII VIII Total Total Govt.
Enrolment
HOSHIARPUR 3.41 3.63. 3.58 3.66 3.61 3.64 3.50 4.58 29.61 139416
ENROLMENT TABLE CATEGORY WISE TOTAL TABLE
( compare with 3.10 to 3.18 for year 2006 – 07 )
2006-2007
% of class Enrolment = SC enroll/ total enrolment in class
I II III IV V VI VII VIII TOTAL

enrolment
SC-Girls 26.6% 26.9% 25.5% 27.2% 27.3% 23.8% 23.2% 22.8% 2154SC-B 32.1% 30.3% 30.2% 31.5% 27.5% 35.5% 33.1% 32.6% 2699
ST-G 0.2% 0.2% 0.1% 0.1% 0.3% 0.6% 0.8% 1.1% 39ST-B 0.7% 0.6% 0.3% 0.8% 0.2% 0.7% 0.6% 0.6% 47OBC-G 11.0% 10.7% 12.0% 11.4% 11.4% 6.1% 6.0% 5.0% 765OBC-B 12.7% 14.0% 13.6% 11.7% 15.4% 9.5% 9.0% 10.0% 1012 2006-2007 Percent of Enrolment of Year I II III IV V VI VII VIII SC-Girls 11.1% 12.4% 12.3% 13.4% 13.0% 11.9% 10.9% 15.0%
SC-B 10.7% 11.2% 11.6% 12.4% 10.4% 14.2% 12.4% 17.2%ST-G 5.1% 5.1% 2.6% 2.6% 7.7% 17.9% 20.5% 38.5%ST-B 12.8% 12.8% 6.4% 17.0% 4.3% 17.0% 12.8% 17.0%OBC-G 12.9% 14.0% 16.2% 15.8% 15.3% 8.6% 7.8% 9.3%OBC-B 11.3% 13.8% 13.9% 12.3% 15.6% 10.1% 9.0% 14.0% There is large variation in percentage of enrolment of SC students be it boys or girls.
Finding from this study are given in the tables
Table No. 3.12
Percentage of SC Enrolment by Class (Girls)
Class District Name
I II III IV V VI VII VIII Total Total Govt.
Enrolment
HOSHIARPUR 3.00 3.11 3.09 3.17 3.27 3.47 3.39 4.60 27.10 139416
Table No. 3.18

Percentage of Enrolment by Caste
SC ST OBC GEN Total District Name
Boys Girls Boys Girls Boys Girls Boys Girls Boys Girls
Total Enrolme
nt
HOSHIARPUR 29.49 27.00 0.11 0.10 11.01 9.89 12.08 10.32 52.69 47.31 139416
70.3% 57.6% 1.2% 1.0% 26.4% 20.4% 2.1% 21.0% 50.6% 49.4% 7579 There is large difference in percentages. As this field was not part of the earlier
DISE data ( as per the questionnaires provided to Datamation, New Delhi for
comparison) this data needs to be verified.
CLASS-WISE ENROLMENT DATA Percentage of Enrolment of Boys ( 2007-08 ) HOSHIARPUR 56.9% 55.3% 57.1% 55.4% 54.8% 56.8% 56.9% 59.0%
Percentage of Enrolment of Boys ( 2006-2007 ) HOSHIARPUR 54.3%
54.1% 55.5% 52.6% 53.6% 59.2% 58.2% 59.5% Percentage of Enrolment of Girls ( 2007-08 ) HOSHIARPUR 43.1% 44.7% 42.9% 44.6% 45.2% 43.2% 43.1% 41.0%
Percentage Enrolment by Girls (2006-2007) HOSHIARPUR 11.0 12.2 12.3 13.4 12.7 11.8 11.3 15.4
There seems to be improvement in girls enrolment.

Class-wise Percentage Enrolment for respective Gender
( 2007- 2008) I II III IV V VI VII VIII ST-B 0.9% 0.7%ST-G 1.7% 1.4%SC-G 46.7% 54.7% 57.5% 57.1% 54.6% 57.1% 56.3% 54.8%SC-B 55.9% 55.0% 52.6% 58.8% 59.3% 58.0% 58.3% 56.1%OBC-G 20.4% 32.6% 26.0% 27.8% 25.4% 16.4% 11.8% 12.6%
OBC-B 29.7% 25.9% 28.2% 25.4% 23.5% 22.8% 10.0% 11.1%Gen-B 19.0% 23.6% 25.5% 19.6% 20.9% 25.3% 40.7% 46.2%
Gen-G 18.0% 12.7% 16.5% 15.1% 20.0% 26.5% 30.3% 31.1%

District Name : Bathinda Total No. of Schools : 50
Sr. No. CD Block Name Village Name School Name 01 BATHINDA ABLU GPS ABLU 02 BATHINDA AKLIA KALAN G Gobind Singh Pub Sch Aklia Kalan 03 BATHINDA AKLIA KHURD GPS AKLIA KHURD 04 BATHINDA BALLUANA GSSS BALLUANA 05 BATHINDA BARKANDI GPS BARKANDI 06 BATHINDA BEER BEHMAN GHS BEER BEHMAN 07 BATHINDA BEHMAN DIWANA GSSS BEHMAN DIWANA 08 BATHINDA BHAGU GPS BHAGU 09 BATHINDA BHISIANA GPS BHISIANA 10 BATHINDA BALAHAR MEHMA GMS BALAHAR MEHMA 11 BATHINDA GANGA GHS GANGA 12 BATHINDA JANDA WALA GPS (BR) JANDA WALA 13 BATHINDA JHUMBA GPS JHUMBA 14 BATHINDA KOTHE KAUR SINGH GPS KOTHE KAUR SINGH 15 BATHINDA NARUANA GSSS NARUANA 16 BHAGTA BHAI KA AKLIA JALAL GPS AKLIA JALAL 17 BHAGTA BHAI KA BHAGTA GSSS BHAGTA 18 BHAGTA BHAI KA BURJ THROR GMS BURJ THROR 19 BHAGTA BHAI KA GURUSAR PHUL GPS GURUSAR PHUL 20 BHAGTA BHAI KA RAMUWALA GPS RAMUWALA 21 MAUR BHAI BAKHTAUR GPS BHAI BAKHTAUR 22 MAUR CHANARTHAL GPS CHANARTHAL 23 MAUR KAMALU S GPS KAMALU S 24 MAUR KUTIWAL KALAN GSSS KUTTIWAL KALAN 25 MAUR SANDOHA GPS SANDOHA 26 NATHANA BHAINI GPS BHAINI 27 NATHANA BHUCHO KHURD GPS BHUCHO KHURD 28 NATHANA BHUCHO KHURD ST KABIR CONV SCH BHUCHO KHURD 29 NATHANA BURJ DALLA GPS BURJ DALLA 30 NATHANA LEHRA KHANA GPS LEHRA KHANA 31 PHUL BHAI RUPA GSSS BHAI RUPA 32 PHUL ALI KE GPS ALI KE 33 PHUL DHINGER GPS DHINGAR 34 PHUL PHUL TOWN GPS PHUL TOWN (G) 35 PHUL SADHANA GPS SADHANA 36 RAMPURA BADIALA GMS BADIALA 37 RAMPURA BHUNDER GPS BHUNDER 38 RAMPURA DHADE GPS DHADE 39 RAMPURA JETHUKE GSSS JETHU KE 40 SANGAT BAJAK GPS BAJAK 41 SANGAT BANDI GHS BANDI 42 SANGAT Kal Jharani Dashmesh Public Sch Kal Jharani 43 SANGAT DHUNI KE GPS DHUNI KE

44 SANGAT GEHRI BUTER GSSS GEHRI BUTTER 45 TALWANDI BANGI KALAN GPS BANGI KALAN 46 TALWANDI BHAGI WANDER GSSS BHAGI WANDER 47 TALWANDI GIANA GHS GIANA 48 TALWANDI JOGEWALA GPS JOGEWALA 49 TALWANDI Talwandi Sabo Tagore Public Sch Talwandi Sabo 50 TALWANDI TEONA PUJARIAN GPS TEONA PUJARIAN
Dist Gurdaspur
Total No. of Schools : 115
District : Gurdaspur
Sr.no. Block Name Village Name School Name SCHOOL CODE
01 BAMIAL BAMIAL GPS BAMIAL
02 BAMIAL BALOTAR GPS BALOTRA
03 BATALA QILLA LAL SINGH GPS QILLA LAL SINGH
04 BATALA TARAGARH GES TARAGARH
05 BATALA AHMEDABAD GPS AHMEDABAD
06 BATALA KARWALIAN GPS KARWALIAN
07 BATALA DHOULPUR GPS DHOULPUR
08 BATALA HARRUWAL GPS HARRUWAL
09 BATALA DIALGARH GSSS DIALGARH
10 BATALA BATALA GPS BATALA
11 DERA BABA NANAK SANGTUWAL GPS SANGTUWAL
12 DERA BABA NANAK UMARWAL GPS UMARWAL
13 DERA BABA NANAK RUPOWALI GMS RUPOWALI
14 DERA BABA NANAK TALWANDI GORAYA ST. THOMAS SCHOOL
15 DERA BABA NANAK MOOLOWALI GPS MOOLOWALI
16 DHAR KALAN SHAHPUR KANDI GMS SK
17 DHAR KALAN UCHA THARA GSSS UCHHA TAHAR
18 DHAR KALAN DURANG KHAD GPS DK
19 DHAR KALAN DHAR KALAN GPS DHAR KALAN
20 DHAR KALAN TAHRA GPS TAHREA
21 DHARIWAL DHARIWAL KALAN GMS DHARIWAL KALAN
22 DHARIWAL KHAN MALAK GPS KHAN MALAK
23 DHARIWAL SUJANPUR GPS SUJANPUR
24 DHARIWAL MALIAN FAQIRAN GPS MALIAN FAQIRAN
25 DHARIWAL ZAFFARWAL GSSS ZAFFARWAL
26 DHARIWAL KHUNDA BABA FARID MODERN SCH KHUNDA
27 DHARIWAL GODHERPUR GPS GODHERPUR
28 DHARIWAL GHUMAN KALAN GSSS GHUMAN KALAN
29 DINANAGAR UDHIPUR GPS UDHIPUR
30 DINANAGAR DODWAN GES DODWAN

31 DINANAGAR MAJITHI GPS MAJITHI
32 DINANAGAR JHABKARA GHS JHABKRA
33 DINANAGAR SHAHPUR GES SHAHPUR
34 DINANAGAR CHOUNTA GSSS CHAUNTA
35 DINANAGAR BHAGWANPUR GPS BHAFWANPUR
36 DINANAGAR SIRKIAN GPS SIRIKIAN
37 DORANGLA SHAMSHERPUR GPS SHAMSHERPUR
38 DORANGLA MUGHLANI CHAK GPS MUGALANI CHAK
39 DORANGLA NAUSHERA GPS NAUSHERA
40 FATEHGARH CHURIAN
BATALA GURU RAM DASS PUBLIC SCHOOL
41 FATEHGARH CHURIAN
UGREWAL GPS UGREWAL
42 FATEHGARH CHURIAN
ATHWAL GPS ATHWAL
43 FATEHGARH CHURIAN
KOT MAJLAS GPS KOT MAJLAS
44 FATEHGARH CHURIAN
KASTIWAL GPS KASTIWAL
45 FATEHGARH CHURIAN
KULAR GPS KULAR
46 FATEHGARH CHURIAN
PANWAN GPS PANWAN
47 FATEHGARH CHURIAN
KALA AFGANA NEW MODREN PUBLIC SEN.SEC.SCH.
48 FATEHGARH CHURIAN
MARRAR GHS MARRAR
49 FATEHGARH CHURIAN
FATEHGARH CHURAIN GGSSS FATEHGARH CHURIAN
50 FATEHGARH CHURIAN
HARDORWAL KALAN GSSS HARDOWAL
51 GURDASPUR MACHLA GPS MACHLA
52 GURDASPUR KOUNTA GPS KOUNTA
53 GURDASPUR BARIAR GHS BARIAR
54 GURDASPUR NP HUNDAL GPS NAWA PIND HUNDAL
55 GURDASPUR KHICHIAN GPS KHICHIAN
56 GURDASPUR PAKHOWAL GPS PAKHOWAL
57 GURDASPUR BABEHALI RATAN SAGAR HIGH SCHOL
58 GURDASPUR PUROWAL ARIAN GPS PUROWAL ARIAN
59 GURDASPUR TIBRI GMS TIBRI
60 GURDASPUR BHATTHA COLONY GPS BHATHA COLNY
61 GURDASPUR AMIPUR GPS AMIPUR
62 KAHNUWAN THIKRIWAL GPS THIKRIWAL
63 KAHNUWAN SAHAIPUR GPS SAHAIPUR
64 KAHNUWAN MARRE GPS MARRE
65 KAHNUWAN CHAK SARIF GMS CHAK SARIF
66 KAHNUWAN JOGOWAL BET GSSS JAGOWAL BET
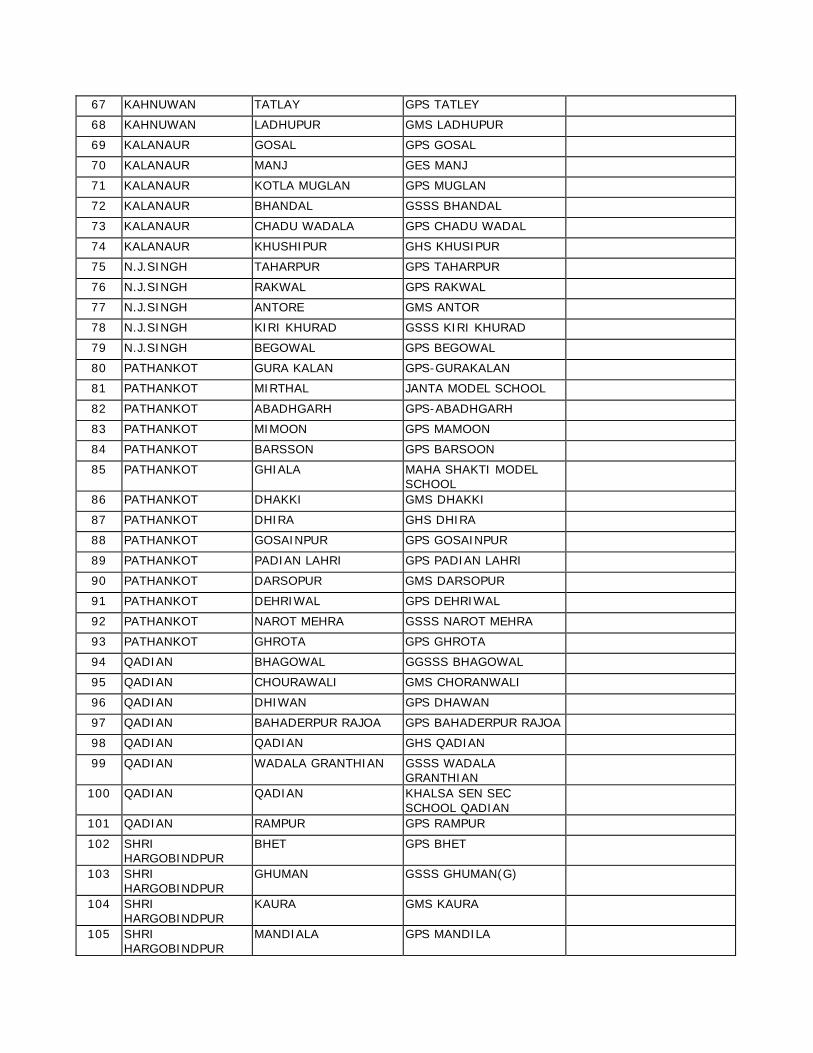
67 KAHNUWAN TATLAY GPS TATLEY
68 KAHNUWAN LADHUPUR GMS LADHUPUR
69 KALANAUR GOSAL GPS GOSAL
70 KALANAUR MANJ GES MANJ
71 KALANAUR KOTLA MUGLAN GPS MUGLAN
72 KALANAUR BHANDAL GSSS BHANDAL
73 KALANAUR CHADU WADALA GPS CHADU WADAL
74 KALANAUR KHUSHIPUR GHS KHUSIPUR
75 N.J.SINGH TAHARPUR GPS TAHARPUR
76 N.J.SINGH RAKWAL GPS RAKWAL
77 N.J.SINGH ANTORE GMS ANTOR
78 N.J.SINGH KIRI KHURAD GSSS KIRI KHURAD
79 N.J.SINGH BEGOWAL GPS BEGOWAL
80 PATHANKOT GURA KALAN GPS-GURAKALAN
81 PATHANKOT MIRTHAL JANTA MODEL SCHOOL
82 PATHANKOT ABADHGARH GPS-ABADHGARH
83 PATHANKOT MIMOON GPS MAMOON
84 PATHANKOT BARSSON GPS BARSOON
85 PATHANKOT GHIALA MAHA SHAKTI MODEL SCHOOL
86 PATHANKOT DHAKKI GMS DHAKKI
87 PATHANKOT DHIRA GHS DHIRA
88 PATHANKOT GOSAINPUR GPS GOSAINPUR
89 PATHANKOT PADIAN LAHRI GPS PADIAN LAHRI
90 PATHANKOT DARSOPUR GMS DARSOPUR
91 PATHANKOT DEHRIWAL GPS DEHRIWAL
92 PATHANKOT NAROT MEHRA GSSS NAROT MEHRA
93 PATHANKOT GHROTA GPS GHROTA
94 QADIAN BHAGOWAL GGSSS BHAGOWAL
95 QADIAN CHOURAWALI GMS CHORANWALI
96 QADIAN DHIWAN GPS DHAWAN
97 QADIAN BAHADERPUR RAJOA GPS BAHADERPUR RAJOA
98 QADIAN QADIAN GHS QADIAN
99 QADIAN WADALA GRANTHIAN GSSS WADALA GRANTHIAN
100 QADIAN QADIAN KHALSA SEN SEC SCHOOL QADIAN
101 QADIAN RAMPUR GPS RAMPUR
102 SHRI HARGOBINDPUR
BHET GPS BHET
103 SHRI HARGOBINDPUR
GHUMAN GSSS GHUMAN(G)
104 SHRI HARGOBINDPUR
KAURA GMS KAURA
105 SHRI HARGOBINDPUR
MANDIALA GPS MANDILA
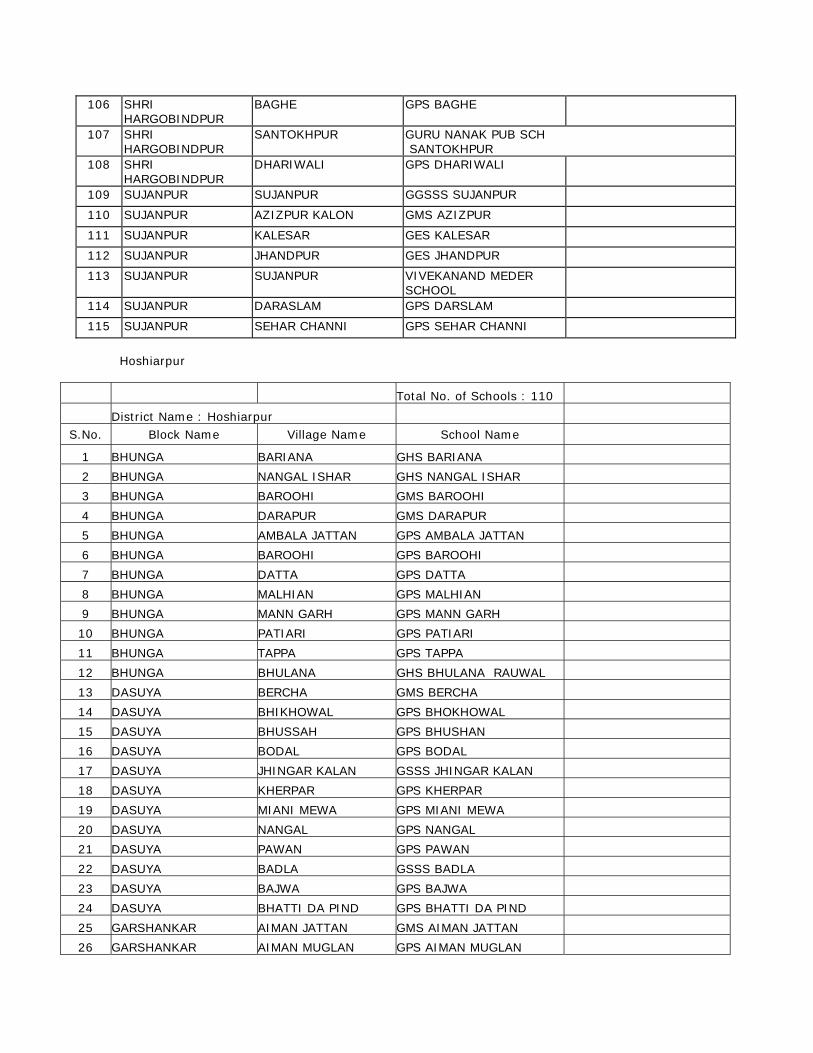
106 SHRI HARGOBINDPUR
BAGHE GPS BAGHE
107 SHRI HARGOBINDPUR
SANTOKHPUR GURU NANAK PUB SCH SANTOKHPUR
108 SHRI HARGOBINDPUR
DHARIWALI GPS DHARIWALI
109 SUJANPUR SUJANPUR GGSSS SUJANPUR
110 SUJANPUR AZIZPUR KALON GMS AZIZPUR
111 SUJANPUR KALESAR GES KALESAR
112 SUJANPUR JHANDPUR GES JHANDPUR
113 SUJANPUR SUJANPUR VIVEKANAND MEDER SCHOOL
114 SUJANPUR DARASLAM GPS DARSLAM
115 SUJANPUR SEHAR CHANNI GPS SEHAR CHANNI
Hoshiarpur
Total No. of Schools : 110
District Name : Hoshiarpur S.No. Block Name Village Name School Name
1 BHUNGA BARIANA GHS BARIANA
2 BHUNGA NANGAL ISHAR GHS NANGAL ISHAR
3 BHUNGA BAROOHI GMS BAROOHI
4 BHUNGA DARAPUR GMS DARAPUR
5 BHUNGA AMBALA JATTAN GPS AMBALA JATTAN
6 BHUNGA BAROOHI GPS BAROOHI
7 BHUNGA DATTA GPS DATTA
8 BHUNGA MALHIAN GPS MALHIAN
9 BHUNGA MANN GARH GPS MANN GARH
10 BHUNGA PATIARI GPS PATIARI
11 BHUNGA TAPPA GPS TAPPA
12 BHUNGA BHULANA GHS BHULANA RAUWAL
13 DASUYA BERCHA GMS BERCHA
14 DASUYA BHIKHOWAL GPS BHOKHOWAL
15 DASUYA BHUSSAH GPS BHUSHAN
16 DASUYA BODAL GPS BODAL
17 DASUYA JHINGAR KALAN GSSS JHINGAR KALAN
18 DASUYA KHERPAR GPS KHERPAR
19 DASUYA MIANI MEWA GPS MIANI MEWA
20 DASUYA NANGAL GPS NANGAL
21 DASUYA PAWAN GPS PAWAN
22 DASUYA BADLA GSSS BADLA
23 DASUYA BAJWA GPS BAJWA
24 DASUYA BHATTI DA PIND GPS BHATTI DA PIND
25 GARSHANKAR AIMAN JATTAN GMS AIMAN JATTAN
26 GARSHANKAR AIMAN MUGLAN GPS AIMAN MUGLAN
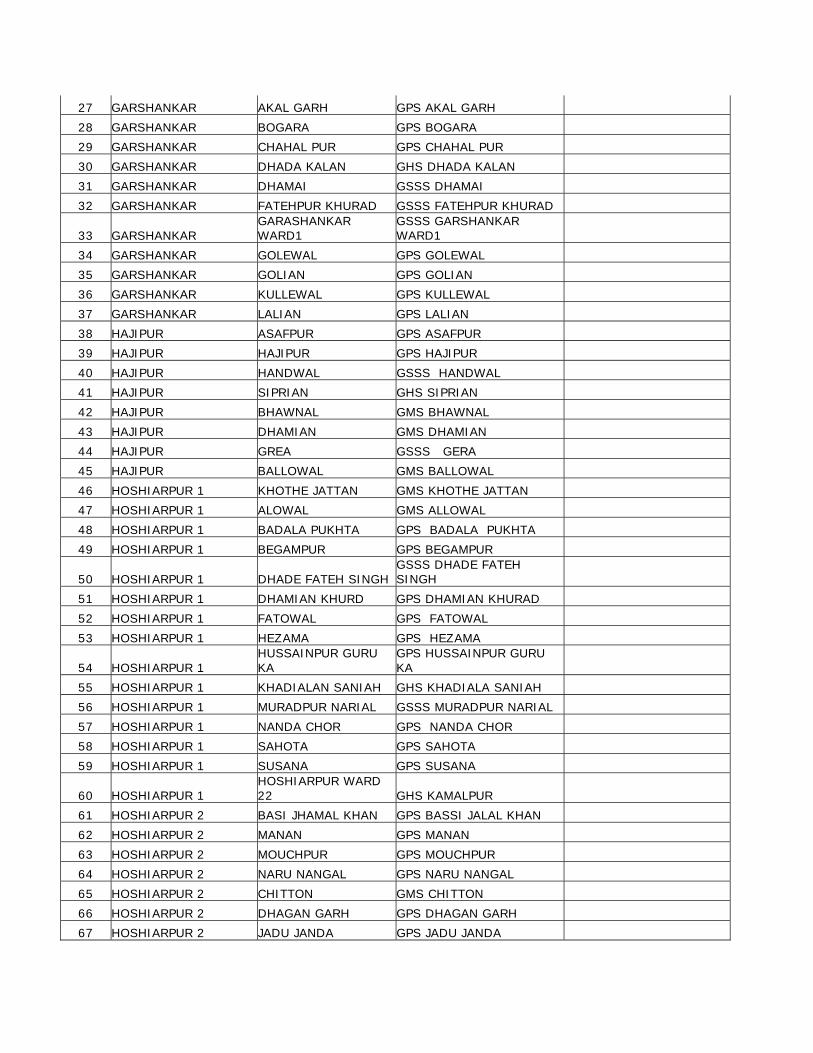
27 GARSHANKAR AKAL GARH GPS AKAL GARH
28 GARSHANKAR BOGARA GPS BOGARA
29 GARSHANKAR CHAHAL PUR GPS CHAHAL PUR
30 GARSHANKAR DHADA KALAN GHS DHADA KALAN
31 GARSHANKAR DHAMAI GSSS DHAMAI
32 GARSHANKAR FATEHPUR KHURAD GSSS FATEHPUR KHURAD
33 GARSHANKAR GARASHANKAR WARD1
GSSS GARSHANKAR WARD1
34 GARSHANKAR GOLEWAL GPS GOLEWAL
35 GARSHANKAR GOLIAN GPS GOLIAN
36 GARSHANKAR KULLEWAL GPS KULLEWAL
37 GARSHANKAR LALIAN GPS LALIAN
38 HAJIPUR ASAFPUR GPS ASAFPUR
39 HAJIPUR HAJIPUR GPS HAJIPUR
40 HAJIPUR HANDWAL GSSS HANDWAL
41 HAJIPUR SIPRIAN GHS SIPRIAN
42 HAJIPUR BHAWNAL GMS BHAWNAL
43 HAJIPUR DHAMIAN GMS DHAMIAN
44 HAJIPUR GREA GSSS GERA
45 HAJIPUR BALLOWAL GMS BALLOWAL
46 HOSHIARPUR 1 KHOTHE JATTAN GMS KHOTHE JATTAN
47 HOSHIARPUR 1 ALOWAL GMS ALLOWAL
48 HOSHIARPUR 1 BADALA PUKHTA GPS BADALA PUKHTA
49 HOSHIARPUR 1 BEGAMPUR GPS BEGAMPUR
50 HOSHIARPUR 1 DHADE FATEH SINGH GSSS DHADE FATEH SINGH
51 HOSHIARPUR 1 DHAMIAN KHURD GPS DHAMIAN KHURAD
52 HOSHIARPUR 1 FATOWAL GPS FATOWAL
53 HOSHIARPUR 1 HEZAMA GPS HEZAMA
54 HOSHIARPUR 1 HUSSAINPUR GURU KA
GPS HUSSAINPUR GURU KA
55 HOSHIARPUR 1 KHADIALAN SANIAH GHS KHADIALA SANIAH
56 HOSHIARPUR 1 MURADPUR NARIAL GSSS MURADPUR NARIAL
57 HOSHIARPUR 1 NANDA CHOR GPS NANDA CHOR
58 HOSHIARPUR 1 SAHOTA GPS SAHOTA
59 HOSHIARPUR 1 SUSANA GPS SUSANA
60 HOSHIARPUR 1 HOSHIARPUR WARD 22 GHS KAMALPUR
61 HOSHIARPUR 2 BASI JHAMAL KHAN GPS BASSI JALAL KHAN
62 HOSHIARPUR 2 MANAN GPS MANAN
63 HOSHIARPUR 2 MOUCHPUR GPS MOUCHPUR
64 HOSHIARPUR 2 NARU NANGAL GPS NARU NANGAL
65 HOSHIARPUR 2 CHITTON GMS CHITTON
66 HOSHIARPUR 2 DHAGAN GARH GPS DHAGAN GARH
67 HOSHIARPUR 2 JADU JANDA GPS JADU JANDA
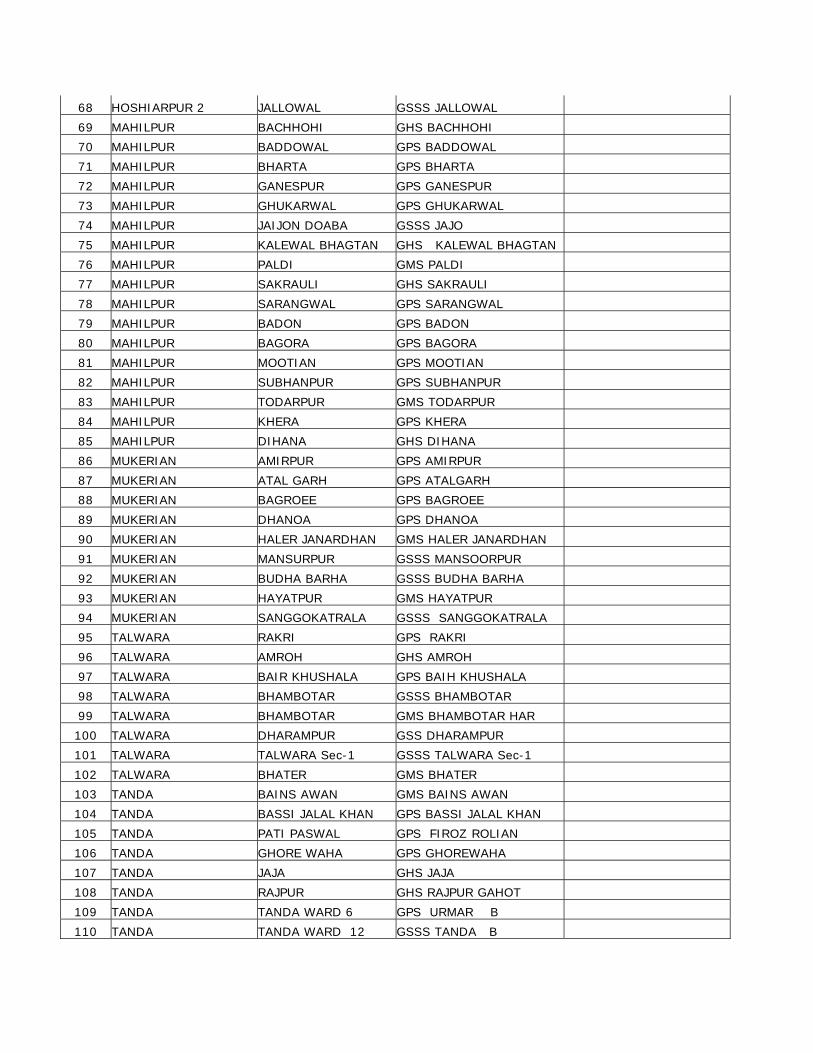
68 HOSHIARPUR 2 JALLOWAL GSSS JALLOWAL
69 MAHILPUR BACHHOHI GHS BACHHOHI
70 MAHILPUR BADDOWAL GPS BADDOWAL
71 MAHILPUR BHARTA GPS BHARTA
72 MAHILPUR GANESPUR GPS GANESPUR
73 MAHILPUR GHUKARWAL GPS GHUKARWAL
74 MAHILPUR JAIJON DOABA GSSS JAJO
75 MAHILPUR KALEWAL BHAGTAN GHS KALEWAL BHAGTAN
76 MAHILPUR PALDI GMS PALDI
77 MAHILPUR SAKRAULI GHS SAKRAULI
78 MAHILPUR SARANGWAL GPS SARANGWAL
79 MAHILPUR BADON GPS BADON
80 MAHILPUR BAGORA GPS BAGORA
81 MAHILPUR MOOTIAN GPS MOOTIAN
82 MAHILPUR SUBHANPUR GPS SUBHANPUR
83 MAHILPUR TODARPUR GMS TODARPUR
84 MAHILPUR KHERA GPS KHERA
85 MAHILPUR DIHANA GHS DIHANA
86 MUKERIAN AMIRPUR GPS AMIRPUR
87 MUKERIAN ATAL GARH GPS ATALGARH
88 MUKERIAN BAGROEE GPS BAGROEE
89 MUKERIAN DHANOA GPS DHANOA
90 MUKERIAN HALER JANARDHAN GMS HALER JANARDHAN
91 MUKERIAN MANSURPUR GSSS MANSOORPUR
92 MUKERIAN BUDHA BARHA GSSS BUDHA BARHA
93 MUKERIAN HAYATPUR GMS HAYATPUR
94 MUKERIAN SANGGOKATRALA GSSS SANGGOKATRALA
95 TALWARA RAKRI GPS RAKRI
96 TALWARA AMROH GHS AMROH
97 TALWARA BAIR KHUSHALA GPS BAIH KHUSHALA
98 TALWARA BHAMBOTAR GSSS BHAMBOTAR
99 TALWARA BHAMBOTAR GMS BHAMBOTAR HAR
100 TALWARA DHARAMPUR GSS DHARAMPUR
101 TALWARA TALWARA Sec-1 GSSS TALWARA Sec-1
102 TALWARA BHATER GMS BHATER
103 TANDA BAINS AWAN GMS BAINS AWAN
104 TANDA BASSI JALAL KHAN GPS BASSI JALAL KHAN
105 TANDA PATI PASWAL GPS FIROZ ROLIAN
106 TANDA GHORE WAHA GPS GHOREWAHA
107 TANDA JAJA GHS JAJA
108 TANDA RAJPUR GHS RAJPUR GAHOT
109 TANDA TANDA WARD 6 GPS URMAR B
110 TANDA TANDA WARD 12 GSSS TANDA B