publication.pdf - Journal of Environmental Sciences
298
-
Upload
khangminh22 -
Category
Documents
-
view
0 -
download
0
Transcript of publication.pdf - Journal of Environmental Sciences


Editorial Board of Journal of Environmental Sciences
Copyright© Research Center for Eco-Environmental Sciences, Chinese Academy of Sciences. Published by Elsevier B.V. and Science Press. All rights reserved.
Editor-in-Chief
Advisory Board
Associate Editors
Editorial Board
Editorial OfficeManaging editor
Editors
English editor
Address
Zixuan WangSuqin LiuKuo LiuZhen-gang Mao
Catherine Rice, USA
18 Shuangqing Road,Haidian District,Beijing 100085, China
Qingcai Feng
X. Chris Le University of Alberta, Canada
William MitchJiuhui QuSusan RichardsonJerald L. SchnoorHongxiao TangShu TaoHugh A. Tilson
Christopher AndersonZucong CaiZongwei CaiJianmin ChenJiping ChenJingwen ChenMaohong FanXinbin FengBaoyu GaoHong HePinjing HeHenner HollertHongqing HuJianying HuChihpin HuangGuibin JiangErwin KlumppKin-Che LamJae-Seong LeeJunhua LiPeijun LiXing-Fang LiClark C. K. LiuSijin LiuAbdelwahid MelloukiYujing MuTsuyoshi NakanishiWun Jern NgWillie PeijnenburgChristopher RensingJames Jay SchauerMichael SchloterBojan SedmakMin ShaoWenfeng ShangguanHokyong ShonLirong SongChunxia WangChonggang WangYuesi WangXuejun WangZhiwu WangZijian WangYuxiang WangGehong WeiMin YangRalph T. YangXin YangZhifeng YangDaqiang YinHanqing YuZhongtang YuMinghui ZhengBingsheng ZhouLizhong Zhu
Massey University, New ZealandNanjing Normal University, ChinaHong Kong Baptist University, Hong Kong, ChinaFudan University, ChinaDalian Institute of Chemical Physics, Chinese Academy of Sciences, ChinaDalian University of Technology, ChinaUniversity of Wyoming, USAInstitute of Geochemistry, Chinese Academy of Sciences, ChinaShandong University, ChinaResearch Center for Eco-Environmental Sciences, Chinese Academy of Sciences, ChinaTongji University, ChinaRWTH Aachen University, GermanyHuazhong Agricultural University, ChinaPeking University, ChinaNational Chiao Tung University,Taiwan, ChinaResearch Center for Eco-Environmental Sciences, Chinese Academy of Sciences, ChinaResearch Centre Juelich, Agrosphere Institute, GermanyThe Chinese University of Hong Kong, Hong Kong, ChinaSungkyunkwan University, Republic of KoreaTsinghua University, ChinaInstitute of Applied Ecology, Chinese Academy of Sciences, ChinaUniversity of Alberta, CanadaUniversity of Hawaii at Manoa, USAResearch Center for Eco-Environmental Sciences, Chinese Academy of Sciences, ChinaCentre National de la Recherche Scientifique, FranceResearch Center for Eco-Environmental Sciences, Chinese Academy of Sciences, ChinaGifu Pharmaceutical University, JapanNanyang Environment & Water Research Institute, SingaporeUniversity of Leiden, The NetherlandsUniversity of Copenhagen, DenmarkUniversity of Wisconsin-Madison, USAGerman Research Center for Environmental Health, GermanyNational Institute of Biology, SloveniaPeking University, ChinaShanghai Jiao Tong University, ChinaUniversity of Technology, Sydney, AustraliaInstitute of Hydrobiology, Chinese Academy of Sciences, ChinaNational Natural Science Foundation of China, ChinaXiamen University, ChinaInstitute of Atmospheric Physics, Chinese Academy of Sciences, ChinaPeking University, ChinaThe Ohio State University, USAResearch Center for Eco-Environmental Sciences, Chinese Academy of Sciences, ChinaQueen’s University, CanadaNorthwest A&F University, ChinaResearch Center for Eco-Environmental Sciences, Chinese Academy of Sciences, ChinaUniversity of Michigan, USABritish Antarctic Survey, UKBeijing Normal University, ChinaTongji University, ChinaUniversity of Science & Technology of China, ChinaThe Ohio State University, USAResearch Center for Eco-Environmental Sciences, Chinese Academy of Sciences, ChinaInstitute of Hydrobiology, Chinese Academy of Sciences, ChinaZhejiang University, China
Yong CaiPaul K. S. LamJonathan MartinMichael J. PlewaPo-Keung Wong
Florida International University, USAHong Kong Baptist University, Hong Kong, ChinaUniversity of Alberta, CanadaUniversity of Illinois at Urbana-Champaign, USAThe Chinese University of Hong Kong, Hong Kong, China
Stanford University, USAChinese Academy of Sciences, ChinaUniversity of South Carolina, USAUniversity of Iowa, USAResearch Center for Eco-Environmental Sciences, Chinese Academy of Sciences, ChinaPeking University, ChinaNational Institute of Environmental Health Sciences, USA
5
Tel: +86-10-62920553E-mail: [email protected]

Highlight articles
1 Characterization of natural organic matter in water for optimizing water treatment and minimizingdisinfection by-product formationQi Zheng, Xiaoqiu Yang, Wenchao Deng, X. Chris Le and Xing-Fang Li
6 A new technique helps to uncover unknown peptides and disinfection by-products in waterSusan D. Richardson and Cristina Postigo
Review article
32 Characteristics of the water-soluble components of aerosol particles in Hefei, ChinaXue-liang Deng, Chun-e Shi, Bi-wen Wu, Yuan-jian Yang, Qi Jin, Hong-lei Wang, Song Zhu andCaixia Yu
Regular articles
9 Evaluation of health benefit using BenMAP-CE with an integrated scheme of model and monitor dataduring Guangzhou Asian GamesDian Ding, Yun Zhu, Carey Jang, Che-Jen Lin, Shuxiao Wang, Joshua Fu, Jian Gao, Shuang Deng,Junping Xie and Xuezhen Qiu
19 Influence of phosphorus availability on the community structure and physiology of cultured biofilmsShuangshuang Li, Chun Wang, Hongjie Qin, Yinxia Li, Jiaoli Zheng, Chengrong Peng and Dunhai Li
41 Differences in nitrite-oxidizing communities and kinetics in a brackish environment after enrichment atlow and high nitrite concentrationsWipasanee Tangkitjawisut, Tawan Limpiyakorn, Sorawit Powtongsook, Preeyaporn Pornkulwat andBenjaporn Boonchayaanant Suwannasilp
50 Assessing the effects of surface-bound humic acid on the phototoxicity of anatase and rutile TiO2
nanoparticles in vitro
Xiaojia He, Sabrieon Sanders, Winfred G. Aker, Yunfeng Lin, Jessica Douglas and Huey-min Hwang
(
61 Evaluation of drinking water treatment combined filter backwash water recycling technology basedon comet and micronucleus assayTing Chen, Yongpeng Xu, Zhiquan Liu, Shijun Zhu, Wenxin Shi and Fuyi Cui
71 Metal release/accumulation during the decomposition of Potamogeton crispus in a shallowmacrophytic lakeHuanguang Deng, Ju Zhang, Shiyue Chen, Liwei Yang, Dongqi Wang and Shiyong Yu
79 Microbial bioavailability of dissolved organic nitrogen (DON) in the sediments of Lake Shankou,Northeastern ChinaMingzhou Su, Jingtian Zhang, Shouliang Huo, Beidou Xi, Fei Hua, Fengyu Zan, Guangren Qian andJianyong Liu
89 Aqueous stability and mobility of C60 complexed by sodium dodecyl benzene sulfonate surfactantXianjia Peng, Yue Yuan, Hongyu Wang and Chuan Liang
97 Accumulation and phytotoxicity of technical hexabromocyclododecane in maizeTong Wu, Honglin Huang and Shuzhen Zhang
105 Novel microbial fuel cell design to operate with different wastewaters simultaneouslyAbhilasha Singh Mathuriya
112 Modeling of acute cadmium toxicity in solution to barley root elongation using biotic ligand modeltheoryXuedong Wang, Mingyan Wu, Jingxing Ma, Xiaolin Chen and Luo Hua
Journal of Environmental Sciences Volume 42 2016
www.jesc.ac.cn
CONTENTS
119 Nitrogen reduction using bioreactive thin-layer capping (BTC) with biozeolite: A field experiment in aeutrophic riverZhenming Zhou, Tinglin Huang and Baoling Yuan
126 Temperature effect on photolysis decomposing of perfluorooctanoic acidTiliang Zhang, Gang Pan and Qin Zhou
134 Mechanism of Methylene Blue adsorption on hybrid laponite-multi-walled carbon nanotube particlesMaryna Manilo, Nikolai Lebovka and Sandor Barany
142 Deposition behavior of residual aluminum in drinking water distribution system: Effect of aluminumspeciationYue Zhang, Baoyou Shi, Yuanyuan Zhao, Mingquan Yan, Darren A. Lytle and Dongsheng Wang
152 Preliminary investigation of phosphorus adsorption onto two types of iron oxide-organic mattercomplexesJinlong Yan, Tao Jiang, Ying Yao, Song Lu, Qilei Wang and Shiqiang Wei
163 Enhancement of ultrasonic disintegration of sewage sludge by aerationHe Zhao, Panyue Zhang, Guangming Zhang and Rong Cheng
168 Activity and hydrothermal stability of CeO2–ZrO2–WO3 for the selective catalytic reduction of NOx withNH3
Zhongxian Song, Ping Ning, Qiulin Zhang, Hao Li, Jinhui Zhang, Yancai Wang, Xin Liu andZhenzhen Huang
178 Reversibility of the structure and dewaterability of anaerobic digested sludgeYiqi Sheng, Yili Wang, Wei Hu, Xu Qian, Huaili Zheng and Xiaoxiu Lun
187 Genomic organization and transcriptional modulation in response to endocrine disrupting chemicalsof three vitellogenin genes in the self-fertilizing fish Kryptolebias marmoratus
Bo-Mi Kim, Min Chul Lee, Hye-Min Kang, Jae-Sung Rhee and Jae-Seong Lee
196 Impact of undissociated volatile fatty acids on acidogenesis in a two-phase anaerobic systemKeke Xiao, Yan Zhou, Chenghong Guo, Yogananda Maspolim and Wun Jern Ng
202 Characteristics of pellets with immobilized activated sludge and its performance in increasingnitrification in sequencing batch reactors at low temperaturesWenjie Dong, Guang Lu, Li Yan, Zhenjia Zhang and Yalei Zhang
210 Enhanced methane production in an anaerobic digestion and microbial electrolysis cell coupledsystem with co-cultivation of Geobacter and Methanosarcina
Qi Yin, Xiaoyu Zhu, Guoqiang Zhan, Tao Bo, Yanfei Yang, Yong Tao, Xiaohong He, Daping Li andZhiying Yan
215 Integrating geochemical (surface waters, stream sediments) and biological (diatoms) approaches toassess AMD environmental impact in a pyritic mining area: Aljustrel (Alentejo, Portugal)Ana Teresa Luís, Nuno Durães, Salomé Fernandes Pinheiro de Almeida and Eduardo Ferreira da Silva
227 Investigation of colloidal biogenic sulfur flocculation: Optimization using response surface analysisFan Chen, Ye Yuan, Chuan Chen, Youkang Zhao, Wenbo Tan, Cong Huang, Xijun Xu andAijie Wang
236 Characterisation of dissolved organic matter in stormwater using high-performance size exclusionchromatographyHuiping Huang, Christopher W.K. Chow and Bo Jin
246 Emissions from the combustion of eucalypt and pine chips in a fluidized bed reactorE.D. Vicente, L.A.C. Tarelho, E.R. Teixeira, M. Duarte, T. Nunes, C. Colombi, V. Gianelle, G.O. da Rocha,A. Sanchez de la Campa and C.A. Alves
259 Nontargeted identification of peptides and disinfection byproducts in waterYanan Tang, Ying Xu, Feng Li, Lindsay Jmaiff, Steve E. Hrudey and Xing-Fang Li

267 The nitritation performance of biofilm reactor for treating domestic wastewater under high dissolvedoxygenZhaoming Zheng, Zebing Li, Jing Ma, Jia Du, Guanghui Chen, Wei Bian, Jun Li and Baihang Zhao
275 A nanofilter composed of carbon nanotube-silver composites for virus removal and antibacterialactivity improvementJun Pyo Kim, Jae Ha Kim, Jieun Kim, Soo No Lee and Han-Oh Park
284 Use of micellar liquid chromatography for rapid monitoring of fungicides post harvest applied to citruswastewaterJuan Peris-Vicente, Ana Marzo-Mas, Pasqual Roca-Genovés, Samuel Carda-Broch andJosep Esteve-Romero

J O U R N A L O F E N V I R O N M E N T A L S C I E N C E S 4 2 ( 2 0 1 6 ) 1 – 5
Ava i l ab l e on l i ne a t www.sc i enced i r ec t . com
ScienceDirect
www.e l sev i e r . com/ loca te / j es
Characterization of natural organic matter in water foroptimizing water treatment and minimizing disinfectionby-product formation
Qi Zheng1,2,⁎, Xiaoqiu Yang1,2, Wenchao Deng1, X. Chris Le3, Xing-Fang Li3,⁎
1. Key Laboratory of Optoelectronic Chemical Materials and Devices, Ministry of Education, School of Chemical and Environmental Engineering,Jianghan University, Wuhan 430056, China. E-mail: [email protected]. Institute of Environment and Health, Jianghan University, Wuhan 430056, China3. Division of Analytical and Environmental Toxicology, University of Alberta, Edmonton, Alberta T6G 2G3, Canada
A R T I C L E I N F O
Available online 23 March 2016
Keywords:Disinfection by-products (DBPs)Dissolved organic carbon (DOC)Dissolved organic matter (DOM)FluorescenceNatural organic matter (NOM)NitrificationSize exclusion chromatographyTotal organic carbon (TOC)
⁎ Corresponding authors. E-mail: x
http://dx.doi.org/10.1016/j.jes.20161001-0742/© 2016 The Research C
absorbance at an ultraviolet (UV) wavelength (e.g., 254 nm),
IntroductionNatural organic matter (NOM) present in source water hassignificant impact on water treatment processes and on thequality of drinking water. NOM is a complex mixture ofdiverse groups of organic compounds, humic and fulvic acids,proteins, peptides, carbohydrates, andheterogeneousmaterialsdecayed from terrestrial vegetation and aquatic organisms(Edwards, 1997; Barrett et al., 2000; Hwang et al., 2000). Thepresence of NOM in source water is a critical factor in thedetermination of both coagulant and disinfectant doses forwater treatment (Edzwald, 1993; Matilainen et al., 2010;Rakruam and Wattanachira, 2014; Huang et al., 2015). NOMcan act as a carbon source for the growth of microorganisms inwater distribution systems (Edwards, 1997; Zhao et al., 2014). In
[email protected] (Xing-Fang Li
.03.005enter for Eco-Environmental Science
addition,many classes of organic compounds in NOM can reactwith disinfectants to form various disinfection by-products(DBPs). The type and amount of DBPs produced during waterdisinfection are highly dependent on the concentration andconstituents of NOM in the source water (Barrett et al., 2000;Hua and Reckhow, 2007a; Krasner et al., 2006; Bull et al., 2011;Richardson and Postigo, 2012; Wang et al., 2016). Therefore,characterization of NOM in water is important for optimizingprocesses of water treatment and forminimizing the formationof toxic DBPs.
1. Techniques for the characterization of NOM
Examination of water color and turbidity, measurements of
and determination of dissolved organic carbon (DOC) can offerlimited information about NOM in a water sample (Bennett andDrikas, 1993; APHA et al., 1998; Matilainen et al., 2011). Advancedinstrumental techniques, such as gas chromatography massspectrometry (GC–MS) (e.g., pyrolysis GC–MS), nuclear magneticresonance (NMR) (e.g., C13 solid stateNMR), infrared spectroscopy(e.g., diffuse reflectance infrared Fourier transform), fluorescencespectroscopy, high performance size exclusion chromatography(HPSEC), and liquid chromatography with high resolution massspectrometry (Vuoria et al., 1998; Her et al., 2003; Allpike et al.,2005; Chow et al., 2008; Peleato and Andrews, 2015; Tang et al.,2016; Richardson and Postigo, 2016), can provide further infor-mation on the composition of NOM.
In a recent study by Huang et al. (2016), the authorscombined HPSEC separation withmulti-wavelength absorption
).
s, Chinese Academy of Sciences. Published by Elsevier B.V.

2 J O U R N A L O F E N V I R O N M E N T A L S C I E N C E S 4 2 ( 2 0 1 6 ) 1 – 5
detection to characterize dissolved organic matter (DOM) in alive water distribution system. The high performance sizeexclusion chromatography enabled the separation of DOMon the basis of apparent molecular weight (AMW) (Fig. 1).Absorbance detection simultaneously at multiple UV wave-lengths, e.g., 210, 230, and 254 nm, provided complementarydetection of DOM classes thatmay ormay not contain aromaticmoieties. Applications of this technique contributed to thecharacterization of molecular size fractions of DOM.
2. Characterization ofDOM ina livewater distributionsystem
While previous studies (Liu et al., 2010; Xing et al., 2012) haveused HPSEC to characterize various organics related to thedrinking water supply, Huang et al. (2016) applied the methodto examine a drinking water distribution system in SouthAustralia. From the water treatment plant to the consumers'water taps, the water supply distribution system consisted ofa single long trunk main with branches to several remotecommunities. The source water was from River Murray. Themain steps of the conventional treatment were coagulation,flocculation, sedimentation, filtration, UV disinfection, andchloramination. Chloramine was used as the secondarydisinfectant to ensure that disinfectant residuals reached theend of the long distribution system and to provide protectionagainst microbial contamination. The authors collected watersamples from 17 sampling points across the water treatmentplant and throughout the water distribution system. Thesesamples from a live water distribution system allowed for thecharacterization of the changes of DOM, disinfectant resid-uals, and microbial cell counts. These measures also made itpossible to study the associations between DOM and otherwater quality parameters.
The high performance size exclusion chromatography-ultraviolet (HPSEC-UV) analyses of raw water (Fig. 1a) and
Fig. 1 – Chromatograms obtained from the high performance sizeof raw water (left graph) and treated water (right graph). Apparenretention time response from polystyrene sulfonate standards. Uvertical axis on the right shows the difference between the absoReproduced with permission from Huang et al., 2016.
treated water (Fig. 1b) show two broad peaks, correspondingto apparent molecular weight (AMW) of approximately 200–300 and 1000–1300 Da. The lower intensity of the higher AMWfraction (1000–1300 Da) in the treated water (Fig. 1b) ascompared to the raw water (Fig. 1a) suggests that the watertreatment processes were able to remove or destroy some ofthe higher molecular weight DOM. However, the treatmentprocesses did not result in a decrease of the lower AMW (200–300 Da) DOM. In general, across treatment processes in thewater treatment plant, changes were observed in the higherAMW fraction (1000–2000 Da). Along the water distributionsystem, changes were observed in the lower AMW fraction(200–300 Da). A comparison of the signals obtained from thedetection at different wavelengths (210, 230, and 254 nm) alsosuggests that the treatment processes preferentially removedor destroyed the aromatic fraction of DOM (absorbance at254 nm). These results are consistent with previous findings(Korshin et al., 2009; Xing et al., 2012).
3. Determination of microbial cells in the waterdistribution system
Huang et al. (2016) also measured the changes in microbiallevels of water in the water treatment plant and in thedistribution system. This was done by using flow cytometryanalysis of fluorescently stained bacteria with SYTO-9 andwith a bacterial viability kit (Hoefel et al., 2005). They foundthat the active bacterial concentration in the raw water was1 × 107 cells/mL. This was significantly decreased followingthe steps of water treatment and disinfection. Specifically, withthe conventional water treatment (before disinfection), theactive bacterial concentration was reduced to 1 × 10⁶ cells/mL.The subsequent disinfection process further reduced the activebacterial concentration to 1 × 10⁴ cells/mL. Thus, the overallwater treatment processes resulted in a total of 3 log removal ofthe active bacterial cells.
exclusion chromatography (HPSEC)-ultraviolet (UV) analysest molecular weight (AMW) was calibrated against the
V absorbance (Abs) was detected at 210, 230, and 254 nm. Therbance at 230 nm and the absorbance at 254 nm (A230 − A254).

3J O U R N A L O F E N V I R O N M E N T A L S C I E N C E S 4 2 ( 2 0 1 6 ) 1 – 5
To understand the relation between the disinfectantresiduals and the bacterial concentration in water from thedistribution system, Huang et al. (2016) also measured theconcentrations of the total chlorine residual in the watersamples (APHA et al., 1998). They found that the order of thetotal bacterial cell concentrations at three customer tap waterlocations coincided with the reverse order of the totaldisinfectant residual. These results are consistent withprevious research indicating that the level of microorganismsincreases with decrease of total disinfectant (Lipponen et al.,2002; Bai et al., 2015).
4. Understanding the association between DOMand nitrification
Further to the observation that the total bacterial cellconcentrations in the water distribution system correlatedin reverse order with the total disinfectant residual, Huanget al. (2016) also found that the order of the total bacterial cellconcentrations coincided with the order of the sums of nitrateand nitrite. An increase in oxidized nitrogen concentrations(nitrate or nitrite), a decrease in disinfectant residual, and anincrease in microbial concentrations are common adverseeffects associated with the occurrence of nitrification(Wilczak et al., 1996; Schreiber and Mitch, 2007; Zhang et al.,2009). Nitrification involves oxidation of ammonia to nitrite,and further oxidation of nitrite to nitrate (Zhang et al., 2009).
Fig. 2 – Schematic showing relations of nitrification with other wsecondary disinfectant. Figure courtesy of Mr. David Cook, Senior S
These processes are associated with the occurrence andactivity of nitrifying microorganisms.
Management of nitrification is critical particularly whenchloramine is used as the secondary disinfectant. Nitrificationis related to many water quality parameters (Fig. 2), andmanagement of nitrification requires understanding of NOMinwater and its relation to the decay of chloramine. Chloramineoffers longer lasting disinfection and greater stability overchlorine, which is particularly important in distribution systemsthat are characterized by long residence times and hightemperatures. While offering greater stability over chlorine,chloramine is still unstable and degrades over time.Nitrificationcan reduce the pH and alkalinity of the water and the nitriteproduced by nitrification can increase chloramine decay.Furthermore, reaction of chloramine with DOM in drinkingwater results in decreases in the concentration of the disinfec-tant residual needed to ensure a safe drinking water supply.The growth and regrowth of microorganisms have seriouspotential health risks. Therefore, management of chloraminedecay and the prevention of nitrification are critical for waterutilities managing chloraminated drinking water distributionsystems.
Formation of DBPs from reactions between DOM and thedisinfectants is also a concern. While chloramine producesonly a fraction of the common DBPs (e.g., trihalomethanes,haloacetic acids, and chloral hydrate) that are produced bychlorine (Mitch and Sedlak, 2002; Swietlik et al., 2004; Hua andReckhow, 2007b; Lin et al., 2015), a number of new DBPs of
ater quality parameters when chloramine is used as thecientist, AustralianWater Quality Centre, SAWater, Australia.

4 J O U R N A L O F E N V I R O N M E N T A L S C I E N C E S 4 2 ( 2 0 1 6 ) 1 – 5
higher toxicity have been detected in chloraminated drinkingwater (Gerecke and Sedlak, 2003; Krasner et al., 2006;Richardson et al., 2007; Li et al., 2015).
5. Concluding remarks
It is important to characterize NOM in water because NOMinfluences water treatment processes, reduces the concentra-tion of disinfectant residuals, forms disinfection by-products,and affects the quality of drinking water. By using HPSECcoupled with a multiple wavelength UV absorbance detection,Huang et al. (2016) were able to characterize DOM as anindirect assessment tool for potential nitrification occurrencealong an operating distribution system. This approach wasapplied to investigate the impact of different fractions ofDOM on nitrification. The DOM fractions included those ofrelatively lowermolecular weight, less aromatic character andwith a weak absorbance response in the 250–280 nm wave-length range. This study revealed general water qualityparameter changes associated with nitrification occurrencein the distribution system and their associations with changesin the DOM molecular weight profile. Due to the nature of anoperating system with possible changes in both environmen-tal and operational conditions along the distribution system,it is important to conduct studies like this to compare thesamples in different sections of a distribution system and toanalyze interactions among the key water quality parameters.Such studies will contribute to a better understanding of howDOM impacts water quality in chloraminated distributionsystems.
The type and character of NOM are complicated and varywith location and season (Sharp et al., 2006). The interactionsof chloramine with complicated NOM in source water haveresulted in the formation of new DBPs (Mitch and Sedlak,2002; Choi and Valentine, 2002; Krasner et al., 2006; Qin et al.,2010; Shah and Mitch, 2012). Further research is needed tounderstand the formation of the new DBPs, characterize theirprecursors, survey their occurrence, investigate their trans-formation, study their human health effects, and minimizetheir formation, achieving the ultimate goal of ensuring thesupply of safe drinking water.
Acknowledgments
This work was supported by the Natural Sciences and Engi-neering Research Council of Canada (NSERC), the NationalNatural Science Foundation of China, Alberta Innovates, andAlberta Health.
R E F E R E N C E S
Allpike, B.P., Heitz, A., Joll, C.A., Kagi, R.I., Abbt-Braun, G., Frimmel,F.H., et al., 2005. Size exclusion chromatography to characterizeDOC removal in drinkingwater treatment. Environ. Sci. Technol.39 (7), 2334–2342.
APHA (American Public Health Association), AWWA, WEF, 1998.Standard Methods for the Examination of Water and Waste
Water. 20th ed. American Public Health Association,Washington, DC.
Bai, X., Zhi, X., Zhu, H., Meng, M., Zhang, M., 2015. Real-timeArcGIS and heterotrophic plate count based chloraminedisinfectant control in water distribution system. Water Res.68, 812–820.
Barrett, S.E., Krasner, S.W., Amy, G.L., 2000. Natural OrganicMatter and Disinfection By-products: Characterization andControl in Drinking Water—An Overview. In: Barrett, S.E.,Krasner, S.W., Amy, G.L. (Eds.), Natural Organic Matter andDisinfection By-products. Oxford University Press, Oxford,pp. 2–14.
Bennett, L.E., Drikas, M., 1993. The evaluation of colour in naturalwaters. Water Res. 27 (7), 1209–1218.
Bull, R.J., Reckhow, D.A., Li, X.-F., Humpage, A.R., Joll, C., Hrudey,S.E., 2011. Potential carcinogenic hazards of non-regulateddisinfection by-products: haloquinones, halo-cyclopenteneand cyclohexene derivatives, N-halamines, halonitriles, andheterocyclic amines. Toxicology 286 (1-3), 1–19.
Choi, J.H., Valentine, R.L., 2002. 2002. Formation of N-nitrosodimethylamine (NDMA) by reaction ofmonochloramine in a model water: a new disinfectionby-product. Water Res. 36 (4), 817–824.
Chow, C.W., Fabris, R., Leeuwen, J.V., Wang, D., Drikas, M., 2008.Assessing natural organic matter treatability using highperformance size exclusion chromatography. Environ. Sci.Technol. 42 (17), 6683–6689.
Edwards, M., 1997. Predicting DOC removal during enhancedcoagulation. J. Am. Water Works Assoc. 89 (5), 78–89.
Edzwald, J.K., 1993. Coagulation in drinking-water treatment —particles, organics and coagulants. Water Sci. Technol. 27 (11),21–35.
Gerecke, A.C., Sedlak, D.L., 2003. Precursors of N-mitrosodimethylamine in natural waters. Environ. Sci.Technol. 37 (7), 1331–1336.
Her, N., Amy, G., McKnight, D., Sohn, J., Yoon, Y., 2003.Characterization of DOM as a function of MW by fluorescenceEEM and HPLC-SEC using UVA, DOC, and fluorescencedetection. Water Res. 37 (17), 4295–4303.
Hoefel, D., Monis, P.T., Grooby, W.L., Andrews, S., Saint, C.P., 2005.Culture-independent techniques for rapid detection ofbacteria associated with loss of chloramine residual in adrinking water system. Appl. Environ. Microbiol. 71 (11),6479–6488.
Hua, G.H., Reckhow, D.A., 2007a. Characterization of disinfectionbyproduct precursors based on hydrophobicity and molecularsize. Environ. Sci. Technol. 41 (9), 3309–3315.
Hua, G.H., Reckhow, D.A., 2007b. Comparison of disinfectionbyproduct formation from chlorine and alternativedisinfectants. Water Res. 41 (8), 1667–1678.
Huang, H.P., Sawade, E., Cook, D., Chow, C.W.K., Drikas, M., Jin, B.,2016. High-performance size exclusion chromatography with amulti-wavelength absorbance detector study on dissolvedorganicmatter characterization alongawater distribution system.J. Environ. Sci. 42. http://dx.doi.org/10.1016/j.jes.2015.12.011.
Huang, X., Sun, S.L., Gao, B.Y., Yue, Q.Y., Wang, Y., Li, Q., 2015.Coagulation behavior and floc properties of compoundbioflocculant-polyaluminum chloride dual-coagulants andpolymeric aluminum in low temperature surface watertreatment. J. Environ. Sci. 30, 215–222.
Hwang, C.J., Sclimente, M.J., Krasner, S.W., 2000. In: S.E., Barret,S.W., Krasner, G.L., Amy (Eds.), Natural Organic Matter andDisinfection By-ProductsACS Symposium Series 761. AmericanChemical Society, Washington, DC, pp. 173–187.
Korshin, G., Chow, C.W., Fabris, R., Drikas, M., 2009. Absorbancespectroscopy-based examination of effects of coagulation onthe reactivity of fractions of natural organic matter withvarying apparent molecular weights. Water Res. 43 (6),1541–1548.

5J O U R N A L O F E N V I R O N M E N T A L S C I E N C E S 4 2 ( 2 0 1 6 ) 1 – 5
Krasner, S.W., Weinberg, H.S., Richardson, S.D., Pastor, S.J., Chinn,R., Sclimenti, M.J., et al., 2006. Occurrence of a new generationof disinfection byproducts. Environ. Sci. Technol. 40 (23),7175–7185.
Li, J., Wang, W., Moe, B., Wang, H., Li, X.-F., 2015. Chemical andtoxicological characterization of halobenzoquinones, anemerging class of disinfection byproducts. Chem. Res. Toxicol.28, 306–318.
Lin, P.F., Zhang, X.J., Wang, J., Zeng, Y.N., Liu, S.M., Chen, C., 2015.Comparison of different combined treatment processes toaddress the source water with high concentration of naturalorganic matter during snowmelt period. J. Environ. Sci. 27,51–58.
Lipponen, M.T., Suutari, M.H., Martikainen, P.J., 2002. Occurrenceof nitrifying bacteria and nitrification in Finnish drinkingwater distribution systems. Water Res. 36 (17), 4319–4329.
Liu, S., Lim, M., Fabris, R., Chow, C.W., Drikas, M., Korshin, G.,Amal, R., 2010. Multi-wavelength spectroscopic andchromatography study on the photocatalytic oxidation ofnatural organic matter. Water Res. 44 (8), 2525–2532.
Matilainen, A., Gjessing, E.T., Lahtinen, T., Hed, L., Bhatnagar, A.,Sillanpaa, M., 2011. An overview of the methods used in thecharacterisation of natural organic matter (NOM) in relation todrinking water treatment. Chemosphere 83 (11), 1431–1442.
Matilainen, A., Vepsalainen, M., Sillanpaa, M., 2010. Naturalorganic matter removal by coagulation during drinking watertreatment: a review. Adv. Colloid Interf. Sci. 159 (2), 189–197.
Mitch, W.A., Sedlak, D.L., 2002. Formation of N-nitrosodimethylamine (NDMA) from dimethylamine duringchlorination. Environ. Sci. Technol. 36 (4), 588–595.
Peleato, N.M., Andrews, R.C., 2015. Comparison of three-dimensional fluorescence analysis methods for predictingformation of trihalomethanes and haloacetic acids. J. Environ.Sci. 27, 159–167.
Qin, F., Zhao, Y.Y., Zhao, Y., Boyd, J.M., Zhou, W., Li, X.-F., 2010. Atoxic disinfection byproduct, 2,6-dichloro-1,4-benzoquinone,identified in drinking water. Angew. Chem. Int. Ed. 49, 790–792.
Rakruam, P., Wattanachira, S., 2014. Reduction of DOM fractionsand their trihalomethane formation potential in surfaceriverwater by in-line coagulation with ceramic membranefiltration. J. Environ. Sci. 26 (3), 529–536.
Richardson, S.D., Plewa, M.J., Wagner, E.D., Schoeny, R., DeMarini,D.M., 2007. Occurrence, genotoxicity, and carcinogenicity ofregulated and emerging disinfection by-products in drinkingwater: a review and roadmap for research. Mutat. Res. Rev.Mutat. Res. 636 (1-3), 178–242.
Richardson, S.D., Postigo, C., 2012. Drinking water disinfection by-products. In: Barceló, D. (Ed.), Emerging Organic Contaminantand Human Health. Springer, Berlin Heidelberg, pp. 93–137.
Richardson, S.D., Postigo, C., 2016. A new technique helps touncover unknown peptides and disinfection by-products inwater. J. Environ. Sci. 42. http://dx.doi.org/10.1016/j.jes.2016.03.008.
Schreiber, I.M., Mitch, W.A., 2007. Enhanced nitrogenousdisinfection byproduct formation near the breakpoint:implications for nitrification control. Environ. Sci. Technol. 41(20), 7039–7046.
Shah, A.D., Mitch, W.A., 2012. Halonitroalkanes, halonitriles,haloamides, and N-nitrosamines: a critical review ofnitrogenous disinfection byproduct formation pathways.Environ. Sci. Technol. 46 (1), 119–131.
Sharp, E.L., Parsons, S., Jefferson, B., 2006. Seasonal variations innatural organic matter and its impact on coagulation in watertreatment. Sci. Total Environ. 363 (1-3), 183–194.
Swietlik, J., Dabrowska, A., Raczyk-Stanislawiak, U., Nawrocki, J.,2004. Reactivity of natural organic matter fractions withchlorine dioxide and ozone. Water Res. 38 (3), 547–558.
Tang, Y.N., Xu, Y., Li, F., Jmaiff, L.K., Hrudey, S.E., Li, X.-F., 2016.Non-targeted analysis of peptides and disinfection byproductsin water. J. Environ. Sci. 42. http://dx.doi.org/10.1016/j.jes.2015.08.007.
Vuoria, E., Vahala, R., Rintala, J., Laukkanen, R., 1998. Theevaluation of drinking water treatment performed with HPSEC.Environ. Int. 24 (5/6), 617–623.
Wang, W., Moe, B., Li, J., Qian, Y., Zheng, Q., Li, X.-F., 2016.Analytical characterization, occurrence, transformation, andremoval of the emerging disinfection byproductshalobenzoquinones in water. Trends Anal. Chem. http://dx.doi.org/10.1016/j.trac.2016.03.004.
Wilczak, A., Jacangelo, J.G., Marcinko, J.P., Odell, L.H., Kirmeyer,G.J., Wolfe, R.L., 1996. Occurrence of nitrification inchloraminated distribution systems. J. Am. Water WorksAssoc. 88 (7), 74–85.
Xing, L., Fabris, R., Chow, C.W., Leeuwen, J.V., Drikas, M., Wang, D.,2012. Prediction of DOM removal of low specific UV absorbancesurface waters using HPSEC combined with peak fitting.J. Environ. Sci. 24 (7), 1174–1180.
Zhang, Y., Love, N., Edwards, M., 2009. Nitrification in drinkingwater systems. Crit. Rev. Environ. Sci. Technol. 39 (3), 153–208.
Zhao, X., Hu, H.Y., Yu, T., Su, C., Jiang, H.C., Liu, S.M., 2014. Effect ofdifferent molecular weight organic components on theincrease of microbial growth potential of secondary effluent byozonation. J. Environ. Sci. 26 (11), 2190–2197.

J O U R N A L O F E N V I R O N M E N T A L S C I E N C E S 4 2 ( 2 0 1 6 ) 6 – 8
Ava i l ab l e on l i ne a t www.sc i enced i r ec t . com
ScienceDirect
www.e l sev i e r . com/ l oca te / j es
A new technique helps to uncover unknown peptides anddisinfection by-products in water
Susan D. Richardson1,⁎, Cristina Postigo2
1. Department of Chemistry and Biochemistry, University of South Carolina, Columbia, SC 29205, USA2. Department of Environmental Chemistry, Institute for Environmental Assessment and Water Research-Spanish National Research Council(IDAEA-CSIC), Barcelona 08034, Spain
A R T I C L E I N F O
Available online 30 March 2016
Keywords:Disinfection by-products (DBPs)Drinking waterHalogenated peptidesLiquid chromatographyNatural organic matter (NOM)Non-targeted analysisTandem mass spectrometryWater contaminants
⁎ Corresponding author. E-mail: Ri
http://dx.doi.org/10.1016/j.jes.20161001-0742/© 2016 The Research C
matrix effects, has made GC–MS a tool of choice for uncovering
Environmental water samples can be extremely complex, withpotentially thousandsofmolecules that canderive fromnaturalorganic matter (NOM) and thousands that derive from anthro-pogenic contaminants. As complex as these samples are,drinking water can be evenmore complex. Due to disinfectantsthat are used to treat drinkingwater (e.g., chlorine, chloramines,ozone, or chlorine dioxide), NOM and contaminant moleculescan transform into many new disinfection by-products (DBPs).For example, the contaminant triclosan, which is used inmanyantibacterial hand soaps, can transform in the presenceof chlorine to form six DBPs, including chloroform, threechlorophenoxyphenols, and two chlorophenols (Rule et al.,2005). And, NOM can transform into thousands of DBPs. Thus,the complexity of the water greatly magnifies.In addition to being highly complex, there are also concernsover the toxicity of DBPs that are formed in drinking water.Disinfected drinking water has been associated with suchadverse effects as bladder cancer,miscarriage, and birth defects
[email protected] (Susan D. R
.03.008enter for Eco-Environmental Science
(Waller et al., 1998; Nieuwenhuijsen et al., 2000; Bove et al., 2002;Villanueva et al., 2004; Savitz et al., 2005). And,many DBPs havebeen found to be cytotoxic, mutagenic, genotoxic, teratogenic,or carcinogenic (Richardsonet al., 2007; Plewaet al., 2008).Whilea small number of DBPs are regulated inmany countries (e.g., 11are regulated in theU.S.), toxicology data point to the possibilitythat DBPs other than those regulatedmay be responsible for thehuman health effects observed. As a result, it is important tothoroughly characterize and identify DBPs formed in drinkingwater.
Most efforts to this end have used gas chromatography(GC)-mass spectrometry (MS) with electron ionization (EI),largely because it is easier to identify unknown molecules thisway. The availability of large mass spectral library databases,along with easy-to-spot chromatographic peaks and the lack of
new DBPs over the last several years (Richardson, 2002, 2012).To-date, nearly 700 DBPs have been identified (Richardson,1998, 2011).
However, GC–MS is limited to volatile and semi-volatilecompounds with low molecular weights (<~800 Da), andmany compounds are likely missed. In fact, the measurementof total organic halogen in chlorinated drinking waterindicates that >50% of the halogenated DBPs are stillunaccounted for (Krasner et al., 2006). And, this surrogatemeasurement only captures halogenated compounds.
A new paper published by Tang et al. (2016) introduces anentirely new strategy to comprehensively identify compoundsin source waters and finished drinking water (Fig. 1). Thisstrategy combinesmultiple solid phase extraction (SPE), liquidchromatography (LC) with 2 complementary columns, highresolution-MS/MS, and a new technique called precursor ionelimination (PIE). First, through the use of multiple SPE, amuch broader range of compounds can be extracted.
ichardson).
s, Chinese Academy of Sciences. Published by Elsevier B.V.

Fig. 1 – New approach to comprehensively identify DBPs and other compounds in water.
7J O U R N A L O F E N V I R O N M E N T A L S C I E N C E S 4 2 ( 2 0 1 6 ) 6 – 8
Researchers typically use a single sorbent phase to extractorganic molecules from water, which is not able to effectivelyextract all types of compounds. However, by using 3 differentSPE phases (Oasis HLB, Bond Elut C18, or Bond Elut ENV),>5000 putative organic compounds were extracted, with ~40%unique compounds identified with each SPE.
Next, rather than using GC–MS, the authors used LC–MS,which allowed the capture of a much broader range ofcompounds. And, while researchers will generally choose asingle LC column (typically C18), the authors used two differentcomplementary ones (C18 and a hydrophilic interaction liquidchromatography (HILIC) column), which dramatically increased
the number of compounds that could be detected and resolved,allowing 50% unique identifications with each. The novel PIEstrategy then further extended the number of quality MS/MSspectra that could be obtained. This technique involved aninitial MS/MS scan of the high abundance ions, followed by asecondMS/MS scan,which excluded thesehigh abundance ionsand focused on the ions at lower abundance. This processallowed 30%–40% more compounds to be detected than with atraditional single LC–MS/MS approach.
In addition, because a high resolution mass spectrometerwas used (a triple-TOF), these MS/MS spectra containedaccurate mass information that allowed formulas for the

8 J O U R N A L O F E N V I R O N M E N T A L S C I E N C E S 4 2 ( 2 0 1 6 ) 6 – 8
molecular ions and the fragment ions to be obtained. Finally,the LC–MS/MS spectra were searched against the HumanMetabolome Database (HMDB) and structures were proposed.Because the HMDB contains many peptides and otherbiomolecules, it was particularly handy for identifying anumber of peptides (>600) in these samples. Interestingly,not all of these peptides were only in the raw source waters,but >100 of the peptides and amino acids were unique to thefinished drinking water. Twenty-five of them were confirmedwith authentic standards, including a few chlorinated andnitrosated peptides that had not been reported previously.Finally, the authors were able to determine three differentdisinfection reaction pathways that converted the peptidesinto toxic DBPs. This was a radically different approach toidentify compounds in water, and in the end, it allowed theidentification of hundreds of compounds in a single study.
While this new strategy was specifically applied todrinking water, it also has tremendous utility for other typesof environmental samples. For example, an intense areaof research for a number of years has been in trying tounderstand and characterize different types of NOM inenvironmental waters (Barrett et al., 2000; Huang et al., 2016;Zheng et al., 2016). It is likely that this more comprehensiveidentification approach will shed new light on NOM structureand function. This new strategy could also be used to identifynew emerging contaminants and their transformation prod-ucts in water. While environmental pollutants likely will nothave many successful matches in the HMDB, the expandedSPE-PIE-LC-high resolution-MS/MS approach should allow theidentification of many more contaminants in a much shortertime.
R E F E R E N C E S
Barrett, S.E., Krasner, S.W., Amy, G.L., 2000. Natural Organic Matterand Disinfection By-products: Characterization and Control inDrinking Water—An Overview. In: Barrett, S.E., Krasner, S.W.,Amy, G.L. (Eds.), Natural Organic Matter and DisinfectionBy-products. Oxford University Press, Oxford, pp. 2–14.
Bove, F., Shim, Y., Zeitz, P., 2002. Drinking water contaminantsand adverse pregnancy outcomes: a review. Environ. HealthPerspect. 110, 61–74.
Huang, H.P., Sawade, E., Cook, D., Chow, C.W.K., Drikas, M., Jin, B.,2016. High-performance size exclusion chromatography with amulti-wavelength absorbancedetector studyondissolvedorganicmatter characterization along a water distribution system.J. Environ. Sci. 42. http://dx.doi.org/10.1016/j.jes.2015.12.011.
Krasner, S.W., Weinberg, H.S., Richardson, S.D., Pastor, S.J.,Chinn, R., Sclimenti, M.J., et al., 2006. Occurrence of a newgeneration of disinfection byproducts. Environ. Sci. Technol. 40,7175–7185.
Nieuwenhuijsen, M.J., Toledano, M.B., Eaton, N.E., Fawell, J.,Elliott, P., 2000. Chlorination disinfection byproducts in waterand their association with adverse reproductive outcomes: areview. Occup. Environ. Med. 57, 73–85.
Plewa, M.J., Wagner, E.D., Muellner, M.G., Hsu, K.M., Richardson,S.D., 2008. Comparative Mammalian Cell Toxicity of N-DBPsand C-DBPs. In Disinfection By-Products in Drinking Water:Occurrence, Formation, Health Effects, and Control. AmericanChemical Society, Washington, D.C.
Richardson, S.D., 2011. Disinfection By-products: Formation andOccurrence of Drinking Water. In: Nriagu, J.O. (Ed.)TheEncyclopedia of Environmental Health vol. 2. Elsevier,Burlington, pp. 110–136.
Richardson, S.D., 1998. Drinking Water Disinfection By-products.The Encyclopedia of Environmental Analysis and Remediationvol. 3. John Wiley & Sons, pp. 1398–1421.
Richardson, S.D., 2002. The role of GC/MS and LC/MS in thediscovery of drinking water disinfection by-products.J. Environ. Monit. 4, 1–9.
Richardson, S.D., 2012. Mass Spectrometry Identification andQuantification of Toxicologically Important Drinking WaterDisinfection By-products. In: Lebedev, A.T. (Ed.),Comprehensive Environmental Mass Spectrometry, Chapter12. ILM Publications, St. Albans, United Kingdom, pp. 263–285.
Richardson, S.D., Plewa, M.J., Wagner, E.D., Schoeny, R., DeMarini,D.M., 2007. Occurrence, genotoxicity, and carcinogenicity ofregulated and emerging disinfection by-products in drinkingwater: a review and roadmap for research. Mutat. Res. 636,178–242.
Rule, K.L., Ebbett, V.R., Vikesland, P.J., 2005. Formation of chloroformand chlorinated organics by free-chlorine-mediated oxidation oftriclosan. Environ. Sci. Technol. 39, 3176–3185.
Savitz, D.A., Singer, P.C., Hartmann, K.E., Herring, A.H., Weinberg,H.S., Makarushka, Hoffman, C., et al., 2005. Drinking WaterDisinfection By-Products and Pregnancy Outcome. AWWAResearch Foundation, Denver, CO.
Tang, Y.N., Xu, Y., Li, F., Jmaiff, L.K., Hrudey, S.E., Li, X.-F., 2016.Non-targeted analysis of peptides and disinfection byproductsin water. J. Environ. Sci. 42. http://dx.doi.org/10.1016/j.jes.2015.08.007.
Villanueva, C.M., Cantor, K.P., Cordier, S., Jaakkola, J.J.K., King,W.D., Lynch, C.F., et al., 2004. Disinfection byproducts andbladder cancer: a pooled analysis. Epidemiology 15, 357–367.
Waller, K., Swan, S.H., DeLorenze, G., Hopkins, B., 1998.Trihalomethanes in drinking water and spontaneous abortion.Epidemiology 1998 (9), 134–140.
Zheng, Q., Yang, X.Q., Deng, W.C., Le, X.C., Li, X.-F., 2016.Characterization of natural organic matter in water foroptimizing water treatment and minimizing disinfectionby-product formation. J. Environ. Sci. 42, 6–8.

J O U R N A L O F E N V I R O N M E N T A L S C I E N C E S 4 2 ( 2 0 1 6 ) 9 – 1 8
Ava i l ab l e on l i ne a t www.sc i enced i r ec t . com
ScienceDirect
www. jou rna l s . e l sev i e r . com/ j es
Evaluation of health benefit using BenMAP-CE with anintegrated scheme of model and monitor data duringGuangzhou Asian Games
Dian Ding1, Yun Zhu1,2,⁎, Carey Jang3, Che-Jen Lin1,4, Shuxiao Wang2,5, Joshua Fu6,Jian Gao7, Shuang Deng7, Junping Xie1, Xuezhen Qiu1
1. Guangdong Provincial Key Laboratory of Atmospheric Environment and Pollution Control, College of Environmental and Energy, South ChinaUniversity of Technology, Guangzhou Higher Education Mega Center, Guangzhou 510006, China. E-mail: [email protected]. State Environmental Protection Key Laboratory of Sources and Control of Air Pollution Complex, Beijing 100084, China3. USEPA/Office of Air Quality Planning & Standards, RTP, NC27711, USA4. Department of Civil Engineering, Lamar University, Beaumont, TX 77710-0024, USA5. Department of Environmental Science and Engineering, Tsinghua University, Beijing 100084, China6. Department of Civil & Environmental Engineering, University of Tennessee, Knoxville, TN 37996-2010, USA7. Chinese Research Academy of Environmental Sciences, Beijing 100012, China
A R T I C L E I N F O
⁎ Corresponding author. E-mail: zhuyun@scu
http://dx.doi.org/10.1016/j.jes.2015.06.0031001-0742/© 2015 The Research Center for Ec
A B S T R A C T
Article history:Received 24 February 2015Revised 28 May 2015Accepted 1 June 2015Available online 7 July 2015
Guangzhou is the capital and largest city (land area: 7287 km2) of Guangdong province inSouth China. The air quality in Guangzhou typically worsens in November due tounfavorable meteorological conditions for pollutant dispersion. During the GuangzhouAsian Games in November 2010, the Guangzhou government carried out a number ofemission control measures that significantly improved the air quality. In this paper, weestimated the acute health outcome changes related to the air quality improvement duringthe 2010 Guangzhou Asian Games using a next-generation, fully-integrated assessmentsystem for air quality and health benefits. This advanced system generates air quality databy fusing model and monitoring data instead of using monitoring data alone, whichprovides more reliable results. The air quality estimates retain the spatial distribution ofmodel results while calibrating the value with observations. The results show that themean PM2.5 concentration in November 2010 decreased by 3.5 μg/m3 compared to that in2009 due to the emission control measures. From the analysis, we estimate that the airquality improvement avoided 106 premature deaths, 1869 cases of hospital admission, and20,026 cases of outpatient visits. The overall cost benefit of the improved air quality isestimated to be 165 million CNY, with the avoided premature death contributing 90% of thisfigure. The research demonstrates that BenMAP-CE is capable of assessing the health andcost benefits of air pollution control for sound policy making.© 2015 The Research Center for Eco-Environmental Sciences, Chinese Academy of Sciences.
Published by Elsevier B.V.
Keywords:Air qualityHealth benefitPM2.5
BenMAP-CEData fusionModel and monitor data
t.edu.cn (Yun Zhu).
o-Environmental Sciences, Chinese Academy of Sciences. Published by Elsevier B.V.

10 J O U R N A L O F E N V I R O N M E N T A L S C I E N C E S 4 2 ( 2 0 1 6 ) 9 – 1 8
Introduction
Along with the rapidly booming economy and urbanization,the Pearl River Delta (PRD, including Guangzhou, Shenzhen,etc.) region has been suffering from serious PM (particulatematter) and ozone air pollution in recent years (Wu et al.,2007, 2012a). The PM pollution in the PRD region is worse inautumn and winter due to the unfavorable meteorologicalconditions for pollutant dispersion. With the goal of attainingbetter air quality (air pollution index ≤ 100) during the 16thGuangzhou Asian Games in November 2010, about 2.4 billionChinese Yuan (CNY) was invested to implement a number ofair pollution control measures in Guangzhou since 2008,including industrial emission reduction, traffic restriction,fugitive dust control, etc., in Guangzhou and surroundingcities (including Foshan, Dongguan, etc.). The observed airquality improved significantly in November 2010 compared toin 2009 although the dispersion conditions were worse than in2009 (Wu et al., 2012b). However, the health and cost benefitsof the improved air quality remained unclear.
Health impacts and benefits associated with air qualityimprovements have been studied previously. The US Envi-ronmental Protection Agency (US EPA, 1999), World Bank(World Bank, 2007), and WHO (Cohen et al., 2005) quantifiedthe health effects of air pollution. Hong Kong University (CivicExchange, 2008) estimated that nearly 10,000 deaths in theSouthern China region in 2006, with the majority (94%)occurring in the PRD, were due to air pollution. Huang andZhang (2013) evaluated the health benefits for the Jingjinjiarea assuming the attainment of a new national ambient airquality standard (GB3095-2012). Kan and Chen (2004); Yuanand Dong (2006) and Zhang et al. (2007, 2008) estimated thehealth impact and economic loss due to the particulate matterpollution of China cities. Hou et al. (2011) calculated thehealth-related economic loss due to PM10 in Lanzhou during2002–2009. Hou et al. (2010) analyzed human exposure to PM10
and associated economics during the Beijing Olympic Games.Gao et al. (2015) assessed the health impacts and economiclosses of the 2013 severe smog event in Beijing. There areincreasing studies on health impact assessment in China, butnone of these works use both model and monitoring datathroughuse of an interpolationmethod to perform the analysis.
In this study, the US EPA's next-generation integrated airquality attainment and evaluation system were applied toevaluate the benefits to public health due to air qualityimprovement during the Guangzhou Asian Games. Thisintegrated assessment system includes and links two mod-ules: (1) the Software for Model Attainment Test-CommunityEdition (SMAT-CE, available at http://www.abacas-dss.com/),which can predict the baseline/future year air quality withmodel simulation data and observation data (Wang et al.,2015), and (2) the environmental Benefits Mapping andAnalysis Program-Community Edition (BenMAP-CE, availableat http://www.epa.gov/airquality/benmap/ce.html), which isan integrated geographic information system (GIS) toolcapable of estimating the health impacts and associatedeconomic benefits resulting from changes in air quality(Yang et al., 2013). SMAT-CE provides air quality datafor BenMAP-CE as input. This data transmission can be
automatically realized in the assessment system after clickingthe “Link to BenMAP” button in SMAT-CE. To improvethe accuracy of the air quality and evaluation results,SMAT-China (China version of SMAT-CE) was applied togenerate the model and related monitor air quality grid data(combining model and monitoring data by using an interpo-lation method) as the input for BenMAP-CE. The integratedassessment system can fill the gaps in previous works fromsimply using modeled/monitoring air quality values to assesshealth benefits. Here we present the approach and provideestimates of health benefits due to air quality improvement inNovember 2009 and November 2010 in Guangzhou.
1. Methodology
1.1. Health benefit evaluation method
Fig. 1 describes the analytical steps. PM2.5 (particulate matterwith a size ≤ 2.5 μm)was chosen as the air pollution indicator.The EPA's Community Multiscale Air Quality (CMAQ) modelwas applied to simulate the PM2.5 baseline and controlconcentration of Guangzhou. SMAT-China was utilized togenerate the modeled and related monitor values as the inputfor BenMAP-CE. Then BenMAP-CE was applied to estimatehuman health effects and benefits resulting from changesin air quality, with the input data including population,incidence rates, and unit value for health endpoints.
In SMAT-China, an algorithm for Voronoi neighbor aver-aging (VNA) was adopted to interpolate air quality monitoringdata to obtain the air quality data at unmonitored locations(US EPA, 2007; Wang et al., 2015). Neighboring monitors wereidentified by drawing a Voronoi diagram using the centroid ofthe grid cell and all monitors, then we calculated aninverse-distance (or square inverse-distance) weighted aver-age of the neighboring monitors as the grid value. Theequation is shown below:
GridCellE ¼Xn
i¼1
Weighti �Monitori ð1Þ
where n is the number of neighboring sites, Weighti is theinverse distance weight for monitor i, Monitori is the observeddata at monitor i, and GridCellE is the value at grid cell E.
Another interpolation method used model data to adjustthe VNA spatial field results (eVNA), by multiplying the ratioof the model value in the unmonitored area with the modelvalue at the grid cell containing the monitor:
GridCellE ¼Xn
i¼1
Weighti �Monitori �ModelEModeli
ð2Þ
where ModelE is the model data at cell E, and Modeli is themodel data at the grid cell which contains monitor site i. Thisapproach takes themonitor andmodel value into account sincethe monitor value provides the real observed concentration,while the model value can provide the spatial distribution ofPM2.5 concentration in addition. In this case, eVNA was appliedto generate air quality input data for BenMAP-CE. The detailedcomparison is discussed in Section 2.1.1.
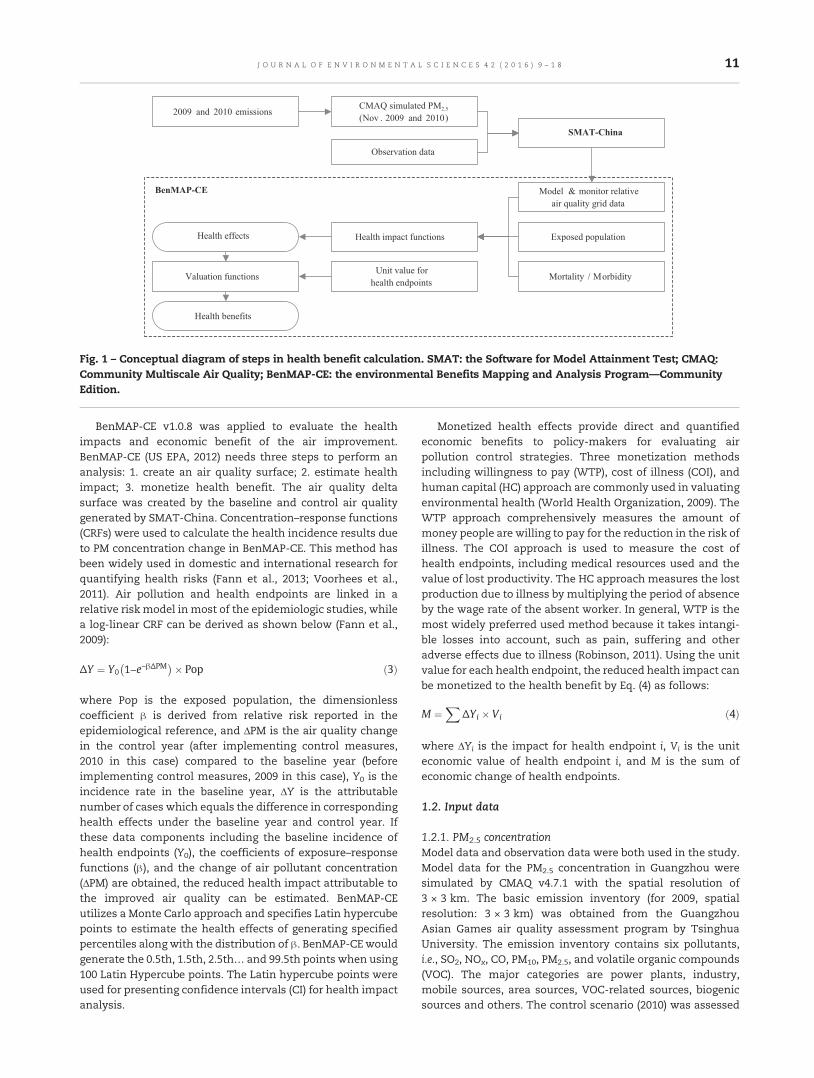
Fig. 1 – Conceptual diagram of steps in health benefit calculation. SMAT: the Software for Model Attainment Test; CMAQ:Community Multiscale Air Quality; BenMAP-CE: the environmental Benefits Mapping and Analysis Program—CommunityEdition.
11J O U R N A L O F E N V I R O N M E N T A L S C I E N C E S 4 2 ( 2 0 1 6 ) 9 – 1 8
BenMAP-CE v1.0.8 was applied to evaluate the healthimpacts and economic benefit of the air improvement.BenMAP-CE (US EPA, 2012) needs three steps to perform ananalysis: 1. create an air quality surface; 2. estimate healthimpact; 3. monetize health benefit. The air quality deltasurface was created by the baseline and control air qualitygenerated by SMAT-China. Concentration–response functions(CRFs) were used to calculate the health incidence results dueto PM concentration change in BenMAP-CE. This method hasbeen widely used in domestic and international research forquantifying health risks (Fann et al., 2013; Voorhees et al.,2011). Air pollution and health endpoints are linked in arelative risk model in most of the epidemiologic studies, whilea log-linear CRF can be derived as shown below (Fann et al.,2009):
ΔY ¼ Y0 1−e−βΔPM� �� Pop ð3Þ
where Pop is the exposed population, the dimensionlesscoefficient β is derived from relative risk reported in theepidemiological reference, and ΔPM is the air quality changein the control year (after implementing control measures,2010 in this case) compared to the baseline year (beforeimplementing control measures, 2009 in this case), Y0 is theincidence rate in the baseline year, ΔY is the attributablenumber of cases which equals the difference in correspondinghealth effects under the baseline year and control year. Ifthese data components including the baseline incidence ofhealth endpoints (Y0), the coefficients of exposure–responsefunctions (β), and the change of air pollutant concentration(ΔPM) are obtained, the reduced health impact attributable tothe improved air quality can be estimated. BenMAP-CEutilizes a Monte Carlo approach and specifies Latin hypercubepoints to estimate the health effects of generating specifiedpercentiles along with the distribution of β. BenMAP-CEwouldgenerate the 0.5th, 1.5th, 2.5th… and 99.5th points when using100 Latin Hypercube points. The Latin hypercube points wereused for presenting confidence intervals (CI) for health impactanalysis.
Monetized health effects provide direct and quantifiedeconomic benefits to policy-makers for evaluating airpollution control strategies. Three monetization methodsincluding willingness to pay (WTP), cost of illness (COI), andhuman capital (HC) approach are commonly used in valuatingenvironmental health (World Health Organization, 2009). TheWTP approach comprehensively measures the amount ofmoney people are willing to pay for the reduction in the risk ofillness. The COI approach is used to measure the cost ofhealth endpoints, including medical resources used and thevalue of lost productivity. The HC approach measures the lostproduction due to illness by multiplying the period of absenceby the wage rate of the absent worker. In general, WTP is themost widely preferred used method because it takes intangi-ble losses into account, such as pain, suffering and otheradverse effects due to illness (Robinson, 2011). Using the unitvalue for each health endpoint, the reduced health impact canbe monetized to the health benefit by Eq. (4) as follows:
M ¼X
ΔYi � Vi ð4Þ
where ΔYi is the impact for health endpoint i, Vi is the uniteconomic value of health endpoint i, and M is the sum ofeconomic change of health endpoints.
1.2. Input data
1.2.1. PM2.5 concentrationModel data and observation data were both used in the study.Model data for the PM2.5 concentration in Guangzhou weresimulated by CMAQ v4.7.1 with the spatial resolution of3 × 3 km. The basic emission inventory (for 2009, spatialresolution: 3 × 3 km) was obtained from the GuangzhouAsian Games air quality assessment program by TsinghuaUniversity. The emission inventory contains six pollutants,i.e., SO2, NOx, CO, PM10, PM2.5, and volatile organic compounds(VOC). The major categories are power plants, industry,mobile sources, area sources, VOC-related sources, biogenicsources and others. The control scenario (2010) was assessed

1 5
2
43
67
8
9
10
11
12
Foshan Dongguan
City monitoring stations
National air quality monitoring sites
Fig. 2 – District map of Guangzhou with locations of citymonitoring stations and national air quality monitoringsites.
12 J O U R N A L O F E N V I R O N M E N T A L S C I E N C E S 4 2 ( 2 0 1 6 ) 9 – 1 8
using the emission reduction due to the control measuresbased on the baseline scenario. The following seriesof measures were implemented to improve air quality:restructuring of the power plant and industry boilers toreduce emissions of sulfur and nitrogen oxides to theatmosphere; reduction of exhaust emissions by closing thearea to traffic except for green label cars and implementingthe odd-and-even license plate rule (e.g., vehicles witheven registration numbers are only allowed on-road ineven-number dates); reduction of the road and constructionfugitive dust by sprinkling water on the roads and stoppingconstruction; reduction of VOC-related sources by gasrecovery at petrol stations, adopting effective VOC emissioncontrols in key industries, and promoting the use of low-VOCemission paint and paint products. The percentage reductionsof SO2, NOx, CO, PM10, PM2.5, and VOC emissions in differentsources (Table 1) were obtained from the final officialtechnical report, which were calculated according to thecontrol measures mentioned in the report of the Guangzhouair pollution control office.
Daily PM observation data for November, 2009 and 2010were obtained from the Guangzhou Environmental Monitor-ing Center. For the sites that had PM10 data only, PM2.5 wascalculated as 70% of the PM10 level (Liu et al., 2010). Fig. 2shows the observational sites in Guangzhou. There are 18monitoring stations, 10 of which are national air qualitymonitoring sites.
1.2.2. Exposed populationBenMAP-CE can assess the health impact for different groupsclassified by age range, gender, race and ethnicity. In thisstudy, the total population was used to represent the exposedpopulation without classification by age or gender due to thelack of available population data. According to the Guangzhoustatistics yearbook (2011) (Statistics Bureau of GuangdongProvince, 2011) and the sixth national population census datacommuniqué, the total population in Guangzhou in 2010 was12.7 million. The population distribution of each administra-tion district is shown in Fig. 3. BenMAP-CE can generatepopulation data to different grid definition levels (such as12 km, city, etc.) based on the original data through aspatially-weighted average approach.
1.2.3. Selection of CRFs and mortality/morbidity ratesCRF is the key factor to quantitatively evaluate the healthimpact caused by air pollution. The health endpoints wereselected based on the literature (World Bank, 2007): (1) those
Table 1 – Pollutant emission reduction (%) duringGuangzhou Asian Games compared to 2009.
Sources SO2 NOx CO PM10 PM2.5 VOC
Power plant 35.9 56.6 – – – –Industry 14.1 20.6 4.7 6.0 7.9 16.9On-road mobile sources 47.2 41.2 60.0 36.2 36.2 52.0Non-road mobile sources 22.3 13.0 3.2 8.8 8.6 –Fugitive dust – – – 62.4 62.4 –VOC product-related – – – – – 75.7
VOC: volatile organic compounds.–: without control.
registered in Chinese cities and classified by ICD-10(International Classification of Diseases) code; (2) thosepublished in exposure–response studies; and (3) statisticaldata such asmortality/morbidity incidence rates. Accordingly,the health endpoints of all-cause mortality, all-cause hospitaladmissions, all-cause outpatient visits, mortality for respira-tory and cardiovascular disease, and hospital admissions forrespiratory and cardiovascular disease were selected. In thiscase, those CRFs (Table 2) reported in epidemiological studiesof acute health effects were chosen to assess health impact.The CRFs applied for 0–99 age ranges were selected sincethe population in different age ranges was unavailable.Several studies assessed the exposure to particulate matterof different diameters such as PM10 and total suspendedparticulate (TSP), so conversion factors (0.65 for PM10 to TSP,0.7 for PM2.5 to PM10) were applied (Kan and Chen, 2004; Liu etal., 2010) if necessary. The CRFs under the same healthendpoint were combined using a fixed-effects pooling proce-dure. Each estimate was weighted in proportion to the inverseof the variance. Table 3 shows the annual baseline incidencerates for each chosen health endpoint. The annual incidencerates (in 2009) were obtained from the China statisticsyearbook (2010) (National Bureau of Statistics of China, 2010)and China health statistics yearbook (2010) (National Healthand Family Planning Commission of China, 2010).

Fig. 3 – Population of Guangzhou administration district(2010).
Table 3 – Baseline incidence rates for included mortalityand morbidity endpoints.
Health endpoints Baseline incidence(×10−3/year)
Mortality, all cause 4.52Mortality, respiratory 0.64Mortality, cardiovascular 1.30Hospital admissions, all cause 62.27Hospital admissions, cardiovascular 11.30Hospital admissions, respiratory 7.80Outpatient visits, all cause 2411.19
13J O U R N A L O F E N V I R O N M E N T A L S C I E N C E S 4 2 ( 2 0 1 6 ) 9 – 1 8
1.2.4. Selection of monetization methodTable 4 shows the unit values for economic valuation ofvarious health endpoints. The WTP value is associated withhuman income and will be different for regions with differenteconomic status. In this case, the unit value for Guangzhouwas generated from the original value for studies in reported
Table 2 – Summary of the main features of the selected concen
Health endpoints Pollutant Refere
Mortality, all cause PM2.5 Kan et al.PM2.5 Xie et al. (PM10 Chen et a
Mortality, respiratory PM2.5 Kan et al.PM2.5 Xie et al. (PM10 Chen et a
Mortality, cardiovascular PM2.5 Kan et al.PM2.5 Xie et al. (PM10 Chen et a
Hospital admissions, all cause TSP Chen (200Hospital admissions, cardiovascular PM10 Wong et a
TSP Chen (200PM10 Xie et al. (
Hospital admissions, respiratory TSP Chen (200PM10 Xie et al. (
Outpatient visits, all cause PM10 Cao et al.
Coefficient β represents the increase in acute health impact per 10 μg/m95% confidence interval (CI).TSP: total suspended particulate.
cities (Chongqing/Beijing) multiplied by the annual capitaincome ratio between Guangzhou and the source city (Huanget al., 2012). Then the unit value for various currency yearswas adjusted to the year 2010 by multiplying by the annualconsumer price index (CPI) in China (Voorhees et al., 2014). Forhospital admission and outpatient visits, the COI and HCvaluation approaches were applied. COI estimates the directcost of a health outcome while HC measures the lostproduction. Both valuation estimates were updated to cur-rency year 2010 using similar adjustments. Multiple valuationresults under each endpoint were combined using averageweights.
2. Results and discussion
2.1. Air quality data
2.1.1. Improvement in data preprocessThe interpolation method of eVNA was utilized to generatethe air quality grid data for BenMAP-CE. Here we presentthe comparison of VNA and eVNA using the air quality datain 2009. Fig. 4a displays the average PM2.5 concentration ofCMAQ results for November, 2009. It is in good agreement withthe spatial distribution of the road network and industries.Fig. 4b displays the air quality grid value interpolated from
tration–response functions (CRFs).
nces Coefficient β Location
(2007) 0.0036 (0.0011,0.0061) Shanghai2009) 0.0040 (0.0019,0.0062) Shanghai, Chongqingl. (2012) 0.0035 (0.0018,0.0052) 16 Chinese cities(2007) 0.0095 (0.0016,0.0173) Shanghai2009) 0.0143 (0.0085,0.0201) Shanghail. (2012) 0.0056 (0.0031,0.0081) 16 Chinese cities(2007) 0.0041 (0.0001,0.0082) Shanghai2009) 0.0053 (0.0015,0.0090) Shanghail. (2012) 0.0044 (0.0023,0.0064) 16 Chinese cities4) 0.0026 (0.0006,0.0046) Guangzhoul. (2002) 0.0070 (0.0031,0.0109) Hong Kong4) 0.0029 (0.0001,0.0060) Guangzhou2009) 0.0066 (0.0036,0.0095) Hong Kong4) 0.0034 (0.0004,0.0065) Guangzhou2009) 0.0124 (0.0086,0.0162) Hong Kong(2009) 0.0011 (−0.0003,0.0026) Shanghai
3 increase of particulate matter pollution. Values in parentheses are

Table 4 – Unit values for various health endpoints.
Health endpoints Unit value (CNY) Approach References
Mortality 965041.7 (928614.8, 1001469.7) WTP in 2010 CNY Wang and Mullahy (2006)1709300a WTP in 2010 CNY Mu and Zhang (2013)
Hospital admissions, all cause 7534a COI in 2010 CNY National Health and Family PlanningCommission of China (2011)
Hospital admissions, cardiovascular 6442a HC in 2010 CNY Wan et al. (2005)5433a COI in 2010 CNY Kan and Chen (2004)5006a COI in 2010 CNY Zhang et al. (2008)
Hospital admissions, respiratory 3625a HC in 2010 CNY Wan et al. (2005)3698a COI in 2010 CNY Kan and Chen (2004)2454a COI in 2010 CNY Zhang et al. (2008)
Outpatient visits, all cause 64a HC in 2010 CNY Wan et al. (2005)106a COI in 2010 CNY Xu and Jin (2003)
a The available data did not provide the distribution of the values. WTP: willingness to pay; COI: cost of illness; HC: human capital approach.
14 J O U R N A L O F E N V I R O N M E N T A L S C I E N C E S 4 2 ( 2 0 1 6 ) 9 – 1 8
observation data only. The model value and the grid observeddata show a largely consistent spatial distribution of concen-tration which increased from the northeast to the southwest ofGuangzhou. However, model data provide a much morereasonable concentration distribution. Combining the advan-tages of model and observed data, air quality interpolated byusing eVNA (Fig. 4c) can providemore accurate information thatcalibrates the value with observations while retaining thespatial distribution of model results. The leave-one-out valida-tion method was used to verify the accuracy of VNA and eVNA.Air quality grid data were generated by both interpolationmethods after removing one site each time, then comparedwith the observed value of the removed one. Table 5 displaysthe result of four observed sites as representative. No. 2 andNo.4 sites (Fig. 2) have the same bias for both VNA and eVNAbecause they are in the southwest of Guangzhou with highdensity of monitors around, while No. 11 and No. 12 sites showa larger bias for VNA because of the sparse interpolation sites.
2.1.2. PM2.5 reductionBaseline and control air quality data were generated bySMAT-China using the eVNA interpolation method with
Fig. 4 – (a) Model data, (b) spatial field interpolated by using Voronby using model data to adjust the VNA spatial field results (eVN
model and monitor data input. The CMAQ model data ofNovember in 2009 and 2010 were compared to the observa-tions at those grid cells that contained monitoring sites. Themodel results in both years slightly overestimate the averagePM2.5 observations (mean bias as 2.9 μg/m3 for 2009 and3.4 μg/m3 for 2010). Fig. 5 shows a comparison between thesimulated and observed daily PM2.5 concentrations at the tennational air quality monitoring sites (Fig. 2) in Guangzhou.The comparison shows that model data were able to capturethe temporal variation of observations, with the correlationcoefficient ranging from 0.55 to 0.74 in 2009, and from 0.43 to0.67 in 2010. The emission control measures during theGuangzhou Asian Games are the likely causes for the modelover-prediction. By using the eVNA method, baseline/controlPM2.5 grid data were generated by combining monitoring dataand observations. The air quality change was calculated fromthe interpolated baseline and control data. Fig. 6a shows thePM2.5 concentration reduction in Guangzhou. According to theresearch of Wu et al. (2012b), the significant air pollutionreduction was attributed to the effective transportationrestrictions and industrial emission controls, because diffu-sion conditions were worse during the Guangzhou Asian
oi neighbor averaging (VNA) and (c) spatial field interpolatedA).

Table 5 – Voronoi neighbor averaging (VNA) and modeldata to adjust the VNA spatial field results (eVNA) resultcomparison.
Monitorsite
Normalized bias ofVNA (%)
Normalized bias ofeVNA (%)
Urban areaNo. 2 1.43 1.25No. 4 1.99 1.92
Suburb areaNo. 11 15.66 4.99No. 12 36.72 6.26
15J O U R N A L O F E N V I R O N M E N T A L S C I E N C E S 4 2 ( 2 0 1 6 ) 9 – 1 8
Games when compared to the same period of historical data.Tao et al. (2015) also found that air quality during the AsianGames period was much better than that observed in thesame period without control measures in Guangzhou. Fig. 6band c shows the distribution of the road network andindustrial point sources in Guangzhou. Their intensity isvery high in the urban area. Therefore, there were moreemission reductions for on-roadmobile, industry, and fugitivedust sources in the urban area than in the suburban area.Chen et al. (2010) indicated that air pollutants in Guangzhoumainly came from local emissions, and Dongguan and Foshancontributed most to Guangzhou of all the surrounding cities.The north suburban area of Guangzhou (Conghua) had aslightly lower concentration because it had better air qualitycompared to the urban area and was not the key area in theair pollution control strategy. Influenced by the wind from thenortheast, air pollutant emission from Dongguan had animpact on air quality of south Guangzhou. Although Foshan islocated in the downwind area of Guangzhou, it also affectedthe air quality in Guangzhou under a constantly changingwind direction because of its large amount of emission. ThePM2.5 reduction in the south of Guangzhou (Panyu, etc.) waslow since it was associated with the intense emissions in theadjacent cities.
Fig. 5 – PM2.5 observed and predicted pairs at national air quali
2.2. Health impact and valuation results
Table 6 lists the result of avoided acute health effects and theassociated costs avoided from reduced morbidity and avoidedpremature deaths from the emission reduction during the2010 Asian Games. According to the estimates, the averagePM2.5 observation value decreased 3.5 μg/m3 and the publichealth benefit estimate was 165 million CNY. The benefitsfrom three all-cause endpoints (mortality, hospital admis-sions, outpatient visits) are summed up as the total healthbenefits from air quality improvement.
The major health benefit was from the reduction inpremature deaths, which contributed to 90% of the totalcost. PM2.5 pollution is most likely to cause cardiovascular andrespiratory disease (Chapman et al., 1997; Linares and Díaz,2010). The avoided death and illness due to cardiovascular orrespiratory disease contributed to 73% and 61% of the totalavoidable death and illness.
The distribution of health impact and benefit results ofeach health endpoint shows a similar spatial pattern. Fig. 7depicts avoidable all-cause premature deaths for each gridcell and their saved economic costs (aggregated to county). Itis estimated that the Baiyun district had the largest economicbenefit, at 40 million CNY, because it has the highestpopulation (Fig. 3) and greater air quality improvements interms of PM2.5 concentration. This indicates that controlstrategies can result in higher benefits through focusing onthe areas which have a high density of population withpriority.
The reported research on chronic health impact in China isvery sparse, especially that caused by PM2.5. Kan and Chen(2002) distinguished between acute and chronic mortality forthe effects of TSP. To avoid error from using data fromdifferent studies, Kan and Chen's results were used in anattempt to calculate the long-term and short-term mortalityreductions and benefits of air improvement during theGuangzhou Asian Games. Results show that the economicbenefit in terms of chronic mortality is 568.01 (95% CI, 181.94–
ty monitoring sites for November 2009 and November 2010.

a b
c
Fig. 6 – (a) Monthly PM2.5 reduction in Guangzhou, (b) roaddistribution network map including national, provincial andcity roads, and (c) industrial point source distribution inGuangzhou and surrounding area.
16 J O U R N A L O F E N V I R O N M E N T A L S C I E N C E S 4 2 ( 2 0 1 6 ) 9 – 1 8
1179.81) million CNY, while the benefit to acute mortality is175.65 (95% CI, 56.24–365.61) million CNY. The results showthat the economic benefit for chronic mortality is larger thanthat for acute mortality. However, the current measures weretaken to reduce fairly high concentrations in the short term.As the control measures were implemented during theGuangzhou Asian Games, the effect of air quality improve-ment only lasted one month, which produced less in terms ofchronic health effect. To achieve long-term air qualityimprovement, fundamental and sustainable measures shouldbe taken, such as energy structure reconstruction, industryemission control, development of public transportation, etc.
Table 6 – PM2.5 reduction related health effects andbenefits.
Health endpoints Attributable number ofcases per year
Benefit (×106
CNY/year)
Mortality, all cause 106 (44,162) 150 (59,277)Mortality,cardiovascular
44 (15,79) 53 (17,106)
Mortality, respiratory 33 (15, 60) 46 (18,102)Hospital admissions,all cause
1869 (402,3326) 14 (3,25)
Hospital admissions,cardiovascular
575 (311,838) 3.2 (1.7,5.1)
Hospital admissions,respiratory
565 (113,948) 1.8 (0.4,3.4)
Outpatient visits, allcause
20026 (−6540,46448) 1.7 (−0.6,4.6)
Totala 165 (62, 306)
Values in parentheses are 95% confidence interval (CI).a Total = mortality, all cause + hospital admissions, allcause + outpatient visits, all cause.
2.3. Error analysis
The input data of this case study included air quality data,exposed population, CRFs, mortality/morbidity incidence rates,andmonetary valuation functions. Each of these input data canaffect the final results to different extents. The accuracy ofresults is interpreted cautiously in the following discussion.
Population and mortality/morbidity incidence rates wereobtained from reliable data sources—the national/local sta-tistics institute. The validity of health impact results dependsbasically on the selection of CRFs. There are relatively fewquantitative studies on the relationship between air pollution,especially PM2.5, and health impact for Chinese cities,compared with the foreign literature. Compared to the UnitedStates, China's health impact coefficient is much lower. Arecent study reported by the California Air Resources Board(2008) indicates that the risk of death rises as much as 10% per10 μg/m3 increase of PM2.5. This study selected domestic CRFsand avoided regional differences of data as much as possible.CRF estimates rely on the quality of epidemiological studies.To avoid error introduced by the particularities of individualstudies, multiple CRFs were selected for one health endpointand then combined together using the fixed effect method.Meanwhile, in the evaluation process, the mean value and95% CI of health outcomes were used to reflect the error range.
In the process of measuring health impact, uncertaintyexists when using different unit values for monetization. TheChinese research and statistical data on the unit economicvalue for each health endpoint are relatively insufficient andthe reported data are far less extensive than those of theUnited States. Uncertainty is unavoidable as a result of thelimited domestic research available, since unit value variesgreatly in the different regions and is generated by differentmonetizationmethods. Compared toWTP, HC and COI cannotfully reflect the disutility and welfare losses of the healthimpact, leading to underestimation of the unit economicvalue for health endpoints. This study obtained the unitvalue for Guangzhou by adjusting results of other citiesin China with income per capita, to achieve accuratemeasurements.
3. Conclusions
The study provides an efficient method for using an integrat-ed air quality attainment and evaluation system, includingSMAT-CE and BenMAP-CE for health benefit analysis. Theinterpolation method eVNA was employed in SMAT-CE togenerate more accurate air quality grid data by combining thespatial distribution of model results with observations. Basedon the air quality grid data provided by SMAT-CE, BenMAP-CEcan estimate the health impact and quantify the economicbenefit with reasonable geographic spatial resolution. Then acomprehensive relationship between control measures andhealth outcomes can be found to help policy makers tooptimize control strategy.
This paper demonstrates a real case study of assessingacute health effect results from air quality improvementduring the Guangzhou Asian Games as an application ofthis integrated assessment system. Due to the strict

Fig. 7 – (a) Number of avoidable deaths and (b) economic benefit from all-cause mortality.
17J O U R N A L O F E N V I R O N M E N T A L S C I E N C E S 4 2 ( 2 0 1 6 ) 9 – 1 8
implementation of transportation restrictions and industrialemission control measures, the monthly average PM2.5
concentration of November, 2010 in Guangzhou decreased by3.5 μg/m3 compared to the same period the previous year. Theevaluation results showed that the air improvement resultedin 106.03 (95% CI, 43.97–161.81) annual premature avoidabledeaths, and a total benefit of 165.45 (95% CI, 61.62–306.18)million CNY. Note that the benefit was underestimatedbecause only air quality improvement in Guangzhou hasbeen taken into account, while the air quality of other citieswas also improved due to the joint regional air pollutioncontrol in the PRD. The public health benefit results canstrongly encourage policy makers to implement more effec-tive pollution control policies to decrease PM2.5 emission. Thepresented software can aid in making strategic decisions forair pollution control in other cities in China or internationallyas well (Fann et al., 2012).
Acknowledgments
Financial support and data source for this work wereprovided by the US Environmental Protection Agency (No.5-312-0212979-51786L) and the Guangzhou EnvironmentalProtection Bureau (No. x2hjB2150020), the project of anintegrated modeling and filed observational verification onthe deposition of typical industrial point-source mercuryemissions in the Pearl River Delta. This work was also partlysupported by the funding of the Guangdong Provincial KeyLaboratory of Atmospheric Environment and Pollution Con-trol (No. 2011A060901011), the project of Atmospheric HazeCollaboration Control Technology Design from the ChineseAcademy of Sciences (No. XDB05030400), and the National
Environmental Protection Public Welfare Industry TargetedResearch Foundation of China (No. 201409019).
R E F E R E N C E S
California Air Resources Board. Methodology for estimatingpremature deaths associated with long-term exposure to fineairborne particulate matter in California. In: CaliforniaEnvironmental Protection Agency, editor, 2008.
Cao, J., Li, W., Tan, J., Song, W., Xu, X., Jiang, C., et al., 2009.Association of ambient air pollution with hospital outpatientand emergency room visits in Shanghai, China. Sci. TotalEnviron. 407, 5531–5536.
Chapman, R.S., Watkinson, W.P., Dreher, K.L., Costa, D.L., 1997.Ambient particulate matter and respiratory and cardiovascularillness in adults: particle-borne transition metals and theheart–lung axis. Environ. Toxicol. Pharmacol. 4, 331–338.
Chen, X., 2004. Time Series Analysis of air Pollution and Health.Sun Yat-sen University.
Chen, H., Wang, Z., Wu, Q., Wang, W., 2010. Source analysis ofGuangzhou air pollutants by numerical simulation in theAsian Games Period. Acta Sci. Circumst. 2145–2153.
Chen, R., Kan, H., Chen, B., Huang, W., Bai, Z., Song, G., et al., 2012.Association of particulate air pollution with daily mortality:the China air pollution and health effects study. Am.J. Epidemiol. 175, 1173–1181.
Cohen, A.J., Ross Anderson, H., Ostro, B., Pandey, K.D., Krzyzanowski,M., Künzli, N., et al., 2005. The global burden of disease due tooutdoor air pollution. J. Toxic. Environ. Health A 68, 1301–1307.
Civic Exchange, 2008. A Price too High: the Health Impacts of AirPollution in Southern China. Hong Kong University MedicalCentre, HK.
Fann, N., Fulcher, C., Hubbell, B., 2009. The influence of location,source, and emission type in estimates of the human healthbenefits of reducing a ton of air pollution. Air Qual. Atmos.Health 2, 169–176.

18 J O U R N A L O F E N V I R O N M E N T A L S C I E N C E S 4 2 ( 2 0 1 6 ) 9 – 1 8
Fann, N., Baker, K.R., Fulcher, C.M., 2012. Characterizing thePM2.5-related health benefits of emission reductions for 17industrial, area and mobile emission sectors across the U.S.Environ. Int. 49, 141–151.
Fann, N., Fulcher, C.M., Baker, K., 2013. The recent and futurehealth burden of air pollution apportioned across U.S. sectors.Environ. Sci. Technol. 47, 3580–3589.
Gao, M., Guttikunda, S.K., Carmichael, G.R., Wang, Y., Liu, Z.,Stanier, C.O., et al., 2015. Health impacts and economic lossesassessment of the 2013 severe haze event in Beijing area. Sci.Total Environ. 511, 553–561.
Hou, Q., An, X.Q., Wang, Y., Guo, J.P., 2010. An evaluation ofresident exposure to respirable particulate matter and healtheconomic loss in Beijing during Beijing 2008 Olympic Games.Sci. Total Environ. 408, 4026–4032.
Hou, Q., An, X., Wang, Z., Wang, Y., Sun, Z., 2011. Assessment onhealth economic costs of particulate air pollution in Lanzhouduring 2002–2009. China Environ. Sci. 1398–1402.
Huang, D., Zhang, S., 2013. Health benefit evaluation for PM2.5
pollution control in Beijing–Tianjin–Hebei region of China.China Environ. Sci. 166–174.
Huang, D., Xu, J., Zhang, S., 2012. Valuing the health risks ofparticulate air pollution in the Pearl River Delta, China.Environ. Sci. Pol. 15, 38–47.
Kan, H., Chen, B., 2002. Analysis of exposure–responserelationships of air particulate matter and adverse healthoutcomes in China. J. Environ. Health 422–424.
Kan, H., Chen, B., 2004. Particulate air pollution in urban areas ofShanghai, China: health-based economic assessment. Sci.Total Environ. 322, 71–79.
Kan, H., London, S.J., Chen, G., Zhang, Y., Song, G., Zhao, N., et al.,2007. Differentiating the effects of fine and coarse particles ondaily mortality in Shanghai, China. Environ. Int. 33, 376–384.
Linares, C., Díaz, J., 2010. Short-term effect of concentrations offine particulate matter on hospital admissions due tocardiovascular and respiratory causes among the over-75 agegroup in Madrid, Spain. Publ. Health 124, 28–36.
Liu, X., Xie, P., Lie, Z., Li, T., Zhong, L., Xiang, Y., 2010. Economicassessment of acute health impact due to inhalable particulateair pollution in the Pearl River Delta. Acta Sci. Nat. Univ. Pekin.46, 829–834.
Mu, Q., Zhang, S., 2013. An evaluation of the economic loss due tothe heavy haze during January 2013 in China. China Environ.Sci. 33, 2087–2094.
National Bureau of Statistics of China, 2010. China StatisticalYearbook 2010. China Statistics Press, Beijing.
National Health, Family Planning Commission of China, 2010.China Health Statistics Yearbook 2010. the Minister of Healthof China, Beijing.
National Health, Family Planning Commission of China, 2011.China Health Statistics Yearbook 2011. the Minister of Healthof China, Beijing.
Robinson, L.A., 2011. Valuing the health impacts of air emissions.In: Nriagu, J.O. (Ed.), Encyclopedia of Environmental Health.Elsevier, Burlington, pp. 619–627.
Statistics Bureau of Guangdong Province, 2011. GuangdongStatistical Yearbook 2011.
Tao, J., Zhang, L., Zhang, Z., Huang, R., Wu, Y., Zhang, R., et al.,2015. Control of PM2.5 in Guangzhou during the 16th AsianGames period: implication for hazy weather prevention. Sci.Total Environ. 508, 57–66.
US EPA, 1999. The Benefits and Costs of the Clean Air Act, 1990 to2010. EPA Office of Air and Radiation, Washington, DC.
US EPA, 2007. Guidance on the Use of Models and Other Analysesfor Demonstrating Attainment of Air Quality Goals for Ozone,
PM2.5, and Regional Haze (Available at: http://www.epa.gov/ttn/scram/guidance/guide/final-03-pm-rh-guidance.pdf.).
US EPA, 2012. BenMAP User's Manual. (Available at: http://www.epa.gov/airquality/benmap/models/BenMAPManualOct2012.pdf).
Voorhees, A.S., Fann, N., Fulcher, C., Dolwick, P., Hubbell, B.,Bierwagen, B., et al., 2011. Climate change-related temperatureimpacts on warm season heat mortality: a proof-of-conceptmethodology using BenMAP. Environ. Sci. Technol. 45,1450–1457.
Voorhees, A.S., Wang, J., Wang, C., Zhao, B., Wang, S., Kan, H.,2014. Public health benefits of reducing air pollution inShanghai: a proof-of-concept methodology with application toBenMAP. Sci. Total Environ. 485–486, 396–405.
Wan, Y., Yang, H., MASUI, T., 2005. Health and economic impactsof air pollution in China: a comparison of the generalequilibrium approach and human capital approach. Biomed.Environ. Sci. 427–441.
Wang, H., Mullahy, J., 2006. Willingness to pay for reducing fatalrisk by improving air quality: a contingent valuation study inChongqing, China. Sci. Total Environ. 367, 50–57.
Wang, H., Zhu, Y., Jang, C., Lin, C.-J., Wang, S.X., Fu, J., et al., 2015.Design andcase study of a next-generation air quality attainmentassessment system for PM2.5 and O3. J. Environ. Sci. 27, 178–188.
Wong, C.M., Atkinson, R.W., Anderson, H.R., Hedley, A.J., Ma, S.,Chau, P.Y., et al., 2002. A tale of two cities: effects of airpollution on hospital admissions in Hong Kong and Londoncompared. Environ. Health Perspect. 110, 67–77.
World Bank, 2007. Cost of Pollution in China: Economic Estimatesof Physical Damages. World Bank, Washington, DC.
World Health Organization. WHO guide to identifying theeconomic consequences of disease and injury. In: Departmentof Health Systems Financing, editor, 2009.
Wu, D., Bi, X., Deng, X., Li, F., Tan, H., Liao, G., et al., 2007. Effect ofatmospheric haze on the deterioration of visibility over thePearl River Delta. Acta Meteorol. Sin. 215–223.
Wu, D., Lau, A.K.-H., Leung, Y., Bi, X., Li, F., Tan, H., et al., 2012a.Hazy weather formation and visibility deterioration resultedfrom fine particulate (PM2.5) pollutions in Guangdong andHong Kong. Acta Sci. Circumst. 2660–2669.
Wu, D., Liao, B., Wu, C., Chen, H., Li, F., Li, H., et al., 2012b.Investigation on hazy weather during the Guangzhou 2010Asian Games. Acta Sci. Circumst. 521–527.
Xie, P., Liu, X., Liu, Z., Li, T., Bai, Y., 2009. Exposure–responsefunctions for health effects of ambient particulatematter pollution applicable for China. China Environ. Sci.1034–1040.
Xu, Z., Jin, F., 2003. Assessment of economic loss due to healthimpact of air pollution in city of Liaoning Province. J. Environ.Health 67–71.
Yang, Y., Zhu, Y., Jang, C., Xie, J., Wang, S., Fu, J., et al., 2013.Research and development of environmental benefitsmapping and analysis program: community edition. Acta Sci.Circumst. 2395–2401.
Yuan, B., Dong, D., 2006. Accounting of health-loss value inducedby inhalable particulate matter — a case study of Jilin City.Sichuan Environ. 83–86.
Zhang, M., Song, Y., Cai, X., 2007. A health-based assessment ofparticulate air pollution in urban areas of Beijing in 2000–2004.Sci. Total Environ. 376, 100–108.
Zhang, M., Song, Y., Cai, X., Zhou, J., 2008. Economic assessment ofthe health effects related to particulate matter pollution in 111Chinese cities by using economic burden of disease analysis.J. Environ. Manag. 88, 947–954.

J O U R N A L O F E N V I R O N M E N T A L S C I E N C E S 4 2 ( 2 0 1 6 ) 1 9 – 3 1
Ava i l ab l e on l i ne a t www.sc i enced i r ec t . com
ScienceDirect
www. jou rna l s . e l sev i e r . com/ j es
Influence of phosphorus availability on the communitystructure and physiology of cultured biofilms
Shuangshuang Li1,5, Chun Wang2,5, Hongjie Qin3, Yinxia Li4, Jiaoli Zheng1,5,Chengrong Peng1, Dunhai Li1,⁎
1. Key Laboratory of Algal Biology, Institute of Hydrobiology, Chinese Academy of Sciences, Wuhan 430072, China. E-mail: [email protected]. Institute of Oceanology, Chinese Academy of Sciences, Qingdao 266071, China3. Institute of Agricultural Resources and Environment, Jiangsu Academy of Agricultural Sciences, Nanjing 210014, China4. Department of Resource and Environmental Engineering, Henan Institute of Engineering, Zhengzhou 451191, China5. University of Chinese Academy of Sciences, Beijing 100049, China
A R T I C L E I N F O
⁎ Corresponding author. E-mail: [email protected]
http://dx.doi.org/10.1016/j.jes.2015.08.0051001-0742/© 2015 The Research Center for Ec
A B S T R A C T
Article history:Received 10 March 2015Revised 31 July 2015Accepted 3 August 2015Available online 13 September 2015
Biofilmshave important effects onnutrient cycling in aquatic ecosystems.However, publicationsabout the community structure and functions under laboratory conditions are rare. This studyfocused on the developmental and physiological properties of cultured biofilms under variousphosphorus concentrations performed in a closely controlled continuous flow incubator. Theresults showed that the biomass (Chl a) and photosynthesis of algae were inhibited underP-limitation conditions, while the phosphatase activity and P assimilation rate were promoted.The algal community structure of biofilmswasmore likely related to the colonization stage thanwith the phosphorus availability. Cyanobacteria were more competitive than other algae inbiofilms, particularly when cultured under low P levels. A dominance shift occurred fromnon-filamentous algae in the early stage to filamentous algae in themid and late stages under Pconcentrations of 0.01, 0.1 and 0.6 mg/L. However, the total N content, dry weight biomass andbacterial community structure of biofilmswere unaffected by phosphorus availability. Thismaybe attributed to the low respiration rate, highaccumulation of extracellular polymeric substancesand high alkaline phosphatase activity in biofilms when phosphorus availability was low. Thebacterial community structure differed over time, while there was little difference between thefour treatments, which indicated that it was mainly affected by the colonization stage of thebiofilms rather than the phosphorus availability. Altogether, these results suggested that thedevelopment of biofilms was influenced by the phosphorus availability and/or the colonizationstage and hence determined the role that biofilms play in the overlying water.© 2015 The Research Center for Eco-Environmental Sciences, Chinese Academy of Sciences.
Published by Elsevier B.V.
Keywords:Chlorophyll fluorescenceCultured biofilmsMicrobial community structurePhosphatase activityPhosphorus availability
Introduction
Freshwater biofilms that grow on any wet solid surface aremicroecosystems of autotrophs and heterotrophs consisting ofalgae, bacteria, archaea, fungi and protozoa (Lock et al., 1984; DiPippo et al., 2009;Wu et al., 2010; Proia et al., 2012). Biofilms play
n (Dunhai Li).
o-Environmental Science
a crucial role in natural aquatic ecosystems through theirinfluence on energy flow, nutrient recycling and biogeochem-ical processes and patterns, as they are highly efficient andsuccessful ecological communities (Battin et al., 2003).
Microorganisms in biofilms can secrete extracellular poly-meric substances (EPS) mainly composed of polysaccharides,
s, Chinese Academy of Sciences. Published by Elsevier B.V.

20 J O U R N A L O F E N V I R O N M E N T A L S C I E N C E S 4 2 ( 2 0 1 6 ) 1 9 – 3 1
proteins, lipids, humic substances and small amounts ofnucleic acids (Jorand et al., 1995; Stoodley et al., 2002). Thepresence of EPS maintains the structural stability of biofilms,contributes to the attachment of cells to substrata andprotects biofilms against environmental stress, as well asproviding nutrition storage (Di Pippo et al., 2009; Vu et al.,2009).
Biofilms have various properties that may contribute to theuptake, storage and transformation of inorganic and organicnutrients as well as other chemicals, and are important in theself-depuration of water bodies (Romani et al., 2004; Pusch et al.,1998). The autotrophs in biofilms have a high affinity fornitrogen (N) and phosphorus (P) in the water and can use themfor their growth (Perez-Martinez et al., 2010), and EPS in thematrix enable absorption of metals (Jang et al., 2001). Thepresence of biofilms can also reduce the rate of P release from thesediment, not only by direct uptake, but also by oxygenproduction (Zhang et al., 2013). Therefore, to clarify the relation-ship between a biofilm and the nutrient level of its environmentis very important.
A variety of factors probably have effects on biofilm coloni-zation and development, mainly including physical (light,temperature, hydrodynamics), chemical (nutrient concentration,toxicant effects) and biological (microbial community assem-blage) factors (Sabater et al., 2002). Among these, diverse studieshave shown that P availability is one of the most importantlimiting factors determining biofilm structure and function(Rejmankova and Komarkova, 2000; McCormick et al., 2001;Proia et al., 2012;Noe et al., 2002). As one of themain componentsof lake primary productivity in the littoral zone (Vadeboncoeur etal., 2001), biofilms are frequently subjected to P deficiency(Maberly et al., 2002; Rejmankova and Komarkova, 2000).Because of the boundary-layer of biofilms, microorganisms inbiofilms are more sensitive to P availability in the water bodythan phytoplankton (Riber and Wetzel, 1987). The growthrates of biofilms may increase with increasing P concentra-tion, but the phosphatase activity, which indicates the use oforganophosphoric compounds, may decline (Rejmankova andKomarkova, 2000). However, many studies concerning therelationship between phosphatase activity and P fractions arecontradictory. The relationship between them can be positive(Barik et al., 2001; Zhou et al., 2001; Zhang et al., 2007, 2012),negative (Vrba et al., 1993; Zhou and Zhou, 1997; Singh andTiwari, 2000; Nedoma et al., 2006; Boge et al., 2012), or evenirrelative (Jamet et al., 1997; Romani and Sabater, 2001), sophosphatase activity may be used only as a supplementaryindicator of P content.
Microbial community composition and succession are funda-mental determinants of ecosystem functioning (Naeem et al.,1994), which are controlled by a variety of physicochemical andbiological factors (Besemer et al., 2007; Yang et al., 2010). Thedevelopment of biofilms begins with the attachment of microor-ganisms to the surface of a support substratum naturally orartificially (Cohen, 2001). The formation process mainly includesfour steps: initial contact between microorganisms or attach-ment of a microorganism on a solid surface due to physicalmovement, stable and multicellular contact due to attractiveforces, microbial forces to make microorganisms mature, andformation of the three-dimensional structure of biofilms due tohydrodynamic shear forces (Liu and Tay, 2002; Yang et al., 2010).
In terms of bacteria, Jackson et al. (2001) suggested that the initialattachment of bacteria to substances was random, and thenbacterial assemblages may decrease because of competition forresources. However, in the later stage of biofilm colonization, thebacteria diversity would increase again in that biofilms havemore variation in habitat and available resources. In addition,external environmental conditions (temperature, light, andhydrodynamics) are probably other factors driving the succes-sionof bacteria (Lyautey et al., 2005). Flowvelocity (Besemer et al.,2007) and flow heterogeneity (Besemer et al., 2009) can influencethe community composition and succession of biofilms. There-fore, bacteria community composition and succession may beshaped by a combination of allogenic and autogenic changes(Lyautey et al., 2005), and such a complex process will not justconform to a single model. In the case of algae, besides thefactors above, nutrient content may also be a profound factor.Nevertheless, data on this process in algae are inconsistent. Onthe one hand, algal biomass accumulation is influenced bynutrient availability, but algal succession is independent ofnutrient availability (Villanueva et al., 2011). On the other hand,Veraart (2008) documented distinct variations in the composi-tion of an algae community caused by nutrient enrichment.This study also suggested that different species had differentresponses to nutrient addition, and the effects of nutrientdynamics on algal assemblage could not be separated fromother environmental conditions. The community compositionchanges with both nutrient availability and time of year(Chenier et al., 2003). Furthermore, there are more complicatedsituations. Under low N level, algae composition may bereshaped toward dominance by nitrogen-fixing taxa. In turn,these algae assemblages could increase the nitrogen content inbiofilms (Biggs and Smith, 2002).
Based on these previous studies, we hypothesized thatvariation in phosphorus availability may be a factor determin-ing biofilm structural variables, metabolism and microbialcommunity assemblages, but the critical values for each onemay be different. However, the colonization process of biofilmsitself may be also a main factor modulating its development.Therefore, this experiment was designed using field epilithicbiofilm samples collected from a hyper-eutrophic urban lake.The culture experimentswereperformedusing a flow incubatorunder closely controlled ambient conditions. The main objec-tives of this study were to assess: (1) how P availability and thecolonization process play roles in biofilm colonization; (2) whateffects the changes of biofilms in turn have on phosphoruscycling in a freshwater lake.
1. Materials and methods
1.1. Biofilm inocula collection
Phototrophic biofilm inoculawere collected fromone sitewhichwas near a sewage draining exit of Lake Nanhu in March, 2014.Lake Nanhu (30°30′N, 114°21′E) is a seriously eutrophic fresh-water lake in Wuhan City, China. The environmental variablesat the site: total phosphorus (TP), 0.6–0.8 mg/L; total nitrogen(TN), 4.8–9.4 mg/L. Submerged biofilms on flat stones in thelittoral zone were scraped off, stored in sterile plastic bottleswithmodified BG11medium, and kept on ice until arrival in the
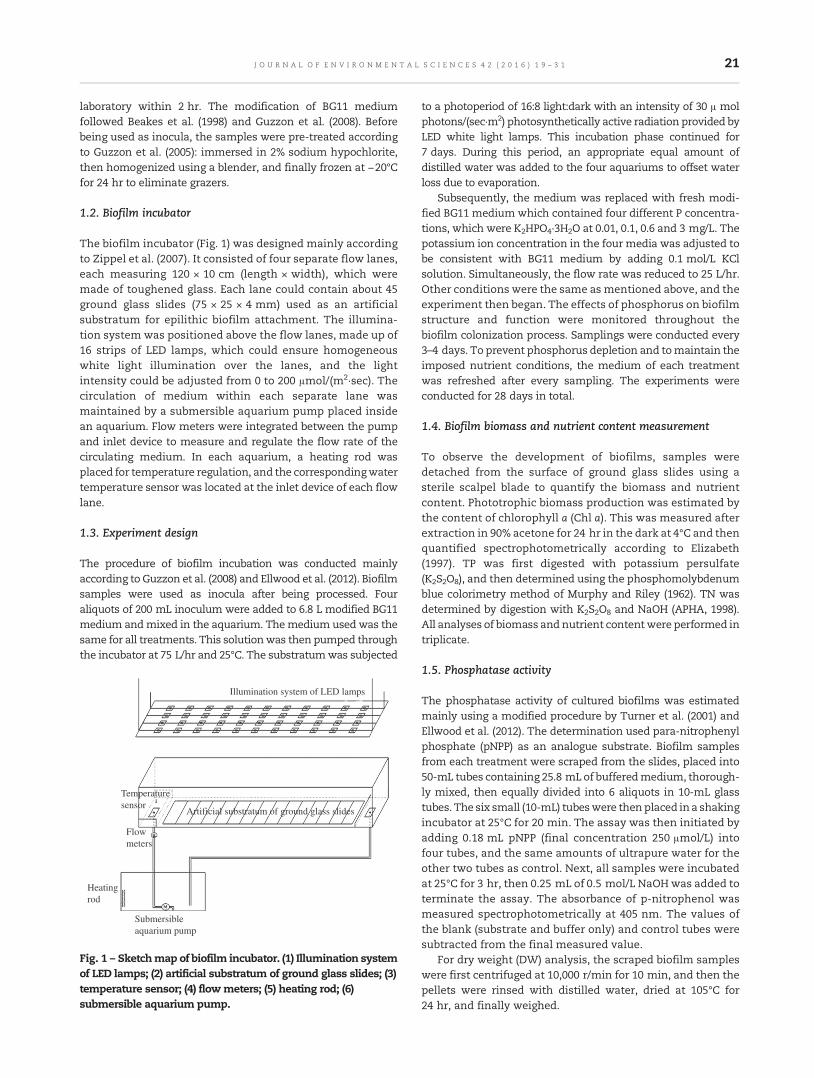
21J O U R N A L O F E N V I R O N M E N T A L S C I E N C E S 4 2 ( 2 0 1 6 ) 1 9 – 3 1
laboratory within 2 hr. The modification of BG11 mediumfollowed Beakes et al. (1998) and Guzzon et al. (2008). Beforebeing used as inocula, the samples were pre-treated accordingto Guzzon et al. (2005): immersed in 2% sodium hypochlorite,then homogenized using a blender, and finally frozen at −20°Cfor 24 hr to eliminate grazers.
1.2. Biofilm incubator
The biofilm incubator (Fig. 1) was designed mainly accordingto Zippel et al. (2007). It consisted of four separate flow lanes,each measuring 120 × 10 cm (length × width), which weremade of toughened glass. Each lane could contain about 45ground glass slides (75 × 25 × 4 mm) used as an artificialsubstratum for epilithic biofilm attachment. The illumina-tion system was positioned above the flow lanes, made up of16 strips of LED lamps, which could ensure homogeneouswhite light illumination over the lanes, and the lightintensity could be adjusted from 0 to 200 μmol/(m2·sec). Thecirculation of medium within each separate lane wasmaintained by a submersible aquarium pump placed insidean aquarium. Flow meters were integrated between the pumpand inlet device to measure and regulate the flow rate of thecirculating medium. In each aquarium, a heating rod wasplaced for temperature regulation, and the correspondingwatertemperature sensor was located at the inlet device of each flowlane.
1.3. Experiment design
The procedure of biofilm incubation was conducted mainlyaccording to Guzzon et al. (2008) and Ellwood et al. (2012). Biofilmsamples were used as inocula after being processed. Fouraliquots of 200 mL inoculum were added to 6.8 L modified BG11medium andmixed in the aquarium. Themedium used was thesame for all treatments. This solutionwas then pumped throughthe incubator at 75 L/hr and 25°C. The substratumwas subjected
Illumination system of LED lamps
Artificial substratum of ground glass slides
Temperaturesensor
Flowmeters
Heatingrod
Submersibleaquarium pump
Fig. 1 – Sketchmap of biofilm incubator. (1) Illumination systemof LED lamps; (2) artificial substratum of ground glass slides; (3)temperature sensor; (4) flowmeters; (5) heating rod; (6)submersible aquarium pump.
to a photoperiod of 16:8 light:dark with an intensity of 30 μ molphotons/(sec·m2) photosynthetically active radiation provided byLED white light lamps. This incubation phase continued for7 days. During this period, an appropriate equal amount ofdistilled water was added to the four aquariums to offset waterloss due to evaporation.
Subsequently, the medium was replaced with fresh modi-fied BG11 medium which contained four different P concentra-tions, which were K2HPO4·3H2O at 0.01, 0.1, 0.6 and 3 mg/L. Thepotassium ion concentration in the four media was adjusted tobe consistent with BG11 medium by adding 0.1 mol/L KClsolution. Simultaneously, the flow rate was reduced to 25 L/hr.Other conditions were the same as mentioned above, and theexperiment then began. The effects of phosphorus on biofilmstructure and function were monitored throughout thebiofilm colonization process. Samplings were conducted every3–4 days. To prevent phosphorus depletion and tomaintain theimposed nutrient conditions, the medium of each treatmentwas refreshed after every sampling. The experiments wereconducted for 28 days in total.
1.4. Biofilm biomass and nutrient content measurement
To observe the development of biofilms, samples weredetached from the surface of ground glass slides using asterile scalpel blade to quantify the biomass and nutrientcontent. Phototrophic biomass production was estimated bythe content of chlorophyll a (Chl a). This was measured afterextraction in 90% acetone for 24 hr in the dark at 4°C and thenquantified spectrophotometrically according to Elizabeth(1997). TP was first digested with potassium persulfate(K2S2O8), and then determined using the phosphomolybdenumblue colorimetry method of Murphy and Riley (1962). TN wasdetermined by digestion with K2S2O8 and NaOH (APHA, 1998).All analyses of biomass and nutrient contentwere performed intriplicate.
1.5. Phosphatase activity
The phosphatase activity of cultured biofilms was estimatedmainly using a modified procedure by Turner et al. (2001) andEllwood et al. (2012). The determination used para-nitrophenylphosphate (pNPP) as an analogue substrate. Biofilm samplesfrom each treatment were scraped from the slides, placed into50-mL tubes containing 25.8 mLof bufferedmedium, thorough-ly mixed, then equally divided into 6 aliquots in 10-mL glasstubes. The six small (10-mL) tubeswere thenplaced ina shakingincubator at 25°C for 20 min. The assay was then initiated byadding 0.18 mL pNPP (final concentration 250 μmol/L) intofour tubes, and the same amounts of ultrapure water for theother two tubes as control. Next, all samples were incubatedat 25°C for 3 hr, then 0.25 mL of 0.5 mol/L NaOHwas added toterminate the assay. The absorbance of p-nitrophenol wasmeasured spectrophotometrically at 405 nm. The values ofthe blank (substrate and buffer only) and control tubes weresubtracted from the final measured value.
For dry weight (DW) analysis, the scraped biofilm sampleswere first centrifuged at 10,000 r/min for 10 min, and then thepellets were rinsed with distilled water, dried at 105°C for24 hr, and finally weighed.
22 J O U R N A L O F E N V I R O N M E N T A L S C I E N C E S 4 2 ( 2 0 1 6 ) 1 9 – 3 1
1.6. Photosynthetic characteristics
Photosynthetic characteristics of the biofilms were analyzed bymeasuring the chlorophyll fluorescencewith a PAM-2100 system(Pulse–Amplitude–Modulation Chlorophyll Fluorescence 2100;WALZ, Effeltrich, Germany). The assessment of biofilm photo-synthetic activity was carried out by an undisturbed methodaccording to Barranguet et al. (2004) and Di Pippo et al. (2012).In vivo fluorescence measurements were conducted on eachsampling day. A simple improvement was made using atest-tube rack in order to position the substratum and thePAM fiber-optic, and keep a certain distance (8 mm) betweenthem. For each treatment, the measurement of actual photo-chemical efficiency ΦPSII was done as follows: 5 random pointswere measured per slide on a total of 6 slides. The slides werethen put back in the same position in the lane and re-used forthe next fluorescence assessment or analysis of other param-eters. ΦPSII was automatically calculated by the followingformula: ΦPSII = (Fm′–Fs)/Fm′ (Genty et al., 1989).
Biofilm samples cultured with various P concentrations for28 dayswereused to plot rapid light curves (RLCs). RLC included11 steps of actinic irradiance: 6, 8, 11, 15, 23, 32, 48, 70, 104, 153,and 228 μmol photons/(m2·sec), with a 20-sec interval timebetween any two adjacent steps.
1.7. Taxonomic composition
1.7.1. Changes in the composition of algaeBiofilmsamples for analysis of algal compositionandcommunitystructure were stored in plastic bottles and then fixed with 1%Lugol iodine solution. Before microscopic observation, sampleswere sonicated for 90 sec in order to disperse the biofilms.
1.7.2. Changes in the composition of bacteriaBiofilm samples were collected using sterile scalpel blades.Genomic DNA (deoxyribonucleic acid) was then extracted usingan E.Z.N.A.™ Soil DNA Kit (OMEGA Bio-Tek, Norcross, USA)according to the manufacturer's instruction. The variable V3region of bacterial 16S ribosomal RNA (ribonucleic acid) gene(rDNA)was PCR (polymerase chain reaction)-amplified using thebacterial target primers 357F-GC (5′-CCTACGGGAGGCAGCAG-3′with GC clamp in the 5′ end) and 518R (5′-ATTACCGCGGCTGCTGG-3′) as described by Muyzer et al. (1993). PCR wasprepared in 25 μL mixtures containing 80 μmol/L dNTP(deoxy-ribonucleoside triphosphate), 2 mmol/L MgCl2, 2.5 U ofTaqDNApolymerase in 1× buffer, 0.2 μmol/L of eachprimer, andapproximately 100 ng template DNA. Touchdown PCR wasperformed on a S1000TM thermal cycler (Bio-Rad, USA) asfollows: an initial denaturation at 94°C for 10 min, then 10 cyclesof 45 sec at 94°C, 30 sec at 68°C (in the first cycle annealing wasperformed at 68°C, the temperature was then decreased by 1°Ceach cycle), and 60 sec at 72°C. After that, an additional 24 cyclesof 45 sec at 94°C, 30 sec at 58°C and 60 sec at 72°C, and a finalextension step of 10 min at 72°C were performed.
PCR products were checked via electrophoresis in 1.5%agarose gel stained with ethidium bromide, and the confirmedproducts were then separated on polyacrylamide gel. DGGE(denaturing gradient gel electrophoresis) analysis was per-formed with an INGENYphorU-2 (INGENY International BV,Leiden, The Netherland) using 9.0% (W/V) polyacrylamide gel
(acrylamide:bisacrylamide = 37.5:1, W/W) with a 40%–70% de-naturing gradient. Electrophoresis was run for 12 hr at 110 V at60°C. Following that, the gel was stained with SYBR Gold(Invitrogen, USA) for 30 min, and visualized using a Gel Doc™XR imaging system (Bio-Rad, Hercules, USA). DGGE images wereanalyzed using Quantity One software (Bio-Rad, version 4.6.2).Some of the intensively stained bands were then excised fromthe DGGE gel and re-amplified by PCR. The PCR products werepurified using a DNA purification kit (Axygen, USA). Cloning wasperformed using the pMD 18-T vector (Takara, Japan) andEscherichia coli strain DH5α cells. After culture, DNA sequencingwas verified by Sangon Biotech Co., Ltd, China.
1.8. Statistical analysis of data
The effects of phosphorus concentration on biomass andnutrient content, phosphatase activity and photosyntheticcharacteristics throughout biofilm colonization were analyzedby repeated measures analysis of variance (RM-ANOVA) withtreatments as a fixed factor and colonization time as a randomfactor. Because the interactions between treatments andcolonization time were significant, one-way ANOVA followedby the least significant difference multiple comparisons weresubsequently used to test the differences between treatmentsin each sampling day. A t-test was used to examine whetherthere was difference among rapid light curves of all thetreatments. Correlation analysis was performed using theSpearman's rank correlation coefficients. The above statisticalanalyses were performed using SPSS (Statistical Product andService Solutions) 13.0 software (SPSS Inc, Chicago, USA).
The statistical differences of DGGE bands' richness andbacteria biodiversity indices between stages of colonizationwere evaluated using one-way ANOVA. The cluster analysis ofthe DGGE fingerprint image was performed by the unweightedpair-group method with arithmetic means (UPGMA) in thesoftware PAST. Principal component analysis (PCA) ordinationwas carried out based on the band intensity matrix usingCanoco for Windows 4.5. The statistically significant dissimi-larities of bacteria community composition were analyzed withAdonis (multivariate analysis of variance based on dissimilaritymatrices) using R version 3.1.2 (R Foundation for StatisticalComputing, Vienna, Austria).
2. Results
2.1. Biomass and nutrient contents
The Chl a contents of all treatments showed a similar increasetrend in the earlier stage of the colonization period (Fig. 2a).However, the influence of P on Chl a contents became significantby day 17 (p < 0.01). The final Chl a contents of biofilms that werecultured under P concentrations of 0.01, 0.1, 0.6 and 3 mg/L were15.157 ± 1.351, 22.742 ± 2.533, 41.739 ±0.498, 38.162 ± 0.011 μg/cm2,respectively. This suggested that the growth of algae inbiofilms was inhibited, in part, by low levels of P.
The DW of biofilms in all treatments appeared to be almostthe same (p > 0.05) (Fig. 2b). They kept increasing throughoutthe whole period of experiment, showing values between0.528 ± 0.045 and 3.736 ± 0.328 mg/cm2.

0 3 6 9 12 15 18 21 24 270
20
40
0 3 6 9 12 15 18 21 24 270
2
4
Chl
a (
µg/c
m2 )
P = 0.01 mg/L P = 0.1 mg/L P = 0.6 mg/L P = 3 mg/L
a b
DW
(m
g/cm
2 )
Time (days)Time (days)
Fig. 2 – Change in biomass of biofilm during the colonization period. (a) Chl a; (b) dry weights.
23J O U R N A L O F E N V I R O N M E N T A L S C I E N C E S 4 2 ( 2 0 1 6 ) 1 9 – 3 1
The total N contents (mg/cm2) of biofilms followed asimilar trend to that of dry weights for all four treatments(Fig. 3a), as displayed by a significant correlation between TNand DW (p < 0.01). However, the changes in the percent contentof N (% N of DW) in biofilms for all the treatments over timewere irregular (Fig. 3b).
The total P contents (μg/cm2) of biofilms cultured under Prich conditions (0.6 and 3 mg/L) were higher than those ofcultures under low P levels (0.01 and 0.1 mg/L) (p < 0.05) (Fig. 3c).The two biofilms cultured in P rich media showed similar Pcontents, and the two biofilms cultured in low P media alsoshowed similar P contents. During the experiment, the percentcontents of P (% P of DW) in all the treatments kept decreasing,and the decreasewas dose dependent (Fig. 3d). The values (fromlow to high P concentration) decreased by 78.4%, 73.0%, 4.2%and 4.3% of initial values respectively. The overall trend ofbiofilmN:P ratios in the four treatments was increasing, but therate of increase at low P levels was higher compared to thosecultured under rich P levels (Fig. 3e).
Correlation analyses showed highly significant positive rela-tionships among Chl a, TN and DW in all phosphorus conditions(p < 0.01).
0 3 6 9 1
9
18
27
0 3 6 9 12 15 18 21 24 270.0
0.1
0.2
0.3
0 3 6 9 130
60
90
0 3 6 9 12 15 18 21 24 270
40
80
N:P
Time
ed
ba
TN
(m
g/cm
2 )
N c
onte
nt (
% D
W)
P co
nten
t (%
DW
)
TimeTime (days)
Time (days)
Fig. 3 – Change in biofilm nutrient contents (N and P). (a and c) areP values as percentage of the biofilm dry weight; (e) N:P ratio of
2.2. Biofilm phosphatase activity
The biofilms showed a distinct difference in alkaline phos-phatase activity (APA) between rich and low P levels duringthe biofilm colonization (p < 0.05). Under low P levels (0.01 and0.1 mg/L P), the APA increased rapidly and continuously fromthe beginning of the fourth day. In contrast, the APA underrich P levels (0.6 and 3 mg/L P) maintained a steady and lowlevel with time in this experiment (Fig. 4a).
APA in the media of all the treatments experienced anincrease in the initial four days. However, at P levels of 0.1, 0.6and 3 mg/L, the APA then started to decrease and graduallyreached a relatively stable status (Fig. 4b). These values weresignificantly lower than that of biofilms under 0.01 mg/L P(p < 0.01).
2.3. Chlorophyll fluorescence
The ΦPSII of biofilms evaluated by PAM-2100 ranged between0.378 ± 0.014 and 0.527 ± 0.011 (Fig. 5). The ΦPSII values inbiofilms cultured under 3 mg/L P level kept continuouslyincreasing, and under P concentrations of 0.1 and 0.6 mg/L, the
0 3 6 9 12 15 18 21 24 27
5
10
15
20
2 15 18 21 24 27
2 15 18 21 24 27
TP
(µg/
cm2 )
(days)
c
P = 0.01 mg/L
P = 0.1 mg/L
P = 0.6 mg/L
P = 3 mg/L
(days) Time (days)
al N and P values normalized to surface area; (b and d) N andthe biofilm.

0 3 6 9 12 15 18 21 24 270
2
4
0 3 6 9 12 15 18 21 24 270
20
40
60
ba
Wat
er A
PA (
µmol
/(L
.hr)
)
Time (days)Time (days)
APA
(m
mol
pro
duct
/(g
DW
.hr)
)
P = 0.01 mg/L P = 0.1 mg/L P = 0.6 mg/L P = 3 mg/L
Fig. 4 – Change in alkaline phosphatase activity (APA) during the colonization period. (a) APA of biofilm; (b) APA in themedium.
24 J O U R N A L O F E N V I R O N M E N T A L S C I E N C E S 4 2 ( 2 0 1 6 ) 1 9 – 3 1
values started to increase after a short-term decline. Thebiofilms cultured at P level of 0.01 mg/L showed the lowestΦPSII values in comparison with the other treatments (p < 0.01).
Fig. 6a, and b shows the rapid light curves (RLCs) of theactual photochemical efficiency of PSII (ΦPSII) and α, respec-tively. The RLC of ΦPSII in biofilms for all cultures decreasedwith increasing light intensity. Compared with samples underP levels of 0.1, 0.6 and 3 mg/L, the ΦPSII was markedly lower inbiofilms under the P level of 0.01 mg/L (t-test, p < 0.05). Thevalue of α, which represents photosynthesis efficiency, wasalso lower in biofilms cultured at the P level of 0.01 mg/L(0.1529), compared with those cultured under P levels of 0.1, 0.6and 3 mg/L (0.1922, 0.1982, and 0.2035 respectively).
2.4. Change of algae composition
Thealgal community of all the treatmentswasmainly composedof Cyanophyta and Chlorophyta, as well as a small amount ofEuglenophyta, Bacillariophyta, and Cryptophyta. The dominantspecies of Cyanophyta were Phormidium sp., Lyngbya sp.,Chroococcus sp. and Oscillatoria sp. while the dominant species ofChlorophyta were Carteria sp., Scenedesmus sp. and Westella sp.Other Chlorophyta observed were Oocystis sp., Stigeoclonium
3 6 9 12 15 18 21 24 27 300.35
0.42
0.49
Yie
ld
Time (days)
P = 0.01 mg/L
P = 0.1 mg/L
P = 0.6 mg/L
P = 3 mg/L
Fig. 5 – Change in biofilm actual photochemical efficiency ofPSII (ΦPSII) during the colonization period.
sp. and Chlorella sp. Fig. 7 shows clear changes in the algaecommunity composition over time. Under all four P levels,the percent biovolumes of Cyanophyta and Chlorophytawereroughly equal in the first 4–7 days. Then Cyanophyta inbiofilms cultured under P levels of 0.01, 0.1 and 0.6 mg/Lbegan to increase rapidly, and became the dominant taxawith final values of 77.66%, 73.58%, and 80.80%, respectively.However, an exception was the biofilms cultured underthe P condition of 3 mg/L; its final percent biovolume ofCyanophyta was 61.80%. In terms of the morphology of algae,non-filamentous algae were the absolutely dominant taxa atthe beginning of the colonization period, with percentbiovolume values more than 70% for all the treatments (Fig. 8).However, under P levels of 0.01, 0.1 and 0.6 mg/L, filamentousalgae gradually increased and finally became the dominanttaxa, with percent values of 65.32%, 62.04%, and 67.74%,respectively. A difference was observed in biofilms under the Pcondition of 3 mg/L: its percent biovolume of filamentous algaeincreased relatively slowly and non-filamentous algae werealways prevalent.
2.5. Changes in bacteria assemblage
PCR-DGGE was performed to evaluate the composition ofbacteria communities in biofilms at different stages of coloni-zation under various concentrations of phosphorus. A total of73 bands containing 18 common bands and 4 sample-specificbands were detected in the DGGE fingerprint.
Theoretically, each band on the DGGE fingerprint representsan operational taxonomic unit (OTU). DGGE band richness wasused to infer the richness of bacterial taxa within each biofilm.The number of bands detected from biofilm samples wasbetween 31 and 48 (Table 1). With the development of biofilms,the number of bands increased, especially in biofilms under Plevels of 0.01 and 0.1 mg/L. Without consideration of treatment,significant differences in the number of DGGE bands weredetected between biofilms incubated for 1 day and thoseincubated for 7, 21 and 25 days (p < 0.05). However, there wasno significant difference in the number of DGGE bands betweentreatments. A total of 21 DNAbandswere excised and sequencedfor taxonomic identification. Sphingomonas spp., Rhodobacter spp.,Arenimonas spp.,Hydrogenophaga spp.,Ochrobactrum spp.,Gordonia

0 05 100 150 200 2500.2
0.3
0.4
0.5
0.6 ba
Yie
ld
PAR (µmol photons/(m2.sec))
YP=0.01 = 0.1529X + 0.3988
YP=0.1 = 0.1922X + 0.3477
YP=0.6 = 0.1982X + 0.3049
YP=3 = 0.2035X + 0.3901
0
4
8
12
16
0 20 40 60 80
γE
TR
(µm
ol p
hoto
ns/(
m2 .s
ec))
Illumination density (µmol photons/(m2.sec))
P = 0.01 mg/LP = 0.1 mg/LP = 0.6 mg/LP = 3 mg/L
P = 0.01 mg/L P = 0.1 mg/LP = 0.6 mg/L P = 3 mg/L
Fig. 6 – Rapid light curves (RLC) from biofilm cultured in various phosphorus concentrations for 28 days. (a) ΦPSII; (b) α.
25J O U R N A L O F E N V I R O N M E N T A L S C I E N C E S 4 2 ( 2 0 1 6 ) 1 9 – 3 1
spp. and Clostridium spp. were detected in the samples. Amongthem, Rhodobacter spp. were only detected in biofilms culturedunder the P level of 3 mg/L for 25 days.
Biodiversity indices of all samples were calculated basedon the DGGE fingerprint image (Table 1). The comparison ofbiodiversity indices also showed differences between biofilmsat different stages of their development.
UPGMA clusters indicated that bacteria communities fromthe same and adjacent time period preferred to cluster together(Fig. 9). Biofilms incubated for 1, 4, and 7 days were aggregatedinto one group, and the others, which incubated for 13, 21, and25 days, were aggregated into another group. The distance ofheterogeneity between 21-day aged biofilms and 25-day aged
0
20
40
60
80
100
Alg
ae c
ompo
sitio
n (%
)
Cryptophyta Bacillariophyta Eu
0 3 6 9 12 15 18 21 24 270
20
40
60
80
100c
ba
Alg
ae c
ompo
sitio
n (%
)
Time (days)
Time (days)0 3 6 9 12 15 18 21 24 27
Fig. 7 – Change in algae community compositionduring the colonizphosphorus (mg/L): (a) 0.01; (b) 0.1; (c) 0.6; ( d) 3.
biofilms was so small that the samples mixed together in thecluster tree. This result emphasizes the phenomenon that themost important factor determining community assemblagewas the stage of biofilm colonization. PCA analysis also reacheda similar conclusion (Fig. 10).
To statistically assess differences in bacterial communitystructure across various P concentrations and stages of coloniza-tion, the peak values of each band were compared using Adonis.The results showed that there was no significant difference inbacterial community composition between the four treatments(F = 0.9538, p = 0.4179). However, without consideration of treat-ment, bacterial assemblages of different stages of developmentwere significantly different (F = 17.441, p = 0.0050).
glenophyta Chlorophyta Cyanophyta
0
20
40
60
80
100
Alg
ae c
ompo
sitio
n (%
)
d
0 3 6 9 12 15 18 21 24 270
20
40
60
80
100
Alg
ae c
ompo
sitio
n (%
)
Time (days)
0 3 6 9 12 15 18 21 24 27Time (days)
ationperiod. Small letters represent different concentrations of

0
20
40
60
80
100
Alg
ae c
ompo
sitio
n (%
)
Non-filamentous algae Filamentous algae
0
20
40
60
80
100
Alg
ae c
ompo
sitio
n (%
)
0 3 6 9 12 15 18 21 24 270
20
40
60
80
100 dc
ba
Alg
ae c
ompo
sitio
n (%
)
Time (days) 0 3 6 9 12 15 18 21 24 27
0
20
40
60
80
100
Alg
ae c
ompo
sitio
n (%
)
Time (days)
0 3 6 9 12 15 18 21 24 27Time (days)
0 3 6 9 12 15 18 21 24 27Time (days)
Fig. 8 – Change in the morphology (filamentous, non-filamentous) of algae biovolume during the colonization period. Smallletters represent different concentrations of phosphorus (mg/L): (a) 0.01; (b) 0.1; (c) 0.6; (d) 3.
Table 1 – The band richness and biodiversity indices of biofilms cultured under different concentrations of phosphorus.
Sampling days P concentration (mg/L) Bandrichness
Shannon–Wiener Simpson Margalef
Value Mean Value Mean ± SD Value Mean ± SD Value Mean ± SD
Day 1 0.01 31 37b 3.261 3.434 ± 0.117b 0.956 0.963 ± 0.005c 3.320 3.815 ± 0.336c0.1 38 3.470 0.965 3.9070.6 39 3.489 0.965 3.9733 40 3.515 0.966 4.059
Day 4 0.01 44 43.75a 3.580 3.578 ± 0.040a 0.967 0.967 ± 0.001ab 4.472 4.342 ± 0.201ab0.1 41 3.527 0.966 4.0660.6 46 3.626 0.969 4.5093 44 3.578 0.967 4.319
Day 7 0.01 41 44a 3.508 3.557 ± 0.069a 0.964 0.966 ± 0.003bc 4.088 4.340 ± 0.317ab0.1 41 3.487 0.963 4.0440.6 47 3.616 0.968 4.6233 47 3.616 0.968 4.604
Day 13 0.01 44 43.25a 3.596 3.560 ± 0.028a 0.968 0.967 ± 0.001ab 4.379 4.272 ± 0.172b0.1 44 3.562 0.967 4.3450.6 44 3.555 0.967 4.3493 41 3.527 0.966 4.016
Day 21 0.01 45 46a 3.646 3.622 ± 0.030a 0.970 0.969 ± 0.002ab 4.438 4.559 ± 0.097ab0.1 46 3.636 0.969 4.5220.6 46 3.579 0.966 4.6283 47 3.627 0.969 4.646
Day 25 0.01 48 46a 3.69 3.645 ± 0.046a 0.971 0.970 ± 0.002a 4.768 4.613 ± 0.136a0.1 47 3.665 0.971 4.6870.6 44 3.583 0.967 4.4963 45 3.641 0.970 4.502
Within the same columns, values with different letters differ with each other (p < 0.05).
26 J O U R N A L O F E N V I R O N M E N T A L S C I E N C E S 4 2 ( 2 0 1 6 ) 1 9 – 3 1

A13
A21
B21
D21
C21
A25
B25
C25
D25
A4
A7
B7
B1
C1
D1
A1
C7
D7
B4
D4
C4
B13
C13
D13
Similarity
0.95 0.90 0.85 0.80 0.75 0.70 0.65 0.60
Fig. 9 – UPGMA clustering of 16S rRNA gene in biofilm samples.Capital letters represent different concentrations of phosphorus(mg/L): A 0.01; B 0.1; C 0.6; D 3. Numbers represent the age of thebiofilm in days.
-1.0 1.5
A1
B1C1
D1
A4
B4
C4
D4A7
B7
C7
D7A13
B13
C13
D13
A21
B21
C21
D21A25
B25
C25D25
0.8
-0.6
Fig. 10 – PCA ordination of 16S rRNA gene in biofilm samples.Capital letters represent different concentrations of phosphorus(mg/L): A 0.01; B 0.1; C 0.6; D 3. Numbers represent the age of thebiofilm in days.
27J O U R N A L O F E N V I R O N M E N T A L S C I E N C E S 4 2 ( 2 0 1 6 ) 1 9 – 3 1
3. Discussion
The biofilm is one of the major sites of P cycling in freshwaterhabitats. The study was designed to explore the responsemechanism of biofilms to various P concentrations. The impactsof P availability on the development and physiology of culturedbiofilms were obvious.
Phosphorus limitation in the low nutrient water body wasindicated by APA (Healey and Hendzel, 1979; Singh and Tiwari,2000), which often showed an inverse relationship with Pavailability (Whitton et al., 2005; Nedoma et al., 2006; Boge etal., 2012). The production of APA was one possible strategy toovercome P insufficiency (Rejmankova and Komarkova, 2000;Strojsova et al., 2005). In thepresent study, theAPAkept roughlyconsistent for all four treatments in the initial 4 days, suggest-ing that the low P level (0.01 and 0.1 mg/L) could maintain thenormal growth of biofilms for a period of time. Also, part of Pused in this period was probably from the inoculation phase.However, biofilms, at least algae, of these two groups thenprobably began to suffer from phosphorus deficiency, whichwas associated with distinctly higher phosphatase activities,lower Chl a and lower P contents (Litchman et al., 2003;Newman et al., 2003). These results emphasize the importanceof the fact that biofilm phosphatase activity was regulated to agreat extent by P concentration in the medium, and probablytriggered by phosphorus deficiency. The increase in phospha-tase activity may be a response to the increase in P demandcaused by the development of the biofilm (Ellwood et al., 2012).Also, in the low nutrient treatment (0.01 and 0.1 mg/L), phospha-tase activity increased faster at the end of the experiment,indicating stronger P limitation andmore acquisition of inorganicphosphorus from organic compounds.
In spite of obvious differences of Chl a contents in the laterstages, there was no significant difference in DW throughoutthe experiment. This was probably because biofilms culturedunder low P status had made some stress response tocounteract P limit. This phenomenon may be caused by thereverse relationship between EPS production and utilizablenutrient contents. It was known from early studies that thepresence of EPS, namely biofilmmucilages, markedly increasedthe adsorption capacity of biofilms by providing potentialbinding sites for many kinds of organic and inorganic elements(Sabater et al., 2002; Xing et al., 2011). Wetzel et al. (1997)regarded the production of EPS as a mechanism for nutrientretention. Furthermore, it has been shown that nutrientdepletion inbiofilms could inducean increase of EPSproduction(Mohamed et al., 1998;Wang et al., 2005; Zhang et al., 2014), andthere appeared to be more EPSmatrix in treatments containinginsufficient phosphorus concentration and imbalanced N:Pratios (Artigas et al., 2012; Neu et al., 2005). In the presentstudy, we also found that biofilms cultured under low P levelswere easier to aggregate together, and to be removed as a layerof thin film. Thiswas likely due to the function of EPS.Moreover,our unpublished study also found that the EPS content ofbiofilms cultured under a P level of 0.01 mg/L was significantlyhigher than that of cultures under a P level of 0.6 mg/L. What'smore, the presence of EPS would contribute to strengthen thecohesion of the biofilms so as to better resist hydrodynamicshear stress (Mathieu et al., 2014). Therefore, biofilms cultured

28 J O U R N A L O F E N V I R O N M E N T A L S C I E N C E S 4 2 ( 2 0 1 6 ) 1 9 – 3 1
under low P conditions (0.01 and 0.1 mg/L) possibly interceptedmore additional elements.
Another reason for this phenomenonmight be attributed torespiration. Biofilms cultured under low P level had lowerphotosynthetic activity, but their respiration may also be lowerso as to reduce the consumption of organic matter. Therefore,biofilms of all treatments obtained almost the same DW.
Biofilms cultured under low P level showed higher efficiencyin P utilization in comparison with those at high P level. In thepresent study, the ratios of P concentration provided in themedium of the four treatments were 1:10:60:300, but the ratiosin biofilms were much higher throughout the experiment.The final ratios of phosphorus content in biofilms were1:1.25:3.23:3.18, suggesting higher uptake efficiency at low Pstatus. As mentioned above, this higher uptake efficiency inlow P statuswas related, in part, to the higher contents of EPS.What's more, this situation should be also attributed to theregulated expression of some genes involved in P acquisition,which are two high-affinity phosphate-binding protein genesand a putative alkaline phosphatase gene. The expression ofthese genes would increase when cells were offered low Pconcentration, but decreased when P was sufficient (Harke etal., 2012).
The results of our study also showed that there was virtuallyno difference in biomass, P and N contents, phosphataseactivity and chlorophyll fluorescence betweenbiofilms culturedunder 0.6 and 3 mg/L P. This suggested that when the Pconcentration in themedium increased to 0.6 mg/L, the growthof biofilms would not be limited at all. The threshold ofphosphorus concentration limiting biofilm development maybe between 0.1 and 0.6 mg/L.
The microbial community assemblage was an importantfactor in response to environmental stress (Chenier et al., 2003).In the current study, both algae and bacteria communitycomposition showed noticeable change on days 7–10, andtheir community shifts occurred almost at the same time.
Similar algae species were observed in biofilms of alltreatments, whereas the succession (proportional biovolume) ofthe algae community was different. A taxonomic dominanceshift occurred from Chlorophyta and Cyanophyta in the earlystage of biofilm colonization to Cyanophyta in mid and latestages under P concentrations of 0.01, 0.1 and 0.6 mg/L. Thisresult emphasized the phenomenon that cyanobacteria aremorecompetitive during the development of biofilms. It was knownfrom early study that cyanobacteria were generally the majorcomponents of microbial mats in various environments (Severinand Stal, 2010). Some possible reasons have been offered for thisphenomenon (Yu, 2011; Aubriot and Bonilla, 2012). Firstly, it waslikely that many cyanobacteria had the ability to secrete EPS.Secondly, cyanobacteria were capable of CO2 capture, and somewere diazotrophs, so they had low nutritional requirements.The high nutrient-uptake rate, affinity, and storage capacity ofcyanobacteria could confer themcompetitive capabilities.What'smore, cyanobacteria had the ability to adapt to extreme andfluctuating environmental conditions and could thrive in variousenvironments. McCormick and O'Dell (1996) and Rejmankovaand Komarkova (2000) also found that cyanobacteria were themain components of mats in P-limited areas, and the increase ofnutrient concentration was accompanied with an increase indiatoms and green algae.
Another interesting phenomenon was the shift fromnon-filamentous algae to filamentous algae in biofilms culturedunder P levels of 0.01, 0.1 and 0.6 mg/L. Non-filamentous algalspecies such as Chroococcus sp., Carteria sp., and Scenedesmus sp.dominated in the initial stage of attachment for all treatments,but they were gradually replaced by filamentous species, mostlyPhormidium sp.,Oscillatoria sp., and Lyngbya sp. in themid and latestages of biofilm colonization. It was likely that early colonizerschanged the environmental conditions in the biofilms, andthis change could facilitate the attachment of filamentouscyanobacteria (Roeselers et al., 2007). Previous studies alsoreported that filamentous cyanobacteria frequently prevailed inthe cyanobacteria communities in low nutrient availability(Rejmankova andKomarkova, 2000) and extremeenvironments(Vincent et al., 1993). Filamentous cyanobacteria (Phormidium)even dominated the biofilms incubated under P-organic,P-replete and P-limited conditions at the final colonizationperiod (Ellwood et al., 2012). This is because the filamentouscyanobacteria can produce a lot of EPS (Di Pippo et al., 2013) andinterleave closely to form a film structure. These characteristicsare helpful for biofilms to attach to the substrate.
In the present study, Phormidium sp. was found to be themostabundant filamentous cyanobacterium, accounting for morethan 65% of the filamentous algal biomass in the mid and latestageof biofilms in all treatments.Microscopic observation foundthat Phormidium sp. exhibited a high capacity for movement,which possibly contributed to escaping from environmentalstress. It had also been reported that drift and immigration maybe a crucial mechanism for some algae species to resist nutrientlimitation, and this ecological strategy could be regarded asspecies autecology (Stevensen et al., 1991). This may be anotherreason why filamentous algae prevailed.
Biofilms cultured under P levels of 0.01 and 0.1 mg/L hadsimilar algae assemblages and succession processes to thosecultured under the P level of 0.6 mg/L, but the changes in theirphosphatase activities were totally different. Therefore, it couldbe expected that the response of phosphatase activity ismainlydue to phosphorus availability and the developmental stage ofbiofilms, not to shifts in the algae assemblages. It is likely thatthe same algae exhibit differential metabolic responses underdifferent environments. The enzyme-labeled fluorescencetechnique is often used to test the production of phosphataseof single algal species (Nedoma et al., 2003; Cao et al., 2005). Byusing thismethod, we observed that algal species of Scenedesmus,Phormidium and Chroococcus could produce phosphatase under Plevels of 0.01 and 0.1 mg/L, but they produced little phosphataseunder P levels of 0.6 and 3 mg/L (unpublished data). That's to say,themetabolic activity of the same algal species changes with theenvironmental conditions.
Microbial succession in biofilms was found to be driven bybacteria in the early stages, and the initial attachment ofbacteria to substrate surface was random (Brasell et al., 2015).Previous studies reported that the succession of bacterialassemblages in biofilms was mostly determined by the age ofbiofilms (Artigas et al., 2012). Similarly,wedetected significantlydifferent bacterial communities in different developmentalstages of the biofilms. The main factor controlling biofilmbacteria succession was time and maturation during a relativestable period (Lyautey et al., 2005). Nevertheless, differentconcentrations of phosphorus supply seemed to have no effect
29J O U R N A L O F E N V I R O N M E N T A L S C I E N C E S 4 2 ( 2 0 1 6 ) 1 9 – 3 1
on the bacterial community structure in the present study, so itis likely that the bacterial P requirement was very low.Kalinowska (1997) demonstrated that phosphorus levels in thewater between 0.009 and0.021 mg/Lwere sufficient for bacterialgrowth. Previous studies also showed that growth limitation ofbiofilm bacteria was often due to carbon, not phosphorus ornitrogen (Haak and McFeters, 1982; Peterson et al., 1993).Therefore, the production of phosphatases by bacteria may benot a response to phosphorus deficiency, but to utilize theorganic moiety of organophosphoric compounds as a source oforganic carbon (Kalinowska, 1997). Additionally, bacteria inbiofilms can use organic matter from algal exudates for theirgrowth, and rely less on external sources for nutrition, so algaland bacterial biomass were often positively correlated (Romaniand Sabater, 1999; Carr et al., 2005). Carr et al. (2005) alsodemonstrated that bacterial production was almost unchangedwith increasingN or P in thewater column, and thiswas becausebacteria could also use inorganic nutrients from the polysaccha-ride matrix.
4. Conclusions
The functions of growth and photosynthesis of algae in biofilmswere significantly inhibited under low phosphorus conditions,and phosphorus limitation could lead to significant changes inthe algal community structure, that is, the final dominance ofcyanobacteria and filamentous algae in terms of algal speciesand morphology, respectively. However, the bacterial commu-nity structure of biofilms was almost unaffected by phosphorusavailability. In brief, these results suggested that the develop-ment of biofilms was influenced by the phosphorus availabilityand/or the colonization stage.
Acknowledgments
This study was supported by theMajor Science and TechnologyProgram for Water Pollution Control and Treatment (No.2012ZX07103003-02). The authors thank Dr Jiajia Ni, fromGuangdong Institute of Microbiology, Guangdong Academy ofScience, for his assistance in DGGE data analysis.
R E F E R E N C E S
APHA, 1998. Standard Methods for the Examination of Water andWastewater. 20th ed. American Public Health Association,American Water Work Association, Water EnvironmentFederation, Washington DC, USA.
Artigas, J., Fund, K., Kirchen, S., Morin, S., Obst, U., Romani, A.M.,et al., 2012. Patterns of biofilm formation in two streams fromdifferent bioclimatic regions: analysis of microbial communitystructure and metabolism. Hydrobiologia 695, 83–96.
Aubriot, L., Bonilla, S., 2012. Rapid regulation of phosphate uptake infreshwater cyanobacterial blooms. Aquat. Microb. Ecol. 67,251–263.
Barik, S.K., Purushothaman, C.S., Mohanty, A.N., 2001. Phosphataseactivity with reference to bacteria and phosphorus in tropicalfreshwater aquaculture pond systems. Aquac. Res. 32, 819–832.
Barranguet, C., van den Beusekom, A.A.M., Veuger, B., Neu, T.R.,Manders, E.M.M., Sinke, J.J., et al., 2004. Studying undisturbedautotrophic biofilms: still a technical challenge. Aquat. Microb.Ecol. 34, 1–9.
Battin, T.J., Kaplan, L.A., Newbold, J.D., Hansen, C.M.E., 2003.Contributions of microbial biofilms to ecosystem processes instream mesocosms. Nature 426, 439–442.
Beakes, G.W., Canter, H.M., Jaworski, G.H.M., 1998. Zoosporesultrastructure of Zygorhizidium affluens and Z. planktonicum, twochytrids parasitizing the diatom Asterionella formosa. Can.J. Bot. 66 (6), 1054–1067.
Besemer, K., Singer, G., Limberger, R., Chlup, A.-K., Hochedlinger,G., Hödl, I., et al., 2007. Biophysical controls on communitysuccession in stream biofilms. Appl. Environ. Microbiol. 73 (15),4966–4974.
Besemer, K., Singer, G., Hodl, I., Battin, T.J., 2009. Bacterialcommunity composition of stream biofilms in spatiallyvariable-flow environments. Appl. Environ. Microbiol. 75 (22),7189–7195.
Biggs, B.J.F., Smith, R.A., 2002. Taxonomic richness of streambenthic algae: effects of flood disturbance and nutrients.Limnol. Oceanogr. 47 (4), 1175–1186.
Boge, G., Lespilette, M., Jamet, D., Jamet, J.L., 2012. Role of seawater DIP and DOP in controlling bulk alkaline phosphataseactivity in N.W. Mediterranean Sea (Toulon, France). Mar.Pollut. Bull. 64 (10), 1989–1996.
Brasell, K.A., Heath, M.W., Ryan, K.G., Wood, S.A., 2015.Successional change in microbial communities of benthicphormidium-dominated biofilms. Microb. Ecol. 69, 254–266.
Cao, X.Y., Strojsova, A., Znachor, P., Zapomelova, E., Liu, G.X.,Vrba, J., et al., 2005. Detection of extracellular phosphatases innatural spring phytoplankton of a shallow eutrophic lake(Donghu, China). Eur. J. Phycol. 40 (3), 251–258.
Carr, G.M., Morin, A., Chamabers, P.A., 2005. Bacteria and algae instream periphyton along a nutrient gradient. Freshw. Biol. 50,1337–1350.
Chenier,M.R., Beaumier, D., Roy, R., Driscoll, B.T., Lawrence, J.R., Greer,C.W., 2003. Impact of seasonal variations and nutrient inputs onnitrogen cycling and degradation of hexadecane by replicatedriver biofilms. Appl. Environ. Microbiol. 69 (9), 5170–5177.
Cohen, Y., 2001. Biofiltration—the treatment of fluids bymicroorganisms immobilised into the filter bedding material: areview. Bioresour. Technol. 77, 257–274.
Di Pippo, F., Bohn, A., Congestri, R., De Philippis, R., Albertano, P.,2009. Capsular polysaccharides of cultured phototrophicbiofilms. Biofouling 25 (6), 495–504.
Di Pippo, F., Ellwood, N.T.W., Guzzon, A., Siliato, L., Micheletti, E.,De Philippis, R., et al., 2012. Effect of light and temperature onbiomass, photosynthesis and capsular polysaccharides incultured phototrophic biofilms. J. Appl. Phycol. 24, 211–220.
Di Pippo, F., Ellwood, N.T.W., Gismondi, A., Bruno, L., Rossi, F.,Magni, P., et al., 2013. Characterization of exopolysaccharidesproduced by seven biofilm-forming cyanobacterial strains forbiotechnological applications. J. Appl. Phycol. 25 (6), 1697–1708.
Elizabeth, J.A., 1997. Method 446.0 In Vitro Determination ofChlorophylls a, b, c 1+ c 2 and Pheopigments in Marine andFreshwater Algae by Visible Spectrophotometry. USEnvironmental Protection Agency, pp. 1–26.
Ellwood, N.T.W., Di Pippo, F., Albertano, P., 2012. Phosphataseactivities of cultured phototrophic biofilm. Water Res. 46,378–386.
Genty, B., Briantais, J.M., Baker, N.R., 1989. The relationship betweenthe quantum yield of photosynthetic electron transport andquenching of chlorophyll fluorescence. Biochim. Biophys. ActaGen. Subj. 990, 87–92.
Guzzon, A., Congestri, R., Albertano, P., 2005. Light-inducedchanges in photosynthesis and structure of cyanobacteriacultured biofilms from an Italian wastewater treatment plant.Algol. Stud. 117, 223–228.

30 J O U R N A L O F E N V I R O N M E N T A L S C I E N C E S 4 2 ( 2 0 1 6 ) 1 9 – 3 1
Guzzon, A., Bohn, A., Diociaiuti, M., Albertano, P., 2008. Culturedphototrophic biofilms for phosphorus removal in wastewatertreatment. Water Res. 42, 4357–4367.
Haak, S.K., McFeters, G.A., 1982. Nutritional relationships amongmicroorganisms in an epilithic biofilm community. Microb.Ecol. 8, 115–126.
Harke, M.J., Berry, D.L., Ammerman, J.W., Gobler, C.J., 2012.Molecular response of the bloom-forming Cyanobacterium,Microcystis aeruginosa, to phosphorus limitation. Microb. Ecol.63, 188–198.
Healey, F.P., Hendzel, L.L., 1979. Indicators of phosphorus andnitrogen deficiency in five algae in culture. J. Fish. Res. BoardCan. 36, 1364–1369.
Jackson, C.R., Churchill, F., Roden, E.E., 2001. Successional changesin bacterial assemblage structure during epilithic biofilmdevelopment. Ecology 82 (2), 555–566.
Jamet, D., Amblard, C., Devaux, J., 1997. Seasonal changes inalkaline phosphatase activity of bacteria andmicroalgae in LakePavin (Massif Central, France). Hydrobiologia 347, 185–195.
Jang, A., Kim, S.M., Kim, S.Y., Lee, S.G., Kim, I.S., 2001. Effect ofheavy metals (Cu, Pb, and Ni) on the compositions of EPS inbiofilms. Water Sci. Technol. 43, 41–48.
Jorand, F., Zartarian, F., Thomas, F., Block, J.C., Bottero, J.Y.,Villemin, G., et al., 1995. Chemical and structural (2D) linkagebetween bacteria within activated sludge flocs. Water Res. 29,1639–1647.
Kalinowska, K., 1997. Eutrophication processes in a shallow,macrophyte dominated lake-alkaline phosphatase activity inLake Luknajno (Poland). Hydrobiologia 342, 395–399.
Litchman, E., Steiner, D., Bossard, P., 2003. Photosynthetic andgrowth responses of three freshwater algae to phosphoruslimitation and daylength. Freshw. Biol. 48, 2141–2148.
Liu, Y., Tay, J.H., 2002. The essential role of hydrodynamic shearforce in the formation of biofilm and granular sludge.Water Res.36, 1653–1665.
Lock, M.A., Wallace, R.R., Costerton, J.W., Ventullo, R.M., Charlton,S.E., 1984. River epilithon: towards a structural–functionalmodel. Oikos 42, 10–22.
Lyautey, E., Jackson, C.R., Cayrou, J., Rols, J.-L., Garabetian, F., 2005.Bacterial community succession in natural river biofilmassemblages. Microb. Ecol. 50, 589–601.
Maberly, S.C., King, L., Dent, M.M., Jones, R.I., Gibson, C.E., 2002.Nutrient limitation of phytoplankton and periphyton growthin upland lakes. Freshw. Biol. 47, 2136–2152.
Mathieu, L., Bertrand, I., Abe, Y., Angel, E., Block, J.C., Skali-Lami, S.,et al., 2014. Drinking water biofilm cohesiveness changes underchlorination or hydrodynamic stress. Water Res. 55, 175–184.
McCormick, P.V., O'Dell, M.D., 1996. Quantifying periphytonresponses to phosphorus in the Florida Everglades: a synopticexperimental approach. J. N. Am. Benthol. Soc. 15, 450–468.
McCormick, P.V., O'Dell, M.B., Shuford III, R.B.E., Backus, J.G., Kennedy,W.C., 2001. Periphyton responses to experimental phosphorusenrichment in a subtropical wetland. Aquat. Bot. 71, 119–139.
Mohamed, M.N., Lawrence, J.R., Robarts, R.D., 1998. Phosphoruslimitation of heterotrophic biofilms from the Fraser River,British Columbia, and the effect of pulp mill effluent. Microb.Ecol. 36, 121–130.
Murphy, J., Riley, J.P., 1962. A modified single solution method forthe determination of phosphate in natural waters. Anal. Chim.Acta 27, 31–36.
Muyzer, G., de Waal, E.C., Uitterlinden, A.G., 1993. Profiling ofcomplex microbial populations by denaturing gradient gelelectrophoresis analysis of polymerase chain reaction-amplifiedgenes coding for 16S rRNA. Appl. Environ. Microbiol. 59, 695–700.
Naeem, S., Thomson, L.J., Lawler, S.P., Lawton, J.H., Woodfin, R.M.,1994. Declining biodiversity can alter the performance ofecosystems. Nature 368, 734–737.
Nedoma, J., Strojsova, A., Vrba, J., Komarkova, J., Simek, K., 2003.Extracellular phosphatase activity of natural plankton studied
with ELF97 phosphate: fluorescence quantification and labellingkinetics. Environ. Microbiol. 5 (6), 462–472.
Nedoma, J., Garcia, J.C., Comerma, M., Simek, K., Armengol, J.,2006. Extracellular phosphatases in a Mediterranean reservoir:seasonal, spatial and kinetic heterogeneity. Freshw. Biol. 51 (7),1264–1276.
Neu, T.R., Swerhone, G.D.W., Bockelmann, U., Lawrence, J.R., 2005.Effect of CNP on composition and structure of lotic biofilms asdetected with lectin-specific glycoconjugates. Aquat. Microb.Ecol. 38, 283–294.
Newman, S., McCormick, P.V., Backus, J.G., 2003. Phosphataseactivity as an earlywarning indicator of wetland eutrophication:problems and prospects. J. Appl. Phycol. 15, 45–59.
Noe, G.B., Childers, D.L., Edwards, A.L., Gaiser, E., Jayachandran,K., Lee, D., et al., 2002. Short-term changes in phosphorusstorage in an oligotrophic Everglades wetland ecosystemreceiving experimental nutrient enrichment. Biogeochemistry59, 239–267.
Perez-Martinez, C., Sanchez-Castillo, P., Jimenez-Perez, M.Z., 2010.Utilization of immobilized benthic algal species for N and Premoval. J. Appl. Phycol. 22, 277–282.
Peterson, B.J., Deegan, L., Helfrich, J., Hobbie, J.E., Hullar, M.A.,Moller, B., et al., 1993. Biological responses of a tundra river tofertilization. Ecology 74, 653–672.
Proia, L., Romaní, A.M., Sabater, S., 2012. Nutrients and light effects onstream biofilms: a combined assessment with CLSM, structuraland functional parameters. Hydrobiologia 695, 281–291.
Pusch, M., Fiebig, D., Brettar, I., Eisenmann, H., Ellis, B.K., Kaplan,L.A., et al., 1998. The role of micro-organisms in the ecologicalconnectivity of running waters. Freshw. Biol. 40, 453–495.
Rejmankova, E., Komarkova, J., 2000. A function of cyanobacterialmats in phosphorus-limited tropical wetlands. Hydrobiologia431, 135–153.
Riber, H.H., Wetzel, R.G., 1987. Boundary-layer and internaldiffusion effects on phosphorus fluxes in lake periphyton.Limnol. Oceanogr. 32 (6), 1181–1194.
Roeselers, G., Loosdrecht, M.C.M.V., Muyzer, G., 2007. Heterotrophicpioneers facilitate phototrophic biofilm development. Microb.Ecol. 54 (3), 578–585.
Romani, A.M., Sabater, S., 1999. Epilithic ectoenzyme activity in anutrient-rich Mediterranean river. Aquat. Sci. 61, 122–132.
Romani, A.M., Sabater, S., 2001. Structure and activity of rock andsand biofilms in a Mediterranean stream. Ecology 82, 3232–3245.
Romani, A.M., Guasch, H., Munoz, I., Ruana, J., Vilalta, E.,Schwartz, T., Emtiazi, F., Sabater, S., 2004. Biofilm structureand function and possible implications for riverine DOCdynamics. Microb. Ecol. 47, 316–328.
Sabater, S., Guasch, H., Romani, A., Munoz, I., 2002. The effect ofbiological factors on the efficiency of river biofilms inimproving water quality. Hydrobiologia 469, 149–156.
Severin, I., Stal, L.J., 2010. Diazotrophic microbial mats. In:Seckbach, J., Oren, A. (Eds.), Microbial Mats: Modern andAncient Microorganisms in Stratified Systems (Cellular Origin,Life in Extreme Habitats and Astrobiology). Springer,pp. 323–342.
Singh, S.K., Tiwari, D.N., 2000. Control of alkaline phosphataseactivity in Anabaena oryzae Fritsch. J. Plant Physiol. 157,467–472.
Stevensen, R.J., Peterson, C.G., Kirschtel, D.B., King, C.C.,Tuchman, N.C., 1991. Density-dependent growth, ecologicalstrategies, and effect of nutrients and shading on benthicdiatom succession in streams. J. Phycol. 27, 59–69.
Stoodley, P., Sauer, K., Davies, G., Costerton, J.W., 2002. Biofilms ascomplex differentiated communities. Annu. Rev. Microbiol. 56,187–209.
Strojsova, A., Vrba, J., Nedoma, J., Simek, K., 2005. Extracellularphosphatase activity of freshwater phytoplankton exposed todifferent in situ phosphorus concentrations. Mar. Freshw. Res.56, 417–424.

31J O U R N A L O F E N V I R O N M E N T A L S C I E N C E S 4 2 ( 2 0 1 6 ) 1 9 – 3 1
Turner, B.L., Baxter, R., Ellwood, N.T.W., Whitton, B.A., 2001.Characterization of the phosphatase activities of mosses inrelation to their environment. Plant Cell Environ. 24, 1165–1176.
Vadeboncoeur, Y., Lodge, D.M., Carpenter, S.R., 2001. Whole-lakefertilization effects on distribution of primary productionbetween benthic and pelagic habitats. Ecology 82, 1065–1077.
Veraart, A.J., 2008. Algal response to nutrient enrichment inforested oligotrophic stream. J. Phycol. 44, 564–572.
Villanueva, V.D., Font, J., Schwartz, T., Romani, A.M., 2011. Biofilmformation at warming temperature: acceleration of microbialcolonization andmicrobial interactive effects. Biofouling 27, 59–71.
Vincent, W.F., Downes, M.T., Castenholz, R.W., Howard-Williams,C., 1993. Community structure and pigment organization ofcyanobacteria-dominated microbial mats in Antarctica. Eur.J. Phycol. 28, 213–221.
Vrba, J., Komarkova, J., Vyhnalek, V., 1993. Enhanced activity ofalkaline phosphatases—phytoplankton response to epilimneticphosphorus depletion. Water Sci. Technol. 28, 15–24.
Vu, B., Chen, M., Crawford, R., Ivanova, E.P., 2009. Bacterialextracellular polysaccharides involved in biofilm formation.Molecules 14, 2535–2554.
Wang, Z.W., Liu, Y., Tay, J.H., 2005. Distribution of EPS and cellsurface hydrophobicity in aerobic granules. Appl. Microbiol.Biotechnol. 69, 469–473.
Wetzel, R.G., Ward, A.K., Stock, M., 1997. Effects of naturaldissolved organic matter on mucilaginous matrices of biofilmcommunities. Arch. Hydrobiol. 139, 289–299.
Whitton, B.A., Al-Shehri, A.M., Ellwood, N.T.W., Turner, B.L., 2005.Ecological aspects of phosphatase activity in cyanobacteria,eukaryotic algae and bryophytes. In: Turner, B.L., Frossard, E.,Baldwin, D.S. (Eds.), Organic Phosphorus in the Environment.CAB International, Wallingford, pp. 205–241.
Wu, Y.H., He, J.Z., Yang, L.Z., 2010. Evaluating adsorption andbiodegradation mechanisms during the removal ofmicrocystin-RR by periphyton. Environ. Sci. Technol. 44,6319–6324.
Xing, W., Fang, L.C., Cai, P., Huang, Q.Y., Chen, H., Liang, W., Rong,X.M., 2011. Influence of extracellular polymeric substances(EPS) on Cd adsorption by bacteria. Environ. Pollut. 159,1369–1374.
Yang, C.P., Chen, H., Zeng, G.M., Yu, G.L., Luo, S.L., 2010. Biomassaccumulation and control strategies in gas biofiltration.Biotechnol. Adv. 28, 531–540.
Yu, J.J., 2011. Characteristics of nitrogen fixation in microbial matsfrom the south Texas Gulf Coast and in a cyanobacterial strainisolated from Mats. Thesis for Doctor of Philosophy, theUniversity of Texas, Austin.
Zhang, T.X., Wang, X.R., Jin, X.C., 2007. Variations of alkalinephosphatase activity and P fractions in sediments of a shallowChinese eutrophic lake (Lake Taihu). Environ. Pollut. 150,288–294.
Zhang, Y., Cui, B.S., Wang, S.R., Chu, Z.S., Fan, X.Y., Hua, Y.Y., Lan,Y., 2012. Relation between enzyme activity of sediments andlake eutrophication in Grass-Type Lakes in North China. Clean:Soil, Air, Water 40, 1145–1153.
Zhang, X.F., Liu, Z.W., Gulati, R.D., Jeppesen, E., 2013. The effect ofbenthic algae on phosphorus exchange between sediment andoverlying water in shallow lakes: a microcosm study using 32Pas a tracer. Hydrobiologia 710, 109–116.
Zhang, W.B., Seminara, A., Suaris, M., Brenner, M.P., Weitz, D.A.,Angelini, T.E., 2014. Nutrient depletion in Bacillus subtilisbiofilms triggers matrix production. New J. Phys. 16, 15–28.
Zhou, Y.Y., Zhou, X.Y., 1997. Seasonal variation in kineticparameters of alkaline phosphatase activity in a shallowChinese freshwater lake (Donghu Lake). Water Res. 31,1232–1235.
Zhou, Y.Y., Li, J.Q., Zhang, M., 2001. Vertical variations in kineticsof alkaline phosphatase and P species in sediments of ashallow Chinese eutrophic lake. Hydrobiologia 450, 91–98.
Zippel, B., Rijstenbil, J., Neu, T.R., 2007. A flow-lane incubator forstudying freshwater and marine phototrophic biofilms.J. Microbiol. Methods 70, 336–345.
J O U R N A L O F E N V I R O N M E N T A L S C I E N C E S 4 2 ( 2 0 1 6 ) 3 2 – 4 0
Ava i l ab l e on l i ne a t www.sc i enced i r ec t . com
ScienceDirect
www. jou rna l s . e l sev i e r . com/ j es
Characteristics of the water-soluble components of aerosolparticles in Hefei, China
Xue-liang Deng1,⁎, Chun-e Shi1, Bi-wen Wu1, Yuan-jian Yang1, Qi Jin2, Hong-lei Wang3,Song Zhu4, Caixia Yu1
1. Anhui Institute of Meteorology, Key Laboratory of Atmospheric Science and Satellite Remote Sensing, Hefei 230031, China2. Anhui Weather Modification, Hefei 230031, China3. Key Laboratory for Aerosol-Cloud-Precipitation of China Meteorological Administration, Nanjing University of Information Science andTechnology, Nanjing 210044, China4. Hefei Meteorological Bureau, Hefei 230041, China
A R T I C L E I N F O
⁎ Corresponding author. E-mail: dengxueliang
http://dx.doi.org/10.1016/j.jes.2015.07.0101001-0742/© 2015 The Research Center for Ec
A B S T R A C T
Article history:Received 16 March 2015Revised 16 July 2015Accepted 20 July 2015Available online 26 September 2015
Size-classified daily aerosol mass concentrations and concentrations of water-solubleinorganic ions were measured in Hefei, China, in four representative months betweenSeptember 2012 and August 2013. An annual average mass concentration of 169.09 μg/m3
for total suspended particulate (TSP) was measured using an Andersen Mark-II cascadeimpactor. The seasonal average mass concentration was highest in winter (234.73 μg/m3)and lowest in summer (91.71 μg/m3). Water-soluble ions accounted for 59.49%, 32.90%,48.62% and 37.08% of the aerosol mass concentration in winter, spring, summer, and fall,respectively, which indicated that ionic species were the primary constituents of theatmospheric aerosols. The four most abundant ions were NO3
−, SO42−, Ca2+ and NH4
+. With theexception of Ca2+, the mass concentrations of water-soluble ions were in an intermediaterange compared with the levels for other Chinese cities. Sulfate, nitrate, and ammoniumwere the dominant fine-particle species, which were bimodally distributed in spring, summerand fall; however, the size distribution became unimodal in winter, with a peak at 1.1–2.1 μm.TheCa2+ peak occurred at approximately 4.7–5.8 μmin all seasons. The cation to anion ratiowasclose to 1.4, which suggested that the aerosol particles were alkalescent in Hefei. The averageNO3
−/SO42− mass ratio was 1.10 in Hefei, which indicated that mobile source emissions were
predominant. Significant positive correlation coefficients between the concentrations of NH4+
and SO42−, NH4
+ and NO3−, SO4
2− and NO3−, and Mg2+ and Ca2+ were also indicated, suggesting that
aerosol particles may be present as (NH4)2SO4, NH4HSO4, and NH4NO3.© 2015 The Research Center for Eco-Environmental Sciences, Chinese Academy of Sciences.
Published by Elsevier B.V.
Keywords:AerosolWater-soluble ionsHefeiSize distribution
Introduction
Aerosols, which comprise suspended particulate matter inair with diverse physical and chemical attributes, are amajor factor in global climatic fluctuations and air pollution.
[email protected] (Xue-li
o-Environmental Science
Aerosols can also have an impact on the climate through theabsorption and scattering of solar radiation (Penner et al.,1994), altering the radiation budget and affecting radiativeforcing (Alpert et al., 1998; Satheesh and Moorthy, 2005).In addition, aerosols change the size and density of cloud
ang Deng).
s, Chinese Academy of Sciences. Published by Elsevier B.V.

Fig. 1 – Map showing the location of the observation site inHefei City.
33J O U R N A L O F E N V I R O N M E N T A L S C I E N C E S 4 2 ( 2 0 1 6 ) 3 2 – 4 0
droplets, thus modifying cloud albedo and lifetime, and precip-itation (Twomey et al., 1984; Kaufman and Nakajima, 1993).Because of their role in light extinction, aerosol particles areresponsible for a reduction in visibility that can affect traffic(National Research Council, 1993). The exact effects of aerosolsdepend strongly on their size distribution, chemical composition,and mass concentration, which are related to the complexsources of aerosol, including local primary aerosols, secondaryaerosols and remote transport. Thus, detailed information onaerosol chemical and physical properties is important for aerosolstudies.
Atmospheric aerosols contain water-soluble inorganic com-pounds, organic carbon, elemental carbon and metals. Amongthese components, water-soluble components, such as sulfate,nitrate, ammonium, and chloride, are of great concern in theurban atmosphere because they control the degree of acidity ofthe aerosols and the impact on environmental acidification.Nitrate, sulfate, and ammonium are the primary compoundsthat define secondary aerosols (Kadowaki, 1976; Hara et al.,1983). To investigate the effect of air pollutants on the naturalenvironment and ecological systems, we must measure the drydeposition of particles and analyze their water-soluble compo-nents, which are related to the formation, growth and evolutionof aerosol particles (Wang et al., 2006a,2006b; Du et al., 2011).Many studies have focused on the characteristics of water-soluble components. Chemical species and the size distribu-tion of water-soluble ions in atmospheric aerosols have beeninvestigated in various countries, including Japan (Takeuchiet al., 2004), Egypt (Khoder and Hassan, 2008), Korea (Park etal., 2013) and Italy (Contini et al., 2014). In China, research onwater-soluble components of aerosol particles began in theearly 1990s (Wu and Chen, 1994; Wu et al., 1994; Wu, 1995).More recently, because of the deterioration of air quality inChina, the characteristics of water-soluble components ofthe atmospheric aerosols have been studied inmany Chinesecities (Wang et al., 2003, 2012, 2014a,2014b; Lai et al., 2007;Xiao and Liu, 2004; Hu et al., 2014; Fan et al., 2014; Cheng et al.,2014; Wu et al., 2006).
Hefei City, the capital of Anhui Province, is located in theupper reaches of the Yangtze Delta in China. The city has apopulation of 4.86 million and covers an area of 11,408 km2.Anhui Province is located in the transitional region betweenthe temperate and subtropical zones of China and is one ofthe most important agricultural provinces in the country. Therecent rapid increase in agricultural activity and urbanizationhas had a substantial impact on the atmospheric aerosol andair quality in Anhui, especially in Hefei. Many studies havefocused on Hefei City to determine the mechanisms influenc-ing the atmospheric aerosol concentrations. Previous studieshave indicated that the number of foggy days have decreased,although the duration of fog events has increased in Hefei (Shiet al., 2008; Wei et al., 2012). Furthermore, the extent of hazeand aerosol has expanded considerably in the last 10 years(Zhang et al., 2010; Deng et al., 2012), and the acidity of rainhas also increased in Hefei (Qiu et al., 2009). The chemicalcomposition of precipitation in Hefei was previously investi-gated from April to September in 2010; the major ions werefound to be SO4
2−, NH4+, and Ca2+ (Tang et al., 2012). Due to the
variety of sources, atmospheric aerosol particles are highlydynamic. However, little information is available with regard
to aerosol chemical characteristics and size distributions inHefei.
In this study, the aerosol size distributions and massconcentrations were examined. Additionally, the concentra-tions of water-soluble ions (NH4
+, Ca2+, Mg2+, Na+, K+, Cl−, NO3−,
SO42−, and NO2
−) were evaluated. A period of approximately1 week in each season was selected for aerosol samplingbetween September 2012 and August 2013. The objectives ofthis study were to characterize both the size distributions ofaerosols and the concentrations of water-soluble species inthe capital of Anhui Province in China.
1. Materials and methods
1.1. Sampling site
The sampling site was located on the roof of an office building ofthe Anhui Meteorological Bureau (31.87°N, 117.23°E, 82 m asl)(Fig. 1). The site was located 10 kmwest of the downtown area ofHefei City and was surrounded by residential areas (i.e., noindustry). An Andersen Mark-II cascade impactor (FA-3 model,Kangjie Company, China) was installed on the top-floor balconyof the Yunshui building (15 m agl). The observation period wasbetweenSeptember 2012 andAugust 2013. During this period,weselected a period of approximately 1 week for aerosol samplingin each season. A total of 38 samples were collected. Only 24samples were saved after a quality assurance review. The othersamples were discarded on the basis of the observation records,including the sampler condition, flow rate of the pump, and theappearance of the membrane. Sampling dates and weatherconditions, as provided by the Hefei Meteorological Bureau, arelisted in Table 1.
1.2. Sampling methods
The aerosol mass concentrations were measured using anAndersen Mark-II cascade impactor (FA-3 model, Kangjie

Table 1 – Sampling dates and weather conditions.
Number Date Weather phenomenon Mean visibility (km) Mean relative humidity (%)
1 Sep. 27, 2012 Mist, haze, 7.00 75.752 Oct. 10, 2012 Mist, haze 4.50 58.003 Oct. 18, 2012 Mist, haze 7.00 68.254 Oct. 19, 2013 Haze 8.50 55.755 Jan. 14, 2013 Fog, mist 1.03 97.506 Jan. 16, 2013 Mist 3.25 76.007 Jan. 17, 2013 Mist, haze 3.50 75.508 Jan. 18, 2013 Mist 8.50 70.259 Jan. 19, 2013 Mist, haze 6.50 66.7510 Apr. 09, 2013 Clear 12.00 29.2511 Apr. 10, 2013 Clear 12.25 40.0012 Apr. 11, 2013 Clear 13.00 41.7513 Apr. 12, 2013 Mist, haze 10.75 53.7514 Apr. 14, 2013 Clear 11.00 58.2515 Apr. 16, 2013 Clear 12.25 61.2516 Jun. 15, 2013 Mist, haze 6.75 82.5017 Jun. 16, 2013 Mist, haze 9.00 81.2518 Jul. 09, 2013 Clear 12.75 76.5019 Jul. 10, 2013 Clear 15.25 74.0020 Jul. 11, 2013 Clear 14.00 73.5021 Jul. 12, 2013 Clear 12.25 74.5022 Aug. 05, 2013 Clear 12.50 74.2523 Aug. 06, 2013 Clear 14.00 64.7524 Aug. 07, 2013 Clear 14.00 63.75
34 J O U R N A L O F E N V I R O N M E N T A L S C I E N C E S 4 2 ( 2 0 1 6 ) 3 2 – 4 0
company, China). The principles of operation for the instrumenthave been reported in the literature (Wang et al., 2010). TheAndersenMark-II cascade impactor collected aerosol particles innine size bins; the mass concentration of each level wasdetermined using Teflon membranes. The aerodynamic cutoffpoints at a flow rate of 28.3 L/min were as follows: ≥9.0, 9.0–5.8,5.8–4.7, 4.7–3.3, 3.3–2.1, 2.1–1.1, 1.1–0.65, 0.65–0.43, and ≤0.43 μm.The aerosols were continuously collected over a 24-hr periodfrom8:00 am to 8:00 am the following day. Themembraneswereweighedusing aMX-5microbalance (MX-5microbalance,MettlerToledo, Switzerland) following a constant temperature andhumidity treatment both before and after sampling. Themicrobalancewas calibrated using standardweights. Theweightdifference before and after samplingwas considered to representthe particleweight. Themembraneswere refrigerated and storedin the dark prior to analyzing the water-soluble ion contents ofthe particles.
1.3. Analytical methods for water-soluble ions
Water-soluble ions (Ca2+, Mg2+, Na+, K+, Cl−, NO3−, SO4
2−, NH4+, and
NO2−) were measured using a 850 ion chromatograph (850 ion
chromatograph, Metrohm, Switzerland). The chromatographincludes a column oven, a conductivity detector and an 858
Table 2 – Ion concentrations in total suspended particulate (TSP
Na+ NH4+ K+ Ca2+ Mg2+
Winter 1.17 21.35 1.92 15.79 1.00Spring 1.29 5.13 1.16 13.96 0.82Summer 1.09 4.36 0.77 11.31 0.56Fall 1.34 8.12 1.73 13.62 0.78Mean 1.22 9.74 1.40 13.67 0.79
auto-injector with a soft workstation employing MagIC Netsoftware (Metrohm, Switzerland). The columns included aMetrosep C 4 150/4.0 separation column and a Metrosep ASupp 5 150/4.0 separation column. The eluent was 3.2 mmol/LNa2CO3 + 1.0 mmol/L NaHCO3 for anions and 1.7 mmol/LHNO3 + 0.7 mmol/L pyridine carboxylic acid for cations. Thecolumn temperature was 30 °C, the flow rate was 1.0 mL/min,and the injection volume was 20 μL. Solution preparation anddilution used ultra-pure water with a resistivity of 18.2 MΩ.
2. Results and discussion
2.1. Ionic concentrations in total suspended particulate
The ion concentrations measured in the sampled aerosolparticles in Hefei are presented in Table 2. The annual averagetotal suspended particulate (TSP) mass concentration was169.09 μg/m3, and the seasonal average mass concentrationwas highest in winter (234.73 μg/m3) and lowest in summer(91.71 μg/m3). Water-soluble ions accounted for 45.41% of theaverage aerosol mass concentration, with seasonal values of59.49% (winter), 32.90% (spring), 48.62% (summer) and 37.08%
) during all four seasons in Hefei (unit: μg/m3).
Cl− NO2− NO3
− SO42− Aerosol mass
3.62 0.55 50.58 40.10 234.731.77 0.43 11.51 13.78 162.421.54 0.62 8.09 12.65 91.711.95 0.52 21.59 16.54 187.502.22 0.53 22.94 20.77 169.09

35J O U R N A L O F E N V I R O N M E N T A L S C I E N C E S 4 2 ( 2 0 1 6 ) 3 2 – 4 0
(fall). By contrast, the total water-soluble ions in PM10
contributed a mean mass fraction of 37.85% in the cities ofthe Pearl River Delta (Lai et al., 2007), 30% in Yokohama(Takeuchi et al., 2004), and 16.03% in Lanzhou (Fan et al., 2014).Therefore, the mass fraction of water-soluble ions in Hefeiwas substantially greater than in these other cities, becausewater-soluble ionic species are the primary constituents ofthe atmospheric aerosol particles in Hefei.
The mean concentrations of water-soluble ions decreasedin the following order: NO3
− > SO42− > Ca2+ > NH4
+ > Cl− > K+ >Na+ > Mg2+ > NO2
−. Our results confirmed that NO3−, SO4
2−, Ca2+,and NH4
+ were the major ionic species. The mean concentra-tions of NO3
−, SO42−, Ca2+, and NH4
+ were 22.94, 20.77, 13.67 and9.74 μg/m3, respectively, and the maximum contribution ofthese four ions to the total water-soluble ions was 87.40%. Themass concentrations of the other five ions (Na+, K+, Mg2+, Cl−,and NO2
−) were lower (each by approximately 1 μg/m3),accounting for only 12.60% of the total water-soluble ions.The seasonal variations in the ionic concentrations were alsonotable. The highest concentrations of all ions (except Na+
and NO2−) were recorded in winter, and the lowest concentra-
tions were recorded in summer (except Cl−).Nitrate and sulfate were the most important water-soluble
ions in the atmospheric aerosol particles sampled in Hefei.Nitrate ions exhibited the highest annual mean concentrationduring our study. The concentration was highest in winter,followed by fall and spring, while the lowest value occurred insummer, because relatively low temperatures and high NOx
concentrations are favorable for the formation of NO3− aerosol
(Park et al., 2005). The detected nitrate concentrations exceededthe sulfate concentrations in winter and fall in Hefei, whichmaybe related to anthropogenic emissions. Based on the AnhuiEnvironment Protection Bureau data, the NO2 concentrationwashigher than the SO2 concentration duringmost months in Hefei.Particulate-related nitrate is formed primarily by the oxidation ofnitrogen oxides (NOx) to nitric acid, which then forms particlesthrough reactions with sodium chloride or ammonia (Clase andGysels, 1998). In urban areas, NOx is derived primarily fromanthropogenic sources, such as vehicular and industrial emis-sions. The high concentrations of nitrate detected in each citysuggest that there was a large contribution of NOx from motorvehicle emissions.
The ionic species with the second highest annual meanconcentration during our study was sulfate. The sulfateconcentration was also higher in winter and lower in springand summer. Furthermore, the sulfate concentration washigher than the nitrate concentration in spring and summer,although it was lower than the nitrate concentration inwinter and fall. Anthropogenic emissions account for ap-proximately 75% of the total sulfur emissions in theNorthern Hemisphere (Seinfeld and Pandis, 1998). In urban
Table 3 – Ion concentrations in PM2.5 during all four seasons in
Na+ NH4+ K+ Ca2+ Mg2+
Winter 0.49 17.71 1.42 6.39 0.43 2Spring 0.48 4.25 0.69 4.28 0.23 0Summer 0.51 3.38 0.47 5.37 0.29 0Fall 0.45 5.95 1.23 4.93 0.25 0Mean 0.48 7.82 0.96 5.24 0.30 1
areas, most sulfate is formed via the oxidation of sulfurdioxide, which is produced primarily by fossil fuel combus-tion and some biogenic gases (Wang and Shooter, 2001). TheAnhui Environment Protection Bureau data indicated thatsulfate was one of the most abundant ionic species through-out the year. In Hefei, the SO2 concentration was higher inwinter, which may result in seasonal variations in sulfateloadings.
The ammonium concentration detected in Hefei washighest in winter, with an average of 21.35 μg/m3. Theseasonal ammonium concentrations exhibited the followingorder in Hefei: winter > autumn > spring > summer. Previouswork has suggested that ammonium is most likely related tothe use of fertilizers and local sanitary wastes (Zhang et al.,2002). The conversion of NH3 to NH4
+ depends on theconcentration of acids in the atmosphere, temperature andwater availability (Koerkamp et al., 1998; Kobara et al., 2007).In winter, the lower temperature and higher concentrations ofacid species, such as sulfate and nitrate, were favorable forgas-particle reactions. By contrast, the higher temperatures insummer were not favorable for the conversion from NH3 toNH4
+.The calcium concentration did not differ markedly among
the four seasons during our study. The concentration inwinter was slightly higher than in the other seasons. Calciumis found primarily in the coarse mode, making its concentra-tion a useful indicator of mineral dust (Yin et al., 2005). A greatdeal of city infrastructure has recently been constructed inHefei, which has produced large amounts of dust. Therefore,the primary source of calcium in Hefei is dust from buildingsites. Furthermore, dust emissions are constant throughoutthe year; thus, seasonal changes in calcium concentrationsare related primarily to weather conditions, e.g., rainfall andwind.
2.2. Ion concentrations in PM2.5
PM2.5 refers to aerosol particles with an aerodynamic diameterthat is equal to or less than 2.5 μm. These fine mode particlesinfluence visibility and human health and have been thefocus of many recent studies. Table 3 shows the concentra-tions of water-soluble ions in PM2.5 during the four seasons inHefei. The Andersen Mark-II cascade impactor used in thisstudy does not have a 2.5-μm size bin; thus, PM2.1 was used forthe analysis, although we refer to these values as PM2.5. Asshown in Table 3, the PM2.5 concentration accounted for51.03% of the TSP on average, indicating that the pollutionwas dominated by fine particles. The proportion of PM2.5 inTSP in Hefei was less than in Nanjing (63%–77%), Beijing (70%)and Huangshan (75%, in summer) (Wang et al., 2002; Sun etal., 2014; Wen et al., 2013). The water-soluble ion
Hefei (unit: μg/m3).
Cl− NO2− NO3
− SO42− PM2.5 PM2.5/TSP
.42 0.16 39.33 30.75 145.05 61.79%
.83 0.17 5.64 9.85 68.16 41.97%
.72 0.31 4.19 9.42 49.22 53.67%
.86 0.24 11.41 12.22 82.74 44.13%
.21 0.22 15.14 15.56 86.29 51.03%

Table 4 – Ion concentrations in PM2.5 in several Chinese cities (unit: μg/m3).
Sampling time SO4−2 NO3
− Cl− NH4+ Na+ Ca2+ Mg2+ K+ Remark
Hefei Sep. 2012–Nov. 2013 15.56 15.14 1.21 7.82 0.48 5.24 0.30 0.96 This studyShanghai 2003–2005 10.39 6.23 3.00 3.78 0.57 1.28 0.95 1.37 Wang et al., 2006bBeijing 2009–2010 19.10 20.50 2.90 6.40 0.50 1.50 0.20 1.70 Zhao et al., 2011Jinan Oct. 2007–Dec. 2008 38.30 15.80 4.20 21.30 1.20 0.80 0.10 2.40 Gao et al., 2011Mount Huang Jun. 2011–Aug. 2011 5.72 0.55 0.21 1.77 0.19 0.73 0.02 0.23 Wen et al., 2013
36 J O U R N A L O F E N V I R O N M E N T A L S C I E N C E S 4 2 ( 2 0 1 6 ) 3 2 – 4 0
concentrations in PM2.5 followed an order similar to TSP: SO42−
> NO3− > NH4
+ > Ca2+ > Cl− > K+ > Na+ > Mg2+ > NO2−. The major
ions were also SO42−, NO3
−, NH4+, and Ca2+. The mass concen-
tration of Ca2+ in PM2.5 was lower than in TSP, indicating thatCa2+ was primarily in coarse mode particles. In addition, theion with the highest concentration in our study was SO4
2−, and75% of the total SO4
2− was found in PM2.5. The fraction of NO3− in
PM2.5 was only 66%. The PM2.5 levels in Hefei were consis-tently higher in winter than in spring, summer and autumn.The peak concentrations for most of the water-soluble ions inPM2.5, including SO4
2−, NO3−, NH4
+, Ca2+, Cl−, K+, and Mg2+, wererecorded in winter. The minimum concentrations of SO4
2−,NO3
−, NH4+, Cl−, and K+ in PM2.5 were recorded in summer,
which may be related to local meteorological conditions.Similar variations were previously reported in Guiyang(Xiao & Liu, 2004).
The concentrations of the dominant water-soluble ionswere compared to those recently reported at various sitesin China (Table 4). Considering the rapid changes in Chineseemissions that have occurred, only results for the last 10 yearsare included. As shown in Table 4, the mean sulfate concentra-tion in Hefei was higher than in Shanghai (10.39 μg/m3) andMount Huang (5.72 μg/m3) and lower than in Beijing(19.10 μg/m3) and Jinan (38.30 μg/m3). Sulfate originatesprimarily from industrial emissions. However, Anhui Prov-ince is a large agricultural province, and the study site inHefei was located in a residential area with no influencesfrom industrial activities; thus, the observed sulfate concen-trations were low. In summer, the sulfate concentrations inHefei and Mount Huang were 9.42 and 5.72 μg/m3, respec-tively, which is indicative of widespread regional sulfatepollution. The order of nitrate concentrations was identicalto that of the sulfate concentrations. The nitrate concentra-tions in Hefei were the third highest among the five citieslisted in Table 4 and were comparatively high (15.14 μg/m3).The high nitrate concentrations in Hefei were due to the site'slocation near a roadway with heavy traffic and exposure toautomobile exhaust. The nitrate concentrations were closelylinked to the concentrations of nitrogen dioxide. Since 2006,nitrogen dioxide concentrations have noticeably increased ineast China (Shi et al., 2010), which explains the low nitrateconcentrations in Shanghai between 2003 and 2005. Gener-ally, soil is considered to be the primary source of Ca2+, Mg2+,and K+. The average Ca2+ concentrations in Hefei were thehighest among the assessed cities (Table 4), which waspossibly due to the large-scale construction of city infra-structure in Hefei. Several large construction sites are locatedwithin a 5-km radius around the sampling site, includingHefei Metro Line 2 and a residential community. Theseconstruction activities may have resulted in the observedhigh calcium concentrations. The concentrations of K+, Na+,
and Cl− in Hefei were relatively low compared to the othercities listed in Table 4 except for Mount Huang; theseions primarily originate from biomass combustion and seasalt. The ammonium concentrations in Hefei were onlyone-third those in Jinan, although they were higher than inthe other three cities. Generally, the mass concentrations ofwater-soluble ions detected in Hefei were moderate com-pared to the five sites and were less than in the moreeconomically developed area (Jinan).
2.3. Size distribution of water-soluble ions
The Andersen Mark-II cascade impactor has nine unevenaerosol particle size bins. Thus, the measured mass concen-tration of each level is not a precise determination of the aerosolsize distribution. To objectively analyze aerosol characteristics, adistribution function of themass concentration (q) is used (Konget al., 2010; Xu et al., 2012a):
q ¼ dCd lgDp
ð1Þ
where, dC is the observedmass concentration of each level, andd lg Dp is the logarithmic difference between themaximum andthe minimum aerosol diameter of each level. The mass medianaerodynamic diameters (MMADs), which represent the centraltendency, are used as metrics to compare the size distributiondata.
Fig. 2 shows the seasonal size distributions of water-solubleions in Hefei. Most of the inorganic species exhibited bimodaldistributions. The most important water-soluble ions, i.e., NH4
+,NO3
−, and SO42−, had similar sizes. These species were bimodally
distributed in spring, summer and fall, with one mode peakingat 0.43–0.65 μm and another peaking at 2.1–5.8 μm, which wassimilar to the size rangemeasuredat the Linan Station (Xuet al.,2012a). However, the threewater-soluble ions (i.e., NH4
+, NO3− and
SO42−) exhibited a single mode that peaked at about approxi-
mately 0.43–1.1 μm in Beijing (Xu et al., 2007). Inwinter, the sizedistributions were unimodal, peaking at 1.1–2.1 μm, possiblydue to high-humidity conditions, which was previously ob-served in Hong Kong (Zhuang et al., 1999). The mass concen-trations of sulfate, nitrate and ammoniumwere predominantlyin the fine mode, with low MMADs of 1, 1.32 and 0.95 μm,respectively. The mass concentrations in winter werenoticeably higher than in the other seasons, with the lowestconcentrations occurring in summer. The peak size range forcalciumwas approximately 4.7–5.8 μm, and the ratio of the finemode to coarse mode was high. The largest MMAD wasapproximately 3.31 μm, because calcium originated primarilyfrom the coarse-grained sand used in city construction. Konget al. (2010) and Geng et al. (2010) also obtained a similar size

0
1
2
3
0 1 2 3
∑A
nion
∑Cation
y = 1.05x-0.34r = 0.95
WinterSpringSummerFall
Fig. 3 – Equivalence between the concentrations of cations(ΣCation) and anions (ΣAnion) in the atmospheric aerosolmeasured in Hefei.
SO42-
0
10
20
30
40
50
60
0.1 1 10 100Particle diameter (µm) Particle diameter (µm) Particle diameter (µm)
Particle diameter (µm) Particle diameter (µm) Particle diameter (µm)
Particle diameter (µm) Particle diameter (µm) Particle diameter (µm)
Winter Spring Summer Fall
NH4+
0
5
10
15
20
25
30
0.1 1 10 100
NO3-
0
10
20
30
40
50
60
70
0.1 1 10 100
K+
0
1
2
3
0.1 1 10 100
dC/d
lgD
p (µg
/m3 )
dC/d
lgD
p (µg
/m3 )
dC/d
lgD
p (µg
/m3 )
dC/d
lgD
p (µg
/m3 )
dC/d
lgD
p (µg
/m3 )
dC/d
lgD
p (µg
/m3 )
dC/d
lgD
p (µg
/m3 )
dC/d
lgD
p (µg
/m3 )
dC/d
lgD
p (µg
/m3 )
Cl-
0
1
2
3
4
0.1 1 10 100
Ca2+
0
5
10
15
20
0.1 1 10 100
Mg2+
0
0.2
0.4
0.6
0.8
1.0
0.1 1 10 100
NO2-
0
0.2
0.4
0.6
0.8
1.0
0.1 1 10 100
Na+
0
1
2
3
0.1 1 10 100
Fig. 2 – Particle size distributions (dC/dlgDp) of the water-soluble ions in the atmospheric aerosol in the four seasons in Hefei.
37J O U R N A L O F E N V I R O N M E N T A L S C I E N C E S 4 2 ( 2 0 1 6 ) 3 2 – 4 0
distribution for calcium in Nanjin and Shanghai, respectively.Furthermore, the mass concentration of calcium in Hefei washigher in winter and spring. The mass concentrations of theother five ions in Hefei were lower than the mass concentra-tions of the four primary ions discussed above. The maximummass concentrations of chlorine (MMAD, 1.82 μm), sodium(MMAD, 3.12 μm), nitrite (MMAD, 2.82 μm), and magnesium(MMAD, 3.18 μm) ions were found to be in the coarse sizerange (4.7–5.8 μm), and similar size distributions were alsoobserved in Beijing (Huang et al., 2013). Their seasonal massconcentration changes were not substantial, with the excep-tion of chlorine. In winter, chlorine was observed in the finemode, together with sulfate and nitrate. However, the sizedistribution of potassium was similar to that of sulfate. Abimodal structure was apparent, with a larger fine modethan coarse mode. In winter, there was a unimodal size dis-tribution, with a peak at 0.43–2.1 μm, although the potassiumconcentration was low.
The size distributions of the water-soluble ions in winter,especially sulfate, nitrate, ammonium, and chloride, weredifferent from the size distributions for these ions in the otherseasons. The sampling day for winter (i.e., 14 January, 2013)was a foggy day with very high relative humidity, as shown inTable 1. The hygroscopic growth of water-soluble ions may bethe primary reason for their large sizes. For example, thediameter of ammonium sulfate under conditions of 80%relative humidity is twice the diameter under dry conditions.Therefore, the high relative humidity may have contributed tothe observed size distribution characteristics for the mea-sured water-soluble ions in winter.
2.4. Cation and anion balance
The equivalent concentrations of cations (ΣCation) and anions(ΣAnion) were calculated using the following equations:
XCation ¼ Naþ
� �
23þ NHþ
4� �
18þ Kþ� �
39þ
Mg2þh i
12þ
Ca2þh i
20ð2Þ
XAnion ¼ Cl−½ �
35:5þ NO−
2� �
46þ NO−
3� �
62þ
SO2−4
h i
48ð3Þ

38 J O U R N A L O F E N V I R O N M E N T A L S C I E N C E S 4 2 ( 2 0 1 6 ) 3 2 – 4 0
where, [Na+], [NH4+], [K+], [Mg2+], [Ca+], [Cl−], [NO2
−], [NO3−], and
[SO42−] denoted as the concentration of different ions.The correlations between the equivalent concentrations
of cations and anions are shown in Fig. 3. Good correlations(R = 0.95) between the cation and anion concentrations werefound, which suggested that the measured cations (Na+, NH4
+,K+, Mg2+, and Ca2+) and anions (Cl−, NO3
−, SO42−, and NO2
−)maintained a constant neutralization relationship during thefour seasons (Lai et al., 2007). The ratio of cations to anions is agood indicator of the acidity of aerosol particles. Based on themeasurements, this ratio was close to 1.4 (see Fig. 3). Becausemost of the knownmajor ions weremeasured, the anion deficitsare best explained by the presence of carbonate. The presence ofcarbonate implies that the aerosol particles are alkalescent.Similar results have also been reported for other Chinese cities,e.g., Shanghai (Geng et al., 2010) and Beijing (Cai et al., 2011).
2.5. Source identification using the NO3−/SO4
2− ratio
Nitrogen oxide emissions from mobile sources are an impor-tant contributor to particulate NO3
− in the atmosphere.Therefore, the NO3
−/SO42− mass ratio has been used as an
indicator of the relative importance of stationary vs. mobilesources of sulfur and nitrogen in the atmosphere (Xiao andLiu, 2004). Arimoto et al. (1996) ascribed a high NO3
−/SO42− mass
ratio to the predominance of mobile over stationary pollutantsources. In this study, the average NO3
−/SO42− mass ratio was
1.10 in Hefei. The averagemass ratio in Hefei was greater thanthe NO3
−/SO42− ratios determined for Tianjing (0.86; Zhao et al.,
2011), Shijiazhuang from 2009 to 2010 (0.80; Zhao et al., 2011),and Nanjing in 2008 (0.80; Xu et al., 2012b) and less than themass ratio reported in Beijing from 2009 to 2010 (1.13; Zhao etal., 2011). The high NO3
−/SO42− mass ratios in Hefei were likely
due to the high traffic density and the site location. Generally,the NO3
−/SO42− mass ratio was >1, suggesting that mobile
source emissions were dominant.The average NO3
−/SO42− mass ratios also exhibited seasonal
variations in Hefei; the ratios for the four seasons were 1.26(winter), 0.84 (spring), 0.64 (summer), and 1.31 (fall). The dataindicate that the mass ratios in summer were the lowest. Thehigh temperatures in summer lowered the stability ofNH4NO3, decreasing the rate of NO3
− formation. The NO3−/SO4
2−
mass ratios in the summer were lower than in the otherseasons. In winter and fall, the NO3
−/SO42− mass ratios were
Table 5 – Correlation coefficients among the ionic concentration
Na+ NH4+ K+ Ca2+
Na+ 1.00NH4
+ −0.01 1.00K+ 0.35 0.61 ⁎⁎ 1.00Ca2+ 0.08 0.32 0.34 1.00Mg2+ 0.15 0.47 ⁎ 0.54 ⁎⁎ 0.91 ⁎⁎⁎
Cl− 0.18 0.69 ⁎⁎⁎ 0.62 ⁎⁎ 0.53 ⁎
NO2− 0.03 0.18 0.09 −0.35
NO3− 0.03 0.95 ⁎⁎⁎ 0.65 ⁎⁎⁎ 0.47 ⁎
SO42− 0.06 0.95 ⁎⁎⁎ 0.53 ⁎ 0.31
⁎ Significant (p < 0.05).⁎⁎ Significant (p < 0.01).⁎⁎⁎ Significant (p < 0.001).
high, which may have been due to two factors. First, based onthe Anhui Environment Protection Bureau data, the NO2
concentrations were higher than the SO2 concentrations inwinter and fall in Hefei. Second, low temperatures canincrease the rate of NO3
− formation.
2.6. Correlations between ionic species
Calculating the inter-correlations between ions in aerosolsamples is a simple means of investigating their possiblesources and the associations between them in aerosolparticles. Correlation coefficients for the relationships be-tween the ionic concentrations in Hefei are presented inTable 5. Significant positive correlation coefficients werefound between NH4
+ and SO42− (0.95), NH4
+ and NO3− (0.95), SO4
2−
and NO3− (0.86), and Mg2+ and Ca2+ (0.91). As reported in Tang
et al. (2012), these ions also exhibit strong relationships withprecipitation in Hefei, with correlation coefficients of 0.77,0.75, 0.87, and 0.84 for NH4
+ and SO42−, NH4
+ and NO3−, SO4
2− andNO3
−, and Mg2+ and Ca2+, respectively.A significant positive correlation was found between SO4
2−
and NH4+ in Hefei (Table 5), which suggested neutralization by
ammonia gas. A strong positive correlation coefficient (0.95)for the relationship between SO4
2− and NH4+ indicated that SO4
2−
was present as (NH4)2SO4 and/or NH4HSO4. The linear fit to thedata can be described by SO4
2− = 0.75 NH4+ + 0.05 (μeq vs. μeq).
Because the equivalent ratios of SO42− to NH4
+ for (NH4)2SO4 andNH4HSO4 are 2 and 1, respectively, the slope of 0.75 indicatesthe incomplete neutralization of SO4
2− by NH4+, and NH4HSO4 is
the primary chemical form. There was also a strong correla-tion coefficient (0.95) for the relationship between NH4
+ andNO3
− in Hefei, which confirms the existence of NH4NO3 in thefine mode aerosol particles. NO3
− can react with Ca2+ and Mg2+
in the coarse mode.The strong correlation for the relationship between Mg2+
and Ca2+ suggests they have a common source. In the coarsemode, they may originate from soil particles. In addition tosoil, sea salt is also a source of Mg2+. Normally, the ratio ofMg2+/Na+ is approximately 0.12 in sea salt aerosol (Xu et al.,2012b), whereas the ratio was 0.64 in this study. Thus, thecontribution of the soil source to Mg2+ was larger than that ofsea salt in Hefei. Calcium generally originates from local soiland dust transported from the desert during storms. TheMg2+/Ca+ ratio is 0.17 in the desert region (Xu et al.,
s in Hefei.
Mg2+ Cl− NO2− NO3
− SO42−
1.000.63 ⁎⁎ 1.00
−0.31 −0.01 1.000.56 ⁎⁎ 0.79 ⁎⁎⁎ 0.06 1.000.44 ⁎ 0.52 ⁎ 0.17 0.86 ⁎⁎⁎ 1.00
39J O U R N A L O F E N V I R O N M E N T A L S C I E N C E S 4 2 ( 2 0 1 6 ) 3 2 – 4 0
2012a,2012b), whereas it was only 0.06 in Hefei, whichsuggests that Ca+ in Hefei is mainly generated from local soilsources.
3. Conclusions
This study determined size-classified daily aerosol massconcentrations of aerosol particles and concentrations ofwater-soluble inorganic ions (i.e., NH4
+, Ca2+, Mg2+, Na+, K+,Cl−, NO3
−, SO42−, and NO2
−) in Hefei, China, using an AndersenMark-II cascade impactor. The main conclusions were asfollows.
Water-soluble ions were the primary fraction of theatmospheric aerosols in Hefei, accounting for 59.49% (winter),32.90% (spring), 48.62% (summer) and 37.08% (fall) of the totalaerosol concentrations. The four most abundant water-solubleions were NO3
−, SO42−, Ca2+, and NH4
+, and the maximumcontribution of the four ions to the total concentrations in thewater-soluble ions was 87.40%. The seasonal variability in thewater-soluble ions was noteworthy. For most of the ions, theconcentrations were highest in winter and lowest in summer.ComparedwithotherChinese cities, thewater-soluble ionmassconcentrations in Hefei (except for Ca2+) were in the interme-diate range. The size distribution of water-soluble ions wasfound to depend on local sources, reaction conditions, andlong-range transport. In Hefei, sulfate, nitrate, and ammoniumwere the dominant fine-mode species, which were bimodallydistributed; however, inwinter, these species exhibitedunimodaldistributions. The calcium peak was in the coarse mode (4.7–5.8 μm) in all seasons. The ratio of cations to anions can be usedto indicate the acidity of aerosols; this ratio was found to be 1.4in Hefei, indicating that the aerosol particles were alkalescent.The NO3
−/SO42− ratio indicated that mobile sources had a
considerable contribution to the observed urban aerosol. Theaverage NO3
−/SO42− mass ratio was 1.10 (i.e., greater than 1) in
Hefei, which indicated that mobile source emissions weredominant. Significant positive correlation coefficients werealso confirmed between the concentrations of NH4
+ and SO42−,
NH4+ andNO3
−, SO42− andNO3
−, andMg2+ andCa2+,which indicatedthat aerosol particles may consist of (NH4)2SO4, NH4HSO4 andNH4NO3.
Acknowledgments
This work was supported by the Anhui Provincial NaturalScience Foundation (No. 1308085MD55) and the China SpecialFund for Meteorological Research in the Public Interest (Nos.GYHY201206011 and GYHY201406039). The authors would liketo acknowledge the Hefei Meteorological Bureau for providingthe meteorological data.
R E F E R E N C E S
Alpert, P., Kaufman, Y.J., Shay-El, Y., Tanre, D., da Silva, A.,Schubert, S., et al., 1998. Quantification of dust-forced heatingof the lower atmosphere. Nature 395 (6700), 367–370.
Arimoto, R., Duce, R.A., Savoie, D.L., Prospero, J.M., Talbot, R.,Cullen, J.D., et al., 1996. Relationships among aerosolconstituents from Asia and the North Pacific during PEM-WestA. J. Geophys. Res. 101 (D1), 2011–2023.
Cai, Y.Y., Yang, F.M., He, K.B., Ma, Y.L., Okuda, T., Tanaka, S., 2011.Characteristics of water-soluble ions in dry deposition inurban Beijing. China Environ. Sci. 31 (7), 1071–1076.
Cheng, H.R., Gong, W., Wang, Z.W., Zhang, F., Wang, X.M., Lv, X.P.,et al., 2014. Ionic composition of submicron particles (PM1.0)during the long-lasting haze period in January 2013 in Wuhan,central China. J. Environ. Sci. 26 (4), 810–817.
Clase, M., Gysels, K., 1998. IUPAC Series on Analytical and PhysicalChemistry of Environmental Systems. Wiley, New York,pp. 141–145.
Contini, D., Cesari, D., Genga, A., Siciliano, M., Ielpo, P., Guascito,M.R., et al., 2014. Source apportionment of size-segregatedatmospheric particles based on the major water-solublecomponents in Lecce (Italy). Sci. Total Environ. 472, 248–261.
Deng, X.L., Shi, C.E., Wu, B.W., Chen, Z.H., Nie, S.P., He, D.Y., et al.,2012. Analysis of aerosol characteristics and their relationshipswith meteorological parameters over Anhui province in China.Atmos. Res. 109–110, 52–63.
Du, H.H., Kong, L.D., Cheng, T.T., Chen, J.M., Du, J.F., Li, L., et al.,2011. Insights into summertime haze pollution events overShanghai based on online water-soluble ionic composition ofaerosols. Atmos. Environ. 45 (29), 5131–5137.
Fan, J., Yue, X.Y., Jing, Y., Chen, Q.,Wang, S.G., 2014. Onlinemonitoringof water-soluble ionic composition of PM10 during early summerover Lanzhou City. J. Environ. Sci. 26 (2), 353–361.
Gao, X.M., Yang, L.X., Cheng, S.H., Gao, R., Zhou, Y., Xue, L.K., et al.,2011. Semi-continuous measurement of water-soluble ions inPM2.5 in Jinan, China: Temporal variations and sourceapportionments. Atmos. Environ. 45 (33), 6048–6056.
Geng, Y.H., Liu, W., Shan, J., Yao, J., Fan, X.B., Wei, N.N., et al., 2010.Characterization of major water-soluble ions insize-fractionated particulate matters in Shanghai.China Environ. Sci. 30 (12), 1585–1589.
Hara, H., Honda, K., Nagara, K., Goto, A., 1983. Seasonal variationin particle-size distribution of chloride and nitrate in theambient air. Nippon Kagaku Kaishi 1983 (8), 1221–1225.
Hu, G.Y., Zhang, Y.M., Sun, J.Y., Zhang, L.M., Shen, X.J., Lin, W.L., etal., 2014. Variability, formation and acidity of water-solubleions in PM2.5 in Beijing based on the semi-continuousobservations. Atmos. Res. 145–146, 1–11.
Huang, Y.M., Liu, Z.R., Chen, H., Wang, Y.S., 2013. Characteristicsof mass size distributions of water-soluble inorganic ionsduring summer and winter haze days of Beijing. Environ. Sci.34 (4), 1236–1244.
Kadowaki, S., 1976. Size distribution of atmospheric total aerosols,sulfate, ammonium and nitrate particulates in the Nagoyaarea. Atmos. Environ. 10 (1), 39–43.
Kaufman, Y.J., Nakajima, T., 1993. Effect of Amazon smoke oncloud microphysics and albedo–analysis from satellite imagery.J. Appl. Meteorol. 32 (4), 729–744.
Khoder, M.I., Hassan, S.K., 2008. Weekday/weekend differences inambient aerosol level and chemical characteristics ofwater-soluble components in the city centre. Atmos. Environ.42 (32), 7483–7493.
Kobara, H., Takeuchi, K., Ibusuki, T., 2007. Effect of relativehumidity on aerosol generation through experiments at lowconcentrations of gaseous nitric acid and ammonia. AerosolAir Qual. Res. 7 (2), 193–204.
Koerkamp, P.W.G.G., Metz, J.H.M., Uenk, G.H., Phillips, V.R.,Holden, M.R., Sneath, R.W., et al., 1998. Concentrations andemissions of ammonia in livestock buildings in NorthernEurope. J. Agric. Eng. Res. 70 (1), 79–95.
Kong, C.X., Guo, S.L., Tang, L.L., 2010. Size distribution of watersoluble ions in aerosol and its variation with height in Nanjing.Trans. Atmos. Sci. 33 (6), 757–761.

40 J O U R N A L O F E N V I R O N M E N T A L S C I E N C E S 4 2 ( 2 0 1 6 ) 3 2 – 4 0
Lai, S.C., Zou, S.C., Cao, J.J., Lee, S.C., Ho, K.F., 2007. Characterizingionic species in PM2.5 and PM10 in four Pearl River Delta cities,South China. J. Environ. Sci. 19 (8), 939–947.
National Research Council, 1993. Protecting Visibility in NationalParks and Wilderness Areas. National Academy Press,Washington, DC.
Park, S.S., Sim, S.Y., Bae, M.S., Schauer, J.J., 2013. Size distributionof water-soluble components in particulate matter emittedfrom biomass burning. Atmos. Environ. 73, 62–72.
Park, S.S., Ondov, J.M., Harrison, D., Nair, N.P., 2005. Seasonal andshorter-term variations in particulate atmospheric nitrate inBaltmore. Atmos. Environ. 39 (11), 2011–2020.
Penner, J.E., Charlson, R.J., Laulainen, N.S., Leifer, R., Novakov, T.,Ogren, J., et al., 1994. Quantifying and minimizing uncertaintyof climate forcing by anthropogenic aerosols. Bull. Am.Meteorol. Soc. 75 (3), 375–400.
Qiu, M.Y., Shi, C.E., Zhang, H., Zhang, P., Zhou, S.X., 2009. Markedchanges of acid rain in Hefei and their causes. Acta Sci.Circumst. 29 (6), 1329–1338.
Satheesh, S.K., Moorthy, K.K., 2005. Radiative effects of naturalaerosols: a review. Atmos. Environ. 39 (11), 2089–2110.
Seinfeld, J.H., Pandis, S.N., 1998. Atmospheric Chemistry andPhysics: From Air Pollution to Climate Change. John Wiley &Sons, Inc., New York.
Shi, C.E., Roth, M., Zhang, H., Li, Z.H., 2008. Impacts of urbanizationon long-term fog variation in Anhui Province, China. Atmos.Environ. 42 (36), 8484–8492.
Shi, C.E., Qiu, M.Y., Zhang, A.M., Zhang, H., Zhang, S., Wang, Z.F.,2010. Spatiotemporal trends and the impact factors of acid rainin Anhui Province. Environ. Sci. 31 (6), 1676–1681.
Sun, K., Qu, Y., Wu, Q., Han, T.T., Gu, J.W., Zhao, J.J., et al., 2014.Chemical characteristics of size-resolved aerosols in winter inBeijing. J. Environ. Sci. 26 (8), 1641–1650.
Takeuchi, M., Okochi, H., Igawa, M., 2004. Characteristics ofwater-soluble components of atmospheric aerosols inYokohama and Mt. Oyama, Japan from 1990 to 2001. Atmos.Environ. 38 (28), 4701–4708.
Tang, R., Wang, T.J., Shi, C.E., Deng, X.L., Chen, R.L., 2012. Analysison the chemical composition of precipitation in Hefei.J. Meteorol. Sci. 32 (4), 459–465.
Twomey, S.A., Piepgrass, M., Wolfe, T.L., 1984. An assessment ofthe impact of pollution on the global albedo. Tellus B 36B (5),356–366.
Wang, G.H., Huang, L.M., Gao, S.X., Gao, S.T., Wang, L.S., 2002.Characterization of water-soluble species of PM10 and PM2.5
aerosols in urban area in Nanjing, China. Atmos. Environ. 36(8), 1299–1307.
Wang, G.H., Wang, H., Yu, Y.J., Gao, S.X., Feng, J.F., Gao, S.T., et al.,2003. Chemical characterization of water-soluble componentsof PM10 and PM2.5 atmospheric aerosols in five locations ofNanjing, China. Atmos. Environ. 37 (21), 2893–2902.
Wang, H.B., Shooter, D., 2001. Water soluble ions of atmosphericaerosols in three New Zealand cities: seasonal changes andsources. Atmos. Environ. 35 (34), 6031–6040.
Wang, H.L., Zhu, B., Ma, L.C., Chen, S., Chen, C., Wang, P., 2010.Analysis of aerosol pollution characteristics in summer invarious functional areas of Nanjing. J. Nanjing Univ. Inf. Sci.Technol. (Nat. Sci. Ed.) 2 (3), 221–229.
Wang, H.L., Zhu, B., Shen, L.J., Kang, H.Q., 2012. Size distributionsof aerosol and water-soluble ions in Nanjing during a cropresidual burning event. J. Environ. Sci. 24 (8), 1457–1465.
Wang, H.L., An, J.L., Shen, L.J., Zhu, B., Pan, C., Liu, Z.R., et al.,2014a. Mechanism for the formation and microphysicalcharacteristics of submicron aerosol during heavy haze
pollution episode in the Yangtze River Delta, China. Sci. TotalEnviron. 490, 501–508.
Wang, Y., Zhuang, G.S., Sun, Y.L., An, Z.S., 2006a. The variation ofcharacteristics and formation mechanisms of aerosols in dust,haze, and clear days in Beijing. Atmos. Environ. 40 (34),6579–6591.
Wang, Y., Zhuang, G.S., Zhang, X.Y., Huang, K., Xu, C., Tang, A.H.,et al., 2006b. The ion chemistry, seasonal cycle, and sources ofPM2.5 and TSP aerosol in Shanghai. Atmos. Environ. 40 (16),2935–2952.
Wang, Y.S., Yao, L., Wang, L.L., Liu, Z.R., Ji, D.S., Tang, G.Q., et al.,2014b. Mechanism for the formation of the January 2013 heavyhaze pollution episode over central and eastern China. Sci.China Earth Sci. 57 (1), 14–25.
Wei, W.H., Wang, T.J., Shi, C.E., Zhang, H., 2012. Analysis ofweather conditions for fog in Hefei. J. Meteorol. Sci. 32 (4),437–442.
Wen, B., Yin, Y., Qing, Y.S., Chen, K., 2013. Chemical characteristicsof water-soluble components of aerosol particles at differentaltitudes of theMount Huang in the summer. Environ. Sci. 34 (5),1973–1981.
Wu, D., 1995. The distribution characteristics of water-solublecomposition of atmospheric aerosol over north of the SouthChina Sea. Sci. Atmos. Sin. 19 (5), 615–622.
Wu, D., Chen, W.C., 1994. Intra-annual variation features of massdistribution and water soluble composition distribution ofatmospheric aerosol over Guangzhou. Acta Meteorol. Sin. 52 (4),499–505.
Wu, D., Chen, W.C., Chang, Y.D., Xiang, P.Y., Mao, J.T., Qin, Y.,1994. A primary study of the size-distribution and watersoluble composition distribution of atmospheric aerosols overSouth China. J. Trop. Meteorol. 10 (1), 85–96.
Wu, D., Tie, X.X., Deng, X.J., 2006. Chemical characterizations ofsoluble aerosols in southern China. Chemosphere 64 (5), 749–757.
Xiao, H.Y., Liu, C.Q., 2004. Chemical characteristics ofwater-soluble components in TSP over Guiyang, SW China,2003. Atmos. Environ. 38 (37), 6297–6306.
Xu, H.H., Liu, J., Wang, Y.S., Mao, M.J., Pu, J.J., 2012a. Variationpattern of water-soluble ions in atmospheric at Lin'an regionalbackground station. Environ. Chem. 31 (6), 796–802.
Xu, H.H., Wang, Y.S., Wen, T.X., He, X.X., 2007. Size distributionsand vertical distributions of water soluble ions of atmosphericaerosol in Beijing. Environ. Sci. 28 (1), 14–19.
Xu, M.J., Wang, Y.H., Tang, L.L., Zhang, X.Z., Tang, L., Li, X.W., etal., 2012b. Study on characteristics of water-soluble ions inPM10 in autumn in Nanjing. Environ. Eng. 30 (5), 108–113.
Yin, J., Allen, A.G., Harrison, R.M., Jennings, S.G., Wright, E.,Fitzpatrick, M., et al., 2005. Major component composition ofurban PM10 and PM2.5 in Ireland. Atmos. Res. 78 (3-4), 149–165.
Zhang, X.Y., Cao, J.J., Li, L.M., Arimoto, R., Cheng, Y., Huebert, B., etal., 2002. Characterization of atmospheric aerosol over Xi'an inthe south margin of the Loess Plateau, China. Atmos. Environ.36 (26), 4189–4199.
Zhuang, H., Chan, C.K., Fang, M., Wexler, A.S., 1999. Sizedistributions of particulate sulfate, nitrate, and ammonium ata coastal site in Hong Kong. Atmos. Environ. 33 (6), 843–853.
Zhang, H., Shi, C.E., Qiu, M.Y., Xie, W., 2010. Long-term variation ofhaze phenomena in Hefei and its impact factors. Acta Sci.Circumst. 30 (4), 714–721.
Zhao, P.S., Zhang, X.L., Meng, W., Yang, B.Y., Fan, W.Y., Liu, H.Y.,2011. Characteristics of inorganic water-soluble ions fromaerosols in Beijing–Tianjin–Hebei area. Environ. Sci. 32 (6),1546–1549.

J O U R N A L O F E N V I R O N M E N T A L S C I E N C E S 4 2 ( 2 0 1 6 ) 4 1 – 4 9
Ava i l ab l e on l i ne a t www.sc i enced i r ec t . com
ScienceDirect
www. jou rna l s . e l sev i e r . com/ j es
Differences in nitrite-oxidizing communities and kinetics in abrackish environment after enrichment at low and highnitrite concentrations
Wipasanee Tangkitjawisut1, Tawan Limpiyakorn1,2, Sorawit Powtongsook3,4,Preeyaporn Pornkulwat1, Benjaporn Boonchayaanant Suwannasilp1,2,⁎
1. Department of Environmental Engineering, Faculty of Engineering, Chulalongkorn University, Bangkok 10330, Thailand2. Center of Excellence on Hazardous Substance Management (HSM), Chulalongkorn University, Bangkok 10330, Thailand3. Center of Excellence for Marine Biotechnology, Department of Marine Science, Faculty of Science, Chulalongkorn University, Bangkok 10330,Thailand4. National Center for Genetic Engineering and Biotechnology, National Science and Technology Development Agency, Pathum Thani 12120,Thailand
A R T I C L E I N F O
⁎ Corresponding author. E-mail: benjaporn.bo
http://dx.doi.org/10.1016/j.jes.2015.07.0141001-0742/© 2015 The Research Center for Ec
A B S T R A C T
Article history:Received 17 March 2015Revised 17 July 2015Accepted 5 August 2015Available online 29 October 2015
Nitrite accumulation in shrimp ponds can pose serious adverse effects to shrimpproduction and the environment. This study aims to develop an effective process for theenrichment of ready-to-use nitrite-oxidizing bacteria (NOB) inocula that would beappropriate for nitrite removal in brackish shrimp ponds. To achieve this objective, theeffects of nitrite concentrations on NOB communities and nitrite oxidation kinetics in abrackish environment were investigated. Moving-bed biofilm sequencing batch reactorsand continuous moving-bed biofilm reactors were used for the enrichment of NOB atvarious nitrite concentrations, using sediment from brackish shrimp ponds as seedinoculum. The results from NOB population analysis with quantitative polymerasechain reaction (qPCR) show that only Nitrospira were detected in the sediment from theshrimp ponds. After the enrichment, both Nitrospira and Nitrobacter coexisted in thereactors controlling effluent nitrite at 0.1 and 0.5 mg-NO2
−-N/L. On the other hand, in thereactors controlling effluent nitrite at 3, 20, and 100 mg-NO2
−-N/L, Nitrobacter outcompetedNitrospira in many orders of magnitude. The half saturation coefficients (Ks) for nitriteoxidation of the enrichments at low nitrite concentrations (0.1 and 0.5 mg-NO2
−-N/L) were inthe range of 0.71–0.98 mg-NO2
−-N/L. In contrast, the Ks values of NOB enriched at high nitriteconcentrations (3, 20, and 100 mg-NO2
−-N/L) were much higher (8.36–12.20 mg-NO2−-N/L). The
results suggest that the selection of nitrite concentrations for the enrichment of NOB inoculacan significantly influence NOB populations and kinetics, which could affect the effectivenessof their applications in brackish shrimp ponds.© 2015 The Research Center for Eco-Environmental Sciences, Chinese Academy of Sciences.
Published by Elsevier B.V.
Keywords:Nitrite-oxidizing bacteria (NOB)NitrospiraNitrobacterKineticsBrackish waterShrimp ponds
@chula.ac.th (Benjaporn Boonchayaanant Suwannasilp).
o-Environmental Sciences, Chinese Academy of Sciences. Published by Elsevier B.V.
42 J O U R N A L O F E N V I R O N M E N T A L S C I E N C E S 4 2 ( 2 0 1 6 ) 4 1 – 4 9
Introduction
Nitrite accumulation is usually a concern in shrimp ponds thatlack sediment, as sediment is the major source of nitrifyingmicroorganisms, including nitrite-oxidizing bacteria (NOB). Theaccumulation of nitrite greater than 1 mg/L-N in shrimp pondscan cause serious adverse effects on aquaculture (Hart andO'Sullivan, 1993). Therefore, the development of techniques forcontrolling nitrite concentrations in shrimp ponds is essential.Bioaugmentation with NOB inocula is considered an attractiveapproach for resolving intermittent nitrite accumulation inshrimp ponds. Bioaugmentation for nitrification has previouslybeen demonstrated in activated sludge systems (Yu et al., 2012;Leu and Stenstrom, 2010; Parker and Wanner, 2007). Theapproach has great potential to be further developed andapplied in aquaculture.
NOB are groups of microorganisms that are capable ofconverting nitrite into nitrate, which can be applied to resolvenitrite accumulation in shrimp ponds. Nitrobacter, Nitrospira,and Nitrotoga are the three main genera of NOB commonlyobserved in nitrification systems. These groups of NOB usuallythrive under different environmental conditions (Daims et al.,2001). Studies have shown that physicochemical and opera-tional parameters, such as nitrite concentrations, dissolvedoxygen (DO) concentrations, temperature, and salinity affectedNOB populations (Daims et al., 2001; Huang et al., 2010; Moussaet al., 2006). In the past, Nitrobacter was believed to be the keyNOB in wastewater treatment plants (Grady and Lim, 1988).However, Nitrobacter-related organisms were not detected innitrifying activated sludge samples by fluorescence in situhybridization (FISH) (Wagner et al., 1996). In addition, NOBcommunities in a nitrifying bioreactor were investigated usingFISH, and the results revealed that Nitrospira spp. were theresponsible NOB in nitrification systems (Schramm et al., 1999).Moreover, a recent study found thatNitrotoga-like bacteria werekey nitrite oxidizers in full-scale wastewater treatment plants(Lücker et al., 2015). Nevertheless, until now, the occurrenceand importance of Nitrotoga in brackish systems have not yetbeen reported. Therefore, Nitrobacter and Nitrospira are stillconsidered to be the two main genera of NOB commonlyobserved in brackish environments.
With the kinetic characteristics of NOB, it has beensuggested that Nitrospira are K-strategists that can adapt tolow nitrite concentrations, while Nitrobacter are r-strategiststhat thrive when nitrite is at high concentrations (Daims et al.,2001; Schramm et al., 1999). Nitrospira generally have highernitrite affinities (lower KS values) compared to Nitrobacter(Nowka et al., 2015). Many studies have also supported the K/rhypothesis. For examples, Kim and Kim (2006) reported that thedistribution of Nitrobacter and Nitrospira depended on nitriteconcentrations. Nogueira and Melo (2006) studied the competi-tion between Nitrospira and Nitrobacter in nitrite-oxidizingbioreactors. The dominance of Nitrobacter over Nitrospira ap-peared to be caused by the elevated nitrite concentrations inbioreactors, which confirmed the K/r hypothesis (Nogueira andMelo, 2006). These previous findings suggest that nitriteconcentrations can significantly influence NOB communities.Therefore, the selection of nitrite concentrations to enrich NOBinocula is crucial since it can lead to different NOB communities
and kinetics, which could affect their applications in brackishshrimp ponds.
In general, nitrite concentrations in shrimp ponds are in therange of 0.02–0.17 mg-NO2
−-N/L, in which only Nitrospira spp.were observed (Srithep et al., 2015). However, higher nitriteconcentrations are usually used for the enrichment of NOBinocula for applications in shrimp ponds. The differences innitrite concentrations used for the enrichment could result indifferent nitrite-oxidizing bacterial communities and kinetics.The effects of nitrite concentrations on NOB communities andkinetics remain unclear, especially in brackish environments.Such information would be useful for the development of NOBinocula appropriate for nitrite removal in aquaculture ponds.The objective of this study is to investigate the effects of nitriteconcentrations on microbial communities and the kinetics ofNOB enrichments. The approach for NOB enrichment in thisstudy can also be further applied to develop NOB inoculasuitable for aquaculture ponds.
1. Material and methods
1.1. Moving-bed biofilm sequencing batch reactors
Sediment from two outdoor brackish shrimp ponds inChachengsao, Thailand, was collected and mixed to use asseed inoculum for the enrichment of NOB on biofilm carriers(2H-BCN 012 KLL, Kunststoff GmbH, Germany) in two moving-bed biofilm sequencing batch reactors (50 L). The biofilm carriers(Appendix A Fig. S1) had specific surface area of 859 m2/m3, aprotected area of 704 m2/m3, and a weight of 150 ca. kg/m3. Thefirst (Reactor A) and second (Reactor B) moving‐bed biofilmsequencing batch reactors were fed intermittently with nitrite ata low concentration (1 mg-NO2
−-N/L) and at a high concentration(50 mg-NO2
−-N/L), respectively. The NOB enrichment in thesemoving-bed biofilm sequencing batch reactors was aimed toincrease the amount of NOB populations at low and high nitriteconcentrations for further NOB enrichment in continuous-flowmoving-bed biofilm reactors.
The synthetic wastewater used in this experimentconsisted of NaNO2 (1 or 50 mg/L NO2
−-N), 0.2 g/L of KH2PO4,0.4 g/L of MgSO4·7H2O, 0.1 g/L of KBr, 200 g/L of NaHCO3,35.8 g/L of Marinium™ reef sea salt (Mariscience, USA), 1 mL/Lof nonchelated trace element mixture, 1 mL/L of vitaminmixture, 1 mL/L of vitamin B12 solution, 1 mL/L of vitamin B1solution, 1 mL/L of selenite-tungstate solution (modified fromKönneke et al. (2005)). The nonchelated trace element mixture,vitaminmixture, vitamin B12 solution, vitamin B1 solution, andselenite-tungstate solution were prepared according to Widdeland Bak (1992). The reactors were operated for 90 days at roomtemperature (28 ± 3°C). Both reactorswere operatedwithin a pHrange of 7.5–8.5 and an alkalinity range of 120–150 mg-CaCO3/L.DO was controlled to be greater than 4 mg-O2/L throughout theoperation. The salinity of the medium was 15 ppt. The nitriteand nitrate concentrations in both reactors were monitored.
1.2. Continuous-flow moving-bed biofilm reactors
The biofilm carriers that were enriched in Reactor A were thentransferred to 2 aerobic continuous-flow moving-bed biofilm

43J O U R N A L O F E N V I R O N M E N T A L S C I E N C E S 4 2 ( 2 0 1 6 ) 4 1 – 4 9
reactors (10 L), Reactor A0.1 and Reactor A0.5. On the otherhand, the biofilm carriers enriched in Reactor B weretransferred to 3 aerobic continuous-flow moving-bed biofilmreactors (10 L), Reactor B3, Reactor B20, and Reactor B100. Thebiofilm carriers with the total volume of 5 L were placed ineach reactor. The nitrite concentrations in the reactors werecontrolled to be 0.1 mg-NO2
−-N/L (Reactor A0.1), 0.5 mg-NO2−-N/L
(Reactor A0.5), 3 mg-NO2−-N/L (Reactor B3), 20 mg-NO2
−-N/L(Reactor B20), and 100 mg-NO2
−-N/L (Reactor B100), respectively.The flow rate and influent concentration of the nitrite wereadjusted to achieve aforementioned nitrite concentrations inthe reactors. The flow rates of Reactor A0.1, Reactor A0.5,Reactor B20, and Reactor B100 were 2.88 L/day, 8.40 L/day,3.80 L/day, and 6.00 L/day, respectively. In Reactor B3, the initialflow rate was 1.63 L/day. It was then increased to 1.74 L/day,1.86 L/day, and 1.97 L/day on day 8, 16, and 42 of operation,respectively. The hydraulic retention time, determined by thetotal volume of the reactor divided by the flow rate (V/Q), ofReactor A0.1, Reactor A0.5, Reactor B20, and Reactor B100 was3.47 days, 1.19 days, 2.63 days, and 1.67 days, respectively. ForReactor B3, the initial hydraulic retention time was 6.13 day. Itthen decreased to 5.75 days, 5.38 days, and 5.08 days onday 8, 16, and 42 of operation, respectively. The nitriteloading of each reactor (mg-N/day) is shown in AppendixA Fig. S2. The synthetic wastewater composition used inthis study was identical to that used in the moving-bedbiofilm sequencing batch reactors except that the nitriteconcentrations were different. The nitrite and nitrate concen-trations in the influent and effluent of the five reactors weremonitored over time.
1.3. Nitrite-oxidizing bacterial population analysis
Deoxyribonucleic acid (DNA) from 0.5 g of sediment fromshrimp ponds was extracted using a FastDNA® SPIN Kitfor Soil (Qbiogene, USA). Then, humic acids were removedfrom the extracted DNA using G-50 Mini Column (Geneaid,Taiwan). Duplicates of the extracted DNA were combinedand used for further molecular analysis (Srithep et al.,2015). For the bioreactor samples, biomass was washedfrom the biofilm carriers using deionized water then centri-fuged and collected in Eppendorf tubes to obtain 2 mg ofmixed liquor suspended solids (MLSS) per tube. DNA wasthen extracted using a FastDNA® SPIN Kit for Soil (Qbiogene,U.S.).
Quantitative polymerase chain reaction (qPCR) (qPCR,Thermo Scientific, USA) was used with Maxima SYBR Green/ROX qPCR Master Mix (Thermo Scientific, USA) for nitrite-oxidizing bacterial population analysis. Primers P338f andNIT3 were used to amplify the partial 16S ribosomalribonucleic acid (rRNA) gene of Nitrobacter; while NSR1113fand NSR1264r were used to amplify the partial 16S rRNAgene ofNitrospira (Table 1) (Reganet al., 2002; Dionisi et al., 2002).The qPCR conditions for the 16S rRNA genes of Nitrobacter andNitrospira are summarized in Table 1. The plasmid inserts of theclones derived from the samples collected from Reactor B100and Reactor A0.1 were used as standards for the partial 16SrRNA genes of Nitrobacter and Nitrospira, respectively. For allsamples, qPCR was run at 1-, 10-, and 100-fold dilutions withduplicates.
1.4. Nitrite-oxidizing bacterial community analysis
To further investigate the microbial communities ofNitrobacter and Nitrospira, clonal libraries of the partial 16SrRNA genes of Nitrobacter and Nitrospira were constructed incertain samples. A clonal library of partial 16S rRNA genes ofNitrobacter was constructed for the biomass from the biofilmcarriers in Reactor A0.5, B3, and B100 whereas a clonal libraryof partial 16S rRNA genes of Nitrospira was constructed for thebiomass from the biofilm carriers in Reactor A0.1, B3, B100,and the shrimp pond sediment. The DNA extraction wasdescribed in the nitrite-oxidizing bacterial population analy-sis. The primers used for PCR are summarized in Table 1(Regan et al., 2002; Dionisi et al., 2002). PCRs were run in athermocycler (Takara, Japan) with Taq DNA polymerase(Takara, Japan). The PCR conditions used are summarized inTable 1. Clonal libraries were then constructed using a pGem-TEasy vector system I kit (Promega, USA) and XL1-Blue compe-tent cells (Stratagene, USA). From each clonal library, 6 to 15clones were randomly selected for sequencing (Macrogen Inc.,Korea). A total of 35 and 51 cloneswere sequenced forNitrobacterand Nitrospira, respectively. The sequences were calculated foran arrangement of operational taxonomic units (OTUs), basedon 99% OTU identities using the DOTUR program (Schloss andHandelsman, 2005). Any sequences obtained from the sameclonal library showing 99% similarity were defined as one OTU.The representative sequences and reference sequences werealigned and phylogenetically analyzed using the ARB programpackage (version 2.0; Department of Microbiology, TechnischeUniversitat Munchen [http://www.arb-home.de]). Phylogenetictrees were constructed by adding our analyzed sequences intodistance trees, which were previously constructed based on acomparison of >1200-bp sequences of reference Nitrobacter orNitrospira.
1.5. Nitrite oxidation kinetics
The nitrite oxidation kinetics of intact biofilms obtained fromReactors A0.1, A0.5, B3, B20, and B100 were investigated in aseries of batch reactors (1 L). To examine the kinetics, the biofilmcarriers were directly transferred from the continuous-flowmoving-bed biofilm reactors into batch reactors. The biofilmcarriers fromReactorsA0.1, A0.5, B3, B20, andB100were collectedfor the kinetic tests on day 63, 72, 85, 25, and 35, respectively. Forthe biofilm carriers from each reactor, nitrite oxidation wastested at 8 initial concentrations. All nitrite oxidation testswere conducted in duplicates. The DO concentrations werein the range of 5–6 mg-O2/L. The nitrite concentrations inthe bulk liquid phase were measured over time. The initialrates of nitrite oxidation were then calculated with respectto mixed liquor volatile suspended solids (MLVSS). Plots ofnitrite oxidation rates (mg-NO2
−-N/mg MLVSS · hr) versusinitial nitrite concentrations were then constructed. The halfsaturation coefficients (Ks) andmaximumspecific rates (qmax) ofnitrite oxidation were estimated based on the Monod equationas described in Eq. (1) using SigmaPlot software (Systat SoftwareInc., USA).
q ¼ qmaxSKs þ S
ð1Þ

Tab
le1–Pr
imersforth
e16
SrR
NA
genes
ofNitroba
cter
andNitrosp
iraan
dPC
R/qP
CRco
ndition
suse
din
this
study
.
Targe
tge
ne
Prim
erNuc
leotidese
quen
ceReferen
cePC
Rco
ndition
sqP
CRco
ndition
s
16SrR
NA
genes
ofNitr
obacter
P338
fACTCCTACGGGAGGCAGCAG
Reg
anet
al.(20
02)
Initiald
enaturation
5min
95°C
Initiald
enaturation
5min
95°C
DNA
denaturation
1.5min
95°C
g30cyc
les
DNA
denaturation
1.5min
95°C
g40cyc
les
Prim
eran
nea
ling0.5min
65°C
Prim
eran
nea
ling0.5min
65°C
NIT3
CCTGTGCTCCATGCTCCG
DNA
extension
1min
72°C
DNA
extension
1min
72°C
Final
extension
6min
72°C
Withda
taca
pturedforea
chcy
cleat
80°C
for15
sec
16SrR
NA
genes
ofNitr
ospira
NSR
1113
fCCTGCTTTCAGTTGCTACCG
Dionisie
tal.(20
02)
Initiald
enaturation
10min
95°C
DNA
denaturation
0.5min
95°C
Prim
eran
nea
ling0.5min
60°C
DNA
extension
1min
72°C
Final
extension
6min
72°C
Initiald
enaturation
10min
95°C
DNA
denaturation
0.5min
94°C
Prim
eran
nea
ling0.5min
60°C
DNA
extension
0.5min
72°C
withda
taca
pturedforea
chcy
cle
at78
°Cfor15
sec
NSR
1264
rGTTTGCAGCGCTTTGTACCG
g30cyc
les
g40cyc
les
44 J O U R N A L O F E N V I R O N M E N T A L S C I E N C E S 4 2 ( 2 0 1 6 ) 4 1 – 4 9
where, q (mg-NO2−-N/mg MLVSS · hr) is specific rate of nitrite
oxidation, qmax (mg-NO2−-N/mg MLVSS · hr) is the maximum
specific rates of nitrite oxidation, S (mg-NO2−-N/L) is nitrite
concentration, and Ks (mg-NO2−-N/L) is the half saturation
coefficient.
1.6. Analytical measurements
Nitrite and nitrate were analyzed using the colorimetricmethod according to the standard methods (APHA et al., 2005).The concentrations of DO in the reactors were measured usinga DO meter (Eutech model DO110). Salinity was measuredusing a salinity meter (Atago model S/Mill-E), and pHwas monitored using a portable pH meter (Mettler-ToledoSevenGo, Schwerzenbach, Switzerland). Alkalinity was mea-sured using alkalinity test kits (AQUA-VBC). Biomass sampleswere collected from the biofilm carriers via washing bydeionized water and sonication at 40 kHz/200 W for 10 min(MS-4010, Y J TechUltrasonic Co., Ltd., Thailand), then theMLSSand MLVSS of biomass were measured using the gravimetricmethod (APHA et al., 2005). The reported MLSS and MLVSSaccounted for both the suspended solids coming out from thewashing process and from the sonication.
2. Results and discussion
2.1. Moving-bed biofilm sequencing batch reactors
Reactor A and Reactor B were operated for 90 days with inter-mittent feeding of nitrite at low and high nitrite concentrations,respectively. In Reactor A, the nitrite was intermittently fed at1 mg-NO2
−-N/L. The average nitrite concentration in Reactor Awas 0.54 mg-NO2
−-N/L. In Reactor B, the nitrite was intermittentlyfed at 50 mg-NO2
−-N/L, resulting in an average nitrite concentra-tion of 25.76 mg-NO2
−-N/L during the operation period. In bothreactors, nitrite was completely oxidized to nitrate. The DO, pH,alkalinity and salinity were maintained at 4–7 mg-O2/L, 7–8.5,120 mg-CaCO3/L, and 10–20 ppt, respectively.
2.2. Continuous-flow moving-bed biofilm reactors
The biofilm carriers enriched in Reactor A and Reactor B werethen used in Reactors A0.1, A0.5, B3, B20, and B100 in whichthe nitrite concentrations in the reactors were maintained atapproximately 0.1, 0.5, 3, 20, and 100 mg-NO2
−-N/L, respectively.Fig. 1 shows the nitrite concentrations of the influent andeffluent in Reactors A0.1 and A0.5, and Fig. 2 shows the nitriteconcentrations of the influent and effluent in Reactors B3, B20,andB100. The averagenitrite concentrations inReactorsA0.1 andA0.5 were 0.11 ± 0.01 mg-NO2
−-N/L and 0.47 ± 0.06 mg-NO2−-N/L,
respectively, during steady states of operation. In Reactors B3,B20, and B100, the average nitrite concentrations were 2.47 ±1.04 mg-NO2
−-N/L, 21.89 ± 5.00 mg-NO2−-N/L, and 107.91 ±
26.94 mg-NO2−-N/L, respectively. In all of the reactors, nitrite
was completely oxidized to nitrate. According to the massbalance of nitrogen, denitrification appeared to be minimal.The DO, pH, alkalinity and salinity were in the range of 5–7 mg-O2/L, 7.2–8.5, 120–150 mg-CaCO3/L, and 10–15 ppt, respec-tively, throughout the operation.

0.0
0.1
0.2
0.3
0.4
0.5
0
5
10
15
20
25
30
0 20 40 60 80
Infl
uent
nitr
ite, e
fflu
ent n
itrat
e (m
g-N
/L)
Time (day) Time (day)
Influent nitrite Effluent nitrate Effluent nitrite
Eff
luen
tnitr
ite (
mg-
N/L
)
0.0
0.2
0.4
0.6
0.8
1.0
1.2
1.4
1.6
0
5
10
15
20
25
30
0 20 40 60 80Infl
uent
nitr
ite, e
fflu
ent n
itrat
e (m
g-N
/L)
Eff
luen
tnitr
ite (
mg-
N/L
)
a b
Fig. 1 – Nitrite and nitrate concentrations in the continuous-flow moving-bed biofilm reactors: (a) Reactor A0.1 and (b) ReactorA0.5.
45J O U R N A L O F E N V I R O N M E N T A L S C I E N C E S 4 2 ( 2 0 1 6 ) 4 1 – 4 9
2.3. Nitrite-oxidizing bacterial population analysis
Fig. 3 shows the nitrite-oxidizing bacterial populations(Nitrobacter and Nitrospira) in the shrimp pond sedimentand biofilms of Reactors A0.1, A0.5, B3, B20, and B100. From theresults, only Nitrospira, not Nitrobacter, were detected in thesediment of shrimp ponds. The results are consistent withSrithep et al. (2015), in which only Nitrospira were detected in allshrimp pondswhere the nitrite concentrationswere in the rangeof 0.02–0.17 mg-NO2
−-N/L. Nitrospira have also been found innatural habitats, such as freshwater and marine sediments(Altmann et al., 2003; Haaijer et al., 2013; Watson et al., 1986)and in biofilters in fresh, marine, and brackish recirculationaquaculture/aquariumsystems (Itoi et al., 2007; Sugita et al., 2005;Tal et al., 2003; Keuter et al., 2011; Kruse et al., 2013).
In the moving-bed biofilm sequencing batch reactorsintermittently fed with 1 mg-NO2
−-N/L (Reactor A) and thecontinuous-flow moving-bed biofilm reactors enriched at lownitrite concentrations (Reactors A0.1 and B0.5), both Nitrospiraand Nitrobacter coexisted. In previous studies, Nitrospira spp.were reported to have a high nitrite affinity (low Ks values)and found to be predominant at low nitrite concentrations(Schramm et al., 1999; Kim and Kim, 2006). Therefore, it israther unexpected that Nitrobacterwere observed at low nitriteconcentrations in this study. Although Nitrobacter were notdetected in shrimp pond sediment, they were detected in themoving-bed biofilm sequencing batch reactor intermittentlyfed with 1 mg-NO2
−-N/L (Reactor A). Nitrobacter were subse-quently detected in all of the continuous-flow moving-bedbiofilm reactors enriched at low nitrite concentrations(0.1–0.5 mg-NO2
−-N/L), in which the biofilm carriers of thesereactors were initially transferred from Reactor A. A possibleexplanation is that the enrichment of NOB in Reactor Aintermittently fedwith 1 mg-NO2
−-N/L could support the growthof both Nitrobacter and Nitrospira. Therefore, when the biofilmcarriers from Reactor A were transferred to Reactor A0.1 andReactor A0.5, Nitrobacter could still be observed in the biofilmcarriers since inactive biomass cannot be effectively removedfrom the attached growth process. Although a nitrite concen-tration of 1 mg-NO2
−-N/L appears to be low, the kinetic resultsshow that the nitrite concentrations resulting in the shifts inkinetic characteristics of NOB enrichments were in the range of
0.5–3 mg-NO2−-N/L. Therefore, it is possible that Reactor A
intermittently fedwith 1 mg-NO2−-N/L could support the growth
of both Nitrobacter andNitrospira. More details on the kinetics ofthe nitrite oxidation of these enrichments are discussed inSection 2.5. A previous study demonstrated that a relativeabundance of Nitrobacter was positively correlated with DOwhereas Nitrospira was better adapted to low DO (Huang et al.,2010). As excess oxygen was provided in this study, theconditions (i.e. oxygen availability) could have been morefavorable to Nitrobacter than Nitrospira. The high concentrationsof DO in the systems might also help to explain the occurrenceof Nitrobacter during the NOB enrichment at low nitriteconcentrations (Fig. 3).
In the reactors enriched at high nitrite concentrations(3–100 mg-NO2
−-N/L), Nitrobacter clearly outcompeted Nitrospirain many orders of magnitude. The results are consistent withprevious studies that reported the dominances of Nitrobacter athigh nitrite concentrations (Kim and Kim, 2006; Nogueira andMelo, 2006). The presence of Nitrospira at high nitrite concen-trations could also be derived from the uses of attached growthprocesses in this study. Moreover, in the thick biofilms (e.g. inthe reactors fed with high nitrite loadings), substrate andoxygen gradients may have developed along the biofilmdepth. Oxygen and substrate limitations within the biofilmmight favor the growth of Nitrospira. However, according to aprevious study that investigated oxygen mass transfer innitrifying biofilms (Brockmann et al., 2008), oxygen shouldhave been transferred effectively through the biofilm consider-ing the high level of DO (5–7 mg-O2/L) in these reactors. Theformation of microenvironments within biofilms favoringinterspecies competition has been shown in Mattei et al.(2015), but competition between Nitrobacter and Nitrospirawithin biofilms has not been investigated until now.
Nevertheless, the results still suggest the favorability ofNitrobacter toward high nitrite concentrations. The amount ofNitrobacter greatly decreased when nitrite concentrations werebelow 3 mg-NO2
−-N/L. From this perspective, the enrichment ofNOB at low nitrite concentrations (<3 mg-NO2
−-N/L) would helpprevent the Nitrobacter from outcompeting while retaining theNitrospira thatwere actually observed in brackish shrimpponds.The NOB enrichment at low nitrite concentrations is likelyto benefit further applications of NOB in actual shrimp ponds.

0
2
4
6
8
10
0
100
200
300
400
500
600
0 20 40 60 80 100
Infl
uent
nitr
ite, e
fflu
ent n
itrat
e (m
g-N
/L)
Time (day)
Influent nitrite Effluent nitrate Effluent nitrite
Eff
luen
t nitr
ite (
mg-
N/L
)
0
20
40
60
80
100
0
100
200
300
400
500
600
700
0 5 10 15 20 25 30
Infl
uent
nitr
ite, e
fflu
ent n
itrat
e (m
g-N
/L)
Time (day)
Eff
luen
t nitr
ite (
mg-
N/L
)
0
100
200
300
400
500
0
100
200
300
400
500
600
700
0 10 20 30 40
Infl
uent
nitr
ite, e
fflu
ent n
itrat
e (m
g-N
/L)
Time (day)
Eff
luen
t nitr
ite (
mg-
N/L
)
a b c
Fig. 2 – Nitrite and nitrate concentrations in the continuous-flow moving-bed biofilm reactors: (a) Reactor B3, (b) Reactor B20,and (c) Reactor B100.
46 J O U R N A L O F E N V I R O N M E N T A L S C I E N C E S 4 2 ( 2 0 1 6 ) 4 1 – 4 9
Besides nitrite and DO concentrations, salinity can influ-ence competition between Nitrobacter and Nitrospira (Moussaet al., 2006). Nitrobacter, not Nitrospira, were found at highsalt levels in both long-term (one-year) and short-term(one-month) adapted nitrifying sludge (Moussa et al., 2006).However, several other studies reported the occurrence andimportance of Nitrospira in marine environments (Haaijer etal., 2013; Keuter et al., 2011; Off et al., 2010; Watson et al.,1986). Although the nitrite concentration was the main param-eter investigated in the present study, the DO concentration andsalinity may also have influenced the competition betweenNitrobacter and Nitrospira to some extent under the conditionsused in this study.
2.4. Nitrite-oxidizing bacterial community analysis
The phylogenetic tree of the partial 16S ribosomal deoxyribo-nucleic acid (rDNA) of Nitrobacter from nitrite-oxidizingenrichments (Reactors A0.1, B3, and B100) is illustrated inAppendix A Fig. S3. All 35 sequences obtained from Nitrobacterclone libraries show 99% similarity of the 16S rRNA genesequences to previously reported sequences of Nitrobacter inthe GenBank database. The result confirmed very highspecificity of the primers P338f and NIT3 to quantify andamplify Nitrobacter in qPCR and clone libraries. Our sequences
10
102
103
104
105
106
107
SEED A A0.1 A0.5 B B3 B20 B100
Gen
e nu
mbe
r (c
opie
s/ng
DN
A) Nitrobacter
Nitrospira
Fig. 3 – The 16S rRNA gene numbers of Nitrobacter andNitrospira in shrimp pond sediment and the biofilms ofReactors A, A0.1, A0.5, B, B3, B20, and B100. The limits ofdetection (LOD) for Nitrobacter and Nitrospira were 2 genecopies/ng DNA.
related closely to Nitrobacter vulgaris, Nitrobacter winogradskyi,and Nitrobacter alkalicus.
The phylogenetic tree of the partial 16S rDNA of Nitrospirafrom nitrite-oxidizing enrichments (Reactors A0.1, B3, andB100) and sediment from shrimp ponds is illustrated inAppendix A Fig. S4. All sequences fell into only the Nitrospiradefluvii lineage, suggesting that the communities of Nitrospirain the brackish shrimp pond sediment, A0.1, B3, and B100samples were similar. Together with the qPCR results, it isimplied that we were able to maintain NOB responsible fornitrite oxidation in the shrimp ponds in all reactors. Never-theless, the Nitrospira spp. observed in this study belong to adifferent sublineage from those observed in the study bySrithep et al. (2015), in which Nitrospira spp. from the Nitrospiramoscoviensis lineage and the Nitrospira marina lineage wereobserved in shrimp ponds.
2.5. Nitrite oxidation kinetics
The nitrite oxidation kinetics of the biofilms obtained fromReactors A0.1, A0.5, B3, B20, and B100 were investigated. Thegraphs of initial nitrite oxidation rates versus initial nitriteconcentrations are plotted in Fig. 4. Table 2 summarizes thenitrite oxidation kinetic coefficients of the biofilms obtainedfrom Reactors A0.1, A0.5, B3, B20, and B100 as described byMonod equation. The NOB enriched at low nitrite concentra-tions (0.1–0.5 mg-NO2
−-N/L) in Reactors A0.1 and A0.5 appear tohavemuch lower Ks values (0.71–0.98 mg-NO2
−-N/L) than thoseenriched at higher nitrite concentrations (3–100 mg-NO2
−-N/L)as in Reactors B3, B20, and B100, in which the Ks values werein the range of 8.36–12.20 mg-NO2
−-N/L. Therefore, the nitriteconcentrations that could result in the shifts in nitriteoxidation kinetics of the enrichments were likely to be in therange of 0.5–3 mg-NO2
−-N/L.The results on nitrite oxidation kinetics agree well with
the observed NOB populations. In general, the Ks values ofNitrobacter spp. (0.36–15.26 mg-NO2
−-N/L), are higher thanthose of Nitrospira spp. (0.13–1.0 mg-NO2
−-N/L) (Schramm etal., 1999; Manser et al., 2005; Laanbroek et al., 1994; Blackburneet al., 2007a,b; Vadivelu et al., 2006; Nowka et al., 2015). Arecent study by Nowka et al. (2015), which compared nitriteoxidation kinetics of pure cultures of Nitrobacter spp. andNitrospira spp., also confirmed the differences in substrateaffinities of Nitrobacter and Nitrospira with the Ks values of0.13–0.38 mg-NO2
−-N/L for Nitrospira and 0.67–7.6 mg-NO2−-N/L
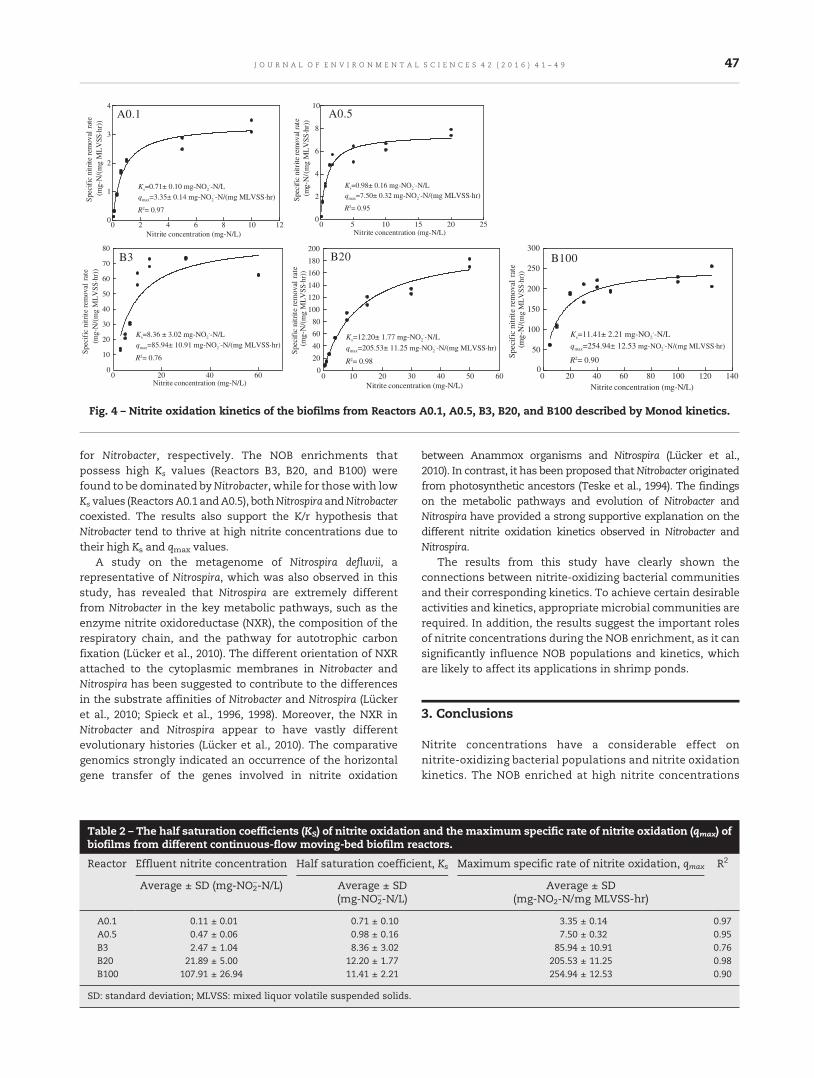
0 2 4 6 8 10 120
1
2
3
4
0 5 10 15 20 250
2
4
6
8
10
0 20 40 600
10
20
30
40
50
60
70
80
0
20
40
60
80
100
120
140
160
180
200
0 10 20 30 40 50 60 0 20 40 60 80 100 120 1400
50
100
150
200
250
300
A0.1
B3
A0.5
B20 B100
Nitrite concentration (mg-N/L)
Nitrite concentration (mg-N/L)
Nitrite concentration (mg-N/L)
Nitrite concentration (mg-N/L) Nitrite concentration (mg-N/L)
Spe
cifi
c ni
trite
rem
oval
rat
e(m
g-N
/(m
g M
LV
SS. h
r))
(mg-
N/(
mg
ML
VSS
. hr)
)
(mg-
N/ (
mg
ML
VSS
. hr)
)
(mg-
N/(
mg
ML
VSS
. hr)
)
(mg-
N/(
mg
ML
VSS
. hr)
)S
peci
fic
nitr
ite
rem
oval
rat
e
Spe
cifi
c ni
trite
rem
oval
rate
Spe
cifi
c ni
trit
e re
mov
al r
ate
Spe
cifi
c ni
trit
e re
mov
al r
ate
Ks=0.71± 0.10 mg-NO2--N/L
qmax=3.35± 0.14 mg-NO2--N/(mg MLVSS.hr)
R2= 0.97
Ks=8.36 ± 3.02 mg-NO2--N/L
qmax=85.94± 10.91 mg-NO2--N/(mg MLVSS.hr)
R2= 0.76
Ks=0.98± 0.16 mg-NO2--N/L
qmax=7.50± 0.32 mg-NO2--N/(mg MLVSS.hr)
R2= 0.95
Ks=12.20± 1.77 mg-NO2--N/L
qmax=205.53± 11.25 mg-NO2--N/(mg MLVSS.hr)
R2= 0.98
Ks=11.41± 2.21 mg-NO2--N/L
qmax=254.94± 12.53 mg-NO2--N/(mg MLVSS.hr)
R2= 0.90
Fig. 4 – Nitrite oxidation kinetics of the biofilms from Reactors A0.1, A0.5, B3, B20, and B100 described by Monod kinetics.
47J O U R N A L O F E N V I R O N M E N T A L S C I E N C E S 4 2 ( 2 0 1 6 ) 4 1 – 4 9
for Nitrobacter, respectively. The NOB enrichments thatpossess high Ks values (Reactors B3, B20, and B100) werefound to be dominated byNitrobacter, while for those with lowKs values (ReactorsA0.1 andA0.5), bothNitrospira andNitrobactercoexisted. The results also support the K/r hypothesis thatNitrobacter tend to thrive at high nitrite concentrations due totheir high Ks and qmax values.
A study on the metagenome of Nitrospira defluvii, arepresentative of Nitrospira, which was also observed in thisstudy, has revealed that Nitrospira are extremely differentfrom Nitrobacter in the key metabolic pathways, such as theenzyme nitrite oxidoreductase (NXR), the composition of therespiratory chain, and the pathway for autotrophic carbonfixation (Lücker et al., 2010). The different orientation of NXRattached to the cytoplasmic membranes in Nitrobacter andNitrospira has been suggested to contribute to the differencesin the substrate affinities of Nitrobacter and Nitrospira (Lückeret al., 2010; Spieck et al., 1996, 1998). Moreover, the NXR inNitrobacter and Nitrospira appear to have vastly differentevolutionary histories (Lücker et al., 2010). The comparativegenomics strongly indicated an occurrence of the horizontalgene transfer of the genes involved in nitrite oxidation
Table 2 – The half saturation coefficients (KS) of nitrite oxidationbiofilms from different continuous-flow moving-bed biofilm re
Reactor Effluent nitrite concentration Half saturation coefficie
Average ± SD (mg-NO2−-N/L) Average ± SD
(mg-NO2−-N/L)
A0.1 0.11 ± 0.01 0.71 ± 0.10A0.5 0.47 ± 0.06 0.98 ± 0.16B3 2.47 ± 1.04 8.36 ± 3.02B20 21.89 ± 5.00 12.20 ± 1.77B100 107.91 ± 26.94 11.41 ± 2.21
SD: standard deviation; MLVSS: mixed liquor volatile suspended solids.
between Anammox organisms and Nitrospira (Lücker et al.,2010). In contrast, it has been proposed thatNitrobacter originatedfrom photosynthetic ancestors (Teske et al., 1994). The findingson the metabolic pathways and evolution of Nitrobacter andNitrospira have provided a strong supportive explanation on thedifferent nitrite oxidation kinetics observed in Nitrobacter andNitrospira.
The results from this study have clearly shown theconnections between nitrite-oxidizing bacterial communitiesand their corresponding kinetics. To achieve certain desirableactivities and kinetics, appropriate microbial communities arerequired. In addition, the results suggest the important rolesof nitrite concentrations during the NOB enrichment, as it cansignificantly influence NOB populations and kinetics, whichare likely to affect its applications in shrimp ponds.
3. Conclusions
Nitrite concentrations have a considerable effect onnitrite-oxidizing bacterial populations and nitrite oxidationkinetics. The NOB enriched at high nitrite concentrations
and the maximum specific rate of nitrite oxidation (qmax) ofactors.
nt, Ks Maximum specific rate of nitrite oxidation, qmax R2
Average ± SD(mg-NO2-N/mg MLVSS-hr)
3.35 ± 0.14 0.977.50 ± 0.32 0.95
85.94 ± 10.91 0.76205.53 ± 11.25 0.98254.94 ± 12.53 0.90

48 J O U R N A L O F E N V I R O N M E N T A L S C I E N C E S 4 2 ( 2 0 1 6 ) 4 1 – 4 9
(3–100 mg-NO2−-N/L) resulted in the predominance ofNitrobacter
with high qmax and Ks (8.36–12.20 mg-NO2−-N/L). In contrast, the
NOB enriched at low nitrite concentrations (0.1–0.5 mg-NO2−-N/L)
led to the coexistence of Nitrospira and Nitrobacter with low Ks
values (0.71–0.98 mg-NO2−-N/L). According to the NOB population
and kinetic results, the NOB enriched at low nitrite concentra-tions (<0.5 mg-NO2
−-N/L) should be more appropriate for furtheruses in actual shrimp ponds.
Acknowledgment
This research has been supported by the National ResearchUniversity Project, Office of Higher Education Commission(No. WCU-014-FW-57). The authors would like to thankBunchong's farm (Mr. Bunchong Nispawanich) for providingthe sediment in brackish shrimp ponds for seed inoculum.
Appendix A. Supplementary data
Supplementary data to this article can be found online athttp://dx.doi.org/10.1016/j.jes.2015.07.014.
R E F E R E N C E S
Altmann, D., Stief, P., Amann, R., De Beer, D., Schramm, A., 2003. Insitu distribution and activity of nitrifying bacteria in freshwatersediments. Environ. Microbiol. 5, 798–803.
APHA, AWWA, WEF, 2005. Standard Methods for the Examinationof Water & Wastewater. 21st ed. American Public HealthAssociation, Washington D.C.
Blackburne, R., Vadivelu, V., Yuan, Z., Keller, J., 2007a. Kineticcharacterization of an enriched Nitrospira culture withcomparison to Nitrobacter. Water Res. 41, 3033–3042.
Blackburne, R., Vadivelu, V.M., Yuan, Z., Keller, J., 2007b.Determination of growth rate and yield of nitrifying bacteria bymeasuring carbon dioxide uptake rate. Water Environ. Res. 79,2437–2445.
Brockmann, D., Rosenwinkel, K.H., Morgenroth, E., 2008. Practicalidentifiability of biokinetic parameters of a model describingtwo-step nitrification in biofilms. Biotechnol. Bioeng. 101 (3),497–514.
Daims, H., Nielsen, L.J., Nielsen, H.P., Schleifer, H.K., Wagner, M.,2001. In situ characterization of Nitrospira-like nitrite-oxidizingbacteria active in wastewater treatment plants. Appl. Environ.Microbiol. 67, 5273–5284.
Dionisi, H.M., Layton, A.C., Robinson, K.G., Brown, J.R., Gregory,I.R., Parker, J.J., et al., 2002. Quantification of Nitrosomonasoligotropha and Nitrospira spp. using competitive polymerasechain reaction in bench-scale wastewater treatment reactorsoperating at different solids retention times. Water Environ.Res. 74, 462–469.
Grady, C.P.L., Lim, H.C., 1988. Biological Wastewater Treatment.1st ed. Marcel Dekker, New York.
Haaijer, S.C., Ji, K., van Niftrik, L., Hoischen, A., Speth, D., Jetten,M.S., et al., 2013. A novel marine nitrite-oxidation Nitrospiraspecies from Dutch coastal North Sea water. Front. Microbiol.4, 60.
Hart, P., O'Sullivan, D., 1993. Recirculation System: Design,Construction and Management. Aquaculture Sourcebook,Tasmania.
Huang, Z., Gedalanga, P.B., Asvapathanagul, P., Olson, B.H., 2010.Influence of physiochemical and operational parameters onNitrobacter and Nitrospira communities in an aerobic activatedsludge bioreactor. Water Res. 44, 4351–4358.
Itoi, S., Ebihara, N., Washio, S., Sugita, H., 2007. Nitrite oxidizingbacteria, Nitrospira, distribution in the outer layer of the biofilmfrom filter materials of a recirculating water system for thegoldfish Carassius auratus. Aquaculture 264, 297–308.
Keuter, S., Kruse, M., Lipski, A., Spieck, E., 2011. Relevance ofNitrospira for nitrite oxidation in a marine recirculationaquaculture system and physiological features of a Nitrospiramarina-like isolate. Environ. Microbiol. 13 (9), 2536–2547.
Kim, D.J., Kim, S.H., 2006. Effect of nitrite concentration on thedistribution and competition of nitrite oxidizing bacteria innitratation reactor systems and their kinetic characteristics.Water Res. 40, 887–894.
Könneke, M., Bernhard, A.E., De La Torre, J.R., Walker, C.B.,Waterbury, J.B., Stahl, D.A., 2005. Isolation of an autotrophicammonia-oxidizing marine archaeon. Nature 437, 543–546.
Kruse, M., Keuter, S., Bakker, E., Spieck, E., Eggers, T., Lipski, A.,2013. Relevance and diversity of Nitrospira populations inbiofilters of brackish RAS. PLoS One 8 (5), e64737.
Laanbroek, H.J., Bodelier, P.L.E., Gerards, S., 1994. Oxygenconsumption kinetics of Nitrosomonas europaea and Nitrobacterhamburgensis grown in mixed continuous cultures at differentoxygen concentrations. Arch. Microbiol. 161, 156–162.
Leu, S.Y., Stenstrom, M.K., 2010. Bioaugmentation to improvenitrification in activated sludge treatment. Water Environ. Res.82, 524–535.
Lücker, S., Wagner, M., Maixner, F., Pelletier, E., Koch, H., Vacherie,B., et al., 2010. A Nitrospira metagenome illuminates thephysiology and evolution of globally importantnitrite-oxidizing bacteria. Proc. Natl. Acad. Sci. U. S. A. 107,13479–13484.
Lücker, S., Schwarz, J., Gruber-Dorninger, C., Spieck, E., Wagner,M., Daims, H., 2015. Nitrotoga-like bacteria are previouslyunrecognized key nitrite oxidizers in full-scale wastewatertreatment plants. ISME J. 9, 708–720.
Manser, R., Gujer, W., Siegrist, H., 2005. Consequences of masstransfer effects on the kinetics of nitrifiers. Water Res. 39,4633–4642.
Mattei, M.R., Frunzo, L., D'Acunto, B., Esposito, G., Pirozzi, F., 2015.Modelling microbial population dynamics in multispeciesbiofilms including anammox bacteria. Ecol. Model. 304, 43–58.
Moussa, M.S., Sumanasekera, D.U., Ibrahim, S.H., Lubberding, H.J.,Hooijmans, C.M., Gijzen, H.J., et al., 2006. Long term effects ofsalt on activity, population structure and floc characteristics inenriched bacterial cultures of nitrifiers. Water Res. 40,1377–1388.
Nogueira, R., Melo, L.F., 2006. Competition between Nitrospira spp.and Nitrobacter spp. in nitrite oxidizing bioreactors. Biotechnol.Bioeng. 95, 169–175.
Nowka, B., Daims, H., Spieck, E., 2015. Comparison of oxidationkinetics of nitrite-oxidizing bacteria: nitrite availability as akey factor in niche differentiation. Appl. Environ. Microbiol. 81,745–753.
Off, S., Alawi, M., Speick, E., 2010. Enrichment and physiologicalcharacterization of a novel nitrospira-like bacterium obtainedfrom a marine sponge. Appl. Environ. Microbiol. 76, 4640–4646.
Parker, D., Wanner, J., 2007. Review of methods for improvingnitrification through bioaugmentation. Water Pract. 1 (5), 1–16.
Regan, J.M., Harrington, G.W., Notuera, D.R., 2002. Ammonia- andnitrite-oxidizing bacterial communities in a pilot-scalechloraminated drinking water distribution system. Appl.Environ. Microbiol. 68, 73–81.
Schloss, P.D., Handelsman, J., 2005. Introducing DOTUR, acomputer program for defining operational taxonomic unitsand estimating species richness. Appl. Environ. Microbiol. 71,1501–1506.
49J O U R N A L O F E N V I R O N M E N T A L S C I E N C E S 4 2 ( 2 0 1 6 ) 4 1 – 4 9
Schramm, A., De Beer, D., Van den Heuvel, J.C., Ottengraf, S.,Amann, R., 1999. Microscale distribution of populations andactivities of Nitrosospira and Nitrospira spp. along a macroscalegradient in a nitrifying bioreactor: quantification by in situhybridization and the use of microsensors. Appl. Environ.Microbiol. 65, 3690–3696.
Spieck, E., Aamand, J., Bartosch, S., Bock, E., 1996.Immunocytochemical detection and location of themembrane-bound nitrite oxidoreductase in cells of Nitrobacterand Nitrospira. FEMS Microbiol. Lett. 139, 71–76.
Spieck, E., Ehrich, S., Aamand, J., Bock, E., 1998. Isolation andimmunocytochemical location of the nitrite-oxidizing systemin Nitrospira moscoviensis. Arch. Microbiol. 169, 225–230.
Srithep, P., Khinthong, B., Chodanon, T., Powtongsook, S.,Pungrasmi, W., Limpiyakorn, T., 2015. Communities ofammonia-oxidizing bacteria, ammonia-oxidizing archaea andnitrite-oxidizing bacteria in shrimp ponds. Ann. Microbiol. 65,267–278.
Sugita, H., Nakamura, H., Shimada, T., 2005. Microbialcommunities associated with filter materials in recirculatingaquaculture systems of freshwater fish. Aquaculture 243,403–409.
Tal, Y., Watts, J.E.M., Schreier, S.B., Sowers, K.R., Schreier, H.J.,2003. Characterization of the microbial community andnitrogen transformation processes associated with moving
bed bioreactors in a closed recirculated mariculture system.Aquaculture 215, 187–202.
Teske, A., Alm, E., Regan, J.M., Toze, S., Rittmann, B.E., Stahl, D.A.,1994. Evolutionary relationships among ammonia- andnitrite-oxidizing bacteria. J. Bacteriol. 176, 6623–6630.
Vadivelu, V.M., Yuan, Z., Fux, C., Keller, J., 2006. Stoichiometricand kinetic characterisation of Nitrobacter in mixed culture bydecoupling the growth and energy generation processes.Biotechnol. Bioeng. 94, 1176–1188.
Wagner, M., Rath, G., Koops, H.P., Flood, J., Amann, R.I., 1996. Insitu analysis of nitrifying bacteria in sewage treatment plants.Water Sci. Technol. 34, 237–244.
Watson, S.W., Bock, E., Valois, F.W., Waterbury, J.B., Schlosser, U.,1986. Nitrospira marina gen. nov. sp. Nov.: a chemolitrophicnitrite-oxidizing bacterium. Arch. Microbiol. 144, 1–7.
Widdel, F., Bak, F., 1992. Gram-negative mesophilic sulfate-reducing bacteria. In: Balows, A., Truper, H.G., Dworkin, M., etal. (Eds.), The Prokaryotes vol. IV. Springer-Verlag, Berlin,pp. 3352–3378.
Yu, L., Peng, D., Pan, R., 2012. Shifts in nitrification kinetics andmicrobial community during bioaugmentation of activatedsludge with nitrifiers enriched on sludge rejected water.J. Biomed. Biotechnol. (Article ID 691894).

J O U R N A L O F E N V I R O N M E N T A L S C I E N C E S 4 2 ( 2 0 1 6 ) 5 0 – 6 0
Ava i l ab l e on l i ne a t www.sc i enced i r ec t . com
ScienceDirect
www. jou rna l s . e l sev i e r . com/ j es
Assessing the effects of surface-bound humic acid on thephototoxicity of anatase and rutile TiO2 nanoparticles in vitro
Xiaojia He1, Sabrieon Sanders2, Winfred G. Aker3, Yunfeng Lin4,Jessica Douglas5, Huey-min Hwang1,⁎
1. Department of Biology, Jackson State University, Jackson, MS, USA2. Department of Biological Sciences, Alcorn State University, Lorman, MS, USA3. Environmental Science Ph.D. Program, Jackson State University, Jackson, MS, USA4. Department of Chemistry and Biochemistry, Jackson State University, Jackson, MS, USA5. School of Polymers and High Performance Materials, The University of Southern Mississippi, Hattiesburg, MS, USA
A R T I C L E I N F O
⁎ Corresponding author. E-mail: hwang@jsum
http://dx.doi.org/10.1016/j.jes.2015.05.0281001-0742/© 2015 The Research Center for Ec
A B S T R A C T
Article history:Received 18 March 2015Revised 17 May 2015Accepted 22 May 2015Available online 1 September 2015
In this study, the cytotoxicity of two different crystal phases of TiO2 nanoparticles, withsurfacemodification by humic acid (HA), to Escherichia coli, was assessed. The physicochemicalproperties of TiO2 nanoparticles were thoroughly characterized. Three different initialconcentrations, namely 50, 100, and 200 ppm, of HA were used for synthesis of HA coatedTiO2 nanoparticles (denoted as A/RHA50, A/RHA100, and A/RHA200, respectively). Resultsindicate that rutile (LC50 (concentration that causes 50% mortality compared the controlgroup) = 6.5) was more toxic than anatase (LC50 = 278.8) under simulated sunlight (SSL)irradiation, possibly due to an extremely narrow band gap. It is noted that HA coatingincreased the toxicity of anatase, but decreased that of rutile. Additionally, AHA50 and RHA50had the biggest differences compared to uncoated anatase and rutile with LC50 of 201.9 and21.6, respectively.We then investigated the formation of reactive oxygen species (ROS) by TiO2
nanoparticles in terms of hydroxyl radicals (UOH) and superoxide anions (O2U−). Data suggested
that O2U−was themain ROS that accounted for the higher toxicity of rutile upon SSL irradiation.
We also observed that HA coating decreased the generation of UOH and O2U− on rutile, but
increased O2U− formation on anatase. Results from TEM analysis also indicated that HA coated
rutile tended to be attached to the surface of E. colimore than anatase.© 2015 The Research Center for Eco-Environmental Sciences, Chinese Academy of Sciences.
Published by Elsevier B.V.
Keywords:TiO2 nanoparticlesEscherichia coliHumic acidCrystallinitySurface coating
Introduction
Titanium dioxide (TiO2) nanoparticles are themost widely usedphotocatalyst for environmental remediation (Chen and Mao,2007; Kwon et al., 2008), particularly in natural aquatic envi-ronments. However, recent studies have raised the concernsover the potential health risks to humans and environments
s.edu (Huey-min Hwang
o-Environmental Science
caused by nano TiO2 throughout its life cycle (Boxall et al., 2007;Sharma, 2009; He et al., 2014b). The behavior and fate ofTiO2 nanoparticles can be altered by suspended solids anddissolved organic matter (DOM), once they are released intoaquatic environments. In addition, the lack of knowledge ofnano-bio-eco interactions could limit the use of TiO2 nanopar-ticles for field applications. Therefore, it is imperative that their
).
s, Chinese Academy of Sciences. Published by Elsevier B.V.

51J O U R N A L O F E N V I R O N M E N T A L S C I E N C E S 4 2 ( 2 0 1 6 ) 5 0 – 6 0
physicochemical properties be assessed by conducting feasibil-ity studies before we employ such nanotechnology for environ-mental remediation.
In general, unmodified TiO2 nanoparticles can only beexcited by UV light, owing to their large band gap (theoretically3.0 eV for rutile and 3.2 eV for anatase). However, TiO2 nano-particles can be sensitized through specific photosensitizers,for instance, dyes (Persson et al., 2000; De Angelis et al., 2007).Recently, humic acid (HA) has also been suggested to be capa-ble of serving as a photosensitizer in HA/TiO2/visible lightsystem (Selli et al., 1999; Cho and Choi, 2002; Ryu and Choi,2004). The supplementation with HA essentially expands theapplicability of TiO2 as a photocatalyst into visible light region.In addition, TiO2 nanoparticles on most occasions, tend toaggregate in aqueous solutions and exist as aggregates, nor-mally over 1 μm. Appreciably, surface coating can largely im-prove the stability and dispersibility of TiO2 nanoparticles inaqueous solutions. Thus, lately, the physicochemical proper-ties of HA coated TiO2 nanoparticles have been studied andreported (Yang and Xing, 2009; Chen et al., 2012). Besides theexpanded spectrum of light excitation, HA coated TiO2 nano-particlesmay also differ from the uncoated TiO2 nanoparticlesin the presence of free HA (Lin et al., 2012). It was reported thatHA coating could reduce the adhesion of TiO2 nanoparticles toalgal cells, decrease the formation of reactive oxygen species(ROS), and consequently alleviate the algal toxicity (Lin et al.,2012). However, Yang et al. (2013) reported that oxidativedeoxyribonucleic acid (DNA) damage and toxicity to zebrafish(Danio rerio) were increased by the supplement of HA to TiO2
nanoparticles in the absence of light irradiation (Yang et al.,2013). Thus, it is necessary to investigate the alteration ofphysicochemical properties of TiO2 nanoparticles coated withHA and to assess the effects on the subsequent nanotoxicity inthe presence of sunlight or only visible light.
Furthermore, the effect of crystallinity has also been sug-gested to be attributed to the different toxicological profiles ofTiO2 nanoparticles. It is generally recognized that anataseis more active and toxic than rutile under UV irradiation.According to Luttrell et al. (2014), this is owing to the largerband gap of anatase. Under UV irradiation, anatase TiO2
nanoparticles could generate higher amounts of ROS intra-cellularly and extracellularly than the rutile phase (Chen et al.,2007; Guichard et al., 2012). However, this could be altered oreven reversed under visible light irradiation, or in the ab-sence of light, as substantiated by the reports (Sayes et al.,2006; Lipovsky et al., 2012; Numano et al., 2014). Notably, ROSformation in water suspensions of TiO2 was much higherin rutile than anatase after visible light illumination (400–800 nm, 40 mW/cm2) (Lipovsky et al., 2012). They suggestedthat the difference between anatase and rutile under visibleillumination might be owing to a difference in their band-gapenergies (Eg), in which Eg (anatase) = 3.2 eV (387 nm), and Eg(rutile) = 3 eV (415 nm). On the basis of the above consider-ation, it is important to investigate how the photoactivity andtoxicity differ with crystallinity under sunlight irradiation.
In this study, we synthesized HA coated TiO2 nanoparticlesin both rutile and anatase phases. We investigated theirtoxicity to Escherichia coli (E. coli) under simulated sunlight(SSL) irradiation. To the best of our knowledge, no study hasbeen reported to have specifically investigated the effect of
surface-bound HA on the physicochemical properties andtoxicity of TiO2 nanoparticles to living organisms.
1. Materials and methods
1.1. Materials
TiO2 nanoparticles (Sample A and Sample B) were purchasedfrom US Research Nanomaterials, Inc. (US Research Nano-materials, Inc., Houston, TX, USA). All organic solvents andthe humic acid (>99%) used in this study were purchasedfrom Sigma Aldrich (Sigma-Aldrich Co., St. Louis, MO, USA).All solutions were prepared using nanopure water (ThermoScientific™ NERL™ Reagent Grade Water, Nerl DiagnosticsLLC, East Providence, RI, USA). Bacteria E. coli (ATCC#25254)was purchased from the American Type Culture Collection(ATCC, Manassas, VA, USA).
1.2. Preparation of HA coated TiO2
The steps of synthesis of HA coated TiO2 followed the previousdescription of (Yang and Xing, 2009) with slight modifications.Briefly, 1 g of TiO2 (Sample A or Sample B) was added into100 mLofHA solution to reach the different final concentrationsof 50, 100, and 200 ppm. After stirring for 2 day at 180 r/min, themixturewas then centrifuged at 5000 ×g for 30 min andwashedthree times with nanopure water to eliminate any unboundedHA residues. The pellet was collected after removing the super-natant, and freeze-dried. Lyophilization was then conductedunder vacuumat 0.014 mbar for 48 hrwith a Labconco FreezonePlus 2.5 L BenchtopCascadeFreezeDrySystems (Labconco,USA)equipped with a Welch 8912Z-02 Vacuum (Welch 8912Z-02,Gardner DenverWelch Vacuum Technology Inc., USA). SamplesA and B were identified by X-ray diffraction (XRD) as anataseTiO2, and rutile TiO2, respectively. AHA50, AHA100, and AHA200were the products from 50, 100, and 200 ppm HA coated withSample A (anatase TiO2) respectively. Correspondingly, RHA50,RHA100, and RHA200 were 50, 100, and 200 ppmHA coated withSample B (rutile TiO2), respectively.
1.3. Characterization
The characterization of HA coated TiO2 nanoparticles wasconducted with XRD, transmission electron microscopy (TEM),scanning electron microscopy (SEM), energy dispersive X-rayspectroscopy (EDX), Fourier transform infrared spectroscopy(FTIR), UV-Vis spectroscopy, dynamic light scattering (DLS), andphase analysis light scattering (PALS). The content of coatedHAwas determined with total organic carbon (TOC) analysis.
XRD patterns were obtained using a Rigaku D/MAX-Ultima-III diffractometer (Rigaku D/MAX-Ultima-III diffrac-tometer, Rigaku, Japan) at room temperature with Cu Kα ra-diation at a tube current of 44 mA and an acceleration voltageof 40 kV. The scan ranges were 2–40° and 2–75° at a step in-terval of 0.1° and a scanning rate of 0.05°/min. Primary nano-particle size was determined using a Jeol, JEM 1011 electronmicroscope working at 100 kV (JEM 1011, Joel USA, Inc., USA)equipped with a Gatan camera model 785. Morphology of TiO2
and variation of growth for synthesized HA coated TiO2 were

52 J O U R N A L O F E N V I R O N M E N T A L S C I E N C E S 4 2 ( 2 0 1 6 ) 5 0 – 6 0
also studied using a SEM (SIGMA VP, Carl Zeiss, Germany)operating at 10 kV at a working distance of 3.3–3.7 mm. Theelemental composition of the nanocomposite was studiedusing EDX with a Thermo Scientific Ultra Dry EDS Detector(Thermo Scientific, USA) operating at 20 kV.
Uncoated TiO2 and the HA-coated variants were alsocharacterized by FT-IR using a Nexus 870 FTIR spectrometer(Nexus 870, Thermo-Nicolet, USA). Absorbance spectra of thetested TiO2 weremeasured using a UV–Vis spectrophotometer(UV-2600, Shimadzu, Japan). The hydrodynamic size and zetapotential values of suspensions of the tested TiO2 at 100 ppmin nanopure water were obtained via DLS and PALS, respec-tively, using a Malvern Zetasizer Nano (Malvern InstrumentsLtd, UK). Nanoparticle suspension was sonicated (FS30, FisherScientific, USA) in water for 30 min and kept in dark untiluse. The stock solution was sonicated for 10 min prior toexperimentation. The pH adjustment of PALS was achievedby the addition of 0.025 mol/L HCl or 0.025 mol/L NaOHsolution.
TOC was analyzed using an Elementar Combustion Instru-ment (Vario Macro CNS, Elementar, Germany). Approximatelya 70 to 80 mg sample was dropped into a combustion chamberwhere it was consumed at 1150°C; the post-combustion tem-perature was 800°C, and the reduction tube was at 850°C.Once combustion took place, the gases were swept sequen-tially to a thermoconductivity (TC) detector by Helium gas at499 mL/min. Nitrogen was measured immediately while thecarbon and sulfur gases were adsorbed onto their respectivecolumns and released to the TC detector, carbon first, and thensulfur. Initial combustion was carried out with an injection ofoxygen, first at stage 1 for 30 sec at 30 mL/min, and then atstage 2 for 120 sec at 100 mL/min.
1.4. Cytotoxicity test
The TiO2 stock solutions (1000 ppm) used in this study includeanatase, AHA50 and AHA200, rutile, RHA50 and RHA200. Thestock solutions were autoclaved to eliminate any contaminantmicroorganisms, allowed to cool to room temperature, thenused immediately for the cytotoxicity tests. The effect ofautoclaving on the physicochemical properties and toxicity ofTiO2was also evaluated. No significant differencewas observedwith regard to the effect of autoclaving (data not shown). Allstock solutions were sonicated (FS30, Fisher Scientific, USA) for30 min prior to adding them to make the working solution. Itwas reported that sonication of nanoparticles has a minimaleffect on particle surface charge. Sonication has been utilized tofacilitate particle dispersion and solution mixture (Warheit,2008).
Cytotoxicity testing was performed by inoculating bacterialcells on Miller Luria-Bertani Broth (LB) agar plates after treat-ment with TiO2 solutions of various concentrations. An inocu-lation loop of E. coli suspension was introduced into LBnutrient broth and cultured overnight at 37°C. Following incu-bation, the culture was washed three times with sterilizedphysiological saline (0.8% W/V) in a centrifuge (EppendorfCentrifuge 5810 R, Eppendorf AG, Germany) at 4°C and 1735 ×gfor 10 min. The bacterial suspensions were diluted (106 ×dilution factor) and exposed to the TiO2 in quartz test tubes(ACE Glass Inc., Louisville, USA). Subsequently, they were then
exposed to simulated sunlight for 1 hr with stirring. A PMA2100 radiometer (PMA 2100, Solar Light Co., USA) equipped withUVAprobe PMA2110 andvisible light probe PMA2130 (PMA2130,Solar Light Co., USA) was used to measure the light intensityduring exposure (visible light: average 22.95 ± 0.16 W/m2, total in1 hr 83.70 kJ/m2; UVA: average 0.18 ± 0.00 mW/cm2, total in 1 hr0.70 J/cm2). Dark exposure was also conducted in quartz tubesand wrapped in aluminum foil to prevent light illumination.
After exposure, 100 μL aliquots of the samples were spreadon respective LB agar and then placed in an incubator at 37°Cfor 24 hr. LC50 (concentration that causes 50% mortalitycompared to the control group) was then calculated (Cook etal., 2010).
1.5. Assessment of ROS formation
1.5.1. Hydroxyl radicals (UOH)Hydroxyl radical (UOH) generation by TiO2 nanoparticles wasquantified by fluorescence spectroscopy using terephthalic acid(Ishibashi et al., 2000; Yu et al., 2009). Owing to its highsensitivity and reliability, terephthalic acid is able to specificallyreact with UOH, producing fluorescent 2-hydroxyterephthalicacid. Briefly, TiO2 solutionwas added into 5 mLof 5 × 10⁻⁴ mol/Lterephthalic acid with NaOH at 2 × 10⁻³ mol/L. Themixture wasthen stirred in the dark for 2 hr to reach equilibrium. After that,the solution was immediately exposed to simulated sunlightirradiation for 1 hr. Prior to fluorescence spectroscopy, thereaction mixture was filtered through a membrane filter (poresize 0.22 μm, diameter 13 mm, polyvinylidene fluoride (PVDF),Fisher Sci., USA). Fluorescence intensity was measured at425 nm (scanned from 350 to 600 nmwith 1 nm slit) excited by315 nm light with a Horiba Scientific Fluoromax-4 spectrofluo-rometer (Horiba Jobin Yvon Inc., USA) equippedwith a NanoLEDpulsed diode light source.
1.5.2. Superoxide (O2U−)
The formation of superoxide (O2U−) was detected by using a nitro
blue tetrazolium (NBT) assay. Superoxide ions can reduce NBTto insoluble purple formazan (Goto et al., 2004). Briefly, TiO2
samples of various concentrations were added into 5 mLsolutions of 0.1 mmol/LNBT inquartz test tubes. The respectivemixtures were then stirred thoroughly and exposed to simulat-ed sunlight for 1 hr under stirring. Subsequently, 0.22 μm PVDFmembrane filters were used to filter out precipitates prior toUV–Vis spectroscopy. The generation of O2
U− was quantified bymeasuring the reduction of NBT at 260 nm. The final solutionscontaining NBT were diluted twofold in order to reach anoptimal optical reading. Accordingly, results weremultiplied bytwo for quantitation.
1.6. TEM analysis of nano-bio interactions
Bacterial suspension was prepared for TEM measurements.For observing attachment of nanoparticles, a 20 μL aliquot oftreated bacterial suspension was spread onto a TEM coppergrid (CF300-Cu, Electron Microscopy Sciences, USA). Afterdrying out at ambient temperature, TEM micrographs werecaptured and analyzed using a Jeol, JEM 1011 electron micro-scopeworking at 100 kV (JEM 1011, Joel USA, Inc., USA) equippedwith a Gatan camera model 785.
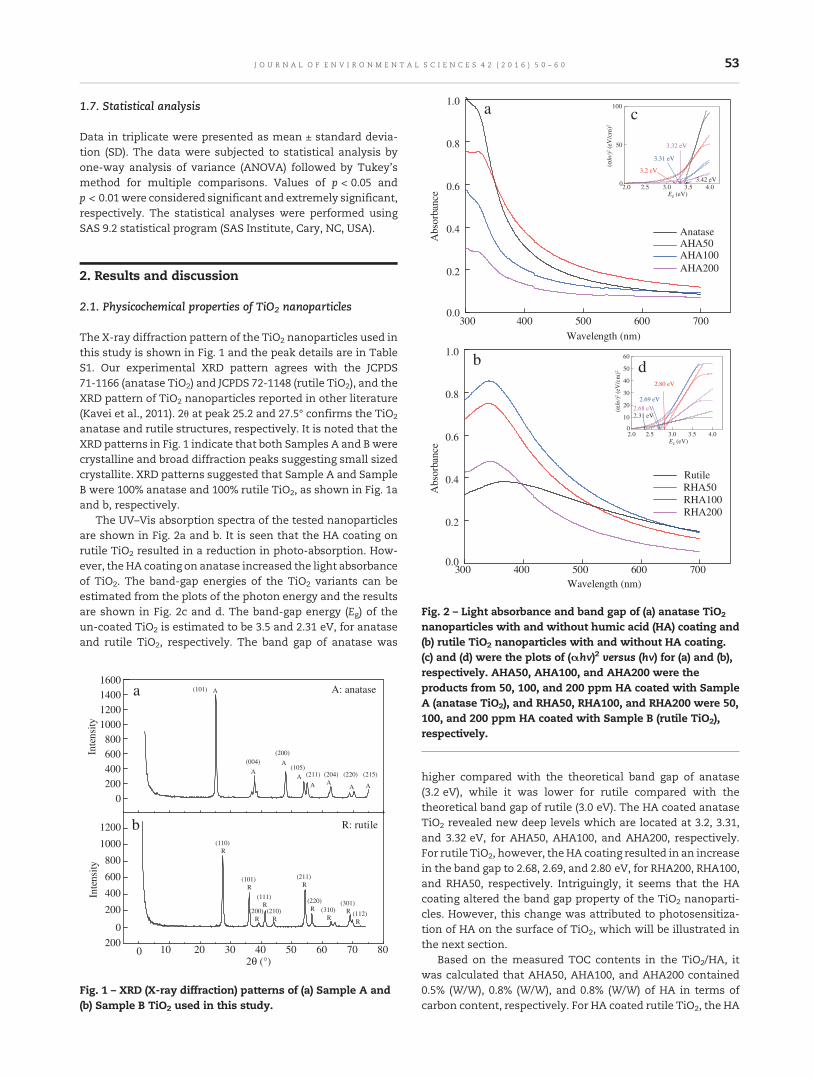
0.4
0.6
0.8
1.0
Abs
orba
nce
Anatase AHA50
0
50
100
3.2 eV
3.31 eV
3.32 eV
3.42 eV2.0 2.5 3.0 3.5 4.0
(αhv
)2 (eV
/cm
)2
Eg (eV)
a c
53J O U R N A L O F E N V I R O N M E N T A L S C I E N C E S 4 2 ( 2 0 1 6 ) 5 0 – 6 0
1.7. Statistical analysis
Data in triplicate were presented as mean ± standard devia-tion (SD). The data were subjected to statistical analysis byone-way analysis of variance (ANOVA) followed by Tukey'smethod for multiple comparisons. Values of p < 0.05 andp < 0.01were considered significant and extremely significant,respectively. The statistical analyses were performed usingSAS 9.2 statistical program (SAS Institute, Cary, NC, USA).
0.0
0.2
Wavelength (nm)
AHA100AHA200
300 400 500 600 700
300 400 500 600 7000.0
0.2
0.4
0.6
0.8
1.0
Abs
orba
nce
Wavelength (nm)
Rutile RHA50RHA100RHA200
2.0 2.5 3.0 3.5 4.00
10
20
30
40
50
60
2.80 eV
2.69 eV
2.68 eV(αhv
)2 (eV
/cm
)2
Eg (eV)
2.31 eV
b d
Fig. 2 – Light absorbance and band gap of (a) anatase TiO2
nanoparticles with and without humic acid (HA) coating and(b) rutile TiO2 nanoparticles with and without HA coating.(c) and (d) were the plots of (αhν)2 versus (hν) for (a) and (b),
2. Results and discussion
2.1. Physicochemical properties of TiO2 nanoparticles
The X-ray diffraction pattern of the TiO2 nanoparticles used inthis study is shown in Fig. 1 and the peak details are in TableS1. Our experimental XRD pattern agrees with the JCPDS71-1166 (anatase TiO2) and JCPDS 72-1148 (rutile TiO2), and theXRD pattern of TiO2 nanoparticles reported in other literature(Kavei et al., 2011). 2θ at peak 25.2 and 27.5° confirms the TiO2
anatase and rutile structures, respectively. It is noted that theXRD patterns in Fig. 1 indicate that both Samples A and B werecrystalline and broad diffraction peaks suggesting small sizedcrystallite. XRD patterns suggested that Sample A and SampleB were 100% anatase and 100% rutile TiO2, as shown in Fig. 1aand b, respectively.
The UV–Vis absorption spectra of the tested nanoparticlesare shown in Fig. 2a and b. It is seen that the HA coating onrutile TiO2 resulted in a reduction in photo-absorption. How-ever, the HA coating on anatase increased the light absorbanceof TiO2. The band-gap energies of the TiO2 variants can beestimated from the plots of the photon energy and the resultsare shown in Fig. 2c and d. The band-gap energy (Eg) of theun-coated TiO2 is estimated to be 3.5 and 2.31 eV, for anataseand rutile TiO2, respectively. The band gap of anatase was
0
200400
600800
10001200
14001600
Inte
nsity
10 20 30 40 50 60 70 800200
0
200
400
600
800
1000
1200
Inte
nsity
a
b
2θ (°)
(101)
(004)(200)
(105)(211) (204) (220) (215)
(110)
A
AA
AA
AA
R
(101)R
(211)R
(310)R
(301)R (112)
R
(220)R
(111)R
(200)R
(210)R
A: anatase
R: rutile
A
Fig. 1 – XRD (X-ray diffraction) patterns of (a) Sample A and(b) Sample B TiO2 used in this study.
respectively. AHA50, AHA100, and AHA200 were theproducts from 50, 100, and 200 ppm HA coated with SampleA (anatase TiO2), and RHA50, RHA100, and RHA200 were 50,100, and 200 ppm HA coated with Sample B (rutile TiO2),respectively.
higher compared with the theoretical band gap of anatase(3.2 eV), while it was lower for rutile compared with thetheoretical band gap of rutile (3.0 eV). The HA coated anataseTiO2 revealed new deep levels which are located at 3.2, 3.31,and 3.32 eV, for AHA50, AHA100, and AHA200, respectively.For rutile TiO2, however, the HA coating resulted in an increasein the band gap to 2.68, 2.69, and 2.80 eV, for RHA200, RHA100,and RHA50, respectively. Intriguingly, it seems that the HAcoating altered the band gap property of the TiO2 nanoparti-cles. However, this change was attributed to photosensitiza-tion of HA on the surface of TiO2, which will be illustrated inthe next section.
Based on the measured TOC contents in the TiO2/HA, itwas calculated that AHA50, AHA100, and AHA200 contained0.5% (W/W), 0.8% (W/W), and 0.8% (W/W) of HA in terms ofcarbon content, respectively. For HA coated rutile TiO2, the HA

54 J O U R N A L O F E N V I R O N M E N T A L S C I E N C E S 4 2 ( 2 0 1 6 ) 5 0 – 6 0
content was 0.4% (W/W), 0.8% (W/W), and 0.7% (W/W) forRHA50, RHA100, and RHA200, respectively. The linear increaseof the coating percentage from HA50 to HA100 implied thatHA coating on TiO2 proceeded with multilayer formation. Incontrast, the data indicated that there was no significantdifference between the HA coated TiO2 prepared at 100 and200 ppm, in terms of coating percentage. This fact is in agree-ment with the band gap results. Thus, we chose 200 ppm HAcoated TiO2 for further analysis and testing. It is noteworthythat there is no significant difference among surface coatingin terms of sulfur and nitrogen (data not shown).
Furthermore, the primary size of TiO2 was revealed usingTEM, as shown in Fig. 3a–f and Table 1. The TEM images showthat the tested rutile and anatase TiO2 nanoparticles werein the same size range. We also found that humic acid, as asurface coating, had no significant effect on the primary size ofanatase or rutile TiO2 nanoparticles. The two-dimensional(2-D) surface morphological study of the HA loaded TiO2
nanoparticles was carried out by SEM (Fig. 3g–j). The morphol-ogy and structure of the samples were further investigatedby EDX spectroscopy. The elemental compositions are thusfurther confirmed. EDX point spectra taken from the centerpoint of TiO2 show strong Ti and O signals (Fig. 3k–n). Asshown in Fig. 3l and n, N signals were also observed for HAcoated TiO2. The chemical compositions of the thin filmsanalyzed are given in Fig. S1–8.
The FTIR spectra of the tested TiO2 with and without HAcoating are presented in Fig. 4. The data indicate that the
k
l
m
n
ba c
f hg
Fig. 3 – TEM micrographs of (a) anatase, (b) AHA50, (c) AHA200, ((h) AHA200, (i) rutile, (j) RHA200, EDX point spectra and line scansare attributed to the silicon wafers for imaging. Other elements stransmission electron microscopy; EDX: energy dispersive X-rayelectron microscopy.
observed peak of rutile TiO2 at 1639 cm−1 shifted to 1629, 1627,and 1631 cm−1 for RHA50, RHA100, and RHA200, respectively.As shown in Fig. 4a, absorption spectra suggest strong inter-actions of phenolic OH of HA with TiO2. Interestingly, RHA100exhibited the largest shift as well as the strongest absorbance.This may be due to ligand exchange between TiO2 and HA anda larger band gap of RHA100 (Fig. 2b). A similar shift was alsoobserved for anatase TiO2 around 1600–1700 cm−1, as shownin Fig. 4b. In comparison with pure anatase TiO2, several con-tinuous new peaks around 1300–1500 cm−1 appeared afterbinding with HA, owing to the C = C and C = O stretch of HA,particularly, the tiny peak around 1300, 1372 and 1537 cm−1
should be vs(C–O), vas(COO−), and vs(COO−). In addition, thepeak of OH stretching at 3300–3600 cm−1 may come from adifferent extent of ligand exchange between phenolic groupsin TiO2 and HA. We also found that as the amount of HAincreased, the peak at 2350–2400 becameweaker, owing to thestrong interactions of phenolic OH with TiO2. Compared withthe ones coated with HA at 100 and 50 ppm, there is a sharpincrease in the intensity of the peak of the hydroxyl group,around 3500 cm−1, in rutile TiO2 after coating with HA at200 ppm. This could occur as a result of the ligand exchangebetween hydroxyl groups on TiO2 and HA carboxyl/hydroxylfunctional groups (Yang and Xing, 2009). From this observation,HA chemically bound on the surface of TiO2 nanoparticles.
In addition, hydrodynamic size and zeta potential wereinvestigated as aspects of chemical characterization. Becauseof their lipophilicity, the rutile TiO2 nanoparticles form larger
d e
ji
d) rutile, (e) RHA50, (f) RHA200, FESEM images of (g) anatase,of (k) anatase, (l) AHA200, (m) rutile, and (n) RHA200. Si peaksuch as Na and Cl are the components of substrate. TEM:spectroscopy; FESEM: field emission SEM; SEM: scanning
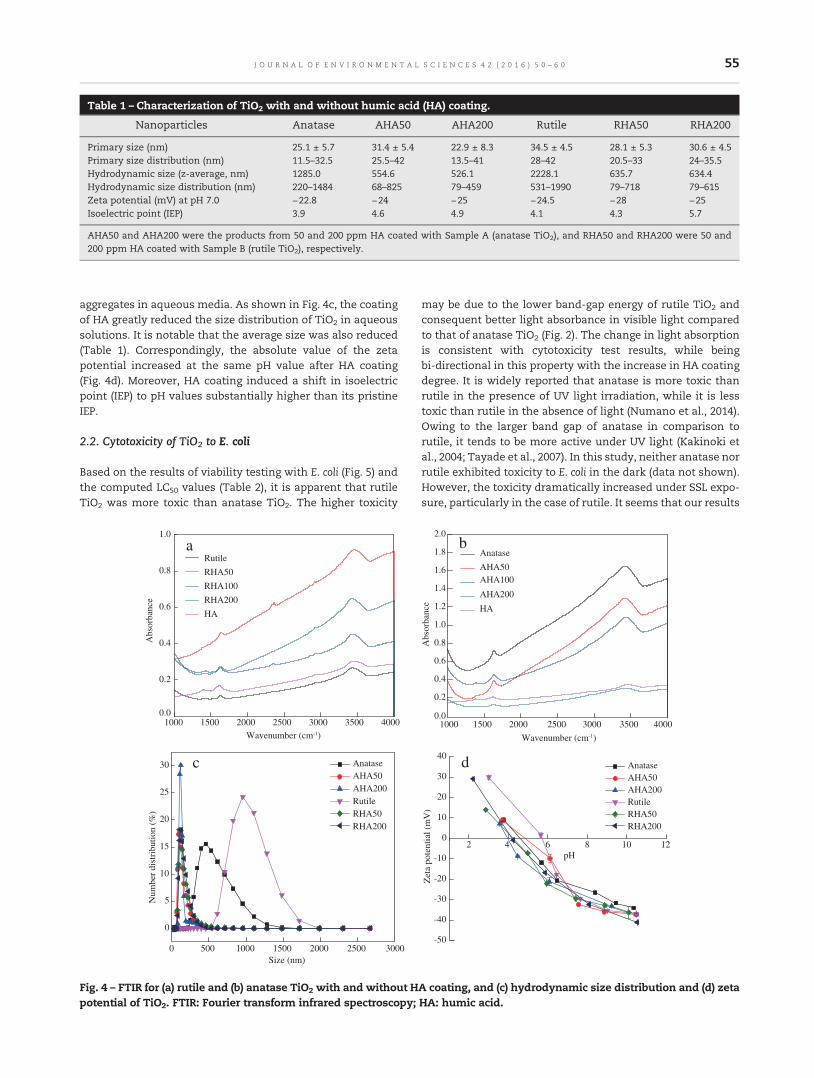
Table 1 – Characterization of TiO2 with and without humic acid (HA) coating.
Nanoparticles Anatase AHA50 AHA200 Rutile RHA50 RHA200
Primary size (nm) 25.1 ± 5.7 31.4 ± 5.4 22.9 ± 8.3 34.5 ± 4.5 28.1 ± 5.3 30.6 ± 4.5Primary size distribution (nm) 11.5–32.5 25.5–42 13.5–41 28–42 20.5–33 24–35.5Hydrodynamic size (z-average, nm) 1285.0 554.6 526.1 2228.1 635.7 634.4Hydrodynamic size distribution (nm) 220–1484 68–825 79–459 531–1990 79–718 79–615Zeta potential (mV) at pH 7.0 −22.8 −24 −25 −24.5 −28 −25Isoelectric point (IEP) 3.9 4.6 4.9 4.1 4.3 5.7
AHA50 and AHA200 were the products from 50 and 200 ppm HA coated with Sample A (anatase TiO2), and RHA50 and RHA200 were 50 and200 ppm HA coated with Sample B (rutile TiO2), respectively.
55J O U R N A L O F E N V I R O N M E N T A L S C I E N C E S 4 2 ( 2 0 1 6 ) 5 0 – 6 0
aggregates in aqueous media. As shown in Fig. 4c, the coatingof HA greatly reduced the size distribution of TiO2 in aqueoussolutions. It is notable that the average size was also reduced(Table 1). Correspondingly, the absolute value of the zetapotential increased at the same pH value after HA coating(Fig. 4d). Moreover, HA coating induced a shift in isoelectricpoint (IEP) to pH values substantially higher than its pristineIEP.
2.2. Cytotoxicity of TiO2 to E. coli
Based on the results of viability testing with E. coli (Fig. 5) andthe computed LC50 values (Table 2), it is apparent that rutileTiO2 was more toxic than anatase TiO2. The higher toxicity
0 500 1000 1500 2000 2500 3000
0
5
10
15
20
25
30
Num
ber
dist
ribu
tion
(%)
Size (nm)
AnataseAHA50AHA200
RHA50RHA200
Rutile
1000 1500 2000 2500 3000 3500 40000.0
0.2
0.4
0.6
0.8
1.0
Abs
orba
nce
HA
RHA50
RHA200
Rutile
RHA100
a
c
Wavenumber (cm-1)
Fig. 4 – FTIR for (a) rutile and (b) anatase TiO2 with and without Hpotential of TiO2. FTIR: Fourier transform infrared spectroscopy;
may be due to the lower band-gap energy of rutile TiO2 andconsequent better light absorbance in visible light comparedto that of anatase TiO2 (Fig. 2). The change in light absorptionis consistent with cytotoxicity test results, while beingbi-directional in this property with the increase in HA coatingdegree. It is widely reported that anatase is more toxic thanrutile in the presence of UV light irradiation, while it is lesstoxic than rutile in the absence of light (Numano et al., 2014).Owing to the larger band gap of anatase in comparison torutile, it tends to be more active under UV light (Kakinoki etal., 2004; Tayade et al., 2007). In this study, neither anatase norrutile exhibited toxicity to E. coli in the dark (data not shown).However, the toxicity dramatically increased under SSL expo-sure, particularly in the case of rutile. It seems that our results
2 4 6 8 10 12
-50
-40
-30
-20
-10
0
10
20
30
40
Zet
a po
tent
ial (
mV
)
pH
d
b
1000 1500 2000 2500 3000 3500 40000.0
0.2
0.4
0.6
0.8
1.0
1.2
1.4
1.6
1.8
2.0
Abs
orba
nce
Wavenumber (cm-1)
HA
AHA50
AHA200
Anatase
AHA100
AnataseAHA50AHA200
RHA50RHA200
Rutile
A coating, and (c) hydrodynamic size distribution and (d) zetaHA: humic acid.

20
40
60
80
100Su
rviv
al r
ate
(%)
Concentration (ppm)
RutileRHA50RHA200
0 2 4 6 8 10 0 50 100 150 200
40
50
60
70
80
90
100
Surv
ival
rat
e (%
)
Concentration (ppm)
AnataseAHA50AHA200
a b
Fig. 5 – Viability of Escherichia coli (E. coli) after exposure to (a) anatase and (b) rutile TiO2 under simulated sunlight.
56 J O U R N A L O F E N V I R O N M E N T A L S C I E N C E S 4 2 ( 2 0 1 6 ) 5 0 – 6 0
disagree with some published data (Sayes et al., 2006;Braydich-Stolle et al., 2009). However, differences in the lightconditions used in the aforementioned studies account for thevariances, owing to the extremely low band gap of rutile usedin this study. It should be noted that the aggregation state ofTiO2 nanoparticles may alter their ultimate bioavailability. Inthe present study, there was no notable difference in theextent of aggregation among the HA coated TiO2. Hence, thebig difference between uncoated anatase and rutile did notcontribute to their distinct performance in causing toxicity toE. coli, indicating that the bioavailability may not be the majorfactor for causing higher toxicity by rutile.
In addition to crystallinity, our statistical analysis indicatesthat surface coating with HA exhibited significant impacton the phototoxicity of TiO2 (p < 0.05, Table 3). It is apparentthat surface coating of HA increased the toxicity of anatase,but decreased the toxicity of rutile. Additionally, the alterationof toxicity was related to the percentage of HA coating. Theresults suggested that AHA50 and RHA50 had the biggestdifferences compared to uncoated anatase and rutile, respec-tively. The LC50 values of AHA50 and RHA50 decreased by27.6% and 332%, respectively. This pattern is consistent withband gap properties in Fig. 2. The lower coating percentage ofHA tended to increase the band gap of rutile more intensively,leading to a subsequent narrowing of the light absorptionband and decreased phototoxicity. However, the lower coatingpercentage of HA was more capable of lowering bang gap ofanatase, resulting in expanded light absorption and increasedphototoxicity. This change suggests that there is a threshold
Table 2 – LC50 of TiO2 nanoparticles to Escherichia coli.
Nanoparticles Anatase AHA50 AHA200
LC50 (ppm) 278.8 201.9 221.9R2 0.9295 0.9078 0.9969
Nanoparticles Rutile RHA50 RHA200
LC50 (ppm) 6.5 21.6 6.7R2 0.8603 0.8535 0.9980
LC50: concentration that causes 50% mortality compared to thecontrol group.
coating percentage for altering the photoreactivity and subse-quent phototoxicity of TiO2.
It was reported that co-exposure to TiO2 nanoparticles andHA under simulated sunlight could significantly increase oxi-dative stress and subsequent toxicity in developing zebrafish(Bar-Ilan et al., 2012; Yang et al., 2013). Additionally, it wassuggested that HA could act as both donor and acceptor ofelectrons to and from the TiO2 conduction band (CB), withoutundergoingmineralization (Cho and Choi, 2002). Therefore, wepropose a hypothesis for this particular alteration, as present-ed in Fig. 6. In this system, HA as a sensitizer is firstly activatedby visible light irradiation and subsequently, electrons areinjected into the CB of TiO2. The injected electrons then mi-grate from the lattice to the surface of TiO2 where they par-ticipate in redox reactionswith O2, leading to the generation ofsuperoxide (O2
U−). As an acceptor of electrons, HA also acceptselectrons from the solution redox couple, making a loopingcycle (Meyer, 1997). In addition, HA also serves as hole scav-enger that enhances the production of superoxide (Selli et al.,1999; Ryu and Choi, 2004). It was reported that hydroxylradicals (UOH) could react with HA, leading to the formation ofhumic acid radicals (Wang et al., 2000; Westerhoff et al., 2007).Thus, the surface coating of HA could alter the light absorptionproperty of TiO2 nanoparticles. Based on this hypothesis, wecan expect that in this study, there will be increased super-oxide formation, and decreased of UOH. It is true so far, foranatase TiO2. However, the story is slightly different withrutile. The rutile in our experiment had an extremely smallband gap, making it sensitive to visible light. It is noteworthythat only a partial visible spectrum (up to 500 nm, correspond-ing to a band gap of 2.48 eV) is responsible for the light-induced ROS in TiO2 nanoparticles (Lipovsky et al., 2012). Thus,the low band gap of rutile may not contribute to ROS produc-tion any further below 2.48 eV. The coating of HA essentiallyblocked the light absorption of rutile, while HA per se still couldbe activated by visible light as a sensitizer and a holescavenger. It was reported that O2
U− was the dominant ROS inrutile upon visible light illumination (Lipovsky et al., 2012).This factmay cause a decrease in the generation of UOH andO2
U−
on rutile. The coating of HA at a certain percentage mayachieve amaximum interferencewith light absorption of TiO2,resulting in a balance of light activation-blocking. In thisstudy, 0.4%–0.5%HA coating on TiO2 could greatly increase the

Table 3 – Statistic results of viability test by different surface coating and concentration of two types of TiO2.
Source Degree offreedom (DF)
Type I SS(sum of squares)
Mean square F value Pr > F
AnataseSurface coating 2 465.85 232.93 5.25 0.0160Concentration 2 2792.07 1396.04 31.46 <0.0001Surface coating-concentration 4 85.48 21.37 0.48 0.7489
RutileSurface coating 2 2826.74 1413.37 12.59 0.0004Concentration 2 5380.07 2690.04 23.95 <0.0001Surface coating-concentration 4 1483.93 370.98 3.30 0.0339
57J O U R N A L O F E N V I R O N M E N T A L S C I E N C E S 4 2 ( 2 0 1 6 ) 5 0 – 6 0
photoactivity of anatase, while largely decreasing that ofrutile. This hypothesis was then tested with the followinginvestigations on the production of superoxide and hydroxylradicals upon light activation.
Upon light excitation, excited HA (HA*) transfers electrons(e−) into the conduction band (CB) of TiO2. Meanwhile, e− alsotransfer back to oxidized HA (HAox), making a looping cycle.Subsequently, injected e− lead to the formation of superoxide(O2
U−). Hydroxyl radicals (UOH) react with HA, resulting in thegeneration of humic acid radicals (HAU), which further promotethe production of O2
U−. The production of O2U− and UOH is affected
by the balance of HA-photosensitization-light-blocking on thesurface of TiO2 nanoparticles.
2.3. Measurement of reactive oxygen species
ROS is regarded as the critical factor in causing nanotoxicity bydisturbing physiological redox-regulated functions, resultingin cellular damage, and death (Fu et al., 2014; He et al., 2014b).In this study, we first measured the generation of hydroxylradicals. As we expected, rutile generated much more UOHthan anatase at the same concentration (Fig. 7). It is also notedthat the generation of UOH by RHA50 and RHA200 decreased by43% and 4% compare to uncoated rutile at 10 ppm (p < 0.05),respectively. Similarly, the generation of •OH by AHA50 andAHA200 was 30% and 27% lower than that of uncoated anatseat 10 ppm (p < 0.05), respectively. The results disagreewith theLC50 values reported in Table 2, but support our hypothesis.
VB
CB
Rutile
Anatase
2.31
eV
3.42
eV
e-
e- e- e- e-
e-e-
Reduction
h+h+
O2
O2•-
HA+
Fig. 6 – Simulated sunlight-induced HA sensitization and hole scaradicals; CB: conduction band; VB: valence band; HA+: ionized hu
The production of O2U− was then measured for further elab-
oration. As shown in Fig. 8, it was found that the generationof O2
U− by RHA50 and RHA200 decreased slightly, by 2.9% and0.2%, respectively, compared to uncoated rutile at 10 ppm.Opposite to rutile, there was an increase in the O2
U− formation byAHA50 and AHA200 by 2.6% and 1.5%, respectively, comparedto uncoated anatase at 10 ppm. Although the change in thepercentage (%) value was slight, the statistical difference wassignificant for both anatase and rutile (p < 0.05). This alsoexplicitly agrees with our hypothesis.
It is also noteworthy that different pathways of cell deathinduced by TiO2 nanoparticles may also be attributable to ourexperimental results. Braydich-Stolle et al. (2009) reported thatanatase TiO2 nanoparticles induced cell necrosis, while therutile TiO2 nanoparticles initiated apoptosis through forma-tion of ROS. Our data indicate that the generation of O2
U− byuncoated rutile was 4.9% more than that of uncoated anataseat 10 ppm (p < 0.05). Similarly, rutile induced more UOH thananatase at 10 ppm by 3.5% (p < 0.05). Additionally, since rutilegenerated much lower UOH but much higher O2
U− at the LC50
level than did anatase, we can further conclude that O2U− was
themain ROS responsible for the higher toxicity of rutile uponSSL irradiation.
2.4. TEM analysis of nanoparticles—E. coli interaction
The direct contact between nanoparticles and bacteriahas been recognized as an important mechanism in causing
Simulated sunlight
HA/HAox
HA*/HAox
Excitation
e-
e-
Oxidationh+
Injection
HA•
OH-
•OH
venging on TiO2. HA*: excited HA; HAox: oxidized HA; HAU: HAmic acid; HA: humic acid.

0.0
0.5
1.0
1.5
2.0
2.5
3.0
0.0
0.5
1.0
1.5
2.0
2.5
3.0
Abs
orba
nce
260 280 300 320 340 360 380 400 420
Abs
orba
nce
Wavelength (nm)
a
c
Rutile, 1 ppm
Rutile, 5 ppm
Rutile, 10 ppm
RHA50, 1 ppm
RHA50, 5 ppm
RHA50, 10 ppm
RHA200, 1 ppm
RHA200, 5 ppm
RHA200, 10 ppm
Anatase, 10 ppm
Anatase, 100 ppm
Anatase, 200 ppm
AHA50, 10 ppm
AHA50, 100 ppm
AHA50, 200 ppm
AHA200, 10 ppm
AHA200, 100 ppm
AHA200, 200 ppm
260 280
260 2802.5
3.0
2.5
3.0
b
d
Fig. 8 – Superoxide (O2U−) generated by (a) rutile and (c) anatase
TiO2 nanoparticles. Inserts (b) and (d) are enlargements ofabsorbance peak portion of (a) and (c), respectively.
0
1000
2000
3000
4000
5000
6000
Fluo
resc
ense
inte
nsity
(co
unts
/sec
)Fl
uore
scen
se in
tens
ity (
coun
ts/s
ec)
350 400 450 500 550 600
0
10000
20000
30000
40000
50000
Wavelength (nm)
Rutile, 1 ppmRutile, 5 ppmRutile, 10 ppmRHA50, 1 ppmRHA50, 5 ppmRHA50, 10 ppmRHA200, 1 ppmRHA200, 5 ppmRHA200, 10 ppm
Anatase, 10 ppmAnatase, 100 ppmAnatase, 200 ppmAHA50, 10 ppmAHA50, 100 ppmAHA50, 200 ppmAHA200, 10 ppmAHA200, 100 ppmAHA200, 200 ppm
a
b
Fig. 7 – Hydroxyl radicals (UOH) generated by (a) rutile and(b) anatase TiO2 nanoparticles.
58 J O U R N A L O F E N V I R O N M E N T A L S C I E N C E S 4 2 ( 2 0 1 6 ) 5 0 – 6 0
cellular toxicity (Jiang et al., 2009). TEM micrographs ofnanoparticles—E. coli interactions are shown in Fig. 9. Theattachment of nanoparticles onto the surface of E. coliindicated that there were no preferred sites or arrangements.We did not observe nanoparticles forming any coating on thewhole bacterial cells. Intriguingly, all HA coated nanoparticles,including both anatase and rutile, weremore likely to attach tobacterial cells, though aggregates were also formed. Unlikeuncoated TiO2, the ones coated with HA were rarely found inother areas except the bacterial surface. Although the numberof nanoparticles attached to the bacterial surface is hard toquantify, we noticed that there were more rutile attached tothe surface of E. coli. This factmay also contribute to the highertoxicity of rutile nanoparticles.
In addition, we also investigated the attachment of TiO2
nanoparticles onto bacteria in the presence of free HA (Fig. S9).It is clear that TiO2 nanoparticles randomly scattered all overthe grid, in the meantime, attached onto bacterial surface,suggesting that free HA didn't enhance the attachment ofnanoparticles as coated HA did. Furthermore, in our previouspublication we reported that TiO2 could pass through cellwalls and penetrate the cell membrane, finally entering intothe bacterial cell (Pathakoti et al., 2013) and zebrafish cells (Heet al., 2014a). We also observed similar results in this study,
but no significant difference between anatase and rutile.However, the damage caused by oxidative stress is not solelydependent upon cellular uptake (Heinlaan et al., 2008). Thus,the gathering and attachment of nanoparticles surroundingbacterial surfaces per se, may be powerful enough to produceROS and induce oxidative stress, leading to cellular damageand destruction upon light irradiation.
3. Conclusion
In summary, while both types of the studied TiO2 nanoparti-cles were non-toxic in the absences of light, rutile was moretoxic to E. coli than anatase under SSL. Data suggested that theextreme low band gap of rutile might contribute to its higherSSL-induced activity and toxicity. Humic acid (HA) coatingsubstantially altered the photoactivity and phototoxicity ofboth anatase and rutile TiO2 nanoparticles. Clearly, surface-bound HA increased the toxicity of anatase but decreased thatof rutile, and exhibited the highest impact at coating per-centage of 0.4–0.5%. Analysis results of reactive oxygenspecies (ROS) implied that superoxide (O2
U−) was the mainROS that accounted for higher toxicity of rutile in this study.With HA coating, a pronounced decrease of hydroxyl radicals

a1a
b1b
c1c
d1d
e1e
f1f
Fig. 9 – Typical TEMmicrographs of nanoparticles—E. coli interaction. (a–c) Anatase, AHA50, AHA200, magnification at 40,000×,60,000×, 40,000×, respectively; (d–f) rutile, RHA50, RHA200, magnification at 40,000×, 40,000×, 25,000×, respectively.(a1–c1) and (d1–f1) were enlarged micrographs of the rectangular region in (a–c) and (d–f), magnification at 100,000×, 120,000×,100,000×, 100,000×, 100,000×, 60,000×, respectively. Red arrow heads indicate where nanoparticles were attached onto E. coli.
59J O U R N A L O F E N V I R O N M E N T A L S C I E N C E S 4 2 ( 2 0 1 6 ) 5 0 – 6 0
(UOH) and O2U− in rutile, a decrease of UOH in anatase and an
increase of O2U− in anatase were observed. Finally, TEM analysis
revealed the attachment and invasion of nanoparticles into E.coli, with a more profound invasion by rutile. In conclusion,from the results of the present study, it is clear that thephotocatalytic behavior and toxicological profile of rutile differfrom that of anatase TiO2 nanoparticles (~30 nm) under SSLirradiation. Studies on nano-bio-eco interactions are urgentlyneeded, with emphases on physicochemical properties of TiO2
nanoparticles and their interactions with DOM and aquaticbiota.
Acknowledgments
The study is supported in part by the NSF-REU program(National Science Foundation-Research Experiences for Un-dergraduates, No. #CHE-1156111) and the NSF-CREST program(National Science Foundation-Centers of Research Excellencein Science and Technology, No. #HRD-0833178). We sincerelythank the technical support from Mississippi State ChemicalLaboratory, Mississippi State University for TOC analysis, andSchool of Polymers and High Performance Materials, theUniversity of Southern Mississippi for SEM, EDX, and XRDcharacterization.
Appendix A. Supplementary data
Supplementary data to this article can be found online athttp://dx.doi.org/10.1016/j.jes.2015.05.028.
R E F E R E N C E S
Bar-Ilan, O., Louis, K.M., Yang, S.P., Pedersen, J.A., Hamers, R.J.,Peterson, R.E., et al., 2012. Titanium dioxide nanoparticlesproduce phototoxicity in the developing zebrafish.Nanotoxicology 6 (6), 670–679.
Boxall, A.B., Tiede, K., Chaudhry, Q., 2007. Engineerednanomaterials in soils and water: how do they behave andcould they pose a risk to human health? Nanomedicine 2 (6),919–927.
Braydich-Stolle, L.K., Schaeublin, N.M., Murdock, R.C., Jiang, J.,Biswas, P., Schlager, J.J., et al., 2009. Crystal structure mediatesmode of cell death in TiO2 nanotoxicity. J. Nanoparticle Res. 11(6), 1361–1374.
Chen, X.B., Mao, S.S., 2007. Titanium dioxide nanomaterials:synthesis, properties, modifications, and applications. Chem.Rev. 107 (7), 2891–2959.
Chen, X.D., Wang, Z., Liao, Z.F., Mai, Y.L., Zhang, M.Q., 2007. Rolesof anatase and rutile TiO2 nanoparticles in photooxidation ofpolyurethane. Polym. Test. 26 (2), 202–208.
Chen, Q.Q., Yin, D.Q., Zhu, S.J., Hu, X.L., 2012. Adsorption ofcadmium (II) on humic acid coated titanium dioxide. J. ColloidInterface Sci. 367 (1), 241–248.
Cho, Y., Choi, W., 2002. Visible light-induced reactions of humicacids on TiO2. J. Photochem. Photobiol. A 148 (1-3), 129–135.
Cook, S.M., Aker, W.G., Rasulev, B.F., Hwang, H.-M.,Leszczynski, J., Jenkins, J.J., et al., 2010. Choosing safedispersing media for C60 fullerenes by using cytotoxicitytests on the bacterium Escherichia coli. J. Hazard. Mater. 176(1-3), 367–373.
De Angelis, F., Fantacci, S., Selloni, A., Nazeeruddin, M.K., Grätzel,M., 2007. Time-dependent density functional theoryinvestigations on the excited states of Ru (II)-dye-sensitizedTiO2 nanoparticles: the role of sensitizer protonation. J. Am.Chem. Soc. 129 (46), 14156–14157.

60 J O U R N A L O F E N V I R O N M E N T A L S C I E N C E S 4 2 ( 2 0 1 6 ) 5 0 – 6 0
Fu, P.P., Xia, Q.S., Hwang, H.M., Ray, P.C., Yu, H.T., 2014.Mechanisms of nanotoxicity: generation of reactive oxygenspecies. J. Food Drug Anal. 22 (1), 64–75.
Goto, H., Hanada, Y., Ohno, T., Matsumura, M., 2004. Quantitativeanalysis of superoxide ion and hydrogen peroxide producedfrom molecular oxygen on photoirradiated TiO2 particles.J. Catal. 225 (1), 223–229.
Guichard, Y., Schmit, J., Darne, C., Gaté, L., Goutet, M., Rousset, D.,et al., 2012. Cytotoxicity and genotoxicity of nanosized andmicrosized titanium dioxide and iron oxide particles in Syrianhamster embryo cells. Ann. Occup. Hyg. 56 (5), 631–644.
He, X., Aker, W.G., Leszczynski, J., Hwang, H.M., 2014a. Using aholistic approach to assess the impact of engineerednanomaterials inducing toxicity in aquatic systems. J. FoodDrug Anal. 22 (1), 128–146.
He, X.J., Aker, W.G., Hwang, H.M., 2014b. An in vivo study on thephoto-enhanced toxicities of S-doped TiO2 nanoparticles tozebrafish embryos (Danio rerio) in terms of malformation,mortality, rheotaxis dysfunction, and DNA damage.Nanotoxicology 8 (S1), 185–195.
Heinlaan, M., Ivask, A., Blinova, I., Dubourguier, H.C., Kahru, A.,2008. Toxicity of nanosized and bulk ZnO, CuO, TiO2 to bacteriaVibrio fischeri, crustaceans Daphnia magna, Thamnocephalusplatyurus. Chemosphere 71 (7), 1308–1316.
Ishibashi, K.-I., Fujishima, A., Watanabe, T., Hashimoto, K., 2000.Quantum yields of active oxidative species formed on TiO2
photocatalyst. J. Photochem. Photobiol. A 134 (1-2), 139–142.Jiang, W., Mashayekhi, H., Xing, B.S., 2009. Bacterial toxicity
comparison between nano-and micro-scaled oxide particles.Environ. Pollut. 157 (5), 1619–1625.
Kakinoki, K., Yamane, K., Teraoka, R., Otsuka, M., Matsuda, Y.,2004. Effect of relative humidity on the photocatalytic activityof titanium dioxide and photostability of famotidine. J. Pharm.Sci. 93 (3), 582–589.
Kavei, G., Nakaruk, A., Sorrell, C.C., 2011. Equilibrium state ofanatase to rutile transformation for titanium dioxide filmprepared by ultrasonic spray pyrolysis technique. Mater. Sci.Appl. 2 (6), 700–705.
Kwon, S., Fan, M., Cooper, A.T., Yang, H., 2008. Photocatalyticapplications of micro-and nano-TiO2 in environmentalengineering. Crit. Rev. Environ. Sci. Technol. 38 (3), 197–226.
Lin, D.H., Ji, J., Long, Z.F., Yang, K., Wu, F.C., 2012. The influence ofdissolved and surface-bound humic acid on the toxicity of TiO2
nanoparticles to Chlorella sp. Water Res. 46 (14), 4477–4487.Lipovsky, A., levitski, L., Tzitrinovich, Z., Gedanken, A., Lubart, R.,
2012. The different behavior of rutile and anatase nanoparti-cles in forming oxy radicals upon illumination with visiblelight: An EPR study. Photochem. Photobiol. 88 (1), 14–20.
Luttrell, T., Halpegamage, S., Tao, J., Kramer, A., Sutter, E., Batzill,M., 2014. Why is anatase a better photocatalyst thanrutile?— Model studies on epitaxial TiO2 films. Sci. Rep. 4(4043), 1–8.
Meyer, G.J., 1997. Efficient light-to-electrical energy conversion:nanocrystalline TiO2 filmsmodified with inorganic sensitizers.J. Chem. Educ. 76 (6), 652–656.
Numano, T., Xu, J., Futakuchi, M., Fukamachi, K., Alexander, D.B.,Furukawa, F., et al., 2014. Comparative study of toxic effects ofanatase and rutile type nanosized titanium dioxide particles invivo and in vitro. Asian Pac. J. Cancer Prev. 15 (2), 929–935.
Pathakoti, K., Morrow, S., Han, C., Pelaez, M., He, X., Dionysiou,D.D., et al., 2013. Photo-inactivation of Escherichia coli by sulfur,nitrogen-fluorine-codoped TiO2 nanoparticles under solarsimulated light, visible light irradiation. Environ. Sci. Technol.47 (17), 9988–9996.
Persson, P., Bergström, R., Lunell, S., 2000. Quantum chemicalstudy of photoinjection processes in dye-sensitized TiO2
nanoparticles. J. Phys. Chem. B 104 (44), 10348–10351.Ryu, J., Choi, W., 2004. Effects of TiO2 surface modifications on
photocatalytic oxidation of arsenite: the role of superoxides.Environ. Sci. Technol. 38 (10), 2928–2933.
Sayes, C.M., Wahi, R., Kurian, P.A., Liu, Y., West, J.L., Ausman, K.D.,et al., 2006. Correlating nanoscale titania structure withtoxicity: a cytotoxicity and inflammatory response study withhuman dermal fibroblasts and human lung epithelial cells.Toxicol. Sci. 92 (1), 174–185.
Selli, E., Baglio, D., Montanarella, L., Bidoglio, G., 1999. Role ofhumic acids in the TiO2-photocatalyzed degradation oftetrachloroethene in water. Water Res. 33 (8), 1827–1836.
Sharma, V.K., 2009. Aggregation and toxicity of titanium dioxidenanoparticles in aquatic environment— a review. J. Environ.Sci. Health A 44 (14), 1485–1495.
Tayade, R.J., Surolia, P.K., Kulkarni, R.G., Jasra, R.V., 2007.Photocatalytic degradation of dyes and organic contaminantsin water using nanocrystalline anatase and rutile TiO2. Sci.Technol. Adv. Mater. 8 (6), 455–462.
Wang, G.-S., Hsieh, S.-T., Hong, C.-S., 2000. Destruction of humicacid in water by UV light-catalyzed oxidation with hydrogenperoxide. Water Res. 34 (15), 3882–3887.
Warheit, D.B., 2008. How meaningful are the results ofnanotoxicity studies in the absence of adequate materialcharacterization? Toxicol. Science 101 (2), 183–185.
Westerhoff, P., Mezyk, S.P., Cooper, W.J., Minakata, D., 2007.Electron pulse radiolysis determination of hydroxyl radicalrate constants with Suwannee River fulvic acid and otherdissolved organic matter isolates. Environ. Sci. Technol. 41(13), 4640–4646.
Yang, K., Xing, B.S., 2009. Sorption of phenanthrene by humicacid-coated nanosized TiO2, ZnO. Environ. Sci. Technol. 43 (6),1845–1851.
Yang, S.P., Bar-Ilan, O., Peterson, R.E., Heideman, W., Hamers, R.J.,Pedersen, J.A., 2013. Influence of humic acid on titaniumdioxide nanoparticle toxicity to developing zebrafish. Environ.Sci. Technol. 47 (9), 4718–4725.
Yu, J.G., Dai, G.P., Huang, B.B., 2009. Fabrication and characterizationof visible-light-driven plasmonic photocatalyst Ag/AgCl/TiO2
nanotube arrays. J. Phys. Chem. C 113 (37), 16394–16401.

J O U R N A L O F E N V I R O N M E N T A L S C I E N C E S 4 2 ( 2 0 1 6 ) 6 1 – 7 0
Ava i l ab l e on l i ne a t www.sc i enced i r ec t . com
ScienceDirect
www. jou rna l s . e l sev i e r . com/ j es
Evaluation of drinking water treatment combined filterbackwash water recycling technology based on comet andmicronucleus assay
Ting Chen, Yongpeng Xu⁎, Zhiquan Liu, Shijun Zhu, Wenxin Shi, Fuyi Cui⁎
State Key Laboratory of UrbanWater Resource andEnvironment, Harbin Institute of Technology, Harbin 150090, China.E-mail:[email protected] of Municipal and Environmental Engineering, Harbin Institute of Technology, Harbin 150090, China
A R T I C L E I N F O
⁎ Corresponding authors. E-mail: xuyongpeng
http://dx.doi.org/10.1016/j.jes.2015.05.0201001-0742 © 2015 The Research Center for Ec
A B S T R A C T
Article history:Received 22 March 2015Revised 23 April 2015Accepted 8 May 2015Available online 4 August 2015
Based on the fact that recycling of combined filter backwash water (CFBW) directly todrinking water treatment plants (WTP) is considered to be a feasible method to enhancepollutant removal efficiency, we were motivated to evaluate the genotoxicity of watersamples from two pilot-scale drinking water treatment systems, one with recycling ofcombined backwash water, the other one with a conventional process. An integratedapproach of the comet and micronucleus (MN) assays was used with zebrafish (Daniorerio) to investigate the water genotoxicity in this study. The total organic carbon (TOC),dissolved organic carbon (DOC), and trihalomethane formation potential (THMFP), ofthe recycling process were lower than that of the conventional process. All the resultsshowed that there was no statistically significant difference (P > 0.05) between theconventional and recycling processes, and indicated that the genotoxicity of watersamples from the recycling process did not accumulate in 15 day continuous recyclingtrial. It was worth noting that there was correlation between the concentrations of TOC,DOC, UV254, and THMFPs in water and the DNA damage score, with corresponding R2
values of 0.68, 0.63, 0.28, and 0.64. Nevertheless, both DNA strand breaks and MNfrequency of all water samples after disinfection were higher than that of water samplesfrom the two treatment units, which meant that the disinfection by-products (DBPs)formed by disinfection could increase the DNA damage. Both the comet and MN testssuggest that the recycling process did not increase the genotoxicity risk, compared tothe traditional process.© 2015 The Research Center for Eco-Environmental Sciences, Chinese Academy of Sciences.
Published by Elsevier B.V.
Keywords:Combined filter backwash waterDrinking water treatmentGenotoxicityComet assayMicronucleus
Introduction
For low turbidity water, the removal ability for particulates isweaker during the traditional coagulation process comparedto high turbidity water, due to the relatively slow hydrolysis
@hit.edu.cn (Y. Xu), hit_c
o-Environmental Science
of coagulant, stronger water viscosity and slower settlingvelocity of flocs (Xiao et al., 2009). Consequently, the corre-sponding chemical stability of the effluent could be reduceddramatically. Based on this phenomenon, recycling of thecombined filter backwash water from WTP was proposed as a
[email protected] (F. Cui).
s, Chinese Academy of Sciences. Published by Elsevier B.V.

62 J O U R N A L O F E N V I R O N M E N T A L S C I E N C E S 4 2 ( 2 0 1 6 ) 6 1 – 7 0
novel method to improve the traditional treatment technol-ogy for treating low turbidity water. Some previous studiesexplored the removal efficiency of organics, Giardia cysts andCryptosporidium oocysts, and some routinely determinedparameters to evaluate the water quality safety after recyclingof sludge (Cornwell and Lee, 1994a; Cornwell et al., 1987;Walsh and Gagnon, 2006). Gottfried et al. (Gottfried et al., 2008)stated that the addition of reused backwash water solids wasbeneficial in increasing the collision and adhesion probabili-ties of suspended particles to further enhance the traditionaltreatment technology, and notably higher removal efficiencyfor DOC and UV254 was found, when the raw water blendedwith 5% and 10% by volume of filter backwash water wasre-input into the conventional drinking water treatment. Xuet al. (2009) and Zhou et al. (2012) thought that the remainingamorphous aluminum and ferric hydroxide in the wastesludge probably did not fully react during the traditional pro-cess, and thus could be used as aggregated cores in therecycling process, enhancing the collision probabilities amongparticles. According to other studies, the removal of Crypto-sporidium oocysts could be enhanced by 4.3%–20% whenuntreated filter backwash water was recycled to the input ofthe coagulation process (Cornwell and Lee, 1994; Cornwell etal., 1987; Cristale et al., 2013). As mentioned above, recyclingCFBW is a feasible practice, and there may be optimumoperating conditions and water quality ranges with regard tothe recycling process, which can not only improve thecoagulation efficiency for treating low turbidity water, butalso save water resources and the cost of coagulants.However, some unknown toxic substances may accumulatein the recycling process, and these contaminants mayinfluence the effluent quality, which could pose a potentialthreat to human health on conditions of long-time exposure,owing to waste residuals from CFBW raw water pollution thatcan be produced during drinking water treatment (Buschini etal., 2008). Furthermore, that may be interactive effects amongthe components, although the individual physico-chemicalparameters meet the water quality guidelines (Routledgeet al., 1998). Therefore, toxicity evaluation of the recyclingprocess is a useful tool to determine the comprehensive risk.
To evaluate the toxicity of water samples treated by therecycling process and compare the toxicity of water from twopilot-scale WTP, comet and micronucleus (MN) assays haveproved to be highly sensitive means to detect DNA damagedby a mixture of pollutants (Andrighetti-Fröhner et al., 2006;Biscardi et al., 2003). In fact, genotoxicity has also beenmeasured directly in treated water using in vivo tests withfish, newts, Vicia faba, Allium cepa and so on (Monarca et al.,2004). The comet assay can detect primary DNA lesions (i.e.,single or double strand breaks) by measuring the migration ofDNA fragments from immobilized nuclear DNA (Singh et al.,1988). The MN assay has been extensively used to study theclastogenic effects as micronuclei derived from chromosomebreakages, which in fish and freshwater mussel gill cells havedemonstrated high sensitivity for monitoring surface waterand detecting the genotoxicity of drinking water (Minissi etal., 1998). Some studies have appeared that employed thecomet and MN assays on zebra fish to evaluate the removalefficiency of genotoxicity in the anoxic–oxic process, showinga high incidence of MN frequency when the peripheral
erythrocytes of fish were exposed to pollutants (Zhang et al.,2013). In addition, the MN frequency is associated with cancerprediction (Bolt et al., 2011).
This study was focused on application of a combinedbioassay and chemical analysis approach to evaluate thepotential genotoxicity and water quality risk of water samplestreated by the recycling process in comparison with watersamples treated by a conventional process. Based on this, apilot WTP was constructed to conduct 15-day continuousrecycling trials, and the genotoxicity of different watersamples was assessed by comet and MN assays of zebra fish.
1. Materials and methods
1.1. Pilot-scale experimental setup and physico-chemicalanalysis
1.1.1. Pilot-scale experimental setup and procedureA sketch of the pilot treatment processes is shown in Fig. 1,illustrating the conventional and recycling drinking water treat-ment processes, respectively. The design parameters of therecycling process units were the same as for the conventionalprocess. The influent flow rate was 5 m3/hr. The A unit containstwo parts: one is a grid flocculation tank, with a bottom length of1100 mm, a bottom width of 400 mm and a liquid height of1700 mm, the other is a plate sedimentation tank, with a bottomlength of 2100 mm, a bottom width of 800 mm and a height of1600 mm. The plate component is composed of 63 plates with atilt angle of 60° and interval of 20 mm. The B unit is a rapid filtertank with filtration velocity of 8 m/hr. The recycled sludge wasstored in two custom-built sludge storage tanks, with a diameterof 1500 mmand a height of 1500 mm. The sludge was pumped totheheadof the static pipelinemixer after being completelymixed.The whole process cycle time was 44 min. The WTP wasteresidual was collected in the grid flocculation tank (label A inFig. 1) and rapid sand filter (label B in Fig. 1) of the recyclingprocessevery24 hr, and then thewaste residualwas released to the sludgestorage tank (label E in Fig. 1) and filter backwashwater tank (labelD in Fig. 1), respectively, through a diameter 100 mm PVC pipe.
The water treatment plant (WTP) waste residuals wererecycled from tanks D and E to the head of the staticmixer by aperistaltic pump via a rubber hose of diameter 10 mm andensured that the residual could be completely reused underthe optimal treatment combination. With this method, thispilot plant test was continuously operated for 15 days and theWTPwaste residual could be repeatedly usedmany times untilthe determined parameters exceeded the sanitary standardsfor drinking water of China. To test the water quality stabilityof the recycling process and compare it with the conventionalprocess, the turbidity, TOC, DOC, UV254, SUVA and THMFPs ofwater from different sampling points (label C1, C2, C3, R1, R2,R3 and R4 in Fig. 1) were determined every day. However, forgenotoxicity evaluation, the day 5, day 10, and day 15 werechosen as sampling times.
1.1.2. Coagulant and characterization of drinkingwater treatmentplant (WTP) waste residualsThe polyferric aluminum chloride (PFAC) used was industrialgrade (with content of 8.1% Fe2O3 and 3.3% Al2O3, basicity

A
B
C
EF
D
R4R1
R2
R3
A
B
C
F
C1
C2
C3
P2P1
Liquid chlorine
Liquid chlorine
Raw water 10 m3/hr
Conventional process
Recycling process
5 m3/hr
5 m3/hr
Fig. 1 – Diagram of the pilot-scale drinking water treatment plant. A: grid flocculation tank; B: conventional rapid sand filter; C:clean-water reservoir; D: filter backwashwater tank; E: sludge storage tank; F: dosing pump; C1: effluent of flocculation tank inconventional process; C2: effluent of rapid sand filter in conventional process; C3: effluent after post-disinfection with chlorinedioxide in conventional process; R1: effluent of flocculation tank in recycling process; R2: effluent of rapid sand filter inrecycling process; R3: effluent after post-disinfection with chlorine dioxide in recycling process; R4: blended water originatedfrom raw water, sludge and filter backwash water; P1: backwash water originated from rapid sand filter; P2: sludge originatedfrom Grid flocculation tank.
Table 1 – Source water and water treatment plant wasteresidual characteristics.
Parameter Rawwater
Sedimentationtank sludge
Filterbackwash
water
Turbidity (NTU) 4–7 500–2560 250–460Color (CU) 28–35 350–420 85–160CODMn (mg/L) 5–9 18–35 10–21UV254 (cm−1) 0.065–0.076 0.091–0.298 0.072–0.081TOC (mg/L) 4.4–5.6 4.85–7.2 4.61–5.32DOC (mg/L) 3.85–4.65 4.70–6.01 4.53–5.16Solid content (w%/w%) 0.001–0.006 1.02–3.2 0.02–0.98pH 6.1–8.3 6.1–7.9 6.3–8.1Temperature (°C) 3–10 4–12 4–11Trihalomethanes(THMs) (μg/L)
80–159 142–207 132–221
THMFPs (μg/L) 395–557 438–567 456–630
63J O U R N A L O F E N V I R O N M E N T A L S C I E N C E S 4 2 ( 2 0 1 6 ) 6 1 – 7 0
6.2%, Zibo, China). The source water originated from theNenjiang River was obtained from the intake of Zhongyinwater treatment plant (Daqing, China). The water wascharacterized as typical slightly polluted surface water withlow turbidity and color. The WTP waste residuals were fromthe sedimentation tank sludge and filter backwash water. Thesludge employed in this study was taken from the outlet ofthe Grid flocculation tank, and was seriously contaminatedcompared to the raw water samples, with high TOC andturbidity. The filter backwash water was essentially a low-solids wastewater with organics. The detailed characteristicsof raw water and sludge are shown in Table 1.
1.1.3. Physico-chemical analysisTurbidity was measured with a turbidimeter (HACH2100P,Hach Company, USA) according to US EPA method #180.1.DOC and TOC were analyzed by a TOC analyzer (TOC-VCHP,Shimadzu Corporation, Japan). The UV absorbance at 254 nm(UV254) was determined using a spectrometer (DR5000 UV/VIS,

64 J O U R N A L O F E N V I R O N M E N T A L S C I E N C E S 4 2 ( 2 0 1 6 ) 6 1 – 7 0
Hach Company, USA). Both DOC and UV254 were measuredafter filtration through 0.45 μmmembranes. The solid contentof the recycled sludge was examined following the StandardMethods (APHA, 1995) and the pH was measured by a pHmeter (PHS-3C, Leici Company, China). The THMFP was alsodetermined, as the parameter estimates the expected con-centration of THMs in water samples of conventional andrecycling processes with an excess of free chlorine (APHA,1998).
1.2. Toxicity assay
1.2.1. Genotoxicity assayThe comet and micronucleus assays were employed to assessthe genotoxicity of the conventional and recycling processwater samples. Zebrafish were obtained from a local fishmarket and kept in glass aquaria at 24 ± 2°C with constantaeration and 48 h water changes. The feeding environmenthad a 12:12 (light:dark) photoperiod and the dissolved oxygenin water was above 2 mg/L. Fish were fed with commercialfish food daily. Ten juvenile zebrafish (0.39 ± 0.11 g) wereplaced in 3.5 L glass jars, and each treatment was replicatedthree times; the zebrafish of both sexes (3–5 month(s) old)were exposed for 2 months to test the genotoxicity. Thenegative control (NC) and positive control (PC) groups weremaintained in dechlorinated tap water and potassium dichro-mate (0.02 mg/L) solution, respectively.
1.2.1.1. Comet assay. Single cell gel electrophoresis (SCGE)was employed to detect the DNA strand breaks caused by thechemical material gene toxicity. Blood samples were obtainedby puncture of the peripheral erythrocytes of fish, andimmediately injected into a micro centrifuge tube togetherwith 10 μL heparin sodium and phosphate buffered saline(PBS), and then centrifuged at 2000 r/min for 10 min and usedto obtain a cell suspension (about 106–108 cells/mL). Cellviability ≥ 87% was ensured by evaluation with trypan blue.Rough microscope slides were coated with two layers ofagarose. For the first layer, 0.8% normal melting point (NMP)agarose was spread over the slides and solidified on ice. Thecell suspension was immobilized in 0.7% low melting point(LMP) agarose at a ratio of 1 part cell suspension to three partsLMP agarose and solidified on ice. Afterwards the cellsuspension immobilized in microgel was subjected to incu-bation in 100 mmol/L EDTA, 2.5 M NaCl, 1% Triton X-100 and10% DMSO (pH 13.0) for 1.5 hr in the dark at 4°C. Then themicrogel was submerged in an electrophoretic buffer(300 mmol/L NaOH, 1 mmol/L EDTA at pH > 13) for 20 min tounwind the DNA at 4°C. Finally the microgel was placed intoan electrophoresis chamber containing an electrophoresisbuffer. After electrophoresis in the same buffer at 25 V and300 mA for 20 min, samples were neutralized by incubation in400 mM Tris at pH 7.4 for 2 min. After neutralization (0.4 mol/LTris–HCl, pH 7.5), the slides were stained with 100 μL ethidiumbromide (10 μL/mL) and observed at a magnification of 320×using a fluorescence microscope (BX51/TF, Olympus Company,Japan) equipped with an excitation filter of 518 nm and animage-analysis system with a grey-scale CCD camera andComet 3.0 software (Kinetic Images, Liverpool, UK). For eachtest, the tail moments of 100 randomly selected cells were
analyzed. Tail moment (tail length multiplied by the fraction ofDNA in the tail) was used as the measure of DNA damage(Peycheva et al., 2014; Singh et al., 1988).
1.2.1.2. Micronucleus assay. For the MN assay, the zebrafishperipheral blood sample was dropped onto clean slidescontaining fetal bovine serum and dried. Then the bloodcells were fixed in methanol for 20 min and dried at roomtemperature. Afterwards the slides were stained with Giemsasolution (Nanjing Jiancheng, China) in phosphate buffersolution (PBS, pH 6.8) for 15 min, then washed with PBS, anddried at room temperature before microscopic analysis. TheMN frequency was determined to evaluate the genotoxicity(Al-Sabti and Metcalfe, 1995; Arkhipchuk and Garanko, 2005).
2. Results and discussion
2.1. Water sample quality analysis
Both TOC and DOC are important surrogate parameters thatcan represent the content of organic matter in drinking watertreatment. As is well known, organics are potential threats tohuman health and are difficult to remove by the conventionaltreatment process. Chlorine is the most extensively useddisinfectant in China, and disinfection by-products (DBPs) isproduced when the chlorine reacts with organics, such ashumic and fulvic acids. With the purpose of evaluating thecoagulation performance of the recycling process and inves-tigating the variation of DBP concentration in water samplescollected from each treatment unit, the THMFPs weredetermined. In addition, the traditional parameters TOC andDOC were also monitored during the whole process. Thewater quality parameters of the different treatment units areillustrated in Fig. 2. It can be seen that the average removalefficiencies of TOC, DOC, and THMFPs between the recyclingprocess and conventional processes in the coagulation/flocculation units are 34.8% and 29.3%, 25.7% and 21.5%, and18.9% and 17.2%, respectively. The mean concentrations ofTOC (3.79 mg/L), DOC (3.42 mg/L), and THMFPs (362.3 μg/L) inthe filter units of the recycling process were less than those ofthe conventional process, where the corresponding TOC, DOC,and THMFP values are 3.91 m, 3.65, and 385.7 μg/L, respec-tively. Compared with the effluent from the rapid sand filter,there was no significant removal of TOC, DOC and THMFPsafter disinfection in the two WTPs. The results appeared toshow that the sludge recycling process did not exacerbate thewater quality; in contrast to the conventional process, theremoval efficiency for organic matters was clearly improved.
2.2. Genotoxicity assays
2.2.1. Comet assayThe comet assay is widely used to detect DNA damage, whichincludes single-strand breaks, double-strand breaks, andincomplete excision repair sites (Shi et al., 2009). To a certainextent, comet assays can represent the presence of genotoxiccompounds in water. The water samples from every stage ofthe conventional and recycling process were evaluated bycomet assay (tail moment), and the results are demonstrated

3.0
3.5
4.0
4.5
5.0
5.5
Raw water C1 R1
3.6
3.9
4.2
4.5
4.8
5.1
300
350
400
450
500
550
3.0
3.5
4.0
4.5
5.0
5.5
C2 R2
DO
C
mg/
L
TO
C
mg/
L
3.2
3.6
4.0
4.4
4.8
5.2
300
350
400
450
500
550
TH
MFP
s (µ
g/L
)
3.0
3.5
4.0
4.5
5.0
5.5
C3 R3
Time (days)Time (days)Time (days)
3.2
3.6
4.0
4.4
4.8
5.2
0 2 8 10 12 14 16 0 2 8 10 12 14 16 0 24 6 4 6 4 6 8 10 12 14 16300
350
400
450
500
550Wat
er f
low
dir
ectio
n
Flocculation
Filter
Disinfection
The continuous recycle trials were conducted for 15 days
Fig. 2 – Concentration of TOC, DOC, and THMFPs in water sample treated by recycling and conventional process during 15 daycontinuous trials. C1–C3 and R1–R3 refer to the caption of Fig. 1.
65J O U R N A L O F E N V I R O N M E N T A L S C I E N C E S 4 2 ( 2 0 1 6 ) 6 1 – 7 0
in Fig. 3. All the water samples showed significant differencescompared with the NC. The effluent genotoxicity of the gridflocculation unit (C1, R1) was not remarkably reduced incomparison with raw water from the two drinking water
0
1
2
3
4
5
617
18
19
* **
**
*********
***
*
*****
Tai
l mom
ent (
µm)
Negative controlPositive controlRaw waterC1 C2
C3 R1 R2 R3 R4
Control Day 5 Day 10 Day 15
*a bc a bcd
ef de f gh i
gh
i
Fig. 3 – Comet assay on zebra fish of drinking water sampledat different points of plants between conventional andrecycling process. Statistical analysis was performed usingStudent's t-test after ANOVA for the Tail moment. Data arepresented asmean ± SD (n = 3). * P < 0.05 compared with NC;the same letter (i.e., a–i) at P > 0.05 compared with thecounterpart of treatment units at different sampling times.
treatments during the 15 day continuous trials. However, theeffluent genotoxicity of effluent from the conventional rapidsand filter (C2, R2) was approximately 2–3 times lower thanthat of raw water. The results are probably due to the fact thata large number of particles coated with natural organic matter(NOM) were present in the flocculation effluent, hence theNOM was removed from water along with particles in thefilter unit.
Considering the tail moment, C1–C3 and R1–R3 correspondto the conventional and recycling processes, respectively.Clearly, there were no significant differences (P > 0.5) for thethree sampling times, suggesting that genotoxic compoundsdid not accumulate during the recycling process. It was worthnoting that the genotoxicity of C3, R3, and R4 was higher thanfor other sample points. After blending raw water, filterbackwash water and sludge, a great quantity of pollutantswas imported in the recycling process, resulting in highercontent of genotoxic compounds in R4.
Table 2 shows the degree of DNA damage in zebra fishperipheral blood, according to tail intensity, which wasclassified into five levels of 0, 1, 2, 3, or 4 (from undamaged 0to maximally damaged 4), arbitrary units (AU) were used toexpress the extent of DNA damage and were calculated asshown below (Zhong et al., 2001).
AU ¼X4
i¼0Ni� i
where, Ni is the number of cells with degree I, i is the damagedegree (0, 1, 2, 3, 4).
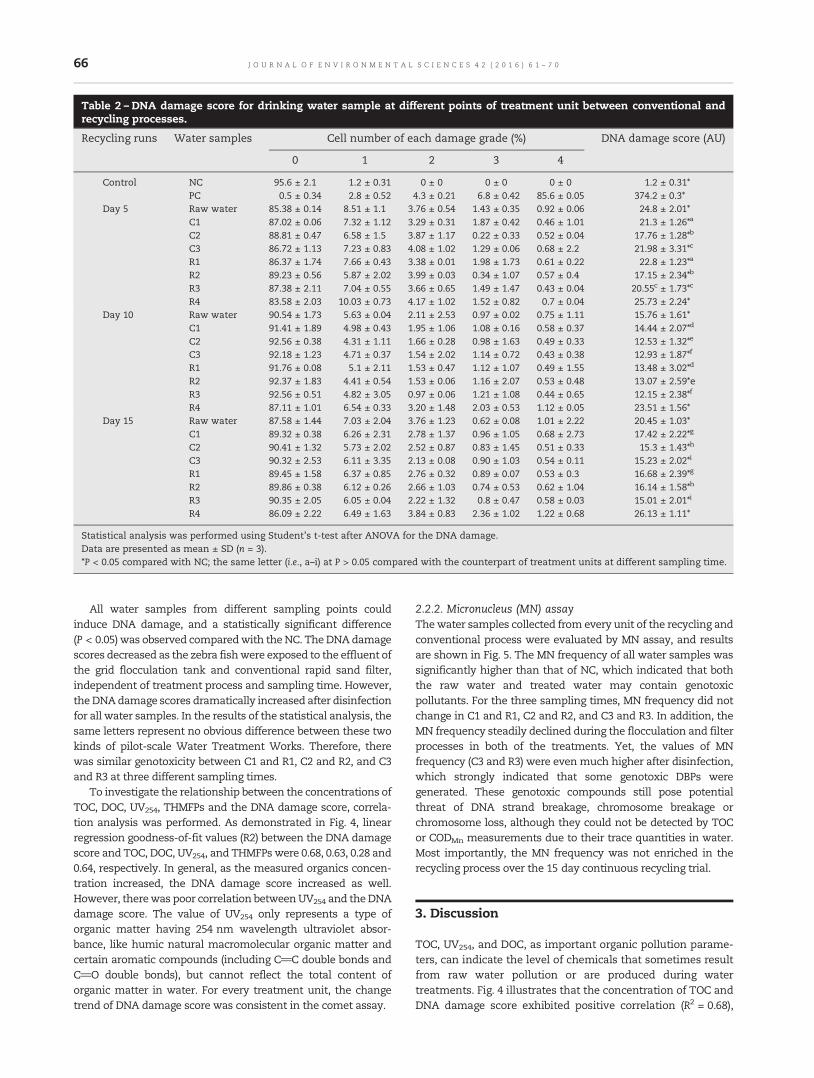
Table 2 – DNA damage score for drinking water sample at different points of treatment unit between conventional andrecycling processes.
Recycling runs Water samples Cell number of each damage grade (%) DNA damage score (AU)
0 1 2 3 4
Control NC 95.6 ± 2.1 1.2 ± 0.31 0 ± 0 0 ± 0 0 ± 0 1.2 ± 0.31*PC 0.5 ± 0.34 2.8 ± 0.52 4.3 ± 0.21 6.8 ± 0.42 85.6 ± 0.05 374.2 ± 0.3*
Day 5 Raw water 85.38 ± 0.14 8.51 ± 1.1 3.76 ± 0.54 1.43 ± 0.35 0.92 ± 0.06 24.8 ± 2.01*C1 87.02 ± 0.06 7.32 ± 1.12 3.29 ± 0.31 1.87 ± 0.42 0.46 ± 1.01 21.3 ± 1.26*a
C2 88.81 ± 0.47 6.58 ± 1.5 3.87 ± 1.17 0.22 ± 0.33 0.52 ± 0.04 17.76 ± 1.28*b
C3 86.72 ± 1.13 7.23 ± 0.83 4.08 ± 1.02 1.29 ± 0.06 0.68 ± 2.2 21.98 ± 3.31*c
R1 86.37 ± 1.74 7.66 ± 0.43 3.38 ± 0.01 1.98 ± 1.73 0.61 ± 0.22 22.8 ± 1.23*a
R2 89.23 ± 0.56 5.87 ± 2.02 3.99 ± 0.03 0.34 ± 1.07 0.57 ± 0.4 17.15 ± 2.34*b
R3 87.38 ± 2.11 7.04 ± 0.55 3.66 ± 0.65 1.49 ± 1.47 0.43 ± 0.04 20.55c ± 1.73*c
R4 83.58 ± 2.03 10.03 ± 0.73 4.17 ± 1.02 1.52 ± 0.82 0.7 ± 0.04 25.73 ± 2.24*Day 10 Raw water 90.54 ± 1.73 5.63 ± 0.04 2.11 ± 2.53 0.97 ± 0.02 0.75 ± 1.11 15.76 ± 1.61*
C1 91.41 ± 1.89 4.98 ± 0.43 1.95 ± 1.06 1.08 ± 0.16 0.58 ± 0.37 14.44 ± 2.07*d
C2 92.56 ± 0.38 4.31 ± 1.11 1.66 ± 0.28 0.98 ± 1.63 0.49 ± 0.33 12.53 ± 1.32*e
C3 92.18 ± 1.23 4.71 ± 0.37 1.54 ± 2.02 1.14 ± 0.72 0.43 ± 0.38 12.93 ± 1.87*f
R1 91.76 ± 0.08 5.1 ± 2.11 1.53 ± 0.47 1.12 ± 1.07 0.49 ± 1.55 13.48 ± 3.02*d
R2 92.37 ± 1.83 4.41 ± 0.54 1.53 ± 0.06 1.16 ± 2.07 0.53 ± 0.48 13.07 ± 2.59*eR3 92.56 ± 0.51 4.82 ± 3.05 0.97 ± 0.06 1.21 ± 1.08 0.44 ± 0.65 12.15 ± 2.38*f
R4 87.11 ± 1.01 6.54 ± 0.33 3.20 ± 1.48 2.03 ± 0.53 1.12 ± 0.05 23.51 ± 1.56*Day 15 Raw water 87.58 ± 1.44 7.03 ± 2.04 3.76 ± 1.23 0.62 ± 0.08 1.01 ± 2.22 20.45 ± 1.03*
C1 89.32 ± 0.38 6.26 ± 2.31 2.78 ± 1.37 0.96 ± 1.05 0.68 ± 2.73 17.42 ± 2.22*g
C2 90.41 ± 1.32 5.73 ± 2.02 2.52 ± 0.87 0.83 ± 1.45 0.51 ± 0.33 15.3 ± 1.43*h
C3 90.32 ± 2.53 6.11 ± 3.35 2.13 ± 0.08 0.90 ± 1.03 0.54 ± 0.11 15.23 ± 2.02*i
R1 89.45 ± 1.58 6.37 ± 0.85 2.76 ± 0.32 0.89 ± 0.07 0.53 ± 0.3 16.68 ± 2.39*g
R2 89.86 ± 0.38 6.12 ± 0.26 2.66 ± 1.03 0.74 ± 0.53 0.62 ± 1.04 16.14 ± 1.58*h
R3 90.35 ± 2.05 6.05 ± 0.04 2.22 ± 1.32 0.8 ± 0.47 0.58 ± 0.03 15.01 ± 2.01*i
R4 86.09 ± 2.22 6.49 ± 1.63 3.84 ± 0.83 2.36 ± 1.02 1.22 ± 0.68 26.13 ± 1.11*
Statistical analysis was performed using Student's t-test after ANOVA for the DNA damage.Data are presented as mean ± SD (n = 3).*P < 0.05 compared with NC; the same letter (i.e., a–i) at P > 0.05 compared with the counterpart of treatment units at different sampling time.
66 J O U R N A L O F E N V I R O N M E N T A L S C I E N C E S 4 2 ( 2 0 1 6 ) 6 1 – 7 0
All water samples from different sampling points couldinduce DNA damage, and a statistically significant difference(P < 0.05) was observed comparedwith theNC. TheDNAdamagescores decreased as the zebra fishwere exposed to the effluent ofthe grid flocculation tank and conventional rapid sand filter,independent of treatment process and sampling time. However,the DNAdamage scores dramatically increased after disinfectionfor all water samples. In the results of the statistical analysis, thesame letters represent no obvious difference between these twokinds of pilot-scale Water Treatment Works. Therefore, therewas similar genotoxicity between C1 and R1, C2 and R2, and C3and R3 at three different sampling times.
To investigate the relationship between the concentrations ofTOC, DOC, UV254, THMFPs and the DNA damage score, correla-tion analysis was performed. As demonstrated in Fig. 4, linearregression goodness-of-fit values (R2) between the DNA damagescore and TOC, DOC, UV254, and THMFPswere 0.68, 0.63, 0.28 and0.64, respectively. In general, as the measured organics concen-tration increased, the DNA damage score increased as well.However, therewas poor correlation betweenUV254 and theDNAdamage score. The value of UV254 only represents a type oforganic matter having 254 nm wavelength ultraviolet absor-bance, like humic natural macromolecular organic matter andcertain aromatic compounds (including C_C double bonds andC_O double bonds), but cannot reflect the total content oforganic matter in water. For every treatment unit, the changetrend of DNA damage score was consistent in the comet assay.
2.2.2. Micronucleus (MN) assayThewater samples collected from every unit of the recycling andconventional process were evaluated by MN assay, and resultsare shown in Fig. 5. The MN frequency of all water samples wassignificantly higher than that of NC, which indicated that boththe raw water and treated water may contain genotoxicpollutants. For the three sampling times, MN frequency did notchange in C1 and R1, C2 and R2, and C3 and R3. In addition, theMN frequency steadily declined during the flocculation and filterprocesses in both of the treatments. Yet, the values of MNfrequency (C3 and R3) were evenmuch higher after disinfection,which strongly indicated that some genotoxic DBPs weregenerated. These genotoxic compounds still pose potentialthreat of DNA strand breakage, chromosome breakage orchromosome loss, although they could not be detected by TOCor CODMn measurements due to their trace quantities in water.Most importantly, the MN frequency was not enriched in therecycling process over the 15 day continuous recycling trial.
3. Discussion
TOC, UV254, and DOC, as important organic pollution parame-ters, can indicate the level of chemicals that sometimes resultfrom raw water pollution or are produced during watertreatments. Fig. 4 illustrates that the concentration of TOC andDNA damage score exhibited positive correlation (R2 = 0.68),
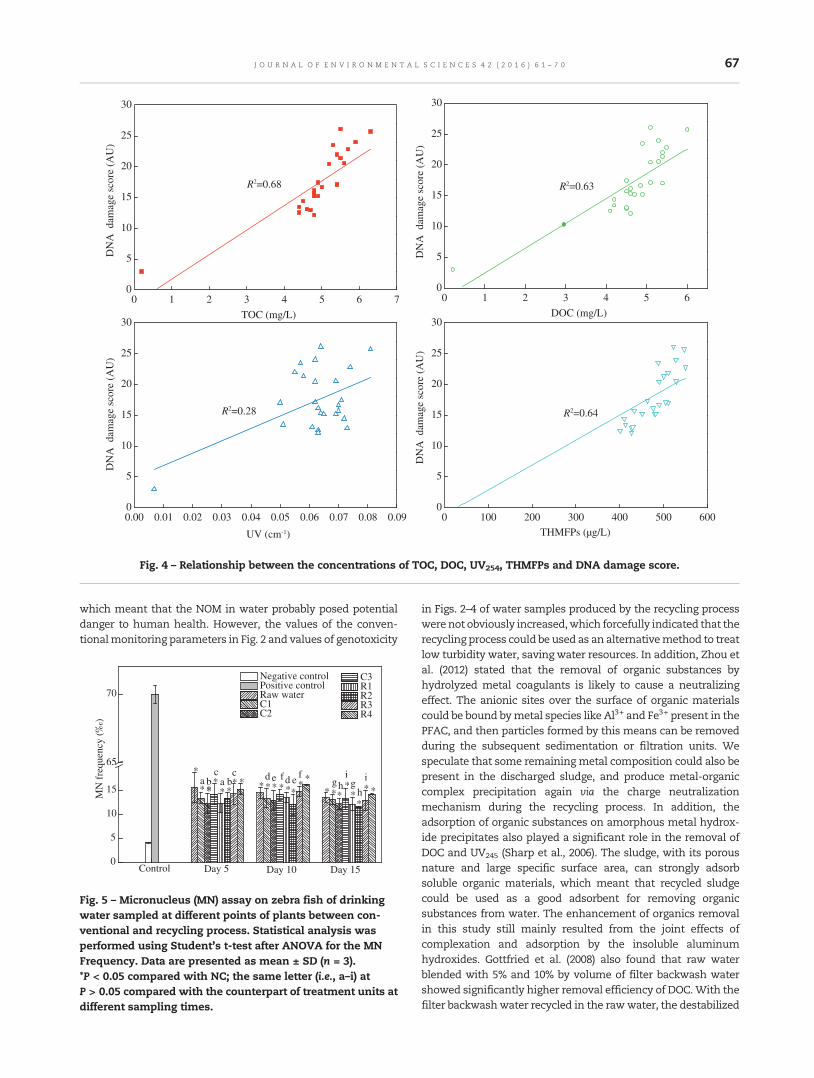
0
5
10
15
20
25
30D
NA
dam
age
scor
e (A
U)
DN
A d
amag
e sc
ore
(AU
)
DN
A d
amag
e sc
ore
(AU
)D
NA
dam
age
scor
e (A
U)
TOC (mg/L)
R2=0.68
R2=0.28 R2=0.64
R2=0.63
0
5
10
15
20
25
30
DOC (mg/L)
0
5
10
15
20
25
30
UV (cm-1)
0 1 2 3 4 5 6 7 0 1 2 3 4 5 6
0.00 0.01 0.02 0.03 0.04 0.05 0.06 0.07 0.08 0.09 0 100 200 300 400 500 6000
5
10
15
20
25
30
THMFPs (µg/L)
Fig. 4 – Relationship between the concentrations of TOC, DOC, UV254, THMFPs and DNA damage score.
67J O U R N A L O F E N V I R O N M E N T A L S C I E N C E S 4 2 ( 2 0 1 6 ) 6 1 – 7 0
which meant that the NOM in water probably posed potentialdanger to human health. However, the values of the conven-tionalmonitoring parameters in Fig. 2 and values of genotoxicity
0
5
10
15
65
70
Negative control Positive control Raw water
C1 C2
C3 R1 R2 R3 R4
**
**
****
**
******
***
**
MN
fre
quen
cy (
‰)
* **
*a b
ca b
c d e f d ef
ghi
gh
i
Control Day 5 Day 10 Day 15
Fig. 5 – Micronucleus (MN) assay on zebra fish of drinkingwater sampled at different points of plants between con-ventional and recycling process. Statistical analysis wasperformed using Student's t-test after ANOVA for the MNFrequency. Data are presented as mean ± SD (n = 3).*P < 0.05 compared with NC; the same letter (i.e., a–i) atP > 0.05 compared with the counterpart of treatment units atdifferent sampling times.
in Figs. 2–4 of water samples produced by the recycling processwere not obviously increased,which forcefully indicated that therecycling process could be used as an alternativemethod to treatlow turbidity water, saving water resources. In addition, Zhou etal. (2012) stated that the removal of organic substances byhydrolyzed metal coagulants is likely to cause a neutralizingeffect. The anionic sites over the surface of organic materialscould be bound bymetal species like Al3+ and Fe3+ present in thePFAC, and then particles formed by this means can be removedduring the subsequent sedimentation or filtration units. Wespeculate that some remainingmetal composition could also bepresent in the discharged sludge, and produce metal-organiccomplex precipitation again via the charge neutralizationmechanism during the recycling process. In addition, theadsorption of organic substances on amorphous metal hydrox-ide precipitates also played a significant role in the removal ofDOC and UV245 (Sharp et al., 2006). The sludge, with its porousnature and large specific surface area, can strongly adsorbsoluble organic materials, which meant that recycled sludgecould be used as a good adsorbent for removing organicsubstances from water. The enhancement of organics removalin this study still mainly resulted from the joint effects ofcomplexation and adsorption by the insoluble aluminumhydroxides. Gottfried et al. (2008) also found that raw waterblended with 5% and 10% by volume of filter backwash watershowed significantly higher removal efficiency of DOC.With thefilter backwashwater recycled in the rawwater, the destabilized

68 J O U R N A L O F E N V I R O N M E N T A L S C I E N C E S 4 2 ( 2 0 1 6 ) 6 1 – 7 0
particles could appreciably improve the amount of collision siteswith the soluble NOM constituents in the raw water. Thisprocedure may most likely affect the formation of flocs duringthe coagulation and sedimentation stages (Cornwell and Lee,1994). An analysis of the mechanism of organic materialsremoval is shown in Fig. 6.
McCormick et al. (2010) investigated the disinfectionby-product (DBP) concentration and formation potential infilter backwash water (FBWW), and evaluated the impact ofuntreated FBWW recycle on water quality in conventionaldrinking water treatment. They stated that the particulateorganic material contained within FBWW is available forreaction with chlorine to form DBPs; however, blending ofuntreated 10% FBWW with raw water ahead of the rapidmixing stage of the plant's treatment train did not impact DBPconcentrations. In our results, there was no obvious differ-ence in the THMFP concentration in water samples betweenthese two treatment processes, showing that there was noimpact on the effluent treated by the recycling process interms of DBPs. Our results were in accordance with theprevious research. In addition, the only slightly higher con-centrations of TOC, DOC and UV254 in the sedimentation tanksludge and filter backwash water in all cases (in Table 1),illustrated that there was the possibility that organic mate-rials could be released again in water samples after the wastesludge was reused. That is the reason that the genotoxicity ofR4 was significantly higher than other water samples in thesetwo water treatments. Both the comet assay and MN test areconsidered sensitive techniques for evaluating genetic dam-age, which reflect different genetic endpoints in two differentcell populations. The Comet assay is used to detect primaryDNA lesions (i.e., single or double strand breaks), while the MNassay is used to detect structural and numerical chromosomaldamage. Additionally, the comet assay determines strandbreaks and labile sites that are subsequently removed byrepair enzymes (Heuser et al., 2008). In this study, both of the
Low dosage of coagulant
(PFAC)
Amorphous metal hydroxide
Micropores surface with functional groups
Functi
Residual sludge Particlescomplexation
absorption
N
Fig. 6 – Schematic diagram of the interaction between waste resiprocess.
detecting techniques were successfully applied in detectingDNA damage in the two different drinking water treatmentprocesses. The results of the two genotoxicity tests indicatedthat there was no statistically significant difference (P > 0.05)between the conventional and recycling processes (Figs. 3 and5, Table 2), and the genotoxic materials were not accumulatedduring the recycling process over the 15 day continuousrecycling trial.
Furthermore, the results of the comet and MN assaysuggested that the disinfection procedure with liquid chlorineled to the increase of DNA damage for C3 and R3 at threesampling times. Fig. 3 also shows that there was a higherconcentration of THMFPs in raw water, which has greatpotential to produce chloroform after addition of the liquidchlorine to water. These DBPs formed by disinfection couldenhance DNA damage. Moreover, other reports have shownthat DNA strand breaks and MN frequency could increaseafter disinfection, while cell viability would decrease withchanges in oxidative stress potential. (Shi et al., 2009). ManyDBP compounds are produced in chlorination, and isolatedDBPs (i.e., bromo-organic by-products and halonitromethanes)were found to induce DNA damage in Salmonella or inmammalian tests (Richardson et al., 2007). For disinfection ofraw water by peracetic acid, chlorine dioxide or sodiumhypochloride, the comet assay test on both haemolymph ofzebra mussels and human white blood cells showed dramaticseasonal variations in DNA damage capability (Bolognesi etal., 2004; Laffon et al., 2001).
4. Conclusions
The results of this study clearly showed that the recyclingprocess could greatly improve the coagulation efficiency,including organic material removal. The water quality of watersamples treated by the recycling process did not deteriorate in
onal groups
Colloidal hydroxide precipitate
DestabilizationFe
Al
Si
Mn
Ca
Me
OM
dual sludge and organic materials in water during recycling
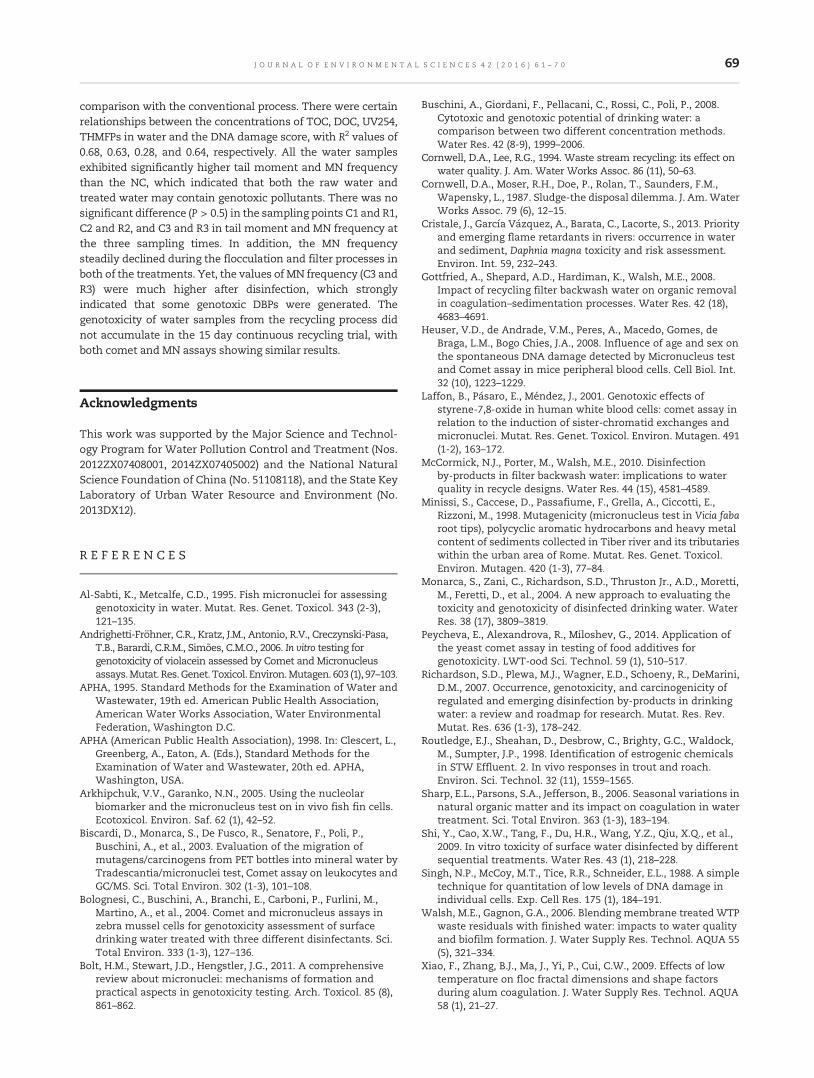
69J O U R N A L O F E N V I R O N M E N T A L S C I E N C E S 4 2 ( 2 0 1 6 ) 6 1 – 7 0
comparison with the conventional process. There were certainrelationships between the concentrations of TOC, DOC, UV254,THMFPs in water and the DNA damage score, with R2 values of0.68, 0.63, 0.28, and 0.64, respectively. All the water samplesexhibited significantly higher tail moment and MN frequencythan the NC, which indicated that both the raw water andtreated water may contain genotoxic pollutants. There was nosignificant difference (P > 0.5) in the sampling points C1 and R1,C2 and R2, and C3 and R3 in tail moment and MN frequency atthe three sampling times. In addition, the MN frequencysteadily declined during the flocculation and filter processes inboth of the treatments. Yet, the values of MN frequency (C3 andR3) were much higher after disinfection, which stronglyindicated that some genotoxic DBPs were generated. Thegenotoxicity of water samples from the recycling process didnot accumulate in the 15 day continuous recycling trial, withboth comet and MN assays showing similar results.
Acknowledgments
This work was supported by the Major Science and Technol-ogy Program for Water Pollution Control and Treatment (Nos.2012ZX07408001, 2014ZX07405002) and the National NaturalScience Foundation of China (No. 51108118), and the State KeyLaboratory of Urban Water Resource and Environment (No.2013DX12).
R E F E R E N C E S
Al-Sabti, K., Metcalfe, C.D., 1995. Fish micronuclei for assessinggenotoxicity in water. Mutat. Res. Genet. Toxicol. 343 (2-3),121–135.
Andrighetti-Fröhner, C.R., Kratz, J.M., Antonio, R.V., Creczynski-Pasa,T.B., Barardi, C.R.M., Simões, C.M.O., 2006. In vitro testing forgenotoxicity of violacein assessed by Comet and Micronucleusassays.Mutat. Res.Genet. Toxicol. Environ.Mutagen. 603 (1), 97–103.
APHA, 1995. Standard Methods for the Examination of Water andWastewater, 19th ed. American Public Health Association,American Water Works Association, Water EnvironmentalFederation, Washington D.C.
APHA (American Public Health Association), 1998. In: Clescert, L.,Greenberg, A., Eaton, A. (Eds.), Standard Methods for theExamination of Water and Wastewater, 20th ed. APHA,Washington, USA.
Arkhipchuk, V.V., Garanko, N.N., 2005. Using the nucleolarbiomarker and the micronucleus test on in vivo fish fin cells.Ecotoxicol. Environ. Saf. 62 (1), 42–52.
Biscardi, D., Monarca, S., De Fusco, R., Senatore, F., Poli, P.,Buschini, A., et al., 2003. Evaluation of the migration ofmutagens/carcinogens from PET bottles into mineral water byTradescantia/micronuclei test, Comet assay on leukocytes andGC/MS. Sci. Total Environ. 302 (1-3), 101–108.
Bolognesi, C., Buschini, A., Branchi, E., Carboni, P., Furlini, M.,Martino, A., et al., 2004. Comet and micronucleus assays inzebra mussel cells for genotoxicity assessment of surfacedrinking water treated with three different disinfectants. Sci.Total Environ. 333 (1-3), 127–136.
Bolt, H.M., Stewart, J.D., Hengstler, J.G., 2011. A comprehensivereview about micronuclei: mechanisms of formation andpractical aspects in genotoxicity testing. Arch. Toxicol. 85 (8),861–862.
Buschini, A., Giordani, F., Pellacani, C., Rossi, C., Poli, P., 2008.Cytotoxic and genotoxic potential of drinking water: acomparison between two different concentration methods.Water Res. 42 (8-9), 1999–2006.
Cornwell, D.A., Lee, R.G., 1994. Waste stream recycling: its effect onwater quality. J. Am. Water Works Assoc. 86 (11), 50–63.
Cornwell, D.A., Moser, R.H., Doe, P., Rolan, T., Saunders, F.M.,Wapensky, L., 1987. Sludge-the disposal dilemma. J. Am.WaterWorks Assoc. 79 (6), 12–15.
Cristale, J., García Vázquez, A., Barata, C., Lacorte, S., 2013. Priorityand emerging flame retardants in rivers: occurrence in waterand sediment, Daphnia magna toxicity and risk assessment.Environ. Int. 59, 232–243.
Gottfried, A., Shepard, A.D., Hardiman, K., Walsh, M.E., 2008.Impact of recycling filter backwash water on organic removalin coagulation–sedimentation processes. Water Res. 42 (18),4683–4691.
Heuser, V.D., de Andrade, V.M., Peres, A., Macedo, Gomes, deBraga, L.M., Bogo Chies, J.A., 2008. Influence of age and sex onthe spontaneous DNA damage detected by Micronucleus testand Comet assay in mice peripheral blood cells. Cell Biol. Int.32 (10), 1223–1229.
Laffon, B., Pásaro, E., Méndez, J., 2001. Genotoxic effects ofstyrene-7,8-oxide in human white blood cells: comet assay inrelation to the induction of sister-chromatid exchanges andmicronuclei. Mutat. Res. Genet. Toxicol. Environ. Mutagen. 491(1-2), 163–172.
McCormick, N.J., Porter, M., Walsh, M.E., 2010. Disinfectionby-products in filter backwash water: implications to waterquality in recycle designs. Water Res. 44 (15), 4581–4589.
Minissi, S., Caccese, D., Passafiume, F., Grella, A., Ciccotti, E.,Rizzoni, M., 1998. Mutagenicity (micronucleus test in Vicia fabaroot tips), polycyclic aromatic hydrocarbons and heavy metalcontent of sediments collected in Tiber river and its tributarieswithin the urban area of Rome. Mutat. Res. Genet. Toxicol.Environ. Mutagen. 420 (1-3), 77–84.
Monarca, S., Zani, C., Richardson, S.D., Thruston Jr., A.D., Moretti,M., Feretti, D., et al., 2004. A new approach to evaluating thetoxicity and genotoxicity of disinfected drinking water. WaterRes. 38 (17), 3809–3819.
Peycheva, E., Alexandrova, R., Miloshev, G., 2014. Application ofthe yeast comet assay in testing of food additives forgenotoxicity. LWT-ood Sci. Technol. 59 (1), 510–517.
Richardson, S.D., Plewa, M.J., Wagner, E.D., Schoeny, R., DeMarini,D.M., 2007. Occurrence, genotoxicity, and carcinogenicity ofregulated and emerging disinfection by-products in drinkingwater: a review and roadmap for research. Mutat. Res. Rev.Mutat. Res. 636 (1-3), 178–242.
Routledge, E.J., Sheahan, D., Desbrow, C., Brighty, G.C., Waldock,M., Sumpter, J.P., 1998. Identification of estrogenic chemicalsin STW Effluent. 2. In vivo responses in trout and roach.Environ. Sci. Technol. 32 (11), 1559–1565.
Sharp, E.L., Parsons, S.A., Jefferson, B., 2006. Seasonal variations innatural organic matter and its impact on coagulation in watertreatment. Sci. Total Environ. 363 (1-3), 183–194.
Shi, Y., Cao, X.W., Tang, F., Du, H.R., Wang, Y.Z., Qiu, X.Q., et al.,2009. In vitro toxicity of surface water disinfected by differentsequential treatments. Water Res. 43 (1), 218–228.
Singh, N.P., McCoy, M.T., Tice, R.R., Schneider, E.L., 1988. A simpletechnique for quantitation of low levels of DNA damage inindividual cells. Exp. Cell Res. 175 (1), 184–191.
Walsh, M.E., Gagnon, G.A., 2006. Blending membrane treated WTPwaste residuals with finished water: impacts to water qualityand biofilm formation. J. Water Supply Res. Technol. AQUA 55(5), 321–334.
Xiao, F., Zhang, B.J., Ma, J., Yi, P., Cui, C.W., 2009. Effects of lowtemperature on floc fractal dimensions and shape factorsduring alum coagulation. J. Water Supply Res. Technol. AQUA58 (1), 21–27.

70 J O U R N A L O F E N V I R O N M E N T A L S C I E N C E S 4 2 ( 2 0 1 6 ) 6 1 – 7 0
Xu, G.R., Yan, Z.C., Wang, Y.C., Wang, N., 2009. Recycle of Alumrecovered from water treatment sludge in chemically enhancedprimary treatment. J. Hazard. Mater. 161 (2-3), 663–669.
Zhang, J., Zhang, Y.B., Liu, W., Quan, X., Chen, S., Zhao, H.M., et al.,2013. Evaluation of removal efficiency for acute toxicity andgenotoxicity on zebrafish in anoxic–oxic process from selectedmunicipal wastewater treatment plants. Chemosphere 90 (11),2662–2666.
Zhong, Y., Feng, S.L., Luo, Y., Zhang, G.D., Kong, Z.M., 2001.Evaluating the genotoxicity of surface water of Yangzhong Cityusing the vicia faba micronucleus test and the comet assay.Bull. Environ. Contam. Toxicol. 67 (2), 217–224.
Zhou, Z.W., Yang, Y.L., Li, X., Gao, W., Liang, H., Li, G.B., 2012.Coagulation efficiency and flocs characteristics of recyclingsludge during treatment of low temperature andmicro-polluted water. J. Environ. Sci. 24 (6), 1014–1020.

J O U R N A L O F E N V I R O N M E N T A L S C I E N C E S 4 2 ( 2 0 1 6 ) 7 1 – 7 8
Ava i l ab l e on l i ne a t www.sc i enced i r ec t . com
ScienceDirect
www. jou rna l s . e l sev i e r . com/ j es
Metal release/accumulation during the decomposition ofPotamogeton crispus in a shallow macrophytic lake
Huanguang Deng1,⁎, Ju Zhang1, Shiyue Chen1, Liwei Yang1, Dongqi Wang2, Shiyong Yu3
1. School of Environment and Planning, Liaocheng University, Liaocheng 252059, China2. School of Geographical Sciences, East China Normal University, Shanghai 200241, China3. Institute for Cultural Heritage, Shandong University, Jinan 250100, China
A R T I C L E I N F O
⁎ Corresponding author. E-mail address: lcdh
http://dx.doi.org/10.1016/j.jes.2015.07.0041001-0742/© 2015 The Research Center for Ec
A B S T R A C T
Article history:Received 16 March 2015Revised 2 July 2015Accepted 6 July 2015Available online 3 September 2015
Changes inmetal concentrations in the litter of Potamogeton crispuswere monitored during aconsecutive 40-day in situ decomposition experiment using the litterbag method. Theaccumulation index was calculated and used to indicate the changes in the metals in litter.The results showed that the concentrations of Al, Cd, Cr, Fe, Mn, and Pb in litter increasedsignificantly during the decomposition, while Cu and Zn concentrations decreaseddramatically. Significant positive correlations were found between the concentrations ofAl, Cr, Fe, and Mn and between Cu and Zn. Moreover, Cu and Zn both negatively correlatedwith Al and Fe. The remaining dry mass was negatively correlated with Al and Feconcentrations but positively correlated with Cu and Zn concentrations. Generally theaccumulation index values of metals other than Al were less than one, indicating that thelitter of P. crispus acted as a source of metals to the surrounding water body. Al was the onlymetal that showed continuous net accumulation in litter. The net accumulation of Fe andMn in litter during the last 10 days of the experiment may indicate the precipitation of Fe-and Mn-oxides. It was estimated that 160 g/m2 (dry weight) P. crispus was decomposed in40 days. This was equivalent to releasing the following amounts of metals: 0.01 mg Cd,0.03 mg Cr, 0.71 mg Cu, 0.55 mgMn, 0.02 mg Pb and 13.8 mg Zn into surrounding water, andaccumulating 149 mg Al and 11 mg Fe, in a 1 m2 area.© 2015 The Research Center for Eco-Environmental Sciences, Chinese Academy of Sciences.
Published by Elsevier B.V.
Keywords:Litter decompositionMetal release/accumulationMetal stocksAccumulation indexPotamogeton crispusLake Dongping
Introduction
Aquatic plants play an important role in the structure andfunction of aquatic ecosystems. Their status is a direct indicatorof environmental conditions, because they grow in closecontact both with the water that surrounds them and thesediments in which they are rooted (Brönmark and Hansson,1998). Several studies have proposed that submerged plants inthe growingperiod are natural sinks formetals, as they can takeup and adsorb large quantities of metals from sediments and
[email protected] (Huanguang
o-Environmental Science
water (Cardwell et al., 2002; Weis and Weis, 2004). However,when aquatic plants die, the decomposing plant tissuesmay bea source of elements released through leaching and minerali-zation, or sink through litter adsorption or microbial immobi-lization (Schaller et al., 2011; Eid et al., 2012). Meanwhile, thedecomposition of aquatic plants is critical for eutrophic shallowlakes, because it can influence the sediment layer and thus theterrestrial forming processes (Chen et al., 2013).
A number of studies have focused on the metal accumu-lation in decaying litter of wetland plants over time by using
Deng).
s, Chinese Academy of Sciences. Published by Elsevier B.V.

72 J O U R N A L O F E N V I R O N M E N T A L S C I E N C E S 4 2 ( 2 0 1 6 ) 7 1 – 7 8
the litterbag method (Pereira et al., 2007; Eid et al., 2012).Increases ofmetal concentrations in litterwere generally found,but this was not the same for the metal stocks (Kufel, 1991;Windham et al., 2004; Du Laing et al., 2006). Increase of themetal concentrations could be attributed to different factors,such as contamination by sediment particles, passive sorptiononto recalcitrant organic fractions, and active accumulation bymicrobial colonizers (Gadd, 1993; Zawislanski et al., 2001;Kovacova and Sturdik, 2002; Weis and Weis, 2004; Du Laing etal., 2006). Furthermore, the increased metal concentrationsobserved in litter bag experiments significantly depend uponthe environmental conditions (e.g. salinity, pollution degree),and experimental conditions (e.g. submerged or littoral, meshsize of the litter bags, and the treatment of the plant litter) (DuLaing et al., 2006). To date, studies on metal accumulation/release during the decomposition of wetland plants havemainly focused on emergent plants (e.g. Typha domingensis,Spartina alterniflora and Phragmites australis), while few havereported on the decomposition of submerged macrophytes.
Potamogeton crispus L. (P. crispus), a rooted submerged plant,grows in freshwater lakes, ponds, rivers, and streams all over theworld. It is a fast growing plant, which produces high biomassand has shown potential to take up considerable amounts of Cu,Pb, Mn, Ni, Zn, Hg, and Cd during its growing period (Hu et al.,2007; Sivaci et al., 2008; Xu et al., 2010). However, once P. crispusdies, it will decay and decompose in the water body, releasingthe metals back into the water body and causing secondarypollution. This study focused on the dynamics of metals (Al, Cd,Cr, Cu, Fe, Mn, Pb, and Zn) in the litter of P. crispus during itsdecomposition using the litterbag method. We examined thetemporal variation of metal concentrations in P. crispus litterand calculated the metal stocks during a consecutive 40-daydecomposition experiment.
1. Materials and methods
1.1. Study site
Lake Dongping (35°30′–36°20′ N, 116°00′–116°30′ E) is located inDongping County, southwest of Shandong Province, China.Witha total area of 627 km2 including the old and the new lake basins,it is the second largest freshwater lake in Shandong Province.The old lake, with an area of 209 km2, is a flat basin retainingwater all year round, and its multi-annual average of waterdepth is 1–2 m. The water color of Lake Dongping is yellow-green, and the water transparency ranges from 0.20 to 1.46 mwith an average of 0.58 m (Chen et al., 2013). Recharge to LakeDongping relies mainly on surface runoff via the Dawen River.The water in the lake flows northward through the XiaoqingRiver, finally entering the Yellow River. As a water collectioncenter for the Dawen River drainage and a retention reservoir ofthe Yellow River, its main role is to regulate and store floodsof the Yellow River and the Dawen River. In addition, LakeDongping serves important roles in the East Route of theSouth-to-North Water Diversion Project of China and watertransmission from the west to the east of Shandong Province.
Lake Dongping experiences a warm and semi-humidcontinental monsoon climate and has four distinct seasons,with an annual precipitation of 640 mm and an annual average
temperature of 13.3°C, and the average monthly watertemperature varies between 4°C (January) and 30°C (August)(Chorography Compilation Committee of Dongping County inShandong Province, 2006). Metal contents in surface sedimentwere 53,498 ± 3889 mg/kg for Al, 1.00 ± 0.13 mg/kg for Cd, 79 ±10 mg/kg for Cr, 43 ± 13 mg/kg for Cu, 30,045 ± 2579 mg/kgfor Fe, 666 ± 110 mg/kg for Mn, 22 ± 4 mg/kg for Pb, and 100 ±13 mg/kg for Zn, respectively (mean ± standard deviation, n =47, expressed on dry mass basis). Organic matter content insurface sediment varied from 5.2 to 52.1 g/kg with an average of22.3 g/kg. The mean particle size of surface sediment was25.8 μm. Lake Dongping has an abundance of vegetation types,such as Trapa, Nymphea, Typha, Potamogeton, Lemna, and Cyperus,etc. (Chen et al., 2013). P. crispus is the dominant speciesof the aquatic vascular plants in Lake Dongping. The growth ofP. crispus shows great seasonal variations. In Lake Dongping,P. crispus forms shoots in the autumn (September–November)and grows in the winter and spring (December–May). Generally,biomass reaches a peak in May whenmore than 80% of the lakearea is intensively colonized by P. crispus, and the averagebiomass is about 3.27 kg/m2 (wet weight), with a maximumbiomass that can reach 5.33 kg/m2 (wet weight) (Zhang et al.,2009). In late May and early July (early summer), P. crispus beginsto die and decompose, which causes the deterioration of theaquatic ecological environment and themassive death of fishes.The pHofwater in LakeDongping during the decompositionof P.crispuswas between 7.17 and 8.92, and the dissolved oxygen (DO)concentrations ranged from 2.58 to 9.03 mg/L, and the range ofchemical oxygen demand (COD) was from 4.97 to 11.5 mg/L(Zhang et al., 2009).
1.2. Sampling methods and elemental analysis
Decomposition of P. crispus was investigated with the litter bagtechnique, which is widely used in research (e.g. Zawislanski etal., 2001; Longhi et al., 2008; Balasubramanian et al., 2012). At theend of May, 10 kg of P. crispus (aboveground part) in LakeDongping was collected just prior to its death. Fresh plant wastransported to the laboratory and washed with water and thenwith deionized water. Cleaned P. crispus was dried at 60°C toconstant mass (Longhi et al., 2008), and 5 g of the dried plantdetritus was enclosed in each 0.15 mm mesh size nylon bag(20 cm × 20 cm). In total, 45 litter bags were prepared andstrung together with a nylon rope for convenience of sampling,and then the bags were put back into Lake Dongping togetherwith the natural P. crispus detritus.
Three bags (triplicate samples) were taken out on the 1, 2,4, 6, 8, 10, 12, 14, 16, 18, 20, 25, 30, 35, and 40th days after bagswere set in the lake, and then transported into the laboratoryfor analysis. In the laboratory, the residual plant litter inbags was carefully cleaned and repeatedly rinsed withdeionized water to remove adhering debris and sedimentparticles. The cleaned sample in each bag was dried at 60°Cagain to constant mass (Longhi et al., 2008), then weighed andhomogenized. P. crispus and the litter samples were analyzedfor metal content. A 0.5 g sample was hot-digested withHNO3-HClO4-HF (GR) and then diluted to 50 mL volume with1:1 (V/V) HNO3 (Deng et al., 2010). Concentrations of Al, Cd, Cr,Cu, Fe, Mn, Pb, and Zn, were measured by a Varian 710ESICP-OES spectrometer (Varian Inc., USA). Concentrations were

Table 1 – Litter mass, dry mass remaining in litter duringthe 40-day decomposition of P. crispus.
Day Litter mass (g) Dry mass remaining (%)
0 4.39 ± 0.43 1001 2.39 ± 0.07 58.9 ± 0.92 2.39 ± 0.07 58.5 ± 3.14 1.88 ± 0.05 46.4 ± 1.86 1.34 ± 0.11 32.6 ± 2.88 1.08 ± 0.21 26.3 ± 5.010 0.91 ± 0.05 22.8 ± 1.212 0.88 ± 0.25 21.2 ± 5.914 0.61 ± 0.04 14.8 ± 1.116 0.81 ± 0.22 19.1 ± 4.818 0.85 ± 0.14 20.5 ± 3.220 0.88 ± 0.17 18.6 ± 3.725 0.59 ± 0.03 12.3 ± 0.930 1.07 ± 0.30 21.8 ± 6.135 0.96 ± 0.42 18.9 ± 8.640 1.41 ± 0.11 21.4 ± 1.8
Data are presented as mean and standard deviation.
73J O U R N A L O F E N V I R O N M E N T A L S C I E N C E S 4 2 ( 2 0 1 6 ) 7 1 – 7 8
calculated based on the dry weight of each sample. Theanalytical accuracy was estimated by the analysis of CertifiedReference Materials-Poplar leaves (GSV-3, National ResearchCenter for Certified Reference Materials, China). The recoverieswere between 90% and 110%. In order to examine any possiblecontamination during the analytical procedure, blanks wereanalyzed synchronously in each analytical batch and alwaysaccounted for less than 2% of metal concentrations. Thecontainers used in the analytical procedure were cleaned byimmersing in 10% (V/V) HNO3 for more than 24 hr; subsequent-ly, they were washed with fresh water, followed by deionizedwater to ensure that they were free of contamination.
1.3. Data analysis
The accumulation index (AI) is calculated to indicate the netrelease or accumulation of metals during the decompositionof P. crispus (Romero et al., 2005):
AI ¼ WtXt
W0X0ð1Þ
whereWt (g) is the dry mass of litter at time t, Xt (mg/kg) is themetal ‘X’ concentration in litter at time t, W0 (g) is the initialdry weight of litter, and X0 (mg/kg) is the initial concentrationof metal ‘X’ in litter. An AI value of 1 indicates that thedecomposed litter at time t contained the same mass of themetal ‘X’ as when the litter of P. crispus was placed in thelitterbag; AI < 1 indicates a net release of metal ‘X’ from thedecaying litter of P. crispus; while AI > 1 indicates a netaccumulation of metal ‘X’ by the decaying litter.
2. Results and discussion
2.1. Litter mass loss
The mass loss of P. crispus during the 40-day decomposition ispresented inTable 1. Results indicated that P. crispusdecomposedrapidly in the first 14 days, especially in the first 4 days whenmore than half of the dry mass was lost. The classic three-phasemodel of organic matter decomposition was discerned from ourresults (Zawislanski et al., 2001; Pereira et al., 2007; Zhang et al.,2013). As shown in Table 1, in the first 2 days, the leaching ofsoluble materials led to the rapid loss (an average of 41.5%) ofbiomass of P. crispus. Then from the 2nd to the 14th day, thebiomass continued to decrease due to the microbial degradationof labile substrates (e.g. sugars, starches and proteins), and theaverage of weight loss was 43.7%. From the 14th to the 40th day,as the refractory materials (e.g. cellulose, waxes, tannins andlignin) accumulated in litter, the decomposition rate decreasedgradually. The litter weight even increased a little in this stage(Table 1), which might be caused by the adsorption by litter andby microbial immobilization (Pereira et al., 2007; Longhi et al.,2008). After 40 days, only 21.4% of the dry mass remained.
2.2. Metal concentrations in decomposing litter
The initial concentrations of metals were 84.3 ± 7.5 mg/kgfor Al, 0.05 ± 0.01 mg/kg for Cd, 0.30 ± 0.08 mg/kg for Cr, 4.05 ±
0.75 mg/kg for Cu, 64.1 ± 6.8 mg/kg for Fe, 20.5 ± 4.6 mg/kg forMn, 0.19 ± 0.04 mg/kg for Pb, and73.7 ± 9.8 mg/kg for Zn (mean ±standard deviation, n = 3). The changes in metal concentrationsin P. crispus litter are illustrated in Fig. 1. During the decomposi-tion, metal concentrations in litter exhibited different temporalvariations. Concentrations of Al, Cd, Cr, Fe, Mn, and Pb showedsignificant increases (p < 0.05), while concentrations of Zn andCu decreased significantly (p < 0.05). During decomposition, theproportions of metal concentrations in litter bags to the meaninitial concentrations are 2.7–50.0 for Al, 1.0–2.7 for Cd, 0.5–2.4 forCr, 0.4–1.5 for Cu, 1.7–9.3 for Fe, 0.5–6.5 for Mn, 0.8–3.9 for Pb, and0.3–1.3 for Zn. The proportions of Al and Fe were all greater thanone, which indicated that concentrations of Al and Fe in litteralways increased during the decomposition. The maximumproportions, i.e. the highest concentrations in the litter duringthedecomposition, occurred at the 1st day forCd, Cu, andZn, andat the 10th day for Pb, while for Al, Cr, Fe, and Mn, they werefound in the last 10 days of the experiment. At the end of theexperiment, the proportions varied in the order Al (49.1) > Fe(9.3) > Mn (4.3) > Pb (2.5) > Cr (2.4) > Cd (1.5) > Cu (0.6) > Zn (0.3).
As shown in Fig. 1, concentrations of some metals showedsimilar changes, indicating that they may undergo similarbiogeochemical cycling during the decomposition (Pereira etal., 2007). The correlations between metal concentrationsand remaining dry mass are listed in Table 2. There weresignificant positive correlations between Al, Cr, Fe, and Mn,and between Cu and Zn. Nevertheless, Cu and Zn were bothnegatively correlated with Al (p < 0.01) and Fe (p < 0.05). Nosignificant correlations were found for Pb and Cd with theother six metals.
Changes in metal concentrations in plant litter werealso observed by other researchers. Zawislanski et al. (2001)found decaying litter of Spartina foliosa underwent a veryrapid increase in all metal species during the first few weeksof decomposition followed by a subsequent slower increase.Windham et al. (2004) found large increases (10–100 fold) inmetal concentrations in the litter of P. australis and S. alterniflorain the field. Du Laing et al. (2006) found increasing Cd, Cr, Cu, Ni,Pb, and Zn concentrations in stems, leaf sheaths and leaf blades

0 4 8 12 16 20 24 28 32 36 400
1000
2000
3000
4000
5000
0 4 8 12 16 20 24 28 32 36 400.00
0.04
0.08
0.12
0.16
0.20
0 4 8 12 16 20 24 28 32 36 400.0
0.2
0.4
0.6
0.8
0 4 8 12 16 20 24 28 32 36 400.0
1.0
2.0
3.0
4.0
5.0
6.0
7.0
0 4 8 12 16 20 24 28 32 36 400
150
300
450
600
750
0 4 8 12 16 20 24 28 32 36 400
40
80
120
160
200
0 4 8 12 16 20 24 28 32 36 40
0.0
0.2
0.4
0.6
0.8
1.0
1.2
0 4 8 12 16 20 24 28 32 36 400
20
40
60
80
100
120
Al (
mg/
kg)
Cd
(mg/
kg)
Cr
(mg/
kg)
Cu
(mg/
kg)
Fe (
mg/
kg)
Mn
(mg/
kg)
Pb (
mg/
kg)
Time (day)
Zn
(mg/
kg)
Time (day)
Time (day) Time (day)
Time (day) Time (day)
Time (day) Time (day)
Fig. 1 – Changes inmetal concentrationsduring thedecompositionofP. crispus (error bars represent one standarddeviation,n = 3).
74 J O U R N A L O F E N V I R O N M E N T A L S C I E N C E S 4 2 ( 2 0 1 6 ) 7 1 – 7 8
of P. australis during the decomposition in a brackish tidalmarsh. In this study, concentrations of Al, Fe, Mn, and Crincreased significantly as the decomposition proceeded (Fig. 1).During the decomposition, microbes as well as their exudates,especially the exopolysaccharides (EPS), form a heterotrophicbiofilm that can accumulate high amounts of metals (Schalleret al., 2010, 2011). Furthermore, Al, Fe, Mn, and Cr oxides mightbe bound by humic substances or precipitate on the surface andinterstices of the litter during the decomposition (Pereira et al.,
2007). This process may be further confirmed by the significantnegative correlation between Al and Fe with remaining drymass (Table 2). Therefore, the increase of Al, Fe, Mn, and Crconcentrations may be attributed to the combination ofbiofilms that grow on the decomposing litter and adsorptionor precipitation of metals on the decomposing litter. Thevariation of Mn concentrations in the first 14 days is smallcompared with Al, Fe, and Cr. Organic matter oxidation mayhave led to the use of Fe- and Mn-oxides as electron acceptors,

Table 2 – Spearman correlations between metalconcentrations in litter and remaining dry mass duringthe consecutive 40-day decomposition experiment of P.crispus.
Cd Cr Cu Fe Mn Pb Zn RDM ⁎
Al 0.12 0.58b −0.65a 0.93a 0.54b 0.34 −0.88a −0.74a
Cd 0.25 0.36 0.19 0.47 0.20 0.07 0.19Cr 0.06 0.68a 0.78a 0.03 −0.37 −0.15Cu −0.52b −0.04 −0.19 0.72a 0.89a
Fe 0.62a 0.45 −0.82a −0.67a
Mn 0.18 −0.38 −0.15Pb −0.43 −0.18Zn 0.75a
⁎ RDM: remaining dry mass.a Correlation is significant at the 0.01 level (two-tailed).b Correlation is significant at the 0.05 level (two-tailed).
75J O U R N A L O F E N V I R O N M E N T A L S C I E N C E S 4 2 ( 2 0 1 6 ) 7 1 – 7 8
and the reduced Fe and Mn forms may have leached from thelitter (Pereira et al., 2007). As the oxidation of organic matterslowed down after 14 days, Mn concentrations in litterincreased gradually, which could be interpreted as the precip-itation of Mn-oxides. The microbes in the biofilm also facilitatethe precipitation of manganese (Ohnuki et al., 2008; Schaller etal., 2010). The behavior of Al andCr are linked to both Fe andMnredox cycling and may be bound to the oxides and humicsubstances (Tipping et al., 2002; Hamilton-Taylor et al., 2005).
It is well known that Cu and Zn have similar geochemicalbehaviors, and significant correlations are generally foundbetween Cu and Zn concentrations in soil, sediment, andstreet dust (Shi et al., 2008). During the decomposition of P.crispus, they were also well correlated with each other(p < 0.01) and showed a similar temporal variation patternopposite to those of Al, Fe, Mn, and Cr. The highestconcentrations of Cu and Zn in litter were found on the 1stday. This might be related to the rapid leaching of solublematerials in P. crispus, which resulted in an increase in theconcentrations of Cu and Zn in litter. Along with the litterdecomposition, concentrations of Cu and Zn in litter de-creased from the 2nd to the 14th day. Cu and Zn as micronutrients for microbial growth are utilized by microorganismsduring the litter decomposition; on the other hand, Cu andZn were linked to their overriding association with dissolvedhumic substances (Hamilton-Taylor et al., 2005), and theycould be easily released following the microbial degradationof labile substrates in P. crispus. The significant positivecorrelations between Cu and Zn with the residual ratio ofdry mass also suggest that Cu and Zn were released with thelitter decomposition. After 14 days, the decrease of Cu and Znconcentrations slowed down, especially for Cu, for whichconcentrations were almost constant from the 16th day to the40th day. This might be correlated to the slow decompositionof the refractory materials in P. crispus, adsorption by litter,and microbial immobilization (Du Laing et al., 2006; Pereira etal., 2007).
Cd concentrations in litter fluctuated dramatically in thefirst 14 days, and then increased gradually till the end of theexperiment, while Pb concentrations showed a great fluctua-tion in the first 20 days, followed by an increase from the 20thday to the 30th day, and then remained relatively constant in
the last 10 days of the experiment. On the one hand, thefluctuation of Cd and Pb concentrations might be influencedby the first two stages of litter decomposition. For example,the fact that the highest concentration of Cd was on the 1stday might be due to the fast leaching of the soluble materialsin P. crispus. On the other hand, Cd and Pb in the litter weremore likely affected by the surrounding water body, such asfrom suspended particles entering the litterbags, due to thelow initial concentrations of Cd (0.05 ± 0.01 mg/kg) and Pb(0.19 ± 0.04 mg/kg) in P. crispus. This may also be the reasonwhy Cd and Pb did not have significant positive correlationswith Fe and Mn (Table 2) although they could be adsorbed byFe- and Mn-oxides (Dong et al., 2000, 2003; Hamilton-Taylor etal., 2005). In general, Cd and Pb concentrations in litter tendedto maintain a relatively constant level in the later stage of theexperiment, indicating that an equilibrium between adsorp-tion and desorption was attained in the litterbag.
2.3. AI change of metals in decomposing litter
Increasing metal concentrations do not mean that the litterbags functioned as a sink for metals, because the biomass oflitter was lost at the same time (Pereira et al., 2007). Therefore,AI values were calculated according to Eq. (1), and the resultsare illustrated in Fig. 2. It is found that the AI values of Cr, Cu,and Zn were all less than one, suggesting the export of metalsfrom litter to the surrounding water body during the 40-daydecomposition. The same results were found with Cd, Pb, andMn, except for the AI values of Cd on the 1st day, Pb on the 2ndday, and Mn on the 35th day. The AI values of Al were all morethan one, with a range between 1.55 and 10.88, indicating thegreat accumulation of Al in litter. As for Fe, its AI valuesfluctuated around 1 till the 25th day, then increased by 137%to 1.97 at the 30th day, and remained relatively constant in thelast 10 days.
AI values reflect whether the litter was a net source or sinkof metals during the decomposition of P. crispus. AI valuesshowed the export of Cd, Cr, Cu, Pb, Mn, and Zn from litter tothe surrounding water body during the 40-day experiment.However, the variation of AI values between sampling timesmeant that the export was not uniform, especially for Cr, Pb,and Mn. These results are in accord with the findings ofPereira et al. (2007), who also reported that metal releaseexceeded sorption as the decomposition proceeded. More-over, Windham et al. (2004) found no net metal accumulationdue to the rapid mass loss, although concentrations of metalsincreased in litter samples of P. australis and S. alterniflora.These results indicated that the metal stocks might notincrease with the enrichment of metals in decomposing littercompared with the initial metal content, and they might evendecrease due to the more rapid mass loss.
In order to investigate the influence of the biomass loss onthemetal pools of the litter, the residual ratios of litter are alsodepicted in Fig. 2. It could be inferred from Fig. 2 that the lossof metals in litter was not synchronous with the dry massloss. The AI values of Cu and Zn, except for the 1st day, weregenerally smaller than the residual ratio, which might causethe decrease of Cu and Zn concentrations in the decomposinglitter due to the more rapid loss of dry biomass (Fig. 1). TheAI values of Cu and Zn on the 1st day are much higher than

0 4 8 12 16 20 24 28 32 36 40
0
2
4
6
8
10
12
14
0 4 8 12 16 20 24 28 32 36 400.0
0.4
0.8
1.2
1.6
2.0
0 4 8 12 16 20 24 28 32 36 400.0
0.2
0.4
0.6
0.8
1.0
1.2
0 4 8 12 16 20 24 28 32 36 400.0
0.2
0.4
0.6
0.8
1.0
1.2
0 4 8 12 16 20 24 28 32 36 400.0
0.5
1.0
1.5
2.0
2.5
3.0
0 4 8 12 16 20 24 28 32 36 400.0
0.5
1.0
1.5
2.0
2.5
0 4 8 12 16 20 24 28 32 36 400.0
0.4
0.8
1.2
1.6
0 4 8 12 16 20 24 28 32 36 400.0
0.2
0.4
0.6
0.8
1.0
1.2
AI
Al
Residual ratio of dry mass
AI
Cd
AI
Cr
AI
Cu
AI
Fe
AI
Mn
AI
Time (day)
Pb
AI
Time (day)
Time (day) Time (day)
Time (day) Time (day)
Time (day) Time (day)
Zn
Fig. 2 – Changes in the accumulation index (AI) of metals in litter during the consecutive 40-day decomposition experiment ofP. crispus. (Error bars represent one standard deviation, n = 3).
76 J O U R N A L O F E N V I R O N M E N T A L S C I E N C E S 4 2 ( 2 0 1 6 ) 7 1 – 7 8
the residual ratio, indicating that the fact that the highestconcentrations of Cu and Zn occurred on the 1st day might berelated to the rapid leaching of soluble materials, whichcaused Cu and Zn to be concentrated in litter. The AI valuesof Al, Cd, Cr, Pb, Fe, and Mn were generally higher than the
residual ratio of dry mass, suggesting the more rapid loss ofplant materials. Therefore, an increase of metal concentra-tions was observed during the decomposition (Fig. 1).
Whether metal is lost from litter or accumulated duringthe decomposition is determined by two major processes:

77J O U R N A L O F E N V I R O N M E N T A L S C I E N C E S 4 2 ( 2 0 1 6 ) 7 1 – 7 8
(1) the release of metals from dead plant tissues as theyoxidize; and (2) the passive sorption on organic surfaces of thelitter and active accumulation by microbial colonizers(Windham et al., 2004; Du Laing et al., 2006; Schaller et al.,2010). The AI values of Cd and Pb are less than one, except onthe 1st day for Cd and the 2nd day for Pb, indicating that Cdand Pbmay be absorbed from the surrounding water body intolitter at the beginning of the decomposition. Cu and Zn aremicro-nutrients for microbial growth; therefore, the steadyfall of AI values of Cu and Zn during the first 14 days mightindicate the utilization of Cu and Zn by the microbes as theydegraded the litter. As the refractory materials accumulatedin litter (Table 1), Cu and Zn maintained nearly constant AIvalues till the end of the experiment. Fe, as a macro nutrientfor microbial growth, appears to be more active than Mn, asthe AI values of Fe in the first 25 days fluctuated around one,indicating that intense adsorption and desorption occurred inlitter, while Mn was mainly released from litter. The increaseof the AI values of Fe and Mn during the last 10 days of theexperiment was probably due to microbial immobilizationand the precipitation of Fe- and Mn-oxides (Sundby et al.,2003; Schaller et al., 2010). The minimum AI values of Cd, Cr,Cu, Fe, Mn, and Zn occurred on the 14th day, which is inaccordance with the residual ratio change of the dry mass(Fig. 2). This indicated that metals were released to themaximum extent during the first 14 days. The AI values ofAl above one indicated the continuous incorporation of Al intolitter. Al is not a nutrient element for plants, and aluminumions have a toxic impact on plant growth. The ratio of Alconcentration in P. crispus to that in sediment is the smallestcompared with those of the other metals. Furthermore, Al hassignificant interactions with natural organic matter (mainlyhumic substances) (Tipping et al., 2002). Therefore, during thedecomposition of the litter, most humic substances mayadsorb a large amount of Al from the surrounding water body,causing the increase of aluminum AI values.
According to our decomposition experiment, about 80% ofthe initial dry mass of P. crispus was lost after 40 days (Table 1).LakeDongping could producemore than 250 × 104 kg/km2 freshP. crispus annually (Zhang et al., 2009), and the dry matter of P.crispus accounts for about 8% of the fresh weight. Thus, about160 g/m2 (dryweight) P. crispuswas estimated tobe decomposedin 40 days. Based on themetal concentrations in the initial litterand those at the 40th day, the decomposition of P. crispus in40 days was equivalent to releasing the following amounts ofmetals into the surrounding water (in mg/m2): 0.01 Cd, 0.03 Cr,0.71 Cu, 0.55 Mn, 0.02 Pb, and 13.8 Zn; but accumulating 149 Aland 11 Fe in litter from the water body.
3. Conclusions
During the decomposition of P. crispus, the concentrations ofAl, Cd, Cr, Fe, Mn, and Pb significantly increased in litter, whileCu and Zn showed the opposite trend. Significant positivecorrelations were found among Al, Cr, Fe, and Mn, and alsobetween Cu and Zn; furthermore, Al and Fe were bothnegatively correlated with Cu and Zn. This indicates that Al,Cr, Fe, and Mn had similar biogeochemical cycling, whichwas different from that of Cu and Zn in litter during the
decomposition. In addition, Al and Fewere negatively correlatedwith the remaining dry mass, and Cu and Zn were positivelycorrelated with the remaining dry mass, which suggests theaccumulation of Al and Fe and the release of Cu and Zn in litter.In terms ofmetal stocks in litter bags, the AI values of Cd, Cr, Cu,Pb, Zn, and Mnwere less than one, indicating that the release ofthese metals exceeded the sorption during the decomposition.The AI values of Al were all higher than one and increased withtime in litter, suggesting that littermight adsorb the abundant Alin the surrounding water body. No significant net release oraccumulation were found for Fe in the first 25 days, followed bya net accumulation of Fe in the last 10 days, which mightindicate the precipitation of Fe- and Mn-oxides. In general, litterof P. crispus acted as a source of Cd, Cr, Cu, Mn, Pb, and Zn,but a sink of Al and Fe, as revealed by our decompositionexperiment. Our results not only reveal the strong influence of P.crispus decomposition on metal cycling in lakes, but also givewarning that the application of submerged macrophytes forphytoremediation of themetal contaminatedwater body shouldconsider the secondary pollution caused by the decompositionof aquatic plants.
Acknowledgments
This work was supported by the National Natural ScienceFoundation of China (Nos. 41401563, 41301544, 41201094), theNatural Science Foundation of Shandong Province (Nos.ZR2014JL028, ZR2012DQ003) and the China Postdoctoral ScienceFoundation (No. 2015M571830). S. Yu would like to thank theTaishan Scholar Program of Shandong Province for supportinghis research.
R E F E R E N C E S
Balasubramanian, D., Arunachalam, K., Das, A.K., Das, A.K.,Arunachalam, A., 2012. Decomposition and nutrient release ofEichhornia crassipes (Mart.) Solms. Under different trophicconditions in wetlands of eastern Himalayan foothills. Ecol.Eng. 44, 111–122.
Brönmark, C., Hansson, L.A., 1998. The Biology of Lakes and Ponds.Oxford University Press, Oxford.
Cardwell, A.J., Hawker, D.W., Greenway, M., 2002. Metalaccumulation in aquatic macrophytes from southeastQueensland, Australia. Chemosphere 48, 653–663.
Chen, Y., Chen, S., Liu, J., Yao, M., Sun, W., Zhang, Q., 2013.Environmental evolution and hydrodynamic process ofDongping Lake in Shandong Province, China, over the past150 years. Environ. Earth Sci. 68, 69–75.
Chorography compilation committee of Dongping County inShandong Province, 2006. The Chorography of DongpingCounty: 1986–2003. Zhonghua Book Company, Beijing.
Deng, H.G., Zhang, J., Wang, D.Q., Zj, Chen, Xu, S., 2010. Heavymetal pollution and assessment of the tidal flat sedimentsnear the coastal sewage outfalls of Shanghai, China. Environ.Earth Sci. 60, 57–63.
Dong, D., Nelson, Y.M., Lion, L.W., Shuler, M.L., 2000. Adsorption ofPb and Cd onto metal oxides and organic material in naturalsurface coatings as determined by selective extractions: newevidence for the importance of Mn and Fe oxides. Water Res.34 (2), 427–436.

78 J O U R N A L O F E N V I R O N M E N T A L S C I E N C E S 4 2 ( 2 0 1 6 ) 7 1 – 7 8
Dong, D., Derry, L.A., Lion, L.W., 2003. Pb scavenging from afreshwater lake by Mn oxides in heterogeneous surface coatingmaterials. Water Res. 37 (7), 1662–1666.
Du Laing, G., Van Ryckegem, G., Tack, F.M.G., Verloo, M.G., 2006.Metal accumulation in intertidal litter through decomposingleaf blades, sheaths and stems of Phragmites australis.Chemosphere 63, 1815–1823.
Eid, E.M., Shaltout, K.H., El-Sheikh, M.A., Asaeda, T., 2012.Seasonal courses of nutrients and heavy metals in water,sediment and above-and below-ground Typha domingensisbiomass in Lake Burullus (Egypt): perspectives forphytoremediation. Flora 207 (11), 783–794.
Gadd, G.M., 1993. Interactions of fungi with toxic metals. NewPhytol. 124, 25–60.
Hamilton-Taylor, J., Smith, E.J., Davison, W., Sugiyama, M., 2005.Resolving and modeling the effects of Fe and Mn redox cyclingon trace metal behaviour in a seasonally anoxic lake. Geochim.Cosmochim. Acta 69 (8), 1947–1960.
Hu, J.Z., Shi, G.X., Xu, Q.S., Wang, X., Yuan, Q.H., Du, K.H., 2007.Effects of Pb2+ on the active oxygen-scavenging enzymeactivities and ultrastructure in Potamogeton crispus leaves. Russ.J. Plant Physiol. 54 (3), 414–419.
Kovacova, S., Sturdik, E., 2002. Interactions betweenmicroorganismsand heavy metals including radionuclides. Biologia 57, 651–663.
Kufel, I., 1991. Lead and molybdenum in reed and cattail—openversus closed type of metal cycling. Aquat. Bot. 40, 275–288.
Longhi, D., Bartoli, M., Viaroli, P., 2008. Decomposition of fourmacrophytes in wetland sediments: organic matter andnutrient decay and associated benthic processes. Aquat. Bot.89, 303–310.
Ohnuki, T., Ozaki, T., Kozai, N., Nankawa, T., Sakamoto, F., Sakai,T., Suzuki, Y., Francis, A.J., 2008. Concurrent transformation ofCe(III) and formation of biogenic manganese oxides. Chem.Geol. 253, 23–29.
Pereira, P., Caçador, I., Vale, C., Caetao, M., Costa, A.L., 2007.Decomposition of belowground litter and metal dynamics insalt marshes (Tagus Estuary, Portugal). Sci. Total Environ. 380,93–101.
Romero, L.M., Smith, T.J., Fourqurean, J.W., 2005. Changes in massand nutrient content of wood during decomposition in a southFlorida mangrove forest. J. Ecol. 93, 618–631.
Schaller, J., Weiske, A., Mkandawire, M., Dudel, E.G., 2010.Invertebrates control metals and arsenic sequestration asecosystem engineers. Chemosphere 79, 169–173.
Schaller, J., Brackhage, C., Mkandawire, M., Dudel, E.G., 2011.Metal/metalloid accumulation/remobilization during aquaticlitter decomposition in freshwater: a review. Sci. Total Environ.409, 4891–4898.
Shi, G., Chen, Z., Xu, S., Zhang, J., Teng, J., 2008. Potentially toxicmetal contamination of urban soils and roadside dust inShanghai, China. Environ. Pollut. 156, 251–260.
Sivaci, A., Elmas, E., Gümüs, F., Sivaci, E.R., 2008. Removal ofcadmium by Myriophyllum heterophyllum Michx. andPotamogeton crispus L. and its effect on pigments and totalphenolic compounds. Arch. Environ. Contam. Toxicol. 54,612–618.
Sundby, B., Vale, C., Caetano, M., Luther, G.W., 2003. Redoxchemistry in the root zone of a salt marsh sediment in theTagus estuary, Portugal. Aquat. Geochem. 9 (3), 257–271.
Tipping, E., Rey-Castro, C., Bryan, S.E., Hamilton-Taylor, J., 2002. Al(III) and Fe (III) binding by humic substances in freshwaters,and implications for trace metal speciation. Geochim.Cosmochim. Acta 66 (18), 3211–3224.
Weis, J.S., Weis, P., 2004. Metal uptake, transport and release bywetland plants: implications for phytoremediation andrestoration. Environ. Int. 30, 685–700.
Windham, L., Weis, J.S., Weis, P., 2004. Metal dynamics of plantlitter of Spartina alterniflora and Phragmites australis in metal-contaminated salt marshes. Part 1: patterns of decompositionand metal uptake. Environ. Toxicol. Chem. 23 (6), 1520–1528.
Xu, Q.S., Hu, J.Z., Xie, K.B., Yang, H.Y., Du, K.H., Shi, G.X., 2010.Accumulation and acute toxicity of silver in Potamogeton crispusL. J. Hazard. Mater. 173, 186–193.
Zawislanski, P.T., Chau, S., Mountford, H., Wong, H.C., Sears, T.C.,2001. Accumulation of selenium and trace metals on plantlitter in a tidal marsh. Estuar. Coast. Shelf Sci. 52, 589–603.
Zhang, J., Duan, D., Wang, Z., 2009. Harm and control measures forthe decomposition of Potamogeton crispus in Lake Dongping.Environ. Study Monit. (2), 31–33.
Zhang, J., Deng, H.G., Wu, A.Q., Chen, S.Y., Wang, D.Q., 2013.Decomposition of Potamogeton crispus and its effect on theaquatic environment of Dongping Lake. Acta Sci. Circumst. 33(9), 2590–2596.

J O U R N A L O F E N V I R O N M E N T A L S C I E N C E S 4 2 ( 2 0 1 6 ) 7 9 – 8 8
Ava i l ab l e on l i ne a t www.sc i enced i r ec t . com
ScienceDirect
www. jou rna l s . e l sev i e r . com/ j es
Microbial bioavailability of dissolved organic nitrogen (DON) inthe sediments of Lake Shankou, Northeastern China
Mingzhou Su1,2, Jingtian Zhang2, Shouliang Huo2,⁎, Beidou Xi2, Fei Hua3, Fengyu Zan3,Guangren Qian1, Jianyong Liu1
1. School of Environmental and Chemical Engineering, Shanghai University, Shanghai 200444, China2. State Key Laboratory of Environmental Criteria and Risk Assessment, Chinese Research Academy of Environmental Sciences, Beijing 100012,China3. College of Environmental Science and Engineering, Anhui Normal University, Wuhu 241000, China
A R T I C L E I N F O
⁎ Corresponding author.E-mail address: [email protected] (
http://dx.doi.org/10.1016/j.jes.2015.08.0111001-0742/© 2015 The Research Center for Ec
A B S T R A C T
Article history:Received 17 March 2015Revised 11 August 2015Accepted 12 August 2015Available online 31 October 2015
Dissolved organic nitrogen (DON) extracted from Lake Shankou sediments using KCl wasisolated into hydrophobic and hydrophilic fractions. The bioavailabilities of thehydrophobic and hydrophilic fractions to three types of bacterial communities collectedfrom sediments, activated sludge and compost products were examined. The DONrecoveries obtained by DAX-8 and cation exchange resins treatment were 96.17% ± 1.58%and 98.14% ± 0% for the samples obtained from N4 and N14 stations, respectively. After25 days of incubation at 25°C, most DON (59% to 96%) was degraded. Hydrophilic DONexhibited a higher reduction rate than hydrophobic DON during the growth phase.Untreated wastewater from Changshuihe town was the main degradable DON source tostation N4, and 93% of hydrophilic DON and 80% of hydrophobic DON were degraded.Station N14 received a large amount of refractory DON from forest soils and exhibited DONdegradation rates of 82% and 71% for the hydrophilic and hydrophobic fractions,respectively. Amino acid contents and fluorescence intensities were also analyzed.Approximately 27% to 74% of amino acids were taken up by day 5, and their concentrationgradually increased in the following days due to the decomposition of dissolved proteins.Parallel factor analysis resulted in identification of tryptophan-like proteins, tyrosine-likeproteins and FA-like substances. During the growth phase, 40%–51% of the tryptophan-likeproteins were taken up by bacteria, and the accumulation of tyrosine-like proteins wasattributed to the release of biotic substances. The concentration of the FA-like substancesdecreased due to microbial decomposition.© 2015 The Research Center for Eco-Environmental Sciences, Chinese Academy of Sciences.
Published by Elsevier B.V.
Keywords:Microbial bioavailabilityDissolved organic nitrogen (DON)SedimentAmino acidsPARAFAC
Introduction
Dissolved organic nitrogen (DON) is a major nitrogen speciesin estuaries, oceans, rivers and soils and has been found toaccount for 12% of the total dissolved nitrogen (TDN) in ocean
S. Huo).
o-Environmental S
ciencewater, with higher concentrations in surface layers than indeep layers (Ogawa et al., 1999). In estuarial waters,DON concentrations average 12–35 μmol/L (Lønborg andSøndergaard, 2009) and account for 17%–92% and 22%–69% ofthe TDN pool in April and August, respectively (Veuger et al.,2004). The DON concentrations in soils from Germany andTaiwan vary from 2.00 to 3.21 mg/L and 0.57 to 4.47 mg/L,respectively (Schmidt et al., 2011). In addition, DON is
s, Chinese Academy of Sciences. Published by Elsevier B.V.

80 J O U R N A L O F E N V I R O N M E N T A L S C I E N C E S 4 2 ( 2 0 1 6 ) 7 9 – 8 8
constantly produced and used by microorganisms in aquaticsystems, especially during the summer (Zhang et al., 2015),which may increase their primary production levels (Antia etal., 1980). In aquatic systems, bottom sediments often serve asan important assembly area for DON degradation andcirculation, which influences the nitrogen dynamics in theoverlying water column. In addition to the direct absorption ofDON by microorganisms, DON mineralization and immobili-zation occur in the sediment layer to provide a source ofinorganic nitrogen (Wang et al., 2015). The released inorganicnitrogen is available for uptake by phytoplankton, whichincreases the risk of eutrophication.
The DON pool is associated with a mixture of complexcompounds. Urea, dissolved free amino acids, proteins,nucleic acids, amino sugars, and humic substances havefrequently been observed in water (Antia et al., 1991). Most ofthese species are directly bioavailable or can bemineralized toammonia to support microbial growth in aquatic systems.Bioavailable DON reportedly accounted for 43% and 28% of theDON in two coastal water samples during 150-day laboratoryincubations (Lønborg et al., 2009). Asmala et al. (2013) reportedthat 5.5% to 21.9% of DON in Finnish boreal estuaries withdifferent land use patterns was bioavailable and that thebioavailable DON in the Arbutus Lake watershed ranged from12% to 43% (Kang et al., 2013). Approximately 28%–57% ofwastewater effluent DON has been reported to be bioavailable(to algae and bacteria) and biodegradable (by bacteria)(Sattayatewa et al., 2009).
Some researchers have focused on the effects of DONcompounds with different molecular weights (MWs) onbacterial growth (Huo et al., 2014). Most amino acids andproteins in freshwater systems have MWs of lower than5 kDa, whereas most dissolved proteins are high-MW com-pounds (Berman and Bronk, 2003). Humic acid-like compo-nents are associated with high MWs, aromatic structures andhydrophobic properties (Tadanier et al., 2000; Sarathy andMohseni, 2007), whereas fulvic acid (FA)-like substances havelow MWs and are byproducts of microbial decomposition(Chen et al., 2003; Ishi and Boyer, 2012). Whether bacteria andphytoplankton can use DON fractions depends on the envi-ronmental conditions, chemical composition and microbialspecies present. Generally, the bacterial abundance is muchhigher when lower-MW DOM is added (Fagerberg et al., 2009).
Natural and anthropogenic inputs to watersheds are twoimportant DON sources in water systems. Seitzinger et al.(2002) suggested that 0 to 73% of the DON from natural(forests) and anthropogenic (animal pastures, urban/subur-ban storm water runoff) sources is used by estuarineplankton communities. DON components in pasture soilscan also be decomposed and are bioavailable (Ghani et al.,2013). During periods of incubation, DON is immobilized bymicrobes and mineralized in the soil, and its biodegradationis not affected by inorganic nitrogen input (Schmidt et al.,2011). However, few studies have investigated the bioavail-ability of DON in sediments; thus, it is necessary toinvestigate the microbial bioavailability of DON in sedi-ments. The main objectives of this study were as follows: (1)to use DAX-8 resin coupled with cation exchange resin toseparate the DON components in sediments; (2) to investi-gate the bioavailability of hydrophilic and hydrophobic DON
fractions; and (3) to discuss amino acid and fluorescencevariations during periods of incubation.
1. Materials and methods
1.1. Study area
Lake Shankou (126°50′46.86″–126°50′48.34″E, 48°31′40.75″–48°31′15.30″N) is located between Xiao Xingan Mountain andthe Nenjiang Plain, China. It is a deep, artificial reservoir witha surface area of 84 km2 and a mean annual runoff of820 million m3 (Fig. 1). Before the artificial reservoir wasconstructed, water flowed through the valley for a distanceof more than 20 km. Several projects were implemented inthe catchment area during its construction, including landclearing, forest burning and farmland submerging. Threemajor rivers flow into Lake Shankou, including the Nanbei,Changshui and Tulumu Rivers. Themajor types of land in thislake region include forestland (68.13%), everglades (14.46%),grassland (8.29%), dry cultivated land (7.08%) and constructionland (0.13%).
1.2. Sediment sample collection and pretreatment
Surface sediment samples (0 to 10 cm) were collected using agrab sampler at two stations that represented two differentDON-polluted regimes of Lake Shankou in October 2013 (Fig. 1).N4 was located in the Changshui river branch, which receiveslarge amounts of untreated municipal wastewater from thetown of Changshuihe, and N14 was located in the Nanbei riverbranch, which receives runoff water from sloping farmlandsand woodlands. The samples were placed into sealed polyeth-ylene tubes and temporarily stored in iceboxes at 4°C. Afterimmediate transfer to the laboratory, the samples were storedfrozen below −20°C and then freeze-dried at −50°C usingFD-1D-50 freeze-dryers. The dried samples were homogenizedusing an agate mortar and pestle and passed through a100-mesh sieve before analysis.
The 100 g samples were extracted using a 1 mol/L KClsolution (solid-to-water ratio of 1:10, W/V) for 1 hr in ahorizontal shaker at room temperature. The suspensions werecentrifuged at 5000 r/min for 15 min at 4°C and filtered through0.22 μm Millipore filters (mixed cellulose ester membrane) toremove suspended solids and residual bacteria. The filtrateswere stored at 4°C before analysis or fractionation.
1.3. Resin separation protocol
DAX-8 resin was used to separate the sediment into hydropho-bic and hydrophilic DON fractions. Before use, the resin wascleaned as described by Thurman and Malcolm (1981) and Liuet al. (2012). The cleaned DAX-8 resin (30 mL) was packed in aglass column, and 500 mL of the filtered sample was pumpedthrough the column at a flow rate of 1.5 mL/min. The columneffluent was acidified to pH 2.0 using 6 mol/L HCl and pumpedthrough the column again at a flow rate of 1.5 mL/min. Next,the column was cleaned using 0.1 mol/L HCl and deionizedwater at a flow rate of 1.5 mL/min. All effluent was collectedand passed through a cleaned cation exchange resin to remove

Changshuihe river
Nanbeihe river
Tulumuhe river
Fig. 1 – Sampling stations in Lake Shankou.
81J O U R N A L O F E N V I R O N M E N T A L S C I E N C E S 4 2 ( 2 0 1 6 ) 7 9 – 8 8
any NH4+ in solution. The final effluent was considered the
hydrophilic DON fraction. Next, the adsorbed fractions on theDAX-8 resin were eluted in the reverse direction with 0.1 mol/LNaOH and deionized water at a flow rate of 1.5 mL/min toobtain the hydrophobic DON fraction. The raw water from theextracted N4 and N14 samples was passed through cleanedcation exchange resin to remove NH4
+.
1.4. Laboratory incubation system
By considering the variations in DON uptake by differentbacteria, the untreated sample and hydrophobic and hydro-philic fractions were inoculated with three bacterial commu-nities derived from sediments, activated sludge and compostproducts. The bacterial solution was prepared using thefollowing steps. Samples (33.3 mg) were extracted in deion-ized water (solid-to-water ratio of 1:3, W/V) for 1 hr in ahorizontal shaker at room temperature. The mixtures werecentrifuged at 5000 r/min for 15 min at 20°C, and thesupernatants were sequentially filtered through 0.45 and0.22 μm Millipore filters (mixed cellulose ester membrane).Particles collected on the 0.22 μm filters were resuspended in100 mL of the 0.22 μm-filtered effluent as the bacterial inoculum.
Before microbial inoculation, the DON samples (200 mL)were adjusted to pH 7.0 by dropwise addition of 1 mol/L HCland NaOH solution and packed into 250-mL Erlenmeyer flasksfor sterilization. Next, 2 mL of each bacterial inoculum wasadded to each 200 mL sample. Each experimental group wasincubated in a constant temperature incubator at 25°C.
1.5. Chemical analysis
The concentration of DON was calculated as the differencebetween the TDN and the sum of the inorganic nitrogenspecies (i.e., NO3
− and NH4+) (Huo et al., 2014a). NO3
− and NH4+
were measured using an ultraviolet spectrophotometricmethod and the Nessler colorimetric method, respectively(Huo et al., 2014a), and TN was determined using the
persulfate digestion-ultraviolet spectrophotometric method(Huo et al., 2014b). The bacterial abundance was continuouslymonitored using the dilution-plate method, and the aminoacid concentration was measured using the ninhydrin colormethod (Chutipongtanate et al., 2012).
Fluorescence spectra were obtained from the untreated,hydrophobic and hydrophilic samples by using a F7000fluorescence spectrophotometer (Hitachi, Japan). The fluores-cence excitation–emission matrix (EEM) spectra were collect-ed from subsequent scanning emissions at 5 nm incrementsbetween 300 and 500 nm by varying the excitation wave-length by 5 nm increments from 200 to 400 nm EEM fluores-cence, and parallel factor analysis (PARAFAC) was used tocharacterize the DON fractions, as described previously byStedmon and Bro (2008).
2. Results and discussion
2.1. Separation of DON using DAX-8 and cation exchangeresins
The DON at the N4 and N14 stations accounted for 50.7% and52% of the TDN, respectively. Fractionating the DON in theextracted sediments into hydrophobic and hydrophilic frac-tions was accomplished using adsorption to and filtrationthrough a DAX-8 resin. The cation exchange resin was appliedto reduce the NH4
+ content. The total DON concentrationsmeasured in the hydrophobic and hydrophilic fractions weresimilar to those measured in the untreated samples (Table 1),and the DON recovery rates in the N4 and N14 samples afterresin separation were 96.17% ± 1.58% and 98.14% ± 0%, re-spectively, of those in the untreated samples. The hydrophilicDON fraction accounted for an average of 71.88% ± 2.85% ofthe TDN. The hydrophobic DON fraction had a higher C:N ratiothan the hydrophilic DON fraction, indicating the former'scomplex molecular structure. No significant DON concentra-tion variations were observed in the N4 and N14 samples.

Table 1 – Dissolved organic nitrogen (DON) concentrationsof after resin separation.
DON(mg/kg)
Recovery (%) C:N
N4 untreated sample 68.34 ± 2.75 96.17 ± 1.58 1.59 ± 0.01N4 hydrophilic fraction 47.12 ± 5.66 1.87 ± 0.06N4 hydrophobic fraction 18.60 ± 0.48 3.38 ± 0.09N14 untreated sample 76.98 ± 3.07 98.14 ± 0 1.86 ± 0.03N14 hydrophilic fraction 57.58 ± 2.87 1.59 ± 0.01N14 hydrophobic fraction 17.96 ± 0.15 3.20 ± 0.01 -1
4
9
14
19
24
N4 untreated sampleN4 hydrophilic fractionN4 hydrophobic fraction
N14 untreated sampleN14 hydrophilic fractionN14 hydrophobic fraction
Incubation time (day)
DO
N (
mg
N/L
)D
ON
(m
g N
/L)
DO
N (
mg
N/L
)
a
-1
4
9
14
19
24
29
Incubation time (day)
b
-1
4
9
14
19
24
29
0 5 10 15 20 25
0 5 10 15 20 25
0 5 10 15 20 25Incubation time (day)
c
Fig. 2 – Bioavailability of DON during the incubation process.(a) Adding sediment bacteria; (b) adding compost bacteria; (c)adding activated sludge bacteria. DON: dissolved organicnitrogen.
82 J O U R N A L O F E N V I R O N M E N T A L S C I E N C E S 4 2 ( 2 0 1 6 ) 7 9 – 8 8
2.2. Characterization of nitrogen species concentration duringincubation
The three bacterial communities exhibited a similar trend,with significantly decreasing DON concentrations in the first5 days, slowly decreasing DON concentrations until day 15 or20, and slightly increasing DON concentrations in the follow-ing days (Fig. 2). A similar DON trend has been reported inriver and municipal wastewater effluent (Seitzinger andSanders, 1997; Liu et al., 2014). It was assumed that the resinseparation, pH adjustment, and elution procedures did notalter the DON or introduce substances that could inhibitbacterial growth. In this study, approximately 69% to 79% ofthe DON decreased by day 5. Many DON molecules rapidlyadsorb onto cell wall surfaces during the initial inoculationperiod, and this fraction would be removed when passing thesuspension through a 0.22 μm membrane filter and could notbe determined. Meanwhile, the addition of labile DON tobacterial inocula resulted in a DON increase on day 0 (Liu etal., 2012). Next, the consumption of DON by bacteria wasresponsible for the subsequent slow decrease in DON concen-trations from day 5 to day 15 or 20 (Wadhawan et al., 2014).During the decline phase, DON was released from the cellsand could be determined. This release of DON resulted inincreased DON on days 20 or 25. Approximately 59% to 96% ofthe DON in the untreated samples and hydrophilic andhydrophobic fractions was bioavailable for the three bacterialcommunities. DON accounted for 79%–91% of the TDN in theinitial bacterial inoculums (i.e., 0 day), and TDN followed atrend that was similar to that of DON (Appendix A Fig. S1).This finding indicates that DON was the main nitrogen sourcefor bacterial growth. NH4
+-N and NO3−-N did not affect the
behavior of DON due to their low percentages in the TDN andtheir stable variations during the bacterial growth phase(Appendix A Figs. S2 and S3).
Remarkable differences were observed in the DON reduc-tion rates for the different DON fractions. The rates of DONreduction in the growth phase were 0.65–1.27 μg / (L · day) forthe untreated samples, 0.86–1.25 μg / (L · day) for the hydro-philic samples, and 0.29–0.38 μg / (L · day) for the hydropho-bic samples. The order of DON bioavailability was ranked asfollows: hydrophilic DON > untreated DON > hydrophobicDON. Hydrophilic DON was associated with lower MWs andlower C:N ratios (e.g., amino acids, urea, proteins, and nucleicacids), whereas hydrophobic DON was composed of abiodegradation-resistant pool with a higher MW, higher C:Nratio and complex structure (Reemtsma et al., 2008; Baker andCurry, 2004). Urea is a major component of hydrophilic DON
that can be used by many bacteria possessing urease. In LakeShankou, urea is another important labile DON component insediments. As mentioned above, the sloping cultivated land isan important type of land around the N4 and N14 stations(Fig. 1). Excess urea in farmlands was washed into the lakeand deposited into the sediments. After a small decrease onday 5 (Fig. 2), the concentration of hydrophobic DON remainedstable. These results indicate that most of the hydrophobicDON was not bioavailable. The small decrease in hydrophobicDON was attributed to the degradation of a small amount oflow-MW DON that was loosely held by or adsorbed to thehumic core structure (Bermann and Bronk, 2003; Stepanauskaset al., 1999; Watanabe et al., 2014). The C:N ratio reportedlyindicates the source of organic matter (Lee et al., 2006). The C:Nratio of the hydrophobic fractions averaged 3.38 and 3.20, whichwas higher than that of the hydrophilic fractions (1.87 and 1.59).The high C:N ratio of the hydrophobic fractions creates a higherN demand for bacterial decomposition (Liu et al., 2012),affirming the conclusion that the hydrophilic DON in sedi-ments was more bioavailable than the hydrophobic DON.
There was a clear regional difference in DON bioavailabilityin the sediments. As shown in Fig. 3, the average bioavailableDON ratios of hydrophilic DON and hydrophobic DON were 93

0
20%
40%
60%
80%
100%
N4 untreated sample
N4hydrophilic fraction
N4hydrophobicfraction
N14untreatedsample
N14 hydrophilic fraction
N14hydrophobicfraction
Adding sediment bacteria Adding activated sludge bacteria Adding compost bacteria
Bio
avai
labl
e D
ON
/DO
N r
atio
DON fraction
Fig. 3 – Bioavailable DON percentage after 25 d incubation process. DON: dissolved organic nitrogen.
83J O U R N A L O F E N V I R O N M E N T A L S C I E N C E S 4 2 ( 2 0 1 6 ) 7 9 – 8 8
and 80%, respectively, in the N4 samples and 82% and 71%,respectively, in the N14 samples. These results indicate thatthe DON in the sediments at N4 was more bioavailable thanthat at N14. N4 was located in the lake branch of theChangshuihe River, where agricultural activities, urban runoffand untreated wastewater contribute significantly to the DONin sediments. N14 was located in the lake branch of theNanbeihe River, where agricultural and forest runoff was themain source of DON for the sediments.
The soil DON contents changed with the surroundingecological environment, primarily depending on the soil andland use types. In the town of Changshuihe, untreatedwastewater results in the discharge of large amounts of Ninto the lake branch of Changshuihe. DON in domestic sewageis easily degraded because of its simple chemical structure.Influent DON from urban wastewater reportedly averages6.13 mg/L as N, and the <1 kDa fraction contributes an
Table 2 – Bacteria cell density (×105) of N4 and N14 extracted saactivated sludge bacteria or compost bacteria.
Day 0 Day 5 Day 1
Adding sediment bacteriaN4 untreated samples 15.0 ± 0.0 11.9 ± 0.7 58.4 ± 2N4 hydrophilic fraction 1.4 ± 0.0 28.4 ± 2.3 144.0 ± 3N4 hydrophobic fraction 0.2 ± 0.0 28.0 ± 2.8 33.7 ± 5N14 untreated samples 2.5 ± 0.0 19.4 ± 3.1 130.8 ± 1N14 hydrophilic fraction 0.1 ± 0.0 20.4 ± 5.1 146.6 ± 1N14 hydrophobic fraction 0.2 ± 0.0 31.0 ± 4.2 99.0 ± 1
Adding activated sludge bacteriaN4 untreated samples 0.4 ± 0.0 28.5 ± 0.6 162.4 ± 3N4 hydrophilic fraction 0.3 ± 0.0 90.8 ± 1.7 104.0 ± 3N4 hydrophobic fraction 0.2 ± 0.0 42.0 ± 22.6 151.0 ± 1N14 untreated samples 0.3 ± 0.0 98.0 ± 2.8 167.0 ± 1N14 hydrophilic fraction 6.0 ± 0.0 92.4 ± 5.1 108.2 ± 1N14 hydrophobic fraction 0.2 ± 0.0 48.4 ± 14.7 171.0 ± 1
Adding compost bacteriaN4 untreated samples 7.4 ± 0.0 53.4 ± 37.6 139.2 ± 2N4 hydrophilic fraction 10.0 ± 0.0 53.6 ± 0.0 60.0 ± 8N4 hydrophobic fraction 7.4 ± 0.0 8.1 ± 5.5 60.4 ± 0N14 untreated samples 2.0 ± 0.0 36.1 ± 0.7 160.2 ± 0N14 hydrophilic fraction 4.9 ± 0.0 22.8 ± 1.7 89.4 ± 0
average of 40%–57% of the DON (Huo et al., 2013). In forestsoils, hydrophobic N accounts for ca. 50% of DON and includesproteins, polyphenol mixtures and humic substances con-taining amino groups (Gao et al., 2011). Some hydrophilic DONcomponents in forest soils can be degraded and depositedinto rivers with sediments from runoff (Yu et al., 2002).However, most polyphenol N has a high MW (>100 kDa) andis not easily degraded in sediments.
Sloping farmland around Lake Shankou was created byforest clear-felling and burning before Lake Shankou wasbuilt. During replanting, the residual tree trunks, fallen leavesand other organic matter was washed into the valley by therising water level and rainfall. Field et al. (2003) reported thatnearly 56% of suspended charcoal is carried into the sedimentduring the first storm after forest clearing. Long-term appli-cation of chemical fertilizers can result in higher C and Nmineralization rates and can increase microbial biomass
mples during incubation process adding sediment bacteria,
0 Day 15 Day 20 Day 25
.3 2930.0 ± 70.7 25800.0 ± 4242.6 21200.0 ± 1131.43.9 3600.0 ± 282.8 28220.0 ± 28.3 18580.0 ± 2234.5.2 3730.0 ± 183.8 30000.0 ± 2828.4 17100.0 ± 4101.25.3 3580.0 ± 84.9 21000.0 ± 1414.2 16820.0 ± 28.39.0 3446.0 ± 121.6 27900.0 ± 1555.6 20320.0 ± 452.5.4 3699.0 ± 80.6 31600.0 ± 565.7 23200.0 ± 226.3
.4 3740.0 ± 84.9 22400.0 ± 1923.3 16200.0 ± 282.83.9 2580.0 ± 537.4 22860.0 ± 2121.3 14540.0 ± 3592.12.7 3760.0 ± 56.6 28280.0 ± 961.7 17000.0 ± 282.8.4 3905.0 ± 21.2 30500.0 ± 989.9 20560.0 ± 5091.26.7 3396.0 ± 192.3 25400.0 ± 1979.9 13720.0 ± 2432.42.7 3125.0 ± 227.7 32400.0 ± 565.7 24240.0 ± 339.4
0.4 3400.0 ± 282.8 27360.0 ± 2828.4 16720.0 ± 339.4.5 2960.0 ± 56.6 36640.0 ± 565.7 18840.0 ± 1979.9.6 3800.0 ± 141.6 29920.0 ± 2715.3 20180.0 ± 6759.9.3 3400.0 ± 28.3 30140.0 ± 84.9 31200.0 ± 1131.4.8 3798.0 ± 48.1 24200.0 ± 141.4 14480.0 ± 113.1
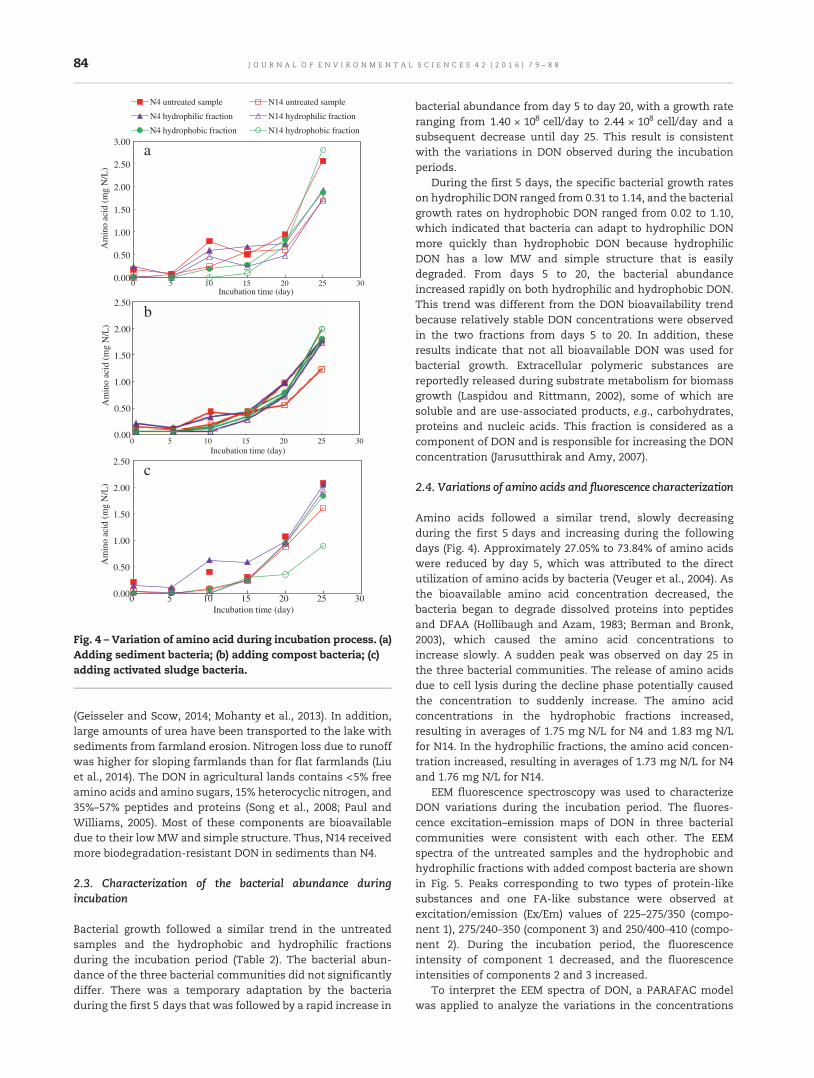
0.00
0.50
1.00
1.50
2.00
2.50
3.00
Am
ino
acid
(m
g N
/L)
Incubation time (day)
N4 untreated sample
N4 hydrophilic fraction
N4 hydrophobic fraction
N14 untreated sample
N14 hydrophilic fraction
N14 hydrophobic fraction
a
0.00
0.50
1.00
1.50
2.00
2.50
Am
ino
acid
(m
g N
/L)
0.00
0.50
1.00
1.50
2.00
2.50
Am
ino
acid
(m
g N
/L)
Incubation time (day)
0 5 10 15 20 25 30
0 5 10 15 20 25 30
0 5 10 15 20 25 30Incubation time (day)
c
b
Fig. 4 – Variation of amino acid during incubation process. (a)Adding sediment bacteria; (b) adding compost bacteria; (c)adding activated sludge bacteria.
84 J O U R N A L O F E N V I R O N M E N T A L S C I E N C E S 4 2 ( 2 0 1 6 ) 7 9 – 8 8
(Geisseler and Scow, 2014; Mohanty et al., 2013). In addition,large amounts of urea have been transported to the lake withsediments from farmland erosion. Nitrogen loss due to runoffwas higher for sloping farmlands than for flat farmlands (Liuet al., 2014). The DON in agricultural lands contains <5% freeamino acids and amino sugars, 15% heterocyclic nitrogen, and35%–57% peptides and proteins (Song et al., 2008; Paul andWilliams, 2005). Most of these components are bioavailabledue to their low MW and simple structure. Thus, N14 receivedmore biodegradation-resistant DON in sediments than N4.
2.3. Characterization of the bacterial abundance duringincubation
Bacterial growth followed a similar trend in the untreatedsamples and the hydrophobic and hydrophilic fractionsduring the incubation period (Table 2). The bacterial abun-dance of the three bacterial communities did not significantlydiffer. There was a temporary adaptation by the bacteriaduring the first 5 days that was followed by a rapid increase in
bacterial abundance from day 5 to day 20, with a growth rateranging from 1.40 × 10⁸ cell/day to 2.44 × 10⁸ cell/day and asubsequent decrease until day 25. This result is consistentwith the variations in DON observed during the incubationperiods.
During the first 5 days, the specific bacterial growth rateson hydrophilic DON ranged from 0.31 to 1.14, and the bacterialgrowth rates on hydrophobic DON ranged from 0.02 to 1.10,which indicated that bacteria can adapt to hydrophilic DONmore quickly than hydrophobic DON because hydrophilicDON has a low MW and simple structure that is easilydegraded. From days 5 to 20, the bacterial abundanceincreased rapidly on both hydrophilic and hydrophobic DON.This trend was different from the DON bioavailability trendbecause relatively stable DON concentrations were observedin the two fractions from days 5 to 20. In addition, theseresults indicate that not all bioavailable DON was used forbacterial growth. Extracellular polymeric substances arereportedly released during substrate metabolism for biomassgrowth (Laspidou and Rittmann, 2002), some of which aresoluble and are use-associated products, e.g., carbohydrates,proteins and nucleic acids. This fraction is considered as acomponent of DON and is responsible for increasing the DONconcentration (Jarusutthirak and Amy, 2007).
2.4. Variations of amino acids and fluorescence characterization
Amino acids followed a similar trend, slowly decreasingduring the first 5 days and increasing during the followingdays (Fig. 4). Approximately 27.05% to 73.84% of amino acidswere reduced by day 5, which was attributed to the directutilization of amino acids by bacteria (Veuger et al., 2004). Asthe bioavailable amino acid concentration decreased, thebacteria began to degrade dissolved proteins into peptidesand DFAA (Hollibaugh and Azam, 1983; Berman and Bronk,2003), which caused the amino acid concentrations toincrease slowly. A sudden peak was observed on day 25 inthe three bacterial communities. The release of amino acidsdue to cell lysis during the decline phase potentially causedthe concentration to suddenly increase. The amino acidconcentrations in the hydrophobic fractions increased,resulting in averages of 1.75 mg N/L for N4 and 1.83 mg N/Lfor N14. In the hydrophilic fractions, the amino acid concen-tration increased, resulting in averages of 1.73 mg N/L for N4and 1.76 mg N/L for N14.
EEM fluorescence spectroscopy was used to characterizeDON variations during the incubation period. The fluores-cence excitation–emission maps of DON in three bacterialcommunities were consistent with each other. The EEMspectra of the untreated samples and the hydrophobic andhydrophilic fractions with added compost bacteria are shownin Fig. 5. Peaks corresponding to two types of protein-likesubstances and one FA-like substance were observed atexcitation/emission (Ex/Em) values of 225–275/350 (compo-nent 1), 275/240–350 (component 3) and 250/400–410 (compo-nent 2). During the incubation period, the fluorescenceintensity of component 1 decreased, and the fluorescenceintensities of components 2 and 3 increased.
To interpret the EEM spectra of DON, a PARAFAC modelwas applied to analyze the variations in the concentrations

N4 untreated sample
N4 hydrophilic fraction
N4 hydrophobic fraction
N14 untreated sample
N14 hydrophilic fraction
N14 hydrophobic fraction
0 day 5 day 10 day 15 day 20 day
Em (nm) Em (nm) )mn(mE)mn(mE Em (nm)
Em (nm) Em (nm) )mn(mE)mn(mE Em (nm)
Em (nm) Em (nm) )mn(mE)mn(mE Em (nm)
Em (nm) Em (nm) )mn(mE)mn(mE Em (nm)
Em (nm) Em (nm) )mn(mE)mn(mE Em (nm)
Em (nm) Em (nm) )mn(mE)mn(mE Em (nm)
Ex
(nm
)
Ex
(nm
)
Ex
(nm
)
Ex
(nm
)
Ex
(nm
)
Ex
(nm
)
Ex
(nm
)
Ex
(nm
)
Ex
(nm
)
Ex
(nm
)
Ex
(nm
)
Ex
(nm
)
Ex
(nm
)
Ex
(nm
)
Ex
(nm
)
Ex
(nm
)
Ex
(nm
)
Ex
(nm
)
Ex
(nm
)
Ex
(nm
)
Ex
(nm
)
Ex
(nm
)
Ex
(nm
)
Ex
(nm
)
Ex
(nm
)
Ex
(nm
)
Ex
(nm
)
Ex
(nm
)
Ex
(nm
)
Ex
(nm
)
Fig. 5 – Three-dimensional excitation emission matrix fluorescence spectroscopy of dissolved organic nitrogen with addedcompost bacteria during the incubation periods.
85J O U R N A L O F E N V I R O N M E N T A L S C I E N C E S 4 2 ( 2 0 1 6 ) 7 9 – 8 8
and fluorescence intensities of three components during theincubation periods. The PARAFAC model for DON with addedcompost bacteria distinguished two protein-like substances(component 1 and component 3) and one FA-like substance
(component 2) for all samples, as shown in Appendix A Fig. S4.Component 1 contained two peaks (Ex/Em 275–285/226–251)that corresponded to tryptophan-like protein substances,which have been identified by Yamashita and Tanoue (2003)

40
50
60
70
80
90
100
110
F/F
0* (
%)
Incubation time (day)
N4 untreated sample
N4 hydrophilic fraction
N4 hydrophobic fraction
N14 untreated sample
N14 hydrophilic fraction
N14 hydrophobic fraction
Component 1
70
90
110
130
150
170
190
210
F/F
0* (
%)
Incubation time (day)
Component 2
80
100
120
140
160
180
200
220
0 5 10 15 20 25 30
0 5 10 15 20 25 30
0 5 10 15 20 25 30
F/F
0* (
%)
Incubation time (day)
Component 3
Fig. 6 – Changes in the fluorescence intensities of threePARAFAC-derived components during incubation process.PARAFAC: parallel factor analysis.
86 J O U R N A L O F E N V I R O N M E N T A L S C I E N C E S 4 2 ( 2 0 1 6 ) 7 9 – 8 8
in ocean water. The fluorescence characteristics of compo-nent 2 have rarely been identified. Chen et al. (2003) observedsimilar fluorophores (Ex/Em 214–220/440–450) for standard FAfrom the Suwannee River. The fluorophore of component 3was characterized by two peaks and exhibited peaks that weresimilar to those of tyrosine-like protein derived from wastesludge (Guo et al., 2014).
The changes in the fluorescence intensities of the threecomponents in the untreated samples and hydrophobic andhydrophilic fractions with added compost bacteria are shownin Fig. 6. The contents of components 1 and 3 varieddifferently during the incubation periods. The relative fluo-rescent intensity of component 1 decreased to 40.2%–42.1% inthe untreated samples to 45.4%–51.3% in the hydrophilicfractions and to 40.0%–44.4% in the hydrophobic fractions byday 25. The tryptophan-like proteins in the DON fractions werehighly bioavailable, especially in the hydrophilic fractions. Forprotein-like component 3, the relative fluorescent intensity
slowly increased during the first 20 days. In addition to theinoculation fluid, the biotic origin was responsible for theproduction of tryptophan- and tyrosine-like substances (Elliottet al., 2006). Tyrosine, with an aromatic protein-like structure, isuseful for maintaining the stability of microbial communities(Zhu et al., 2012). The gradually accumulated tyrosine-likesubstances are primarily attributed to the release of solublemicrobial products during bacterial metabolism (Laspidou andRittmann, 2002; Jarusutthirak and Amy, 2007).
For FA-like component 2, the relative fluorescence intensityincreased during the first 5 days and then decreased during thefollowing days. During the incubation periods, DFAA and DCAAwere preferentially used through direct uptake and hydrolysisor mineralization by bacteria (Pehlivanoglu and Sedlak, 2004).These processes contribute to the release of FA-like substancesadsorbed to the humic core structure and increase its relativefluorescence intensity. When large amounts of low-MWDON were utilized, FA-like substances were decomposed andtaken up by bacteria, which resulted in a relative decrease influorescence intensity.
3. Conclusions
DAX-8 resin coupled with cation exchange treatment wassuccessfully employed to separate the components of DON andto reduce ammonia nitrogen in sediments from Lake Shankou(resulting in a DON recovery rate of 97.16%–98.14%). Thehydrophilic fraction was the main form of DON at the N4 andN14 stations. Approximately 59% to 96% of the sediment-derivedDON was available for uptake in the presence of a bacterialinoculum. Hydrophilic DON was more easily degraded thanhydrophobic DON, with a DON reduction rate of 0.86–1.25 μg /(L · day) due to its low MW. The average degradation rates ofhydrophilic and hydrophobic DON in the N4 samples werehigher than those in the N14 samples. Bacteria can utilize freeamino acids directly, and the decomposition of dissolvedproteins can increase amino acid concentrations. TheEEM-PARAFAC model identified three DON components,tryptophan-like protein substances (component 1), FA-likesubstances (component 2), and tyrosine-like protein substances(component 3). Tryptophan-like protein and FA-like substanceswere degraded during the incubation periods. Simultaneously,tyrosine-like proteins began accumulating during bacterialmetabolism due to the release of SMPs.
Acknowledgments
This work was supported by the Mega-projects of ScienceResearch for Water Environment Improvement (No.2012ZX07101-002) and the National Natural Science Founda-tion of China (No. 41303085).
Appendix A. supplementary data
Supplementary data to this article can be found online athttp://dx.doi.org/10.1016/j.jes.2015.08.011.

87J O U R N A L O F E N V I R O N M E N T A L S C I E N C E S 4 2 ( 2 0 1 6 ) 7 9 – 8 8
R E F E R E N C E S
Antia, N.J., Berland, B.R., Bonin, D.J., 1980. Proposal for an abridgednitrogen turnover cycle in certain marine planktonic systemsinvolving hypoxanthine-guanine excretions by ciliates andtheir reutilization by phytoplankton. Mar. Ecol. Prog. Ser. 2,97–103.
Antia, N.J., Harrison, P.J., Oliveira, L., 1991. The role of dissolvedorganic nitrogen in phytoplankton nutrition, cell biology andecology. Phycologia 30 (1), 1–89.
Asmala, E., Autio, R., Kaartokallio, H., Pitkanen, L., Stedmon, C.A.,Thomas, D.N., 2013. Bioavailability of riverine dissolvedorganic matter in three Baltic Sea estuaries and the effect ofcatchment land use. Biogeosciences 10 (11), 6969–6986.
Baker, A., Curry, M., 2004. Fluorescence of leachates from threecontrasting landfills. Water Res. 38 (10), 2605–2613.
Berman, T., Bronk, D.A., 2003. Dissolved organic nitrogen: adynamic participant in aquatic ecosystems. Aquat. Microb.Ecol. 31 (3), 279–305.
Chen, W., Westeroff, P., Leenheer, J.A., Booksh, K., 2003.Fluorescence excitation–emission matrix regional integrationto quantify spectra for dissolved organic matter. Environ. Sci.Technol. 37 (24), 5701–5710.
Chutipongtanate, S., Watcharatanyatip, K., Homvises, T.,Jaturongkakul, K., Thongboonkerd, V., 2012. Systematiccomparisons of various spectrophotometric and colorimetricmethods to measure concentrations of protein, peptide andamino acid: detectable limits, linear dynamic ranges,interferences, practicality and unit costs. Talanta 98 (30),123–129.
Elliott, S., Lead, J.R., Baker, A., 2006. Characterisation of thefluorescence from freshwater, planktonic bacteria. Water Res.40 (10), 2075–2083.
Fagerberg, T., Carlsson, P., Lundgren, M., 2009. A large molecularsize fraction of riverine high molecular weight dissolvedorganic matter (HMW DOM) stimulates growth of the harmfuldinoflagellate Alexandrium minutum. Harmful Algae 8 (6),823–831.
Field, J.F., Farrish, K.W., Carter, E.A., 2003. Soil and nutrient lossfollowing site preparation burning in a harvested loblolly pinesite. Trans. ASAE. 46 (6), 1–7.
Gao, X.M., Huang, M.L., Que, C.Y., Zhou, B.Q., 2011. Researchprogress on soluble organic nitrogen pool in soil and itsfunctions in forestry ecosystem. Fujian J. Agric. Sci. 26 (6),1135–1141 (in Chinese).
Geisseler, D., Scow, K.M., 2014. Long-term effects of mineralfertilizers on soil microorganisms—a review. Soil Biol.Biochem. 75, 54–63.
Ghani, A., Sarathchandra, U., Ledgard, S., Dexter, M., Lindsey, S.,2013. Microbial decomposition of leached or extracteddissolved organic carbon and nitrogen from pasture soils. Biol.Fertil. Soils 49 (6), 747–755.
Guo, L., Lu, M.M., Li, Q.Q., Zhang, J.W., Zong, Y., She, Z.L., 2014.Three-dimensional fluorescence excitation–emission matrix(EEM) spectroscopy with regional integration analysis forassessing waste sludge hydrolysis treated with multi-enzymeand thermophilic bacteria. Bioresour. Technol. 171, 22–28.
Hollibaugh, J.T., Azam, F., 1983. Microbial degradation of dissolvedproteins in seawater. Limnol. Oceanogr. 28 (6), 1104–1116.
Huo, S.L., Xi, B.D., Yu, H.L., Qin, Y.W., Zan, F.Y., Zhang, J.T., 2013.Characteristics and transformations of dissolved organicnitrogen in municipal biological nitrogen removal wastewatertreatment plants. Environ. Res. Lett. 8 (4), 1–9.
Huo, S.L., Yu, H.L., Xi, B.D., Zan, F.Y., Zhu, C.W., Zhang, J.T., 2014a.Characteristics of dissolved organic nitrogen (DON) in thesurface water of Beijing Olympic Forest Park. Environ. EarthSci. 71 (9), 4021–4028.
Huo, S.L., Zhang, J.T., Xi, B.D., Zan, F.Y., Su, J., Yu, H., 2014b.Distribution of nitrogen forms in surface sediments of lakesfrom different regions, China. Environ. Earth Sci. 71 (5),2167–2175.
Ishii, S.K.L., Boyer, T.H., 2012. Behavior of reoccurring PARAFACcomponents in fluorescent dissolved organic matter in naturaland engineered systems: a critical review. Environ. Sci.Technol. 46 (4), 2006–2017.
Jarusutthirak, C., Amy, G., 2007. Understanding soluble microbialproducts (SMP) as a component of effluent organic matter(EfOM). Water Res. 41 (12), 2787–2793.
Kang, P., Mitchell, M.J., 2013. Bioavailability and size-fraction ofdissolved organic carbon, nitrogen, and sulfur at the ArbutusLake watershed, Adirondack Mountains, N Y. Biogeochemistry115 (1), 213–234.
Laspidou, C.S., Rittmann, B.E., 2002. A unified theory forextracellular polymeric substances, soluble microbialproducts, and active and inert biomass. Water Res. 36 (11),2711–2720.
Lee, W., Westerhoff, P., Esparza-soto, M., 2006. Occurrence andremoval of dissolved organic nitrogen in US water treatmentplants. J. Am. Water Work Assoc. 98 (10), 102–110.
Liu, H.Z., Jeong, J., Gray, H., Smith, S., Sedlak, D.L., 2012. Algaluptake of hydrophobic and hydrophilic dissolved organicnitrogen in effluent from biological nutrient removalmunicipal wastewater treatment systems. Environ. Sci.Technol. 46 (2), 713–721.
Liu, R.M., Wang, J.W., Shi, J.H., Chen, Y.X., Sun, C.C., Zhang, P.P.,Shen, Z.Y., 2014. Runoff characteristics and nutrient lossmechanism from plain farmland under simulated rainfallconditions. Sci. Total Environ. 468–469, 1069–1077.
Lønborg, C., Søndergaard, M., 2009. Microbial availability anddegradation of dissolved organic carbon and nitrogen in twocoastal areas. Estuar. Coast. Shelf Sci. 81 (4), 513–520.
Lønborg, C., Davidsona, K., Álvarez–Salgadob, X.A., Miller, A.E.J.,2009. Bioavailability and bacterial degradation rates ofdissolved organic matter in a temperate coastal area during anannual cycle. Mar. Chem. 113 (3-4), 219–226.
Mohanty, S., Nayak, A.K., Kumar, A., Tripathi, R., Shahid, M.,Bhattacharyya, P., Raja, R., Panda, B.B., 2013. Carbon andnitrogen mineralization kinetics in soil of rice–rice systemunder long term application of chemical fertilizers andfarmyard manure. Eur. J. Soil Biol. 58, 113–121.
Ogawa, H., Fukuda, R., Koike, I., 1999. Vertical distributions ofdissolved organic carbon and nitrogen in the Southern Ocean.Deep-Sea Res. I Oceanogr. Res. Pap. 46 (10), 1809–1826.
Paul, J.P., Williams, B.L., 2005. Contribution of α-amino N toextractable organic nitrogen(DON) in three soil types from theScottish uplands. Soil Biol. Biochem. 37 (4), 801–803.
Pehlivanoglu, E., Sedlak, D.L., 2004. Bioavailability of wastewater-derived organic nitrogen to the alga Selenastrum capricornutum.Water Res. 38 (14-15), 3189–3196.
Reemtsma, T., These, A., Linscheid, M., Leenheer, J., Spitzy, A.,2008. Molecular and structural characterization of dissolvedorganic matter from the deep ocean by FTICR-MS, includinghydrophilic nitrogenous organic molecules. Environ. Sci.Technol. 42 (5), 1430–1437.
Sarathy, S.R., Mohseni, M., 2007. The impact of UV/H2O2 advancedoxidation on molecular size distribution of chromophoricnatural organic matter. Environ. Sci. Technol. 41 (24), 8315–8320.
Sattayatewa, C., Pagilla, K., Pitt, P., Selock, K., Bruton, T., 2009.Organic nitrogen transformations in a 4-stage Bardenphonitrogen removal plant and bioavailability/biodegradability ofeffluent DON. Water Res. 43 (18), 4507–4516.
Schmidt, B.H.M., Kalbitz, K., Braun, S., Fuss, R., McDowell, W.H.,Matzner, E., 2011. Microbial immobilization andmineralizationof dissolved organic nitrogen from forest floors. Soil Biol.Biochem. 43 (8), 1742–1745.

88 J O U R N A L O F E N V I R O N M E N T A L S C I E N C E S 4 2 ( 2 0 1 6 ) 7 9 – 8 8
Seitzinger, S.P., Sanders, R.W., 1997. Contribution of dissolvedorganic nitrogen from rivers to estuarine eutrophication. Mar.Ecol. Prog. Ser. 159 (1), 1–12.
Seitzinger, S.P., Sanders, R.W., Styles, R., 2002. Bioavailability ofDON from natural and anthropogenic sources to estuarineplankton. Limnol. Oceanogr. 47 (2), 353–366.
Song, L.C., Hao, J.M., Cui, X.Y., 2008. Soluble organic nitrogen inforest soils of northeast China. J. For. Res. 19 (1), 53–57.
Stedmon, C., Bro, R., 2008. Characterizing dissolved organic matterfluorescence with parallel factor analysis: a tutorial. Limnol.Oceanogr. Methods 6 (11), 572–579.
Stepanauskas, R., Edling, H., Tranvik, L.J., 1999. Differentialdissolved organic nitrogen availability and bacterial aminopeptidase activity in limnic andmarine waters. Microb. Ecol. 38(3), 264–272.
Tadanier, C.J., Berry, D.F., Knocke, W.R., 2000. Dissolved organicmatter apparent molecular weight distribution and number-average apparent molecular weight by batch ultrafiltration.Environ. Sci. Technol. 34 (11), 2348–2353.
Thurman, E.M., Malcolm, R., 1981. Preparative isolation of aquatichumic substances. Environ. Sci. Technol. 15 (4), 463–466.
Veuger, B., Middelburg, J.J., Boschker, H.T.S., Nieuwenhuize, J., VanRijswijk, P., R-Newall, E.J., Navarro, N., 2004. Microbial uptakeof dissolved organic and inorganic nitrogen in Randers Fjord.Estuar. Coast. Shelf Sci. 61 (3), 507–515.
Wadhawan, T., Simisek, H., Kasi, M., Knutson, K., Prüβ, B., McEvoy,J., Khan, E., 2014. Dissolved organic nitrogen and its
biodegradable portion in a water treatment plant with zoneoxidation. Water Res. 54, 318–326.
Wang, S.R., Zhao, Y.L., Jiao, L.X., Zhang, L., Guo, W., 2015.Characteristics of soluble organic nitrogen composition andsources in sediments from Erhai Lake in China and the effecton the water quality. Environ. Earth Sci. 74 (5), 3849–3856.
Watanabe, A., Tsutsuki, K., Inoue, Y., Maie, N., Melling, L., Jaffé, R.,2014. Composition of dissolved organic nitrogen in riversassociated with wetlands. Sci. Total Environ. 493 (15), 220–228.
Yamashita, Y., Tanoue, E., 2003. Chemical characterization ofprotein-like fluorophores in DOM in relation to aromaticamino acids. Mar. Chem. 3 (82), 255–271.
Yu, Z., Zhang, Q., Kraus, T.E.C., Dahlgren, R.A., Anastasio, C.,Zasoski, R.J., 2002. Contribution of amino compounds todissolved organic nitrogen in forest soils. Biogeochemistry 61(2), 173–198.
Zhang, Y.L., Huo, S.L., Zan, F.Y., Xi, B.D., Zhang, J.T., 2015.Dissolved organic nitrogen (DON) in seventeen shallow lakesof Eastern China. Environ. Earth Sci. 74 (5), 4011–4021.
Zhu, L., Qi, H.Y., Lv, M.L., Kong, Y., Yu, Y.W., Xu, X.Y., 2012.Component analysis of extracellular polymeric substances(EPS) during aerobic sludge granulation using FTIR and 3D-EEMtechnologies. Bioresour. Technol. 124, 455–459.
J O U R N A L O F E N V I R O N M E N T A L S C I E N C E S 4 2 ( 2 0 1 6 ) 8 9 – 9 6
Ava i l ab l e on l i ne a t www.sc i enced i r ec t . com
ScienceDirect
www. jou rna l s . e l sev i e r . com/ j es
Aqueous stability and mobility of C60 complexed by sodiumdodecyl benzene sulfonate surfactant
Xianjia Peng1,⁎, Yue Yuan1, Hongyu Wang2, Chuan Liang1
1. Key Laboratory of Drinking Water Science and Technology, Research Center for Eco-Environmental Sciences, Chinese Academy of Sciences,Beijing 100085, China2. College of Civil Engineering and Architecture, Zhejiang University of Technology, Hangzhou 310014, China
A R T I C L E I N F O
⁎ Corresponding author. E-mail: xjpeng@rcee
http://dx.doi.org/10.1016/j.jes.2015.05.0261001-0742/© 2015 The Research Center for Ec
A B S T R A C T
Article history:Received 26 March 2015Revised 23 May 2015Accepted 28 May 2015Available online 15 August 2015
Surfactant complexation may have significant effects on the environmental behavior ofnano-particles. In order to understand the ecological exposure of nano-materials, it isimportant to determine the stability and mobility of surfactant-complexed nano-materialsin aqueous systems. In this study, the aggregation and transport of C60 complexed bythe surfactant sodium dodecyl benzene sulfonate (SDBS) were investigated. It was foundthat SDBS-complexed C60 had a ζ-potential of −49.5 mV under near-neutral pH conditionsand remained stable during an aging period of 15 days. It had a critical coagulationconcentration of 550 mmol/L for NaCl, which was higher than common natural colloidsand many kinds of raw nano-materials, and was comparable to those of many kinds ofsurface-modified nano-materials. SDBS enhanced the stability of C60 colloid; however, atthe same time, it also enhanced the colloidal particle aggregation rate. Much highermobility was found for SDBS-complexed C60 than C60 colloid. Increase in ionic strength, Ca2+
concentration or Al3+ concentration decreased themobility. In general, SDBS-complexed C60
had high stability and mobility.© 2015 The Research Center for Eco-Environmental Sciences, Chinese Academy of Sciences.
Published by Elsevier B.V.
Keywords:FullereneAggregationTransportSurfactantCarbon nano-materials
Introduction
Amongmany kinds of nanomaterials developed, C60 (Fullerene)was a landmark discovery for carbon nanomaterials and hasattracted wide attention since its discovery. C60 has a sphericalcage-like molecular structure and its discovery has led to theequally significant subsequent discovery of other fullerenes,including carbon nanotubes (CNTs) (Chen and Elimelech, 2006).C60 is a classical engineeredmaterialwith potential applications
s.ac.cn (X. Peng).
o-Environmental Science
in the areas of biomedical technology, electronics, optics, etc.C60 is highly hydrophobic, tends to aggregate and is notreadily dispersed in the aqueous phase. However, thecomplexation of C60 with manufactured surfactants mayenhance the aqueous stability and thus enhance its mobilityin environmental media. The complexation of C60 withsurfactant to enhance aqueous stability may occur in twomain ways, i.e., (1) the complexation of C60 discharged intothe environment with residual surfactants discharged to theenvironment by human activities; and (2) the complexation
s, Chinese Academy of Sciences. Published by Elsevier B.V.

90 J O U R N A L O F E N V I R O N M E N T A L S C I E N C E S 4 2 ( 2 0 1 6 ) 8 9 – 9 6
of C60 with surfactants in industrial processes to enhance theaqueous solubility of C60.
Surfactants are a diverse group of chemicals that are bestknown for their wide use in detergents and other cleaningproducts. Annual production of surfactants worldwide hasrisen to 12.5 million tons (Tan et al., 2010). No doubt thisfigure will grow with the ever growing detergent and cosmeticindustries. After being used, residual surfactants aredischarged into sewage systems or directly into surfacewaters. Most of them finally disperse in different environ-mental compartments such as soil, water or sediment(Ivankovic and Hrenovic, 2010). Although most surfactantsare readily biodegradable, the existence of surfactants in theenvironment is obvious in many regions due to the continualdischarge (Sanderson et al., 2006; Ying, 2006). For example, theconcentration/mass fraction of one of the most commonsurfactants, linear alkylbenzene sulphonic acid (LAS), reached1.1 mg/L in sewage effluents (Holt et al., 1998) and 30.2 g/kgdry mass of treated sludge (Berna et al., 1989). Up to 0.4 mg/Lof LAS was measured in surface waters (Fox et al., 2000). Theelevated levels of surfactants in the environment can greatlyaffect the transport and fate of environmental pollutants inthe environment. With the possible discharge of C60 into theaqueous environment, the complexation of C60 in the aquaticenvironment with residual surfactants may enhance thestability and mobility of C60.
On the other hand, in the application of nano-materials, it isoften required that C60 be debundled and made hydrophilic inorder to be solubilized in the aqueous phase. In these cases,surfactant treatment is usually employed to modify C60. Solubi-lizing C60 by attaching surfactants to the surface throughnon-covalent interactions is an important approach to enhancethe hydrophilic properties for solubilization. For example, C60 canbe solubilized inwater after beingwrappedwith triptycene-basedsurfactants (Torres et al., 2011). Surfactants such as Tween 20,Tween 60, Tween 80, Triton X-100, polyoxyethylene (10) laurylether, n-dodecyl trimethylammonium chloride, myristyltrimethylammonium bromide and sodium dodecyl sulfate canbe used to solubilize C60 to facilitate its biomedical application(Hammershøj et al., 2012).
In previous investigations, the environmental aspects ofraw carbon nano-materials (Prylutskyy et al., 2013; Wang etal., 2014) and oxidized carbon nano-materials (Li and Huang,2010) have been documented. Recently, the stability andmobility of surfactant complexed carbon nano-materialshave become the concern of several researchers. The aggre-gation and transport of one kind of carbon nano-materials,single-walled carbon nanotubes, after surfactant complexa-tion were investigated (Bouchard et al., 2012). Due to the factthat surfactant complexation may increase the aqueousstability and mobility of C60, which may subsequentlyfacilitate the transport of environmental pollutants andcause enhanced harm to organisms, it seems necessary tounderstand the fate of surfactant-complexed C60 in thenatural environment. Wang et al. (2012a) also investigatedthe effect of different kinds of surfactants on the mobility ofC60.
In this investigation, the stability and mobility ofsurfactant-complexed C60 was studied as affected byelectrolytes.
1. Experimental
1.1. Materials
The C60 used in this study, which was claimed to have a purityof 99.9% by the producer, was purchased from Nanjing JicangNano-Material Company (Nanjing, China). It was used asreceived without further purification. Surfactant sodiumdodecyl benzene sulfonate (SDBS) of analytical grade wasprovided by Sinopharm Chemical Reagent Co. Ltd. Tetrahy-drofuran (THF) of HPLC grade was purchased from DikmaTechnologies INC, USA. Glass beads with an average diameterof 1.0 mm were employed as the porous media. Before beingused, the beads were soaked in 0.01 mol/L NaOH for 24 hr andthen in 0.01 mol/L HNO3 for 24 hr. After being washed withultra-pure water, the beads were dried at 105°C for 12 hr andstored in a closed desiccator. Ultra-pure water was usedthroughout the experiments.
1.2. Characterization and concentration measurement
The ζ-potentials of SDBS-complexed C60 dispersions weredetermined at various pH values, and the pH values of thedispersions were adjusted using either HCl or NaOH. The C60
concentration was analyzed spectrophotometrically using aHach DR-5000 UV–visible spectrophotometer at 800 nm usingmatched 10 mm quartz cells. It was observed that SDBS had noabsorbance at 800 nm, and there was a good correlation betweenthe absorbance at this wavelength and the C60 concentration. Asimilar phenomenon was also observed by Lin et al. (2009), whofound a good correlation between the absorbance and theconcentration of multi-walled carbon nanotubes (MWCNTs) at800 nm in the presence of tannic acid.
1.3. Preparation of SDBS-complexed C60
Before the preparation of SDBS-complexed C60 colloid, C60
colloid was prepared employing the method of Fortner et al.(2005) with modifications. 0.02 g C60 was added to 400 mL THFand N2 was sparged to remove oxygen. Then the bottle wassealed to prevent contact with air. Sonication was employedfor the solubilization of C60 and a sonication time of 15 minwas employed. After sonication, the mixture was filteredusing a 0.45 μm nylon membrane, and a transparent pinkliquid was obtained. Then 400 mL water was added to thesolution and a yellow solution was obtained. A three-stepevaporating procedure using a rotary evaporator was thenemployed for removal of THF from the mixture, with anevaporating temperature of 75°C. First, the obtained 800 mLliquid was evaporated to 350 mL. Then 100 mL water wasadded and the obtained 450 mL liquid was evaporated to350 mL. Finally, 100 mL water was added, the liquid wasevaporated to 400 mL and the obtained liquid was cooled toroom temperature and employed as C60 colloid in subsequentstudy. For the preparation of SDBS-complexed C60 colloid, aprescribed amount of SDBS was added to the C60 colloid,stirred for 12 hr and stored at room temperature for later use.Every time before being used, the C60 colloid was sonicated for10 min.
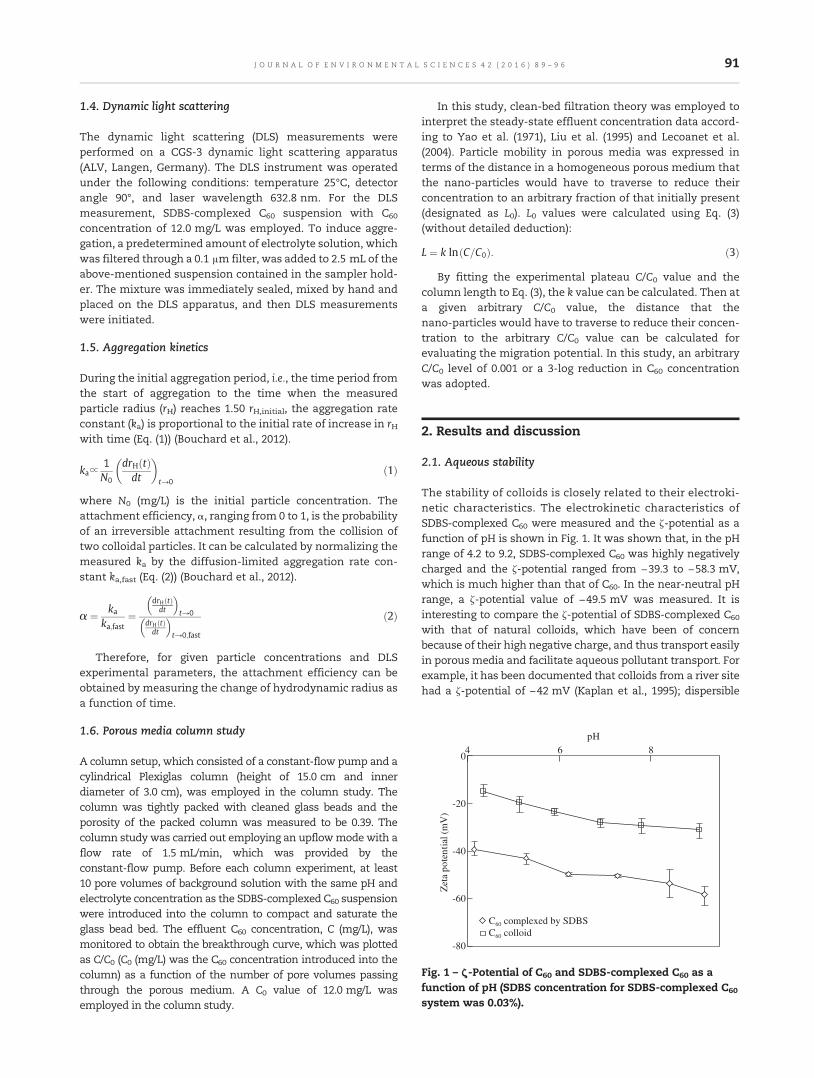
-80
-60
-40
-20
04 6 8
pH
Zet
a po
tent
ial (
mV
)
C60 complexed by SDBSC60 colloid
Fig. 1 – ζ-Potential of C60 and SDBS-complexed C60 as afunction of pH (SDBS concentration for SDBS-complexed C60
system was 0.03%).
91J O U R N A L O F E N V I R O N M E N T A L S C I E N C E S 4 2 ( 2 0 1 6 ) 8 9 – 9 6
1.4. Dynamic light scattering
The dynamic light scattering (DLS) measurements wereperformed on a CGS-3 dynamic light scattering apparatus(ALV, Langen, Germany). The DLS instrument was operatedunder the following conditions: temperature 25°C, detectorangle 90°, and laser wavelength 632.8 nm. For the DLSmeasurement, SDBS-complexed C60 suspension with C60
concentration of 12.0 mg/L was employed. To induce aggre-gation, a predetermined amount of electrolyte solution, whichwas filtered through a 0.1 μm filter, was added to 2.5 mL of theabove-mentioned suspension contained in the sampler hold-er. The mixture was immediately sealed, mixed by hand andplaced on the DLS apparatus, and then DLS measurementswere initiated.
1.5. Aggregation kinetics
During the initial aggregation period, i.e., the time period fromthe start of aggregation to the time when the measuredparticle radius (rH) reaches 1.50 rH,initial, the aggregation rateconstant (ka) is proportional to the initial rate of increase in rHwith time (Eq. (1)) (Bouchard et al., 2012).
ka∝1N0
drH tð Þdt
� �
t→0ð1Þ
where N0 (mg/L) is the initial particle concentration. Theattachment efficiency, α, ranging from 0 to 1, is the probabilityof an irreversible attachment resulting from the collision oftwo colloidal particles. It can be calculated by normalizing themeasured ka by the diffusion-limited aggregation rate con-stant ka,fast (Eq. (2)) (Bouchard et al., 2012).
α ¼ kaka;fast
¼drH tð Þdt
� �t→0
drH tð Þdt
� �t→0;fast
ð2Þ
Therefore, for given particle concentrations and DLSexperimental parameters, the attachment efficiency can beobtained by measuring the change of hydrodynamic radius asa function of time.
1.6. Porous media column study
A column setup, which consisted of a constant-flow pump and acylindrical Plexiglas column (height of 15.0 cm and innerdiameter of 3.0 cm), was employed in the column study. Thecolumn was tightly packed with cleaned glass beads and theporosity of the packed column was measured to be 0.39. Thecolumn study was carried out employing an upflowmode with aflow rate of 1.5 mL/min, which was provided by theconstant-flow pump. Before each column experiment, at least10 pore volumes of background solution with the same pH andelectrolyte concentration as the SDBS-complexed C60 suspensionwere introduced into the column to compact and saturate theglass bead bed. The effluent C60 concentration, C (mg/L), wasmonitored to obtain the breakthrough curve, which was plottedas C/C0 (C0 (mg/L) was the C60 concentration introduced into thecolumn) as a function of the number of pore volumes passingthrough the porous medium. A C0 value of 12.0 mg/L wasemployed in the column study.
In this study, clean-bed filtration theory was employed tointerpret the steady-state effluent concentration data accord-ing to Yao et al. (1971), Liu et al. (1995) and Lecoanet et al.(2004). Particle mobility in porous media was expressed interms of the distance in a homogeneous porous medium thatthe nano-particles would have to traverse to reduce theirconcentration to an arbitrary fraction of that initially present(designated as L0). L0 values were calculated using Eq. (3)(without detailed deduction):
L ¼ k ln C=C0ð Þ: ð3Þ
By fitting the experimental plateau C/C0 value and thecolumn length to Eq. (3), the k value can be calculated. Then ata given arbitrary C/C0 value, the distance that thenano-particles would have to traverse to reduce their concen-tration to the arbitrary C/C0 value can be calculated forevaluating the migration potential. In this study, an arbitraryC/C0 level of 0.001 or a 3-log reduction in C60 concentrationwas adopted.
2. Results and discussion
2.1. Aqueous stability
The stability of colloids is closely related to their electroki-netic characteristics. The electrokinetic characteristics ofSDBS-complexed C60 were measured and the ζ-potential as afunction of pH is shown in Fig. 1. It was shown that, in the pHrange of 4.2 to 9.2, SDBS-complexed C60 was highly negativelycharged and the ζ-potential ranged from −39.3 to −58.3 mV,which is much higher than that of C60. In the near-neutral pHrange, a ζ-potential value of −49.5 mV was measured. It isinteresting to compare the ζ-potential of SDBS-complexed C60
with that of natural colloids, which have been of concernbecause of their high negative charge, and thus transport easilyin porous media and facilitate aqueous pollutant transport. Forexample, it has been documented that colloids from a river sitehad a ζ-potential of −42 mV (Kaplan et al., 1995); dispersible

1000
1200
100 mmol/L 200 mmol/L 300 mmol/L400 mmol/L 500 mmol/L 550 mmol/L600 mmol/L 700 mmol/L 800 mmol/L
1000 mmol/L
92 J O U R N A L O F E N V I R O N M E N T A L S C I E N C E S 4 2 ( 2 0 1 6 ) 8 9 – 9 6
clays from surface or near-surface sediment possessed aζ-potential of about −25 mV (pH 7–10) (Ryan and Gschwend,1994); the ζ-potential of colloids from a coastal plain wasmeasured to be −41 to −18 mV (Kaplan et al., 1993).As compared to these naturally occurring colloids,SDBS-complexed C60 has higher negative charge, which mayenhance its mobility and facilitate its transport. Recently, theelectrokinetic characteristics of several kinds of modifiednano-materials have been of concern and were documented.Previous investigation showed that oxidized multi-walledcarbon nanotubes (MWCNTs) had negative ζ-potentials in therange of −31.0 to −49.5 mV in the pH range 2.6–6.5, and aζ-potential value of −49.5 mV was measured undernear-neutral pH conditions (Peng et al., 2009). The ζ-potentialvalue of oxidized single-walled carbon nanotubes (SWCNTs)reached −45 mV (Li et al., 2008). That of natural organic matter(NOM)-modified C60 was documented to reach −42 mV (Wanget al., 2012b). The value measured in this investigation seemedto be quite comparable to those of other kinds of modifiednano-materials in previous investigations.
The stability of C60 colloid and SDBS-complexed C60 wasinvestigated using a sedimentation test and the results areshown in Fig. 2. It can be seen from this figure thatSDBS-complexed C60 has higher stability than C60 colloid. Ithas been reported that oxidized and surfactant-modifiedCNTs have relatively high stability in the aqueous phase.SWCNTs modified by low-concentration surfactant weredocumented to have high stability. The suspended mass andζ-potential potential varied by <5% over a 17-day period(Bouchard et al., 2012). Oxidized MWCNTs were reported tohave a concentration decrease of only 15% even after 30-dayaging (Peng et al., 2009). It is shown in Fig. 2 that the C60
concentration remained almost constant during an agingperiod of 15 days, which indicated that SDBS-complexed C60
had rather high stability. The stable dispersion ofSDBS-complexed C60 may make it a potential pollutant afterbeing discharged into water bodies.
The high stability of SDBS-complexed C60 is mainly due tothree mechanisms. The first one is that the surfactant coatingenhanced the dispersive properties of C60 through providingan increased electrostatic repulsion. In the aqueous phase,the electrostatic repulsive forces between the negative surface
0 5 10 15Time (day)
0
0.2
0.4
0.6
0.8
1.0
C/C
0
C60 complexed by SDBSC60 colloid
Fig. 2 – C60 concentration versus aging time inSDBS-complexed C60 dispersion (SDBS concentration forSDBS-complexed C60 system was 0.03%).
charges of the surfactant coated on C60 surfaces led to thestability of C60, and the SDBS-complexed C60 formed a stabledispersion in water. The second is that the surfactant coatingreduced the surface hydrophobicity, which facilitates aggre-gation. In the investigation of enhanced stability of SWCNTsby surfactants, Bouchard et al. (2012) suggested that surfac-tant adsorbed on the SWCNT surface reduced the exposure ofpristine surface to the aqueous phase and thus enhancedSWCNT stability. This mechanism can also be employed forthe explanation of the high stability of SDBS-complexed C60.The pristine carbon surface, which was highly hydrophobic,facilitated the aggregation and reduced the colloid stability.However, after surfactant was adsorbed on the surface, achemically heterogeneous surface was created and thehydrophobic surface was partially shielded. This also en-hanced the stability. The third mechanism is the stericrepulsion between C60 caused by the adsorbed SDBS.
2.2. Aggregation kinetics
The aggregation kinetics of SDBS-complexed C60 was studiedover a NaCl concentration range of 100 to 1000 mmol/L atpH 6.5, and an SDBS concentration of 0.015% was adopted forthe colloid preparation. The aggregation experiments werecarried out in duplicate and the results showed goodreproducibility. Fig. 3 shows the aggregation profiles. It wasindicated that, under very low electrolyte concentrations(NaCl concentration ≤ 100 mmol/L), no obvious aggregationwas observed. However, when the NaCl concentration in-creased to 200 mmol/L, the growth of the hydrated particleradius became observable. The positive correlation of theaggregate size of SDBS-complexed C60 with ionic strength is inaccordance with other kinds of nano-particles (Conway et al.,2015). With the further increase in NaCl concentration from200 to 550 mmol/L, the drHðtÞ
dt value increased rapidly, which
0
200
400
600
800
0 10 20 30Time (min)
r H (
nm)
Fig. 3 – Aggregation kinetics of SDBS-complexed C60 over aNaCl concentration range of 100 to 1000 mmol/L at pH 6.5.

93J O U R N A L O F E N V I R O N M E N T A L S C I E N C E S 4 2 ( 2 0 1 6 ) 8 9 – 9 6
meant an increasing degree of aggregation with increasingelectrolyte concentration. After that point, the drHðtÞ
dt valueremained constant, indicating the occurrence of fast aggrega-tion. The measured kinetics was in accordance with the tworegimes typical of colloidal systems, in which the aggregationkinetics can be explained by DLVO theory. Under lowelectrolyte concentration conditions, attachment efficiencyincreased due to the screening of particle surface charge andthe reduction of the energy barrier to aggregation. This wascalled the reaction-limited regime or slow aggregation regimeand the attachment efficiency was governed, in part, byelectrostatic repulsive interactions. With the further increasein electrolyte concentration, the surface charge of particleswas completely screened, the energy barrier was eliminated,and the drHðtÞ
dt value reached 1.0 and remained constant. Theaggregation was no longer governed by electrostatic repulsiveinteractions but by the diffusion of particles. This is known asthe diffusion-limited regime. The increasing aggregation withincreasing electrolyte concentration indicated that electro-static repulsion played an important role in the stabilization.
Fig. 4 shows the attachment efficiency of SDBS-complexedC60 as a function of salt concentration. The SDBS concentrationadopted was also 0.015%. The critical coagulation concentration(CCC) valueswere obtainedbydetermining the intersectionpointbetween the reaction-limited regime and the diffusion-limitedregime. The CCC value of NaCl for SDBS-complexed C60 obtainedfrom this investigation, as shown in Fig. 4, was 550 mmol/L at thenear-neutral pH value employed. The magnitude of CCCvalues for natural colloids, nano-materials and modifiednano-materials has been of concern due to the fact that theirstability will facilitate their transport in the environment. It wasdocumented that two kinds of natural colloids, montmorilloniteand illite, had CCC values of 5 and 34 mmol/L NaCl, respectively(Lagaly and Ziesmer, 2003; Jiang et al., 2012). Although muchhigher valueshave beendocumented for specific kinds of naturalcolloids, for example, a CCC value of 137 ± 24 mmol/L NaCl hasbeen measured for quartz (Jiang et al., 2012), most naturalcolloids were reported to have CCC magnitudes of tens ofmmol/L NaCl or lower. Generally, though several kinds ofman-made nano-materials have lower CCC values, mostman-made nano-materials seem to have higher CCC values
0
0.2
0.4
0.6
0.8
1.0
0.01 0.1 1 10 100 1000 10000
Salt concentration (mmol/L)
Atta
chm
ent e
ffic
ienc
y
NaCl
CaCl
AlCl
Fig. 4 – Attachment efficiency of SDBS-complexed C60 as afunction of salt concentration.
than natural colloids. It has been documented that CeO2
nano-particles had a CCC value of 34 mmol/L KCl (Li et al.,2011). That of SWCNTswas reported to be 20 mmol/LNaCl (Salehet al., 2010). However, those of pure magnetite sol, C60 and boronnano-particles reached 120, 160 and 200 mmol/L, respectively(Illés and Tombácz, 2006; Chen and Elimelech, 2007; Liu et al.,2010). Surfacemodification of colloidal particles can significantlyenhance their stability. After the modification process ofoxidation, CCC values for SWCNTs and MWCNTs reached160 mmol/L (Li and Huang, 2010) and 185 mmol/L (Peng et al.,2009), respectively. That of surfactant-complexed SWCNTsvaried in the range of 121–871 mmol/L, depending on thesurfactant concentration adopted (Bouchard et al., 2012). It hasalso been shown that, even at high NaCl concentration, humicacid-complexedC60 showedvery slowaggregationkinetics (Chenand Elimelech, 2007). The measured CCC value of 550 mmol/LNaCl for surfactant-complexed C60 seemed to be higher thannatural colloids and many kinds of raw nano-materials, compa-rable to those of surface-modified nano-materials and lowerthan that of extremely stable systems, such as humicacid-complexed C60.
Generally, the valence of electrolyte cations has a signifi-cant effect on the aggregation of colloids. The attachmentefficiencies of SDBS-complexed C60 as a function of CaCl2 andAlCl3 concentration are also shown in Fig. 4, and CCC valuesfor CaCl2 and AlCl3 were determined to be 6 mmol/L and0.5 mmol/L, respectively. The ratio of the CCC values for NaCl,CaCl2 and AlCl3 was 1100:12:1, different from the ratio of729:11.4:1 predicted by the Schulze–Hardy rule. The differencebetween the experimental data and the Schulze–Hardy rulemaybe was due to the fact that salts not only acted aselectrostatic screening electrolytes for surfactant complexedC60 colloids, but also reacted with the surfactant in theaqueous solution to form surfactant micelles.
The aggregation of SDBS-complexed C60 under varyingsurfactant concentration as a function of NaCl concentrationwas also investigated. The results showed that the CCC values ofSDBS-complexed C60 under surfactant concentrations of 0.001%,0.005%, 0.010%, 0.015% and 0.050% (the critical micelle concen-tration of SDBS under the experimental conditions was 0.052%)were 450, 500, 550, 600, 700 and 800 mmol/L NaCl, respectively,which indicated that the stability of C60 increased with theincrease in surfactant concentration. This is different from fulvicacid- and bacillus subtilis exudate-complexed nano-particles, inwhich case adsorption of organic molecules onto nano-particlescan enhance aggregation via colloidal bridging and/or chargeneutralization, or with more complete surface coverage, candiminish aggregation via electrostatic repulsion and/or sterichindrance (Duster and Fein, 2014). Moreover, the ðdrHðtÞdt Þt→0;fastvalues obtained under surfactant concentrations of 0.001%,0.005%, 0.010%, 0.015% and 0.050% were 12.2, 18.3, 27.9, 43.8 and59.7 nm/min, respectively, which indicated that SDBS in theaqueous phase enhanced the colloidal particle growth rate.Similar results were also obtained under electrolyte concentra-tions below the CCC values. For example, for NaCl concentrationof 400 mmol/L, the ðdrHðtÞdt Þt→0 values obtained under SDBSconcentrations of 0.001%, 0.005%, 0.010%, 0.015% and 0.050%were 5.3, 8.2, 10.3, 13.8 and 35.7 nm/min, respectively, which alsoindicated that surfactant in the aqueous phase enhanced thecolloidal particle growth rate. The increase in colloidal particle

0
0.2
0.4
0.6
0.8
1.0
20 1 3 4 5V/V0
C/C
0
5 mmol/L25 mmol/L50 mmol/L100 mmol/L
Fig. 6 – Breakthrough curves of C60 under various NaClconcentrations.
94 J O U R N A L O F E N V I R O N M E N T A L S C I E N C E S 4 2 ( 2 0 1 6 ) 8 9 – 9 6
growth rate with the increase in SDBS concentration was due tothe fact that electrolyte reacted with the surfactant in theaqueous solution and surfactant micelles formed, which com-bined with C60 colloidal particles and enhanced the colloidgrowth rate.
2.3. Transport in porous media
Breakthrough curves of SDBS-complexedC60 (0.015%SDBS) undervarious ionic strength conditions are presented in Fig. 5, whichshow the normalized effluent C60 concentration (C/C0) as afunction of the cumulative number of pore volumes passingthrough the porous media. An ionic strength range of 5.0 to100.0 mmol/L NaCl was employed for the investigation. Beforethe investigation, the DLS data were recorded to determine thestability of the dispersions under the employed dispersionconditions for transport investigation. The results showed that,during the 10 hr aging, there was no obvious aggregation. As acomparison, breakthrough curves of C60 were also studied andthe results are presented in Fig. 6. It was shown that, under thesame ionic strength conditions, SDBS-complexed C60 had amuchhigher plateau C/C0 value than C60, which indicated thatsurfactant complexation significantly enhanced the mobility.This is in accordance with Yang et al. (2013) and Wang et al.(2012), who found that oxidation or complexation by stabilizingagents enhanced the mobility of carbon nano-materials, due toincreased electrostatic repulsion. The particle mobility in porousmedia is generally dependent on twomain processes. One is theBrownian diffusion process, which determines the transport ofparticles from fluid to the media surface. Another is thedeposition of particles on the media surface. It can be arguedthat the enhancement of C60mobility by complexationwith SDBSwas due to the fact that surfactant complexation, whichsignificantly enhanced particle surface charge, decreased thedeposition. The deposited particles on the media surface, whichwere negatively charged, excluded the immediate vicinity of thecollector surface from subsequent deposition. This surfaceexclusion phenomenon has been termed blocking (Liu et al.,1995). Compared with C60, SDBS-complexed C60 had enhancedblocking properties due to the enhanced surface charges.
0
0.2
0.4
0.6
0.8
1.0
0 1 2 3 4 5V/V0
C/C
0
5 mmol/L25 mmol/L50 mmol/L100 mmol/L
Fig. 5 – Breakthrough curves of SDBS-complexed C60 undervarious NaCl concentrations.
The calculation of the L0 values showed that, under the nearneutral pH value and low ionic strength (5 mmol/L NaCl)conditions, SDBS-complexed C60 had an L0 value of 22.25 m.Generally, surface oxidation using a strong oxidant will alsointroduce negative surface charges on the surface of carbonnano-materials,whichwill be capable of enhancing their stabilityand mobility. It is interesting to compare the mobility ofSDBS-complexed carbon nano-materials with that of surface-oxidized carbon nano-materials. In our previous investigation,MWCNTs oxidized by concentrated nitric acid for 12 hr, whichhad a ζ-potential of −45 mV, had an L0 value of 7.69 m underdispersion conditions of I = 5 mmol/L NaCl and pH = 6.5 (Peng etal., 2011). However, in this investigation, under similar dispersionconditions, it was found that SDBS-complexed C60, which had asimilar ζ-potential of −49.5 mV, had amuch higher L0 value. Thisresult indicated that surface complexation by surfactants mayfacilitate the mobility of carbon nano-materials more thanoxidation does. It can also be seen clearly that ionic strengthhadanobvious effect on themobility of SDBS-complexedC60, andan increase in ionic strength decreased the mobility ofSDBS-complexed C60. L0 values under ionic strength of 5.0, 25.0,50.0 and 100.0 mmol/L NaCl were calculated to be 22.25, 18.32,9.94 and 3.78 m, respectively.
The effect of divalent and trivalent cations, Ca2+ and Al3+,on the transport was also investigated and the results areshown in Fig. 7. Before the investigation, the DLS measure-ments also showed that, under the divalent and trivalentcation concentrations employed, there was no obviousaggregation during the time period of the transport investi-gation. Ca2+ and Al3+ in the dispersion significantly decreasedthemobility. The L0 value calculation showed that an increasein Ca2+ concentration from 0.05 to 0.15 mmol/L resulted in adecrease in L0 value from 17.85 to 3.88 m. An increase in Al3+
concentration from 0.02 to 0.05 mmol/L resulted in a decreasein L0 value from 15.62 to 5.06 m.
3. Conclusions
In this study, the aggregation and transport of C60 complexedby the surfactant sodium dodecyl benzene sulfonate (SDBS)were investigated. It was found that SDBS-complexed C60 had

a
0
0.2
0.4
0.6
0.8
1.0
0 2 4 6 8
V/V0
C/C
0
C/C
0
0.05 mmol/L
0.10 mmol/L
0.15 mmol/L
b
0
0.2
0.4
0.6
0.8
1.0
V/V0
0 2 4 6 8
0.02 mmol/L
0.05 mmol/L
Fig. 7 – Breakthrough curves of SDBS-complexed C60 under various CaCl2 (a) and AlCl3 (b) concentrations.
95J O U R N A L O F E N V I R O N M E N T A L S C I E N C E S 4 2 ( 2 0 1 6 ) 8 9 – 9 6
a ζ-potential of −49.5 mV under near-neutral pH conditions,which indicated that SDBS-complexed C60 had higher nega-tive charge compared to the naturally occurring colloids andcomparable negative charge to other kinds of modifiednano-materials. SDBS-complexed C60 had rather high stabilityand remained stable during an aging period of 15 days. It hada critical coagulation concentration (CCC) of 550 mmol/L forNaCl, which was higher than common natural colloids andmany kinds of raw nano-materials, and comparable to those ofmany kinds of surface-modified nano-materials. SDBS en-hanced the stability of C60 colloid; however, at the same timeit enhanced the colloidal particle aggregation rate. Surfactantcomplexation significantly enhanced the mobility of C60, andSDBS-complexedC60 hadmuchhighermobility thanC60 colloid.Increase in ionic strength, Ca2+ concentration or Al3+ concen-tration decreased the mobility of SDBS-complexed C60. Anincrease in ionic strength from 5.0 to 100.0 mmol/L resulted ina decrease in L0 value from 22.25 to 3.78 m; an increase in Ca2+
concentration from 0.05 to 0.15 mmol/L resulted in a decreasein L0 value from 17.85 to 3.88 m; and an increase in Al3+
concentration from 0.02 to 0.05 mmol/L resulted in a decreasein L0 value from 15.62 to 5.06 m.
Acknowledgments
This work was supported by the National Natural ScienceFoundation of China (No. 41473113, 41273123) and the NationalBasic Research Program (973) of China (No. 2011CB933700-G).
R E F E R E N C E S
Berna, J.L., Ferrer, J., Moreno, A., Prats, D., Bevia, F.R., 1989. The fate ofLAS in the environment. Tenside, Surfactants, Deterg. 26, 101–107.
Bouchard, D., Zhang, W., Powell, T., Rattanaudompol, U.S., 2012.Aggregation kinetics and transport of single-walled carbonnanotubes at low surfactant concentrations. Environ. Sci.Technol. 46, 4458–4465.
Chen, K.L., Elimelech, M., 2006. Aggregation and depositionkinetics of fullerene (C60) nanoparticles. Langmuir 22,10994–11001.
Chen, K.L., Elimelech, M., 2007. Influence of humic acid on theaggregation kinetics of fullerene (C60) nanoparticles in mono-valent and divalent electrolyte solutions. J. Colloid InterfaceSci. 309, 126–134.
Conway, J.R., Adeleye, A.S., Gardea-Torresdey, J., Keller, A.A., 2015.Aggregation, dissolution, and transformation of copper nano-particles in natural waters. Environ. Sci. Technol. 49 (5),2749–2756.
Duster, T.A., Fein, J.B., 2014. Comparison of the aggregationbehavior of TiO2 nanoparticles exposed to fulvic acid andbacillus subtilis exudates. Water Air Soil Pollut. 225 (11).
Fortner, J.D., Lyon, D.Y., Sayes, C.M., Boyd, A.M., Falkner, J.C.,Hotze, E.M., et al., 2005. C60 in water: nanocrystal formationand microbial response. Environ. Sci. Technol. 39, 4307–4316.
Fox, K., Holt, M., Daniel, M., Buckland, H., Guymer, I., 2000.Removal of linear alkylbenzene sulfonate from a smallYorkshire stream: contribution to GREAT-ER project #7. Sci.Total Environ. 251–252, 265–275.
Hammershøj, P., Bomans, P.H.H., Lakshminarayanan, R., Fock, J.,Jensen, S.H., Jespersen, T.S., et al., 2012. A triptycene-basedapproach to solubilising carbon nanotubes and C60. Chem. Eur.J. 18, 8716–8723.
Holt, M.S., Fox, K.K., Burford, M., Daniel, M., Buckland, H., 1998. UKmonitoring study on the removal of linear alkylbenzenesulphonate in trickling filter type sewage treatment plants.Contribution to GREAT-ER project #2. Sci. Total Environ.210–211, 255–269.
Illés, E., Tombácz, E., 2006. The effect of humic acid adsorption onpH-dependent surface charging and aggregation of magnetitenanoparticles. J. Colloid Interface Sci. 295, 115–123.
Ivankovic, T., Hrenovic, J., 2010. Surfactants in the environment.Arh. Hig. Rada Toksikol. 61, 95–110.
Jiang, C.L., Séquaris, J.M., Vereecken, H., Klumpp, E., 2012. Effectsof inorganic and organic anions on the stability of illite andquartz soil colloids in Na-, Ca- and mixed Na–Ca systems.Colloid Surf. A 415, 134–141.
Kaplan, D.I., Bertsch, P.M., Adriano, D.C., Miller, W.P., 1993.Soil-borne mobile colloids as influenced by water flow andorganic carbon. Environ. Sci. Technol. 27, 1193–1200.
Kaplan, D.I., Bertsch, P.M., Adriano, D.C., 1995. Facilitatedtransport of contaminant metals through an acidified aquifer.Ground Water 33, 708–717.
Lagaly, G., Ziesmer, S., 2003. Colloid chemistry of clay minerals:the coagulation of montmorillonite dispersions. Adv. ColloidInterf. Sci. 100–102, 105–128.
Lecoanet, H.F., Bottero, J.Y., Wiesner, M.R., 2004. Laboratoryassessment of the mobility of nanomaterials in porous media.Environ. Sci. Technol. 38, 5164–5169.
96 J O U R N A L O F E N V I R O N M E N T A L S C I E N C E S 4 2 ( 2 0 1 6 ) 8 9 – 9 6
Li, M.H., Huang, C.P., 2010. Stability of oxidized single-walledcarbon nanotubes in the presence of simple electrolytes andhumic acid. Carbon 48, 4527–4534.
Li, M.H., Boggs, M., Beebe, T.P., Huang, C.P., 2008. Oxidation ofsingle-walled carbon nanotubes in dilute aqueous solutions byozone as affected by ultrasound. Carbon 46, 466–475.
Li, K.G., Zhang, W., Huang, Y., Chen, Y.S., 2011. Aggregationkinetics of CeO2 nanoparticles in KCl and CaCl2 solutions:measurements and modeling. J. Nanoparticle Res. 13,6483–6491.
Lin, D.H., Liu, N., Yang, K., Zhu, L.Z., Xu, Y., Xing, B.S., 2009. Theeffect of ionic strength and pH on the stability of tannic acid-facilitated carbon nanotube suspensions. Carbon 47,2875–2882.
Liu, D., Johnson, P.R., Elimelech, M., 1995. Colloid depositiondynamics in flow-through porous media: role of electrolyteconcentration. Environ. Sci. Technol. 29, 2963–2973.
Liu, X.Y., Wazne, M., Han, Y., Christodoulatos, C., Jasinkiewicz,K.L., 2010. Effects of natural organic matter on aggregationkinetics of boron nanoparticles in monovalent and divalentelectrolytes. J. Colloid Interface Sci. 348, 101–107.
Peng, X.J., Jia, J.J., Gong, X.M., Luan, Z.K., Fan, B., 2009. Aqueousstability of oxidized carbon nanotubes and the precipitation bysalts. J. Hazard. Mater. 165, 1239–1242.
Peng, X.J., Du, C.J., Liang, Z., Wang, J., Luan, Z.K., Li, W.J., 2011.Mobility of acid-treated carbon nanotubes in water-saturatedporous media. J. Environ. Qual. 40, 1991–1994.
Prylutskyy, Y.I., Buchelnikov, A.S., Voronin, D.P., Kostjukov, V.V.,Ritter, U., Parkinson, J.A., M. P., et al., 2013. C60 fullereneaggregation in aqueous solution. Phys. Chem. Chem. Phys. 15(23), 9351–9360.
Ryan, J.N., Gschwend, P.M., 1994. Effect of solution chemistry onclay colloid release from an iron oxide-coated aquifer sand.Environ. Sci. Technol. 28, 1717–1726.
Saleh, N.B., Pfefferle, L.D., Elimelech, M., 2010. Influence ofbiomacromolecules and humic acid on the aggregationkinetics of single-walled carbon nanotubes. Environ. Sci.Technol. 44, 2412–2418.
Sanderson, H., Dyer, S.D., Price, B.B., Nielsen, A.M., Compernolle,R.V., Selby, M., et al., 2006. Occurrence and weight-of-evidencerisk assessment of alkyl sulfates, alkyl ethoxysulfates, andlinear alkylbenzene sulfonates (LAS) in river water andsediments. Sci. Total Environ. 368, 695–712.
Tan, X.B., Yim, S.Y., Uppu, P., Kleinow, K.M., 2010. Enhancedbioaccumulation of dietary contaminants in catfish withexposure to the waterborne surfactant linear alkylbenzenesulfonate. Aquat. Toxicol. 99, 300–308.
Torres, V.M., Posa, M., Srdjenovic, B., Simplício, A.L., 2011.Solubilization of fullerene C60 in micellar solutions of differentsolubilizers. Colloid Surf. B 82, 46–53.
Wang, L.L., Huang, Y., Kan, A.T., Tomson, M.B., Chen, W., 2012a.Enhanced transport of 2,2′,5,5′-polychlorinated biphenyl bynatural organic matter (NOM) and surfactant-modifiedfullerene nanoparticles (nC60). Environ. Sci. Technol. 46,5422–5429.
Wang, Y.G., Li, Y.S., Costanza, J., Abriola, L.M., Pennell, K.D., 2012b.Enhanced mobility of fullerene (C60) nanoparticles in thepresence of stabilizing agents. Environ. Sci. Technol. 46,11761–11769.
Wang, X., Cai, L., Han, P., Lin, D., Kim, H., Tong, M., 2014.Cotransport of multi-walled carbon nanotubes and titaniumdioxide nanoparticles in saturated porous media. Environ.Pollut. 195, 31–38.
Yang, J., Bitter, J.L., Smith, B.A., Fairbrother, D.H., Ball, W.P., 2013.Transport of oxidized multi-walled carbon nanotubes throughsilica based porous media: influences of aquatic chemistry,surface chemistry, and natural organic matter. Environ. Sci.Technol. 47, 14034–14043.
Yao, K.M., Habibian, M.T., O'Melia, C.R., 1971. Water and wastewater filtration. Concepts and applications. Environ. Sci.Technol. 5, 1105–1112.
Ying, G.G., 2006. Fate, behavior and effects of surfactants and theirdegradation products in the environment. Environ. Int. 32,417–431.

J O U R N A L O F E N V I R O N M E N T A L S C I E N C E S 4 2 ( 2 0 1 6 ) 9 7 – 1 0 4
Ava i l ab l e on l i ne a t www.sc i enced i r ec t . com
ScienceDirect
www. jou rna l s . e l sev i e r . com/ j es
Accumulation and phytotoxicity of technicalhexabromocyclododecane in maize
Tong Wu1,2, Honglin Huang1, Shuzhen Zhang1,⁎
1. State Key Laboratory of Environmental Chemistry and Ecotoxicology, Research Center for Eco-Environmental Sciences, Chinese Academy of Sciences,Beijing 100085, China. E-mail: [email protected]. School of Environmental Science and Engineering, Hebei University of Science and Technology, Hebei 050018, China
A R T I C L E I N F O
⁎ Corresponding author. E-mail: szzhang@rce
http://dx.doi.org/10.1016/j.jes.2015.06.0181001-0742/© 2015 The Research Center for Ec
A B S T R A C T
Article history:Received 27 March 2015Revised 10 June 2015Accepted 16 June 2015Available online 30 October 2015
To investigate the accumulation and phytotoxicity of technical hexabromocyclododecane(HBCD) inmaize, young seedlings were exposed to solutions of technical HBCD at differentconcentrations. The uptake kinetics showed that the HBCD concentration reached anapparent equilibrium within 96 hr, and the accumulation was much higher in roots thanin shoots. HBCD accumulation inmaize had a positive linear correlation with the exposureconcentration. The accumulation of different diastereoisomers followed the orderγ-HBCD > β-HBCD > α-HBCD. Compared with their proportions in the technical HBCDexposure solution, the diastereoisomer contribution increased for β-HBCD and decreasedfor γ-HBCD in both maize roots and shoots with exposure time, whereas the contributionof α-HBCD increased in roots and decreased in shoots throughout the experimental period.These results suggest the diastereomer-specific accumulation and translocation of HBCDin maize. Inhibitory effects of HBCD on the early development of maize followed the orderof germination rate > root biomass ≥ root elongation > shoot biomass ≥ shoot elongation.Hydroxyl radical (UOH) and histone H2AX phosphorylation (γ-H2AX) were induced inmaizeby HBCD exposure, indicative of the generation of oxidative stress and DNA double-strandbreaks inmaize. An UOH scavenger inhibited the expression of γ-H2AX foci in bothmaize rootsand shoots, which suggests the involvement of UOH generation in the HBCD-induced DNAdamage. The results of this study will offer useful information for a more comprehensiveassessment of the environmental behavior and toxicity of technical HBCD.© 2015 The Research Center for Eco-Environmental Sciences, Chinese Academy of Sciences.
Published by Elsevier B.V.
Keywords:Technical hexabromocyclododecane(HBCD)Plant uptakeOxidative toxicityDNA damage
Introduction
Hexabromocyclododecane (HBCD) is one of the most widely usedbrominated flame retardants and employed primarily in construc-tion materials, upholstery textiles and electronic equipment(Marvin et al., 2011). It was reported that the current annualproduction of HBCD was estimated to 28,000 tons (http://www.kemi.se/en/Content/International/Conventions-and-agreements/-
es.ac.cn (Shuzhen Zhang
o-Environmental Science
Stockholm-Convention-POPs/). Due to its widespread use, HBCDhas been detected widely in environmental and biologicalmatrices. HBCD was first found in fish and sediment in theSwedish River Viskan in 1998 (Sellström et al., 1998), andsince then it has been detected in a wide variety of biota andabiotic samples such as rainbow trout, loach, water, sewagesludge, soils and sediments (Haukås et al., 2009; Zhang et al.,2009; Hale et al., 2006; Wang et al., 2009; Li et al., 2013).
).
s, Chinese Academy of Sciences. Published by Elsevier B.V.

98 J O U R N A L O F E N V I R O N M E N T A L S C I E N C E S 4 2 ( 2 0 1 6 ) 9 7 – 1 0 4
Very high HBCD levels have been reported in sewage sludge(36,000 ng/g dry weight) (Morris et al., 2004), soils (28,000 ng/gdryweight) (Petersen et al., 2004) and eelmuscles (10,275 ng/glipid weight) (Allchin and Morris, 2003). The concentration ofHBCD has been reported to be 15.3 pg/g dry weight, withγ-HBCD as the dominant diastereoisomer, in agriculture soilsin Chongming Island, the Yangtze River Delta in South China(Meng et al., 2011). A much higher concentration of HBCDwas detected at a concentration of 37.5 ng/g dry weight infarmland soils near a BFR factory in North China (Zhu et al.,2014). The potential risk of HBCD in the environment is ofconsiderable concern owing to its characteristics of long-distance transportation (Ueno et al., 2006), persistence andbiomagnification (Law et al., 2008) as well as its toxicity effectson human health (Christen et al., 2010).
Commercially used HBCD (technical HBCD) is a mixture ofdifferent isomers with α-, β- and γ-HBCDs (in ranges of 10%–13%,1%–12% and 75%–89%, respectively) as the predominantdiastereoisomers (Tomy et al., 2004). Although having thesame chemical formula, different configurations of HBCDdiastereoisomers result in their different levels, distributionsand fates in the environment. The α-HBCD concentration isusually the highest in biotic environments, whereas γ-HBCDhas been reported as the dominant diastereoisomer in abioticsamples (Thomsen et al., 2007; Marvin et al., 2006). Therefore,there is a need to elucidate the uptake and contribution ofeach diastereoisomer when examining the toxic effect of theHBCD technical mixture.
Plant uptake of persistent organic pollutants is an impor-tant process when considering the risks associated with landcontamination, the role of vegetation in global cycling, andthe potential of industrial discharges to contaminate the foodchain (Collins et al., 2006). Despite its ubiquitous presence insoils, there is limited knowledge on the plant uptake andphytotoxicity of HBCD. The accumulation of HBCD in cabbageand radish tissues has been determined by Li et al. (2011), withpredominance of γ-HBCD in roots and α-HBCD in shoots.Nevertheless, phytotoxicity information on technical HBCD islacking. Although we have investigated the accumulationand toxicity of each HBCD diastereoisomer in maize in ourprevious work (Wu et al., 2012), the contribution of eachdiastereoisomer in the technical mixture to HBCD accumula-tion in plants is still unknown.
Oxidative stress caused by the generation of reactiveoxygen species (ROS) is thought to be a major cause ofphysiological disorders of plants after exposure to contami-nants. Overproduction of ROS can induce oxidative damageto biomolecules such as lipids, proteins and DNA, eventuallyleading to cell death (Mittler et al., 2004). ROS-derived DNAoxidation will result in altered bases and damaged sugarresidues, leading to DNA single- and double-strand breaks(DSBs) (Roldán-Arjona and Ariza, 2009). Phosphorylation ofhistoneH2AX (γ-H2AX) at serine 139 occurs after DNADSBs andis probably the earliest cellular response to this lesion (Rogakouet al., 1999). The γ-H2AX foci assay showed higher sensitivity tolow levels of DNADSBs than theneutral comet assay, a classicalmethod for detecting DNA damage (Yu et al., 2006). Because ofthe quantitative correspondence between the number ofγ-H2AX foci and the number of DSBs, γ-H2AX has been usedas a new indicator for DNA damage.
Ahydroponic experimentwas conducted in the present studyto investigate the uptake andoxidative toxicity of technical HBCDin maize. The time- and concentration-dependent accumula-tions of HBCD in maize were detected. The relative diastereoiso-mer contributions of α-, β- and γ-HBCDs were further analyzed.The dose-effect relationship of HBCD toxicity in maize wasexamined by determining its toxic influence on the early growthand development of maize. ROS generation in maize exposed todifferent concentrations of HBCD was determined by electronparamagnetic resonance (EPR) spectroscopy. The level of γ-H2AXfoci was examined to investigate genotoxicity in maizeinduced by HBCD. The results of the present study wouldoffer useful information for a more comprehensive assessmentof the environmental behavior of the technical HBCD mixture.
1. Materials and methods
1.1. Chemicals
A technical HBCDmixture and the native (α-, β- and γ-) HBCDstandards were purchased from AccuStandard (New Haven,USA). The 13C-labeled (α-, β- and γ-) HBCD standardswere obtained from Cambridge Isotope Laboratories, Inc.(Andover, USA). Dimethylsulfoxide (DMSO, purity > 99.9%)and α-phenyl-N-tert-butylnitrone (PBN, purity > 98%) wereobtained from Sigma-Aldrich company (USA). Anhydroussodium sulfate (Na2SO4), silica gel and alumina (100–200 mesh)were washed with hexane and used after heating overnight at150°C. Other solvents and chemicals used were of analytical orHPLC grade.
1.2. Plant cultivation and exposure
Technical HBCD was dissolved in methanol as stock solution. Aseries of HBCD solutions for plant exposure tests with a range ofconcentrations (0, 0.002, 0.005, 0.01, 0.02, and 0.05 mg/L) wereprepared using the stock solution and sterile deionized water.Maize (Zea mays L.) was used as the test plant and the seeds wereobtained from the Chinese Academy of Agricultural Sciences,Beijing, China. Prior to germination, the seeds were surface-sterilized in 3% (V/V) H2O2 for 10 min and rinsed thoroughly withdeionized water. After germination for 4 days, five uniformseedlings were transferred to each colored vitreous pot contain-ing 200 mL of test solution to investigate the uptake and toxicityof HBCD in maize. Pots were kept in a growth chamber with acontrolled environment at a light intensity of 250 μmol/(m2·s)provided by supplementary illumination with a photoperiod of14 hr each day, 25/20°C day/night temperature regime, andrelative humidity of 60%–70%. The seedlings were repositioneddaily to minimize spatial differences in illumination andtemperature, and harvested after 4 days. Unplanted andblank controls without HBCD exposure were included. Testsolutions were renewed every day and all the treatmentswere set up in triplicate. The test solution of 0.002 mg/L wasselected for the kinetic uptake assay, and maize plants wereharvested at different time intervals.
Seed germination was tested on filter paper placed inPetri dishes and moistened with 60 mL of test solutions. Aftersterilizing, one hundred seeds were placed in each dish, covered

99J O U R N A L O F E N V I R O N M E N T A L S C I E N C E S 4 2 ( 2 0 1 6 ) 9 7 – 1 0 4
by a lid, and incubated at 27 ± 0.5°C in the dark. After 96 hr, theproportion of germinated seeds was counted. Seeds wereconsidered to have germinated when both the radicle andcoleoptile had achieved lengths greater than half the seed size.Controls were obtained by moistening the filter papers with60 mLof deionizedwater. Test solutionswere renewed every dayand each treatment was set up in triplicate and repeated 3 times.
1.3. Extraction and cleanup of plant samples
Sample extraction and concentration analysiswere conducted asfollows. The harvested plants were separated into roots andshoots, rinsed thoroughly with deionized water and blotted withfilter paper. Plant tissueswere then frozenat−50°Covernight andfreeze-dried for 48 hr in a lyophilizer (FD-1, China). The driedsamples were chopped finely and stored in glass containersat −20°C before extraction.
Extraction and cleanup of plant samples for HBCDanalysis were based on the method of Han et al. (2010) andZhang et al. (2009) with some modifications. Each sample(0.1–0.5 g dry weight) was ultrasonic-assisted extracted for2 hr using 20 mL of ethyl acetate at 60°C after spiking with13C-α-HBCD and 13C-γ-HBCD. The extract was collectedand evaporated to 1–2 mL. The concentrated extract wasthen cleaned up on a multilayer silica gel/alumina columnpacked with anhydrous sodium sulfate (5 g), neutral silica(2 g, 3% deactivated), acidic silica (5 g, 44% sulfuric acid),neutral silica (2 g, 3% deactivated), neutral alumina (5 g, 3%deactivated) and anhydrous sodium sulfate (5 g) from top tobottom.HBCDwas elutedwith 50 mL of hexane and evaporatedto 1 mL. After concentrating to near-dryness under a gentlenitrogen gas, the extract was spiked with 13C-β-HBCD as aninternal standard and adjusted to 0.4 mL with methanol.
1.4. Determination of HBCD diastereoisomers
The extracted samples were analyzed using an ultra-highperformance liquid chromatography coupled to a triple-quadrupolemass spectrometer (UPLC–MS/MS). Chromatographicseparation of HBCD diastereoisomerswas performed on anUPLC(Waters ACQUITY UPLC system, USA) with a column of WatersACQUITY UPLC BEH C18 (50 × 2.1 mm, i.d., 1.7 μm particle size).A mobile phase of (A) 0.01 mol/L ammonium acetate and(B) methanol at a flow rate of 0.2 mL/min was applied for elutionof the target compounds. The elution program started with 50%A and was ramped linearly to 15% A in 9 min, held for 4 min,followed by a linear decrease to 0%A in 1 min andheld for 5 min.Then the mobile phase composition was returned to theinitial conditions in 2 min and equilibrated for a further5 min. A Waters Quattro Premier XE triple quadrupole massspectrometer equipped with an ESI source (Waters, USA) wasused. TheMS systemwas operated in the electrospray negativeionization (ESI) and multiple reaction monitoring (MRM) mode.The MRM transitions monitored were 639.7 → 79.0 for nativeHBCD diastereoisomers and 651.5 → 79.0 for the 13C-labeledHBCDs, respectively. The conditions for the MS system wereoptimizedas follows: cone voltage 20 V, capillary voltage 3.5 kV,desolvation temperature 350°C, source temperature 110°C,nebulizing gas flow 400 L/hr, cone gas flow 50 L/hr and collisionenergy 15 eV, respectively.
Quality assurance and quality control were done by regularanalyses of procedural blanks, blind duplicate samples, andrandom injection of solvent blanks and standards. Matrixeffects on the signal intensity of UPLC-MS/MS were mini-mized using 13C-α- and 13C-γ-HBCDs as surrogate standards,and 13C-β-HBCD as internal standard. The limits of detection(LOD) were 0.001 mg/kg on dry weight basis. Recovery valuesranged from 79.7 to 136% with a relative standard deviation(RSD) < 10%. No HBCD was found in the blank plant samples.
1.5. PBN adduct extraction and Fenton reaction
Maize roots and shoots were analyzed for the detection of ROSgenerated after exposure to HBCD for 4 days. After beingrinsed with ice-cold 0.1 mol/L CaCl2 solution and blotted withfilter paper, plant samples were weighed (0.5 g) and homog-enized in a mortar with 1.0 mL freshly prepared solution of0.1 mol/L PBN (dissolved in DMSO) in an ice bath. Then thehomogenates were incubated at 37°C for 15 min, and centri-fuged at 4500 r/min at 4°C for 3 min. The supernatant (30 μL)was transferred to a capillary tube with a diameter of 1.0 mmfor electron paramagnetic resonance (EPR) analysis. The EPRspectra were recorded with a Bruker ESP 300 spectrometer(Bruker, Germany) at room temperature. The operationconditions were as follows: microwave power, 20 mW; micro-wave frequency, 9.7 GHz; center field, 347 mT; scan range,10 mT; modulation frequency, 100 kHz; modulation ampli-tude, 0.25 mT; and receiver gain of 2 × 10⁴ scans.
1.6. DNA damage measurement
Maize plants exposed to HBCD were rinsed thoroughly withdeionized water, blotted with filter paper, and separated intoroots and shoots for histone extraction after exposure toHBCD for 4 days. Fresh samples (1.0 g) were homogenized in9 mL of extraction buffer (0.2 mol/L NaH2PO4·Na2HPO4, pH 7.4)in an ice bath. Then the homogenates were centrifugedat 4000 r/min at 4°C for 15 min and the supernatant wascollected. The H2AX phosphorylation level in histone sampleswas analyzed with a plant γ-H2AX enzyme-linked immuno-sorbent assay (ELISA) kit (RB, USA).
1.7. Statistical analysis
All results were expressed as mean ± standard deviation (SD) oftriplicates. Statistical analysis was performed by Microsoft Excel2010, Origin 7.5 and SPSS 13.0 variance analysis software.One-way and Two-way ANOVA with Turkey's multiple compar-ison tests were used to assess differences among samples atp < 0.05.
2. Results and discussion
2.1. HBCD uptake by maize and diastereoisomer contribution
The initial fast uptake caused a sharp increase of HBCDconcentration inmaize roots and shoots, and the accumulationreached an apparent equilibrium within 96 hr (Fig. 1a). Theconcentration of HBCDwasmuch higher inmaize roots than in

100 J O U R N A L O F E N V I R O N M E N T A L S C I E N C E S 4 2 ( 2 0 1 6 ) 9 7 – 1 0 4
shoots, and the apparent equilibrium concentrations were3.71 ± 0.12 mg/kg in roots and 0.10 ± 0.01 mg/kg in shoots(on a dry weight basis) after exposure to HBCD at 0.002 mg/L,respectively. The HBCD concentration in both maize rootsand shoots increased linearly with increasing concentrationof HBCD in the culture solution (Fig. 1b, R2 = 0.9842 for rootsand 0.9923 for shoots, p < 0.05), demonstrating that plantuptake of HBCD is concentration-dependent within the testedconcentration range.
Diastereomer-specific accumulation of HBCD was furtherinvestigated, and their concentrations in both maize rootsand shoots were found to vary in the order γ-HBCD >β-HBCD > α-HBCD (Fig. 2). The initial exposure solutionhad a percentage diastereoisomer contribution of 12.87 ±0.15, 13.12 ± 0.23 and 74.01 ± 0.35% for α-, β- and γ-HBCDs,respectively. Compared to this, the relative diastereoisomercontribution of β-HBCD increased, and that of γ-HBCDdecreased with exposure time in bothmaize roots and shoots(Fig. 3). The relative contribution of α-HBCD increased in rootsand decreased in shoots throughout the experimental period.For example, thediastereoisomerpattern in rootswas 14.76, 25.69and 58.98% for α-, β- and γ-diastereoisomers after the longestexposure time of 120 hr, respectively (Fig. 2a), corresponding tothe relative increases of 14.42 ± 0.83 and 96.09 ± 8.86% for α- andβ-HBCDs, respectively, and a decrease of 20.30 ± 0.87% in therelative amount of γ-HBCD in roots compared to their initialproportions in the exposure solution (Fig. 3a). In shoots, the
b
0
5
10
15
20
25
30
Con
cent
ratio
n in
sho
ot (
mg/
kg)
Concentration (mg/L)
Root
0.00 0.01 0.02 0.03 0.04 0.05
0 20 40 60 80 100 120
0
1
2
3
4
Con
cent
ratio
n in
roo
t (m
g/kg
)
Time (hr)
Root
a
Fig. 1 – Time- and concentration-dependent accumulations (a andEach value is the mean ± SE of three replicate cultures.
proportions of α-, β- and γ-HBCDs were 7.89, 23.68 and 67.60%after exposure for 120 hr (Fig. 3b), which corresponded toa relative decrease of 38.87 ± 1.19 and 8.65 ± 0.67% in theproportions of α- and γ-HBCDs, and a relative increase of80.76 ± 4.58% forβ-HBCD (Fig. 3b). Therefore it can be concludedthat the uptake and translocation of HBCD in maize werediastereomer-selective. Similar results were also observed inrainbow trout by Haukås et al. (2009).
The diastereoisomer contribution of HBCD was detected inmany environmental samples. α-HBCD was reported to be themajor diastereoisomer in the tissues of organisms such as fish,birds andmarinemammals (Zegers et al., 2005; Janák et al., 2005;Morris et al., 2004), whereas γ-HBCD was found the dominantdiastereoisomer in abiotic environmental samples such as soil,sediment, air and water (Marvin et al., 2006; Covaci et al., 2006).A similar resultwas determined in the present study,with higherγ-HBCDconcentrations in bothmaize roots and shoots comparedwith α- and β-HBCDs. The time-dependent accumulation repre-sents a balance between the uptake and elimination processesof HBCD. The highest percentage of relative accumulation forβ-HBCD indicates that this diastereoisomer is more easily takenup by maize than α- and γ-HBCDs.
2.2. Effect of HBCD on maize development
The effect of technical HBCD on maize growth was determinedafter exposure for 4 days. The relative inhibition rates of seed
0.0
0.2
0.4
0.6
0.8
1.0
Concentration (mg/L)
Con
cent
ratio
n in
sho
ot (
mg/
kg)
Shoot
0.00
0.03
0.06
0.09
0.12
Con
cent
ratio
n in
sho
ot (
mg/
kg)
Time (hr)
Shoot
0.00 0.01 0.02 0.03 0.04 0.05
0 20 40 60 80 100 120
b) of HBCD inmaize roots and shoots (on a dry weight basis).

ba
0
20
40
60
80
100
β-HBCD α-HBCD γ-HBCD
Time (hr)
Tot
al H
BC
D (
%)
Std 3 7 13 25 36 48 60 84 96 120 Std 3 7 13 25 36 48 60 84 96 1200
20
40
60
80
100
Tot
al H
BC
D (
%)
Time (hr)
Fig. 2 – Time-dependent change of HBCD diastereomeric distribution in maize roots (a) and shoots (b). Std represents theproportion of α-, β- and γ-HBCDs in the technical standard.
101J O U R N A L O F E N V I R O N M E N T A L S C I E N C E S 4 2 ( 2 0 1 6 ) 9 7 – 1 0 4
germination, root and shoot biomass, and root and shootelongation increasedwith increasing exposure concentrationof HBCD (Table 1). The relative inhibition rates changedmore noticeably at lower exposure concentrations comparedwith higher exposure concentrations. The toxic effects ofHBCD to maize followed the order: germination rate > rootbiomass ≥ root elongation > shoot biomass ≥ shoot elongation.At the maximum exposure concentration of 0.05 mg/L, theinhibition rates reached 46.54, 32.71, 31.94, 14.04 and 11.97% forgermination rate, root biomass, root elongation, shoot biomassand shoot elongation, respectively. Seed germination wasmoresensitive to HBCD than seedling growth. Seed germinationrelies almost exclusively on seed reserves for the supply ofrespiration metabolites as well as other anabolic reactions.Starch is quantitatively themost abundant storage in seeds andavailable evidence has indicated that seed starch is degradedduring germination via the amylolytic pathway (Juliano andVarner, 1969). Therefore, HBCD posed a severe inhibitory effecton seed germination most probably because it damaged thestarch or depressed amylase activity.
-20
0
20
40
60
80
100
120
dcbbababb
ddd
cbc
a
a
b
a
aa
!
a
eddcbabaaa
Time (hr)
Rel
ativ
e ch
ange
in c
ontr
ibut
ion
(%)
3 7 13 25 36 48 60 84 96 120
a
β-H DCBH-α
Fig. 3 – Time-dependent change (mean ± SE) of HBCD diastereoisowith their proportions in the initial exposure solution. Differenttimes at p < 0.05.
2.3. Hydroxyl radical generation in maize
Oxidative stress, resulting from the imbalance between endoge-nous generation of ROS and antioxidant defense systems, is animportant phenomenon in plants when exposed to contami-nants (Bowler et al., 1992). Endogenous ROS produced in plantshave extremely short half-lives and are present in low concen-trations, therebymaking detection difficult. In the present study,spin trapping followed by EPR analysis was employed to directlyobserve the formation of free radicals inmaize exposed to HBCD.Six-line (triplet of two lines in each set) EPR spectra of ROS andPBN adducts were observed in maize tissues after exposureto HBCD (Fig. 4a, taking the concentration of 0.01 mg/L as anexample). The variations of signal intensity of the PBN-radicaladducts in the EPR spectra reflected the generation of hydroxylradical (UOH), and the UOH intensity was calculated by the signalintensity of the second couple of the triplet, according to ourprevious study (Wu et al., 2012). Weak UOH signals were found inthe control without HBCD exposure (Fig. 4a), indicating UOHgeneration during normal cellular functions (Yin et al., 2007).
3 7 13 25 36 48 60 84 96 120-40
-20
0
20
40
60
80
100
Rel
ativ
e ch
ange
in c
ontr
ibut
ion
(%)
Time (hr)
eeedededabc
b
dccbc
bbb
b
a
a
a
a
ddddcbcccb
b
BCD DCBH-γ
mer contributions inmaize roots (a) and shoots (b) comparedletters represent statistically significant difference between

Table 1 – Relative inhibition rates (IRs) of germination (GER), root biomass (RB), shoot biomass (SB), root elongation (RE) andshoot elongation (SE) of maize exposed to technical HBCD for 4 days.
IR (%) Concentration (mg/L)
0 0.002 0.005 0.01 0.02 0.05
GER 0.00 ± 3.33a 10.58 ± 4.08b 17.31 ± 3.33c 21.15 ± 3.33c 36.54 ± 5.77d 46.54 ± 7.31eRB 0.00 ± 1.72a 6.27 ± 0.69b 9.76 ± 3.58b 18.42 ± 3.35c 24.36 ± 2.86d 32.71 ± 2.99eSB 0.00 ± 0.66a 5.25 ± 0.90b 6.62 ± 1.37b 8.30 ± 1.93bc 11.95 ± 1.14 cd 14.04 ± 2.29dRE 0.00 ± 2.83a 6.84 ± 3.13b 10.63 ± 2.14b 18.18 ± 2.24c 22.64 ± 2.64c 31.94 ± 3.90dSE 0.00 ± 1.31a 4.22 ± 1.59ab 5.78 ± 1.16b 7.51 ± 0.58bc 10.60 ± 1.34c 11.97 ± 0.85c
Different letters represent statistically significant difference at p < 0.05.
102 J O U R N A L O F E N V I R O N M E N T A L S C I E N C E S 4 2 ( 2 0 1 6 ) 9 7 – 1 0 4
The UOH level in both maize roots and shoots was signifi-cantly increased (p < 0.05) at HBCD exposure concentrationslower than 0.01 mg/L and then decreased with increasingconcentration (Fig. 4b). The highest UOH intensity increase was19.5% in roots and 25.7% in shoots at the concentration of0.01 mg/L, compared with the levels of the controls. More UOHwas detected in maize shoots than in roots. UOH is the mostreactive species among the ROS and will immediately reactwith most cellular macromolecules after generation, includingproteins, lipids and DNA. The production and accumulation ofROS can lead to oxidative stress. It was reported that thecatalase activity significantly increased in rainbow trout afterexposure to HBCD (Ronisz et al., 2004). The antioxidativeenzyme catalase plays an important role in scavenging ROSgenerated in plants. It has been reported in a previous studythat the activities of catalase, peroxidase and superoxidedismutase in wheat seedlings were enhanced significantlyafter HBCD exposure (Li, 2010). The elevated UOH levels detectedin this study further provided direct evidence for ROS genera-tion and oxidative stress in maize induced by HBCD exposure.Oxidative stress is associated with numerous deleteriousconsequences for cells, such as lipid peroxidation and celldeath (Mittler et al., 2004). Excessive production of ROS is one ofthe importantmechanisms for plant cell damageunder adverseenvironmental conditions (Mancini et al., 2006). Therefore,the decrease of UOH level at higher exposure concentrationswas mainly attributed to the death of plant cells, which
a
3400 3440 3480 3520
0
40
80
120
HBCD
Control
PBN+DMSO
Magnetic field (G)
ESR
inte
nsity
(a.
u.)
Fig. 4 – EPR spectrum (a) and radical intensity (b) of PBN-ROS-addDifferent letters represent statistically significant difference at pindicate differences in maize roots and shoots, respectively).
inactivated the production and scavenging of ROS. These dataare important for the risk assessment of HBCD in plants.
2.4. DNA damage responses and potential toxicity mechanism
The level of phosphorylated histone H2AX was examinedto investigate the genotoxic effects of HBCD on maize. Theγ-H2AX gene was identified in maize without HBCD exposureand constitutively expressed in all plant tissues (Fig. 5). The levelof γ-H2AX foci was significantly elevated (p < 0.05) when theexposure concentration of HBCD was higher than 0.005 mg/L forroots and 0.01 mg/L for shoots, respectively. The highest γ-H2AXlevels in maize roots and shoots (1.77 ± 0.54 ng/g in roots and1.54 ± 0.29 ng/g in shoots on freshweight basis) were observed atthe exposure concentration of 0.05 mg/L, which corresponded toa relative increase of 23.10 and 16.61% in γ-H2AX level for rootsand shoots compared to the controls. Several studies havealready described the relevance of H2AX in the DSB responsesin human and other mammalian cells (Rothkamm and Löbrich,2003; Celeste et al., 2003); however limited analyses have so farbeenperformedonplants. Langet al. (2012) first characterized theexpression of H2AXa and H2AXb in Arabidopsis and noticed theincrease of γ-H2AX protein after treatment with the DSB-inducerdrug bleomycin. It was demonstrated that each γ-H2AX focuswas approximately equivalent to one DNA DSB, and theformation and loss of foci reflected the DSB induction and repair(Rothkamm and Löbrich, 2003). Therefore, the increase in the
b
300
350
400
600
700
A
E
D
A
B
C
b
a
da
c
RootShoot
a
Concentration (mg/L)
Rad
ical
inte
nsity
(a.
u.)
0.00 0.01 0.02 0.03 0.04 0.05
ucts determined in maize after exposure to HBCD for 4 days.< 0.05 (the lower-case letters and the upper-case letters

0.00 0.01 0.02 0.03 0.04 0.05
1.2
1.4
1.6
1.8d
RootShoot
b
C
D
B
AAA
c
b
aa
Concentration (mg/L)
γ-H
2AX
con
cent
ratio
n (n
g/g)
Fig. 5 – γ-H2AX induction inmaize after exposure toHBCD (on afresh weight basis). Different letters represent statisticallysignificant difference at p < 0.05 (the lower-case letters and theupper-case letters indicate differences in maize roots andshoots, respectively).
Table 2 – Relative inhibition levels of UOH and γ-H2AXcompared to the controls at the exposure concentration of0.02 mg/L after the addition of ROS scavengers.
Treatment UOH relative intensity γ-H2AX relativeconcentration
Roots Shoots Roots Shoots
Control 1.00 ± 0.01a 1.00 ± 0.03a 1.00 ± 0.02a 1.00 ± 0.01aControl + sb 0.99 ± 0.03a 0.98 ± 0.04a 0.98 ± 0.02a 0.97 ± 0.02aHBCD 1.12 ± 0.03a 1.09 ± 0.02a 1.18 ± 0.03a 1.10 ± 0.03aHBCD + sb 1.04 ± 0.04b 0.97 ± 0.05b 1.09 ± 0.03b 1.05 ± 0.01b
Different letters represent statistically significant difference betweenHBCD treatment and HBCD + sodium benzoate (sb) treatment atp < 0.05.
103J O U R N A L O F E N V I R O N M E N T A L S C I E N C E S 4 2 ( 2 0 1 6 ) 9 7 – 1 0 4
γ-H2AX level in the present study suggested that DNA damagebecame more serious with increasing exposure concentrationof HBCD.
ROS is thought to be a major cause of DNA damage(Vanderauwera et al., 2011). To further confirm whether theDNA damage in maize was induced by UOH generation, sodiumbenzoate, an UOHscavenger (Chang et al., 2005),wasadded to theexposure solution. Sodium benzoate significantly reduced theUOH generation and inhibited the expression of γ-H2AX foci(p < 0.05) in both roots and shoots ofmaize exposed to 0.02 mg/LHBCD (Table 2), indicative of the involvement of UOH generationin theHBCD-inducedDNAdamage. It has been reported that thehighly reactive UOH can react with DNA and cause geneticmutations (Cooke et al., 2003).Mancini et al. (2006) detectedDNAdamage in leaf cells of Nicotiana tabacum with the increase ofDNA migration value and hedgehog percentage induced byhydrogen peroxide. The results of the present study indicatedthat UOH generation could induce the formation of γ-H2AX fociduring theDNADSB responses inmaize after exposure toHBCD.However, the decrease of γ-H2AX foci did not result in its returnto the control level. By comparing the results shown in Figs. 4band 5, we can also notice the co-occurrence of the reduction ofUOH intensity and the continual increase in the γ-H2AX levelwhen the exposure concentration of HBCD is higher than0.01 mg/L. Therefore, it is expected that besides UOH generationthere should be othermechanisms responsible for DNAdamagein maize after exposure to HBCD.
3. Conclusions
This study demonstrates the uptake and accumulation ofHBCD in maize roots and shoots, which generates phytotoxiceffects on maize. HBCD accumulation in maize roots andshoots is concentration-dependent and diastereomer-specific,with γ-HBCD being more likely to be bioaccumulated thanα- and β-HBCDs. Exposure to HBCD influences the earlydevelopment of maize, with germination being the mostsensitive. The induction of UOH and γ-H2AX with HBCD
exposure indicates the generation of oxidative stress anddamage from DNA double-strand breaks in maize. The UOHscavenger benzoate inhibits the expression of γ-H2AX fociin both maize roots and shoots, indicative of the involve-ment of UOH generation in the HBCD-induced DNA damage.Given the present indications of plant accumulation andphytotoxicity for the technical HBCD mixture combinedwith the diastereomer-specific contribution, there is a needto elucidate the environmental fate and behavior of thediastereoisomers in technical HBCD.
Acknowledgments
This work was supported by the Strategic Priority ResearchProgramof theChineseAcademyof Sciences (No. XDB14020202)and the National Natural Science Foundation of China(Nos. 21321004 and 21407041).
R E F E R E N C E S
Allchin, C.R., Morris, S., 2003. Hexabromocyclododecane (HBCD)diastereoisomers and brominated diphenyl ether congener(BDE) residues in edible fish from the rivers Skerne and Tees,UK. Organohalogen Compd. 61, 41–44.
Bowler, C., VanMontagu,M., Inzé, D., 1992. Superoxide dismutaseand stress tolerance. Annu. Rev. Plant Physiol. Plant Mol. Biol.43, 83–116.
Celeste, A., Difilippantonio, S., Difilippantonio, M.J.,Fernandez-Capetillo, O., Pilch, D.R., Sedelnikova, O.A., et al.,2003. H2AX haploinsufficiency modifies genomic stability andtumor susceptibility. Cell 114 (3), 371–383.
Chang, H.B., Lin, C.W., Huang, H.J., 2005. Zinc-induced cell deathin rice (Oryza Sativa L.) roots. Plant Growth Regul. 46 (3),261–266.
Christen, V., Crettaz, P., Oberli-Schrämmli, A., Fent, K., 2010. Someflame retardants and the antimicrobials triclosan andtriclocarban enhance the androgenic activity in vitro.Chemosphere 81 (10), 1245–1252.
Collins, C., Fryer, M., Grosso, A., 2006. Plant uptake of non-ionicorganic chemicals. Environ. Sci. Technol. 40 (1), 45–52.
Cooke, M.S., Evans, M.D., Dizdaroglu, M., Lunec, J., 2003. OxidativeDNA damage: mechanisms, mutation, and disease. FASEB J. 17(10), 1195–1214.

104 J O U R N A L O F E N V I R O N M E N T A L S C I E N C E S 4 2 ( 2 0 1 6 ) 9 7 – 1 0 4
Covaci, A., Gerecke, A.C., Law, R.J., Voorspoels, S., Kohler, M., Heeb,N.V., et al., 2006. Hexabromocyclododecanes (HBCDs) in theenvironment and humans: a review. Environ. Sci. Technol. 40(12), 3679–3688.
Hale, R.C., La Guardia, M.J., Harvey, E., Gaylor, M.O., Mainor, T.M.,2006. Brominated flame retardant concentrations and trendsin abiotic media. Chemosphere 64 (2), 181–186.
Han, C., Chen, X.M., Xie, W., Zhu, Z.O., Liu, C.P., Chen, F., et al., 2010.Determination of hexabromocyclododecanediastereoisomers inSargassum fusiforme and comparison of the extraction efficiencyof ultrasonication, microwave-assisted extraction, Soxhletextraction and pressurised liquid extraction. J. Sep. Sci. 33 (21),3319–3325.
Haukås, M., Mariussen, E., Ruus, A., Tollefsen, K.E., 2009.Accumulation and disposition of hexabromocyclododecane(HBCD) in juvenile rainbow trout (Oncorhynchus mykiss). Aquat.Toxicol. 95 (2), 144–151.
Janák, K., Covaci, A., Voorspoels, S., Becher, G., 2005.Hexabromocyclododecane inmarine species from theWesternScheldt Estuary: diastereoisomer- and enantiomer-specificaccumulation. Environ. Sci. Technol. 39 (7), 1987–1994.
Juliano, B.O., Varner, J.E., 1969. Enzymic degradation of starchgranules in the cotyledons of germinating peas. Plant Physiol.44 (6), 886–892.
Lang, J., Smetana, O., Sanchez-Calderon, L., Lincker, F., Genestier,J., Schmit, A.C., et al., 2012. Plant γH2AX foci are required forproper DNA DSB repair responses and colocalize with E2Ffactors. New Phytol. 194 (2), 353–363.
Law, R.J., Herzke, D., Harrad, S., Morris, S., Bersuder, P., Allchin,C.R., 2008. Levels and trends of HBCD and BDEs in theEuropean and Asian environments, with some information forother BFRs. Chemosphere 73 (2), 223–241.
Li, Y.N., 2010. The Fate and Ecotoxicological Effects of BFRs in SoilEnvironment (PhD thesis) Nankai University, Tianjin, China.
Li, Y.N., Zhou, Q.X., Wang, Y.Y., Xie, X.J., 2011. Fate oftetrabromobisphenol A and hexabromocyclododecanebrominated flame retardants in soil and uptake by plants.Chemosphere 82 (2), 204–209.
Li, H.H., Shang, H.T., Wang, P., Wang, Y.W., Zhang, H.D., Zhang,Q.H., et al., 2013. Occurrence and distribution ofhexabromocyclododecane in sediments from seven majorriver drainage basins in China. J. Environ. Sci. 25 (1), 69–76.
Mancini, A., Buschini, A., Restivo, F.M., Rossi, C., Poli, P., 2006.Oxidative stress as DNA damage in different transgenictobacco plants. Plant Sci. 170 (4), 845–852.
Marvin, C.H., Tomy, G.T., Alaee, M., Macinnis, G., 2006. Distribu-tion of hexabromocyclododecane in Detroit River suspendedsediments. Chemosphere 64 (2), 268–275.
Marvin, C.H., Tomy, G.T., Armitage, J.M., Arnot, J.A., McCarty, L.,Covaci, A., et al., 2011. Hexabromocyclododecane: currentunderstanding of chemistry, environmental fate and toxicologyand implications for global management. Environ. Sci. Technol.45 (20), 8613–8623.
Meng, X.Z., Duan, Y.P., Yang, C., Pan, Z.Y., Wen, Z.H., Chen, L.,2011. Occurrence, sources, and inventory ofhexabromocyclododecanes (HBCDs) in soils from ChongmingIsland, the Yangtze River Delta (YRD). Chemosphere 82 (5),725–731.
Mittler, R., Vanderauwera, S., Gollery, M., Van Breusegem, F., 2004.Reactive oxygen gene network of plants. Trends Plant Sci. 9(10), 490–498.
Morris, S., Allchin, C.R., Zegers, B.N., Haftka, J.J.H., Boon, J.P.,Belpaire, C., et al., 2004. Distribution and fate of HBCD andTBBPA flame retardants in North Sea estuaries and aquaticfood webs. Environ. Sci. Technol. 38 (21), 5497–5504.
Petersen, M., Hamm, S., Schäfer, A., Esser, U., 2004. ComparativeGC/MS and LC/MS detection of hexabromocyclododecane
(HBCD) in soil and water samples. Organohalogen Compd. 66,224–231.
Rogakou, E.P., Boon, C., Redon, C., Bonner, W.M., 1999. Megabasechromatin domains involved in DNA double-strand breaksin vivo. J. Cell Biol. 146 (5), 905–916.
Roldán-Arjona, T., Ariza, R.R., 2009. Repair and tolerance ofoxidative DNA damage in plants. Mutat. Res. Rev. Mutat. 681(2-3), 169–179.
Ronisz, D., Finne, E.F., Karlsson, H., Förlin, L., 2004. Effects of thebrominated flame retardants hexabromocyclododecane(HBCDD), and tetrabromobisphenol A (TBBPA), on hepaticenzymes and other biomarkers in juvenile rainbow trout andferal eelpout. Aquat. Toxicol. 69 (3), 229–245.
Rothkamm, K., Löbrich, M., 2003. Evidence for a lack of DNAdouble-strand break repair in human cells exposed to very lowX-ray doses. Proc. Natl. Acad. Sci. U. S. A. 100 (9), 5057–5062.
Sellström, U., Kierkegaard, A., de Wit, C., Jansson, B., 1998.Polybrominated diphenyl ethers andhexabromocyclododecane in sediment and fish from a Swedishriver. Environ. Sci. Technol. 17 (6), 1065–1072.
Thomsen, C., Molander, P., Daae, H.L., Janák, K., Froshaug, M.,Liane, V.H., et al., 2007. Occupational exposure tohexabromocyclododecane at an industrial plant. Environ. Sci.Technol. 41 (15), 5210–5216.
Tomy, G.T., Budakowski, W., Halldorson, T., Whittle, D.M., Keir,M.J., Marvin, C., et al., 2004. Biomagnification of α- andγ-hexabromocyclododecane isomers in a Lake Ontario foodweb. Environ. Sci. Technol. 38 (8), 2298–2303.
Ueno, D., Alaee, M., Marvin, C., Muir, D.C.G., Macinnis, G., Reiner,E., et al., 2006. Distribution and transportability ofhexabromocyclododecane (HBCD) in the Asia-Pacific regionusing skipjack tuna as a bioindicator. Environ. Pollut. 144 (1),238–247.
Vanderauwera, S., Suzuki, N., Miller, G., van de Cotte, B., Morsa, S.,Ravanat, J.L., et al., 2011. Extranuclear protection of chromosomalDNA from oxidative stress. Proc. Natl. Acad. Sci. U. S. A. 108 (4),1711–1716.
Wang, X., Ren, N.Q., Qi, H., Ma, W.L., Li, Y.F., 2009. Levels anddistribution of brominated flame retardants in the soil ofHarbin in China. J. Environ. Sci. 21 (11), 1541–1546.
Wu,T.,Wang, S., Huang,H.L., Zhang, S.Z., 2012. Diastereomer-specificuptake, translocation, and toxicity of hexabromocyclododecanediastereoisomers tomaize. J. Agric. Food Chem. 60 (34), 8528–8534.
Yin, Y., Jia, H.X., Sun, Y.Y., Yu, H., Wang, X., Wu, J., et al., 2007.Bioaccumulation and ROS generation in liver of Carassiusauratus, exposed to phenanthrene. Comp. Biochem. Physiol. CToxicol. Pharmacol. 145 (2), 288–293.
Yu, Y.K., Zhu, W., Diao, H.L., Zhou, C.X., Chen, F.Q.F., Yang, J., 2006.A comparative study of using comet assay and γH2AX fociformation in the detection of N-methyl-N′-nitro-N-nitrosoguanidine-induced DNA damage. Toxicol. in Vitro 20(6), 959–965.
Zegers, B.N., Mets, A., van Bommel, R., Minkenberg, C., Hamers,T., Kamstra, J.H., et al., 2005. Levels ofhexabromocyclododecane in harbor porpoises and commondolphins from Western European seas, with evidence forstereoisomer-specific biotransformation by cytochrome P450.Environ. Sci. Technol. 39 (7), 2095–2100.
Zhang, X.L., Yang, F.X., Luo, C.H., Wen, S., Zhang, X., Xu, Y., 2009.Bioaccumulative characteristics of hexabromocyclododecanesin freshwater species from an electronic waste recycling areain China. Chemosphere 76 (11), 1572–1578.
Zhu, Z.C., Chen, S.J., Zheng, J., Tian,M., Feng, A.H., Luo, X.J., et al., 2014.Occurrenceof brominated flame retardants (BFRs), organochlorinepesticides (OCPs), and polychlorinated biphenyls (PCBs) inagricultural soils in a BFR-manufacturing region of North China.Sci. Total Environ. 481, 47–54.

J O U R N A L O F E N V I R O N M E N T A L S C I E N C E S 4 2 ( 2 0 1 6 ) 1 0 5 – 1 1 1
Ava i l ab l e on l i ne a t www.sc i enced i r ec t . com
ScienceDirect
www. jou rna l s . e l sev i e r . com/ j es
Novel microbial fuel cell design to operate with differentwastewaters simultaneously
Abhilasha Singh MathuriyaDepartment of Biotechnology, Anand Engineering College, NH-2, Keetham, Agra 282007, India. E-mail: [email protected]
A R T I C L E I N F O
http://dx.doi.org/10.1016/j.jes.2015.06.0141001-0742/© 2015 The Research Center for Ec
A B S T R A C T
Article history:Received 2 April 2015Revised 24 June 2015Accepted 25 June 2015Available online 31 August 2015
A novel single cathode chamber and multiple anode chamber microbial fuel cell design(MAC-MFC) was developed by incorporating multiple anode chambers into a single unit andits performance was checked. During 60 days of operation, performance of MAC-MFC wasassessed and compared with standard single anode/cathode chamber microbial fuel cell(SC-MFC). The tests showed that MAC-MFC generated stable and higher power outputscompared with SC-MFC and each anode chamber contributed efficiently. Further,MAC-MFCs were incorporated with different wastewaters in different anode chambersand their behavior in MFC performance was observed. MAC-MFC efficiently treatedmultiplewastewaters simultaneously at low cost and small space, which claims its candidature forfuture possible scale-up applications.© 2015 The Research Center for Eco-Environmental Sciences, Chinese Academy of Sciences.
Published by Elsevier B.V.
Keywords:Microbial fuel cellsMultiple wastesBioelectricityNew designWastewater treatment
Introduction
Microbial fuel cells (MFCs) hold a promising future in waste-water treatment as an emerging system, capable of removingcontaminants and producing electricity simultaneously. Theseare the devices, which convert chemical energy of chemicalcompounds, directly into electrical energy using catalyticactivities of microorganisms. The essential components of aMFC include: an anode, a cathode, an electrolyte medium thatconnects the two electrodes, an external circuit, and microor-ganisms (Cheng et al., 2006a; Mathuriya and Sharma, 2009a;Mathuriya and Yakhmi, 2014). A prototype two-chamber MFChas been studied most extensively (Cheng et al., 2006a, 2006b;Shukla et al., 2004; Mathuriya and Sharma, 2009b). This MFCconsists of anaerobic anode and aerobic cathode chamberseparated by a cation/proton exchange membrane. At theanode, microorganisms generate electrons through degradingorganic compounds. Electrons travel through external circuitto cathode while protons through membrane. At thecathode, they react with oxygen to form water. Therefore,the electricity generated by MFC can be harvested by an
o-Environmental Science
external resistor placed between the anode and the cathode(Jiang et al., 2010).
Over the past few years, MFCs witnessed intense researchand development and proved to be superior over other com-peting conventional wastewater treatment technologies, inmany aspects, including enhanced conversion efficiency dueto direct conversion of substrate's chemical energy intoelectricity; capability to treat low-strength wastewaters thatare not suitable for anaerobic digestion (Rittmann, 2008;Watanabe, 2008); safe and quite performance; ability tooperate at ambient temperature (Mathuriya and Sharma,2009a); and generation of 50%–90% less solids to be disposedof (Du et al., 2007). Moreover, MFCs produce mainly carbondioxide (CO2) that has no useful energy content and compar-atively less harmful, thus not requiring much further treat-ment (Jang et al., 2004). In recent years power densities inMFCs reached over 4200 mW/m3 (Sharma and Li, 2010) andchemical oxygen demand (COD) and other contaminantsremoval up to 100% (Luo et al., 2011).
The structural parameters draw crucial effects on theoverall performance of a fuel cell (Larminie and Dicks, 2000).
s, Chinese Academy of Sciences. Published by Elsevier B.V.

106 J O U R N A L O F E N V I R O N M E N T A L S C I E N C E S 4 2 ( 2 0 1 6 ) 1 0 5 – 1 1 1
In past, manyMFC designs have been tested to increase powerdensity or wastewater treatment efficiency (Kaewkannetra etal., 2011; Qian et al., 2011; Huang et al., 2012). In additions,various attempts have been made to minimize MFC operationalcosts (Buitrón and Cervantes-Astorga, 2013). Novel configura-tions viz. single-chamber (Yokoyamaet al., 2006), column (Powerset al., 2011), tubular, (Rabaey et al., 2005) and high efficiencyelectrode materials (non-platinum coated cathodes, brush an-odes, granular activated carbon anodes) have been developed tilldate (Rabaey et al., 2005; Cheng et al., 2006a,b; He et al., 2007;Logan et al., 2007; Zou et al., 2008; Sharma et al., 2008). However,most MFCs studies were conducted at lab scales (less than 1 L)and it was observed that the power density decreased duringscale-up (Keller and Rabaey, 2008). In addition, these MFCs wereable to treat only one type of wastewater at a time (Mathuriyaand Sharma, 2009a; Rabaey et al., 2005). In order to make MFCssuitable for practical applications, it is critical to achieve highpower density at large scale along with real time wastewatermanagement capabilities. In present investigation, a novelmultiple anode chamber and single cathode chamber MFCdesign (MAC-MFC)was fabricatedwhich operated as a fed batchsystem to optimize power output from wastewater and itsperformance was compared with the standard single-anode/cathode chamber MFC (SC-MFC) for power production andchemical oxygen demand (COD) removal. Further, efficiency ofMAC-MFC was studied with different wastewaters in eachanode chamber to prove its ability in treating different waste-waters simultaneously, a possible situation in many wastetreatment plants.
1. Materials and methods
1.1. Wastewaters
Dairywastewaterwas collected fromprimary effluent collectiontank from a local dairy plant at Agra, India. Potato wastewaterwas collected from local potato chip unit Agra, India. Paperwastewaterwas collected fromapaper processing plant at Agra,India. The artificial wastewater was prepared by modifyingprevious method (Jang et al., 2004). The composition was (g/L):15.0 g glucose, 450.0 mgNaHCO3, 100.0 mgNH4Cl, 10.5 mgK2HPO4,6.0 mgKH2PO4, 64.3 mgCaCl2·2H2O, 18.9 mgMgSO4·7H2O, 10.0 mgFeSO4·7H2O, 6.0 mg MnSO4, 0.5 mg ZnSO4·7H2O, 20.0 mg CoCl2·6-H2O, and 0.65 mg CuSO4·5H2O. Spot samples of all wastewaterswere transported to laboratory for physicochemical analysis.These parameters include pH, total dissolved solids (TDS), totalsuspendedsolids (TSS), volatile suspendedsolids (VSS), color, odor,COD, and biological oxygen demand (BOD). Each sample was leftundisturbed for 24 hr at 4°C under anaerobic conditions to settlethe solid particulate contents. Wastewater samples were kept inrefrigerator at 4°C, when not in use. The plain wastewaters(without any modifications such as addition of nutrients, media-tor, and any other microbial inoculum or trace metals) withconstantCODvalueof 1500 mg/Lwereusedas the inoculumforallMFC tests (except as indicated). CODvaluesof variouswastewaterswere adjusted by diluting wastewaters with de-ionized water.Experiments were conducted at 30°C, pH 7.0 and stagnantcondition (without stirring).
1.2. MFC designs
Standard single chamber MFCs (SC-MFCs) were constructedfrom two glass chambers with total inner volume of 3000 mLand working volume of 2100 mL. The anode and cathodechambers were separated using a glass plate frame having6 × 6 cm hole. The hole was tightly sealed by a protonexchange membrane (PEM-Nafion™ 117, DuPont Co., USA).Plain carbon paper (7 × 7 cm) and graphite plate (7 × 7 cm)were used as anode and as cathode (Fig. 1a). The electrodes(both anode and cathode) were connected to copper wire andexposed coppermetal surface at the joints, were tightly sealedwith non conductive epoxy resin. Both anode and cathodewere suspended in their respective chambers. The anodicchamber was filled with 2100 mL dairy wastewater. The anodicchamber was continuously flushed with a mixture of N2/CO2
(80:20, V/V) to maintain anaerobic conditions. On the other hand,cathodechamberwas filledwith700 mLof100 mmol/Lphosphatebuffer and pH was maintained to 7.0 by 0.5 mol/L NaOH. Air waspercolated in the cathode chamber through a 0.45 μm pore sizefilter to providemolecular oxygenas electronacceptor for cathode.
Multiple anode chamber MFC design (MAC-MFC) wasconstructed from three media bottles and one water bottle.Each media bottle had a total working volume of 1000 mLwhile water bottle was of 5000 mL capacity. Themedia bottleswere developed as anode chambers and water bottle ascathode. All anodes and cathode bottles were joined by anon-conductive resin with 6 × 6 cm PEM, separating thepassage between the bottles (Fig. 1b). Electrode arrangementsconsisting of plain carbon paper (7 × 7 cm) as anode and threeparallel graphite plates (7 × 7 cm) as cathode were used. Theanodes and cathodes were suspended from the top cover,which was tightly sealed. The anodes were continuouslyflushed with N2/CO2 (80:20, V/V) to maintain anaerobicconditions. Cathode chamber was filled with 100 mmol/L,2100 mL phosphate buffer and pH adjusted to 7 by 0.5 mol/LNaOH. Cathode chamber was provided with air that waspassed through a 0.45 μm pore size filter to provide molecularoxygen as electron acceptor for cathode. The electrodes wereattached to copper wire with all exposed metal surfacessealed with a nonconductive epoxy. One sampling ports weretapped in the side of the anodes and cathode chamber topermit withdrawal and addition of medium solution.
1.3. MFC operations
After the attachments were completely dried, both the cathodeand anode electrodes were soaked in deionized water for 1 hrbefore assembling the MFCs. The anode chambers were filled(700 mL) with wastewater for study. Initially MFCs wereinoculated with artificial wastewater containing glucose ascarbon source. After two cycles, feed solution containing 50%artificial wastewater and 50% dairy wastewater sample, inocu-lated into MFCs separately. After four cycles, feed solution wasswitched to dairy wastewater sample.
The experimental setupwas run in fed-batchmodewithdairywastewater as anolyte except as indicated. The performance ofall the MFCs was evaluated by measuring current, currentdensity, potential, open circuit voltage (OCV), and power densityalong with COD removal efficiency. Stable voltage output was

Anode 2Anode 1
Anode 3
Sampling port 2
Sampling port 1
Sampling port 1
Sampling port 3
Nafion 117
Nafion 117
Nafion 117
Cathode 3Cathode 2
Cathode 1
Fig. 1 – Schematic representation of standard single anode/cathode chamber microbial fuel cell (SC-MFC) and multiple anodechamber and single cathode chamber microbial fuel cell (MAC-MFC) design.
107J O U R N A L O F E N V I R O N M E N T A L S C I E N C E S 4 2 ( 2 0 1 6 ) 1 0 5 – 1 1 1
achieved after two cycles (30 days each). Constant substrate(COD) removal efficiency and voltage output were consid-ered as indicators to assess the stable performance of theMFC. Electrode fouling was not observed and the electrodescould be used in further experiments without remarkableactivity loss. Before changing the feed, inoculum was allowedto settle down (1 hr) and exhausted feed (350 mL) was replacedwith fresh feed under anaerobic condition. The anode chamberwas sparged with oxygen-free N2 gas for a period (4 min) tomaintain anaerobicmicroenvironment after every feeding event.A steady increase in voltage generation was observed withadditional feed.
1.4. Polarization curve measurement
Polarization curve for an MFC dictates its sustainable perfor-mance under specific operating conditions. For each testrun, when the MFCs reached steady state (i.e., effluent CODconcentration remained little change and obtained currentdidn't showed much fluctuation), a polarization curve exper-iment was carried out. For polarization, current generationwasmonitored at various external resistances connected for afew minutes and readings were noted after stabilization ofvoltage. The polarization curve measurement was conductedto determine the power generation at different external resis-tors, Rext (Ω). The Rext was changed from100 to 1000 Ω during themeasurement and the voltage on each Rext was recorded by adigital multimeter (Model–108, Kusam Electrical Industries,India). In MAC-MFC, all three anodes were connected in seriesduring polarization experiment.
1.5. Electricity measurement
Current (I) and voltage (V) measurements were done byconnecting with 200 Ω external circuit. OCV was measuredin an open circuit, without any external resistance. The poweroutput (P) generated was calculated according to P = V2 / Rand plotted with respect to Rext. The maximum power out-put was derived from the polarization curve. Power density,
PD (mW/m2), was calculated by multiplying the current byvoltage and dividing with electrode surface area.
1.6. COD measurement
COD measurements were conducted using standard methods(Greenberg et al., 1992). All samples were filtered through a0.22 μm (pore diameter) membrane filter prior to COD measure-ments. COD (mg/L) removal was calculated as ECOD = (CODin −CODout / CODin) × 100%, where CODin (mg/L) is the influent CODand CODout (mg/L) is the effluent COD.
1.7. Statistical analyses
All experiments were conducted in triplicate either usingseparate MFCs or the experiments were repeated at least 3times, when single MFC was used. The results were presentedas average values.
2. Results and discussion
2.1. Wastewater characterization
All wastewaters were characterized to observe their suitabilityto act as anolyte in anode chambers of MFCs. The character-istics of the wastewaters were observed as shown in Table 1.The results show that these wastewaters are cause of pollutionin the environment. In addition, those can be utilized asanolytes in MFCs due to their high COD values.
2.2. Characterization of MFC performance
Fig. 2 represents the polarization curves of both MFC designs,as a function of current density, potential, and power densitymeasured at variable resistances (100 to 1000 Ω). Under lowresistances the fuel cell circuit allowed more electrons toflow and to neutralize the protons (H+) present at the cathode,

Table 1 – Characterization of different wastewaters.
Dairy Potato Paper
pH 7.9 6.4 7.8COD (mg/L) 2057 1735 2839BOD (mg/L) 1827 234 1528TSS (mg/L) 2867 256 385VSS concentration(mg/L)
1945 1276 2458
TDS (mg/L) 13878.5 11794.1 19889.9Odor Foul Foul Foul and intolerantColor Brownish Brownish Dark brownish
COD: chemical oxygen demand, BOD: biological oxygen demand,TSS: total suspended solids, VSS: volatile suspended solids, TDS:total dissolved solids.
108 J O U R N A L O F E N V I R O N M E N T A L S C I E N C E S 4 2 ( 2 0 1 6 ) 1 0 5 – 1 1 1
in comparison to higher resistance, which resulted in rapidstabilizationof potential at higher resistances. In similarmanner,decreasing current generation trend with increase in the resis-tance was observed in both MFC types and at 1000 Ω relativelyless current generation was recorded. This typical current andpotential decreasing trend with increase in resistance was foundto be in consistentwith earlier studies (Kaewkannetra et al., 2011;Oh et al., 2004), and thus represents typical fuel cell behavior.Higher performance was observed in MAC-MFCs than SC-MFCduring polarization studies, which indicate better substratediffusion and less internal losses inMAC-MFC.MAC-MFC showed1.23 times higher power density (356 mW/m2) than the powerdensity obtained from SC-MFC (289 mW/m2). These resultsencourage the candidature of MAC-MFC particularly for furtherlarge scale applications.
2.3. Electricity generation in MAC-MFC and SC-MFC
After successful stable start-up, performance was measuredby running the MAC-MFCs and SC-MFCs without any externalresistance for 60 days under identical conditions. MFCs startedgenerating power soon after inoculation and a gradual rise inthe OCV was observed, which might be due to readily degrad-able components inwastewater. The voltage droppedwhen theeasily degradable contents of anolyte were exhausted, yet thepresence of other degradable components supported microbialmetabolism and less OCVwas observed. When the voltage out-put dropped remarkably, 50% of freshwastewater was replaced
50
100
150
200
250
300
350
400
0100200300400500600700800900
12 16 20 24 28 32 36 40
Pow
er d
ensi
ty (
mW
/cm
2 )
Pote
ntia
l (m
V)
Dairy wastewater
PotentialPower density
4 8
Current density (mA/cm2)
Fig. 2 – Polarization curve obtained from MAC-MFC (a) and SC-Manode chamber and single cathode chamber microbial fuel cell;fuel cell.
with old, into MFCs to maintain the COD of 1500 mg/L. A linearincrease inOCVoutputwas observedwith every additional feed.
When compared with SC-MFC, MAC-MFCs exhibited higherperformance. The voltage output of MAC-MFC was 1.21 times(986 mV) higher than SC-MFC (810 mV). While highest currentdensity of MAC-MFC was 288 mA/m2 in comparison with196 mA/m2 of SC-MFC. The MAC-MFC showed less fluctuationin the voltage as well as current response in comparison withSC-MFC (Fig. 3). This might be due to multiple anode chambersinMAC-MFCwhich acted as co-backup to other anodic chamber.In addition, distribution of anolyte among three chambersprovides much scope for microbial metabolism and substratedistribution.
2.4. COD removal efficiency
As the main aim of present study was to observe theefficiency of MFCs as waste treatment system, thereforeduring the operation MFCs were continuously monitored forwaste (as COD) removal. COD value was fixed at 1500 mg/L inboth MFCs. Both the systems showed their potential for CODremoval indicating the function of microflora in metabolizingthe waste in wastewater as electron donors. Microbes enrichedfor 60 days in anMFC removed organic contaminants in waste-water almost completely, with the concomitant generationof electricity. MAC-MFC showed a higher and stable CODremoval efficiency than SC-MFC (Fig. 4), during 60 days ofoperation.
2.5. Simultaneous treatment of different wastewatersin MAC-MFC
Many real waste treatment sites generate more than one typeof wastewaters which hinders the installation of standardMFC which treats only one type of wastewater in one time. Inan attempt to meet this challenge, MAC-MFC was operatedwith three different wastewaters (dairy, potato and paperindustry) in each anodic chamber to study its efficiency asmultiple wastewater treatment system. The COD concentra-tion of each wastewater was optimized at 1500 mg/L. CODremoval efficiency was checked separately in every anodicchamber, while OCV measured in complete system to checkstable voltage output. 50% fresh wastewater was replacedwith old, when COD level dropped remarkably. Highest and
Pow
er d
ensi
ty (
mW
/cm
2 )
PotentialPower density
0
50
100
150
200
250
300
350
0
100
200
300
400
500
600
700
800
4 8 12 16 20 24 28 32 36 40
Pote
ntia
l (m
V)
Wastewater
Current density (mA/cm2)
FC (b) operating on dairy wastewater. MAC-MFC: multipleSC-MFC: standard single anode/cathode chamber microbial

0
50
100
150
200
250
300
350
0
100
200
300
400
500
600
700
800
900
1000
Cur
rent
den
sity
(m
A/m
2 )
Ope
n ci
rcui
t vol
tage
(m
V)
0
50
100
150
200
250
0
100
200
300
400
500
600
700
800
900
1000
10 11 12 13 14 15 16 17 18 19 20 21 22 23 24 25 26 27 28 29 30 31 32 33 34 35 36 37 38 39 40 41 42 43 44 45 46 47 48 49 50 51 52 53 54 55 56 57 58 59 601 2 3 4 5 6 7 8 9
1 2 3 4 5 6 7 8 9 10 11 12 13 14 15 16 17 18 19 20 21 22 23 24 25 26 27 28 29 30 31 32 33 34 35 36 37 38 39 40 41 42 43 44 45 46 47 48 49 50 51 52 53 54 55 56 57 58 59 60
Cur
rent
den
sity
(m
A/m
2 )
Ope
n ci
rcui
t vol
tage
(m
V)
Open circuit voltage
Current density
Open circuit voltage
Current density
a
b
Time (day)
Time (day)
Fig. 3 – Open circuit voltage and current density obtained from MAC-MFC (a) and SC-MFC (b) operating on dairy wastewater.
109J O U R N A L O F E N V I R O N M E N T A L S C I E N C E S 4 2 ( 2 0 1 6 ) 1 0 5 – 1 1 1
rapid COD removal efficiency was shown be associated withpotato wastewater. Paper industry wastewater showed afluctuated current response throughout, and it was replaced
0
10
20
30
40
50
60
70
80
90
100
1 2 3 4 5 6 7 8 9 10 11 12 13 14 15
CO
D r
emov
al e
ffic
ienc
y (%
)
Time
Fig. 4 – Chemical oxygen demand (COD) remo
3 times less than potato wastewater and two times less thandairy wastewater. It was due to less COD removal in paperindustry wastewater than other two wastewaters. Although
16 17 18 19 20 21 22 23 24 25 26 27 28 29 30 (days)
MAC-MFC
SC-MFC
val efficiencies in MAC-MFC and SC-MFC.
110 J O U R N A L O F E N V I R O N M E N T A L S C I E N C E S 4 2 ( 2 0 1 6 ) 1 0 5 – 1 1 1
the COD removal trend was different yet the voltage outputwas almost stable, which clearly indicates that all threechambers were associated with each other and acted asbackup for another anode chamber.
In some earlier studies, it was observed that the cathodewas among major limiting factors for lower power output ofMFCs (Jiang et al., 2010; Oh et al., 2004; Zhao et al., 2006; Zuo etal., 2007; Jiang and Li, 2009). Increase in the number ofcathodes might increase the power output due to higheroxidation rate on the multiple cathodes. This concept wasapplied in present study that multiple cathode surface areawould provide more reaction sites and thus would result inan increase in the voltage output (Oh and Logan, 2007;Rismani-Yazdi et al., 2008). However, ohmic loss and masstransport loss also limit the high voltage yield in spite of largecathode area (Rismani-Yazdi et al., 2008). The possible reasonmay be the scarcity of oxygen due to less liquid volumein comparison to number of electrodes (in SC-MFC). Thisproblem was illustrated in present study that power densityis also dependant of available oxygen at cathode present incatholyte. Catholyte limits the power density even if multiplecathodes are present. The configuration of multiple anodechambers, single cathode chamber (with multiple electrodesin large volume of catholyte) in one MFC reactor, thusmaintained the high power generation.
MAC-MFC was found to be more efficient than SC-MFC, interms of electricity generation and COD removal. The primaryreasonmay be the distribution of anolyte in separate chambers,which facilitated more scope for substrate diffusion. Here, itmay consider that MAC-MFC and SC-MFC are stagnant-batchsystems, thus substrate diffusionmaybe the limitation. Second,MAC-MFC offers high membrane:anolyte contact ratio due tomultiple anode chambers, which allows higher transfer of H+ tocathode, thus offers higher efficiency.
Further, different wastewaters were tested in MAC-MFCto check its suitability to treat a large domain of wastewaters.Wastewaters were selected on the basis of the nature of majorbiodegradable component present in wastewater (dairy waste-water: proteinous; potato wastewater: carbohydratic; and paperindustry wastewater: cellulosic nature). Dairy effluent containsdissolved proteins, fats, and sugars and is a good source ofnutrition for microorganisms of broad category (Mathuriya andSharma, 2009b). The potato wastewater is considered as richsource of starch and sugar (Mathuriya andSharma, 2009b, 2010).Paper wastewater contains mainly cellulose or lingo-cellulosicmaterials which are difficult to metabolize by microbes thanthat of low molecular carbohydrates, or of the storage carbo-hydrate starch, as the ß (beta)-glycosidic bonds of the structuralcarbohydrate cellulose are highly resistant to hydrolysis(Mathuriya and Sharma, 2009a). Different results were obtainedin terms of COD removal which suggests that performance ofevery anode chamber was independent and it followedmore orless same pattern as was in author's previous study (Mathuriyaand Sharma, 2009b). Further the stable voltage output wasobserved due to variation in degradation pattern of differentwastewaters, which apparently acted as backup for MFC togenerate sustainable voltage output. Although MAC-MFC con-sumed must cost due to expansive nafion 117, yet the replace-ment of low cost separator with nafion 117 may solve theproblem.
3. Conclusions
The core objective of this study was to describe a proof-ofconcept MAC-MFC system with special focus on multiplewastewater treatment with energy generation. This prototypesuccessfully demonstrated the defined objective. During paralleloperation with SC-MFC, MAC-MFC exhibited superior and stableperformance and all anode chambers in MAC-MFC acted asco-backup to others. Yet the performance of MFCs is influencedby several other factors viz. microbial activity, anolyte, PEM,internal resistance, and cathode electron transfer efficiency. Allof these require careful study in order to develop MFC as aneconomical power production device and are of further scope.
Acknowledgment
The author acknowledges the assistance of Suyash Srivastavaand Pradyot Tripathi during laboratory work and AnshulKumar for framing the manuscript.
R E F E R E N C E S
Buitrón, G., Cervantes-Astorga, C., 2013. Performance evaluationof a low-cost microbial fuel cell using municipal wastewater.Water Air Soil Pollut. 224, 1470–1478. http://dx.doi.org/10.1007/s11270-013-1470-z.
Cheng, S., Liu, H., Logan, B., 2006a. Power densities using differentcathode catalysts (Pt and CoTMPP) and polymer binders(Nafion and PTFE) in single chamber microbial fuel cells.Environ. Sci. Technol. 40 (1), 364–369.
Cheng, S., Liu, H., Logan, B.E., 2006b. Increased power generationin a continuous flow mfc with advective flow through theporous anode and reduced electrode spacing. Environ. Sci.Technol. 40 (7), 2426–2432.
Du, Z., Li, H., Gu, T., 2007. A state of the art review on microbialfuel cells: a promising technology for wastewater treatmentand bioenergy. Biotechnol. Adv. 25, 464–482.
Greenberg, A., Clesceri, L.S., Eaton, A.D., 1992. Standard Methodsfor the Examination of Water and Wastewater. 18th ed.American Public Health Association, Washington, DC.
He, Z., Shao, H., Angenent, L., 2007. Increased power productionfrom a sediment microbial fuel cell with a rotating cathode.Biosens. Bioelectron. 22 (12), 3252–3255.
Huang, Y., He, Z.B., Kan, J., Manohar, A.K., Nealson, K.H., Mansfeld,F., 2012. Electricity generation from a floating microbial fuelcell. Bioresour. Technol. 114, 308–313.
Jang, J.K., Pham, T.H., Chang, I.S., Kang, K.H., Moon, H., Cho, K.S., etal., 2004. Construction and operation of a novel mediator andmembrane-less microbial fuel cell. Process Biochem. 39 (8),1007–1012.
Jiang, D., Li, B., 2009. Granular activated carbon single-chamberMFCs: a design suitable for large-scale wastewater treatmentprocesses. Biochem. Eng. J. 47 (1–3), 31–37.
Jiang, D., Li, X., Raymond, D., Mooradain, J., Baikun, L., 2010. Powerrecovery with multi-anode/cathode microbial fuel cells suitablefor future large-scale applications. Int. J. Hydrog. Energy 35 (16),8683–8689.
Kaewkannetra, P., Chiwes, W., Chiu, T.Y., 2011. Treatment ofcassava mill wastewater and production of electricity throughmicrobial fuel cell technology. Fuel 90 (8), 2746–2750.

111J O U R N A L O F E N V I R O N M E N T A L S C I E N C E S 4 2 ( 2 0 1 6 ) 1 0 5 – 1 1 1
Keller, J., Rabaey, K., 2008. Experiences from MFC pilot plantoperation: how to get the technology market ready? Abstractsof Microbial Fuel Cells: First International Symposium. ThePennsylvania State University, Pennsylvania, p. 13 (May 27–29)
Larminie, J., Dicks, A., 2000. Fuel Cell Systems Explained. JohnWiley & Sons, Chichester, pp. 68–69.
Logan, B., Cheng, S., Watson, V., Estadt, G., 2007. Graphite fiberbrush anodes for increased power production in air-cathodemicrobial fuel cells. Environ. Sci. Technol. 41 (9), 3341–3346.
Luo, Y., Zhang, R., Liu, G., Li, J., Qin, B., Li, M., et al., 2011.Simultaneous degradation of refractory contaminants in boththe anode and cathode chambers of the microbial fuel cell.Bioresour. Technol. 102 (4), 3827–3832. http://dx.doi.org/10.1016/j.biortech.2010.11.121.
Mathuriya, A.S., Sharma, V.N., 2009a. Bioelectricity productionfrom paper industry waste using a microbial fuel cell byClostridium species. J. Biochem. Technol. 1 (2), 49–52.
Mathuriya, A.S., Sharma, V.N., 2009b. Bioelectricity productionfrom various waste waters through microbial fuel celltechnology. J. Biochem. Technol. 2 (1), 133–137.
Mathuriya, A.S., Sharma, V.N., 2010. Electricity generation frompotato waste water in amicrobial fuel cell. Int. J. Agric. Environ.Biotechnol. 3 (3), 335–340.
Mathuriya, A.S., Yakhmi, J.V., 2014. Microbial fuelcells—applications for generation of electrical power andbeyond. Crit. Rev. Microbiol. http://dx.doi.org/10.3109/1040841X.2014.905513.
Oh, S., Logan, B., 2007. Voltage reversal during microbial fuel cellstack operation. J. Power Sources 167 (1), 11–17.
Oh, S., Min, B., Logan, B., 2004. Cathode performance as a factor inelectricity generation in microbial fuel cells. Environ. Sci.Technol. 38 (18), 4900–4904.
Powers, C.A., Scott, N.R., Richardson, R.E., 2011. Performance ofmicrobial fuel cells with dairy manure as the substrate andcombined with anaerobic digestion. Biol. Eng. 3 (3), 151–161.http://dx.doi.org/10.13031/2013.36509.
Qian, F., He, Z., Thelen, M.P., Li, Y., 2011. A microfluidic microbialfuel cell fabricated by soft lithography. Bioresour. Technol. 102(10), 5836–5840.
Rabaey, K., Clauwaert, P., Aelterman, P., Verstraete, W., 2005.Tubular microbial fuel cells for efficient electricity generation.Environ. Sci. Technol. 39 (20), 8077–8082.
Rismani-Yazdi, H., Carver, S.M., Christy, A.D., Tuovinen, I.H., 2008.Cathodic limitations in microbial fuel cells: an overview.J. Power Sources 180 (2), 683–694.
Rittmann, B.E., 2008. Opportunities for renewable bioenergy usingmicroorganisms. Biotechnol. Bioeng. 100 (2), 203–212.
Sharma, Y., Li, B., 2010. Optimizing energy harvest in wastewatertreatment by combining anaerobic hydrogen producingbiofermentor (HPB) and microbial fuel cell (MFC). Int. J. Hydrog.Energy 35 (8), 3789–3797.
Sharma, T., Reddy, A., Chandra, T., Ramaprabhu, S., 2008.Development of carbon nanotubes and nanofluids basedmicrobial fuel cell. Int. J. Hydrog. Energy 33 (22), 6749–6754.
Shukla, A.K., Suresh, P., Berchmans, S., Rajendran, A., 2004.Biological fuel cells and their applications. Curr. Sci. 87 (4),455–468.
Watanabe, K., 2008. Recent developments in microbial fuel celltechnologies for sustainable bioenergy. J. Biosci. Bioeng. 106(6), 528–536.
Yokoyama, H., Ohmori, H., Ishida, M., Waki, M., Tanaka, Y., 2006.Treatment of cow-waste slurry by a microbial fuel cell and theproperties of the treated slurry as a liquid manure. Anim. Sci. J.77 (6), 634–638.
Zhao, F., Harnisch, F., Schro¨der, U., Scholz, F., Bogdanoff, P.,Herrmann, I., 2006. Challenges and constraints of using oxygencathodes in microbial fuel cells. Environ. Sci. Technol. 40 (17),5193–5199.
Zou, Y., Xiang, C., Yang, L., Yang, L., Sun, L.X., Cao, Z., 2008. Amediatorless microbial fuel cell using polypyrrole coatedcarbon nanotubes composite as anode material. Int. J. Hydrog.Energy 33 (18), 4856–4862.
Zuo, Y., Cheng, S., Call, D., Logan, B.E., 2007. Tubular membranecathodes for scalable power generation in microbial fuel cells.Environ. Sci. Technol. 41 (9), 3347–3353.

J O U R N A L O F E N V I R O N M E N T A L S C I E N C E S 4 2 ( 2 0 1 6 ) 1 1 2 – 1 1 8
Ava i l ab l e on l i ne a t www.sc i enced i r ec t . com
ScienceDirect
www. jou rna l s . e l sev i e r . com/ j es
Modeling of acute cadmium toxicity in solution to barley rootelongation using biotic ligand model theory
Xuedong Wang⁎, Mingyan Wu, Jingxing Ma, Xiaolin Chen, Luo HuaThe Key Lab of Resource Environment and GIS, College of Resource Environment and Tourism, Capital Normal University, Beijing 100048,China
A R T I C L E I N F O
⁎ Corresponding author. E-mail address: xdw
http://dx.doi.org/10.1016/j.jes.2015.06.0191001-0742/© 2015 The Research Center for Ec
A B S T R A C T
Article history:Received 3 April 2015Revised 2 June 2015Accepted 16 June 2015Available online 11 November 2015
Protons (H+) aswell as differentmajor and trace elementsmay inhibit cadmium (Cd) uptake inaquatic organisms and thus alleviate Cd toxicity. However, little is known about suchinteractions in soil organisms. In this study, the independent effects of the cations calcium(Ca2+), magnesium (Mg2+), potassium (K+), H+ and zinc (Zn2+) on Cd toxicity were investigatedwith 5-day long barley root elongation tests in nutrient solutions. The tested concentrations ofselected cations and tracemetal ionswere based on the ranges that occur naturally in soil porewater. The toxicity of Cd decreased with increasing activity of Ca2+, Mg2+, H+ and Zn2+, but notK+. Accordingly, conditional binding constants were obtained for the binding of Cd2+, Ca2+,Mg2+, H+, and Zn2+ with the binding ligand: logKCdBL 5.19, logKCaBL 2.87, logKMgBL 2.98, logKHBL
5.13 and logKZnBL 5.42, respectively. Furthermore, it was calculated that on average 29% of thebiotic ligand sites needed to be occupied by Cd to induce a 50% decrease in root elongation.Using the estimated constants, a biotic ligandmodelwas successfully developed to predict theCd toxicity to barley root elongation as a function of solution characteristics. The feasibilityand accuracy of its application for predicting Cd toxicity in soils were discussed.© 2015 The Research Center for Eco-Environmental Sciences, Chinese Academy of Sciences.
Published by Elsevier B.V.
Keywords:CadmiumBiotic ligand model (BLM)ToxicityBarley
Introduction
Cadmium (Cd), a hazardous heavy metal, can have toxiceffects on crop production and on human beings. Cd is widelypresent in the environment due to human activities, such asmining and smelting, industrial processes and agriculturalapplication of phosphate fertilizers (Carpenè et al., 2006). Thebioaccumulation of Cd in edible plants can especially poserisks to human health. Investigations in different plantspecies have revealed that Cd accumulation in plant tissuescan also lead to limitations to the growth and development ofplants at a cellular level (Liu et al., 2007). Thus a crucialstrategy to alleviate and minimize the adverse biologicaleffects of Cd is to prevent Cd uptake by plant roots
[email protected] (X. Wan
o-Environmental Science
(McLaughlin et al., 1999). Over recent years, some researchershave investigated Cd accumulation in the biological environ-ment and the corresponding toxicity in terrestrial biology andrelated factors. According to a study by Slaveykova et al. (2009)concerning Cd toxicity to the soil bacterium Sinorhizobiummeliloti in model soil solutions, the Cd uptake by S. melilotiwasinfluenced by Cd speciation (free Cd2+ activity) and anioncompetition. Similar results were found in studies on rice(Oryza sativa L.) (Kim et al., 2002), durum wheat (Triticumturgidum) (Berkelaar and Hale, 2003), maize (Zea mays)(Sterckeman et al., 2015), and a bacterium (Vibrio fischeri) (Anet al., 2012). Therefore, predictive models are required for riskassessment of Cd to estimate and evaluate the speciation andphytotoxicity of Cd under different environmental conditions.
g).
s, Chinese Academy of Sciences. Published by Elsevier B.V.

113J O U R N A L O F E N V I R O N M E N T A L S C I E N C E S 4 2 ( 2 0 1 6 ) 1 1 2 – 1 1 8
Recently, a biotic ligandmodel (BLM) was proposed as a toolto quantitatively evaluate how the speciation and biologicalavailability of metals in aquatic systems is affected by waterchemistry (Di Toro et al., 2001). This has attracted increasingattention for the prediction of metal toxicity in terrestrialsystems (Antunes et al., 2006; Thakali et al., 2006a,b). In mostBLMs developed for metals, major cations are considered assimple competitors for metal binding to uptake sites and mayoffer some protective effects against potential metal-inducedtoxicity. Nevertheless, the influence of essential trace elementson metal uptake and toxicity is considered negligible. Hill andMatrone (1970) initially suggested that essential biologicalinteractions can occur among bio-elements and toxic metalswith similar physical and chemical properties. Cd has much incommon with the bio-element zinc (Zn), with both metalsclassified in group II B of the post-transition elements of theperiodic table. For instance, Cd is commonly found in Zn ores,which are therefore the principal commercial sources of Cd.Numerous experimental results and data show that Znplays animportant role in prevention of Cd toxicity (Kölelia et al., 2004;Rogalska et al., 2011; Li et al., 2014). Therefore, it is important toincorporate the effect of Zn into a Cd-BLM.
The present study therefore aimed to investigate the effectsof Zn on Cd toxicity to barley root elongation. Furthermore, theeffects of other cations, i.e., calcium (Ca2+), magnesium (Mg2+),protons (H+) and potassium (K+), on Cd toxicity to barley rootelongationwere also evaluated across awide range of ion levelsto obtain the conditional binding constants for Cd2+ as well asother cations with biotic ligands (BLs). Finally, a BLM to predictCd toxicity to barley was established for a broad range ofsolution characteristics.
1. Materials and methods
1.1. Experimental setup
To determine the independent effects of different cations onCdtoxicity, the concentrations of the target cation were variedduring each one-set experiment, while the concentrations of allother cations were kept low and constant (Lock et al., 2007a).Five sets of Cd toxicity tests with different target cations wereinvestigated, Ca, Mg, K, pH and Zn-sets (Table 1). Each setconsisted of a series of media in which only the activity of thetarget cations varied. Therewere sixCd concentrations plus one
Table 1 – Composition of the test media used in various bielongation. EC50{Cd2+} is the free Cd2+ that results in 50% RE.
Bioassayset
Varied concentrations andpH values
Charabackgrou
Ca 0.2, 1.0, 2.0, 4.0, 7.5, 15.0 mmol/L 0.05 mmol/L Mg0.08 mmol/L K,
Mg 0.05, 0.2, 0.5, 1.0, 2.0, 4.0 mmol/L 0.2 mmol/L Ca,0.08 mmol/L K,
K 0.1, 1.0, 3.0, 5.0, 7.5, 10.0 mmol/L 0.2 mmol/L Ca,2.5 mmol/L Na,
Zn 0.1, 1.0, 2.5, 5.0 μmol/L 0.2 mmol/L Ca,0.08 mmol/L K,
pH 5.0, 5.5, 6.0, 6.5, 7.0, 7.3, 7.7, 8.0 0.2 mmol/L Ca,2.5 mmol/L Na,
treatment without Cd supplementation as a control for allseries. The test concentrations of Cd in solution were in therange of 0–0.2 mmol/L. The selected cation concentrations ofCa2+, Mg2+, K+ and H+ were based on the ranges that occur innatural pore waters (Oorts et al., 2006). The concentrations ofZn2+ ranging from 0 to no observed effect concentrations wereselected according to the data of Wang et al. (2010).
1.2. Preparation of the test media
Chemicals of analytical reagent or higher grade were used inall tests. Deionized water was used throughout the experi-ments. Test solution cultures were prepared by addingdifferent volumes of stock solutions of CaCl2, MgSO4, ZnSO4,NaCl and KCl into deionized water. The solutions werebuffered with 1 mmol/L MES (2-[N-morpholino] ethane sul-fonic acid) for pH < 7.0 treatments and with 3.6 mmol/L MOPS(3-[N-morpholino] propane sulfonic acid) for pH ≥ 7.0 treat-ments sinceMES andMOPS do not form complexeswith heavymetals (De Schamphelaere et al., 2004). The pH was thenadjusted to the desired level with 1 mol/L NaOH or 1 mol/L HClsolution. Except for the pH-sets, the pH values in the mediawere always adjusted using MES. The test medium preparedfor each bioassay was then used to set up a Cd concentrationseries by adding different amounts of CdCl2 solution. The pHvalues of the nutrient solutions were tested before and afterthe bioassay using a pH meter (Delta 320, Mettler, Zurich,Switzerland). To reach near-equilibrium conditions, all mediawere prepared and stored in the test pots at 20°C for 1 daybefore the start of the bioassay. The chemical characteristicsof different test solution cultures are summarized in Table 1.
1.3. Toxicity assays
The barley root elongation test was performed according to ISO11269-1 (ISO, 1993). Barley seeds (Hordeum. vulgare cv. PingguNo. 1) were surface-sterilized in 2% NaClO for 30 min, afterwhich they were thoroughly rinsed with deionized water andgerminated on filter paper, which was moistened in advancewith deionized water, for 36 hr at 20°C in darkness. After theradicle emerged (<2 mm in length), six seeds were transferredto a nylon net fixed on the surface of plastic culture pots thatcontained 350 mL of the prepared test solution. The testsolution was changed every 24 hr to maintain the correctcomposition. The culture pots were placed randomly in the
oassay sets and the observed EC50{Cd2+} for barley root
cteristics ofnd solutions
Observed series of EC50{Cd2+}
, 2.5 mmol/L Na,pH 6.0
1.89, 4.33, 6.39, 9.56, 10.71, 12.46 μmol/L
2.5 mmol/L Na,pH 6.0
2.26, 2.40, 3.23, 3.65, 4.43, 5.34 μmol/L
0.05 mmol/L Mg,pH 6.0
2.83, 1.99, 1.71, 2.03, 3.04, 2.10 μmol/L
0.05 mmol/L Mg,2.5 mmol/L Na, pH 6.0
2.31, 2.35, 2.41, 3.63, 4.33 μmol/L
0.05 mmol/L Mg,0.08 mmol/L K
3.77, 2.34, 2.01, 2.06, 2.08, 2.44, 1.44,1.54 μmol/L
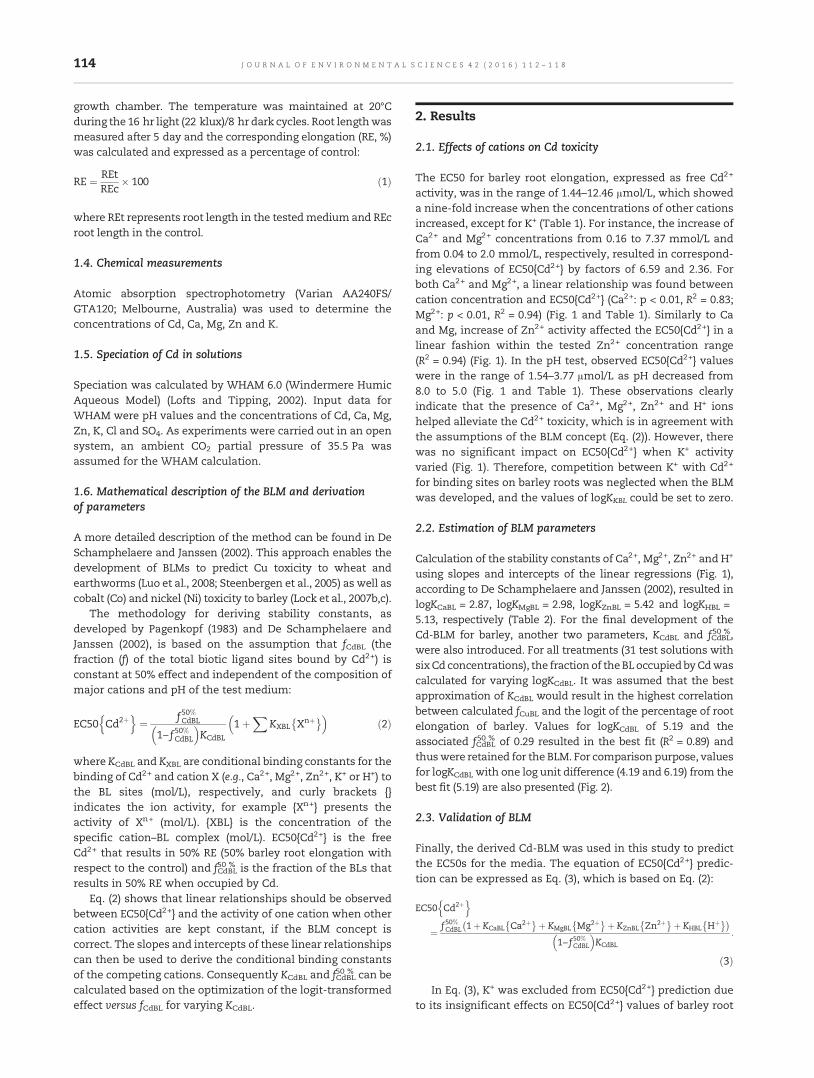
114 J O U R N A L O F E N V I R O N M E N T A L S C I E N C E S 4 2 ( 2 0 1 6 ) 1 1 2 – 1 1 8
growth chamber. The temperature was maintained at 20°Cduring the 16 hr light (22 klux)/8 hr dark cycles. Root lengthwasmeasured after 5 day and the corresponding elongation (RE, %)was calculated and expressed as a percentage of control:
RE ¼ REtREc
� 100 ð1Þ
where REt represents root length in the testedmedium and REcroot length in the control.
1.4. Chemical measurements
Atomic absorption spectrophotometry (Varian AA240FS/GTA120; Melbourne, Australia) was used to determine theconcentrations of Cd, Ca, Mg, Zn and K.
1.5. Speciation of Cd in solutions
Speciation was calculated by WHAM 6.0 (Windermere HumicAqueous Model) (Lofts and Tipping, 2002). Input data forWHAM were pH values and the concentrations of Cd, Ca, Mg,Zn, K, Cl and SO4. As experiments were carried out in an opensystem, an ambient CO2 partial pressure of 35.5 Pa wasassumed for the WHAM calculation.
1.6. Mathematical description of the BLM and derivationof parameters
A more detailed description of the method can be found in DeSchamphelaere and Janssen (2002). This approach enables thedevelopment of BLMs to predict Cu toxicity to wheat andearthworms (Luo et al., 2008; Steenbergen et al., 2005) as well ascobalt (Co) and nickel (Ni) toxicity to barley (Lock et al., 2007b,c).
The methodology for deriving stability constants, asdeveloped by Pagenkopf (1983) and De Schamphelaere andJanssen (2002), is based on the assumption that fCdBL (thefraction (f) of the total biotic ligand sites bound by Cd2+) isconstant at 50% effect and independent of the composition ofmajor cations and pH of the test medium:
EC50 Cd2þn o
¼ f 50%CdBL
1− f 50%CdBL
� �KCdBL
1þX
KXBL Xnþ� �� �ð2Þ
where KCdBL and KXBL are conditional binding constants for thebinding of Cd2+ and cation X (e.g., Ca2+, Mg2+, Zn2+, K+ or H+) tothe BL sites (mol/L), respectively, and curly brackets {}indicates the ion activity, for example {Xn+} presents theactivity of Xn+ (mol/L). {XBL} is the concentration of thespecific cation–BL complex (mol/L). EC50{Cd2+} is the freeCd2+ that results in 50% RE (50% barley root elongation withrespect to the control) and fCdBL50 % is the fraction of the BLs thatresults in 50% RE when occupied by Cd.
Eq. (2) shows that linear relationships should be observedbetween EC50{Cd2+} and the activity of one cation when othercation activities are kept constant, if the BLM concept iscorrect. The slopes and intercepts of these linear relationshipscan then be used to derive the conditional binding constantsof the competing cations. Consequently KCdBL and fCdBL50 % can becalculated based on the optimization of the logit-transformedeffect versus fCdBL for varying KCdBL.
2. Results
2.1. Effects of cations on Cd toxicity
The EC50 for barley root elongation, expressed as free Cd2+
activity, was in the range of 1.44–12.46 μmol/L, which showeda nine-fold increase when the concentrations of other cationsincreased, except for K+ (Table 1). For instance, the increase ofCa2+ and Mg2+ concentrations from 0.16 to 7.37 mmol/L andfrom 0.04 to 2.0 mmol/L, respectively, resulted in correspond-ing elevations of EC50{Cd2+} by factors of 6.59 and 2.36. Forboth Ca2+ and Mg2+, a linear relationship was found betweencation concentration and EC50{Cd2+} (Ca2+: p < 0.01, R2 = 0.83;Mg2+: p < 0.01, R2 = 0.94) (Fig. 1 and Table 1). Similarly to Caand Mg, increase of Zn2+ activity affected the EC50{Cd2+} in alinear fashion within the tested Zn2+ concentration range(R2 = 0.94) (Fig. 1). In the pH test, observed EC50{Cd2+} valueswere in the range of 1.54–3.77 μmol/L as pH decreased from8.0 to 5.0 (Fig. 1 and Table 1). These observations clearlyindicate that the presence of Ca2+, Mg2+, Zn2+ and H+ ionshelped alleviate the Cd2+ toxicity, which is in agreement withthe assumptions of the BLM concept (Eq. (2)). However, therewas no significant impact on EC50{Cd2+} when K+ activityvaried (Fig. 1). Therefore, competition between K+ with Cd2+
for binding sites on barley roots was neglected when the BLMwas developed, and the values of logKKBL could be set to zero.
2.2. Estimation of BLM parameters
Calculation of the stability constants of Ca2+, Mg2+, Zn2+ and H+
using slopes and intercepts of the linear regressions (Fig. 1),according to De Schamphelaere and Janssen (2002), resulted inlogKCaBL = 2.87, logKMgBL = 2.98, logKZnBL = 5.42 and logKHBL =5.13, respectively (Table 2). For the final development of theCd-BLM for barley, another two parameters, KCdBL and fCdBL50 %,were also introduced. For all treatments (31 test solutions withsixCd concentrations), the fraction of theBLoccupiedbyCdwascalculated for varying logKCdBL. It was assumed that the bestapproximation of KCdBL would result in the highest correlationbetween calculated fCuBL and the logit of the percentage of rootelongation of barley. Values for logKCdBL of 5.19 and theassociated fCdBL50 % of 0.29 resulted in the best fit (R2 = 0.89) andthuswere retained for the BLM. For comparison purpose, valuesfor logKCdBL with one log unit difference (4.19 and 6.19) from thebest fit (5.19) are also presented (Fig. 2).
2.3. Validation of BLM
Finally, the derived Cd-BLM was used in this study to predictthe EC50s for the media. The equation of EC50{Cd2+} predic-tion can be expressed as Eq. (3), which is based on Eq. (2):
EC50 Cd2þn o
¼ f 50%CdBL 1þ KCaBL Ca2þ� �þ KMgBL Mg2þ� �þ KZnBL Zn2þ� �þ KHBL Hþ� �� �
1− f 50%CdBL
� �KCdBL
:
ð3Þ
In Eq. (3), K+ was excluded from EC50{Cd2+} prediction dueto its insignificant effects on EC50{Cd2+} values of barley root
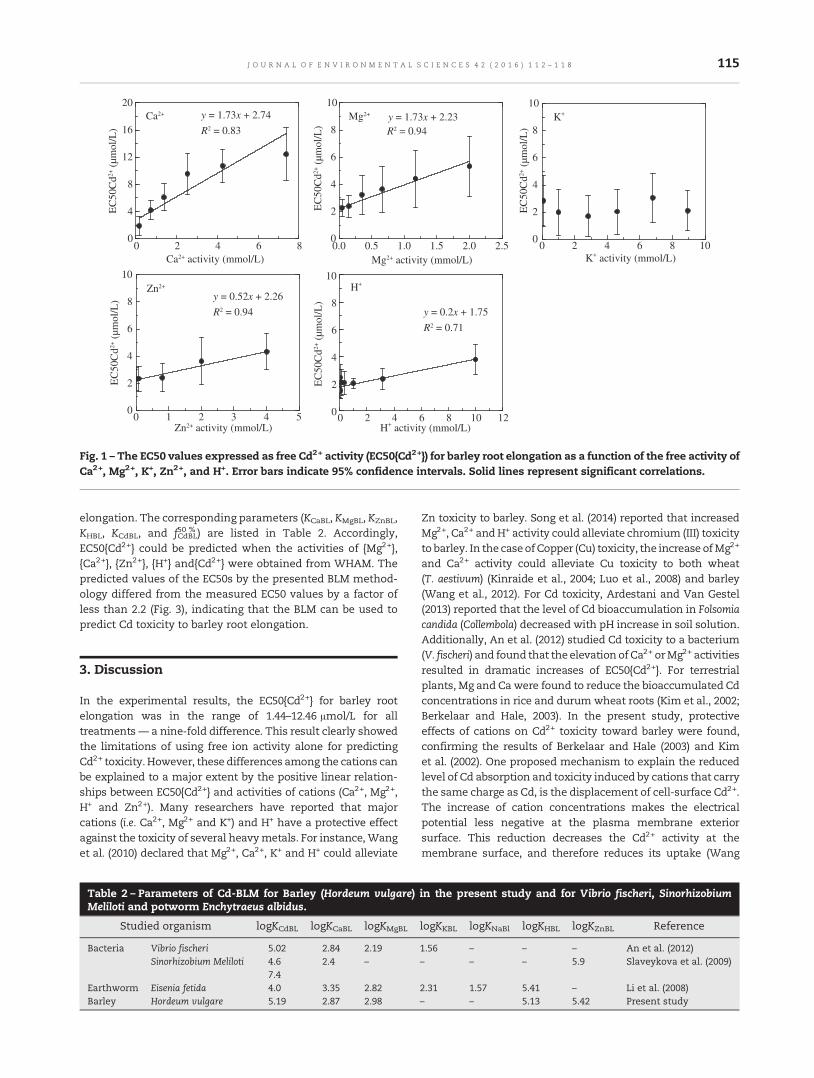
0 2 4 6 8 10 120
2
4
6
8
10H+
0 2 4 6 80
4
8
12
16
20y = 1.73x + 2.74
R2 = 0.83
y = 0.52x + 2.26
R2 = 0.94 y = 0.2x + 1.75
R2 = 0.71
R2 = 0.94
Ca2+E
C50
Cd2+
(µm
ol/L
)E
C50
Cd2+
(µm
ol/L
)
EC
50C
d2+ (
µmol
/L)
EC
50C
d2+ (
µmol
/L)
EC
50C
d2+ (
µmol
/L)
Ca2+ activity (mmol/L)
Zn2+ activity (mmol/L)
Mg2+ activity (mmol/L) K+ activity (mmol/L)
H+ activity (mmol/L)
Mg2+
0.0 0.5 1.0 1.5 2.0 2.50
2
4
6
8
10y = 1.73x + 2.23
0 2 4 6 8 100
2
4
6
8
10
Zn2+
K+
0 1 2 3 4 50
2
4
6
8
10
Fig. 1 – The EC50 values expressed as free Cd2+ activity (EC50{Cd2+}) for barley root elongation as a function of the free activity ofCa2+, Mg2+, K+, Zn2+, and H+. Error bars indicate 95% confidence intervals. Solid lines represent significant correlations.
115J O U R N A L O F E N V I R O N M E N T A L S C I E N C E S 4 2 ( 2 0 1 6 ) 1 1 2 – 1 1 8
elongation. The corresponding parameters (KCaBL, KMgBL, KZnBL,KHBL, KCdBL, and fCdBL50 % ) are listed in Table 2. Accordingly,EC50{Cd2+} could be predicted when the activities of {Mg2+},{Ca2+}, {Zn2+}, {H+} and{Cd2+} were obtained from WHAM. Thepredicted values of the EC50s by the presented BLM method-ology differed from the measured EC50 values by a factor ofless than 2.2 (Fig. 3), indicating that the BLM can be used topredict Cd toxicity to barley root elongation.
3. Discussion
In the experimental results, the EC50{Cd2+} for barley rootelongation was in the range of 1.44–12.46 μmol/L for alltreatments— a nine-fold difference. This result clearly showedthe limitations of using free ion activity alone for predictingCd2+ toxicity. However, these differences among the cations canbe explained to a major extent by the positive linear relation-ships between EC50{Cd2+} and activities of cations (Ca2+, Mg2+,H+ and Zn2+). Many researchers have reported that majorcations (i.e. Ca2+, Mg2+ and K+) and H+ have a protective effectagainst the toxicity of several heavymetals. For instance,Wanget al. (2010) declared that Mg2+, Ca2+, K+ and H+ could alleviate
Table 2 – Parameters of Cd-BLM for Barley (Hordeum vulgare)Meliloti and potworm Enchytraeus albidus.
Studied organism logKCdBL logKCaBL logKMgBL
Bacteria Vibrio fischeri 5.02 2.84 2.19Sinorhizobium Meliloti 4.6 2.4 –
7.4Earthworm Eisenia fetida 4.0 3.35 2.82Barley Hordeum vulgare 5.19 2.87 2.98
Zn toxicity to barley. Song et al. (2014) reported that increasedMg2+, Ca2+ andH+ activity could alleviate chromium (III) toxicityto barley. In the case of Copper (Cu) toxicity, the increase ofMg2+
and Ca2+ activity could alleviate Cu toxicity to both wheat(T. aestivum) (Kinraide et al., 2004; Luo et al., 2008) and barley(Wang et al., 2012). For Cd toxicity, Ardestani and Van Gestel(2013) reported that the level of Cd bioaccumulation in Folsomiacandida (Collembola) decreased with pH increase in soil solution.Additionally, An et al. (2012) studied Cd toxicity to a bacterium(V. fischeri) and found that the elevation of Ca2+ orMg2+ activitiesresulted in dramatic increases of EC50{Cd2+}. For terrestrialplants, Mg and Ca were found to reduce the bioaccumulated Cdconcentrations in rice and durum wheat roots (Kim et al., 2002;Berkelaar and Hale, 2003). In the present study, protectiveeffects of cations on Cd2+ toxicity toward barley were found,confirming the results of Berkelaar and Hale (2003) and Kimet al. (2002). One proposed mechanism to explain the reducedlevel of Cd absorption and toxicity induced by cations that carrythe same charge as Cd, is the displacement of cell-surface Cd2+.The increase of cation concentrations makes the electricalpotential less negative at the plasma membrane exteriorsurface. This reduction decreases the Cd2+ activity at themembrane surface, and therefore reduces its uptake (Wang
in the present study and for Vibrio fischeri, Sinorhizobium
logKKBL logKNaBl logKHBL logKZnBL Reference
1.56 – – – An et al. (2012)– – – 5.9 Slaveykova et al. (2009)
2.31 1.57 5.41 – Li et al. (2008)– – 5.13 5.42 Present study

0.0 0.2 0.4 0.6 0.8 1.0-6
-4
-2
0
2
4
6
R2 = 0.78
R2 = 0.90
R2 = 0.79
logi
t (R
E)
fCdBL
Fig. 2 – Relationship between the logit of the observed percentroot growth of Hordeum vulgare after 5 days of exposure andthe calculated fraction of the biotic ligand sites occupied by Cd(fCdBL) for logKCdBL of 4.19, 5.19 and 6.19, respectively.logit(RE) = ln(RE / (100 − RE)), RE: root elongation.
116 J O U R N A L O F E N V I R O N M E N T A L S C I E N C E S 4 2 ( 2 0 1 6 ) 1 1 2 – 1 1 8
et al., 2011). Another possiblemechanism is that several cationswith similar ionic radii to Cd2+ may compete with Cd2+ foruptake. For instance, the crystal ionic radii of the cations Cd2+,Ca2+, Mg2+ and Zn2+ are 0.97, 0.99, 0.77 and 0.72 Ǻ, respectively.Although effects of sodium (Na) on Cu toxicity were observedfor both Daphnia magna (De Schamphelaere and Janssen, 2002)and fatheadminnow (Erickson et al., 1996) in aquatic ecosystems,Na+ activity has minor effects on toxicities of most metals to
10 10 10100
101
102
Mg
pH
Ca
Zn
K
Pred
icte
d E
C50
{C
d2+}
(µm
ol/L
)
Measured EC50{Cd2+} (µmol/L)
Fig. 3 – Relationship between the measured and predictedvalues of the EC50{Cd2+} based on the BLM developed in thepresent study. The solid line indicates a perfect matchbetween measured and predicted values of the EC50{Cd2+},and the dashed lines indicate the range of the difference, by afactor of 2.2, between the observed and predicted values ofthe EC50{Cd2+}. Cadmium: Cd; BLM: biotic ligand model.
terrestrial plants (Lock et al., 2007a,b,c; Wang et al., 2010; Luoet al., 2008). However, since K+ activity did not affect the EC50 forbarley exposed to Ni2+ (Li et al., 2009) and Cu2+ (Lock et al.,2007a), itwas assumed that K+would not affectmetal toxicity inthe development of most other BLMs. In the present study, Na+
and K+ did not affect Cd2+ toxicity to barley root elongation.The conditional binding constants derived in this study for
barley root elongation (5-d EC50) of H. vulgare were thuscompared with those reported for bioluminescence inhibitionof a bioluminescent bacterium (V. fischeri) (An et al., 2012), formortality of potworms (E. fetida) (Li et al., 2008), and for Cduptake by a soil bacterium (S. meliloti) (Slaveykova et al., 2009)(Table 2). The value of log KCdBL (5.19) obtained in the presentstudy was higher than that reported by Li et al. (2008) insimulated soil solution (log KCdBL = 4.0), but was similar to thatreported byAnet al. (2012) in culture solutions (logKCdBL = 5.02).Slaveykova et al. (2009) studied the effects of different majorand trace elements onCduptake by the soil bacterium S.meliloti.The results demonstrated that there were two Cd uptake siteswith conditional binding constants of log KCdBL,1 = 7.4 and logKCdBL,2 = 4.6 for S.meliloti. Thus the value of log KCdBL (5.19) in thepresent study was between these two values. The bindingconstants logKCaBL (2.87) and logKMgBL (2.98) in the presentstudy were also similar to results reported by Slaveykova et al.(2009) (logKCaBL = 2.84, logKMgBL = 2.19) and by Luo et al. (2008)(logKCaBL = 3.35, logKMgBL = 2.82). Many researchers have dem-onstrated that both Cd and Zn have a high affinity to biologicalstructures compared to other major cations such as Ca and Mg.Moreover, the affinity of Cd should be greater than that of Zn.However, contradictory results were observed in the presentstudy, and the affinity of Zn2+ to the BL (logKZnBL = 5.42) wasslightly higher than that of Cd2+ (logKCdBL = 5.19). Slaveykovaet al. (2009) found that the value of logKZnBL was about 5.9,whichwas similar to the result in the present study. Differencesin binding constants may, for example, result from differentexposure durations, endpoints, target tissues or BLs, or mech-anisms of Cd uptake and/or toxicity (Lock et al., 2006). Inaddition, thenature anddynamicproperties of theBLneed tobetaken into consideration, as the BL (biological membrane) is animportant part of a living organism that is very likely to changein response to environmental disturbances such as ionicstrength and pH. Therefore further research on Cd is necessaryto determine and explain both the differences and similaritiesacross organisms, endpoints and exposure durations.
By using the BLM developed in this study, the EC50s could bepredicted relatively accurately within a difference factor of 2.2,which indicates the possibility of using it to predict metaltoxicity to terrestrial plants. Generally speaking, Cd contami-nation is of concern because it tends to accumulatewithin planttissues to levels that are toxic to animals (including humans)but not to the plant (Dudka and Miller, 1999). Therefore it isimportant to study the role of plants in Cd-contaminatedsystems and their subsequent impacts on the health of animals(including humans). In addition, this study was based only onnutrient solutions, and did not include other factors, such asmetal solid–liquid distribution, microbial activity and rootexudates, which can also accumulate in the rhizosphere andaffect Cd toxicity to plants (Antunes et al., 2006). Consequently,the potential applications of the presented methodology andresults are limited to soil solutions. Thus, further research is

117J O U R N A L O F E N V I R O N M E N T A L S C I E N C E S 4 2 ( 2 0 1 6 ) 1 1 2 – 1 1 8
required to refine such a semi-mechanistic model for applica-tion in soil environments.
4. Conclusions
In this study, a BLMwas developed for predicting the toxicity ofCd to barley (H. vulgare) in nutrient solutions. It was firstdemonstrated that Cd2+ was a toxic species and that itscompetition with Mg2+ Ca2+, Zn2+ and H+ for binding sites ofthe BL should be incorporated into the BLM. Accordingly theBLM parameters were derived and validated and the developedBLM demonstrated good performance in predicting acute Cdtoxicity toward barley root elongation. The difference betweenthe predicted and measured toxicities was by a factor of lessthan 2.2. The BLM, therefore, may be a promising tool forimproving the ecological relevancy of risk assessment proce-dures for divalent metals in water and soil environments.However, further research on the refinement of such a tool isnecessary for potential applications on various natural/fieldsoils with broad ranges of properties, before BLMs can be usedfor risk assessment of metal-contaminated soils in the field.
Acknowledgments
The work was financially supported by the Natural ScienceFoundation of China (No. 21007042) and Beijing NaturalScience Foundation (No. 8122014).
R E F E R E N C E S
An, J., Jeong, S., Moon, H.S., Jho, E.H., Nam, K., 2012. Prediction ofCd and Pb toxicity to Vibrio fischeri using biotic ligand-basedmodels in soil. J. Hazard. Mater. 203–204, 69–76.
Antunes, P.M.C., Berkelaar, E.J., Boyle, D., Hale, B.A., Hendershot,W., Voigt, A., 2006. The biotic ligand model for plants andmetals: technical challenges for field application. Environ.Toxicol. Chem. 25 (3), 875–882.
Ardestani, M.M., Van Gestel, C.A.M., 2013. Using a toxicokineticsapproach to explain the effect of soil pH on cadmiumbioavailability to Folsomia candida. Environ. Pollut. 180, 122–130.
Berkelaar, E., Hale, B.A., 2003. Accumulation of cadmium by durumwheat roots: bases for citrate-mediated exceptionsto the free ion model. Environ. Toxicol. Chem. 22 (5), 1155–1161.
Carpenè, E., Andreani, G., Monari, M., Castellani, G., Isani, G., 2006.Distribution of Cd, Zn, Cu and Fe among selected tissues of theearthworm (Allolobophora caliginosa) and Eurasian woodcock(Scolopax rusticola). Sci. Total Environ. 363 (1-3), 126–135.
De Schamphelaere, K.A.C., Janssen, C.R., 2002. A biotic ligandmodel predicting copper toxicity for Daphnia magna: the effectsof calcium magnesium sodium potassium and pH. Environ.Sci. Technol. 36 (1), 48–54.
De Schamphelaere, K.A.C., Heijerick, D.G., Janssen, C.R., 2004.Comparison of the effect of different ph buffering techniqueson the toxicity of copper and zinc to Daphnia magna andPseudokirchneriella subcapitata. Ecotoxicology 13 (7), 697–705.
Di Toro, D.M., Allen, H.E., Bergman, H.L., Meyer, J.S., Paquin, P.R.,Santore, R.C., 2001. Biotic ligand model of the acute toxicity ofmetals. 1. Technical basis. Environ. Toxicol. Chem. 20 (10),2383–2396.
Dudka, S., Miller, W.P., 1999. Accumulation of potentially toxicelements in plants and their transfer to human food chain.J. Environ. Sci. Health B Pestic. Food Contam. Agric. Wastes34 (4), 681–708.
Erickson, R.J., Benoit, D.A., Mattson, V.R., Nelson Jr., H.P., Leonard,E.N., 1996. The effects ofwater chemistry on the toxicity of copperto fatheadminnows. Environ. Toxicol. Chem. 15 (2), 181–193.
Hill, C.H., Matrone, G., 1970. Chemical parameters in the study ofin vivo and in vitro interaction of transition elements. Fed. Proc.29 (4), 1474–1481.
International Organization for Standardization (ISO), 1993. Soilquality - Determination of the effects of pollutants on soilflora—Part 1: Method for themeasurement of inhibition of rootgrowth. ISO 11269-1, Geneva, Switzerland.
Kim, Y.Y., Yang, Y.Y., Lee, Y., 2002. Pb and Cd uptake in rice roots.Physiol. Plant. 116 (3), 368–372.
Kinraide, T.B., Pedler, J.F., Parker, D.R., 2004. Relative effectivenessof calcium andmagnesium in the alleviation of rhizotoxicity inwheat induced by copper, zinc, aluminum, sodium, and lowpH. Plant Soil 259 (1-2), 201–208.
Kölelia, N., Ekerb, S., Cakmakc, I., 2004. Effect of zinc fertilizationon cadmium toxicity in durum and bread wheat grown inzinc-deficient soil. Environ. Pollut. 131 (3), 453–459.
Li, L.Z., Zhou, D.M., Luo, X.S., Wang, P., Wang, Q.Y., 2008. Effect ofmajor cations and pH on the acute toxicity of cadmium to theearthworm Eisenia fetida: implications for the biotic ligandmodel approach. Arch. Environ. Contam. Toxicol. 55 (1), 70–77.
Li, B., Zhang, X., Wang, X.D., Ma, Y.B., 2009. Refining a biotic ligandmodel for nickel toxicity to barley root elongation in solutionculture. Ecotoxicol. Environ. Saf. 72 (6), 1760–1766.
Li, B., Yang, J.X., Wei, D.P., Chen, S.B., Li, J., Ma, Y.B., 2014. Fieldevidence of cadmium phytoavailability decreased effectivelyby rape straw and/or red mud with zinc sulphate in aCd-contaminated calcareous soil. PLoS One 9 (10), e109967.
Liu, Y.G., Wang, X., Zeng, G.M., Qu, D., Gu, J.J., Zhou, M., et al., 2007.Cadmium-induced oxidative stress and response of theascorbate-glutathione cycle in Bechmeria nivea (L.) Gaud.Chemosphere 69 (1), 99–107.
Lock, K., De Schamphelaere, K.A.C., Because, S., Criel, P., VanEeckhout, H., Janssen, C.R., 2006. Development and validationof an acute biotic ligand model (BLM) predicting cobalt toxicityin soil to the potworm Enchytraeus albidus. Soil Biol. Biochem.38 (7), 1924–1932.
Lock, K., Criel, P., De Schamphelaere, K.A.C., Van Eeckhout, H.,Janssen, C.R., 2007a. Influence of calcium, magnesium,sodium, potassium and pH on copper toxicity to barley(Hordeum vulgare). Ecotoxicol. Environ. Saf. 68 (2), 299–304.
Lock, K., De Schamphelaere, K.A.C., Because, S., Criel, P.,Van-Eeckhout, H., Janssen, C.R., 2007b. Development andvalidation of a terrestrial biotic ligand model predicting theeffect of cobalt on root growth of barley (Hordeum vulgare).Environ. Pollut. 147 (3), 626–633.
Lock, K., Van Eeckhout, H., De Schamphelaere, K.A.C., Criel, P.,Janssen, C.R., 2007c. Development of a biotic ligand model(BLM) predicting nickel toxicity to barley (Hordeum vulgare).Chemosphere 66 (7), 1346–1352.
Lofts, S., Tipping, E., 2002. Windermere Humic AqueousModel-Equilibrium Chemical Speciation for Natural Waters,Ver 6.0.8. Centre for Ecology and Hydrology, CEH Windermere,Ferry House, Far Sawrey, Ambleside, Cumbria, UK.
Luo, X.S., Li, L.Z., Zhou, D.M., 2008. Effect of cations on coppertoxicity to wheat root: implications for the biotic ligand model.Chemosphere 73 (3), 401–406.
McLaughlin, M.G., Parker, D.R., Clarke, J.M., 1999. Metals andmicronutrients-food safety issues. Field Crop Res. 60 (1-2),143–163.
Oorts, K., Ghesquiere, U., Swinnen, K., Smolders, E., 2006. Soilproperties affecting the toxicity of CuCl2 and NiCl2 for soil

118 J O U R N A L O F E N V I R O N M E N T A L S C I E N C E S 4 2 ( 2 0 1 6 ) 1 1 2 – 1 1 8
microbial processes in freshly spiked soils. Environ. Toxicol.Chem. 25 (3), 836–844.
Pagenkopf, G.K., 1983. Gill surface interaction model fortrace-metal toxicity to fishes: role of complexation, pH andwater hardness. Environ. Sci. Technol. 17 (6), 342–347.
Rogalska, J., Pilat-Marcinkiewicz, B., Brzóska, M.M., 2011.Protective effect of zinc against cadmium hepatotoxicitydepends on this bioelement intake and level of cadmiumexposure: a study in a rat model. Chem. Biol. Interact. 193 (3),191–203.
Slaveykova, V.I., Dedieu, K., Parthasarathy, N., Hajdu, R., 2009.Effect of competing ions and complexing organic substanceson the cadmium uptake by the soil bacterium Sinorhizobiummeliloti. Environ. Toxicol. Chem. 28 (4), 741–748.
Song, N.N., Zhong, X., Li, B., Li, J.M., Wei, D.P., Ma, Y.B., 2014.Development of a multi-species biotic ligand model predictingthe toxicity of trivalent chromium to barley root elongation insolution culture. PLoS One 9 (8), e105174.
Steenbergen, N.T.T.M., Iaccino, F., De Winkel, M., Reijnders, L.,Peijnenburg, W.J.G.M., 2005. Development of a biotic ligandmodel and a regression model predicting acute copper toxicityto the earthworm Aporrectodea caliginosa. Environ. Sci. Technol.39 (15), 5694–5702.
Sterckeman, T., Redjala, T., Morel, J.L., 2015. Influence of exposuresolution composition and of plant cadmium content on rootcadmium short-term uptake. Environ. Exp. Bot. 74, 131–139.
Thakali, S., Allen, H.E., Di Toro, D.M., Ponizovsky, A.A., Rooney, C.P.,Zhao, F.J., et al., 2006a. A terrestrial biotic ligand model. 1.Development and application to Cu andNi toxicity to barley rootelongation in soils. Environ. Sci. Technol. 40 (22), 7085–7093.
Thakali, S., Allen, H.E., Di Toro, D.M., Ponizovsky, A.A., Rooney,C.P., Zhao, F.J., et al., 2006b. A terrestrial biotic ligand modelterrestrial biotic ligand model. 2. Application to Ni and Cutoxicities to plants invertebrates and microbes in soil. Environ.Sci. Technol. 40 (22), 7094–7100.
Wang, X.D., Li, B., Ma, Y.B., Hua, L., 2010. Development of a bioticligand model for acute zinc toxicity to barley root elongation.Ecotoxicol. Environ. Saf. 73 (6), 1272–1278.
Wang, P., Zhou, D.M., Weng, N.Y., Wang, D.J., Peijnenburg,W.J.G.M., 2011. Calcium and magnesium enhance arsenaterhizotoxicity and uptake in Triticum aestivum. Environ. Toxicol.Chem. 30 (7), 1642–1648.
Wang, X.D., Hua, L., Ma, Y.B., 2012. A biotic ligand modelpredicting acute copper toxicity for barley (Hordeum vulgare):Influence of calcium, magnesium, sodium, potassium and pH.Chemosphere 89 (1), 89–95.

J O U R N A L O F E N V I R O N M E N T A L S C I E N C E S 4 2 ( 2 0 1 6 ) 1 1 9 – 1 2 5
Ava i l ab l e on l i ne a t www.sc i enced i r ec t . com
ScienceDirect
www. jou rna l s . e l sev i e r . com/ j es
Nitrogen reduction using bioreactive thin-layer capping (BTC)with biozeolite: A field experiment in a eutrophic river
Zhenming Zhou1,2, Tinglin Huang2,⁎, Baoling Yuan1
1. College of Civil Engineering, Huaqiao University, Xiamen 361021, China. E-mail: [email protected]. School of Environmental and Municipal Engineering, Xi'an University of Architecture & Technology, Xi'an 710055, China
A R T I C L E I N F O
⁎ Corresponding author. E-mail: huangtinglin
http://dx.doi.org/10.1016/j.jes.2015.07.0051001-0742/© 2015 The Research Center for Ec
A B S T R A C T
Article history:Received 6 April 2015Revised 8 July 2015Accepted 9 July 2015Available online 11 September 2015
Bioreactive thin-layer capping (BTC) with biozeolite provides a potential remediation designthat can sustainably treat N contamination from sediment and overlying water in eutrophicwater bodies. Nitrogen (N) reduction using BTC with biozeolite was examined in a fieldincubation experiment in a eutrophic river in Yangzhou, Jiangsu Province, China. Thebiozeolite was zeolite with attached bacteria, including two isolated heterotrophic nitrifiers(Bacillus spp.) and two isolated aerobic denitrifiers (Acinetobacter spp.). The results showedthat the total nitrogen (TN) reduction efficiency of the overlying water by BTC withbiozeolite (with thickness of about 2 mm) reached a maximum (56.69%) at day 34, andsimultaneous heterotrophic nitrification and aerobic denitrification occurred in the BTCsystem until day 34. There was a significant difference in the TN concentrations of theoverlying water between biozeolite capping and control (t-test; p < 0.05). The biozeolite hadvery strong in situ bioregeneration ability. Carbon was the main source of nitrifier growth.However, both dissolved oxygen (DO) and carbon concentrations affected denitrifiergrowth. In particular, DO concentrations greater than 3 mg/L inhibited denitrifier growth.Therefore, BTC with biozeolite was found to be a feasible technique to reduce N in aeutrophic river. However, it is necessary to further strengthen the adaptability of aerobicdenitrifiers through changing domestication methods or conditions.© 2015 The Research Center for Eco-Environmental Sciences, Chinese Academy of Sciences.
Published by Elsevier B.V.
Keywords:Bioreactive thin-layer capping (BTC)Simultaneous nitrification anddenitrification (SND)BiozeoliteEutrophic river
Introduction
Eutrophication is a critical problem that impairs the waterquality of urban water bodies. With the rapid development ofindustrialization and urbanization, eutrophication of urbanwater bodies is increasingly serious in China. Both nitrogen(N) and phosphorus (P) concentrations are the main limitingfactors for the eutrophication of water bodies (Lewis et al.,2011). Sediments play an important role in eutrophication,because they are regarded as a source or sink for N and P inwater bodies (Nilsson and Jansson, 2002; Pan et al., 2012).Therefore, when external sources of N and P are strictly
@xauat.edu.cn (Tinglin H
o-Environmental Science
controlled, the subsequent reduction of N and P released fromsediments will effectively control the eutrophication of waterbodies.
At present, dredging and capping are the main approachesfor decreasing N and P released from sediments and arewidely used (Förstner and Apitz, 2007). However, dredging hasthe following disadvantages: (1) high cost; (2) sedimentresuspension; (3) secondary pollution owing to transport anddisposal of sediment; and (4) destruction of the benthicecological environment. Capping has become a focus ofcurrent research and has developed rapidly from inactive,thick-layer capping (Kim and Jung, 2010) to active/bioreactive
uang).
s, Chinese Academy of Sciences. Published by Elsevier B.V.

120 J O U R N A L O F E N V I R O N M E N T A L S C I E N C E S 4 2 ( 2 0 1 6 ) 1 1 9 – 1 2 5
thin-layer capping (BTC) (Jacobs and Förstner, 1999; Berg et al.,2004; Lin et al., 2011; Özkundakci et al., 2011; Huang et al.,2011, 2012, 2013; Meis et al., 2012; Pan et al., 2012). Activecapping materials used for the reduction of N and P ineutrophic water bodies are as follows: (1) calcite (Berg et al.,2004; Lin et al., 2011); (2) natural zeolite and its modifiedproducts (Jacobs and Förstner, 1999; Lin et al., 2011; Sun et al.,2011; Huang et al., 2011, 2012); and (3) different types ofmodified P inactivation agents (Oliveria et al., 2011; Xiong andPeng, 2011; Mailapalli and Thompson, 2011; Özkundakci et al.,2011; Meis et al., 2012; Pan et al., 2012). However, activecapping materials may have the following issues in theiractual application: (1) inability to be regenerated in situ;(2) declining effectiveness with time; and (3) limited utiliza-tion of active adsorbents.
Zeolite is commonly used as a biological carrier because ofits porous properties (Jung et al., 2004). Nitrifiers attached tobiozeolite can regenerate the zeolite ion exchange capacity forammoniumduring thebiological nitrification period (Lahav andGreen, 1998; Jung et al., 2004). In addition, denitrifiers attachedto biozeolite can remove ammonium via the biological denitri-fication reaction.
Studies on simultaneous nitrification and denitrification(SND), which is an effective methods to convert ammoniumnitrogen (NH4
+-N) to N gas via simultaneous heterotrophicnitrification and aerobic denitrification, have drawn increasedattention in wastewater treatment, because SND has advan-tages over conventionally separated nitrification and denitrifi-cation processes (such as short reaction times, small systems,and low cost) (Du et al., 2003; Nakano et al., 2004; Walters et al.,2009; Chen et al., 2012). Hence, with the advancement ofresearch, increased numbers of heterotrophic nitrification andaerobic denitrification strains have been isolated from differentenvironments and investigated for SND, including Paracoccusspp. (Patureau et al., 2000), Pseudomonas spp. (Kim et al., 2008),Alcaligenes spp. (Zhao et al., 2012), Bacillus spp. (Yang et al., 2011;Zhang et al., 2012), Acinetobacter spp. (Zhao et al., 2010), Delftiaspp. (Wang et al., 2007), Agrobacterium spp. (Chen and Ni, 2012),Comamonas spp. (Chen and Ni, 2011), and Serratia spp. (Sakaiet al., 1996).
Current research on simultaneous heterotrophic nitrifica-tion and aerobic denitrification has primarily focused on Nremoval fromwastewater via laboratory experiments. However,few studies have investigated N reduction in eutrophic waterbodies via simultaneous heterotrophic nitrification and aerobicdenitrification under field conditions.
In order to solve the above problems of the current activecapping materials, BTC with biozeolite (i.e., zeolite with twoisolated heterotrophic nitrifiers and two isolated aerobicdenitrifiers attached) was proposed to reduce N in a eutrophicriver by our group (Huang et al., 2011, 2012, 2013). On onehand, the rate of nitrification was improved by high-efficiencyheterotrophic nitrifiers attached to biozeolite so that the insitu bioregeneration rate of the zeolite ion exchange capacitywas increased. On the other hand, N pollutants [e.g., NH4
+-N,nitrite nitrogen (NO2
−-N), nitrate nitrogen (NO3−-N), and organic
nitrogen (Org-N)] were removed by heterotrophic nitrifiersand aerobic denitrifiers via SND and biological assimilation.Previous research results indicated that BTC not onlycompletely inhibited NH4
+-N release from sediments but also
reduced N from overlying water, sediment-interstitial water,and surface sediments. Moreover, in situ bioregeneration ofthe zeolite ion exchange capacity was feasible (Huang et al.,2011, 2012, 2013).
In the present study, a biozeolite were selected as a cappingmaterial. On the basis of previous research, the feasibility of Nreduction in eutrophicwater bodies using BTCwith biozeolite ata dose rate of 2 kg/m−2 (about 2 mm thickness) was furtherexamined through a field incubation experiment in a eutrophicriver in Yangzhou, Jiangsu Province, China. The in situbioregeneration of the zeolite ion exchange capacity was alsoinvestigated. Changes in nitrifier and denitrifier numberattached to the biozeolite were conducted by plate counting.The mechanisms of BTC N reduction were further analyzed.
1. Material and methods
1.1. Study site
The study site was a eutrophic river in Yangzhou City, named“the Yangzhou Ancient Canal”. The Yangzhou Ancient Canalis the oldest section of the Beijing-Hangzhou Canal, and startsfrom Wantou and enters the Yangtze River at Guazhou. Itslength and basin area are respectively 30 km and 720,000 m2,and the depth of the water is 3–5 m.
Urban sewerage, industries and agriculture are the mainsources of pollution in the Yangzhou Ancient Canal. Its eutro-phication is a serious problem. Despite efforts to restore the riverby reducing external nutrient loading, large cyanobacterialbiomasses of low diversity have appeared every summer. It hasthe following hydraulic characteristics: (1) cargo ships are bannedin the Yangzhou Ancient Canal, and (2) with the exception ofchanging thewater of the canal from theBeijing-HangzhouCanalto improve water quality, the flow velocity of the canal is veryslow at most times.
During our field investigations, the concentrations of TN,NH4
+-N, NO2−-N, NO3
−-N, total phosphorus (TP), and orthophos-phate (PO4
3−-P) of the canal section studied ranged from 2 to19 mg/L, 1 to 7 mg/L, 0 to 0.6 mg/L, 0 to 1.5 mg/L, 0.3 to 2.0 mg/Land 0.05 to 1.95 mg/L respectively (mean 7.32 mg/L, 6.23 mg/L,0.11 mg/L, 0.33 mg/L, 0.79 mg/L, and 0.54 mg/L respectively).
1.2. Experimental materials
1.2.1. Natural zeolitePhysical and chemical properties of the natural zeolite used inthis study were as follows: grain size 1–2 mm, specific surfacearea 42.51 m2/g, porosity 36.55%, average aperture 6.75 nm,bulk density 1.01 g/cm3, true density 2.29 g/cm3, maximumsaturated adsorption capacity of the zeolite toward NH4
+-N13.35 mg NH4
+-N/g zeolite.Its source was a mine in Bayannaoer City, Inner Mongolia
Autonomous Region of China. Its main mineral compositionas determined by X-ray diffraction (XRD) was clinoptilolite,orthoclase and quartz. Its elemental composition determinedby X-ray fluorescence (XRF) was as follows, in mass %: Si =73.98, Al = 8.99, Ca = 5.07, K = 4.68, Fe = 3.11, Na = 2.13, Mg =1.51, and other trace elements (such as Mn, Ti, Zn, Cu, Ni, Co,Sr, Zr, and Rb) added up to 0.53. The Si/Al ratio was 8.23.

121J O U R N A L O F E N V I R O N M E N T A L S C I E N C E S 4 2 ( 2 0 1 6 ) 1 1 9 – 1 2 5
1.2.2. Biofilm formation on zeoliteBiofilm formation on the zeolite was cultivated by a mixedculture containing two isolated heterotrophic nitrifiers(WGX10 and WGX18) and two isolated aerobic denitrifiers(HF3 and HF7) through the method of artificial aeration.WGX10 and WGX18 were identified as Bacillus subtilis andBacillus amyloliquefaciens, respectively, by the Auto-Microbicsystem (AMS) and 16S rRNA gene sequence analysis. HF3 andHF7 were identified as Acinetobacter junii and Acinetobactercalcoaceticus, respectively. The four strains were isolated fromsediments. The origins, physiological and biochemical char-acteristics, and detailed procedures regarding biofilm forma-tion on the zeolite were previously illustrated by Huang et al.(2012).
1.3. Incubation experiments
The incubation experiments were set up in two PVC-Udouble-walled corrugated pipes with a height of 5 m and adiameter of 1 m. With the help of a 40-ton crane, the twopipes were laid on the surface of the sediments lightly, andinserted vertically and slowly into the sediments of theSanwan section of the Yangzhou Ancient Canal, respectively.The thickness of the sediments was about 2.5 m and theheight of the overlying water was about 2 m in the two pipes.A schematic of the experimental set-up is shown in Fig. 1.
The first pipe served as the “control system”, which wasmaintained without any capping material as a reference. The
1000
Overlyingwater
Biozeolitecapping Sediment
Water levelin pipe
Water level in theYangzhou Ancient Canal
Plastic pipe
2500
2000
500
Fig. 1 – Schematic of the experimental set-up. (1) Overlyingwater, (2) biozeolite capping, (3) sediment, (4) water levelin the pipe, (5) water level in the Yangzhou Ancient Canal,(6) plastic pipe.
second pipe served as the “biozeolite capping system”, whichcontained the biozeolite capping layer of 2 mm (i.e., thebiozeolite of dose rate of 2 kg/m2 was spread evenly onto thesediment in the biozeolite capping system).
The incubation experiments were initiated on April 22,2011 and lasted 168 days. During July 10 to July 13, the twopipes were submerged due to heavy rains, and waterexchange occurred between the pipes and the YangzhouAncient Canal, which lead to a halt in investigating thereduction efficiency of TN of the overlying water. However,the water level in the Yangzhou Ancient Canal droppedquickly on July 14, and the incubation experiments werecarried on to analyze the changes in nitrifier and denitrifiernumber and the in situ bioregeneration of the zeolite ionexchange capacity.
To investigate the changes in nitrifier and denitrifiernumber and the in situ bioregeneration of the zeolite ionexchange capacity, twelve small bags with nylon nets havinga pore size of 32 mesh (a diameter of 0.5 mm) were sewn, 5 gbiozeolite was put into each bag, the mouth of each bag wassealed with silk thread, and the twelve bags were tied togetherwith a light rope connected to a float and placed onto thesediment in the biozeolite capping system.
A DO probe and pH probe were placed at 20 mm above thetop of the sediment or capping layer in each pipe to measurewater temperature, DO concentration and pH of overlyingwater once every 2–7 days at a set time. About 500 mL waterwas slowly removed using a microwater pump with adiameter of 8 mm, 10 cm above the top of the sediment orcapping layer in each pipe once every 2–7 days at a set time.Source water from the canal was then added to maintain aconstant water volume. The concentrations of total nitrogen(TN), NH4
+-N, NO2−-N, and NO3
−-N in the water samples wereanalyzed within 2 hr according to the standard method (StateEnvironmental ProtectionAdministration (SEPA) of China, 2002)with a UV-visible spectrophotometer (UV759S, Shanghai Preci-sion & Scientific Instrument Co., Ltd., China). Bags containingbiozeolite were removed carefully at regular intervals, and thenumber of nitrifiers and denitrifiers attached to the biozeolitewas measured by plate counting (Yu et al., 1990). NH4
+-Nadsorption by the biozeolite was analyzed using the followingmethod: the NH4
+-N adsorbed in the biozeolite was extracted bythe simultaneous addition of 0.01 mol/L CaCl2 and 2 mol/L KCl,and the quantities of physically and chemically adsorbedNH4
+-N of the biozeolite were examined, respectively.
1.4. Data analysis
The reduction efficiency of TN of the overlying water wascalculated using Eq. (1).
P ¼ C0−Ci
C0� 100% ð1Þ
where P is the percent reduction efficiency of TN of theoverlying water, and Ci (mg/L) and C0 (mg/L) are the TNconcentrations of the overlying water from the biozeolitecapping system and the control system, respectively.
A t-test was carried out to assess the significance ofdifferences between the biozeolite capping system and thecontrol system. Significance was assumed when p < 0.05.
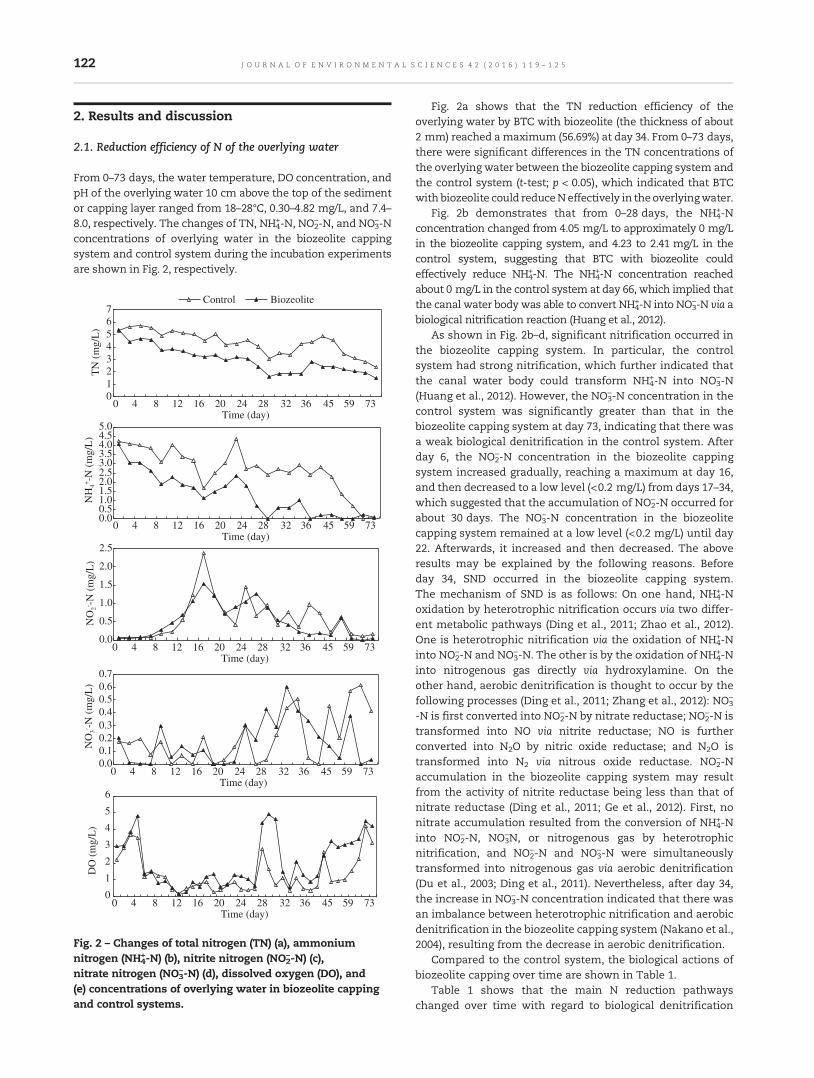
122 J O U R N A L O F E N V I R O N M E N T A L S C I E N C E S 4 2 ( 2 0 1 6 ) 1 1 9 – 1 2 5
2. Results and discussion
2.1. Reduction efficiency of N of the overlying water
From 0–73 days, the water temperature, DO concentration, andpH of the overlying water 10 cm above the top of the sedimentor capping layer ranged from 18–28°C, 0.30–4.82 mg/L, and 7.4–8.0, respectively. The changes of TN, NH4
+-N, NO2−-N, and NO3
−-Nconcentrations of overlying water in the biozeolite cappingsystem and control system during the incubation experimentsare shown in Fig. 2, respectively.
01234567
0 4 8 12 16 20 24 28 32 36 45 59 73Time (day)
0 4 8 12 16 20 24 28 32 36 45 59 73Time (day)
0 4 8 12 16 20 24 28 32 36 45 59 73Time (day)
0 4 8 12 16 20 24 28 32 36 45 59 73Time (day)
0 4 8 12 16 20 24 28 32 36 45 59 73Time (day)
TN
(m
g/L
)
Control Biozeolite
0.00.51.01.52.02.53.03.54.04.55.0
NH
4+-N
(m
g/L
)
0.0
0.5
1.0
1.5
2.0
2.5
NO
2- -N (
mg/
L)
0.00.10.20.30.40.50.60.7
NO
3- -N (
mg/
L)
0
1
2
3
4
5
6
DO
(m
g/L
)
Fig. 2 – Changes of total nitrogen (TN) (a), ammoniumnitrogen (NH4
+-N) (b), nitrite nitrogen (NO2−-N) (c),
nitrate nitrogen (NO3−-N) (d), dissolved oxygen (DO), and
(e) concentrations of overlying water in biozeolite cappingand control systems.
Fig. 2a shows that the TN reduction efficiency of theoverlying water by BTC with biozeolite (the thickness of about2 mm) reached a maximum (56.69%) at day 34. From 0–73 days,there were significant differences in the TN concentrations ofthe overlying water between the biozeolite capping system andthe control system (t-test; p < 0.05), which indicated that BTCwith biozeolite could reduceNeffectively in theoverlyingwater.
Fig. 2b demonstrates that from 0–28 days, the NH4+-N
concentration changed from 4.05 mg/L to approximately 0 mg/Lin the biozeolite capping system, and 4.23 to 2.41 mg/L in thecontrol system, suggesting that BTC with biozeolite couldeffectively reduce NH4
+-N. The NH4+-N concentration reached
about 0 mg/L in the control system at day 66, which implied thatthe canal water body was able to convert NH4
+-N into NO3−-N via a
biological nitrification reaction (Huang et al., 2012).As shown in Fig. 2b–d, significant nitrification occurred in
the biozeolite capping system. In particular, the controlsystem had strong nitrification, which further indicated thatthe canal water body could transform NH4
+-N into NO3−-N
(Huang et al., 2012). However, the NO3−-N concentration in the
control system was significantly greater than that in thebiozeolite capping system at day 73, indicating that there wasa weak biological denitrification in the control system. Afterday 6, the NO2
−-N concentration in the biozeolite cappingsystem increased gradually, reaching a maximum at day 16,and then decreased to a low level (<0.2 mg/L) from days 17–34,which suggested that the accumulation of NO2
−-N occurred forabout 30 days. The NO3
−-N concentration in the biozeolitecapping system remained at a low level (<0.2 mg/L) until day22. Afterwards, it increased and then decreased. The aboveresults may be explained by the following reasons. Beforeday 34, SND occurred in the biozeolite capping system.The mechanism of SND is as follows: On one hand, NH4
+-Noxidation by heterotrophic nitrification occurs via two differ-ent metabolic pathways (Ding et al., 2011; Zhao et al., 2012).One is heterotrophic nitrification via the oxidation of NH4
+-Ninto NO2
−-N and NO3−-N. The other is by the oxidation of NH4
+-Ninto nitrogenous gas directly via hydroxylamine. On theother hand, aerobic denitrification is thought to occur by thefollowing processes (Ding et al., 2011; Zhang et al., 2012): NO3
−
-N is first converted into NO2−-N by nitrate reductase; NO2
−-N istransformed into NO via nitrite reductase; NO is furtherconverted into N2O by nitric oxide reductase; and N2O istransformed into N2 via nitrous oxide reductase. NO2
−-Naccumulation in the biozeolite capping system may resultfrom the activity of nitrite reductase being less than that ofnitrate reductase (Ding et al., 2011; Ge et al., 2012). First, nonitrate accumulation resulted from the conversion of NH4
+-Ninto NO2
−-N, NO3−N, or nitrogenous gas by heterotrophic
nitrification, and NO2−-N and NO3
−-N were simultaneouslytransformed into nitrogenous gas via aerobic denitrification(Du et al., 2003; Ding et al., 2011). Nevertheless, after day 34,the increase in NO3
−-N concentration indicated that there wasan imbalance between heterotrophic nitrification and aerobicdenitrification in the biozeolite capping system (Nakano et al.,2004), resulting from the decrease in aerobic denitrification.
Compared to the control system, the biological actions ofbiozeolite capping over time are shown in Table 1.
Table 1 shows that the main N reduction pathwayschanged over time with regard to biological denitrification

Table 1 – Biological actions of biozeolite capping in different periods, compared with control.
Experimental phase Days 3–16 Days 17–34 Days 35–45 Days 46–73
Reduction of inorganic nitrogen(IOrg-N) concentration of control(mg/L, designated as A)
0.04 0.47 0.83 2.30
Reduction of IOrg-N concentrationof biozeolite (mg/L, designated as B)
0.36 1.13 1.16 0.37
Reduction of TN concentrationof control (mg/L, designated as C)
1.11 0.26 −0.29 2.191.21 1.37 −0.56 0.91
Reduction of TN concentrationof biozeolite (mg/L, designated as D)
0.32 0.66 0.33 −1.93
B–A (mg/L) 0.10 1.11 −0.27 −1.29D–C (mg/L)Main pathway of nitrogen reduction Biological denitrification
(31%) and biologicalassimilation (69%)
Biological denitrification(IOrg-N of 59% and organicnitrogen (Org-N) of 41%converted to N2)
Biological assimilation(IOrg-N convertedto Org-N)
No significant biologicalaction
0
2
46
8
10
12
1416
18
20
0 36 73 121Time (day)
Num
ber
(×10
5 CFU
/g b
ioze
olite
)
Nitrifiers Denitrifiers
Fig. 3 – Changes of nitrifier and denitrifier numbers on thebiozeolite.
123J O U R N A L O F E N V I R O N M E N T A L S C I E N C E S 4 2 ( 2 0 1 6 ) 1 1 9 – 1 2 5
(SND) and biological assimilation. The N reduction by biolog-ical denitrification occurs via two main pathways, which arethe oxidation of NH4
+-N into nitrogenous gas directly viaheterotrophic nitrification and the conversion of NO3
−-N intonitrogenous gas by aerobic denitrification. After day 34, theeffect of aerobic denitrification is not significant. The conclu-sions are the same as discussed above.
2.2. The changes in the DO concentration of the overlyingwater in the two systems
The changes in the DO concentrations of the overlying waterin the biozeolite capping system and control system duringthe incubation experiments are shown in Fig. 2e.
The DO concentration of overlying water in the twosystems either increased or decreased due to the balancebetween the reaeration rate and the microbial consumptionrate of DO. Fig. 2e showed that from 1–8 days, the DOconcentration in the biozeolite capping system was greaterthan that in the control system due to sorption of organics bythe zeolite, consistent with the results reported by Kim andJung (2010). However, from days 9–35, there were no signifi-cant differences in DO concentrations between these twosystems, and their DO concentrations were less than 1.5 mg/L,because the heterotrophic nitrifiers and aerobic denitrifiershad consumed DO due to increased degradation of theavailable organics. From 36–168 days, the DO concentrationin the biozeolite capping system was greater than that in thecontrol system again, which may result from the reduction inavailable organics in the biozeolite capping system.
2.3. Changes in nitrifier and denitrifier numbers attached tobiozeolite
The changes in nitrifier and denitrifier numbers attached tobiozeolite are shown in Fig. 3.
Fig. 3 demonstrates that the number of nitrifiers attachedto biozeolite increased gradually until day 36, decreasedslightly between days 37 and 73, and finally increased quicklyfrom days 74–121. Changes in denitrifier numbers have thesame tendency as nitrifier numbers before day 73. However,denitrifier numbers dropped slowly after day 73, in contrast to
nitrifier numbers. These results suggest that both nitrifiersand denitrifiers attached to biozeolite could grow well beforeday 36, and then died off gradually, which may be due to theabsence of carbon in the biozeolite capping system from days37–73, illustrating why aerobic denitrification decreased afterday 34 (Du et al., 2003; Walters et al., 2009). However, thereappears to bea contradictionbetween the significantnitrificationoccurring and the decrease in nitrifier numbers, such that therewas no evidence of strong nitrification in the canal water body(Huang et al., 2012). After day 73, the increase in nitrifier numbersresulted from the addition of carbon after water exchange.Nevertheless, the decrease in denitrifier numbers indicated that,in addition to carbon, the DO concentration may be a mainfactor in aerobic denitrifier growth (Ding et al., 2011). The DOconcentrations during days 59–73 and 110–168 were greater than3 mg/L (Fig. 2e), suggesting that DO concentrations greater than3 mg/L could inhibit the growth of aerobic denitrifiers. Previousstudies from our group showed that no significant nitrificationoccurs under DO concentrations less than 1 mg/L (Huang et al.,2012). Hence, the optimal DO concentration of aerobic denitrifiergrowth may be 1–3 mg/L.
2.4. The in situ bioregeneration ability of biozeolite
The changes in ammonium adsorption by the biozeolite overtime are shown in Fig. 4.

0
0.5
1.0
1.5
2.0
2.5
3.0
0 36 73 121 168Time (day)
Am
mon
ium
ads
orpa
tion
quan
tity
of b
ioze
olite
(mg
NH
4+-N
/g b
ioze
olite
)
Fig. 4 – Change of ammonium adsorption quantity in thebiozeolite vs. time.
124 J O U R N A L O F E N V I R O N M E N T A L S C I E N C E S 4 2 ( 2 0 1 6 ) 1 1 9 – 1 2 5
Fig. 4 shows that ammonium adsorption by the biozeolitestabilized until day 73 due to the saturation of adsorption ofammonium by the biozeolite, increased during days 74–121,owing to the increase in ammonium concentration afterwater exchange, and finally decreased significantly from 2.52to 1.18 mg NH4
+-N/g biozeolite because of the significant in situbioregeneration of the biozeolite during nitrification (Lahavand Green 1998; Jung et al., 2004). These results indicate thatthe biozeolite has very strong in situ bioregeneration ability.The extent of in situ bioregeneration of the biozeolite seemedto be related to the nitrifier number, which suggested thatthe increase in nitrifier numbers increased the in situbioregeneration rate of the biozeolite.
2.5. The mechanism of BTC N reduction
BTC with biozeolite reduces N in eutrophic water bodies viaa two-step process. First, biozeolite quickly removes ammo-nium from sediments and overlying water by physicaladsorption and ion exchange during the first several days(i.e., ammonium is stored in the biozeolite). Second, hetero-trophic nitrifiers and aerobic denitrifiers reduce N pollutants(e.g., NH4
+-N, NO2−-N, NO3
−-N, and Org-N) through SND andbiological assimilation. Furthermore, significant in situbioregeneration of the biozeolite occurs during nitrification.
Recently, anammox has been identified as an importantpathway for removal of reactive N. Although anammox wasnot investigated in this study, the process may also contributeto the reduction of N from the aquatic ecosystem (Hou et al.,2013). However, further work is still required to confirm thehypothesis.
3. Conclusions
(1) N reduction in eutrophic water bodies using BTC withbiozeolite via SND is feasible.
(2) The effects of in situ bioregeneration of biozeolite weresignificant during nitrification.
(3) Carbon was the main factor in heterotrophic nitrifiergrowth. However, both DO concentration and carbonwere main factors in aerobic denitrifier growth.
(4) It is important to further strengthen the adaptability ofaerobic denitrifiers through the optimization of biofilmformation via the control of DO concentrations between1 and 3 mg/L.
Acknowledgments
This work was supported by the National Science andTechnology Pillar Program (No. 2012BAC04B02), the NationalNatural Science Fund of China (No. 51408243), the NaturalScience Foundation of Fujian Province of China (No.2015J01213), the Fundamental Research Funds for CentralUniversities (No. 11QZR07), the Science and Technology PlanFund of Quanzhou City (No. 2014Z218), and the ResearchFunds of Huaqiao University (No. 14BS216).
R E F E R E N C E S
Berg, U., Neumann, T., Donnert, D., Nüesch, R., Stüben, D., 2004.Sediment capping in eutrophic lakes — efficiency ofundisturbed calcite barriers to immobilize phosphorus. Appl.Geochem. 19, 1759–1771.
Chen, Q., Ni, J.R., 2011. Heterotrophic nitrification–aerobicdenitrification by novel isolated bacteria. J. Ind. Microbiol.Biotechnol. 38, 1305–1310.
Chen, Q., Ni, J.R., 2012. Ammonium removal by Agrobacterium sp.LAD9 capable of heterotrophic nitrification–aerobicdenitrification. J. Biosci. Bioeng. 113 (5), 619–623.
Chen, P.Z., Li, Q.X., Wang, Y.C., Li, S.P., Ren, T.Z., Wang, L.G., 2012.Simultaneous heterotrophic nitrification and aerobicdenitrification by bacterium Rhodococcus sp. CPZ24. Bioresour.Technol. 116, 266–270.
Ding, W., Zhu, L., Xu, J., Feng, L.J., Xu, X.Y., 2011. Progress ofresearches on aerobic denitrifiers and their application inbioremediation. Chin. J. Appl. Environ. Biol. 17 (6), 923–929.
Du, G.C., Geng, J.J., Chen, J., Lun, S.Y., 2003. Mixed culture ofnitrifying bacteria and denitrifying bacteria for simultaneousnitrification and denitrification. World J. Microbiol. Biotechnol.19, 433–437.
Förstner, U., Apitz, S.E., 2007. Sediment remediation: U.S. focus oncapping and monitored natural recovery. Fourth internationalbattle conference on remediation of contaminated sediments.J. Soils Sediments 7 (6), 351–358.
Ge, S.J., Peng, Y.Z., Wang, S.Y., Lu, C.C., Cao, X., Zhu, Y.P., 2012.Nitrite accumulation under constant temperature in anoxicdenitrification process: the effects of carbon sources andCOD/NO3-N. Bioresour. Technol. 114, 137–143.
Hou, L.J., Zheng, Y.L., Liu, M., Gong, J., Zhang, X.L., Yin, G.Y., You,L., 2013. Anaerobic ammonium oxidation (anammox) bacterialdiversity, abundance, and activity in marsh sediments of theYangtze Estuary. J. Geophys. Res. 118, 1237–1246.
Huang, T.L., Xu, J.L., Cai, D.J., 2011. Efficiency of active barriersattaching biofilm as sediment capping to eliminate theinternal nitrogen in eutrophic lake and canal. J. Environ. Sci. 23(5), 738–743.
Huang, T.L., Zhou, Z.M., Xu, J.L., Dong, Y.H., Wang, G., 2012.Biozeolite capping for reducing nitrogen load of the ancientcanal in Yangzhou City. Water Sci. Technol. 66 (2), 336–344.
Huang, T.L., Zhou, Z.M., Su, J.F., Wang, G., Dong, Y.H., 2013.Nitrogen reduction in eutrophic landscape river using

125J O U R N A L O F E N V I R O N M E N T A L S C I E N C E S 4 2 ( 2 0 1 6 ) 1 1 9 – 1 2 5
bioactive multilayer capping (BMC) with biozeolite and sand.J. Soils Sediments 17, 1309–1317.
Jacobs, P.H., Förstner, U., 1999. Concept of subaqueous capping ofcontaminated sediment with active barrier system (ABS) usingnatural and modified zeolite. Water Res. 33, 2083–2087.
Jung, J.Y., Chung, Y.C., Shin, H.S., Son, D.H., 2004. Enhancedammonia nitrogen removal using consistent biologicalregeneration and ammonium exchange of zeolite in modifiedSBR process. Water Res. 38, 347–354.
Kim, G., Jung, W., 2010. Role of sand capping in phosphorusrelease from sediment. KSCE J. Civ. Eng. 14 (6), 815–821.
Kim, M., Jeong, S.Y., Yoon, S.J., Cho, S.J., Kim, Y.H., Ryu, E.Y., Lee,S.J., 2008. Aerobic denitrification of Pseudomonas putida AD-21at different C/N ratios. J. Biosci. Bioeng. 106 (5), 498–502.
Lahav, O., Green, M., 1998. Ammonium removal using ionexchange and biological regeneration. Water Res. 32,2019–2028.
Lewis, W.M., Wurtsbaugh, W.A., Paerl, H.W., 2011. Rationale ofcontrol of anthropogenic nitrogen and phosphorus to reduceeutrophication of inland waters. Environ. Sci. Technol. 45,10300–10305.
Lin, J.W., Zhan, Y.H., Zhu, Z.L., 2011. Evaluation of sedimentcapping with active barrier systems (ABS) using calcitezeolite mixtures to simultaneously manage phosphorusand ammonium release. Sci. Total Environ. 409, 638–646.
Mailapalli, D.R., Thompson, A.M., 2011. Polyacrylamide coatedMilorganite™ and gypsum for controlling sediment andphosphorus loads. Agric. Water Manag. 101, 27–34.
Meis, S., Spears, B.M., Maberly, S.C., O'Malley, M.B., Perkins, R.G.,2012. Sediment amendment with Phoslock® in Clatto reservoir(Dundee, UK): investigating changes in sediment elementalcomposition and phosphorus fractionation. J. Environ. Manag.93, 185–193.
Nakano, K., Iwasawa, H., Lee, T.J., Matsumura, M., 2004. Improvedsimultaneous nitrification and denitrification in a singlereactor by using two different immobilization carriers withspecific oxygen transfer characteristics. Bioprocess Biosyst.Eng. 26, 141–145.
Nilsson, P., Jansson, M., 2002. Hydrodynamic control of nitrogenand phosphorus turnover in an eutrophicated estuary in theBaltic. Water Res. 36, 4616–4626.
Oliveria, M., Ribeiro, D., Nobrega, J.M., Machado, A.V., Brito, A.G.,Nogueira, R., 2011. Removal of phosphorus from water usingactive barriers: Al2O3 immobilized on to polyolefins. Environ.Technol. 32, 989–995.
Özkundakci, D., Hamilton, D.P., Gibbs, M.M., 2011. Hypolimneticphosphorus and nitrogen dynamics in a small, eutrophic lakewith a seasonally anoxic hypolimnion. Hydrobiologia 661,5–20.
Pan, G., Dai, L.C., Li, L., He, L.C., Li, H., Bi, L., Gulati, R.D., 2012.Reducing the recruitment of sedimented algae and nutrientrelease into the overlying water using modified soil/sandflocculation-capping in eutrophic lakes. Environ. Sci. Technol.46, 5077–5084.
Patureau, D., Zumstein, E., Delgenes, J.P., Moletta, R., 2000. Aerobicdenitrifiers isolated from diverse natural and managedecosystems. Microb. Ecol. 39 (2), 145–152.
Sakai, K., Ikehata, Y., Ikenaga, Y., Wakayama, M., Moriguchi, M.,1996. Nitrite oxidation by heterotrophic bacteria under variousnutritional and aerobic conditions. J. Ferment. Bioeng. 82 (6),613–617.
State Environmental Protection Administration (SEPA) of China,2002. Monitoring and Analyzing Methods of Water andWastewater. 4th ed. China Environmental Science Press,Beijing China.
Sun, J., Wang, L., Huang, S.L., Tu, T., Sun, H.W., 2011. The effect ofcapping with natural and modified zeolite on the release ofphosphorus and organic contaminants from river sediment.Front. Environ. Sci. Eng. 5 (3), 308–313.
Walters, E., Hille, A., He, M., Ochmann, C., Horn, H., 2009.Simultaneous nitrification/denitrification in a biofilm airliftsuspension (BAS) reactor with biodegradable carrier material.Water Res. 43, 4461–4468.
Wang, P., Li, X.T., Xiang, M.F., Zhai, Q., 2007. Characterization ofefficient aerobic denitrifiers isolated from two differentsequencing batch reactors by 16S-rRNA analysis. J. Biosci.Bioeng. 103 (6), 563–567.
Xiong, W.H., Peng, J., 2011. Laboratory-scale investigationof ferrihydrite-modified diatomite as a phosphorusco-precipitant. Water Air Soil Pollut. 215, 645–654.
Yang, X.P., Wang, S.M., Zhang, D.W., Zhou, L.X., 2011. Isolationand nitrogen removal characteristics of an aerobicheterotrophic nitrifying–denitrifying bacterium, Bacillus subtilisA1. Bioresour. Technol. 102, 854–862.
Yu, Y.X., Wu, G.Q., Meng, X.T., 1990. Biological test manual ofEnvironmental engineering. China Environmental SciencePress, Beijing China.
Zhang, Q.L., Liu, Y., Ai, G.M., Miao, L.L., Zheng, H.Y., Liu, Z.P., 2012.The characteristics of a novel heterotrophicnitrification–aerobic denitrification bacterium, Bacillusmethylotrophicus strain L7. Bioresour. Technol. 108, 35–44.
Zhao, B., He, Y.L., Hughes, J., Zhang, X.F., 2010. Heterotrophicnitrogen removal by a newly isolated Acinetobacter calcoaceticusHNR. Bioresour. Technol. 101, 5194–5200.
Zhao, B., An, Q., He, Y.L., Guo, J.S., 2012. N2O and N2 productionduring heterotrophic nitrification by Alcaligenes faecalis strainNR. Bioresour. Technol. 116, 379–385.

J O U R N A L O F E N V I R O N M E N T A L S C I E N C E S 4 2 ( 2 0 1 6 ) 1 2 6 – 1 3 3
Ava i l ab l e on l i ne a t www.sc i enced i r ec t . com
ScienceDirect
www. jou rna l s . e l sev i e r . com/ j es
Temperature effect on photolysis decomposing ofperfluorooctanoic acid
Tiliang Zhang, Gang Pan⁎, Qin ZhouResearch Center for Eco-Environmental Sciences, Chinese Academy of Sciences, Beijing 100085, China. E-mail: [email protected]
A R T I C L E I N F O
⁎ Corresponding author. E-mail: gpan6@yaho
http://dx.doi.org/10.1016/j.jes.2015.05.0081001-0742/© 2015 The Research Center for Ec
A B S T R A C T
Article history:Received 1 April 2015Revised 7 May 2015Accepted 11 May 2015Available online 2 July 2015
Perfluorooctanoic acid (PFOA) is recalcitrant to degrade and mineralize. Here, the effect oftemperature on the photolytic decomposition of PFOAwas investigated. The decompositionof PFOA was enhanced from 34% to 99% in 60 min of exposure when the temperature wasincreased from 25 to 85°C under UV light (201–600 nm). The limited degree of decompo-sition at 25°C was due to low quantum yield, which was increased by a factor of 12 at 85°C.Under the imposed conditions, the defluorination ratio increased from 8% at 25°C to 50% at85°C in 60 min. Production of perfluorinated carboxylic acids (PFCAs, C7–C5), PFCAs (C4–C3)and TFA (trifluoroacetic acid, C2) accelerated and attained a maximum within 30 to 90 minat 85°C. However, these reactions did not occur at 25°C despite extended irradiation to180 min. PFOA was decomposed in a step-wise process by surrendering one CF2 unit. Ineach cyclical process, increased temperature enhanced the quantum yields of irradiationand reactions between water molecules and intermediates radicals. The energy consump-tion for removing each μmol of PFOA was reduced from 82.5 kJ at 25°C to 10.9 kJ at 85°Cusing photolysis. Photolysis coupled with heat achieved high rates of PFOA degradation anddefluorination.© 2015 The Research Center for Eco-Environmental Sciences, Chinese Academy of Sciences.
Published by Elsevier B.V.
Keywords:Perfluorooctanoic acidPFOAPhotolysisTemperature effect
Introduction
Perfluorooctanoic acid (PFOA, CF3(CF2)6COOH) is a member ofthe class of substances called perfluorinated chemicals (PFCs).PFOA has been produced and used in commercial productsand industrial processes for over 60 years (Renner, 2004;Lindstrom et al., 2011). Interest and concern about PFOA aregrowing as more are learned about this anthropogenicchemical. PFOA is resistant to environmental degradationand has the potential for bioaccumulation (Post et al., 2012).PFOA enhances the health risks, including endocrine disruptingproperties (White et al., 2011), immunotoxicity (DeWitt et al.,2012) and developmental effects (Fletcher et al., 2013). PFOAis different from other persistent organic pollutants in its
o.co.uk (Gang Pan).
o-Environmental Science
hydrotrope property and can therefore aggregate in the liverand blood serum rather than in fatty tissues (Gebbink et al.,2009). Although the manufacture and use of PFOA are phasingout in some countries, PFOA has been frequently detected indrinking water (Post et al., 2009; Quinones and Snyder, 2009),biotas (Gebbink et al., 2009) and in people (Harada et al., 2007).However, PFOA is difficult to degrade using most conventionaltechnologies (Vecitis et al., 2009). Thus, it is important andurgent to find an effective mineralization method.
Recently, a number of chemical technologies for PFOAdecomposition have been reported. These methods covervarious chemical process, including thermally-induced re-duction (Krusic et al., 2005), microwave assisted oxidativedecomposition (Lee et al., 2009, 2010), sonochemical pyrolysis
s, Chinese Academy of Sciences. Published by Elsevier B.V.

127J O U R N A L O F E N V I R O N M E N T A L S C I E N C E S 4 2 ( 2 0 1 6 ) 1 2 6 – 1 3 3
(Vecitis et al., 2008; Cheng et al., 2010; Moriwaki et al., 2005),electrochemical degradation (Zhuo et al., 2011; Niu et al., 2012;Lin et al., 2012b) and photochemical decomposition (Wang etal., 2008, 2010; Wang and Zhang, 2011; Song et al., 2012).Among these reported methods, sonochemical, electrochem-ical and photochemical degradations are the most promisingtreatment alternatives to degrade PFOA efficiently. In the caseof photochemical decomposition, there have been a numberof attempts to promote the degradation of PFOA. Directphotolysis, as a clean technique, is limited by the lowdegradation efficiency and inadequate mineralization (Horiet al., 2004a). The indirect photoreactions have been devel-oped to improve the efficiency of photo degradation. Someoxidants, such as ozone (Lin et al., 2012a), persulfate (Hori etal., 2005) and ferric ion (Hori et al., 2007), have been found toenhance the degradation and mineralization of PFOA. How-ever, these methods require chemical compounds that arepotential secondary pollutants. Photocatalysts have also beeninvestigated for PFOA degradation. Titanium dioxide mate-rials offer the advantage of generating hydroxyl radicals (HOU)in aqueous solution to help degrade most organic pollutant(Hoffmann et al., 1995), but HOU is not sufficiently effective todegrade PFOA (kOHU + PFOA ≤ 105 (mol/L)−1·sec−1). The electro-negative fluoride atoms in PFOA reduce the electron densityof the terminal –COO– group and are thus inimical to electrontransfer between HOU and the –COO– group (Vecitis et al.,2009). Indium oxide (In2O3) exhibits remarkable photocatalyticactivity for PFOA decomposition. The tightly bidentate com-pound or the bridging configuration of PFOA molecule to theIn2O3 surface enhances the direct decomposition of PFOA byphotogenerated holes in In2O3 under UV irradiation (Li et al.,2012a). Nanostructured In2O3 with greater oxygen vacancydefects shows higher photocatalytic activity (Li et al., 2012b,2013). However, the mineralization is inadequate, becausedegradation productsmay deplete the oxygen vacancy defectsof the photocatalysts. As a result, it is essential to explorea more efficient and clean method for the removal andmineralization of PFOA.
Water molecules involved in reacting with intermediatesin the decomposition processes of PFOA. The reaction tem-perature exhibits significant influence on the decomposingefficiency (Lee et al., 2010; Xiao et al., 2011). The low solutiontemperature (20°C) in persulfate oxidation systems requires648 hr to degrade 81% of PFOA (Lee et al., 2012), whereas hotwater (80°C) persulfate oxidative systems can completelydegrade PFOA in 6 hr (Hori et al., 2008). This acceleration isattributed to the abundant sulfate radicals which were formedquickly at high temperature to degrade PFOA. In the electro-chemical degradation of PFOA by a boron-doped diamond filmelectrode, the apparent reaction rate constant increased from0.108 to 0.444 hr−1 as reaction temperature increased from 20to 100°C (Xiao et al., 2011). In the photolysis processes fordecomposing PFOA, intermediate reactions involved with thewater molecules have been reported (Hori et al., 2004a; Chenet al., 2007). However, there have been few reports concerningthe temperature effects on the PFOA photolysis degradation.
Photolysis is a clean PFOA treatment approach. However, itis constrained by poor efficiency and limited mineralization.There are two practical approaches to enhance the photolysisefficiency of PFOA, which include application of deep
ultraviolet light and the promotion of quantum yields. PFOAhas a strong absorption peak centered at 190 nm and ageneral broad light absorption from 220 to 600 nm. Thecombination of 185 nm and 254 nm could achieve higherdegradation efficiency than 185 nm (Chen et al., 2007; Giri etal., 2011). Therefore, compound light may achieve high PFOAdegradation efficiency. The quantum yield describes the ratioof the absorbed photons that transform the pollutant. This isdependent on the probability of the excited-state achieved byabsorbed photon and their ability promotes the reaction toproducts (Schwarzenbach et al., 2003). The promotion of thequantum yield of the irradiated light will enhance the PFOAdegradation. Nevertheless, there have been few reports toinvestigate the temperature effect on the quantum yield andthe photolysis reaction for degrading PFOA up to now.
The main objective of this study is to explore the tem-perature effect on the photolytic degradation of PFOA. Thequantum yield of compound light at various temperatureswas calculated and discussed. The production of intermedi-ates and fluoride ions was investigated. The potential fortemperature elevation to enhance the degradation or themineralization of PFOA by photolysis was explored.
1. Materials and methods
1.1. Standards and chemicals
Perfluorooctanoic acid (PFOA, sodium salt, 97%, CAS NO.:335-67-1) was purchased from Aldrich Chemical Co. (NewJersey, USA). Methanol (HPLC grade) was purchased fromFisher Scientific (Pittsburgh, USA). Ammonium acetate (LC-MSUltra, CAS NO.: 631-61-8) was purchased from Sigma-AldrichCo. LLC. (Shanghai, China). All other chemicals used in thiswork were of analytical grade. An aqueous solution of PFOAwas prepared using high purity water (18.2 MΩ·cm) obtainedfrom the Milli-Q Ultrapure Water Purification Systems(Millipore, Boston, USA).
1.2. Photolysis experiments
The photolysis experiments were conducted in a tubularquartz reactor with an inner diameter of 55 mm and a lengthof 250 mm (Appendix A Fig. S1). A high-pressure mercury-vapor lamp (500 W, Beijing Lighting Research Institute, China)was used to provide UV illumination. The emission spectrumof the mercury-vapor lamp is shown in Appendix A Fig. S1.The lamp with a quartz envelope was placed in the center ofthe reactor. The reaction temperature was controlled by athermal water jacket around the reactor (Appendix A Fig. S1).
The initial concentration of PFOA was set at 30 mg/L. Thereactor was filled with a volume of 500 mL PFOA aqueoussolution. The temperature of photoreaction solution wascontrolled from 25 to 85°C by circulating water in a bain-marie with a peristaltic pump. Two microliter aliquots of thephotoreaction solution were periodically collected for analysisof PFOA and intermediates at intervals of 0, 30, 60, 90, 120 and180 min during the reaction. In addition, an additional 2 mLaliquot of the photoreaction solution was collected for deter-mination of fluoride ions.

128 J O U R N A L O F E N V I R O N M E N T A L S C I E N C E S 4 2 ( 2 0 1 6 ) 1 2 6 – 1 3 3
1.3. Analysis
An ultra-performance liquid chromatography–tandem massspectrometry (UPLC–MS/MS) was used to determine theconcentrations of PFOA and identify the photolysis interme-diates. The UPLC system (Waters Corp., Massachusetts, USA)was equipped with a C18 column (2.1 mm × 50 mm i.d.,particle size 1.7 mm, Waters Corp., USA). The MS system wasa Quattro Premier XE tandem quadrupole mass spectrometer(Waters Corp., Massachusetts, USA) with an electrosprayionization source. The analytical method has been describedpreviously (Zhou et al., 2013; Zhuo et al., 2012). The mobilephase was a binary mixture of solvent A (2 mmol/L ammoniumacetate in 5% methanol) and solvent B (2 mmol/L ammoniumacetate in 100% methanol) at a flow rate of 0.3 mL/min. Thesolvent gradient began with 25% A and 75% B, and was linearlyramped to 85%A and 15% B in 5 min, then ramped to 25% A and75% B in the following 2 min. The column was then allowed toequilibrate for 3 min and the total running time was 10 min.The injection volume of the samples was 10 μL. The tandemMSanalysis was conducted in the multiple reaction monitoringmodes, and the cone voltage and collision energywere 30 V and11 V, respectively. Standard solutions contained PFOA andsome C2–C7 shorter-chain PFCAs. Calibration standards wereprepared in the range of 10–900 μg/L POFA.
The concentration of fluoride ions (F−) in aqueous solutionwere determined using an ion-chromatography system(Dionex-ICS2000, Sunnyvale, USA) consisting of manual sampleinjector (sample injection volume: 25 μL), degasser, pump,separation column (250 mm length × 4 mm i.d., Dionex IonpacAS11-HC, Sunnyvale, USA), column oven (30°C) and conductivitydetectorwith a suppressor device. Themobile phase consisted ofa solution of KOH (30 mmol/L) which was pumped into thesystem at a rate of 1.0 mL/min. The limit of detection was0.01 mg/L. Defluorination ratio was calculated as follow (Eq. (1)).
Def ¼ C F−
15� CPFOA� 100% ð1Þ
where, Def is the defluorination ratio, CF-(mmol/L) is theconcentration of fluoride ion, CPFOA (mmol/L) is the initialconcentration of PFOA and the constant 15 corresponds to thenumber of fluorine atoms in PFOA molecule.
0 30 60 90 120 150 1800.0
0.2
0.4
0.6
0.8
1.0
C/C
0
Irradiation time (min)
25°C45°C65°C
85°C
a
Fig. 1 – Photolytic decomposition of perfluorooctanoic acid (PFOAtemperatures.
2. Results
2.1. Degradation kinetics of PFOA
The concentration of PFOA decreased with irradiation time,which was remarkably enhanced as temperature of thereaction system was increased (Fig. 1). The decrease in theconcentration of PFOA in solution went from 39% at 25°C to99% at 85°C within 60 min (Fig. 1a). The decrease of PFOAfollowed first-order kinetics at the various temperatures(Fig. 1b, Appendix A Table S1). The reaction rate constantsincreased from 6.40 × 10⁻³ min−1 at 25°C to 7.71 × 10⁻² min−1
at 85°C.
2.2. Defluorination
Fluoride ions were generated during the photolysis reaction,which increased as the temperature increased (Fig. 2).Defluorination ratio at 25°C was 8%, which increased to 50%at 85°C within 60 min. The defluorination ratio increasedcontinuously to 77% at 85°C from 60 min to 180 min.
2.3. Degradation intermediates
The samples collected at different temperatures were ana-lyzed by UPLC–MS/MS chromatograms to identify intermedi-ate products. According to the mass-charge ratio of thefragment ions, the intermediate products were identified asshort chain PFCAs bearing C7–C2 perfluoroalkyl groups, includ-ing PFHpA (C6F13COO−), PFHxA (C5F11COO−), PFPeA (C4F9COO−),PFBA (C3F7COO−), PFPrA (C2F5COO−) and TFA (CF3COO−) (Fig. 3and Appendix A Fig. S3).
With the degradation of PFOA at 25°C (Fig. 1a), PFCA (C7–C3) formation followed the order of chain length from PFHpA(C7) to TFA (C2). PFHpA (C7) was detected immediately. PFHxA(C6), PFPeA (C5), PFBA (C4) and PFPrA (C3) were detected at 30,30, 60 and 180 min. TFA (C2) was not detected after 180 min ofirradiation (Fig. 3a).
The production of PFCAs accelerated as the temperaturewas increased (Fig. 3 and Appendix A Table S3). At 25°C, PFCAs(C7–C2) were produced slowly and did not attain the maximumgeneration even after extended irradiation times to 180 min. At
0 30 60 90 120 150 180-6
-5
-4
-3
-2
-1
0
25°C45°C65°C85°C
ln (
C/C
0)
Irradiation time (min)
b
) (a) and first-order plots of PFOA degradation (b) at different

0 30 60 90 120 150 180
0
20
40
60
80C
/C0
Irradiation time (min)
25°C45°C65°C85°C
Fig. 2 – Defluorination ratios of PFOA at different temperatures.PFOA: perfluorooctanoic acid.
129J O U R N A L O F E N V I R O N M E N T A L S C I E N C E S 4 2 ( 2 0 1 6 ) 1 2 6 – 1 3 3
85°C, PFCAs (C7–C5), PFCAs (C4–C3) and TFA (C2) formed quicklyand were at maximum concentration within 30, 60 and 90 min,respectively.
At high reaction temperatures, PFCA (C7–C2) formationalso followed the order of chain length from PFHpA (C7) to TFA(C2) (Fig. 3b–d). PFHpA (C7), PFHxA (C6) and PFPeA (C5) formedfirst and achieved maximum concentration within 30 min.Following this, PFBA (C4) and PFPrA (C3) formed and achievedmaximum concentration within 60 and 90 min, respectively.TFA (C2) generation did not achieve maximum concentrationwithin 180 min (Fig. 3c).
3. Discussion
3.1. Effect of temperature on PFOA photolysis
It is well known that the efficiency of direct photolysis islimited by quantum efficiency and the intensity of theirradiating light, in which the intensity is increased at thecost of energy consumption (Hori et al., 2004a; Cao et al., 2010).The quantum yield is the number of degraded PFOA mole-cules divided by the number of photons absorbed by thesystem. The quantum yields at different temperatures werecalculated according to Appendix Eq. (S1). The quantum yieldsincreased with temperature and obeyed Eq. (2) (Fig. 4).
Φ ¼ 402:6� exp−4424:6T þ 273
� �ð2Þ
After the PFOA molecule absorbed a photon, it becameunstable and underwent two competing processes in theexperimental photoreaction system. These processes includ-ed degradation or internal conversion to heat, which wereinitiated to return the molecule to a stable state (Zepp andCline, 1977). High reaction temperatures inhibited the internalconversion to heat and favored the degradation process ofPFOA. The promotion of quantum yield illustrates an increasein the proportion of PFOA molecules existing at an excitedstate that are involved in the degradation process. Thequantum yield (1.72 × 10⁻³) at 85°C was twelve times higherthan that (1.55 × 10⁻⁴) at 25°C (Fig. 4 and Appendix A Table S1).
Temperature elevation promoted the quantum yields andthus enhanced the photolysis of PFOA.
3.2. Effect of temperature on the degradation of PFCA interme-diates and mineralization
The defluorination ratio increased by 50% when 99% PFOAwas degraded in 60 min at 85°C (Figs. 2 and 1a), whereas thedefluorination ratio continually increased to 77% (Fig. 2)from 60 to 180 min (Fig. 3d). The additional fluoride ionsgenerated during the reaction from 60 to 180 min resultedfrom the degradation of PFCAs intermediates. Hydrogenions were also simultaneously generated (Fig. 5). The longchain PFCAs were degraded to fluoride ions, hydrogen ionsand short chain PFCAs containing fewer CF2 units (Figs. 2, 3and 5).
The degradation of PFHpA (C7), PFHxA (C6) achieved theirmaximum concentration within 60 min at 45°C (Fig. 3b), butthis process was observed within 30 min at 65°C (Fig. 3c).Obviously, the degradation of PFHpA (C7) was accelerated byincreasing the temperature from 45 to 65°C. Similarly, withthe degradation of PFPeA (C5), PFBA (C4) occurred andachieved maximum concentration at 65°C, but not at 45°C(Fig. 3b and c). This illustrated that the degradation of PFPeA(C5) was also enhanced as temperature was increased.These phenomena were also investigated in the otherPFCAs intermediates (Fig. 3b, c, d and Appendix A TableS3). Higher reaction temperatures promoted the degrada-tion of PFCAs into hydrogen ions, fluoride ions and shortchain PFCAs.
Defluorination ratio was directly related to the degree ofPFOA mineralization. The increase in the defluorination ratiosuggested that PFOA was directly degraded to fluoride ionsand carbon dioxide (Lee et al., 2012). Temperature elevationpromoted the production of hydrogen ions and fluoride ions(Figs. 2 and 5). The mineralization of PFOA by photolysis waspromoted by increased reaction temperature.
3.3. Mechanism of PFOA degradation
As illustrated above, when the PFOA was degraded, thedefluorination ratio increased continually so that PFCA inter-mediates were formed and decomposed, pH values decreasedand these processes were enhanced with increasing temper-ature (Figs. 1, 2, 3 and 5). The PFOAwas decomposed into shortchain PFCAs, fluoride ions and hydrogen ions at 85°C withpattern similar to that at 25°C, i.e. direct photolysis. Based onthe results and direct photolysis, the mechanism of the tem-perature effects on photolysis to degrade PFOA is proposed.
The reaction temperatures (≤85°C) are far below thethermolysis temperature (350°C) and were not sufficient todegrade PFOA without irradiation (Krusic and Roe, 2004;Krusic et al., 2005). The C–C bond between C7F15 and COOH isthe weakest bond in the PFOA chemical structure because thefluorine atom has the strongest inductive electron withdrawalability (Blondel et al., 1989). The light irradiation initiallycleaves this weakest bond, which initiates the PFOA degrada-tion. As a result, C7F15U radicals and carbon dioxide aregenerated in this step (Eq. (3)). The increasing reactiontemperature promotes the quantum yield of the irradiating
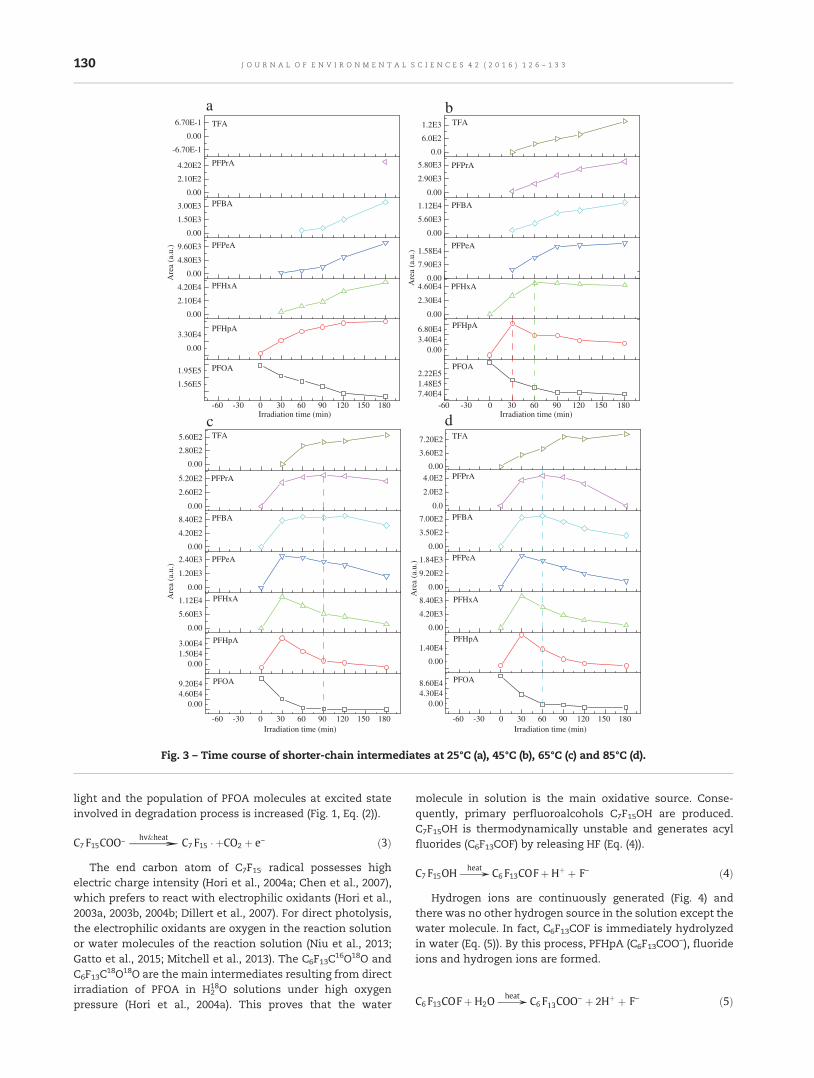
-60 -30 0 30 60 90 120 150 180
1.56E5
1.95E5
0.00
3.30E4
0.00
2.10E4
4.20E4
0.00
4.80E3
9.60E3
0.00
1.50E3
3.00E3
0.00
2.10E2
4.20E2
-6.70E-1
0.00
6.70E-1
Are
a (a
.u.)
Irradiation time (min)
PFOA
PFHpA
PFHxA
PFPeA
PFBA
PFPrA
TFA
a
-60 -30 0 30 60 90 120 150 1807.40E41.48E52.22E5
0.003.40E46.80E4
0.00
2.30E4
4.60E40.00
7.90E3
1.58E4
0.00
5.60E3
1.12E4
0.00
2.90E3
5.80E3
0.0
6.0E2
1.2E3
Are
a (a
.u.)
Irradiation time (min)
PFOA
PFHpA
PFHxA
PFPeA
PFBA
PFPrA
bTFA
-60 -30 0 30 60 90 120 150 180
0.004.60E49.20E4
0.001.50E43.00E4
0.00
5.60E3
1.12E4
0.00
1.20E3
2.40E3
0.00
4.20E2
8.40E2
0.00
2.60E2
5.20E2
0.00
2.80E2
5.60E2
Are
a (a
.u.)
Irradiation time (min)
PFOA
PFHpA
PFHxA
PFPeA
PFBA
PFPrA
cTFA
-60 -30 0 30 60 90 120 150 180
0.004.30E48.60E4
0.00
1.40E4
0.00
4.20E3
8.40E3
0.00
9.20E2
1.84E3
0.00
3.50E2
7.00E2
0.0
2.0E2
4.0E2
0.00
3.60E2
7.20E2
Are
a (a
.u.)
Irradiation time (min)
PFOA
PFHpA
PFHxA
PFPeA
PFBA
PFPrA
dTFA
Fig. 3 – Time course of shorter-chain intermediates at 25°C (a), 45°C (b), 65°C (c) and 85°C (d).
130 J O U R N A L O F E N V I R O N M E N T A L S C I E N C E S 4 2 ( 2 0 1 6 ) 1 2 6 – 1 3 3
light and the population of PFOA molecules at excited stateinvolved in degradation process is increased (Fig. 1, Eq. (2)).
C7 F15COO→hv&heat
C7 F15 � þCO2 þ e− ð3Þ
The end carbon atom of C7F15U radical possesses highelectric charge intensity (Hori et al., 2004a; Chen et al., 2007),which prefers to react with electrophilic oxidants (Hori et al.,2003a, 2003b, 2004b; Dillert et al., 2007). For direct photolysis,the electrophilic oxidants are oxygen in the reaction solutionor water molecules of the reaction solution (Niu et al., 2013;Gatto et al., 2015; Mitchell et al., 2013). The C6F13C16O18O andC6F13C18O18O are the main intermediates resulting from directirradiation of PFOA in H2
18O solutions under high oxygenpressure (Hori et al., 2004a). This proves that the water
molecule in solution is the main oxidative source. Conse-quently, primary perfluoroalcohols C7F15OH are produced.C7F15OH is thermodynamically unstable and generates acylfluorides (C6F13COF) by releasing HF (Eq. (4)).
C7 F15OH→heat
C6 F13COFþHþ þ F− ð4Þ
Hydrogen ions are continuously generated (Fig. 4) andthere was no other hydrogen source in the solution except thewater molecule. In fact, C6F13COF is immediately hydrolyzedin water (Eq. (5)). By this process, PFHpA (C6F13COO−), fluorideions and hydrogen ions are formed.
C6 F13COFþH2O→heat
C6 F13COO− þ 2Hþ þ F− ð5Þ
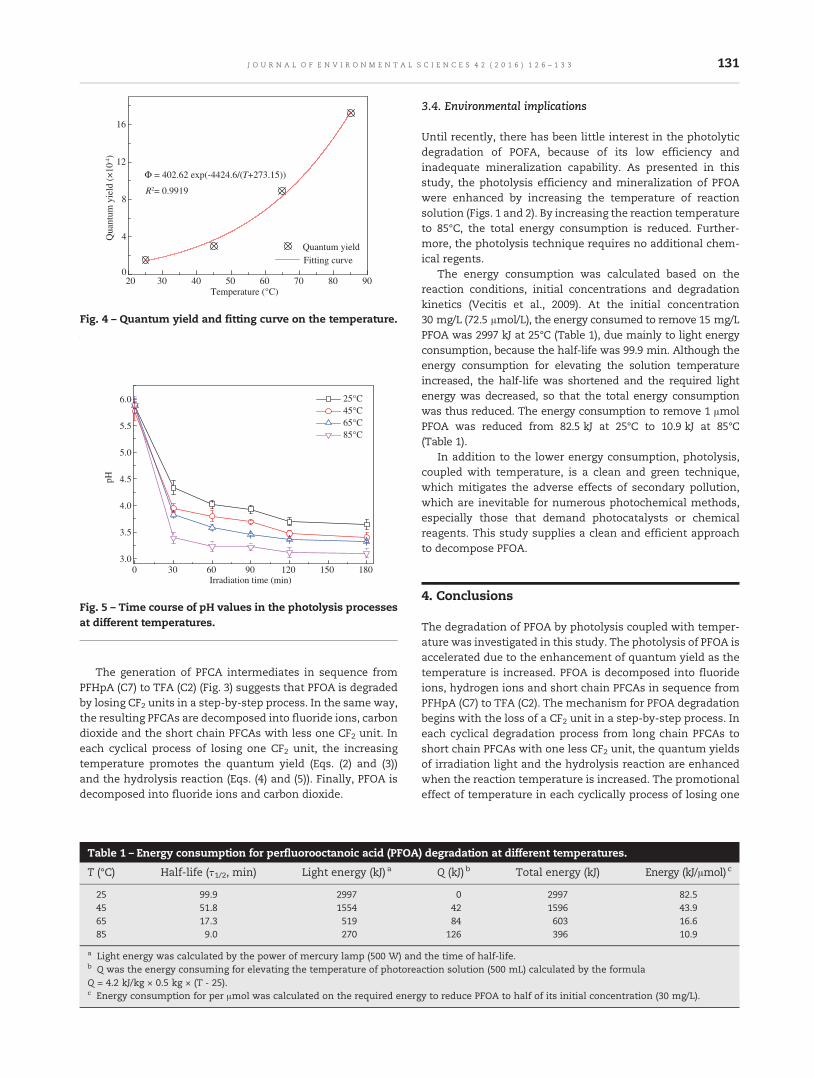
20 30 40 50 60 70 80 900
4
8
12
16
Φ = 402.62 exp(-4424.6/(T+273.15))
R2= 0.9919
Quantum yieldFitting curve
Qua
ntum
yie
ld (
×10
-4)
Temperature (°C)
Fig. 4 – Quantum yield and fitting curve on the temperature.
0 30 60 90 120 150 1803.0
3.5
4.0
4.5
5.0
5.5
6.0
pH
Irradiation time (min)
25°C45°C65°C85°C
Fig. 5 – Time course of pH values in the photolysis processesat different temperatures.
131J O U R N A L O F E N V I R O N M E N T A L S C I E N C E S 4 2 ( 2 0 1 6 ) 1 2 6 – 1 3 3
The generation of PFCA intermediates in sequence fromPFHpA (C7) to TFA (C2) (Fig. 3) suggests that PFOA is degradedby losing CF2 units in a step-by-step process. In the same way,the resulting PFCAs are decomposed into fluoride ions, carbondioxide and the short chain PFCAs with less one CF2 unit. Ineach cyclical process of losing one CF2 unit, the increasingtemperature promotes the quantum yield (Eqs. (2) and (3))and the hydrolysis reaction (Eqs. (4) and (5)). Finally, PFOA isdecomposed into fluoride ions and carbon dioxide.
Table 1 – Energy consumption for perfluorooctanoic acid (PFOA
T (°C) Half-life (τ1/2, min) Light energy (kJ) a
25 99.9 299745 51.8 155465 17.3 51985 9.0 270
a Light energy was calculated by the power of mercury lamp (500 W) andb Q was the energy consuming for elevating the temperature of photoreaQ = 4.2 kJ/kg × 0.5 kg × (T - 25).c Energy consumption for per μmol was calculated on the required energ
3.4. Environmental implications
Until recently, there has been little interest in the photolyticdegradation of POFA, because of its low efficiency andinadequate mineralization capability. As presented in thisstudy, the photolysis efficiency and mineralization of PFOAwere enhanced by increasing the temperature of reactionsolution (Figs. 1 and 2). By increasing the reaction temperatureto 85°C, the total energy consumption is reduced. Further-more, the photolysis technique requires no additional chem-ical regents.
The energy consumption was calculated based on thereaction conditions, initial concentrations and degradationkinetics (Vecitis et al., 2009). At the initial concentration30 mg/L (72.5 μmol/L), the energy consumed to remove 15 mg/LPFOA was 2997 kJ at 25°C (Table 1), due mainly to light energyconsumption, because the half-life was 99.9 min. Although theenergy consumption for elevating the solution temperatureincreased, the half-life was shortened and the required lightenergy was decreased, so that the total energy consumptionwas thus reduced. The energy consumption to remove 1 μmolPFOA was reduced from 82.5 kJ at 25°C to 10.9 kJ at 85°C(Table 1).
In addition to the lower energy consumption, photolysis,coupled with temperature, is a clean and green technique,which mitigates the adverse effects of secondary pollution,which are inevitable for numerous photochemical methods,especially those that demand photocatalysts or chemicalreagents. This study supplies a clean and efficient approachto decompose PFOA.
4. Conclusions
The degradation of PFOA by photolysis coupled with temper-ature was investigated in this study. The photolysis of PFOA isaccelerated due to the enhancement of quantum yield as thetemperature is increased. PFOA is decomposed into fluorideions, hydrogen ions and short chain PFCAs in sequence fromPFHpA (C7) to TFA (C2). The mechanism for PFOA degradationbegins with the loss of a CF2 unit in a step-by-step process. Ineach cyclical degradation process from long chain PFCAs toshort chain PFCAs with one less CF2 unit, the quantum yieldsof irradiation light and the hydrolysis reaction are enhancedwhen the reaction temperature is increased. The promotionaleffect of temperature in each cyclically process of losing one
) degradation at different temperatures.
Q (kJ) b Total energy (kJ) Energy (kJ/μmol)c
0 2997 82.542 1596 43.984 603 16.6
126 396 10.9
the time of half-life.ction solution (500 mL) calculated by the formula
y to reduce PFOA to half of its initial concentration (30 mg/L).

132 J O U R N A L O F E N V I R O N M E N T A L S C I E N C E S 4 2 ( 2 0 1 6 ) 1 2 6 – 1 3 3
CF2 unit also strengthens themineralization of the photolysis.The energy consumption for removing 1 μmol PFOA is reducedfrom 82.5 kJ at 25°C to 10.9 kJ at 85°C. This study providesan exploration on the application of thermal effects in thephotolytic degradation of PFOA.
Acknowledgments
This work was supported by the National Basic ResearchProgram (973) of China (No. 2010CB933600), the StrategicPriority Research Program of the Chinese Academy of Sciences(No. XDA09030203), the National Natural Science Foundation ofChina (Nos. 21277161, 41103076), the special fund from theState Key Laboratory of Environmental Aquatic Chemistry(No. 10Y10ESPCR), and the Youth Innovation Promotion Asso-ciation, Chinese Academy of Sciences (29QNCX2012005).
Appendix A. Supplementary data
Supplementary data associated with this article can be foundin online version at http://dx.doi.org/10.1016/j.jes.2015.05.008.
R E F E R E N C E S
Blondel, C., Cacciani, P., Delsart, C., Trainham, R., 1989.High-resolution determination of the electron affinity offluorine and bromine using crossed ion and laser beams. Phys.Rev. A 40, 3698–3701.
Cao, M.H., Wang, B.B., Yu, H.S., Wang, L.L., Yuan, S.H., Chen, J.,2010. Photochemical decomposition of perfluorooctanoic acidin aqueous periodate with VUV and UV light irradiation.J. Hazard. Mater. 179, 1143–1146.
Chen, J., Zhang, P.Y., Liu, J., 2007. Photodegradation ofperfluorooctanoic acid by 185 nm vacuum ultraviolet light.J. Environ. Sci. (China) 19, 387–390.
Cheng, J., Vecitis, C.D., Park, H., Mader, B.T., Hoffmann, M.R., 2010.Sonochemical degradation of perfluorooctane sulfonate (PFOS)and perfluorooctanoate (PFOA) in groundwater: kinetic effectsof matrix inorganics. Environ. Sci. Technol. 44, 445–450.
DeWitt, J.C., Peden-Adams, M.M., Keller, J.M., Germolec, D.R., 2012.Immunotoxicity of perfluorinated compounds: recentdevelopments. Toxicol. Pathol. 40, 300–311.
Dillert, R., Bahnemann, D., Hidaka, H., 2007. Light-induceddegradation of perfluorocarboxylic acids in the presence oftitanium dioxide. Chemosphere 67, 785–792.
Fletcher, T., Galloway, T.S., Melzer, D., Holcroft, P., Cipelli, R.,Pilling, L.C., et al., 2013. Associations between PFOA, PFOS andchanges in the expression of genes involved in cholesterolmetabolism in humans. Environ. Int. 57-58C, 2–10.
Gatto, S., Sansotera, M., Persico, F., Gola, M., Pirola, C., Panzeri, W.,et al., 2015. Surface fluorination on TiO2 catalyst induced byphotodegradation of perfluorooctanoic acid. Catal. Today 241,8–14 (Part A).
Gebbink, W.A., Hebert, C.E., Letcher, R.J., 2009. Perfluorinatedcarboxylates and sulfonates and precursor compounds inHerring Gull Eggs from colonies spanning the LaurentianGreat Lakes of North America. Environ. Sci. Technol. 43,7443–7449.
Giri, R.R., Ozaki, H., Morigaki, T., Taniguchi, S., Takanami, R., 2011.UV photolysis of perfluorooctanoic acid (PFOA) in diluteaqueous solution. Water Sci. Technol. 63, 276–282.
Harada, K., Koizumi, A., Saito, N., Inoue, K., Yoshinaga, T., Date, C., etal., 2007. Historical and geographical aspects of the increasingperfluorooctanoate and perfluorooctane sulfonate contaminationin human serum in Japan. Chemosphere 66, 293–301.
Hoffmann, M.R., Martin, S.T., Choi, W., Bahnemann, D.W., 1995.Environmental applications of semiconductor photocatalysis.Chem. Rev. 95, 69–96.
Hori, H., Takano, Y., Koike, K., Kutsuna, S., Einaga, H., Ibusuki, T.,2003a. Photochemical decomposition of pentafluoropropionicacid to fluoride ions with a water-soluble heteropolyacidphotocatalyst. Appl. Catal. B Environ. 46, 333–340.
Hori, H., Takano, Y., Koike, K., Takeuchi, K., Einaga, H., 2003b.Decomposition of environmentally persistent trifluoroaceticacid to fluoride ions by a homogeneous photocatalyst in water.Environ. Sci. Technol. 37, 418–422.
Hori, H., Hayakawa, E., Einaga, H., Kutsuna, S., Koike, K., Ibusuki,T., et al., 2004a. Decomposition of environmentally persistentperfluorooctanoic acid in water by photochemical approaches.Environ. Sci. Technol. 38, 6118–6124.
Hori, H., Hayakawa, E., Yamashita, N., Taniyasu, S., Nakata, F.,Kobayashi, Y., 2004b. High-performance liquid chromatographywith conductimetric detection of perfluorocarboxylic acids andperfluorosulfonates. Chemosphere 57, 273–282.
Hori, H., Yamamoto, A., Hayakawa, E., Taniyasu, S., Yamashita, N.,Kutsuna, S., et al., 2005. Efficient decomposition ofenvironmentally persistent perfluorocarboxylic acids by use ofpersulfate as a photochemical oxidant. Environ. Sci. Technol.39, 2383–2388.
Hori, H., Yamamoto, A., Koike, K., Kutsuna, S., Osaka, I., Arakawa,R., 2007. Photochemical decomposition of environmentallypersistent short-chain perfluorocarboxylic acids in watermediated by iron(II)/(III) redox reactions. Chemosphere 68,572–578.
Hori, H., Nagaoka, Y., Murayama, M., Kutsuna, S., 2008. Efficientdecomposition of perfluorocarboxylic acids and alternativefluorochemical surfactants in hot water. Environ. Sci. Technol.42, 7438–7443.
Krusic, P.J., Roe, D.C., 2004. Gas-phase NMR technique for studyingthe thermolysis of materials: thermal decomposition ofammonium perfluorooctanoate. Anal. Chem. 76, 3800–3803.
Krusic, P.J., Marchione, A.A., Roe, D.C., 2005. Gas-phase NMRstudies of the thermolysis of perfluorooctanoic acid. J. Fluor.Chem. 126, 1510–1516.
Lee, Y.C., Lo, S.L., Chiueh, P.T., Chang, D.G., 2009. Efficientdecomposition of perfluorocarboxylic acids in aqueoussolution using microwave-induced persulfate. Water Res. 43,2811–2816.
Lee, Y.C., Lo, S.L., Chiueh, P.T., Liou, Y.H., Chen, M.L., 2010.Microwave-hydrothermal decomposition of perfluorooctanoicacid in water by iron-activated persulfate oxidation. WaterRes. 44, 886–892.
Lee, Y.C., Lo, S.L., Kuo, J., Lin, Y.L., 2012. Persulfate oxidation ofperfluorooctanoic acid under the temperatures of 20–40degrees C. Chem. Eng. J. 198, 27–32.
Li, X.Y., Zhang, P.Y., Jin, L., Shao, T., Li, Z.M., Cao, J.J., 2012a.Efficient photocatalytic decomposition of perfluorooctanoicacid by indium oxide and its mechanism. Environ. Sci.Technol. 46, 5528–5534.
Li, Z.M., Zhang, P.Y., Shao, T., Li, X.Y., 2012b. In2O3
nanoporous nanosphere: a highly efficient photocatalyst fordecomposition of perfluorooctanoic acid. Appl. Catal. BEnviron. 125, 350–357.
Li, Z., Zhang, P., Shao, T., Wang, J., Jin, L., Li, X., 2013. Differentnanostructured In2O3 for photocatalytic decomposition ofperfluorooctanoic acid (PFOA). J. Hazard. Mater. 260, 40–46.
Lin, A.Y.-C., Panchangam, S.C., Chang, C.-Y., Hong, P.K.A., Hsueh,H.-F., 2012a. Removal of perfluorooctanoic acid andperfluorooctane sulfonate via ozonation under alkalinecondition. J. Hazard. Mater. 243, 272–277.
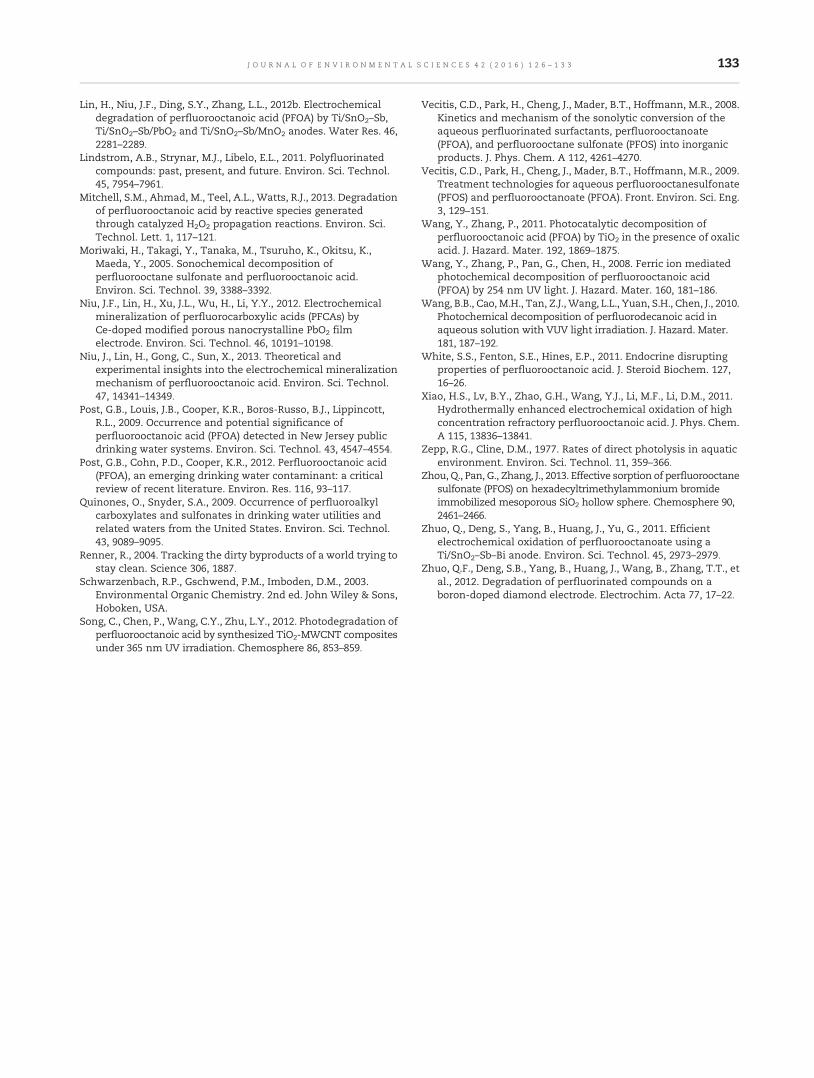
133J O U R N A L O F E N V I R O N M E N T A L S C I E N C E S 4 2 ( 2 0 1 6 ) 1 2 6 – 1 3 3
Lin, H., Niu, J.F., Ding, S.Y., Zhang, L.L., 2012b. Electrochemicaldegradation of perfluorooctanoic acid (PFOA) by Ti/SnO2–Sb,Ti/SnO2–Sb/PbO2 and Ti/SnO2–Sb/MnO2 anodes. Water Res. 46,2281–2289.
Lindstrom, A.B., Strynar, M.J., Libelo, E.L., 2011. Polyfluorinatedcompounds: past, present, and future. Environ. Sci. Technol.45, 7954–7961.
Mitchell, S.M., Ahmad, M., Teel, A.L., Watts, R.J., 2013. Degradationof perfluorooctanoic acid by reactive species generatedthrough catalyzed H2O2 propagation reactions. Environ. Sci.Technol. Lett. 1, 117–121.
Moriwaki, H., Takagi, Y., Tanaka, M., Tsuruho, K., Okitsu, K.,Maeda, Y., 2005. Sonochemical decomposition ofperfluorooctane sulfonate and perfluorooctanoic acid.Environ. Sci. Technol. 39, 3388–3392.
Niu, J.F., Lin, H., Xu, J.L., Wu, H., Li, Y.Y., 2012. Electrochemicalmineralization of perfluorocarboxylic acids (PFCAs) byCe-doped modified porous nanocrystalline PbO2 filmelectrode. Environ. Sci. Technol. 46, 10191–10198.
Niu, J., Lin, H., Gong, C., Sun, X., 2013. Theoretical andexperimental insights into the electrochemical mineralizationmechanism of perfluorooctanoic acid. Environ. Sci. Technol.47, 14341–14349.
Post, G.B., Louis, J.B., Cooper, K.R., Boros-Russo, B.J., Lippincott,R.L., 2009. Occurrence and potential significance ofperfluorooctanoic acid (PFOA) detected in New Jersey publicdrinking water systems. Environ. Sci. Technol. 43, 4547–4554.
Post, G.B., Cohn, P.D., Cooper, K.R., 2012. Perfluorooctanoic acid(PFOA), an emerging drinking water contaminant: a criticalreview of recent literature. Environ. Res. 116, 93–117.
Quinones, O., Snyder, S.A., 2009. Occurrence of perfluoroalkylcarboxylates and sulfonates in drinking water utilities andrelated waters from the United States. Environ. Sci. Technol.43, 9089–9095.
Renner, R., 2004. Tracking the dirty byproducts of a world trying tostay clean. Science 306, 1887.
Schwarzenbach, R.P., Gschwend, P.M., Imboden, D.M., 2003.Environmental Organic Chemistry. 2nd ed. John Wiley & Sons,Hoboken, USA.
Song, C., Chen, P., Wang, C.Y., Zhu, L.Y., 2012. Photodegradation ofperfluorooctanoic acid by synthesized TiO2-MWCNT compositesunder 365 nm UV irradiation. Chemosphere 86, 853–859.
Vecitis, C.D., Park, H., Cheng, J., Mader, B.T., Hoffmann, M.R., 2008.Kinetics and mechanism of the sonolytic conversion of theaqueous perfluorinated surfactants, perfluorooctanoate(PFOA), and perfluorooctane sulfonate (PFOS) into inorganicproducts. J. Phys. Chem. A 112, 4261–4270.
Vecitis, C.D., Park, H., Cheng, J., Mader, B.T., Hoffmann, M.R., 2009.Treatment technologies for aqueous perfluorooctanesulfonate(PFOS) and perfluorooctanoate (PFOA). Front. Environ. Sci. Eng.3, 129–151.
Wang, Y., Zhang, P., 2011. Photocatalytic decomposition ofperfluorooctanoic acid (PFOA) by TiO2 in the presence of oxalicacid. J. Hazard. Mater. 192, 1869–1875.
Wang, Y., Zhang, P., Pan, G., Chen, H., 2008. Ferric ion mediatedphotochemical decomposition of perfluorooctanoic acid(PFOA) by 254 nm UV light. J. Hazard. Mater. 160, 181–186.
Wang, B.B., Cao, M.H., Tan, Z.J.,Wang, L.L., Yuan, S.H., Chen, J., 2010.Photochemical decomposition of perfluorodecanoic acid inaqueous solution with VUV light irradiation. J. Hazard. Mater.181, 187–192.
White, S.S., Fenton, S.E., Hines, E.P., 2011. Endocrine disruptingproperties of perfluorooctanoic acid. J. Steroid Biochem. 127,16–26.
Xiao, H.S., Lv, B.Y., Zhao, G.H., Wang, Y.J., Li, M.F., Li, D.M., 2011.Hydrothermally enhanced electrochemical oxidation of highconcentration refractory perfluorooctanoic acid. J. Phys. Chem.A 115, 13836–13841.
Zepp, R.G., Cline, D.M., 1977. Rates of direct photolysis in aquaticenvironment. Environ. Sci. Technol. 11, 359–366.
Zhou, Q., Pan, G., Zhang, J., 2013. Effective sorption of perfluorooctanesulfonate (PFOS) on hexadecyltrimethylammonium bromideimmobilized mesoporous SiO2 hollow sphere. Chemosphere 90,2461–2466.
Zhuo, Q., Deng, S., Yang, B., Huang, J., Yu, G., 2011. Efficientelectrochemical oxidation of perfluorooctanoate using aTi/SnO2–Sb–Bi anode. Environ. Sci. Technol. 45, 2973–2979.
Zhuo, Q.F., Deng, S.B., Yang, B., Huang, J., Wang, B., Zhang, T.T., etal., 2012. Degradation of perfluorinated compounds on aboron-doped diamond electrode. Electrochim. Acta 77, 17–22.

J O U R N A L O F E N V I R O N M E N T A L S C I E N C E S 4 2 ( 2 0 1 6 ) 1 3 4 – 1 4 1
Ava i l ab l e on l i ne a t www.sc i enced i r ec t . com
ScienceDirect
www. jou rna l s . e l sev i e r . com/ j es
Mechanism of Methylene Blue adsorption on hybridlaponite-multi-walled carbon nanotube particles
Maryna Manilo1, Nikolai Lebovka1,⁎, Sandor Barany2,3
1. Institute of Biocolloidal Chemistry named after F.D. Ovcharenko, National Academy of Sciences of Ukraine, 42, Vernadsky blvd.,030142 Kyiv, Ukraine. E-mail: [email protected]. University of Miskolc, MTA-ME Materials Science Research Group and Institute of Chemistry, Hungary3. The Transcarpathian II. Ferenc Rakoczi Hungarian Institute, Beregovo, Ukraine
A R T I C L E I N F O
⁎ Corresponding author. E-mail: lebovka@gm
http://dx.doi.org/10.1016/j.jes.2015.06.0111001-0742/© 2015 The Research Center for Ec
A B S T R A C T
Article history:Received 7 April 2015Revised 10 June 2015Accepted 26 June 2015Available online 31 August 2015
The kinetics of adsorption and parameters of equilibrium adsorption of Methylene Blue(MB) on hybrid laponite-multi-walled carbon nanotube (NT) particles in aqueous suspen-sions were determined. The laponite platelets were used in order to facilitate disaggrega-tion of NTs in aqueous suspensions and enhance the adsorption capacity of hybrid particlesfor MB. Experiments were performed at room temperature (298 K), and the laponite/NTratio (Xl) was varied in the range of 0–0.5. For elucidation of the mechanism of MBadsorption on hybrid particles, the electrical conductivity of the system as well as theelectrokinetic potential of laponite-NT hybrid particles were measured. Three differentstages in the kinetics of adsorption of MB on the surface of NTs or hybrid laponite-NTparticles were discovered to be a fast initial stage I (adsorption time t = 0–10 min), a slowerintermediate stage II (up to t = 120 min) and a long-lasting final stage III (up to t = 24 hr).The presence of these stages was explained accounting for different types of interactionsbetween MB and adsorbent particles, as well as for the changes in the structure ofaggregates of NT particles and the long-range processes of restructuring of laponiteplatelets on the surface of NTs. The analysis of experimental data on specific surface areaversus the value of Xl evidenced in favor of the model with linear contacts between rigidlaponite platelets and NTs. It was also concluded that electrostatic interactions control thefirst stage of adsorption at low MB concentrations.© 2015 The Research Center for Eco-Environmental Sciences, Chinese Academy of Sciences.
Published by Elsevier B.V.
Keywords:Multi-walled carbon nanotubesLaponite plateletsMethylene BlueAdsorptionKineticsZeta potential
Introduction
Recent studies have shown the good potential of carbonnanotubes (NTs) for adsorptive purification of water contam-inated by toxic metals (Kabbashi et al., 2009; Adolph et al.,2012; Yu et al., 2013), organic matters (Bele, 2010; Lian et al.,2012) and synthetic dyes (Fugetsu et al., 2004; Gupta et al.,2013; Kerkez and Bayazit, 2014). Methylene Blue (MB) isfrequently used as amodel dye in investigations of adsorption
ail.com (Nikolai Lebovka)
o-Environmental Science
on carbon-based substances. The data on adsorption of MB bydifferent types of carbons (Wang et al., 2005; Kavitha andNamasivayam, 2007; Qada et al., 2008) and NTs (Yan et al.,2005; Qu et al., 2008; Shahryari et al., 2010; Madrakiana et al.,2011; Norzilah et al., 2011; Ma et al., 2012; Li et al., 2013;Szlachta and Wójtowicz, 2013; Tabrizi and Yavari, 2015) werealready reported.
The kinetic and equilibrium data for adsorption of MB onmulti-walled NTs at different temperatures were analyzed
.
s, Chinese Academy of Sciences. Published by Elsevier B.V.
135J O U R N A L O F E N V I R O N M E N T A L S C I E N C E S 4 2 ( 2 0 1 6 ) 1 3 4 – 1 4 1
(Shahryari et al., 2010). Adsorption equilibrium was attainedwithin ~2 hr. The estimated thermodynamic parameterssuggested that the process of MB adsorption on NTs wasspontaneous and endothermic. The same conclusions weredone from adsorption investigation of MB on NT-basedaerogel (Tabrizi and Yavari, 2015). Data on adsorption kineticsof MB onmulti-walled NTs revealed that adsorption was rapidin the initial stage and then followed by a slower process toreach the plateau value (Szlachta andWójtowicz, 2013). Studyof the adsorption of MB on single-walled NTs testified that thenature of adsorption is mainly determined by charge-transferand hydrophobic interactions (Yan et al., 2005). The presenceof solubilization of NTs and formation of MB–NT adsorptivenanostructures in water has been demonstrated. Adsorptionof MB on NTs at different pH was studied in details, and it wasconcluded that the adsorption mechanism may be due to π–πelectron donor acceptor interactions and electrostatic attrac-tion between positively charged dye ions and NTs (Li et al.,2013). The method of removal of MB from aqueous solutionusing multi-walled magnetic NTs was proposed (Qu et al.,2008; Madrakiana et al., 2011). The prepared magnetic NTscan be easily separated in magnetic field after they havebeen loaded with dye. The alkali-activated NTs demonstratedexcellent adsorption capacity for MB (399 mg/g). The effectswere attributed to the multiple adsorption interaction mech-anisms (hydrogen bonding, π–π and electrostatic interactions,etc.) (Ma et al., 2012).
The adsorption capacity of NTs forMB is increased after heattreatment and it is decreased after acid modification (Norzilahet al., 2011). It was demonstrated that the adsorption of MB onmodified NTs was mainly influenced by surface functionalgroups. Recently, a new type of hybrid adsorbent based onmulti-walledNTs covered by platelets of laponitewas described(Loginov et al., 2012). Stabilization of NTs in the presence oflaponite was explained by the formation of the hydrophiliccharged shells on the NTs surface. The presence of such shellswas recently visualized using high resolution transmissionelectron microscopy (TEM) technique (Manilo et al., 2015).Hydride laponite-NT adsorbent can be effectively used forremoval of MB from aqueous systems (Loginov et al., 2014).Moreover, the prepared hybrid adsorbent can be easily separat-ed using filtration after being loaded with dye. However, themechanism of adsorption of MB on the surface of hybridlaponite-NT adsorbent has not been fully understood yet.
The objective of this study is to investigate the mechanismof adsorption of MB onto hybrid laponite and NT particles inaqueous suspensions. The kinetics of adsorption and parame-ters of equilibriumadsorption at different values of laponite/NTratio were measured. For elucidation of the nature of MBadsorption onto hybrid particles the studies of electricalconductivity and electrophoretic mobility were also performed.
1. Experimental
1.1. Materials
The multi-walled carbon nanotubes (NTs) were producedby catalytic chemical vapor deposition (CVD) method in thepresence of Fe–Mo–Al catalyst (Specmash, Kyiv, Ukraine)
(Melezhyk et al., 2005). NTs were purified by annealing toseparate from the catalyst and mineral impurities, andtreated by aqueous solutions of alkali (NaOH) and hydrochlo-ric acid (HCl). Then samples were filtered to remove theexcess acid and repeatedly washed by distilled water until theconstant pH of ~7.5. The studied NTs were composed ofconcentric shells with inter-shell distance (dss) of 0.34 nm,their typical outer diameter (dn) of 10–20 nm, their length (ln)of 5–10 μm, and the number of walls within the range of ~6-8layers. The estimated density (ρn) of NTs decreases from 1.6 to~1 g/cm3, while their outer diameter increased from 10 to20 nm (Manilo et al., 2014). Typically, as-grown by CVDmethod the multi-walled carbon nanotubes have closedends and the internal surface is unavailable to the absorption(Yao et al., 2008). It was supported by the adsorption data. Thespecific surface area of NTs (Sn), experimentally determinedby nitrogen adsorption, was 254 ± 5 m2/g and was close tothe theoretically estimated value of the outer specific area(Manilo et al., 2014) which was calculated as follows:
Smn ¼ πdnln ≈ 260 m2=g:
The laponite RD (Rockwood Additives Ltd., Widnes, UK)is a typical synthetic swelling clay with the formula ofNa0.7[(Si8Mg5.5Li0.4)O20(OH)4]. It is composed of chargeddisk-like platelets with thickness (hl) about 1 nm and averagediameter (dl) about 25 nm (Zebrowski et al., 2003). The density oflaponite (ρl) is equal to 2.53 g/cm3 (Zebrowski et al., 2003).Taking into account the shape, size and density of the laponiteparticles, their specific surface area (Slm) may be theoreticallyestimated as:
Sml ¼ 2hlρl
≈ 791 m2=g:
This value noticeably exceeded the experimental value(359–368 m2/g) determined by N2 adsorption (Fripiat et al.,1982), or by H2O adsorption (345.1 m2/g) (Fripiat et al., 1982).The laponite platelets are charged highly heterogeneously inaqueous suspensions. Their faces have large negative charge,while smaller surface charge of their edges (~10% of the totalcharge) is pH-dependent and positive in acidic medium. Thenegative surface charge of laponite RD, defined as its cationexchange capacity (CEC), was equal to 0.75 meq/g.
Cationic dye Methylene Blue (MB) with molecular for-mula C16H18N3SCl (molecular weight (MMB) of 319.85 g/mol)was chosen as adsorbate. The molecule of MB can beregarded approximately as a rectangular volume of dimen-sions 1.7 nm × 0.76 nm × 0.325 nm with effective areas ofadsorption on face and edge surfaces equalling to 1.3 nm2
and 0.55 nm2, respectively (Johnson, 1957) (Fig. 1). The dyestock solution was prepared by dissolving the weightedsolid crystal-hydrate C16H18ClN3S·3H2O (Merck, Darmstadt,Germany), withMMB of 373.9 g/mol in distilled water tomake aconcentration of 100 mg/dm3. Then experimental solutionswere prepared by diluting stock solution with distilled waterto the designated concentration.
Hybrid laponite-NT systems were obtained by addition ofthe appropriate amounts of laponite and NTs to distilledwater and subsequent sonication of mixtures using ultrasonic
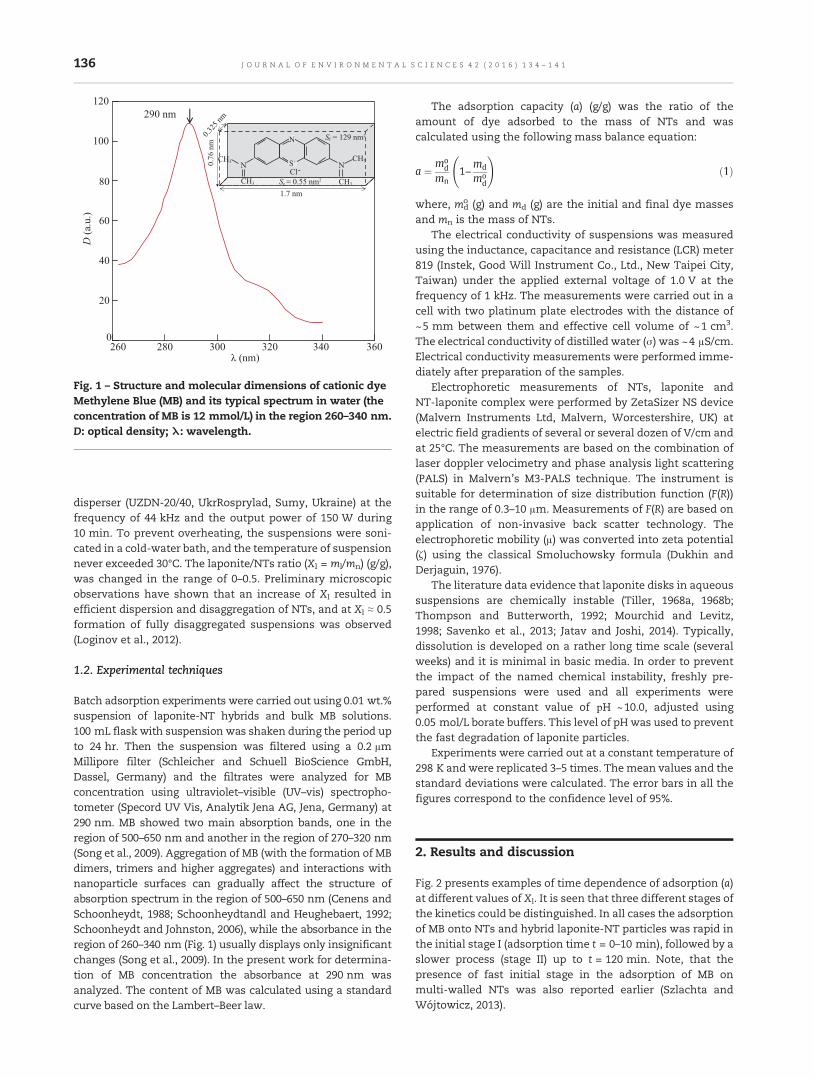
Fig. 1 – Structure and molecular dimensions of cationic dyeMethylene Blue (MB) and its typical spectrum in water (theconcentration of MB is 12 mmol/L) in the region 260–340 nm.D: optical density; λ: wavelength.
136 J O U R N A L O F E N V I R O N M E N T A L S C I E N C E S 4 2 ( 2 0 1 6 ) 1 3 4 – 1 4 1
disperser (UZDN-20/40, UkrRosprylad, Sumy, Ukraine) at thefrequency of 44 kHz and the output power of 150 W during10 min. To prevent overheating, the suspensions were soni-cated in a cold-water bath, and the temperature of suspensionnever exceeded 30°C. The laponite/NTs ratio (Xl = ml/mn) (g/g),was changed in the range of 0–0.5. Preliminary microscopicobservations have shown that an increase of Xl resulted inefficient dispersion and disaggregation of NTs, and at Xl ≈ 0.5formation of fully disaggregated suspensions was observed(Loginov et al., 2012).
1.2. Experimental techniques
Batch adsorption experiments were carried out using 0.01 wt.%suspension of laponite-NT hybrids and bulk MB solutions.100 mL flask with suspension was shaken during the period upto 24 hr. Then the suspension was filtered using a 0.2 μmMillipore filter (Schleicher and Schuell BioScience GmbH,Dassel, Germany) and the filtrates were analyzed for MBconcentration using ultraviolet–visible (UV–vis) spectropho-tometer (Specord UV Vis, Analytik Jena AG, Jena, Germany) at290 nm. MB showed two main absorption bands, one in theregion of 500–650 nm and another in the region of 270–320 nm(Song et al., 2009). Aggregation of MB (with the formation of MBdimers, trimers and higher aggregates) and interactions withnanoparticle surfaces can gradually affect the structure ofabsorption spectrum in the region of 500–650 nm (Cenens andSchoonheydt, 1988; Schoonheydtandl and Heughebaert, 1992;Schoonheydt and Johnston, 2006), while the absorbance in theregion of 260–340 nm (Fig. 1) usually displays only insignificantchanges (Song et al., 2009). In the present work for determina-tion of MB concentration the absorbance at 290 nm wasanalyzed. The content of MB was calculated using a standardcurve based on the Lambert–Beer law.
The adsorption capacity (a) (g/g) was the ratio of theamount of dye adsorbed to the mass of NTs and wascalculated using the following mass balance equation:
a ¼ mod
mn1−
md
mod
!ð1Þ
where, mdo (g) and md (g) are the initial and final dye masses
and mn is the mass of NTs.The electrical conductivity of suspensions was measured
using the inductance, capacitance and resistance (LCR) meter819 (Instek, Good Will Instrument Co., Ltd., New Taipei City,Taiwan) under the applied external voltage of 1.0 V at thefrequency of 1 kHz. The measurements were carried out in acell with two platinum plate electrodes with the distance of~5 mm between them and effective cell volume of ~1 cm3.The electrical conductivity of distilled water (σ) was ~4 μS/cm.Electrical conductivity measurements were performed imme-diately after preparation of the samples.
Electrophoretic measurements of NTs, laponite andNT-laponite complex were performed by ZetaSizer NS device(Malvern Instruments Ltd, Malvern, Worcestershire, UK) atelectric field gradients of several or several dozen of V/cm andat 25°C. The measurements are based on the combination oflaser doppler velocimetry and phase analysis light scattering(PALS) in Malvern's M3-PALS technique. The instrument issuitable for determination of size distribution function (F(R))in the range of 0.3–10 μm. Measurements of F(R) are based onapplication of non-invasive back scatter technology. Theelectrophoretic mobility (μ) was converted into zeta potential(ζ) using the classical Smoluchowsky formula (Dukhin andDerjaguin, 1976).
The literature data evidence that laponite disks in aqueoussuspensions are chemically instable (Tiller, 1968a, 1968b;Thompson and Butterworth, 1992; Mourchid and Levitz,1998; Savenko et al., 2013; Jatav and Joshi, 2014). Typically,dissolution is developed on a rather long time scale (severalweeks) and it is minimal in basic media. In order to preventthe impact of the named chemical instability, freshly pre-pared suspensions were used and all experiments wereperformed at constant value of рН ~10.0, adjusted using0.05 mol/L borate buffers. This level of pH was used to preventthe fast degradation of laponite particles.
Experiments were carried out at a constant temperature of298 K and were replicated 3–5 times. Themean values and thestandard deviations were calculated. The error bars in all thefigures correspond to the confidence level of 95%.
2. Results and discussion
Fig. 2 presents examples of time dependence of adsorption (a)at different values of Xl. It is seen that three different stages ofthe kinetics could be distinguished. In all cases the adsorptionof MB onto NTs and hybrid laponite-NT particles was rapid inthe initial stage I (adsorption time t = 0–10 min), followed by aslower process (stage II) up to t = 120 min. Note, that thepresence of fast initial stage in the adsorption of MB onmulti-walled NTs was also reported earlier (Szlachta andWójtowicz, 2013).

Fig. 2 – Typical time dependences of MB adsorption capacity(a) on laponite-NT hybrid particles at different values of thelaponite/NTs ratio (Xl) and equilibrium relative concentrationof dye (Xd). The chosen value of Xd approximately corre-sponds to that required for the monolayer adsorption at thegiven value of Xl. MB: Methylene Blue; NT: nanotube.
Fig. 3 – Adsorption capacity (a) versus equilibrium relativeconcentration of dye (Xd) at different values of the laponite/NTs ratio (Xl). Inset plot shows the initial section of isothermsat small Xd and different values of Xl. NT: nanotube.
137J O U R N A L O F E N V I R O N M E N T A L S C I E N C E S 4 2 ( 2 0 1 6 ) 1 3 4 – 1 4 1
It can be speculated that during stage I the adsorption ofMB on the most active centers on the surface of particles mayoccur. During this stage the adsorption was governed bystrong electrostatic interactions between positively chargedcation of MB+ and negatively charged surfaces of laponite andNTs. The negative charge of the faces of laponite originatesfrom the water–particle interactions as a result of hydrolysiswhile the negative charge of NTs is attributed to thedissociation of surface functional groups. According to FTIRspectra, the NT surface contained a small amount of hydroxyland carboxylic groups (Manilo et al., 2014). Moreover, MB is anideally planar molecule, and π–π stacking interactions be-tween the hexagonal skeleton of NTs and aromatic backboneof MB (Chen et al., 2007) may also be rather important at thisstage of adsorption.
Stage II corresponded to the slower rate of adsorption, andcould be explained by the presence of other types of surfaceadsorption sites. Note that the presence of initial rapid stage Iand later on slower process (stage II) was previously observedin adsorption kinetics of MB on multi-walled NTs (Szlachtaand Wójtowicz, 2013).
At longer time of adsorption (stage III) different behaviorsof the system were observed as a function of the Xl value.During stage III the value of a decreased continuously withtime for pure NTs (Xl = 0). This behavior can reflect the partialdesorption of MB from the surface of NTs at the late stage ofadsorption owing to the development of aggregation of NTparticles in aqueous medium. At small values of Xl (Xl = 0.1)the adsorbed amount (a) rapidly reached a plateau. At largervalues of Xl a continuous increase in awas observed for longertime and the plateau regime was reached at t = ~24 hr. Thetime required for attaining the adsorption equilibrium wasdependent upon the value of Xl, and it turned to be ~3 hr for
Xl = 0.1 and ~24 hr for Xl = 0.3 and 0.5. The long period of timenecessary to reach the adsorption equilibrium for Xl = 0.3 and0.5 can reflect the long-lasting processes of equilibration ofMB molecules that were initially not uniformly distributedbetween different adsorbent particles. The presence of thesimilar long-lasting processes of equilibration of the cationicsurfactant cetyltrimethylammonium bromide (CTAB) mole-cules on the surface of laponite was previously reported(Savenko et al., 2013).
Fig. 3 shows the adsorbed amount of MB (a) versusequilibrium relative concentration of dye (Xd, equalling tomd/mn) at different values of Xl. Analysis has shown that allisotherms can be successfully fitted by a Langmuir-typeequation:
aam
¼ KXd
1þ KXdð2Þ
where, the value of am corresponds to amonolayer adsorptionof MB and K is the equilibrium constant related to the freeenergy of adsorption.
It is interesting that at small values of Xd, the linearrelationships of a = KamXd for different values of Xl wereobserved with the same value of Kam = 0.0968 ± 0.0004 (with acoefficient of determination r2 = 0.999) (see inset in Fig. 3).
Fig. 4 demonstrates the values of monolayer adsorption(am) and specific surface area (S, m2/g) versus the value of Xd.The specific surface area of the hybrid laponite-NT particleswas calculated as (Itodo et al., 2010):
S ¼ amsNA=M≈2061am ð3Þ
where, s (1.3 nm2) is the face surface of one molecule ofМВ, NA (6.022 × 10²³ mol−1) is the Avogadro number and M(373.9 g/mol) is the molecular mass of the MB + 3H2O unit.

Fig. 4 – Dependence of monolayer adsorption (am) andspecific surface area (S) of the hybrid laponite-NT particles onthe value of the laponite/NTs ratio (Xl) estimated usingstretched (Ss) and linear (Sp) contact models. Dashed linecorresponds to the experimental data fitting by parabolicequation (Eq. (4)). NT: nanotube.
Fig. 5 – Size distribution function (F(R)) of hybrid systemsin water at different values of the laponite/NT ratio (Xl).R: particle sizes; NT: nanotube.
138 J O U R N A L O F E N V I R O N M E N T A L S C I E N C E S 4 2 ( 2 0 1 6 ) 1 3 4 – 1 4 1
Dependencies of monolayer adsorption on Xl can be wellfitted (with a coefficient of determination r2 = 0.9996) by thefollowing parabolic equation:
am ¼ 0:072� 0:002ð Þ þ 0:137� 0:021ð ÞXl
þ 0:289� 0:040ð ÞXl2: ð4Þ
At Xl = 0 (i.e., for pure NTs) the specific surface area of NTsin water was Sno ≈ 149 m2/g and it was noticeably smallerthan the maximally possible value (theoretically estimated),Snm ≈ 260 m2/g (Manilo et al., 2014). This can be explained byhigh aggregation of hydrophobic NT particles in water thatresults in screening of some portion of the surface of NTparticles. Moreover, some places on the NTs surface may notbe suitable for effective adsorption of MB dye. Adsorption ofMB on the surface of NTs is governed by different drivingforces, i.e., van der Waals attractive interaction, π–π stackinginteractions between aromatic rings of NTs and MB, andelectrostatic interactions between the cationic dye and thenegatively charged surface of NTs (Fugetsu et al., 2004).
Additional information on the contribution of differentforces into mechanism of MB adsorption onto laponite-NTscomplex particles can be extracted from electrokinetic andelectrical conductivity measurements of the system. Accord-ing to our electrokinetic data, at pH ~10.0 the laponite claydisks and NTs have negative charge and their zeta potentialvalues (ζ) turned to be −47 and −43 mV, respectively. Theobserved hetero-coagulation and formation of laponite-NTshybrid particles evidently reflect the presence of attractiveinteractions between similarly charged species. A number oftheoretical and experimental works have demonstrated thatunusual attractive interactions can exist for similarly andhighly charged colloidal particles (Lebovka, 2014). The ob-served hetero-coagulation between similarly charged NTs and
laponite clay disks can be related to highly heterogeneousdistribution of the negatively charged functional groups onthe surface of NTs. Also, the highly charged laponite disk canbe effectively immobilized on the neutral fraction of the NTsurface due to strong attraction between it and the equivalentimage charge, produced in the conductive surface of NT (Leiteet al., 2012).
An increase ofXl from 0 to 1 caused amonotonic decrease ofthe negative ζ of laponite-NT hybrid particles (value of ζchanged from −40 to −32 mV), and the value of zeta potentialreached saturation at the level of −31 mV at Xl ≥ 0.4. Theobserved behavior of the zeta potential reflects the immobili-zation of laponite platelets on the surface of NTs and formationof hybrid laponite-NT particles. Summarizing the electrokineticdata, one can say that adsorption/heteroadagulation of laponitedisks onto NT stabilizes the nanotubes suspension as a result ofhydrophilization of their surface, and gives some (by about 20%)decrease of the negative electrokinetic potential of nanotubes;at the same time their zeta potential values remain highenough to facilitate the adsorption of cationic dye due toCoulomb interactions.
The size distribution functions F(R) for the studied systemsrevealed the presence of species with different sizes dependingon the value of Xl (Fig. 5). At small value of Xl, three distinctivespecies were observed, i.e., large aggregates of non-stabilizedNTs (R ≈ 2–3 μm), intermediate aggregates of partially stabilizedNTs (R ≈ 0.3–1 μm) and smaller species (100–200 nm) that canbe attributed to the stabilized NT-laponite hybrid particles. Athigher concentration of laponite (Xl = 0.3–0.5), single specieswith the size of 200–300 nm were observed. However, at largerratio (Xl = 0.7), twodifferent species that can be attributed to thestabilized NT-laponite hybrid particles (200–700 nm) and freelaponite clay disks not coupled with NTs (40–100 nm) wereobserved. The adsorption data in the present work wereobtained for the range of Xl ≤ 0.5, where the fraction of thefree laponite disks was insignificant.

Fig. 6 – Electrical conductivity (σ) of MB and 0.1 wt.% laponitesuspension versus the concentration of MB (Cd) in theabsence (sample A) and presence (sample B, Xl = 0.5) of NTs.Cdc : inflection point. Methylene Blue: MB.
139J O U R N A L O F E N V I R O N M E N T A L S C I E N C E S 4 2 ( 2 0 1 6 ) 1 3 4 – 1 4 1
The surface area of the hybrid laponite-NT particles candepend on the model of association between laponite and NTparticles. The total mass of hybrid particles was equal tomn + ml. The surface of hybrid particles was approximatelyequal to the surface of pure NTs for the stretched contactbetween laponite and NT (the flexible platelet wraps the tube),i.e., it was equal to the sum of the surface of NTs and laponiteparticles for the linear contact between particles (the rigidplatelet contacts with tube) (Fig. 4).
As a rough approximation we can assume that atXl ≤ Xl
m = 0.5Xl, the NT specific surface area linearly growswith Xl as:
Sn ¼ Son þ Smn −Son
� �Xl=X
ml ð5Þ
where, Sno (~149 m2/g) and Snm (~260 m2/g) (Manilo et al., 2014)are the surface areas at Xl = 0 and Xl = Xl
m, respectively.The specific surface area of the hybrid laponite + NT
particles for the stretched (Ss) and the linear contact models(Sp) can be estimated as
Ss ¼ Sn= 1þ Xlð Þ ð6Þ
Sp ¼ Sn þ Sml Xl� �
= 1þ Xlð Þ ð7Þ
respectively. Here, Slm of 791 m2/g is the theoretically estimat-ed surface area for laponite.
The dependences of Ss and Sp on Xl are presented in Fig. 4.The linear contact model gave overestimated values and wasmore appropriated for description of the experimental datathan the stretched contact model.
It is interesting to estimate the contribution of laponitesurface charges to adsorption of MB on hybrid laponite-NTparticles. Accounting for the cation exchange capacity (CEC) offaces of laponite (0.75 meq/g), the degree of coverage of facesby MB+ ions (fMB+) can be estimated as:
fMBþ ¼ 1000= 0:75MMBð Þ ¼ 3:57Cd=Cl ¼ 3:57Xd=Xl: ð8Þ
Thismeans that the total covering of faces ( fMB+ = 1) requiresXd ≈ 0.084 for Xl = 0.3 and Xd ≈ 0.14 for Xl = 0.5. The estimatedvalues were noticeably smaller as compared to those requiredfor formation ofmonolayer ofMB. The experimental adsorptiondata evidenced that Xd ≈ 1.5 for Xl = 0.3 and Xd ≈ 3.4 for Xl = 0.5(Fig. 3). It can be assumed that mechanism of charge governedadsorption of MB on the laponite-NT hybrid particles is notessential for the studied systems.
To check this assumption the electrical conductivity (σ) ofMB and of 0.1 wt.% laponite suspension versus the concentra-tion of MB (Cd) in the absence (sample A) and presence (sampleB,Xl = 0.5) ofNTswasdone (Fig. 6). At small concentrationofMB(below inflection point (Cd
c), i.e., Cd ≤ Cdc ≈ 0.03 wt.%), the electri-
cal conductivity of samples A and B exceeded the electricalconductivity of MB and was weakly dependent upon the valueof Cd. However, above Cd
c the strong dependence of σ on Cd forboth samples A and B were observed. At Cl = 0.1 wt.%, Eq. (8)gives Cd ≈ 0.028 wt.% that is close to the inflection points ofcurves σ(Cd) at Cd ≈ Cd
c = 0.03 wt.%. Thus, such behavior can beexplained by strong adsorption of mobile MB+ ions on thenegatively charged faces of laponite particles.
At high concentrations of MB, i.e., Cd > 0.5 wt.%, electricalconductivity of the sample B (0.1 wt.% of laponite and 0.2 wt.%of NTs) was noticeably smaller than that for MB solution or thesample A (0.1 wt.% of laponite). This evidently reflects thestronger binding of the cations of MB on the surface of hybridlaponite-NT particles.
3. Conclusions
Three different stages in the kinetics of adsorption of MB onthe surface of NTs or hybrid laponite-NT particles werediscovered, i.e., the fast initial stage I (t = 0–10 min), slowerintermediate stage II (up to t = 120 min) and the long-durationfinal stage III (up to t = 24 hr). The presence of these stagesmay be explained by different types of interactions betweenMB and adsorbent particles, as well as by the charges instructure of aggregates of NT particles and the long-lastingprocesses of equilibration of CB molecules that were initiallynonuniformly distributed between different adsorbent parti-cles. The laponite platelets cover the surface of NTs andfacilitates their dispersing in water (Loginov et al., 2012).Moreover, the hybrid laponite-NT particles have the highervalues of monolayer adsorption capacity than that for theoriginal NTs (Loginov et al., 2014). The analysis of specificsurface area (S) versus the laponite/NT ratio (Xl) evidenced infavor of the model with linear contacts between rigid laponiteplatelets and NTs. The model of stretched contact, when theflexible laponite particle wraps around the surface of NT,failed to give appropriate estimation of S. The electricalconductivity data evidenced that electrostatic interactionscontrolled the adsorption at small concentrations of MB, andthe stronger binding of the MB cations of on the surface ofhybrid laponite-NT particles was observed.
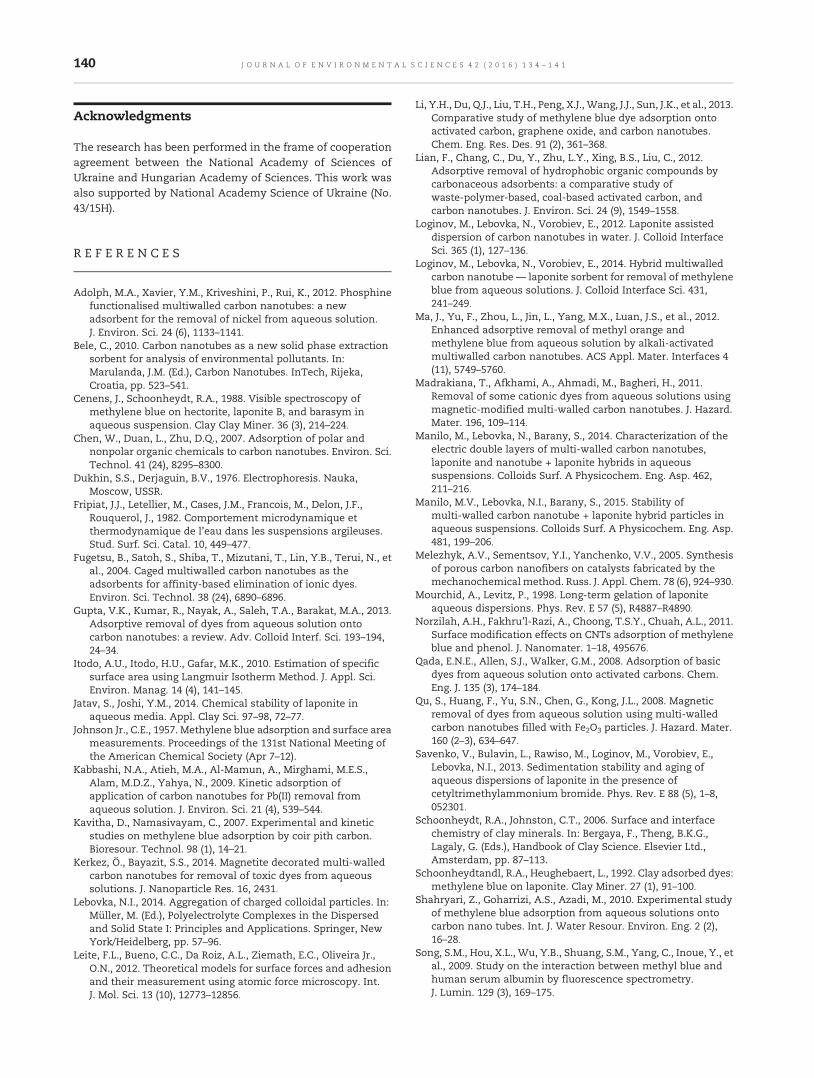
140 J O U R N A L O F E N V I R O N M E N T A L S C I E N C E S 4 2 ( 2 0 1 6 ) 1 3 4 – 1 4 1
Acknowledgments
The research has been performed in the frame of cooperationagreement between the National Academy of Sciences ofUkraine and Hungarian Academy of Sciences. This work wasalso supported by National Academy Science of Ukraine (No.43/15H).
R E F E R E N C E S
Adolph, M.A., Xavier, Y.M., Kriveshini, P., Rui, K., 2012. Phosphinefunctionalised multiwalled carbon nanotubes: a newadsorbent for the removal of nickel from aqueous solution.J. Environ. Sci. 24 (6), 1133–1141.
Bele, C., 2010. Carbon nanotubes as a new solid phase extractionsorbent for analysis of environmental pollutants. In:Marulanda, J.M. (Ed.), Carbon Nanotubes. InTech, Rijeka,Croatia, pp. 523–541.
Cenens, J., Schoonheydt, R.A., 1988. Visible spectroscopy ofmethylene blue on hectorite, laponite B, and barasym inaqueous suspension. Clay Clay Miner. 36 (3), 214–224.
Chen, W., Duan, L., Zhu, D.Q., 2007. Adsorption of polar andnonpolar organic chemicals to carbon nanotubes. Environ. Sci.Technol. 41 (24), 8295–8300.
Dukhin, S.S., Derjaguin, B.V., 1976. Electrophoresis. Nauka,Moscow, USSR.
Fripiat, J.J., Letellier, M., Cases, J.M., Francois, M., Delon, J.F.,Rouquerol, J., 1982. Comportement microdynamique etthermodynamique de l'eau dans les suspensions argileuses.Stud. Surf. Sci. Catal. 10, 449–477.
Fugetsu, B., Satoh, S., Shiba, T., Mizutani, T., Lin, Y.B., Terui, N., etal., 2004. Caged multiwalled carbon nanotubes as theadsorbents for affinity-based elimination of ionic dyes.Environ. Sci. Technol. 38 (24), 6890–6896.
Gupta, V.K., Kumar, R., Nayak, A., Saleh, T.A., Barakat, M.A., 2013.Adsorptive removal of dyes from aqueous solution ontocarbon nanotubes: a review. Adv. Colloid Interf. Sci. 193–194,24–34.
Itodo, A.U., Itodo, H.U., Gafar, M.K., 2010. Estimation of specificsurface area using Langmuir Isotherm Method. J. Appl. Sci.Environ. Manag. 14 (4), 141–145.
Jatav, S., Joshi, Y.M., 2014. Chemical stability of laponite inaqueous media. Appl. Clay Sci. 97–98, 72–77.
Johnson Jr., C.E., 1957. Methylene blue adsorption and surface areameasurements. Proceedings of the 131st National Meeting ofthe American Chemical Society (Apr 7–12).
Kabbashi, N.A., Atieh, M.A., Al-Mamun, A., Mirghami, M.E.S.,Alam, M.D.Z., Yahya, N., 2009. Kinetic adsorption ofapplication of carbon nanotubes for Pb(II) removal fromaqueous solution. J. Environ. Sci. 21 (4), 539–544.
Kavitha, D., Namasivayam, C., 2007. Experimental and kineticstudies on methylene blue adsorption by coir pith carbon.Bioresour. Technol. 98 (1), 14–21.
Kerkez, Ö., Bayazit, S.S., 2014. Magnetite decorated multi-walledcarbon nanotubes for removal of toxic dyes from aqueoussolutions. J. Nanoparticle Res. 16, 2431.
Lebovka, N.I., 2014. Aggregation of charged colloidal particles. In:Müller, M. (Ed.), Polyelectrolyte Complexes in the Dispersedand Solid State I: Principles and Applications. Springer, NewYork/Heidelberg, pp. 57–96.
Leite, F.L., Bueno, C.C., Da Roіz, A.L., Ziemath, E.C., Oliveira Jr.,O.N., 2012. Theoretical models for surface forces and adhesionand their measurement using atomic force microscopy. Int.J. Mol. Sci. 13 (10), 12773–12856.
Li, Y.H., Du, Q.J., Liu, T.H., Peng, X.J., Wang, J.J., Sun, J.K., et al., 2013.Comparative study of methylene blue dye adsorption ontoactivated carbon, graphene oxide, and carbon nanotubes.Chem. Eng. Res. Des. 91 (2), 361–368.
Lian, F., Chang, C., Du, Y., Zhu, L.Y., Xing, B.S., Liu, C., 2012.Adsorptive removal of hydrophobic organic compounds bycarbonaceous adsorbents: a comparative study ofwaste-polymer-based, coal-based activated carbon, andcarbon nanotubes. J. Environ. Sci. 24 (9), 1549–1558.
Loginov, M., Lebovka, N., Vorobiev, E., 2012. Laponite assisteddispersion of carbon nanotubes in water. J. Colloid InterfaceSci. 365 (1), 127–136.
Loginov, M., Lebovka, N., Vorobiev, E., 2014. Hybrid multiwalledcarbon nanotube — laponite sorbent for removal of methyleneblue from aqueous solutions. J. Colloid Interface Sci. 431,241–249.
Ma, J., Yu, F., Zhou, L., Jin, L., Yang, M.X., Luan, J.S., et al., 2012.Enhanced adsorptive removal of methyl orange andmethylene blue from aqueous solution by alkali-activatedmultiwalled carbon nanotubes. ACS Appl. Mater. Interfaces 4(11), 5749–5760.
Madrakiana, T., Afkhami, A., Ahmadi, M., Bagheri, H., 2011.Removal of some cationic dyes from aqueous solutions usingmagnetic-modified multi-walled carbon nanotubes. J. Hazard.Mater. 196, 109–114.
Manilo, M., Lebovka, N., Barany, S., 2014. Characterization of theelectric double layers of multi-walled carbon nanotubes,laponite and nanotube + laponite hybrids in aqueoussuspensions. Colloids Surf. A Physicochem. Eng. Asp. 462,211–216.
Manilo, M.V., Lebovka, N.I., Barany, S., 2015. Stability ofmulti-walled carbon nanotube + laponite hybrid particles inaqueous suspensions. Colloids Surf. A Physicochem. Eng. Asp.481, 199–206.
Melezhyk, A.V., Sementsov, Y.I., Yanchenko, V.V., 2005. Synthesisof porous carbon nanofibers on catalysts fabricated by themechanochemical method. Russ. J. Appl. Chem. 78 (6), 924–930.
Mourchid, A., Levitz, P., 1998. Long-term gelation of laponiteaqueous dispersions. Phys. Rev. E 57 (5), R4887–R4890.
Norzilah, A.H., Fakhru'l-Razi, A., Choong, T.S.Y., Chuah, A.L., 2011.Surface modification effects on CNTs adsorption of methyleneblue and phenol. J. Nanomater. 1–18, 495676.
Qada, E.N.E., Allen, S.J., Walker, G.M., 2008. Adsorption of basicdyes from aqueous solution onto activated carbons. Chem.Eng. J. 135 (3), 174–184.
Qu, S., Huang, F., Yu, S.N., Chen, G., Kong, J.L., 2008. Magneticremoval of dyes from aqueous solution using multi-walledcarbon nanotubes filled with Fe2O3 particles. J. Hazard. Mater.160 (2–3), 634–647.
Savenko, V., Bulavin, L., Rawiso, M., Loginov, M., Vorobiev, E.,Lebovka, N.I., 2013. Sedimentation stability and aging ofaqueous dispersions of laponite in the presence ofcetyltrimethylammonium bromide. Phys. Rev. E 88 (5), 1–8,052301.
Schoonheydt, R.A., Johnston, C.T., 2006. Surface and interfacechemistry of clay minerals. In: Bergaya, F., Theng, B.K.G.,Lagaly, G. (Eds.), Handbook of Clay Science. Elsevier Ltd.,Amsterdam, pp. 87–113.
Schoonheydtandl, R.A., Heughebaert, L., 1992. Clay adsorbed dyes:methylene blue on laponite. Clay Miner. 27 (1), 91–100.
Shahryari, Z., Goharrizi, A.S., Azadi, M., 2010. Experimental studyof methylene blue adsorption from aqueous solutions ontocarbon nano tubes. Int. J. Water Resour. Environ. Eng. 2 (2),16–28.
Song, S.M., Hou, X.L., Wu, Y.B., Shuang, S.M., Yang, C., Inoue, Y., etal., 2009. Study on the interaction between methyl blue andhuman serum albumin by fluorescence spectrometry.J. Lumin. 129 (3), 169–175.

141J O U R N A L O F E N V I R O N M E N T A L S C I E N C E S 4 2 ( 2 0 1 6 ) 1 3 4 – 1 4 1
Szlachta, M., Wójtowicz, P., 2013. Adsorption of methylene blueand Congo red from aqueous solution by activated carbon andcarbon nanotubes. Water Sci. Technol. 68 (10), 2240–2248.
Tabrizi, N.S., Yavari, M., 2015. Methylene blue removal by carbonnanotube-based aerogels. Chem. Eng. Res. Des. 94, 516–523.
Thompson, D.W., Butterworth, J.T., 1992. The nature of laponiteand its aqueous dispersions. J. Colloid Interface Sci. 151 (1),236–243.
Tiller, K.G., 1968a. Stability of hectorite in weakly acidic solutionsI. A chemical study of the dissolution of hectorite with specialreference to the release of silica. Clay Miner. 7 (3), 245–259.
Tiller, K.G., 1968b. Stability of hectorite in weakly acidic solutionsII. Studies of the chemical equilibrium and the calculation offree energy. Clay Miner. 7 (3), 261–270.
Wang, S.B., Zhu, Z.H., Coomes, A., Haghseresht, F., Lu, G.Q., 2005.The physical and surface chemical characteristics of activatedcarbons and the adsorption of methylene blue fromwastewater. J. Colloid Interface Sci. 284 (2), 440–446.
Yan, Y.M., Zhang, M.N., Gong, K.P., Su, L., Guo, Z.X., Mao, L.Q.,2005. Adsorption of methylene blue dye onto carbonnanotubes: a route to an electrochemically functionalnanostructure and its layer-by-layer assemblednanocomposite. Chem. Mater. 17 (13), 3457–3463.
Yao, Y.J., Zhang, S.P., Yan, Y.J., 2008. CVD synthesis and hydrogenstorage properties of multi-walled carbon nanotubes.Proceedings of the 2nd IEEE International NanoelectronicsConference, 2008. INEC 2008. Shanghai, China, pp. 140–143(Mar 24–27).
Yu, F., Wu, Y.Q., Ma, J., Zhang, C., 2013. Adsorption of lead onmulti-walled carbon nanotubes with different outerdiameters and oxygen contents: kinetics, isotherms andthermodynamics. J. Environ. Sci. 25 (1), 195–203.
Zebrowski, J., Prasad, V., Zhang, W., Walker, L.M., Weitz, D.A.,2003. Shake-gels: shear-induced gelation of laponite–PEOmixtures. Colloids Surf. A Physicochem. Eng. Asp. 213 (2–3),189–197.

J O U R N A L O F E N V I R O N M E N T A L S C I E N C E S 4 2 ( 2 0 1 6 ) 1 4 2 – 1 5 1
Ava i l ab l e on l i ne a t www.sc i enced i r ec t . com
ScienceDirect
www. jou rna l s . e l sev i e r . com/ j es
Deposition behavior of residual aluminum in drinking waterdistribution system: Effect of aluminum speciation
Yue Zhang1, Baoyou Shi1,⁎, Yuanyuan Zhao1, Mingquan Yan2,Darren A. Lytle3, Dongsheng Wang1
1. Key Laboratory of Drinking Water Science and Technology, Research Center for Eco-Environmental Sciences, Chinese Academy of Sciences,Beijing 100085, China. E-mail: [email protected]. College of Environmental Sciences and Engineering, Peking University, Beijing 100871, China3. U.S. Environmental Protection Agency, Cincinnati, OH 45268, USA
A R T I C L E I N F O
⁎ Corresponding author. E-mail: byshi@rcees.
http://dx.doi.org/10.1016/j.jes.2015.05.0101001-0742/© 2015 The Research Center for Ec
A B S T R A C T
Article history:Received 31 March 2015Revised 15 May 2015Accepted 28 May 2015Available online 6 July 2015
Finished drinking water usually contains some residual aluminum. The deposition of residualaluminum in distribution systems and potential release back to the drinking water couldsignificantly influence the water quality at consumer taps. A preliminary analysis of aluminumcontent in cast iron pipe corrosion scales and loose deposits demonstrated that aluminumdeposition on distribution pipe surfaces could be excessive for water treated by aluminumcoagulants including polyaluminum chloride (PACl). In this work, the deposition features ofdifferent aluminum species in PACl were investigated by simulated coil-pipe test, batch reactortest and quartz crystal microbalance with dissipation monitoring. The deposition amount ofnon-polymeric aluminum species was the least, and its deposition layer was soft and hydrated,which indicated the possible formation of amorphous Al(OH)3. Al13 had the highest depositiontendency, and the deposition layer was rigid and much less hydrated, which indicated that thedeposited aluminum might possess regular structure and self-aggregation of Al13 could be themain deposition mechanism. While for Al30, its deposition was relatively slower and depositedaluminumamountwas relatively less comparedwith Al13. However, the total depositedmass ofAl30 was much higher than that of Al13, which was attributed to the deposition of particulatealuminum matters with much higher hydration state. Compared with stationary condition,stirring could significantly enhance the deposition process, while the effect of pH on depositionwas relatively weak in the near neutral range of 6.7 to 8.7.© 2015 The Research Center for Eco-Environmental Sciences, Chinese Academy of Sciences.
Published by Elsevier B.V.
Keywords:Aluminum depositionDrinking water distribution systemPolyaluminum chloride (PACl)Quartz crystal microbalance
Introduction
Aluminum is one of the commonmetallic elements in naturalwater, and its concentration in drinking water is generallyrestricted by regulations all over the world. However, thefactors influencing the concentration of aluminum in tapwater are very complicated. Meeting the drinking waterquality standards of aluminum is a great challenge for many
ac.cn (Baoyou Shi).
o-Environmental Science
water utilities. Based on one investigation of drinking waterquality in some cities of China, aluminum concentrationcollected from tap water could significantly exceed thestandard limit of 0.2 mg/L (according to Chinese standardsfor drinking water quality, GB 5749-2006) (Li et al., 2013).Elevated levels of aluminumhave been associated with healthproblems. For example, bone disorders were testified to berelated with aluminum among dialysis dependent patients
s, Chinese Academy of Sciences. Published by Elsevier B.V.

Table 1 –Al concentration and speciation of stock solutions.
Concentration(10−3 mol/L)
Ala (%) Alb (%) Alc (%)
Alo 50.00 92.68 7.06 0.26Al13 21.62 13.10 83.35 3.55Al30 28.67 7.07 7.05 85.88
143J O U R N A L O F E N V I R O N M E N T A L S C I E N C E S 4 2 ( 2 0 1 6 ) 1 4 2 – 1 5 1
(Dahl et al., 2014). Additionally, aluminum accumulated inhumans may cause severe nervous system diseases, suchas Alzheimer's disease, amyotrophic lateral sclerosis andParkinson's dementia (Dzulfakar et al., 2011).
The source of aluminum in finished drinking water mayoriginate from raw water or be introduced from Al-basedcoagulants (Snoeyink et al., 2003). Previous investigations onresidual aluminum conducted in China, the United States andthe Europe, showed that aluminum salts used for coagulationcould increase residual aluminum content significantly (Wanget al., 2010b). Polyaluminum chloride (PACl), has been widelyapplied as coagulants in drinking water treatment (Lin et al.,2014) due to itsmany advantages, such as being effectivewithina broader pH range, rapid aggregation and sedimentation of itsflocs (Gao et al., 2002).
Various aluminum hydrolysis products exist in PACl, includ-ing Al3+, Al(OH)2+, Al2(OH)24+, Al3(OH)45+, AlO4Al12(OH)24(H2O)127+
(Keggin-Al13 species), [Al30O8(OH)56(H2O)24]18+ (Al30 polymer) andAl(OH)3 (Xu et al., 2011). The coagulation efficiency of PACl ishighly related to its aluminum speciation, andAl13 is claimed asthe most efficient species for coagulation in PACl (Hu et al.,2006). The detrimental effects of aluminum on humans are alsohighly related to its specific species (Wang et al., 2010a). Asdissolved aluminumcould be assimilated immediately, it showshigh cytotoxicity to both animal and plant (Szatanik-Kloc andJozefaciuk, 2007). Themononuclear aluminumform is known tobe severelyneurotoxic because it canaccelerate the formationofneurofibrillary tangles and senile plaques in the brain. While,the toxicity of polynuclear aluminum is relatively small as aresult of its slow dissociation process (Wang et al., 2010c). How-ever, it is currently not clear on the transformation and fate ofresidual aluminum with different speciation in finished waterfrom the treatment plant to the consumer taps.
It has been reported that aluminumubiquitously existed incorrosion scales and loose deposits within cast iron pipes,lead pipes, plastic pipes and cement-mortar lined pipes(Snoeyink et al., 2003). The aluminum accumulated in pipescale and sediments may release back into bulk water oncethe water chemistry or hydraulic condition changes, whichcould result in relatively high aluminum content in tap water.Furthermore, severe deposition of aluminum might weakendisinfection efficiency, increase turbidity and interfere watertransport capacity.
In order to control residual aluminum concentration indrinking water, many studies were conducted and differentmeasures were proposed. However, most previous researchfocused on the optimization of coagulant dosage and coagu-lation condition, the investigation of aluminum transforma-tion and deposition in drinking water distribution systemwasrelatively rare. To our knowledge, study on the migration andtransformation of different aluminum species in pipe distri-bution process has not been reported.
The main objective of this work was to understand thedeposition features of different aluminum species on pipesurface, particularly on inert interface. Aluminum content inreal distribution pipe corrosion scales and loose deposits,obtained from two cities with different source water types,was firstly analyzed. The deposition behavior of differentaluminum species was systematically investigated using bothsimulated coil-pipe test and batch reactor test. QCM-D (Quartz
Crystal Microbalance with Dissipation Monitoring) techniquewas applied to explore the characteristics of deposition layerformed between different aluminum species and inert inter-face. The influence of hydraulic condition (stagnant vs. stirring)and pH (within neutral range) on the deposition behavior ofdifferent aluminum species were also observed. The depositionmechanism of different aluminum species was discussed.
1. Materials and methods
1.1. Analysis of aluminum content in real water distributionpipe scales and deposits
Cast iron pipe and plastic pipe sections were obtained from anorthern and a southern city of China. Pipe corrosion scalesand loose deposits were collected, respectively, where avail-able. Totally 76 samples were collected from the northern city,among them 67 samples were hard iron corrosion scales, 9samples were surficial loose deposits. Fifteen samples werecollected from the southern city, 6 hard iron corrosion scalesamples and 9 surficial loose deposit samples (including 3from plastic pipes). Aluminum content in these two typescales were analyzed using XRF (X-ray Fluorescence, Advant'XP, Thermo Electron, Ecublens, Switzerland) and the pretreat-ment procedures were performed according to the report ofYang et al. (2012).
1.2. Preparation of stock solutions with different aluminumspecies
Three stock solutions Alo, Al13 andAl30 with different aluminumspeciation were prepared as follows. Their total aluminum con-centration and speciation are provided in Table 1. All reagentsusedwere of analytical grade. Milli-Qwater was used to rinse allreactors and to prepare all solutions.
For Alo solution, a measured amount of AlCl3 was directlydissolved into 100 mL milli-Q water. Such solution was domi-nated bymonomeric aluminumand someoligomeric aluminumspecies. For Al13, firstly, PACl with basicity (OH/Al, molar ratio)2.0 was prepared by base titration method. 0.5 mol/L NaOH wasslowly titrated into a predetermined amount of AlCl3 solutionunder magnetic stirring. The obtained PACl solution was mixedwith Na2SO4, settled for 24 hr, then filtered to obtain theprecipitate. Then 0.1 mol/L BaCl2 was added to the precipitate,rapid stirring for 3 hr. The supernatant was filtered by 0.45 μmmembranes after 10 min settlement to obtain purified Al13polymer (Xu et al., 2014). For Al30 solution, 1.0 mol/L AlCl3solution with a measured amount of Na2CO3 was mixed toobtain a molar ratio of Na2CO3/Al3+ = 1.15, then heated at 80°Ctill the precipitation dissolved. After settling for 12 hr the

144 J O U R N A L O F E N V I R O N M E N T A L S C I E N C E S 4 2 ( 2 0 1 6 ) 1 4 2 – 1 5 1
solution was diluted 10 times to obtain PACl with basicity 2.3.Then the solution was heated again for 48 hr at 95°C. Ameasured amount of Na2SO4 was added with molar ratio ofSO4
2−/Al3+ = 0.33 and settled for one week. The obtained precip-itate was mixed with Ba(NO3)2 solution, and ultrasonicallyvibrated for 30 min, settled for 4 hr. Finally, the supernatantwas filtered by 0.45-μm membranes to obtain purified Al30polymer (Duan et al., 2014).
1.3. Aluminum speciation characterization
In this work, for each collected water sample, total aluminumand dissolved aluminum concentrationswere directly obtainedthrough membrane separation, then the amount of depositedaluminum was calculated based on the initial dosage. Theseparation procedure is illustrated in Appendix A Fig. S1. Ferrontimed complex-colorimetric method was applied to classifysoluble aluminum as Ala (reacted within 1 min with ferron;including monomeric and oligomeric aluminum(denoted as“Alo” in this work)), Alb (reacted from 1 min to 120 min;including medium polymeric aluminum, which is almostequivalent to Al13), andAlc (slow-reacting colloidal or unreactedspecies; in Al30 stock solution, Alc was the main constituent)(Wang et al., 2004).
1.4. Coil-pipe test
To examine aluminum species variation in drinking waterdistribution system (mainly on inert interface), coil-pipe testwas operated using plastic pipes. The definition of inertinterface presented in this work is material with chargeneutral, chemically inactive, and hard to react with othersubstances (including plastic pipe in coil-pipe test, beaker inbatch test, quartz crystal sensor with gold-coated surface inQCM-D characterization).
Synthetic testwaterwaspreparedbydilutingAlo, Al13 andAl30stock solutions, respectively, using Milli-Q water to obtain initialtotal aluminum concentration of 0.2 mg/L according to WHOguidelines (2004). Besides, the test water contained 0.5 mmol/LNaHCO3and0.5 mmol/LNaNO3 to achieve certain buffer capacityand ionic strength. ThepHof the testwaterwas adjusted to 7.7 byaddingHCl andNaOHsolutions. Synthetic testwaterwas stockedin the tank with 300 r/min magnetic stirring.
The plastic pipes were 10 m long, with 6 mm innerdiameter. Peristaltic pump was used to drive Alo, Al13 andAl30 containing test water into the coil pipe. The flow rate wasadjusted to achieve 8 hr of hydraulic retention time (from theinlet to outlet) in the pipe. After running for 8 hr, water waskept stagnant in pipes for 16 hr. Water samples were collectedeach day after 16 hr stagnation during flowing period. Eachoperation cycle was 7 days. The schematic graph of coil-pipetest is shown in Appendix A Fig. S2.
1.5. Batch test
The aluminum variation for the coil-pipe test consisted of twoparts, that is, variation in the feed solution tank and variationin the pipe. To further elucidate the deposition behavior ofdifferent aluminum species, and testify the findings of coil-pipetest, a well-controlled batch test was established and the
variation of different aluminum species was observed in glassbeaker reactors. Additionally, stationary and magnetic stirring(300 r/min) conditions were applied to compare the effect ofhydraulic condition.
Alo, Al13 and Al30 stock solutions were dosed respectivelyinto each reactor (which contained Milli-Q water) to obtaintest water with 0.2 mg/L total aluminum (0.5 mmol/L NaHCO3,0.5 mmol/LNaNO3, and pH 7.7, same as coil pipe test). 50 mLwater samples were collected from each reactor at prede-termined time intervals. One subsample was filtered with0.45-μm membrane. Then the samples were digested withguaranteed grade HNO3 at pH 1.0 for 2 hr. Total and dissolvedaluminum concentrations were measured by Chrome AzurolS Spectrophotometry method.
1.6. Characterization by QCM-D
The deposition layer features of different aluminum speciesonto inert material were characterized using a QCM-D (QuartzCrystal Microbalance with DissipationMonitoring) instrument(E4, Q-Sense, Gothenburg, Sweden). A 5-MHz AT-cut quartzcrystal sensor with gold-coated surface (QSX 301, Q-Sense,Gothenburg, Sweden) was mounted in the flow module. Priorto measuring, crystal sensors were cleaned as described inprotocols recommended by Q-Sense (SI).
QCM-D application for adsorption layer characterizationhas been previously described (Palmqvist and Holmberg, 2008).The general principle is to apply a voltage to the electrodesaffixed to the quartz crystal which resulted in oscillations ofpiezoelectric quartz crystal. The QCM-D response is sensitive toanymass change of the quartz crystal.When deposition occurs,a shift in the vibrational frequency of the crystal takes place andthe signal is recorded. The energy of dissipation is also si-multaneously monitored to extract the viscoelastic propertiesof the deposited layer.
The experiments were performed at 20 ± 0.1°C. A peristal-tic pump was used to obtain flow rate of 150 μL/min, whichresulted in a laminar flow across the sensor, and avoided airbubbles (Isaacson et al., 2011). QCM-D measurements wereinitiated with flowing air to examine whether a steady stateachieved, then a baseline was establishedwith flowingMilli-Qwater for appropriate background correction, and then eachtest solution was pumped in. The frequency and dissipationresponse of the crystal sensors at various overtones weresimultaneously monitored throughout the experiment.
In the deposition experiments, the variation of frequency anddissipation were monitored at four overtones (n = 3, 5, 7, 9). Foruniform flat and rigid layers, the deposited mass (Δm, kg) isproportional to the change in resonance frequency (Δf = f − f0, Hz)as described by the Sauerbrey equation (Tammelin et al., 2004).
Δm ¼ −CQCM
nΔ f
where, Δm (kg) is the change in depositedmass, CQCM is themasssensitivity constant (17.7 ng/(Hz cm2)), n is the overtone number(1, 3, 5, 7,…; the number of resonance for output frequency of aquartz oscillator) and Δf (Hz) is the shift in resonance frequency.For soft and viscoelastic layers, theVogitmodelwas used (Rodahlet al., 1997) to fit the frequency change (Δf ) and energydissipation (ΔD) simultaneously at multiple overtones to

145J O U R N A L O F E N V I R O N M E N T A L S C I E N C E S 4 2 ( 2 0 1 6 ) 1 4 2 – 1 5 1
obtain themass andphysical properties (e.g., density, thickness,shear elastic modulus, and viscosity) of the deposited film. InVoigt model, fluid density and fluid viscosity were 1000 kg/m3,0.001 kg/(m·sec), respectively. The deposited layer density waspresumed to be 1000 kg/m3.
2. Results and discussion
2.1. Aluminum in corrosion scales and loose deposits of realdistribution pipes
Aluminum content in pipe hard corrosion scales and loosedeposits were analyzed through XRF and the cumulativealuminum occurrence profiles are illustrated in Fig. 1. Obvi-ously, the profiles for surficial loose deposit and hard scale aredistinct. The surficial deposit samples had much higheraluminum content across the entire range for both cities.The average aluminum content of hard scales in the northerncity was 8975 μg/g, significantly lower than that of surficialdeposit (32,714 μg/g). For samples extracted from the southerncity, average aluminum content of surficial deposit was49,444 μg/g, higher than 16,013 μg/g of hard scales. Themuch higher amount of aluminum presented in surficialdeposit testified that aluminum deposition process oc-curred to a great extent in real distribution pipes.
Besides, for the southern city, raw water was surfacewater treated with PACl as coagulant. While for the northerncity, raw water included surface water and ground water,PACl was also the coagulant applied to treat the surfacewater. Since different aluminum species co-existed in PACl,and dominant speciesmay vary for different products, study onthe deposition behavior of different aluminumspecies is crucialfor aluminum control in drinking water distribution system.
2.2. Aluminum speciation variation in coil-pipe test
In order to observe the deposition behavior of different alu-minum species, coil-pipe test was established to simulate awater distribution pipe. Aluminum concentration and speci-ation of samples collected from outlet of the coil-pipe weremeasured. It was observed that the concentration variationof different aluminum species exhibited different patterns
103 104 105
0
20
40
60
80
100
Sam
ple
perc
entil
e (%
)
Aluminum concentration (µg/g)
Hard scale Surficial deposit
a
Fig. 1 – Relative aluminum content in corrosion scale samples ana southern city in China.
(Fig. 2). The aluminum concentration decrease for Alo systemwas rather limited (less than 0.03 mg/L), however for Al13 andAl30 systems, aluminum concentration decreased dramatical-ly. For Alo system, total and dissolved aluminum decreasedslightly at first four days, and then increased slowly in thefollowing days, where the difference between total anddissolved aluminum was relatively small. It indicated thatAlo did not tend to deposit during the experimental period. ForAl13 systems, total aluminum concentration decreased in thefirst four days, then kept at 0.065 mg/L with little fluctuation inthe following days. In addition, dissolved aluminum concen-tration showed similar variation trend. Particulate aluminumconcentration was considerable in the first two days, and thennearly equal to zero in the following days. Such variation ofparticulate aluminum might be due to its deposition. Besides,deposited aluminum calculated by initial dosage minus mea-sured total Al concentration, increasedwith time and accountedfor the large decreased proportion in the solution after the thirdday.
Al13 ([AlO4Al12(OH)24(H2O)12]7+) was characterized by rela-tively stable structure, nanometer molecular diameter andhigh self-aggregation tendency. It has been detected by27Al-NMR (Nuclear Magnetic Resonance) and small angleX-ray scattering that Al13 is a polycation with Keggin structurewith the central AlO4 surrounded by 12 aluminum atom inoctahedral and with molecular diameter of 1.0 nm (Gao et al.,2009). It was investigated that pure Al13 species exhibitedcertain anti-hydrolysis stability, because the unique Kegginstructure could interfere protons to access the AlO4 kernel(Wang et al., 2011). Consequently, the interchange of struc-tural aluminumwith bulk-aluminum and structure rebuildingis rather slow. However, due to the high aggregation propertyof Al13, it might easily become line or branch formed polymersby decreasing its charge and losing Cl− in the hydration layer(Tang and Luan, 1997). The polymers were aggregated togetherwith sizes ranging from tens to hundreds of nanometers (Tang,1998). Additionally, Al13 might hydrolyze to bayerite α-Al(OH)3within solutions with higher pH (Wang and Muhammed, 1999).Consequently, Al13 was apt to deposit as a result of the in-crement of apparent molecular weight.
For the Al30 system, total and soluble Al decreased in the firstthree days and appeared slightly increment at the fifth day, thengradually stabilized at 0.070 mg/L in the last two days. Dissolved
104 105
0
20
40
60
80
100
Sam
ple
perc
entil
e (
%)
Aluminum concentration (µg/g)
Hard scale Surficial deposit
b
d loose deposit specimens extracted from a northern city and

0 1 2 3 4 5 6 70.00
0.05
0.10
0.15
0.20
Total aluminum Dissolved aluminum
Alu
min
um c
once
ntra
tion
(mg/
L)
Time (day)
Al0
0 1 2 3 4 5 6 70.00
0.05
0.10
0.15
0.20
Alu
min
um c
once
ntra
tion
(mg/
L)
Time (day)
Al13
0 1 2 3 4 5 6 70.00
0.05
0.10
0.15
0.20
Alu
min
um c
once
ntra
tion
(mg/
L)
Time (day)
Al30
Fig. 2 – Aluminum speciation vs. time in coil test.
146 J O U R N A L O F E N V I R O N M E N T A L S C I E N C E S 4 2 ( 2 0 1 6 ) 1 4 2 – 1 5 1
aluminum is at relatively lower level and the gap with total Al islarge in the first two days, which also indicated that particulateAl occupied large proportion in the first two days. However, inthe following days, dissolved aluminumwas nearly equal to theamount of total aluminum, which indicated that the particulateAl was almost deposited. Besides, large amount of depositedaluminum appeared in the Al30 system. Compared with Al13reaction system, particulate aluminum content of Al30 systemwas obviously higher in the first two days and it could directlydeposit. The higher concentration of particulate matter in Al30system might be explained by its higher molecular size. Al30([Al30O8(OH)56(H2O)24]18+) polymer is the largest Al polycationisolated and characterized in hydrolytic PACl solution. It alsopossesses Keggin structure, composed of two δ-Al13 connectedby four Al monomers (Chen et al., 2006). Al30 has uniquenanometermolecule dimension (2.0 nm in length) and eighteenpositive charges (Allouche et al., 2000). However in Al13 system,the large amount of deposited aluminum might be partlyresulted from the gradual aggregation of dissolved Al13 species.Consequently, the deposition behaviors that occurred in the Al13and Al30 systems were significantly different.
Table 2 presents the pH variation before and after a weekcycle in the coil-pipe test, and it shows that pH decreasedin three systems, which indicated that Al13 and Al30 mightgradually hydrolyze to higher polymer. The decreasing solublealuminum could be partly due to its transformation into higherpolymers, which was apt to deposit. The pH reduction barelydiffered in three systems, whereas reduction in Alo system wasrelatively lower, indicating that the hydrolysis was weak. Smallamount of amorphous Al(OH)3 could be formed in Alo system.
2.3. Aluminum speciation variation in batch test
2.3.1. Comparison of standing and stirring condition in batch testThe deposited aluminum that occurred in coil-pipe test in-cluded two parts, that is, the deposition in the feed solutiontank (under stirring condition, 300 r/min) and the depositionin the pipe. Additionally, the variation of aluminum
Table 2 – pH variation of test water with different Alspeciation for coil-pipe test.
Before After Reduction
Alo 7.70 7.28 0.42Al13 7.70 7.24 0.46Al30 7.70 7.22 0.48
concentration in the coil-pipe test was affected by hydrauliccondition. Therefore, to further elucidate the deposition behav-ior of different aluminum species and testify the findings ofcoil-pipe test, a well-controlled batch test was established.Besides, stationary andmagnetic stirring (300 r/min) conditionswere applied to compare the effect of hydraulic condition.
In batch test, total and dissolved aluminum concentrationexhibited similar trends with the aluminum variation in coil-pipe test (Fig. 3). Under stationary condition, for Alo reactionsystem, aluminum concentration had minimal reduction,which indicated that such aluminum species did not tend todeposit. For the system of Al13, total aluminum concentrationdecreased continuously with time and stabilized at 0.11 mg/Lafter six days. Besides, particulate aluminum existed butdecreased from 0.051 to 0.020 mg/L. Meanwhile, depositedaluminum increased from 0.015 to 0.090 mg/L, nearly halfamount of aluminum deposited to the reactor surface. ForAl30 system, total aluminum content decreased from 0.178on the first day to 0.148 mg/L at last. Meanwhile, depositedaluminum increased from 0.022 to 0.052 mg/L.
Compared with Al30 system, total and dissolved aluminumreduction in Al13 system was relatively higher, which indicat-ed that Al13 was more apt to deposit. The changing trend ofaluminum species in Al30 solution was more stable andexhibited less decrease with time, meanwhile, relativelyhigher level particulate aluminum existed and was hard toprecipitate in stationary state.
Compared with stationary condition, it is apparent thatdeposited aluminum was much higher under stirring condi-tion. Additionally, particulate aluminum barely existed inthe last three days for all systems. These results verified thatstirring condition enhanced the deposition process andaccelerated the reaction to reach equilibrium.
2.3.2. Ferron timed complex-colorimetric characterization of Alspeciation variationFerron timed complex-colorimetric method was applied tofurther determine the aluminum speciation changes in threesystems under stationary condition. The comparison of alumi-num speciation before and after a week is shown in Fig. 4. In thesolution with Alo, the proportion of Ala increased, and thepercentage of Alb decreased. However, the changes of Ala, Alband Alc were relatively small. A possible explanation is thatsmall percentage of particulate aluminum was deposited andpart of Alb aggregated which resulted in the increment of Alapercentage. For Al13 system, the proportion of Alb increased

0.10
0.12
0.14
0.16
0.18
0.20
Alu
min
um c
once
ntra
tion
(mg/
L)
Time (day)
Total Al-standing Dissolved Al-standing Total Al-stirring Total Al-stirring
0.00
0.05
0.10
0.15
0.20
Total Al-standing Dissolved Al-standing Total Al-stirring Total Al-stirring
Alu
min
um c
once
ntra
tion
(mg/
L)
Time (day)
0 1 2 3 4 5 6 7
0 1 2 3 4 5 6 7
0 1 2 3 4 5 6 70.00
0.05
0.10
0.15
0.20
Total Al-standing Dissolved Al-standing Total Al-stirring Total Al-stirring
Alu
min
um c
once
ntra
tion
(mg/
L)
Time (day)
Al0
Al13
Al30
Fig. 3 – Aluminum speciation vs. time in batch test understationary and stirring condition.
147J O U R N A L O F E N V I R O N M E N T A L S C I E N C E S 4 2 ( 2 0 1 6 ) 1 4 2 – 1 5 1
from61.49% to 76.22%with the decreasingAlc. The increasedAlbpercentage indicated that part of aluminum gradually hydro-lyzed to higher polymers. Besides, the decreased Alc could bedue to the deposition. In Al30 system, the percentage of Alcdistinctly increased from 69.90% to 90.25%. Additionally, Ala andAlb proportions decreased to less than 10%. In Al30 stationarysystem, particulate aluminum was dominant and the gradualhydrolyzation resulted in the increment of Alc proportion.
Based on the results obtained from the batch tests and theferron timed complex-colorimetric characterization, it couldbe deduced that deposited aluminum in Al13 system might
mainly be due to its self-aggregation; while for Al30 system,particulate aluminum precipitation could be the dominantreason for the large amount of deposited aluminum. Thishypothesis will be further discussed below.
2.3.3. Comparison of coil-pipe test and batch testCompared with the initial aluminum concentration of testwater, the decrement in aluminum concentration measuredat the outlet of coil-pipe included the aluminum variations inboth test water tank and coil-pipe. Therefore, the actualdeposited aluminum in coil-pipe could be calculated bydeducting the aluminum deposited in test water tank (stirringcondition) (shown in Fig. 3) from the total deposited alumi-num in both test water tank and coil pipe (shown in Fig. 2).The calculated variation of deposited aluminum concentra-tion in coil-pipe is presented in Fig. 5. It is interesting to findthat the deposited aluminum for Al13 and Al30 systems couldbe negative and positive values, which fluctuated aroundzero. Only Alo system exhibited positive values all the time.This phenomenon demonstrated that the aluminum deposi-tion for Al13 and Al30 systems in the coil pipe test mainlyoccurred in test water tank. The negative value was due to theunstable state in coil-pipe under the changing flow condition,which could result in deposited aluminum release to solution.The findings of simulated coil-pipe test implicated thataluminum deposition behavior in real distribution systemwas more complicated and apt to be affected by the hydrauliccondition, to which attention should be paid by water utilities.
2.3.4. Effect of pH on aluminum depositionThe pH effect on deposition behavior of different aluminumspecies was conducted and shown in Appendix A Figs. S3–S5.For Alo system, pH effect was relatively obvious. Total alu-minum and dissolved aluminum concentration followed thepH sequence of 7.7 > 7.2 > 6.7 ≈ 8.2 ≈ 8.7. High pH promotedAlo hydrolysis to high polymers, and the low pH might beinclined to the formation of amorphous Al(OH)3.
For Al13 system, when pH = 6.7, total aluminum concen-tration was distinctly higher than that under other pHconditions. Besides, dissolved aluminum content followedthe pH sequence of 6.7 > 7.2 > 7.7 ≈ 8.2 ≈ 8.7, with minor gaps.With regard to Al30 system, when pH = 8.7, total aluminumand dissolved aluminum concentration were relatively lower.For Al13 and Al30, total aluminum and dissolved aluminumconcentration were relatively higher at lower pH and smallerat higher pH, which implied that higher pH promotedhydrolyzation. Generally, the pH effect on aluminum deposi-tion was relatively small for Al13 and Al30.
2.4. Deposition characterization of different aluminum speciesby QCM-D
To further investigate the deposition mechanism of differentaluminum species, QCM-D technique was applied. The deposi-tion behavior of Alo, Al13 and Al30 was characterized by QCM-Dat pH of 7.7, temperature of 20°C with initial total aluminumconcentration of 0.2 mg/L. Real-time recording of frequencyshifts (Δf ) and dissipation shifts (ΔD) at four overtones (n = 3, 5,7, 9) are presented in Fig. 6 for Alo, Al13 and Al30, respectively.The curves at the first overtone (5 MHz) were not included as a

75.16
16.67
7.98
84.61
6.47 8.88
Ala Alb Alc
0
30
60
90
Perc
enta
ge (
%)
Aluminum speciesAla Alb Alc
Aluminum speciesAla Alb Alc
Aluminum species
Before
After
27.23
61.50
11.34
76.22
1.190
30
60
90
Before
After
Perc
enta
ge (
%)
1.98
28.15
69.90
3.37 6.41
90.25
0
30
60
90
Before
After
Perc
enta
ge (
%)
Al0 Al13Al30
Fig. 4 – Aluminum speciation before and after a week under stationary condition.
148 J O U R N A L O F E N V I R O N M E N T A L S C I E N C E S 4 2 ( 2 0 1 6 ) 1 4 2 – 1 5 1
result of high scattering, which also observed by (Yan et al.,2011). A stable baseline was first established through injectionof Milli-Q water. After introduction of 0.2 mg/L of Alo, Al13,and Al30 solutions into QCM-D, respectively, Δf decreased todifferent extent along with increasing ΔD from the baseline. Ittook 3, 1.5 and 4 hr forAlo, Al13, andAl30 systems to achievenearsteady-state, respectively.
2.4.1. Deposition featuresIn Alo system (Fig. 6), only small Δf was detected, whichindicated that the deposition mass was relatively small. Thedissipation shifts increased significantly, which implied thatthe deposited layer was rather soft and hydrated.
Fig. 6 also shows the curves of Δf and ΔD versus time for thedeposition of Al13. When Al13 was introduced, Δf sharplydecreased compared with the referred baseline, indicatingthat rapid deposition occurred on the surface. Relativelyslight increments of dissipation shifts indicated that thedeposition of Al13 formed a more rigid layer. Besides, whenAl13 was bound, dissipation shifts at different overtonestended to get closer, which was extremely different from thedistinct separated shifts of Alo and Al30 solutions. Such aweak sensitivity to overtone number is typical for a rigid film(Sun et al., 2014), which further verified that Al13 layer was
0 1 2 3 4 5 6 7-0.2
-0.1
0.0
0.1
0.2
Al0
Al13
Al30Dep
osite
d al
umin
um c
once
ntra
tion
(mg/
L)
Time (day)
Fig. 5 – Deposited aluminum concentration vs. time in coil-pipefor different aluminum species.
Fig. 6 – Performances of deposition behavior of differentaluminum species monitored by QCM-D (Quartz CrystalMicrobalance with Dissipation Monitoring). (a) Alo; (b) Al13;(c) Al30.
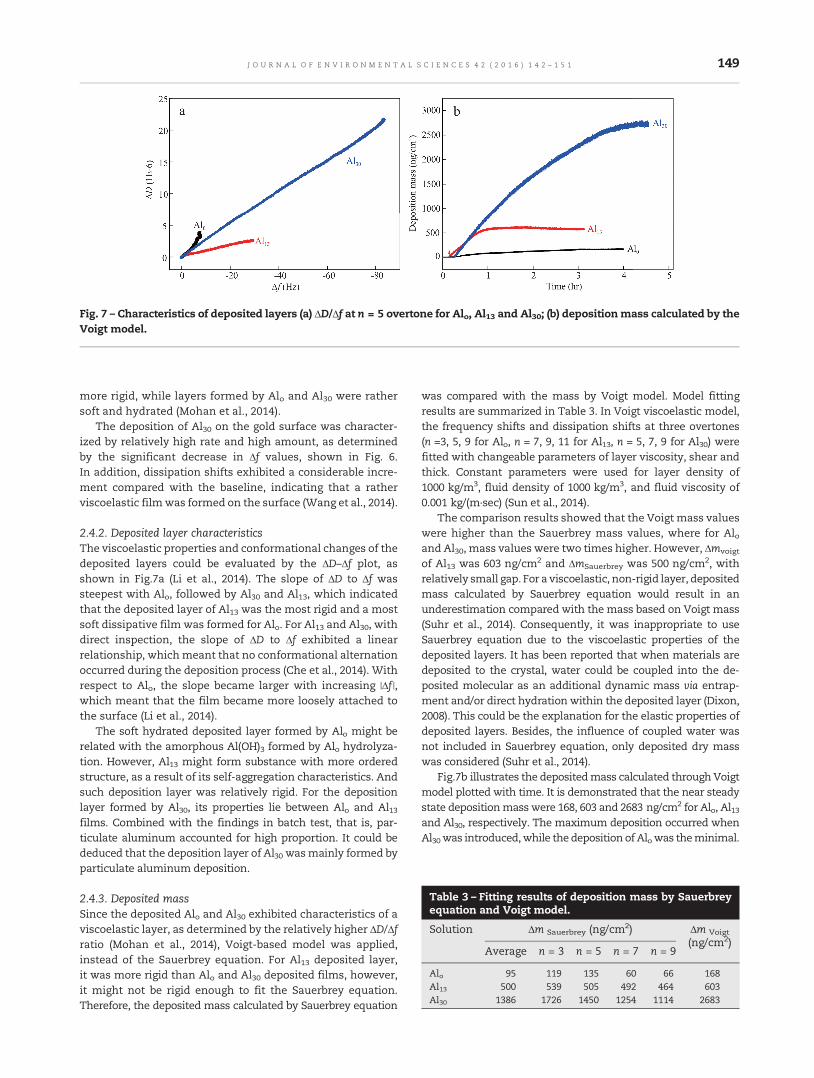
Fig. 7 – Characteristics of deposited layers (a) ΔD/Δf at n = 5 overtone for Alo, Al13 and Al30; (b) depositionmass calculated by theVoigt model.
Table 3 – Fitting results of deposition mass by Sauerbreyequation and Voigt model.
Solution Δm Sauerbrey (ng/cm2) Δm Voigt
(ng/cm2)Average n = 3 n = 5 n = 7 n = 9
Alo 95 119 135 60 66 168Al13 500 539 505 492 464 603Al30 1386 1726 1450 1254 1114 2683
149J O U R N A L O F E N V I R O N M E N T A L S C I E N C E S 4 2 ( 2 0 1 6 ) 1 4 2 – 1 5 1
more rigid, while layers formed by Alo and Al30 were rathersoft and hydrated (Mohan et al., 2014).
The deposition of Al30 on the gold surface was character-ized by relatively high rate and high amount, as determinedby the significant decrease in Δf values, shown in Fig. 6.In addition, dissipation shifts exhibited a considerable incre-ment compared with the baseline, indicating that a ratherviscoelastic filmwas formed on the surface (Wang et al., 2014).
2.4.2. Deposited layer characteristicsThe viscoelastic properties and conformational changes of thedeposited layers could be evaluated by the ΔD–Δf plot, asshown in Fig.7a (Li et al., 2014). The slope of ΔD to Δf wassteepest with Alo, followed by Al30 and Al13, which indicatedthat the deposited layer of Al13 was the most rigid and a mostsoft dissipative film was formed for Alo. For Al13 and Al30, withdirect inspection, the slope of ΔD to Δf exhibited a linearrelationship, whichmeant that no conformational alternationoccurred during the deposition process (Che et al., 2014). Withrespect to Alo, the slope became larger with increasing |Δf |,which meant that the film became more loosely attached tothe surface (Li et al., 2014).
The soft hydrated deposited layer formed by Alo might berelated with the amorphous Al(OH)3 formed by Alo hydrolyza-tion. However, Al13 might form substance with more orderedstructure, as a result of its self-aggregation characteristics. Andsuch deposition layer was relatively rigid. For the depositionlayer formed by Al30, its properties lie between Alo and Al13films. Combined with the findings in batch test, that is, par-ticulate aluminum accounted for high proportion. It could bededuced that the deposition layer of Al30 wasmainly formed byparticulate aluminum deposition.
2.4.3. Deposited massSince the deposited Alo and Al30 exhibited characteristics of aviscoelastic layer, as determined by the relatively higher ΔD/Δfratio (Mohan et al., 2014), Voigt-based model was applied,instead of the Sauerbrey equation. For Al13 deposited layer,it was more rigid than Alo and Al30 deposited films, however,it might not be rigid enough to fit the Sauerbrey equation.Therefore, the deposited mass calculated by Sauerbrey equation
was compared with the mass by Voigt model. Model fittingresults are summarized in Table 3. In Voigt viscoelastic model,the frequency shifts and dissipation shifts at three overtones(n =3, 5, 9 for Alo, n = 7, 9, 11 for Al13, n = 5, 7, 9 for Al30) werefitted with changeable parameters of layer viscosity, shear andthick. Constant parameters were used for layer density of1000 kg/m3, fluid density of 1000 kg/m3, and fluid viscosity of0.001 kg/(m·sec) (Sun et al., 2014).
The comparison results showed that the Voigt mass valueswere higher than the Sauerbrey mass values, where for Aloand Al30, mass values were two times higher. However, Δmvoigt
of Al13 was 603 ng/cm2 and ΔmSauerbrey was 500 ng/cm2, withrelatively small gap. For a viscoelastic, non-rigid layer, depositedmass calculated by Sauerbrey equation would result in anunderestimation compared with the mass based on Voigt mass(Suhr et al., 2014). Consequently, it was inappropriate to useSauerbrey equation due to the viscoelastic properties of thedeposited layers. It has been reported that when materials aredeposited to the crystal, water could be coupled into the de-posited molecular as an additional dynamic mass via entrap-ment and/or direct hydration within the deposited layer (Dixon,2008). This could be the explanation for the elastic properties ofdeposited layers. Besides, the influence of coupled water wasnot included in Sauerbrey equation, only deposited dry masswas considered (Suhr et al., 2014).
Fig.7b illustrates the depositedmass calculated through Voigtmodel plotted with time. It is demonstrated that the near steadystate depositionmasswere 168, 603 and 2683 ng/cm2 for Alo, Al13and Al30, respectively. The maximum deposition occurred whenAl30was introduced,while the deposition of Alowas theminimal.

Al13 Al30Al0
Slowest ModeratelyRapidlyResidual aluminum
Fig. 8 – Schematic deposition features of residual aluminumwith different speciation characteristics.
150 J O U R N A L O F E N V I R O N M E N T A L S C I E N C E S 4 2 ( 2 0 1 6 ) 1 4 2 – 1 5 1
2.5. General discussion
Based on the above results, Alo was difficult to deposit, andthe small deposition might be due to the formation ofamorphous Al(OH)3. Al13 was most apt to deposit due toself-aggregation. For Al30, particulate aluminum occupiedlarge proportion and easily deposited under stirring. Thedeposited mass estimated by QCM-D included the mass ofcoupledwater, and the depositedAlo layer exhibitedhighly soft,hydrated property. Therefore, though the result of QCM-Dexperiment showed that 168 ng/cm2 Alo deposited to the goldsurface, the actual drymass of depositedAlo wasmuch smaller.
For Al13, the result of QCM-Ddemonstrated that the depositedfilm was rather rigid. Besides, the deposition was fastest anddeposition mass per unit time was the largest. Such character-isticswere in accordancewith the batch test. Al13wasmost apt todeposit. Additionally, based on the rigid deposition layer andcharacteristics of Al13, Al13 deposition may mainly be attributedto its self-aggregation.
With regard to Al30, the deposited mass was massive,however the deposited film was rather soft and hydrated,deposition process was slow. Such behavior was also consis-tent with the findings in batch test that particulate aluminumslowly deposited with time. Since the hydrated or entrappedwater might account for large proportion of the depositedmass, the deposition amount (in terms of elemental alumi-num) of Al30 was less than Al13 during the same period. Basedon the deposition properties of Al30, it could be conjecturedthat the deposition of particulate aluminum be the mainmechanism of Al30 deposition. A schematic graph to expressthe characteristic deposition behaviors of different aluminumspecies is presented in Fig. 8.
3. Conclusions
In this work, coil-pipe test, batch test and QCM-D techniquewere used to understand the deposition behavior of differentaluminum species (Alo, Al13 and Al30), some main conclusionswere obtained as below: the Al deposition rate and mass (aselemental Al) followed the order: Al13 > Al30 > Alo. Al13 wasmost inclined to deposit, and Alo hardly deposit. Thedeposition layer formed by Al13 was rigid and compact, butthose formed by Al30 and Alo were rather soft and loose.Compared with the stationary system, stirring enhanced theinteraction between solution and interface, therefore, theprocess of deposition was accelerated. For aluminum species
with higher deposition tendency, more proportion of alumi-num might accumulate in the pipe surface under stirringcondition.Within the neutral pH range of 6.7–8.7, the pH effecton deposition behavior was relatively small for Al13 and Al30.However, for Alo, the effect was relatively larger.
Themain depositionmechanismof Al13 was self-aggregation.The deposition of Al30 was mainly due to the particulatealuminum deposition. The observed aluminum depositionof Alo might be mainly due to the formation of amorphousAl(OH)3.
Acknowledgments
The authors are very grateful to all personnel who providedsupport for this research. This work was supported by theNational Natural Science Foundation of China (Nos. 51378493,and 51178450).
Appendix A. Supplementary data
Supplementary data associated with this article can be foundin online version at http://dx.doi.org/10.1016/j.jes.2015.05.010.
R E F E R E N C E S
Allouche, L., Gerardin, C., Loiseau, T., Ferey, G., Taulelle, F.,2000. Al-30: a giant aluminum polycation. Angew. Chem. Int.Ed. 39 (3), 511–514.
Che, H.X., Yeap, S.P., Osman,M.S., Ahmad,A.L., Lim, J., 2014.Directedassembly of bifunctional silica-iron oxide nanocomposite withopen shell structure. ACS Appl. Mater. Interfaces 6 (19),16508–16518.
Chen, Z.Y., Fan, B., Peng, X.J., Zhang, Z.G., Fan, J.H., Luan, Z.K.,2006. Evaluation of Al-30 polynuclear species in polyaluminumsolutions as coagulant for water treatment. Chemosphere 64(6), 912–918.
Dahl, C., Sogaard,A.J., Tell, G.S., Flaten,T.P., Hongve,D., Omsland, T.K.,Holvik, K., Meyer, H.E., Aamodt, G., O.Norwegian Epidemiologic,2014. Do cadmium, lead, and aluminum in drinking waterincrease the risk of hip fractures? A NOREPOS study. Biol. TraceElem. Res. 157 (1), 14–23.
Dixon, M.C., 2008. Quartz crystal microbalance with dissipationmonitoring: enabling real-time characterization of biologicalmaterials and their interactions. J. Biomol. Tech. : JBT 19 (3),151–158.
Duan, S.X., Xu, H., Xiao, F., Wang, D.S., Ye, C.Q., Jiao, R.Y., Liu, Y.J.,2014. Effects of Al species on coagulation efficiency, residual Aland floc properties in surface water treatment. Colloids Surf.a—Physicochem. Eng. Asp. 459, 14–21.
Dzulfakar, M.A., Shaharuddin, M.S., Muhaimin, A.A., Syazwan,A.I., 2011. Risk assessment of aluminum in drinking waterbetween two residential areas. Water 3 (3), 882–893.
Gao, B.Y., Hahn, H.H., Hoffmann, E., 2002. Evaluation ofaluminum-silicate polymer composite as a coagulant for watertreatment. Water Res. 36 (14), 3573–3581.
Gao, B.Y., Chu, Y.B., Yue, Q.Y., Wang, Y., 2009. Purification andcharacterization of Al-13 species in coagulant polyaluminumchloride. J. Environ. Sci. 21 (1), 18–22.
Hu, C.Z., Liu, H.J., Qu, J.H., Wang, D.S., Ru, J., 2006. Coagulationbehavior of aluminum salts in eutrophic water: significance of
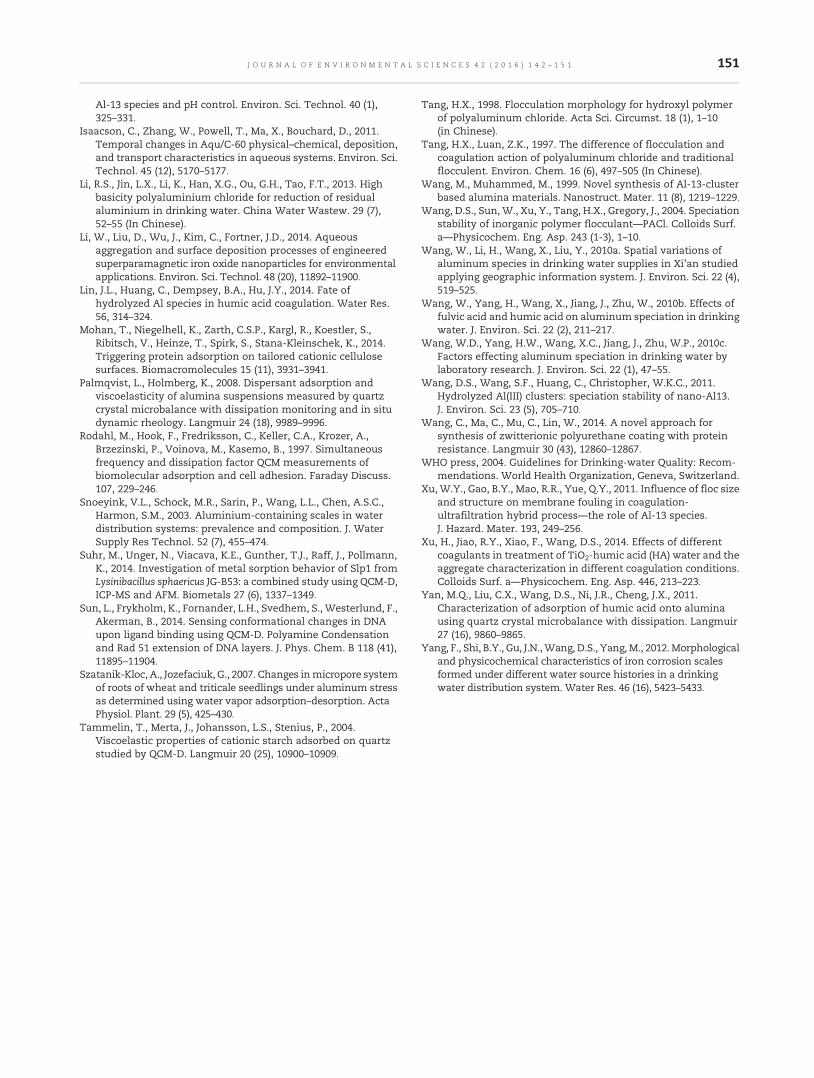
151J O U R N A L O F E N V I R O N M E N T A L S C I E N C E S 4 2 ( 2 0 1 6 ) 1 4 2 – 1 5 1
Al-13 species and pH control. Environ. Sci. Technol. 40 (1),325–331.
Isaacson, C., Zhang, W., Powell, T., Ma, X., Bouchard, D., 2011.Temporal changes in Aqu/C-60 physical–chemical, deposition,and transport characteristics in aqueous systems. Environ. Sci.Technol. 45 (12), 5170–5177.
Li, R.S., Jin, L.X., Li, K., Han, X.G., Ou, G.H., Tao, F.T., 2013. Highbasicity polyaluminium chloride for reduction of residualaluminium in drinking water. China Water Wastew. 29 (7),52–55 (In Chinese).
Li, W., Liu, D., Wu, J., Kim, C., Fortner, J.D., 2014. Aqueousaggregation and surface deposition processes of engineeredsuperparamagnetic iron oxide nanoparticles for environmentalapplications. Environ. Sci. Technol. 48 (20), 11892–11900.
Lin, J.L., Huang, C., Dempsey, B.A., Hu, J.Y., 2014. Fate ofhydrolyzed Al species in humic acid coagulation. Water Res.56, 314–324.
Mohan, T., Niegelhell, K., Zarth, C.S.P., Kargl, R., Koestler, S.,Ribitsch, V., Heinze, T., Spirk, S., Stana-Kleinschek, K., 2014.Triggering protein adsorption on tailored cationic cellulosesurfaces. Biomacromolecules 15 (11), 3931–3941.
Palmqvist, L., Holmberg, K., 2008. Dispersant adsorption andviscoelasticity of alumina suspensions measured by quartzcrystal microbalance with dissipation monitoring and in situdynamic rheology. Langmuir 24 (18), 9989–9996.
Rodahl, M., Hook, F., Fredriksson, C., Keller, C.A., Krozer, A.,Brzezinski, P., Voinova, M., Kasemo, B., 1997. Simultaneousfrequency and dissipation factor QCM measurements ofbiomolecular adsorption and cell adhesion. Faraday Discuss.107, 229–246.
Snoeyink, V.L., Schock, M.R., Sarin, P., Wang, L.L., Chen, A.S.C.,Harmon, S.M., 2003. Aluminium-containing scales in waterdistribution systems: prevalence and composition. J. WaterSupply Res Technol. 52 (7), 455–474.
Suhr, M., Unger, N., Viacava, K.E., Gunther, T.J., Raff, J., Pollmann,K., 2014. Investigation of metal sorption behavior of Slp1 fromLysinibacillus sphaericus JG-B53: a combined study using QCM-D,ICP-MS and AFM. Biometals 27 (6), 1337–1349.
Sun, L., Frykholm, K., Fornander, L.H., Svedhem, S., Westerlund, F.,Akerman, B., 2014. Sensing conformational changes in DNAupon ligand binding using QCM-D. Polyamine Condensationand Rad 51 extension of DNA layers. J. Phys. Chem. B 118 (41),11895–11904.
Szatanik-Kloc, A., Jozefaciuk, G., 2007. Changes inmicropore systemof roots of wheat and triticale seedlings under aluminum stressas determined using water vapor adsorption–desorption. ActaPhysiol. Plant. 29 (5), 425–430.
Tammelin, T., Merta, J., Johansson, L.S., Stenius, P., 2004.Viscoelastic properties of cationic starch adsorbed on quartzstudied by QCM-D. Langmuir 20 (25), 10900–10909.
Tang, H.X., 1998. Flocculation morphology for hydroxyl polymerof polyaluminum chloride. Acta Sci. Circumst. 18 (1), 1–10(in Chinese).
Tang, H.X., Luan, Z.K., 1997. The difference of flocculation andcoagulation action of polyaluminum chloride and traditionalflocculent. Environ. Chem. 16 (6), 497–505 (In Chinese).
Wang, M., Muhammed, M., 1999. Novel synthesis of Al-13-clusterbased alumina materials. Nanostruct. Mater. 11 (8), 1219–1229.
Wang, D.S., Sun,W., Xu, Y., Tang, H.X., Gregory, J., 2004. Speciationstability of inorganic polymer flocculant—PACl. Colloids Surf.a—Physicochem. Eng. Asp. 243 (1-3), 1–10.
Wang, W., Li, H., Wang, X., Liu, Y., 2010a. Spatial variations ofaluminum species in drinking water supplies in Xi'an studiedapplying geographic information system. J. Environ. Sci. 22 (4),519–525.
Wang, W., Yang, H., Wang, X., Jiang, J., Zhu, W., 2010b. Effects offulvic acid and humic acid on aluminum speciation in drinkingwater. J. Environ. Sci. 22 (2), 211–217.
Wang, W.D., Yang, H.W., Wang, X.C., Jiang, J., Zhu, W.P., 2010c.Factors effecting aluminum speciation in drinking water bylaboratory research. J. Environ. Sci. 22 (1), 47–55.
Wang, D.S., Wang, S.F., Huang, C., Christopher, W.K.C., 2011.Hydrolyzed Al(III) clusters: speciation stability of nano-Al13.J. Environ. Sci. 23 (5), 705–710.
Wang, C., Ma, C., Mu, C., Lin, W., 2014. A novel approach forsynthesis of zwitterionic polyurethane coating with proteinresistance. Langmuir 30 (43), 12860–12867.
WHO press, 2004. Guidelines for Drinking-water Quality: Recom-mendations. World Health Organization, Geneva, Switzerland.
Xu, W.Y., Gao, B.Y., Mao, R.R., Yue, Q.Y., 2011. Influence of floc sizeand structure on membrane fouling in coagulation-ultrafiltration hybrid process—the role of Al-13 species.J. Hazard. Mater. 193, 249–256.
Xu, H., Jiao, R.Y., Xiao, F., Wang, D.S., 2014. Effects of differentcoagulants in treatment of TiO2-humic acid (HA) water and theaggregate characterization in different coagulation conditions.Colloids Surf. a—Physicochem. Eng. Asp. 446, 213–223.
Yan, M.Q., Liu, C.X., Wang, D.S., Ni, J.R., Cheng, J.X., 2011.Characterization of adsorption of humic acid onto aluminausing quartz crystal microbalance with dissipation. Langmuir27 (16), 9860–9865.
Yang, F., Shi, B.Y., Gu, J.N.,Wang, D.S., Yang,M., 2012.Morphologicaland physicochemical characteristics of iron corrosion scalesformed under different water source histories in a drinkingwater distribution system. Water Res. 46 (16), 5423–5433.

J O U R N A L O F E N V I R O N M E N T A L S C I E N C E S 4 2 ( 2 0 1 6 ) 1 5 2 – 1 6 2
Ava i l ab l e on l i ne a t www.sc i enced i r ec t . com
ScienceDirect
www. jou rna l s . e l sev i e r . com/ j es
Preliminary investigation of phosphorus adsorption onto twotypes of iron oxide-organic matter complexes
Jinlong Yan1, Tao Jiang1,2,⁎, Ying Yao3, Song Lu1, Qilei Wang1, Shiqiang Wei1,⁎
1. Key Laboratory of Eco-environments in Three Gorges Reservoir Region, Ministry of Education, Chongqing Key Laboratory of AgriculturalResources and Environment, College of Resources and Environment, Department of Environmental Science and Engineering, SouthwestUniversity, Chongqing 400716, China. E-mail: [email protected]. Department of Forest Ecology and Management, Swedish University of Agricultural Sciences, Umeå SE-90183, Sweden3. School of Material Science & Engineering, Beijing Institute of Technology, Beijing 100081, China
A R T I C L E I N F O
⁎ Corresponding authors. E-mail: jiangtower6
http://dx.doi.org/10.1016/j.jes.2015.08.0081001-0742/© 2015 The Research Center for Ec
A B S T R A C T
Article history:Received 6 April 2015Revised 24 August 2015Accepted 27 August 2015Available online 28 October 2015
Iron oxide (FeO) coated by natural organic matter (NOM) is ubiquitous. The associations ofminerals with organic matter (OM) significantly changes their surface properties andreactivity, and thus affect the environmental fate of pollutants, including nutrients (e.g.,phosphorus (P)). In this study, ferrihydrite/goethite-humic acid (FH/GE–HA) complexes wereprepared and their adsorption characteristics on P at various pH and ionic strength wereinvestigated. The results indicated that the FeO–OM complexes showed a decreased Padsorption capacity in comparison with bare FeO. Themaximum adsorption capacity (Qmax)decreased in the order of FH (22.17 mg/g) > FH-HA (5.43 mg/g) > GE (4.67 mg/g) > GE-HA(3.27 mg/g). After coating with HA, the amorphous FH–HA complex still showed higher Padsorption than the crystalline GE–HA complex. The decreased P adsorption observedmight be attributed to changes of the FeO surface charges caused by OM association. Thedependence of P adsorption on the specific surface area of adsorbents suggests that the FeOcomponent in the complexes is still the main contributor for the adsorption surfaces. The Padsorptions on FeO–HA complexes decreased with increasing initial pH or decreasing initialionic strength. A strong dependence of P adsorption on ionic strength and pH maydemonstrate that outer-sphere complexes between the OM component on the surface andP possibly coexist with inner-sphere surface complexes between the FeO component andP. Therefore, previous over-emphasis on the contributions of original minerals to P immobili-zation possibly over-estimates the P loading capacity of soils, especially in humic-rich areas.© 2015 The Research Center for Eco-Environmental Sciences, Chinese Academy of Sciences.
Published by Elsevier B.V.
Keywords:PhosphorusFerrihydrite–humic acid complexGoethite–humic acid complexAdsorption
Introduction
The phosphorus (P) cycle in the environment is an importantbiogeochemical process which could strongly influence agri-cultural nonpoint source pollution, soil fertility, soil erosion,and water eutrophication, etc. Thus, the fate, transport, andtransformation of P in the environment have attracted
[email protected] (Tao Jiang), s
o-Environmental Science
tremendous attention (Ekholm and Lehtoranta, 2012; Lijklema,1980; Sharpley et al., 1994). As a key factor to control P cycling,especially in redox-changing environments such as wetlands,water-level fluctuation zones and riparian areas, iron oxide(FeO) (e.g., goethite (GE) and ferrihydrite (FH)) plays an importantrole in P immobilizationand releasedue to its large surface area,variable-charge surface and high reactivity.
[email protected] (Shiqiang Wei).
s, Chinese Academy of Sciences. Published by Elsevier B.V.

153J O U R N A L O F E N V I R O N M E N T A L S C I E N C E S 4 2 ( 2 0 1 6 ) 1 5 2 – 1 6 2
The amount of P adsorbed by the soil has a linearrelationship with the amorphous and crystalline FeO contentsof the soil (Axt and Walbridge, 1999; Zhang et al., 2003).However, FeO rarely occur alone in the environment; theyoften are associated with natural organic matter (NOM)including humic substances to form FeO–organic matter (OM)complexes (Fontes et al., 1992; Schwertmann et al., 2005; Wenget al., 2006a), which are an important component of soilaggregates and have a significant effect on soil properties(Xiong and Li, 1987). Physical adsorption, ligand exchange,protonation, hydrogen bonding, and cation bridging are mainmechanisms responsible for the interaction between OM andFeO (Gu et al., 1994). In addition, FeO–OM complexes are alsoimportant for the stabilization of OM in soil (Baldock andSkjemstad, 2000; Kaiser and Guggenberger, 2000) as they inhibitthe biodegradation of OM and extend the turnover time. Thecomplexes also serve as a crucial mechanism for carbonsequestration (Baldock and Skjemstad, 2000; Kalbitz et al.,2005), thereby affecting the global carbon cycle. In addition,NOM can inhibit the crystallization of amorphous FeO due tothe formation of iron mineral–OM complexes (Schwertmann,1966). Because of mineral-bound OM, mineral transformationduring abiotic or biotic reduction is clearly changed (Henneberryet al., 2012; Shimizu et al., 2013).
Such changes of iron minerals also strongly affect thecycling of iron, consequently influencing the adsorptioncapacity of minerals for pollutants including oxyanions suchas PO4
3− (Gerke and Hermann, 1992; Laor et al., 1998; Vermeeret al., 1999). Thus, gaining further understanding of the detailsand mechanisms of P adsorption by FeO–OM complexes couldbe helpful in unraveling the processes of retention, bioavail-ability and bioaccumulation of P in natural ecosystems.Although FeO–OM complexes play a significant role on thechemical behavior of environmental pollutants, studies re-garding their effects on the transport and transformation of Pare still insufficient. Previously, most studies only focused onthe competitive adsorption of OM and P onto raw FeO surfaces(Borggaard et al., 2005; Geelhoed et al., 1998; Hiemstra et al.,2013; Weng et al., 2008), while the interactions between P andFeO–OM complexes, which could be ubiquitous geochemicalprocess occurring in environments such as sediments andwetlands, remain unknown.
The main objectives of this study were to find out whethermineral-boundOMpromotes or reduces P sorption, andprovidemore details about the changes of P sorption capacity. Effects ofpHand iron strengthwere also investigated.Webelieve that thefindings here would be useful and pertinent to exploration ofthe underlying mechanism controlling P release from soils/sediments, and the relationship between P andmineral-OM forfurther understanding of eutrophication and OM stabilization,especially in the context of global climate change.
1. Materials and methods
1.1. Preparation and characterization of FeO–HA complexes
Millipore® ultrapure (18.2 MΩ· cm) water was used, and allchemical reagents were of ultrapure grade. Preparation ofpure FeO was carried out based on the method reported by
Schwertmann and Cornell (2000). The detailed procedureswere as follows. For FH preparation: 40 g Fe(NO3)3·9H2O wasweighed and added to 500 mL of deionized (DI) water. Then,330 mL of 1 mol/L KOH was added under vigorous stirringusing a magnetic stirrer; the final 20 mL was added dropwiseto adjust the pH to 7.5. After the pH was adjusted, the mixturewas stirred for 30 min and centrifuged at 4000 r/min for 10 min.Washing with DI water was carried out several times until theconductivity of the eluate was less than 50 μS/cm. Afterfreeze-drying, the sample was ground in an agate mortar,passed through a 100-mesh sieve, and stored in a refrigerator at4°C. Thus, the FH solid was obtained. For GE preparation: 50 mLof 1 mol/L Fe(NO3)3 solution was transferred to a 1 L polyethyl-ene bottle. Then, 90 mL of a 5 mol/L KOH solution was addedrapidly under vigorous stirring using a magnetic stirrer. Waterwas added to adjust the final volume to 1 L and themixturewasthen sealed using a polyethylene film; the initial pH of thesuspension was 12. After storage at 70°C for 60 hr, the mixturewas centrifuged at 4000 r/min for 10 min. The subsequent stepswere the same as for FH preparation.
Preparation of FeO–OM complexes was carried out accord-ing to the method reported by previous researchers withmodification (Cruz-Guzmán et al., 2003; Sharma et al., 2010).We used humic acid (HA) to represent OM. The detailedprocedures were as follows. According to the method forpreparing pure FeO (as above-mentioned), the wet FH (or GE)was transferred to a 1 L beaker. Then, 500 mL (or 250 mL) ofdeionized water was added to obtain a suspension of FeO,followed by the addition of 2 g (or 1 g) of HA (>90% HA,Adamas, purchased from Tansuo Co. Ltd., China). No furtherpurification of HA was conducted. The basic properties of HAwere as follows: The Brunauer–Emmett–Teller (BET) specificsurface area (SSA) 4.36 m2/g; C 39%; N 1%; H 3%. The initialC/Femass ratio of the prepared complex in solution was 0.015.The initial pH of FH-HA as-prepared was 8.3, and the initial pHof GE-HA as-prepared was 9.5. The mixture was stirred for24 hr in the dark, aged for 12 hr, and centrifuged at 4000 r/minfor 30 min. The subsequent steps were the same as for pureFeO preparation. Finally, the carbon contents in the FH–HAand GE–HA complexes were 7.12% and 1.32%, respectively.
Characterization of FeO–HA complexes and pure FeO:X-ray diffraction (XRD) patterns were obtained using a X-raydiffractometer (Beijing Purkinje General XD-3, China) and thedetailed operation conditions were as follows: anodematerial:Cu target; tube voltage: 36 kV; tube current: 20 mA; scanningspeed: 2°/min; step size: 0.04° (2θ); slit (FS-FSS-JS): 1°–0.3°–1°;scan angle: 10–70° (2θ); graphite monochromator. Scanningelectron microscopy (SEM) analysis was performed usingan electron microscope (JEOL JSM-6510LV, Japan) with anaccelerating voltage of 20 kV. Fourier transform infraredspectroscopy (FT-IR) analysis was conducted using an infraredspectrometer (Thermo Scientific Nicolet iS10, USA) with ascan range of 400–4000 cm−1. The BET SSA was determinedusing nitrogen adsorption–desorption (Micromeritics ASAP2020V4.00, USA). The point of zero charge (PZC) was deter-mined through acid-base titrations (702 SM Titrino, Metrohm,Switzerland) (Wei and Xiang, 2013; Wei et al., 2014). Thecarbon content in the FeO–HA complexes was determined byan Infrared Sulfur and Carbon Analyzer-HCS878G (SichuanJingke Instrument Manufacturing Co. Ltd., China).

154 J O U R N A L O F E N V I R O N M E N T A L S C I E N C E S 4 2 ( 2 0 1 6 ) 1 5 2 – 1 6 2
1.2. Adsorption kinetics
0.040 g samples of the FeO–HA complexes were prepared,with the addition of 25 mL of a 20 mg/L KH2PO4 solution (Pconcentration), in 100 mL centrifuge tubes. The pH andsolution ionic strength (I) of the system were controlled at 7and 0.01 mol/L KNO3, respectively. Samples oscillating at aconstant temperature (25°C) and rotation speed (220 r/min),for 1, 5, 10, 20, 30, 60, 180, 720, 1080, 1440, 2160, and 2880 minwere filtered through a mixed cellulose ester 0.45 μm filtermembrane to determine the P content in the filtrate. P contentwas determined using the modified molybdenum blue meth-od (Murphy and Riley, 1962; Wei, 2002), with pure FeO as thecontrol (the same method is used for determining P concen-tration in subsequent sections).
1.3. Adsorption isotherms
0.040 g samples of the FeO–HA complexes were prepared,with the addition of 25 mL of 1, 5, 10, 15, 20, 50, 80, 120, 180,and 250 mg/L KH2PO4 solutions (P concentration), in 100 mLcentrifuge tubes. The pH and I of the system werecontrolled at 7 and 0.01 mol/L KNO3, respectively. Afteroscillating at a constant temperature (25°C) and rotationspeed (220 r/min) for 24 hr, the samples were filteredthrough a 0.45 μm membrane to determine the P concen-tration in the filtrate.
1.4. Effects of ionic strength on adsorption
0.040 g samples of the FeO–HA complexes were prepared,with the addition of 20 mg/L KH2PO4 solution (P concentra-tion), in 100 mL centrifuge tubes. The I values of the systemwere controlled at 1, 0.1, 0.01, and 0.001 mol/L KNO3, while thepH was adjusted to 7. After oscillating at a constanttemperature (25°C) and rotation speed (220 r/min) for 24 hr,the samples were filtered through a 0.45 μm membrane todetermine the P concentration in the filtrate.
1.5. Effects of pH on adsorption
0.040 g samples of the FeO–HA complexes were prepared,with the addition of 20 mg/L KH2PO4 solution (P concen-tration), in 100 mL centrifuge tubes. The pH values of thesystem were controlled at 2, 3, 5, 7, 9, 11, and 12, whilethe I value was maintained at 0.01 mol/L KNO3. Afteroscillating at a constant temperature (25°C) and rotationspeed (220 r/min) for 24 hr, the samples were filteredthrough a 0.45 μm membrane to determine the P con-centration in the filtrate.
1.6. Data processing
Triplicate measurements of the samples, blank controlgroup (P-free), and adsorption-agent-free control groupwere conducted for each adsorption experiment. All resultsare reported here as average values and the relativestandard deviation was less than 5%. Data processingand plotting were carried out using Origin 8.5 and Excel2013.
2. Results and discussion
2.1. Structural features of FeO–HA complexes
The XRD patterns showed that synthesized pure FH and GEexhibited the specific peaks well-matched well with those ofstandards, which indicated that the prepared FH had poorcrystallinity with a 2-line pattern and the prepared GE hadgood crystallinity (Fig. 1). In contrast, both types of FeO–HAcomplexes showed lower intensity diffraction peaks com-pared with pure FeO; for instance the peaks of the GE-HAcomplex corresponding to the 101, 040, and 041 crystal planesalmost disappeared, and the peaks of the FH–HA complex at0.250 nm and 0.151 nm became broad, revealing poorercrystallinity.
FH particles had an irregular shape, with some smallholes and wrinkles on an uneven surface, with BET SSA of259.8 m2/g (Fig. 2a). For FH–HA, HA particles were tightlybound to the FH surface, and some particles entered the holesand wrinkles on the FH surface, and the BET surface areadecreased to 163.3 m2/g (Fig. 2b). The GE particles showed anobvious acicular-shaped morphology with non-uniformdiameter, smooth surface, and SSA of 31.7 m2/g (Fig. 2c). TheGE–HA particles had uniform morphology and showedsignificant agglomeration due to the wrapping of flakyparticles with acicular particles. The agglomerated particleshad non-uniform size and the SSA was reduced to 25.5 m2/g(Fig. 2d). Clearly, this reveals that the coating of HA candecrease the surface area of iron minerals, which is in linewith the observation of Kaiser and Guggenberger (2003) thatsorption of OM reduced the mineral SSA.
The FT-IR spectra of FeO–HA complexes and pure FeO areshown in Fig. 3. The peaks of pure FeO at 464, 561, 1028 cm−1
and 634, 797, 892 cm−1 were the characteristic absorptionpeaks for FH (Mazzetti and Thistlethwaite, 2002; Musić et al.,1993) and GE (Xu et al., 2013), respectively. Meanwhile, bothFH–HA and GE–HA also showed the above-mentioned peaksconsistent with the corresponding pure FeO. These resultsindicate that the combination of HA and FeO did not changethe internal structure of the FeO, which is consistent withthe results of XRD. For FH–HA, the peak at 1385 cm−1 causedby residual NO3
− during FH preparation (Mazzetti andThistlethwaite, 2002) was significantly lower than that of FH,which may be due to the fact that the NO3
− adsorbed on theFeO surface was replaced by HA. Compared with FH, theabsorption peaks of FH-HA at about 3400 cm−1 werered-shifted with a decrease in peak intensity; the peakintensity at 1618 cm−1 was reduced and the peak wasbroadened; in addition, an absorption peak appeared at1561 cm−1, and both two peaks corresponded to the –OHgroup (Mazzetti and Thistlethwaite, 2002; Russell, 1979).Meanwhile, similar results were obtained for both GE–HAand GE (Xu et al., 2013). The above peak changes in the FeO–HA acid complexes at 3400 and 1600 cm−1 may be caused bythe binding of HA onto FeO. In addition, compared with HA,the symmetric stretching vibration peak of COO− groups at1389 cm−1 disappeared in FeO–HA complexes, and the inten-sity of the antisymmetric stretching peak of COO− groups at1618 cm−1 declined or disappeared (Hay and Myneni, 2007).
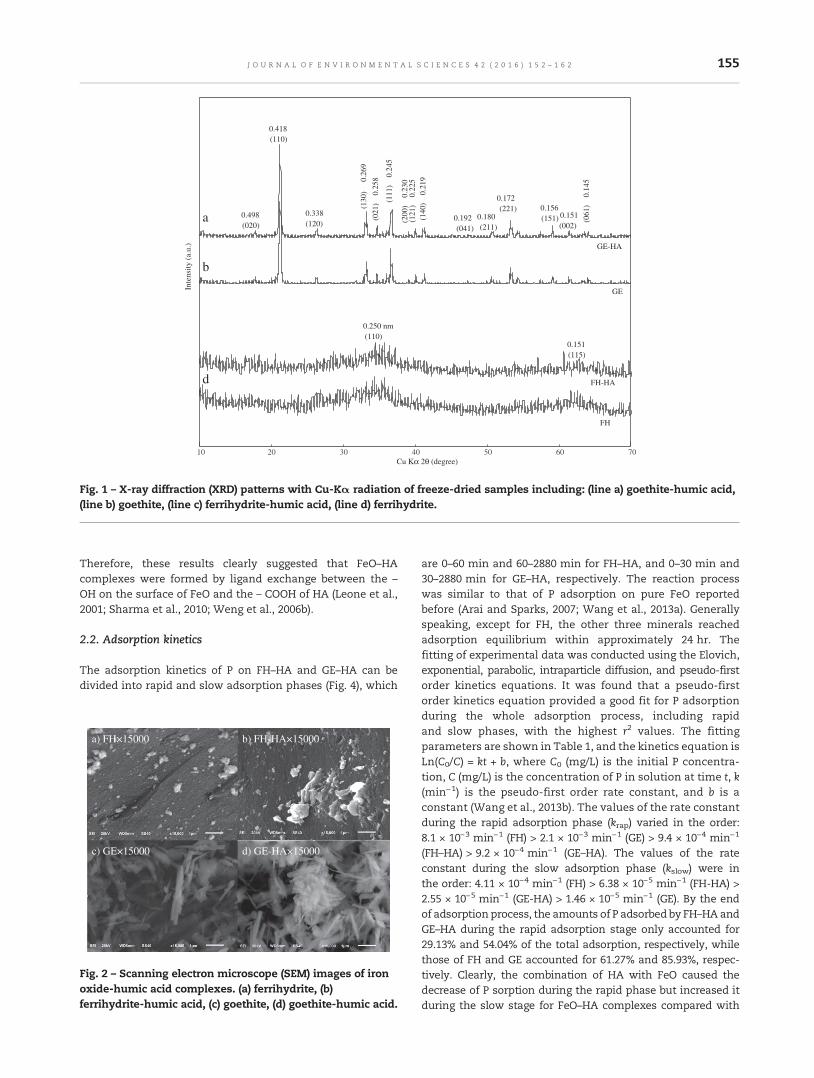
10 20 30 40 50 60 70
Inte
nsity
(a.
u.)
Cu Kα 2θ (degree)
GE-HA
GE
FH-HA
FH
0.250 nm(110)
0.151(115)
0.418(110)
0.498(020)
0.338(120)
0.192(041)
0.180(211)
0.172(221) 0.156
(151) 0.151(002)
(130
)0.
269
(021
)0.
258
(111
)0.
245
(121
)0.
225
(140
)0.
219
(200
)0.
230
(061
)0.
145
a
b
d
Fig. 1 – X-ray diffraction (XRD) patterns with Cu-Kα radiation of freeze-dried samples including: (line a) goethite-humic acid,(line b) goethite, (line c) ferrihydrite-humic acid, (line d) ferrihydrite.
155J O U R N A L O F E N V I R O N M E N T A L S C I E N C E S 4 2 ( 2 0 1 6 ) 1 5 2 – 1 6 2
Therefore, these results clearly suggested that FeO–HAcomplexes were formed by ligand exchange between the –OH on the surface of FeO and the – COOH of HA (Leone et al.,2001; Sharma et al., 2010; Weng et al., 2006b).
2.2. Adsorption kinetics
The adsorption kinetics of P on FH–HA and GE–HA can bedivided into rapid and slow adsorption phases (Fig. 4), which
a) FH×15000
c) GE×15000
b) FH-HA×15000
d) GE-HA×15000
Fig. 2 – Scanning electron microscope (SEM) images of ironoxide-humic acid complexes. (a) ferrihydrite, (b)ferrihydrite-humic acid, (c) goethite, (d) goethite-humic acid.
are 0–60 min and 60–2880 min for FH–HA, and 0–30 min and30–2880 min for GE–HA, respectively. The reaction processwas similar to that of P adsorption on pure FeO reportedbefore (Arai and Sparks, 2007; Wang et al., 2013a). Generallyspeaking, except for FH, the other three minerals reachedadsorption equilibrium within approximately 24 hr. Thefitting of experimental data was conducted using the Elovich,exponential, parabolic, intraparticle diffusion, and pseudo-firstorder kinetics equations. It was found that a pseudo-firstorder kinetics equation provided a good fit for P adsorptionduring the whole adsorption process, including rapidand slow phases, with the highest r2 values. The fittingparameters are shown in Table 1, and the kinetics equation isLn(C0/C) = kt + b, where C0 (mg/L) is the initial P concentra-tion, C (mg/L) is the concentration of P in solution at time t, k(min−1) is the pseudo-first order rate constant, and b is aconstant (Wang et al., 2013b). The values of the rate constantduring the rapid adsorption phase (krap) varied in the order:8.1 × 10⁻³ min−1 (FH) > 2.1 × 10⁻³ min−1 (GE) > 9.4 × 10⁻⁴ min−1
(FH–HA) > 9.2 × 10⁻⁴ min−1 (GE–HA). The values of the rateconstant during the slow adsorption phase (kslow) were inthe order: 4.11 × 10⁻⁴ min−1 (FH) > 6.38 × 10⁻⁵ min−1 (FH-HA) >2.55 × 10⁻⁵ min−1 (GE-HA) > 1.46 × 10⁻⁵ min−1 (GE). By the endof adsorption process, the amounts of P adsorbed by FH–HA andGE–HA during the rapid adsorption stage only accounted for29.13% and 54.04% of the total adsorption, respectively, whilethose of FH and GE accounted for 61.27% and 85.93%, respec-tively. Clearly, the combination of HA with FeO caused thedecrease of P sorption during the rapid phase but increased itduring the slow stage for FeO–HA complexes compared with

464561
1028
1384
1618
33873405
1561
3432
1618
1389
Nor
mal
ized
tran
smitt
ance
Wavenumber (cm)
FH
FH-HA
HA
6347978921654 15603423
34243432
1618
1389
4000 3500 3000 2500 2000 1500 1000 500 4000 3500 3000 2500 2000 1500 1000 500
Nor
mal
ized
tran
smitt
ance
Wavenumber (cm)
GE
GE-HA
HA
d
e
c
a
b
c
Fig. 3 – Fourier transform infrared spectroscopy (FT-IR) spectra of freeze-dried samples. Labels correspond to different samples:(line a) ferrihydrite, (line b) ferrihydrite-humic acid, (line c) humic acid, (line d) goethite, and (line e) goethite-humic acid.Spectra baselines were offset to improve visual clarity of FT-IR spectra.
156 J O U R N A L O F E N V I R O N M E N T A L S C I E N C E S 4 2 ( 2 0 1 6 ) 1 5 2 – 1 6 2
amorphous FeO alone. GE is a crystalline iron mineral with arelatively small amount of adsorption sites, as compared withamorphous FH with a large SSA and adsorption sites available.Thus GE could rapidly reach adsorption saturation during therapid adsorption phase, and the adsorption rate was signifi-cantly reduced during the slow adsorption phase. Meanwhile,the advent of equilibrium for the adsorption of P on GE–HAwasdelayed because of inhibition by HA, and the rate constant ofGE–HA was higher than GE at the slow P adsorption stage. Onthe other hand, the latter had sufficient adsorption sites and thehighest SSA value, resulting in diffusion behavior that lasted fora longer time, and the adsorption rate constantwas higher thanFH–HA during both rapid and slow phases.
0 500 1000 1500 2000 2500 3000
0.0
0.5
1.0
1.5
2.0
ln (
C0 /C
)
Time (min)
FH
FH-HAGEGE-HA
Fig. 4 – Pseudo-first order kinetics fitting curves for twostages of phosphorus adsorption on iron oxide-humic acidcomplexes with an initial phosphorus concentration of20 mg/L (pH 7.0, 0.01 mol/L KNO3). FH: ferrihydrite, GE:goethite, HA: humic acid; FH-HA: ferrihydrite-humic acid;GE-HA: goethite-humic acid.
2.3. Adsorption isotherms
As shown in Fig. 5, the amount of P adsorbed on FeO–HAcomplexes increased with the initial P concentration, which issimilar to the result on pure FeO. When the initial Pconcentration was less than 50 mg/L, the amount of adsorbedP increased rapidly. However, the amount of adsorbed Pincreased much more slowly when the concentration wasgreater than 50 mg/L. The Langmuir (Eq. (1)) and Freundlich(Eq. (2)) isotherm models, were used to fit the data.
Qe ¼ Qmax � kL � Ce= 1þ kL � Ceð Þ ð1Þ
Qe ¼ kF � Ce1=n ð2Þ
where, Qe (mg/g) is the amount of adsorbed P, Qmax (mg/g) isthe maximum adsorption capacity, and kL, kF, and n are allconstants related to the adsorption. Results showed that bothprovided a good fit for P isothermal adsorption.
According to the Langmuir fitting results, the Qmax
values (expressed on a mass basis) varied in the followingorder: 22.17 mg/g (FH) > 5.43 mg/g (FH–HA) > 4.67 mg/g(GE) > 3.27 mg/g (GE–HA) (Table 2). By comparing the Gibbsfree energy (ΔG) and adsorption equilibrium parameter (RL),
Table 1 – Fitting results of the pseudo-first order kineticsequation for two stages of phosphorus adsorption on ironoxide-humic acid complexes. The whole kinetics processwas divided into two parts including rapid and slowstages.
Ln(C0/C) = kt + b
krap (min−1) brap rrap2 kslow (min−1) bslow rslow2
FH 8.06 × 10⁻³ 0.31 0.90 4.11 × 10⁻⁴ 0.94 0.90FH-HA 9.38 × 10⁻⁴ 0.014 0.85 6.38 × 10⁻⁵ 0.097 0.85GE 2.08 × 10⁻³ 0.18 0.84 1.46 × 10⁻⁵ 0.24 0.99GE-HA 9.21 × 10⁻⁴ 0.056 0.64 2.55 × 10⁻⁵ 0.091 0.88
FH: ferrihydrite; GE: goethite; HA: humic acid; FH-HA:ferrihydrite-humic acid; GE-HA: goethite-humic acid.

Table 2 – Adsorption model fitting results for thephosphorus adsorption isotherms of the ironoxide-humic acid complexes.
FH FH-HA GE GE-HA
Langmuir fittingkL 0.17 0.05 0.13 0.05Qmax (mg/g) 22.17 5.43 4.67 3.27Qmax (mg/m2) 0.085 0.033 0.147 0.128MBCa(mg/g) 3.77 0.29 0.61 0.17ΔGb(kJ/mol) −21.24 −18.35 −20.58 −18.31RL
c 0.85 0.95 0.88 0.95r2 0.99 0.99 0.99 0.95
Freundlich fittingkF 7.52 0.90 1.29 0.40n 4.87 3.05 3.73 2.35r2 0.99 0.99 0.98 0.94
FH: ferrihydrite; GE: goethite; HA: humic acid; FH-HA:ferrihydrite-humic acid; GE-HA: goethite-humic acid.a MBC is themaximum buffer capacity of adsorption. MBC = kL × Qmax.Higher MBCmeans greater adsorption capacity of adsorbent.b ΔG is the adsorption reaction Gibbs free energy. ΔG = −R × T ×Ln(kL × 30974), R = 8.314 J/mol, T = 298.15 K (25°C). Morenegative value means the adsorption can occur morespontaneously.c RL is a dimensionless constant called the adsorption equilibriumparameter, which is defined as RL = 1/(1 + kL × C0). C0 (mg/L) is theinitial concentration. Adsorption process is indicated by eitherunfavorable (RL > 1), linear (RL = 1), favorable (0 < RL < 1) orirreversible (RL = 0).
157J O U R N A L O F E N V I R O N M E N T A L S C I E N C E S 4 2 ( 2 0 1 6 ) 1 5 2 – 1 6 2
it could be concluded that the FeO–HA complexes signifi-cantly decreased the P adsorption ability. RL was less than 1in all cases, which revealed that the adsorption processeswere favorable. However, the RL of the complexes werecloser to 1, indicating that P adsorption on complexesappeared less favorable than on the raw iron minerals. Inaddition, it could be observed in Table 2 that the originaliron minerals had greater maximum buffer capacity (MBC)than the complexes. This suggestted that the adsorptioncapacity of P on the complexes decreased, which was alsodemonstrated by Freundlich modeling.
The value of 1/n in the Freundlich model reflects theadsorption strength (Stellacci et al., 2009); the smaller thevalue, the more preferential the adsorption properties. Avalue of 1/n close to 0 suggests the adsorption surface is moreheterogeneous (Sposito, 1989; Lu et al., 2014). Usually, amaterial with a 1/n value of 0.1–0.5 has a high adsorptioncapacity. In this study, the 1/n values for P adsorption onto thefour materials varied in the following order: 0.21 (FH) < 0.27(GE) < 0.33 (FH-HA) < 0.43 (GE-HA). This suggestted that theraw FeO had higher heterogeneity than the organic-mineralcomplexes. This conclusion was supported by the observedmorphologies in SEM images and the reduced SSA after HAcoating.
Additionally, both the kL and kF values in the two modelsreflect the binding constants (Borggaard et al., 2005). The kLand kF values of FH–HA and GE–HA were far less than those ofFH and GE, demonstrating that the P binding capacities of theFeO–HA complexes were much lower than those of raw ironminerals. Besides, the reduction degree of P adsorption ontothe iron mineral-HA complexes clearly depended on the typeof mineral. Amorphous FeO (FH) associated with HA still
0 50 100 150 200 2500
5
10
15
20
25
Qe
(mg/g
)
Ce (mg/L)
FH
FH-HA
GE
GE-HA
Fig. 5 – Adsorption isotherms of phosphorus on the ironoxide-humic acid complexes with the Freundlich model atpH 7.0 and 0.01 mol/L KNO3 after 24 hr equilibrium time. Thedata points represent the adsorption amount of P (Qe) at arelevant equilibrium concentration of solution (Ce), FH:ferrihydrite; GE: goethite; HA: humic acid; FH-HA:ferrihydrite-humic acid; GE-HA: goethite-humic acid.
showed higher reactivity in comparison with the relativelycrystalline FeO–HA (GE–HA) complex.
Further, the different SSA of the minerals may also explainthe different P adsorption results onto the four adsorbents,because SSA can provide an estimation of the potentialavailable sites for P sorption. We also observed a similarpositive relationship between the SSA of adsorbents and theQmax of P sorption as reported by Nelson et al. (1992),indicating that the Qmax depended on minerals SSA by acertain degree. Thus, the SSAof rawFeOwas larger compared toFeO–HA complexes, which showed that P-mineral interactionson the former surfaces were higher than on the lattersurfaces. When Qmax is expressed as mg/m2 derived from SSA,as shown in Table 2, the order of increasing sorption,GE > GE-HA > FH > FH-HA, is different from the order whenQmax is expressed on a mass basis (FH > FH-HA > GE > GE-HA).ThisQmax (mg/m2) ordermight also reflect a possibly increasingtrend of mineral surface area charge density, and thereforeevidentially support the hypothesis that changes of surfacecharge possibly play an important role in the processes.Considering the surface charge of adsorbents, FeO includingFH and GE usually have a higher point zero of charge (PZC) thanHA (PZCof FHat pH 7.9, PZC ofGE at pH 7.5–9.5, but PZC ofHAatpH 2–4) (Kleber et al., 2015; Qin et al., 2015). Thus the PZC of thecomplexes should be between the PZC of raw iron mineral andHA. In fact, we measured the PZC of the four adsorbents in thisstudy. The results were consistent with the above analysis: thePZC of FH,FH-HA,GE and GE-HA were 8.2,7.7, 9.1 and 8.5,respectively. At pH = 7 in this isothermal experiment, the FeOsurface becomesmorenegative after HA coating. So, the surface

0.001 0.01 0.1 1
2
4
10
12
Q (
mg/
g)
I (mol/L)
FH
FH-HA
GE
GE-HA
Fig. 6 – Phosphorus adsorption changes of iron oxide-humicacid complexes at different electrolyte concentrations withan initial phosphorus concentration of 20 mg/L (pH 7.0) after24 hr equilibration time. The data points represent theadsorption amount of P (Q) at a given electrolyteconcentration (I), FH: ferrihydrite; GE: goethite; HA: humicacid; FH-HA: ferrihydrite-humic acid; GE-HA: goethite-humicacid.
158 J O U R N A L O F E N V I R O N M E N T A L S C I E N C E S 4 2 ( 2 0 1 6 ) 1 5 2 – 1 6 2
of minerals dominated by HA in FeO–HA complexes wasinclined to restrain rather than increase P adsorption.
Thus, according to the aforementioned experimentalresults and explanations, we could speculate that thepossible reasons for decreasing P adsorption on FeO-HAwere three-fold: (1) the main adsorption surface was that ofthe iron mineral rather than HA. Interaction between P andthe iron mineral still controls the final P adsorption that weobserve; (2) HA coating is inclined to act as a competitor with Pto occupy the binding sites on themineral surface, resulting infurther reduction in P adsorption. The main coordinatinggroups on the surface of FeO were FeOH1/2−, Fe2OH0, Fe3O1/2−.However, Fe2OH0 groups are inert in the near-neutral pHrange, and the reactions between Fe2OH0/Fe3O1/2− groups andphosphate can often be ignored (Antelo et al., 2005, 2010;Tadanier and Eick, 2002). So, FeOH1/2− on the FeO surface maybe the adsorption sites occupied by the HA coating inour study. P could be bound to HA via metal bridges such aswith organically complexed Fe3+ (Gerke and Hermann, 1992),although this contribution is also negligible; and (3) themore negative surface charge resulting from the HA coatingrepulses further P adsorption.
2.4. Effects of ionic strength
The effects of different initial concentrations of electrolyte(KNO3) on P adsorption on FeO–HA complexes were investi-gated when the initial P concentration was 20 mg/L and pHwas 7 (Fig. 6). With increasing initial KNO3 concentration, theamounts of adsorbed P on the four minerals all graduallyincreased. For P adsorption on FH-HA and GE-HA, bothshowed similar trends as on the raw iron minerals. Somestudies found (Antelo et al., 2005; Rahnemaie et al., 2007) thatat relatively low pH, the increase in electrolyte concentrationhad less impact on P adsorption; while when pH was greaterthan 6 the increase in electrolyte concentration favored Padsorption. This could be explained by high electrolyteconcentration changing the surface potential of adsorbentand reducing electrostatic repulsion, which promotes Padsorption (Rahnemaie et al., 2007). More importantly, thecation K+ may bridge the negatively charged surfaces of solidmineral phases and negatively charged PO4
3− (Arai and Sparks,2001). Additionally, the influence of ionic strength on Padsorption on FeO–HA complexes is more sensitive for theamorphous FH–HA complex than the crystalline GE–HA com-plex. We calculated the net increase of P sorption (Pnet) due toincreasing K+ from 0.001 to 1 mol/L; the difference for FH(2.21 mg/g) was more significant than for FH-HA (1.52 mg/g),which was greater than the difference observed between GE(1.09 mg/g) and GE-HA (1.14 mg/g). The role of the cationicbridge may be masked because of the obvious differences inadsorption capacity; as a result, the increase in P adsorption forFH-HAwas lower than that for FH, while the increase for GE-HAwas slightly higher than that for GE.
Further, a strong dependence on ionic strength is typicalfor outer-sphere rather than inner-sphere complexation.However, at high electrolyte concentrations, P adsorption onFeO still leads to an increase in the formation of inner-spherecomplexes, whose negative surface charge is neutralized bythe co-adsorbed electrolyte cations (e.g., K+, Na+), thereby
promoting P adsorption (Arai and Sparks, 2001) with increas-ing I. The reaction is as follows:
≡Fe‐OHþ Kþ þHPO42−→≡Fe‐O‐PO3H⋯⋯Kþ þH2O:
Thus, this observation seems to indicate that for P adsorp-tion on FeO–HA complexes, outer-sphere complexes betweenthe OM component surface and P involving electrostaticbonding mechanisms possibly coexist with inner-spheresurface complexes between the iron mineral component andP, which necessarily involve largely covalent bonding.
2.5. Effects of pH
The effects of initial pH (2–12) on the P adsorption on FeO–OMcomplexes were explored with the initial P concentration of20 mg/L and I of 0.01 mol/L (Fig. 7). In our study, pHdependency of P adsorption was observed in all four minerals.It was found that the amount of adsorbed P on FH-HA andGE-HA decreased with increasing initial pH values, which wasconsistent with the trends in raw FeO as reported previously(Geelhoed et al., 1997), and also similar to previous reports onsorption of other oxyanions (e.g., arsenate) (Xie, 2012). AfterHA is coated on a mineral, due to the PZC decrease, thesurface becomes more negatively charged due to surfacedeprotonation from increasing pH, so PO4
3− adsorption be-comes less electrostatically favorable. In particular, this mayoccur for the reduction in P adsorption at high pH (Antelo etal., 2010), such as was the case at pH = 12 in our study.Additionally, there were no significant differences in pHimpact between FeO–HA complexes and pure FeO. HA coatingpossibly changed the surface PZC of iron minerals, but did notchange the adsorption mechanism of P on the solid phase.

159J O U R N A L O F E N V I R O N M E N T A L S C I E N C E S 4 2 ( 2 0 1 6 ) 1 5 2 – 1 6 2
The pH-dependent adsorption might be a strong piece ofevidence to support that iron mineral controls the P adsorp-tion. Comparatively, pH increase leads to increase of Padsorption in the case of P binding with HA via iron bridging(Gerke and Hermann, 1992), thus the results in our study alsoindicate that interaction between P and HA could not be themain mechanism for P adsorption by FeO–HA complexes.
2.6. Comparison and environmental implications
In this study, the mineral phase was the key factor in theprocess of P adsorption on FeO–HA complexes, rather than theorganic phase. HA in the complexes occupies a large numberof adsorption sites on the mineral surface, but this did notchange the tendency of P adsorption, which was not consis-tent with the mechanisms from previous studies on theadsorption of heavy metals or organic pollutants by FeO–OMcomplexes (Table 3). Previous studies showed that both FeOand OMs in FeO–OM complexes are almost equally responsi-ble for adsorption of heavy metals or organic pollutants. OMloaded on minerals could even provide extra sites availablefor metal ion binding, and increase the hydrophobicity topromote the “hydrophobic interaction” with organic pollut-ants. In contrast, in terms of the effect on P adsorption, theresult was similar that of arsenic adsorption as previouslyreported (Ko et al., 2004; Xie, 2012), as arsenate and phosphateare both oxyanions sharing similar geochemical properties.
We believe that the P bound to FeO–HA complexes also has
2 4 6 8 10 120
2
4
6
8
10
12
Q (
mg/
g)
pH
FH
FH/HA
GE
GE/HA
Fig. 7 – Phosphorus adsorption changes of iron oxide-humicacid complexes at different pH conditions with an initialphosphorus concentration of 20 mg/L (I = 0.01 mol/L KNO3)after 24 hr equilibrium time. The data points represent theadsorption amount of P (Q) at a given pH value, FH:ferrihydrite; GE: goethite; HA: humic acid; FH-HA:ferrihydrite-humic acid; GE-HA: goethite-humic acid.
profound environmental implications, as mineral-OM associ-ations are ubiquitous in the environment. Under certainfavorable conditions, the complexes may also become mobi-lized and transported in dissolved and colloidal forms, thus
increasing P mobility. Additionally, currently ternary complexformation between arsenate and Fe3+-OM co-precipitation hasbeen proposed to explain the role of iron-OM in arsenateadsorption and mobility. However, further investigation isneeded to understand whether this mechanism for P bindingoccurs in bulk OM coated on FeO, because releases of Fe3+/Fe2+
from solid mineral phases is ubiquitous in wetlands, floodedsoils and sediments under anoxic conditions (Elsner et al.,2004).
FeO in the environment are often associated with NOM,withmore than 20% of OM being buried in sediments bound toiron mineral surfaces (Lalonde et al., 2012). However, mostprevious studies havemerely focused on P adsorption on pureFeO in the lab, leading to an overestimation of the Padsorption and fixation capacities of FeO in the real environ-ment, especially in the organic-rich agricultural areas wherephosphate fertilizer is over-used. On the other hand, forma-tion of FeO–OM complexes, as an important mechanism forthe stabilization of OM, enables carbon fixation in soil, whichcould affect the global carbon cycle and global warming(Lalonde et al., 2012; Lützow et al., 2006). Thus, the resultshere can be further used to understand the eutrophicationdriven by P fate in the context of global climate change.
Formation of iron mineral-OM complexes in the field of Padsorption described above, which preferentially decreases Padsorption, also explains the phenomenon that P adsorptionis lower in humic-rich soil/sediments although iron mineralsare abundant, in contrast to mineral soils (Fontes et al., 1992).Our data show that the traditional P adsorption mechanism,established through direct adsorption on the raw mineralsurfaces, does not accurately describe the true mode of Pimmobilization in soil/sediment, especially in high OM loadareas such as wetlands, forest floors and riparian belts.
3. Conclusions
The results show that the presence of HA decreases thespecific surface area of FeO, especially amorphous FeO, butdid not change their internal structure. The P adsorptioncapacities of FeO–HA complexes were all less than those ofthe corresponding raw FeO. Additionally, the decrease trendfor P adsorption on amorphous FH was far greater than that ofcrystalline GE. HA coated on FeO may affect P adsorption bycompetitively occupying the sites on the mineral surface orthrough changing electrostatic repulsion. However, the mainadsorption surface could still be the iron mineral rather thanHA. Meanwhile, increasing pH inhibited P adsorption, whileincreasing ionic strength promoted P adsorption. It is inter-esting that the strong dependence on ionic strength of Padsorption might demonstrate that, for P adsorption on ironmineral-OM, outer-sphere complexes between the OM com-ponent surface and P possibly coexist with inner-spheresurface complexes between the iron mineral component andP. These results suggest thatmost previous studies focused onthe P adsorption on raw mineral or clay may overestimate theP adsorption ability of soil/sediment in the natural environ-ment. To the best of our knowledge, this study is the firstattempt to investigate P adsorption onto FeO associated withOM.

Tab
le3–Com
pariso
nof
theresu
ltsfrom
reference
son
theeffect
ofm
ineral-o
rgan
icm
atterco
mplex
eson
adso
rption
ofdifferen
tpo
llutants.
Ads
orbe
nt
Ads
orba
teRes
ults
Mec
han
ism
Referen
ce
Hem
atite-humic
subs
tance
Hyd
roph
obic
orga
nic
compo
unds
(HOC)
HOCad
sorbed
increa
sedwithincrea
singhumic
subs
tance
sload
edHyd
roph
obicityincrea
sed
Murp
hyet
al.(19
90)
GE/hem
atite-HA
Phen
anth
rene
Thebindingco
efficien
ts,K
b(oc),o
btained
fordissolve
dHA
weremuch
higher
than
theso
rption
coefficien
ts,K
p(oc),o
btained
forMineral-H
ALe
ssav
ailablesites
Laor
etal.(19
98)
FH-H
AIm
idaz
olinon
eherbicide
sMor
eHA
load
edon
FH-H
A,m
oreherbicide
adso
rbed
Hyd
roph
obicityincrea
sed
Leon
eet
al.(20
01)
Hem
atite-HA
Cd2
+Cd2
+ad
sorp
tion
increa
sedco
mpa
redwithbo
thsingleco
mpo
nen
tProv
ided
new
availablead
sorp
tion
sites
Vermee
ret
al.(19
99)
FH-tartrate/ox
alate
Cu2
+,C
r3+ ,
Pb2+
Mor
eca
rbon
contenton
adso
rben
t,mor
ehea
vymetalsad
sorbed
Prov
ided
new
availablead
sorp
tion
sites
Zhuet
al.(20
10)
FH-fulvic
acid
Pb2+
Pb2+
adso
rption
increa
sedco
mpa
redwithFH
Prov
ided
new
availablead
sorp
tion
sites
Wei
andXiang(201
3)Hem
atite-HA
As(V),As(III)
Alower
adso
rption
capa
city
compa
redwithba
rehem
atite
HA
occu
pied
thead
sorp
tion
sites
Koet
al.(20
04)
FH/G
E/hem
atite-HA
As(V)
As(V)a
dsor
ptionde
crea
sedco
mpa
redwithpu
reiron
oxides
HA
occu
pied
thead
sorp
tion
sitesan
dth
epo
sitive
charge
decrea
sed
Xie
(201
2)
Fe3+-H
APO
43−
Themolar
ratioP a
dso
rbed/Feof
Fe3+-H
Aco
mplex
was
higher
than
amor
phou
sFe
-oxide
Form
edtern
aryco
mplex
viametal
bridge
betw
eenPan
dHA
Gerke
andHerman
n(199
2)
FH:ferrihyd
rite;G
E:go
ethite;
HA:h
umic
acid;F
H-H
A:ferrihyd
rite-h
umic
acid;G
E-HA:g
oeth
ite-humic
acid.
160 J O U R N A L O F E N V I R O N M E N T A L S C I E N C E S 4 2 ( 2 0 1 6 ) 1 5 2 – 1 6 2
Acknowledgments
This work was supported by the National Natural ScienceFoundation of China (Nos. 41171198, 41403079), the ChinaPostdoctoral Science Foundation (No. 2013M542238), theChongqing Special Postdoctoral Science Foundation (No.Xm2014023), and the Fundamental Research Funds for theCentral Universities (No. XDJK2015B035).
R E F E R E N C E S
Antelo, J., Avena, M., Fiol, S., López, R., Arce, F., 2005. Effects of pHand ionic strength on the adsorption of phosphate andarsenate at the goethite-water interface. J. Colloid InterfaceSci. 285 (2), 476–486.
Antelo, J., Fiol, S., Pérez, C., Mariño, S., Arce, F., Gondar, D., et al.,2010. Analysis of phosphate adsorption onto ferrihydriteusing the CD-MUSIC model. J. Colloid Interface Sci. 347 (1),112–119.
Arai, Y., Sparks, D.L., 2001. ATR-FTIR spectroscopic investigation onphosphate adsorption mechanisms at the ferrihydrite-waterinterface. J. Colloid Interface Sci. 241 (2), 317–326.
Arai, Y., Sparks, D.L., 2007. Phosphate reaction dynamics in soilsand soil components: a multiscale approach. Adv. Agron. 94,135–179.
Axt, J.R., Walbridge, M.R., 1999. Phosphate removal capacity ofpalustrine forested wetlands and adjacent uplands in Virginia.Soil Sci. Soc. Am. J. 63 (4), 1019–1031.
Baldock, J.A., Skjemstad, J.O., 2000. Role of the soil matrix andminerals in protecting natural organic materials againstbiological attack. Org. Geochem. 31 (7-8), 697–710.
Borggaard, O.K., Raben-Lange, B., Gimsing, A.L., Strobel, B.W.,2005. Influence of humic substances on phosphate adsorp-tion by aluminium and iron oxides. Geoderma 127 (3),270–279.
Cruz-Guzmán, M., Celis, R., Hermosin, M.C., Leone, P., Nègre, M.,Cornejo, J., 2003. Sorption–desorption of lead (II) and mercury(II) by model associations of soil colloids. Soil Sci. Soc. Am. J. 67(5), 1378–1387.
Ekholm, P., Lehtoranta, J., 2012. Does control of soil erosioninhibit aquatic eutrophication? J. Environ. Manag. 93 (1),140–146.
Elsner, M., Schwarzenbach, R.P., Haderlein, S.B., 2004. Reactivityof Fe (II)-bearing minerals toward reductive transformationof organic contaminants. Environ. Sci. Technol. 38 (3),799–807.
Fontes, M.R., Weed, S.B., Bowen, L.H., 1992. Association ofmicrocrystalline goethite and humic acid in some Oxisols fromBrazil. Soil Sci. Soc. Am. J. 56 (3), 982–990.
Geelhoed, J.S., Hiemstra, T., Van Riemsdijk, W.H., 1997. Phosphateand sulfate adsorption on goethite: single anion andcompetitive adsorption. Geochim. Cosmochim. Acta 61 (12),2389–2396.
Geelhoed, J.S., Hiemstra, T., Van Riemsdijk, W.H., 1998.Competitive interaction between phosphate and citrate ongoethite. Environ. Sci. Technol. 32 (14), 2119–2123.
Gerke, J., Hermann, R., 1992. Adsorption of orthophosphate tohumic-Fe-complexes and to amorphous Fe-oxide. Z.Pflanzenernähr. Bodenkd. 155 (3), 233–236.
Gu, B., Schmitt, J., Chen, Z., Liang, L., McCarthy, J.F., 1994.Adsorption and desorption of natural organic matter on ironoxide: mechanisms and models. Environ. Sci. Technol. 28 (1),38–46.

161J O U R N A L O F E N V I R O N M E N T A L S C I E N C E S 4 2 ( 2 0 1 6 ) 1 5 2 – 1 6 2
Hay, M.B., Myneni, S.C.B., 2007. Structural environments ofcarboxyl groups in natural organic molecules from terrestrialsystems. Part 1: infrared spectroscopy. Geochim. Cosmochim.Acta 71 (14), 3518–3532.
Henneberry, Y.K., Kraus, T.E.C., Nico, P.S., Horwath, W.R., 2012.Structural stability of coprecipitated natural organic matterand ferric iron under reducing conditions. Org. Geochem. 48,81–89.
Hiemstra, T., Mia, S., Duhaut, P.B., Molleman, B., 2013. Natural andpyrogenic humic acids at goethite and natural oxide surfacesinteracting with phosphate. Environ. Sci. Technol. 47 (16),9182–9189.
Kaiser, K., Guggenberger, G., 2000. The role of DOM sorption tomineral surfaces in the preservation of organic matter in soils.Org. Geochem. 31 (7-8), 711–725.
Kaiser, K., Guggenberger, G., 2003. Mineral surfaces and soilorganic matter. Eur. J. Soil Sci. 54 (2), 219–236.
Kalbitz, K., Schwesig, D., Rethemeyer, J., Matzner, E., 2005.Stabilization of dissolved organic matter by sorption to themineral soil. Soil Biol. Biochem. 37 (7), 1319–1331.
Kleber, M., Eusterhues, K., Keiluweit, M., Mikutta, C., Mikutta, R.,Nico, P.S., 2015. Mineral–organic associations: formation,properties, and relevance in soil environments. Adv. Agron.130, 1–140.
Ko, I., Kim, J.Y., Kim, K.W., 2004. Arsenic speciation and sorptionkinetics in the As-hematite-humic acid system. Colloids Surf.A 234 (1), 43–50.
Lalonde, K., Mucci, A., Ouellet, A., Gélinas, Y., 2012. Preservation oforganic matter in sediments promoted by iron. Nature 483,198–200.
Laor, Y., Farmer, W.J., Aochi, Y., Strom, P.F., 1998. Phenanthrenebinding and sorption to dissolved and to mineral-associatedhumic acid. Water Res. 32 (6), 1923–1931.
Leone, P., Nègre, M., Gennari, M., Boero, V., Cornejo, J., 2001.Adsorption of imidazolinone herbicides on ferrihydrite-humic acid associations. J. Environ. Sci. Health B 36 (2),127–142.
Lijklema, L., 1980. Interaction of orthophosphate with iron(III)and aluminum hydroxides. Environ. Sci. Technol. 14 (5),537–541.
Lu, L., Gao, M., Gu, Z., Yang, S., Liu, Y., 2014. A comparative studyand evaluation of sulfamethoxazole adsorption ontoorgano-montmorillonites. J. Environ. Sci. 26 (12), 2535–2545.
Lützow, M.V., Kögel-knabner, I., Ekschmitt, K., Matzner, E.,Guggenberger, G., Marschner, B., et al., 2006. Stabilization oforganic matter in temperate soils: mechanisms and theirrelevance under different soil conditions—a review. Eur. J. SoilSci. 57, 426–445.
Mazzetti, L., Thistlethwaite, P.J., 2002. Raman spectra and thermaltransformations of ferrihydrite and schwertmannite. J. RamanSpectrosc. 33 (2), 104–111.
Murphy, J., Riley, J.P., 1962. A modified single solution method forthe determination of phosphates in natural water. Anal. Chim.Acta 27, 31–36.
Murphy, E.M., Zachara, J.M., Smith, S.C., 1990. Influence ofmineral-bound humic substances on the sorption ofhydrophobic organic compounds. Environ. Sci. Technol. 24(10), 1507–1516.
Musić, S., Gotić, M., Popović, S., 1993. X-ray diffraction andFourier transform-infrared analysis of the rust formed bycorrosion of steel in aqueous solutions. J. Mater. Sci. 28 (21),5744–5752.
Nelson, P.N., Baldock, J.A., Oades, J.M., 1992. Concentration andcomposition of dissolved organic carbon in streams inrelation to catchment soil properties. Biogeochemistry 19 (1),27–50.
Qin, X., Liu, F., Wang, G., Huang, G., 2015. Adsorption of humic acidfrom aqueous solution by hematite: effects of pH and ionicstrength. Environ. Earth Sci. 73 (8), 4011–4017.
Rahnemaie, R., Hiemstra, T., van Riemsdijk, W.H., 2007. Geometry,charge distribution, and surface speciation of phosphate ongoethite. Langmuir 23 (7), 3680–3689.
Russell, J.D., 1979. Infrared spectroscopy of ferrihydrite: evidencefor the presence of structural hydroxyl groups. Clay Miner. 14(2), 109–114.
Schwertmann, U., 1966. Inhibitory effect of soil organic matter onthe crystallization of amorphous ferric hydroxide. Nature 212,645–646.
Schwertmann, U., Cornell, R.M., 2000. IronOxides in the Laboratory:Preparation and Characterization. 2nd ed.Wiley-VCH,Weinheim,Germany.
Schwertmann, U., Wagner, F., Knicker, H., 2005. Ferrihydrite-humicassociations: magnetic hyperfine interactions. Soil Sci. Soc. Am. J.69 (4), 1009–1015.
Sharma, P., Ofner, J., Kappler, A., 2010. Formation of binary andternary colloids and dissolved complexes of organic matter, Feand As. Environ. Sci. Technol. 44 (12), 4479–4485.
Sharpley, A.N., Chapra, S.C., Wedepohl, R., Sims, J.T., Daniel, T.C.,Reddy, K.R., 1994. Managing agricultural phosphorus forprotection of surface waters, issues and options. J. Environ.Qual. 23 (3), 437–451.
Shimizu, M., Zhou, J., Schröder, C., Obst, M., Kappler, A., Borch, T.,2013. Dissimilatory reduction and transformation offerrihydrite-humic acid coprecipitates. Environ. Sci. Technol.47 (23), 13375–13384.
Sposito, G., 1989. The Chemistry of Soils. Oxford University Press,New York, USA, p. 277.
Stellacci, P., Liberti, L., Notarnicola, M., Bishop, P.L., 2009.Valorization of coal fly ash by mechano-chemical activation:part I. Enhancing adsorption capacity. Chem. Eng. J. 149 (1),11–18.
Tadanier, C.J., Eick, M.J., 2002. Formulating the charge-distributionmultisite surface complexation model using FITEQL. Soil Sci.Soc. Am. J. 66 (5), 1505–1517.
Vermeer, A.W.P., McCulloch, J.K., Van Riemsdijk, W.H., Koopal,L.K., 1999. Metal ion adsorption to complexes of humic acidand metal oxides: deviations from the additivity rule. Environ.Sci. Technol. 33 (21), 3892–3897.
Wang, X., Li, W., Harrington, R., Liu, F., Parise, J.B., Feng, X., et al.,2013a. Effect of ferrihydrite crystallite size on phosphateadsorption reactivity. Environ. Sci. Technol. 47 (18),10322–10331.
Wang, X., Liu, F., Tan, W., Li, W., Feng, X., Sparks, D.L., 2013b.Characteristics of phosphate adsorption-desorption ontoferrihydrite: comparison with well-crystalline Fe (hydr) oxides.Soil Sci. 178 (1), 1–11.
Wei, F., 2002. Methods for Water and Wastewater Monitoring andAnalysis. 4th ed. China Environmental Science Press, Beijing,China.
Wei, S., Xiang, W., 2013. Adsorption removal of Pb (II) fromaqueous solution by fulvic acid-coated ferrihydrite. J. FoodAgric. Environ. 11 (2), 1376–1380.
Wei, S., Tan, W., Liu, F., Zhao, W., Weng, L., 2014. Surfaceproperties and phosphate adsorption of binary systemscontaining goethite and kaolinite. Geoderma 213,478–484.
Weng, L., Van Riemsdijk, W.H., Koopal, L.K., Hiemstra, T., 2006a.Adsorption of humic substances on goethite: comparisonbetween humic acids and fulvic acids. Environ. Sci. Technol. 40(24), 7494–7500.
Weng, L., Van Riemsdijk, W.H., Koopal, L.K., Hiemstra, T., 2006b.Ligand and Charge Distribution (LCD) model for thedescription of fulvic acid adsorption to goethite. J. ColloidInterface Sci. 302 (2), 442–457.
Weng, L., Van Riemsdijk, W.H., Hiemstra, T., 2008. Humicnanoparticles at the oxide-water interface: interactions withphosphate ion adsorption. Environ. Sci. Technol. 42 (23),8747–8752.

162 J O U R N A L O F E N V I R O N M E N T A L S C I E N C E S 4 2 ( 2 0 1 6 ) 1 5 2 – 1 6 2
Xie, Y., 2012. Adsorption and Desorption Characteristics ofArsenate on Iron Oxides and Their Complexes With HumicAcids. Southwest University, Chongqing, China (MasterThesis).
Xiong, Y., Li, Q., 1987. China Soil. Science Press, Beijng, China,pp. 390–417.
Xu, Y., Yang, M., He, C., Xiong, H., 2013. Characterization andspectral analysis of the stable mineral phases α, β-FeOOHincluded in iron oxyhydroxides. Spectrosc. Spectr. Anal. 33(12), 3330–3333.
Zhang, Y., Lin, X., Werner, W., 2003. The effect of soil floodingon the transformation of Fe-oxides and the adsorption/desorption behavior of phosphate. J. Plant Nutr. Soil Sci. 166 (1),68–75.
Zhu, J., Pigna, M., Cozzolino, V., Caporale, A.G., Violante, A., 2010.Competitive sorption of copper(II), chromium(III) and lead(II)on ferrihydrite and two organomineral complexes. Geoderma159 (3-4), 409–416.
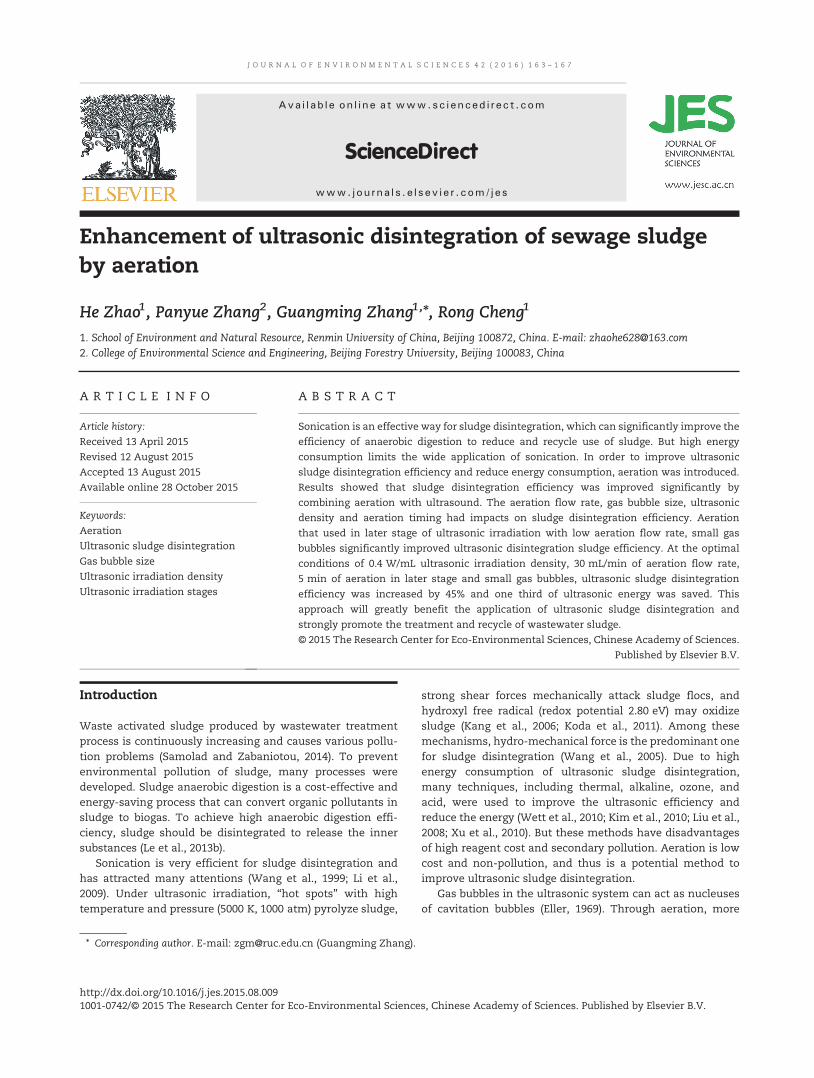
J O U R N A L O F E N V I R O N M E N T A L S C I E N C E S 4 2 ( 2 0 1 6 ) 1 6 3 – 1 6 7
Ava i l ab l e on l i ne a t www.sc i enced i r ec t . com
ScienceDirect
www. jou rna l s . e l sev i e r . com/ j es
Enhancement of ultrasonic disintegration of sewage sludgeby aeration
He Zhao1, Panyue Zhang2, Guangming Zhang1,⁎, Rong Cheng1
1. School of Environment and Natural Resource, Renmin University of China, Beijing 100872, China. E-mail: [email protected]. College of Environmental Science and Engineering, Beijing Forestry University, Beijing 100083, China
A R T I C L E I N F O
⁎ Corresponding author. E-mail: [email protected]
http://dx.doi.org/10.1016/j.jes.2015.08.0091001-0742/© 2015 The Research Center for Ec
A B S T R A C T
Article history:Received 13 April 2015Revised 12 August 2015Accepted 13 August 2015Available online 28 October 2015
Sonication is an effective way for sludge disintegration, which can significantly improve theefficiency of anaerobic digestion to reduce and recycle use of sludge. But high energyconsumption limits the wide application of sonication. In order to improve ultrasonicsludge disintegration efficiency and reduce energy consumption, aeration was introduced.Results showed that sludge disintegration efficiency was improved significantly bycombining aeration with ultrasound. The aeration flow rate, gas bubble size, ultrasonicdensity and aeration timing had impacts on sludge disintegration efficiency. Aerationthat used in later stage of ultrasonic irradiation with low aeration flow rate, small gasbubbles significantly improved ultrasonic disintegration sludge efficiency. At the optimalconditions of 0.4 W/mL ultrasonic irradiation density, 30 mL/min of aeration flow rate,5 min of aeration in later stage and small gas bubbles, ultrasonic sludge disintegrationefficiency was increased by 45% and one third of ultrasonic energy was saved. Thisapproach will greatly benefit the application of ultrasonic sludge disintegration andstrongly promote the treatment and recycle of wastewater sludge.© 2015 The Research Center for Eco-Environmental Sciences, Chinese Academy of Sciences.
Published by Elsevier B.V.
Keywords:AerationUltrasonic sludge disintegrationGas bubble sizeUltrasonic irradiation densityUltrasonic irradiation stages
Introduction
Waste activated sludge produced by wastewater treatmentprocess is continuously increasing and causes various pollu-tion problems (Samolad and Zabaniotou, 2014). To preventenvironmental pollution of sludge, many processes weredeveloped. Sludge anaerobic digestion is a cost-effective andenergy-saving process that can convert organic pollutants insludge to biogas. To achieve high anaerobic digestion effi-ciency, sludge should be disintegrated to release the innersubstances (Le et al., 2013b).
Sonication is very efficient for sludge disintegration andhas attracted many attentions (Wang et al., 1999; Li et al.,2009). Under ultrasonic irradiation, “hot spots” with hightemperature and pressure (5000 K, 1000 atm) pyrolyze sludge,
.cn (Guangming Zhang).
o-Environmental Science
strong shear forces mechanically attack sludge flocs, andhydroxyl free radical (redox potential 2.80 eV) may oxidizesludge (Kang et al., 2006; Koda et al., 2011). Among thesemechanisms, hydro-mechanical force is the predominant onefor sludge disintegration (Wang et al., 2005). Due to highenergy consumption of ultrasonic sludge disintegration,many techniques, including thermal, alkaline, ozone, andacid, were used to improve the ultrasonic efficiency andreduce the energy (Wett et al., 2010; Kim et al., 2010; Liu et al.,2008; Xu et al., 2010). But these methods have disadvantagesof high reagent cost and secondary pollution. Aeration is lowcost and non-pollution, and thus is a potential method toimprove ultrasonic sludge disintegration.
Gas bubbles in the ultrasonic system can act as nucleusesof cavitation bubbles (Eller, 1969). Through aeration, more
s, Chinese Academy of Sciences. Published by Elsevier B.V.

a1000
800
600
400
200
0
0
200
400
600
800
0
0 10 30 50
50 100 150 200
Aeration flow rate (mL/min)
SCO
D (
mg/
L)
SCO
D (
mg/
L)
164 J O U R N A L O F E N V I R O N M E N T A L S C I E N C E S 4 2 ( 2 0 1 6 ) 1 6 3 – 1 6 7
cavitation bubbles were formed. The cavitation effectswere then strengthened. Thus ultrasonic sludge disintegra-tion may be enhanced by aeration. As our best knowledge,aeration has not been used to enhance the ultrasonic sludgedisintegration.
In this article, the feasibility of aeration to enhance theultrasonic sludge disintegration was tested. Conditions ofaeration were optimized. Energy consumption of aeration-sonication sludge disintegration was analyzed. The aimwas to develop an aeration-sonication sludge disintegrationmethod to improve the efficiency and reduce the energyconsumption.
Aeration flow rate (mL/min)
Fig. 1 – Effects of aeration flow rate on ultrasonic sludgedisintegration efficiency (15 min aeration time, 0.5 W/mLultrasonic density, middle size bubble size).
1. Materials and methods
Sludge was collected from a local wastewater treatment plantthat used A/O process. The sludge had a total solid content(TS) of 1.3%–1.5% and a volatile solid content (VS) of 0.8%–1.1%. The initial soluble chemical oxygen demand (SCOD) was62–83 mg/L. The pH value was 6.5–8.5.
Aeration was conducted with a LP-20 diaphragm blower(Resun Co. Ltd., China). Aeration flow rate was controlled by aflow meter. Gas bubble size was controlled by aerators withthree different pore sizes of 80–100, 180–200 and 250–280 μm.Ultrasonic irradiation was performed with a JY92-II ultrasonicgenerator (NingboXinzhi Technology Co., China) with anultrasound frequency of 24 kHz. Each time 250 mL of sludgewas tested. The ultrasonic irradiation time was 15 min, whichwas determined by the preliminary experiments. Temperatureof the sludge was controlled below 30 °C with a circulatingcooling water system (ST22RC/B-E3000, Hengxing Co., China).
All analyses were performed according to APHA standardmethods (APHA, 1995). All experiments were repeated two orthree times and the average results were reported. Error barsin the figures refer to the standard deviation of results fromrepetitive experiments. T-test was used to analyze thesignificance of the data and all results met the requirement(α = 0.05).
2. Results and discussion
In this study, sludge disintegration efficiency was investigatedthrough the determination of soluble chemical oxygen demand(SCOD). The higher the SCOD was, the higher the sludgedisintegration efficiency was (Yu et al., 2013). The results areshown in Fig. 1 (inset). The SCODwas increased by 40% from519to 711 mg/L at aeration flow rate of 50 mL/min, showingsignificant enhancement of sludge disintegration by aeration.
In order to obtain the best efficiency of aeration onultrasonic sludge disintegration, different operation parame-ters including aeration flow rate, gas bubble size, ultrasonicdensity and aeration timing were investigated.
2.1. Impact of aeration flow rates on ultrasonic sludgedisintegration
Effects of aeration flow rates on ultrasonic sludge disintegra-tion were studied, and the results are shown in Fig. 1. At
relative low aeration flow rate (below 30 mL/min), sludgedisintegration efficiency was increased obviously. When theflow rate was above 50 mL/min, little increase of sludgedisintegration efficiency was observed. Considering the effi-ciency and energy cost, aeration flow rate of 30 mL/min wasthe optimal to enhance the ultrasonic sludge disintegration.
At aeration flow rates below 30 mL/min, large quantities ofgas bubbles were introduced into the sludge. Gas bubblesprovided more nucleuses of cavitation bubbles and thenenhanced the cavitation effects, which led to stronger shearforces. So, ultrasonic sludge disintegration was efficientlyimproved by higher aeration flow rate. At aeration flow rateabove 50 mL/min, more gas bubbles were introduced into thesludge. Due to high concentration of gas, surface tension ofthe liquid became lower (Lubetkin, 2003). The lower surfacetension would decrease the strength for cavitation bubblegrowth, then the intensity of cavitation effects decreasedbecause of the weaker bubble growth (Brennen, 1995; Jarman,1959). So, ultrasonic sludge disintegrationwas hindered by toohigh aeration flow rate.
2.2. Impact of gas bubble size on ultrasonic sludge disintegration
The induced gas bubbles act as nucleus for cavitation, butcavitation bubbles have fixed resonance size at given ultra-sonic frequency (Thompson and Doraiswamy, 1999), so gasbubbles of different sizes might work differently. Small,medium and big gas bubbles which were generated byaerators with pore size of 100–120, 180–200 and 260–280 μmwere investigated. Bubbles were generated from the aerator,entered the sludge, aggregated during the movement andwere disrupted by ultrasonic waves, so the size of bubbleskept changing. But bubbles from larger pores kept larger thanthose from smaller pores. Results are shown in Fig. 2. TheSCOD of the treated sludge increased from 548 to 779, 722,636 mg/L respectively, showing a 43.4%, 33.6% and 17.6%improvement with small, medium and big size gas bubbles,respectively. Please note that real waste activated sludge wasused. The sludge was different each time and thus the controlsample gave different values each time.
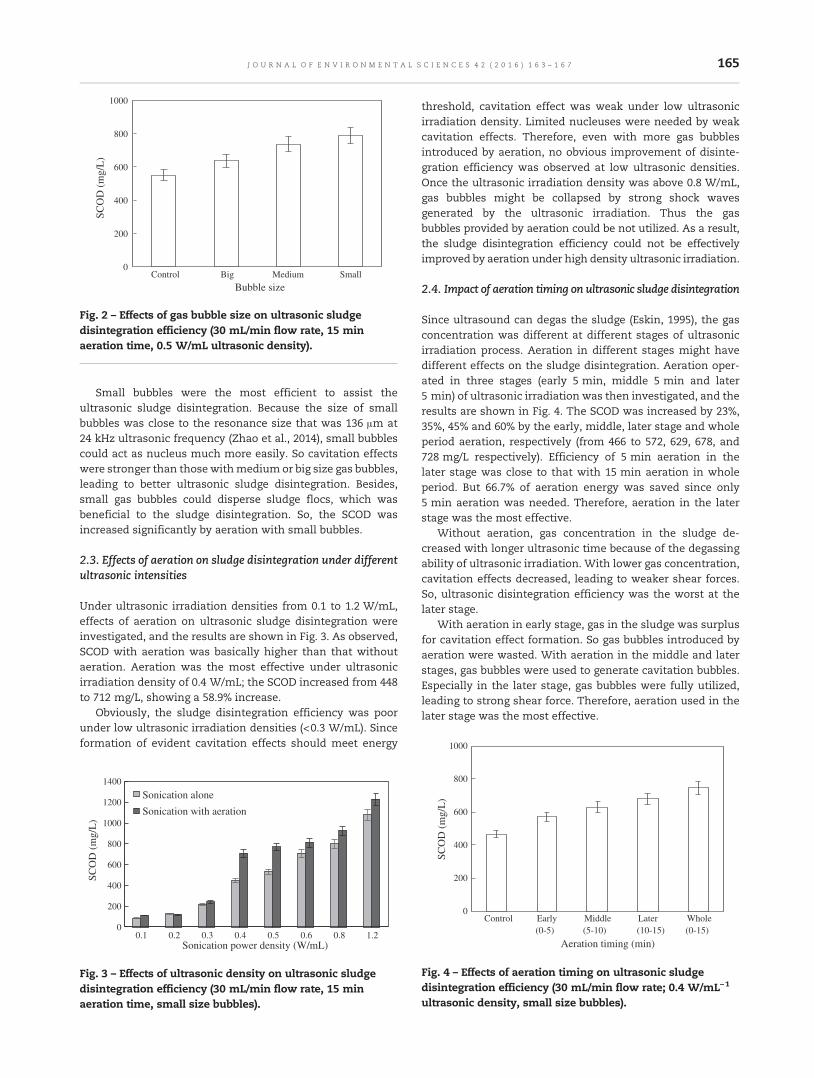
0
200
400
600
800
1000
Control Big Medium Small
SCO
D (
mg/
L)
Bubble size
Fig. 2 – Effects of gas bubble size on ultrasonic sludgedisintegration efficiency (30 mL/min flow rate, 15 minaeration time, 0.5 W/mL ultrasonic density).
1000
165J O U R N A L O F E N V I R O N M E N T A L S C I E N C E S 4 2 ( 2 0 1 6 ) 1 6 3 – 1 6 7
Small bubbles were the most efficient to assist theultrasonic sludge disintegration. Because the size of smallbubbles was close to the resonance size that was 136 μm at24 kHz ultrasonic frequency (Zhao et al., 2014), small bubblescould act as nucleus much more easily. So cavitation effectswere stronger than those withmedium or big size gas bubbles,leading to better ultrasonic sludge disintegration. Besides,small gas bubbles could disperse sludge flocs, which wasbeneficial to the sludge disintegration. So, the SCOD wasincreased significantly by aeration with small bubbles.
2.3. Effects of aeration on sludge disintegration under differentultrasonic intensities
Under ultrasonic irradiation densities from 0.1 to 1.2 W/mL,effects of aeration on ultrasonic sludge disintegration wereinvestigated, and the results are shown in Fig. 3. As observed,SCOD with aeration was basically higher than that withoutaeration. Aeration was the most effective under ultrasonicirradiation density of 0.4 W/mL; the SCOD increased from 448to 712 mg/L, showing a 58.9% increase.
Obviously, the sludge disintegration efficiency was poorunder low ultrasonic irradiation densities (<0.3 W/mL). Sinceformation of evident cavitation effects should meet energy
0
200
400
600
800
1000
1200
1400
0.1 0.2 0.3 0.4 0.5 0.6 0.8 1.2
SCO
D (
mg/
L)
Sonication power density (W/mL)
Sonication alone
Sonication with aeration
Fig. 3 – Effects of ultrasonic density on ultrasonic sludgedisintegration efficiency (30 mL/min flow rate, 15 minaeration time, small size bubbles).
threshold, cavitation effect was weak under low ultrasonicirradiation density. Limited nucleuses were needed by weakcavitation effects. Therefore, even with more gas bubblesintroduced by aeration, no obvious improvement of disinte-gration efficiency was observed at low ultrasonic densities.Once the ultrasonic irradiation density was above 0.8 W/mL,gas bubbles might be collapsed by strong shock wavesgenerated by the ultrasonic irradiation. Thus the gasbubbles provided by aeration could be not utilized. As a result,the sludge disintegration efficiency could not be effectivelyimproved by aeration under high density ultrasonic irradiation.
2.4. Impact of aeration timing on ultrasonic sludge disintegration
Since ultrasound can degas the sludge (Eskin, 1995), the gasconcentration was different at different stages of ultrasonicirradiation process. Aeration in different stages might havedifferent effects on the sludge disintegration. Aeration oper-ated in three stages (early 5 min, middle 5 min and later5 min) of ultrasonic irradiation was then investigated, and theresults are shown in Fig. 4. The SCOD was increased by 23%,35%, 45% and 60% by the early, middle, later stage and wholeperiod aeration, respectively (from 466 to 572, 629, 678, and728 mg/L respectively). Efficiency of 5 min aeration in thelater stage was close to that with 15 min aeration in wholeperiod. But 66.7% of aeration energy was saved since only5 min aeration was needed. Therefore, aeration in the laterstage was the most effective.
Without aeration, gas concentration in the sludge de-creased with longer ultrasonic time because of the degassingability of ultrasonic irradiation. With lower gas concentration,cavitation effects decreased, leading to weaker shear forces.So, ultrasonic disintegration efficiency was the worst at thelater stage.
With aeration in early stage, gas in the sludge was surplusfor cavitation effect formation. So gas bubbles introduced byaeration were wasted. With aeration in the middle and laterstages, gas bubbles were used to generate cavitation bubbles.Especially in the later stage, gas bubbles were fully utilized,leading to strong shear force. Therefore, aeration used in thelater stage was the most effective.
0
200
400
600
800
Control Early(0-5)
Middle(5-10)
Later(10-15)
Whole(0-15)
SCO
D (
mg/
L)
Aeration timing (min)
Fig. 4 – Effects of aeration timing on ultrasonic sludgedisintegration efficiency (30 mL/min flow rate; 0.4 W/mL−1
ultrasonic density, small size bubbles).

Table 1 – Effects of different assisting methods on ultrasonic disintegration of sludge.
Assisted method Conditions Increase of ultrasonicdisintegration efficiency
References
Alkaline pH = 12 30% Kim et al., 2010Alkaline and high pressure 900 mg NaOH/L, 83 MPa 26% Sahaa et al., 2011Ozone 1 g/hr 18% Xu et al., 2010High pressure and thermal 2 bar, 75 °C 10% Le et al., 2013aThermal 80 °C 12.5% Sahinkaya and Sevimli, 2013
166 J O U R N A L O F E N V I R O N M E N T A L S C I E N C E S 4 2 ( 2 0 1 6 ) 1 6 3 – 1 6 7
In summary, aeration improved ultrasonic sludge disinte-gration effectively. Assisted by 5 min aeration with smallbubbles, the disintegration efficiency was increased by 45%from 466 to 678 mg/L under 0.4 W/mL of ultrasonic irradia-tion. In comparison with other methods listed in Table 1,aeration showed great advantages of high efficiency inenhancing the ultrasonic sludge disintegration with noreagent consumption.
Furthermore, aeration was also energy saving. Under0.4 W/mL of ultrasonic irradiation for 15 min assisted by5 min aeration, SCOD was increased to 678 mg/L (Fig. 4),which was similar with that under 0.6 W/mL of ultrasonicirradiation for 15 min alone (709 mg/L, Fig. 3). Therefore, 1/3 ofultrasonic power consumption was saved. On the other hand,0.6 L air was needed to treat 1.0 L sludge (30 mL/min × 5 minfor 250 mL sludge). With a typical blower (L9.5-120/49-LB,Sunsun Co. Ltd., China), which has an operation power of1100 W and a flow rate of 0.98 m3/min, 1.12 × 10⁻⁵ kWh wasneeded to provide 0.6 L air, which was negligible. Therefore,one third of ultrasonic energy was saved by aeration.
At present, wastewater treatment accounts for 1%–2% ofenergy consumption in some countries like USA, China, andGermany. In the process of wastewater treatment, sludge is amajor problem. Anaerobic digestion can utilize sludge andhelp balance the energy consumption of wastewater treat-ment plants. Ultrasonic sludge disintegration has been usedto improve the anaerobic digestion efficiency in practice. Butthe energy consumption of ultrasonic irradiation is high.Assisted by aeration, the ultrasonic sludge disintegration isgreatly improved with little energy, which is beneficial toincrease the anaerobic digestion efficiency. Thus, significantenergy reduction can be realized in WWTPs wastewatertreatment plants, which will promote the development ofwastewater treatment and reduce the energy consumption asa whole.
3. Conclusions
Aeration was a simple, effective, and cost efficient way toimprove the ultrasonic sludge disintegration. Small gas bubbleswere more effective than middle and big gas bubbles; aerationworked the best at ultrasonic power density of 0.4 W/mL;and aeration in the later stage of ultrasonic irradiation wasmore effective than in the early or middle stage. Assisted by5 min aeration in the later stage with flow rate of 30 mL/min,the sludge disintegration efficiency was increased by 45%under 0.4 W/mL of ultrasonic irradiation. One third ofultrasonic energy might be saved through aeration. Effective
and energy-saving aeration-sonication sludge disintegrationwould promote the development of sludge treatment andutilization.
Acknowledgments
This work was supported by the National Natural ScienceFoundation of China (Nos. 51278489 and 51178047).
R E F E R E N C E S
APHA, 1995. Standard Methods for the Examination of Water andWastewater 19th ed. American Public Health Association/American Water Works Association/Water EnvironmentFederation, Washington, DC.
Brennen, C.E., 1995. Cavitation and Bubble Dynamics. OxfordUniversity Press.
Eller, A.I., 1969. Growth of bubbles by rectified diffusion. J. Acoust.Soc. Am. 46, 1246–1250.
Eskin, G.I., 1995. Cavitation mechanism of ultrasonic meltdegassing. Ultrason. Sonochem. 2, S137–S141.
Jarman, P., 1959. Measurements of sonoluminescence from pureliquids and someaqueous solutions. Proc. Phys. Soc. 73 (4),628–640.
Kang, N., Hua, I., Xiao, C.H., 2006. Impacts of sonochemicalprocess variables on number average molecular weightreduction of asphaltene. Ind. Eng. Chem. Res. 45, 5239–5245.
Kim, D.H., Jeong, E., Oh, S.E., Shin, H.S., 2010. Combined(alkaline + ultrasonic) pretreatment effect on sewage sludgedisintegration. Water Res. 44, 3093–3100.
Koda, S., Taguchi, K., Futamura, K., 2011. Effects of frequency anda radical scavenger on ultrasonic degradation of water-solublepolymers. Ultrason. Sonochem. 18, 276–281.
Le, N.T., Julcour-Lebigue, C., Delmas, H., 2013a. Ultrasonic sludgepretreatment under pressure. Ultrason. Sonochem. 20,1203–1210.
Le, N.T., Julcour, C., Ratsimba, B., Delmas, H., 2013b. Improvingsewage sludge ultrasonic pretreatment under pressure bychanging initial pH. J. Env. Manage. 128 (20), 548–554.
Li, H., Jin, Y.Y., Rasool, B.M., Wang, Z.Y., Nie, Y.F., 2009. Effects ofultrasonic disintegration on sludge microbial activity anddewaterability. J. Hazard. Mater. 161, 1421–1426.
Liu, X.L., Liu, H., Chen, J.H., Du, G.C., Chen, J., 2008. Enhancementof solubilization and acidification of waste activated sludge bypretreatment. Waste Manag. 28, 2614–2622.
Lubetkin, S.D., 2003. Why it is much easier to nucleate gas bubblesthan theory predicts? Langmuir 19, 2575–2587.
Sahaa, M., Eskicioglu, C., Marin, J., 2011. Microwave, ultrasonic andchemo-mechanical pretreatments for enhancing methanepotential of pulp mill wastewater treatment sludge. Bioresour.Technol. 102, 7815–7826.

167J O U R N A L O F E N V I R O N M E N T A L S C I E N C E S 4 2 ( 2 0 1 6 ) 1 6 3 – 1 6 7
Sahinkaya, S., Sevimli, M.F., 2013. Sono-thermal pre-treatment ofwaste activated sludge before anaerobic digestion. Ultrason.Sonochem. 20, 587–594.
Samolad, M.C., Zabaniotou, A.A., 2014. Comparative assessmentof municipal sewage sludge incineration, gasification andpyrolysis for a sustainable sludge-to-energy management inGreece. Waste Manag. 34, 411–420.
Thompson, L.H., Doraiswamy, L.K., 1999. Sonochemistry: scienceand engineering. Ind. Eng. Chem. Res. 38, 1215–1249.
Wang, Q.H., Kuninobu, M., Kakimoto, K., I.-Ogaw, H., Kato, Y.,1999. Upgrading of anaerobic digestion of waste activatedultrasonic pretreatment. Bioresour. Technol. 68, 309–313.
Wang, F., Wang, Y., Ji, M., 2005. Mechanisms and kinetics modelsfor ultrasonic waste activated sludge disintegration. J. Hazard.Mater. 123, 145–150.
Wett, B., Phothilangka, P., Eladawy, A., 2010. Systematiccomparison of mechanical and thermal sludge disintegrationtechnologies. Waste Manag. 30, 1057–1062.
Xu, G.H., Chen, S.H., Shi, J.W., Wang, S.M., Zhu, G.F., 2010.Combination treatment of ultrasound and ozone forimproving solubilization and anaerobic biodegradability ofwaste activated sludge. J. Hazard. Mater. 180, 340–346.
Yu, H.G., Wang, Z.W., Wang, Q.Y., Wu, Z.C., Ma, J.X., 2013.Disintegration and acidification of MBR sludge under alkalineconditions. Chem. Eng. J. 231, 206–213.
Zhao, H., Zhang, G.M., Zhang, Q.L., 2014. MnO2/CeO2 for catalyticultrasonic degradation of methyl orange. Ultrason. Sonochem.21, 991–996.

J O U R N A L O F E N V I R O N M E N T A L S C I E N C E S 4 2 ( 2 0 1 6 ) 1 6 8 – 1 7 7
Ava i l ab l e on l i ne a t www.sc i enced i r ec t . com
ScienceDirect
www. jou rna l s . e l sev i e r . com/ j es
Activity and hydrothermal stability of CeO2–ZrO2–WO3 for theselective catalytic reduction of NOx with NH3
Zhongxian Song1, Ping Ning1, Qiulin Zhang1,⁎, Hao Li1, Jinhui Zhang1, Yancai Wang1,Xin Liu1, Zhenzhen Huang2
1. Faculty of Environmental Science and Engineering, Kunming University of Science and Technology, Kunming 650500, China.E-mail: [email protected]. College of Environmental Science and Engineering, Hunan University, Changsha 410082, China
A R T I C L E I N F O
⁎ Corresponding author. E-mail: qiulinzhang_
http://dx.doi.org/10.1016/j.jes.2015.06.0101001-0742/© 2015 The Research Center for Ec
A B S T R A C T
Article history:Received 16 April 2015Revised 9 June 2015Accepted 17 June 2015Available online 28 August 2015
A series of CeO2–ZrO2–WO3 (CZW) catalysts prepared by a hydrothermal synthesis methodshowed excellent catalytic activity for selective catalytic reduction (SCR) of NO with NH3 over awide temperature of 150–550°C. The effect of hydrothermal treatment of CZW catalysts on SCRactivity was investigated in the presence of 10%H2O. The fresh catalyst showed above 90% NOx
conversion at 201–459°C, which is applicable to diesel exhaust NOx purification (200–440°C). TheSCR activity results indicated that hydrothermal aging decreased the SCR activity of CZWat lowtemperatures (below 300°C), while the activity was notably enhanced at high temperature(above 450°C). TheagedCZWcatalyst (hydrothermal aging at 700°C for 8 hr) showed almost 80%NOx conversion at 229–550°C, while the V2O5–WO3/TiO2 catalyst presented above 80% NOx
conversion at 308–370°C. The effect of structural changes, acidity, and redox properties of CZWon the SCR activity was investigated. The results indicated that the excellent hydrothermalstability of CZW was mainly due to the CeO2–ZrO2 solid solution, amorphous WO3 phase andoptimal acidity. In addition, the formationofWO3 clusters increased in size as thehydrothermalaging temperature increased, resulting in the collapse of structure, which could further affectthe acidity and redox properties.© 2015 The Research Center for Eco-Environmental Sciences, Chinese Academy of Sciences.
Published by Elsevier B.V.
Keywords:CeO2–ZrO2–WO3
Hydrothermal stabilitySolid solutionAcidity
Introduction
The NOx from diesel engines poses a serious problem to theenvironment and human health (Yu et al., 2015). With increas-ingly stringent NOx emission legislation, extensive efforts arebeing made to find ways to eliminate NOx from diesel engines.Among the NOx removal technologies, selective catalytic reduc-tion (SCR) has been successfully applied to reduce NOx by NH3
(Zhang et al., 2011). Typically, the main industrial SCR catalystsare V2O5/WO3 (MoO3)/TiO2 and Fe-zeolite catalysts (Chapman,2011; Iwasaki et al., 2008). The vanadium-based catalysts candramatically removeNOx and be effectively regenerated (Tang et
[email protected] (Qiulin Z
o-Environmental Science
al., 2007). However, some drawbacks of these catalysts exist thatimpedewideapplication, including anarrow reaction temperaturewindow (300–400°C), the inherent toxicity of vanadiumoxides andthe formation of N2O at high temperatures (Xu et al., 2014; Yanget al., 2011). The Fe-zeolite catalysts show excellent NH3-SCRperformance at high temperatures (300–600°C), but inferior SCRactivity at low temperature and poor hydrothermal stability arestill serious problems (Brandenberger et al., 2010). To avoid theseproblems, new efficient catalysts are urgently needed.
Currently, one of the challenges for the diesel engine appli-cation of SCR catalysts is their durability under hydrothermalconditions. Although a large number of catalysts have been
hang).
s, Chinese Academy of Sciences. Published by Elsevier B.V.

169J O U R N A L O F E N V I R O N M E N T A L S C I E N C E S 4 2 ( 2 0 1 6 ) 1 6 8 – 1 7 7
employed in NH3-SCR, no suitable catalyst has been found fordiesel de-NOx abatement. It is fundamentally difficult to controlNOx emissions from diesel engines because the temperature ofNOx emitted from diesel engine is 200–440°C (Kim et al., 2012). Inaddition, SCR catalysts are often exposed to high hydrothermaltemperatures (above 650°C) during soot oxidation processes inupstream DPFs (Zheng and Keith, 2004). Therefore, considerableefforts have been devoted to developing efficient SCR catalystswith excellent hydrothermal stability for application in dieselengines. TiO2-based catalysts easily undergo a phase transitionabove 600°C, leading to deactivation (Shan et al., 2012). Zeolite-based catalysts are not suitable as diesel catalysts due to theirinstability under hydrothermal conditions (Metkar et al.,2012). Consequently, high hydrothermal durability and high-temperature catalytic activity are crucial for practical imple-mentation with diesel engines.
Ceria-based catalysts have attracted more attention due totheir advantageous redox properties. However, a majordrawback of pure CeO2 is that it is largely deactivated at hightemperature due to poor thermostability (Fornasiero et al.,1999). However, the thermal stability can be promoted by theaddition of other metal oxides into CeO2 (Casapu et al., 2011).Currently, Ce–Zrmixed oxides are a key component for NH3-SCRcatalysts because of their favorable attributes, such as high-temperature phase stability, good redox properties, and acidity(Marcotte et al., 2011). Tungsten trioxide (WO3), as an importantcatalyst promoter, not only acts as an acidic component, but alsofunctions as a stabilizer for catalysts. Li et al. (2008) reported that80% NOx conversion was obtained at 325–500°C over a WO3/CeO2–ZrO2 catalyst prepared by a wet impregnation methodafter hydrothermal treatment. In this study, the CeO2–ZrO2–WO3
catalyst prepared by a hydrothermal method was found topresent rather good activity at 201–459°C. Compared with V2O5–WO3/TiO2 catalysts, the CZW catalyst exhibits exceptionalactivity, superior N2 selectivity and excellent hydrothermalstability even under an extremely high hydrothermal tempera-ture (700°C) for 96 hr, making it a promising catalyst for NOx
abatement from diesel engine exhaust. To analyze the cause ofhydrothermal aging, the catalysts were characterized by powderX-ray diffraction (XRD), high-resolution transmission electronmicroscopy (HR-TEM), infrared spectroscopyof adsorbedpyridine(Py-IR), raman spectra (RS), X-ray photoelectron spectrum (XPS),and temperature-programmed reductionwithhydrogen (H2-TPR)techniques.
1. Experimental studies
1.1. Catalyst preparation
The samples were synthesized by a hydrothermal method. Allchemicals were of analytical grade. The precursors zirconiumnitrate pentahydrate (0.01 mol), cerium nitrate hexahydrate(0.01 mol), ammoniummetatungstate hydrate (0.6491 g), acryl-ic acid (0.03 mol), and glucose (0.05 mol) were mixed in anaqueous solution. Afterwards, an ammonia solution (25 wt.%)was added dropwise into the solution with vigorous stirringuntil the pH reached 10. Subsequently, the mixture was stirredfor 5 hr at room temperature. Then the blend was transferredinto a Teflon-lined, stainless steel autoclave and heated at
160°C for 72 hr. The obtained precipitates were filtrated andwashed, followed by drying at 80°C for 12 hr and calcining at550°C for 5 hr. The catalysts were denoted as CZW.
To comprehensively evaluate the high temperature catalyticperformance and hydrothermal stability, the CZW catalystswere studied after hydrothermal aging at different tempera-tures (600, 700, 800, and 900°C) for 8 hr in the presence of10 vol.% H2O. The samples were correspondingly denoted asCZW-6-8, CZW-7-8, CZW-8-8, and CZW-9-8. In order to studythe durability of CZW catalysts, the samples were also inves-tigated after hydrothermal aging at 700°C for different times (24,48, and 96 hr) in 10 vol.% H2O. The samples were denoted asCZW-7-24, CZW-7-48, and CZW-7-96.
1.2. Characterization
XRD patterns were recorded by an X-ray diffractometer(s-7000, Shimadzu, Japan) between 10 and 70° 2θ at a step of2°/min using Cu Kα radiation operating at 30 kV and 30 mA todetermine the crystal structure. Raman spectra were mea-sured on a Renishaw-2000 Raman spectrometer (Renishaw-2000, Renishaw, UK) at a resolution of 2 cm−1 by using the514.5 nm line of an Ar ion laser as the excitation source.
XPS analysis was employed using an ULVAC PHI 5000Versa Probe-II equipment (PHI 5000 Versa Probe-II, ULVAC,Japan) operating at 10−9 Pa with Al Kα radiation (1486.6 eV).The observed spectra were corrected using the C 1 s bindingenergy value at 284.8 eV.
Temperature-programmed reduction (TPR) experimentsfor the CZW powders were carried out in a conventional gaschromatograph (GC-9750, FULI Analytical Instrument Co. Ltd.,China) with 0.05 g of catalysts. The H2-TPR experiments wereperformed from 100 to 890°C with a heating rate of 10°C/minunder a 5% H2/Ar flow. The nature of acid sites over thesamples was studied by Py-IR based on the fact that pyridinemolecules adsorbed on different acid sites displayed charac-teristic vibration bands. The spectra were recorded with 4 cm−1
spectral resolution on a Nicolet Nexus 470 spectrometer (Nexus470, Nicolet, USA) equipped with a deuterated triglycine sulfate(DTGS) detector by signal averaging 64 scans. The spectra wererecorded at 25, 100, and 200°C.
HR-TEM with high magnification was performed on a JEOLJEM-2100 analytical transmission electron microscope (JEM-2100, JEOL, USA). Before the HR-TEM test, the samples weredispersed in high-purity ethanol for 15 min, and depositedonto copper-grid-supported amorphous carbon films, thenthe impregnated mesh was dried in air before TEM analysis.
1.3. Catalytic activity measurement
The NH3-SCR activity measurements were carried out in afixed-bed quartz reactor (8 mm i.d.) with 0.4 mL catalysts of60–80 mesh. The experiments were performed under atmo-spheric pressure at 150–550°C and the gas flow wasmonitoredby mass flow meters (Beijing Sevenstar Electronics, Beijing,China). The typical composition of inlet gas was 0.06% NH3,0.06% NO, 5 vol.% O2, and N2 as the balance gas at a flow rateof 400 mL/min, which corresponded to a GHSV (gas hourlyspace velocity) of 60,000 hr−1. The concentration of NOx wascontinuously detected by a flue gas analyzer (ECOM-J2KN,

40
60
80
100
Ox c
onve
rsio
n (%
)
a
170 J O U R N A L O F E N V I R O N M E N T A L S C I E N C E S 4 2 ( 2 0 1 6 ) 1 6 8 – 1 7 7
RBR, Germany). The N2O was analyzed by a gas chromatograph(GC-9750, FULI Analytical Instrument Co. Ltd., China) on twoparallel columns linked to a thermal conductivity detector andelectron capture detector, respectively. A Porapak Q columnwas used for N2O and a 5 Å molecular sieve column for N2. Tominimize the influence of gas adsorption on the catalystsamples, test data were measured after the reactions hadachieved steady state.
Reaction temperature (°C)
Reaction temperature (°C)
150 200 250 300 350 400 450 500 550
20
NN
Ox c
onve
rsio
n (%
)N
Ox c
onve
rsio
n (%
)
Reaction temperature (°C)
CZW CZW-6-8 CZW-7-8 CZW-8-8 CZW-9-8
150 200 250 300 350 400 450 500 550
20
40
60
80
100
CZW-7-8 CZW-7-24 CZW-7-48 CZW-7-96
b
150 200 250 300 350 400 450 500 5500
10
20
30
40
50
60
70
80
90
100
CZW CZW-7-8V5O2-WO3/TiO2
V5O2-WO3/TiO2-7-8
c
Fig. 1 – Catalytic activity of (a) fresh and aged CeO2–ZrO2–WO3
(CZW) catalysts and (b) CZWcatalysts agedat 700°C for differenthydrothermal times for SCR of NOx with NH3; (c) a comparisonof NOx conversion between CZW catalyst and V2O5–WO3/TiO2
catalysts. Reaction conditions: 0.06% NO, 0.06% NH3, 5% O2,balance N2, gas hourly space velocity (GHSV) = 60,000 hr−1.CZW-m-n and V2O5–WO3/TiO2-m-n refer to CZW andV2O5–WO3/TiO2 catalysts aged atm × 100°C in the presence of10 vol.% H2O for n hr.
2. Results and discussion
2.1. Catalytic activity
The activities of the CZW catalysts are exhibited in Fig. 1. Asshown in Fig. 1a, a decrease in low-temperature activity wasobserved for all CZW catalysts after hydrothermal aging, whilethe performance of the aged CZW catalysts was dramaticallyenhanced at high temperature (above 400°C). The NOx conver-sion of CZW was noticeably different after hydrothermal agingat various temperatures. It has been reported that the NOx
conversion is increased at high temperature (above 500°C) forhydrothermally aged NH3-SCR catalysts (Shi et al., 2013). Thephenomena implied that the hydrothermal treatment coulddecrease SCR catalytic activity at low temperature and enhancehigh-temperature performance. For aged CZW catalysts, theCZW-6-8 sample exhibited 74% NOx conversion at 219–527°C.More than 74% NOx conversion was obtained over the CZW-7-8catalyst in the wide temperature range of 225–550°C. With theincrease of hydrothermal aging temperature (800 and 900°C),the catalytic activity decreased significantly. Above 74% NOx
conversion was achieved at 300–525°C over the CZW-9-8catalyst. Therefore, the CZW-7-8 catalyst showed the bestperformance over the whole temperature range. It could beseen fromFig. 1b that nearly 100%NOx conversionwas obtainedwith the CZW-7-8 catalyst at 250–525°C.With increasing hydro-thermal aging time, no evident decrease of activity wasobserved. Hence, the results indicated that the CZW catalystsshowed considerable tolerance to hydrothermal shock at hightemperature.
Fig. 1c presents a comparison between the CZW catalystand a commercial vanadium-based catalyst (V2O5–WO3/TiO2).After aging at 700°C for 8 hr, a decrease in SCR performancewas observed at 150–250°C for the CZW catalyst. Interestingly,the CZW-7-8 catalyst exhibited a dramatic increase in NOx
conversion at high temperature (450–550°C) when comparedwith fresh CZW catalyst. However, substantial differences wereobserved for the V2O5–WO3/TiO2 catalyst after hydrothermalaging at 700°C for 8 hr (denoted as V2O5–WO3/TiO2-7-8). Above80%NOx conversionwas obtained at 259–482°C over the freshV2O5–WO3/TiO2 catalyst. The V2O5–WO3/TiO2-7-8 catalystshowed a significant decrease in the NOx conversion at lowtemperatures (150–300°C) and was even worse at hightemperatures (400–550°C). Furthermore, the NOx conversionat 308–370°C for the V2O5–WO3/TiO2-7-8 catalyst was only alittle over 80%. Brandenberger et al. (2010) reported that thecatalytic activity of a Fe-ZSM-5 catalyst aged at 650°C for 8 hrdecreased rapidly at low temperatures (≤350°C) and 70% NOx
conversion was obtained at 360°C. Ye et al. (2012) found thatthe performance of an aged Cu/ZSM-5 catalyst decreased
dramatically, and 60% NOx conversion was reached at 400°C.By comparison, the CZW catalyst possessed superior hydro-thermal stability.
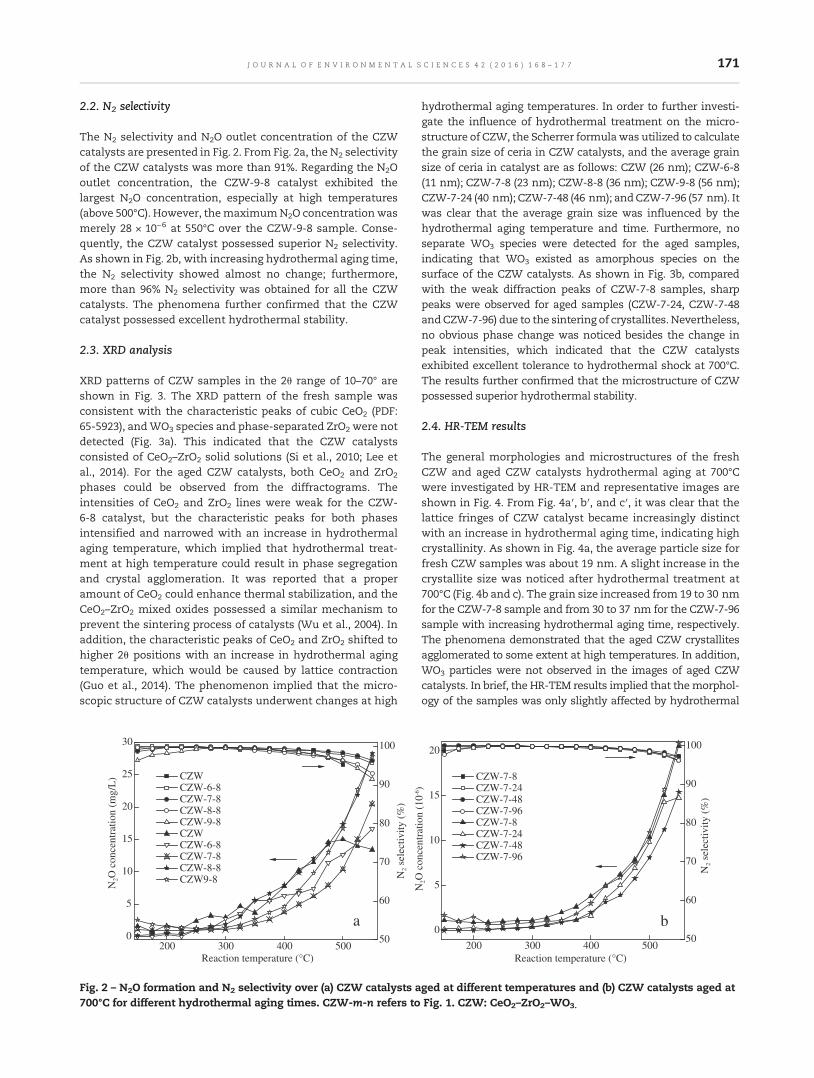
171J O U R N A L O F E N V I R O N M E N T A L S C I E N C E S 4 2 ( 2 0 1 6 ) 1 6 8 – 1 7 7
2.2. N2 selectivity
The N2 selectivity and N2O outlet concentration of the CZWcatalysts are presented in Fig. 2. From Fig. 2a, the N2 selectivityof the CZW catalysts was more than 91%. Regarding the N2Ooutlet concentration, the CZW-9-8 catalyst exhibited thelargest N2O concentration, especially at high temperatures(above 500°C). However, themaximumN2O concentration wasmerely 28 × 10−6 at 550°C over the CZW-9-8 sample. Conse-quently, the CZW catalyst possessed superior N2 selectivity.As shown in Fig. 2b, with increasing hydrothermal aging time,the N2 selectivity showed almost no change; furthermore,more than 96% N2 selectivity was obtained for all the CZWcatalysts. The phenomena further confirmed that the CZWcatalyst possessed excellent hydrothermal stability.
2.3. XRD analysis
XRD patterns of CZW samples in the 2θ range of 10–70° areshown in Fig. 3. The XRD pattern of the fresh sample wasconsistent with the characteristic peaks of cubic CeO2 (PDF:65-5923), andWO3 species and phase-separated ZrO2 were notdetected (Fig. 3a). This indicated that the CZW catalystsconsisted of CeO2–ZrO2 solid solutions (Si et al., 2010; Lee etal., 2014). For the aged CZW catalysts, both CeO2 and ZrO2
phases could be observed from the diffractograms. Theintensities of CeO2 and ZrO2 lines were weak for the CZW-6-8 catalyst, but the characteristic peaks for both phasesintensified and narrowed with an increase in hydrothermalaging temperature, which implied that hydrothermal treat-ment at high temperature could result in phase segregationand crystal agglomeration. It was reported that a properamount of CeO2 could enhance thermal stabilization, and theCeO2–ZrO2 mixed oxides possessed a similar mechanism toprevent the sintering process of catalysts (Wu et al., 2004). Inaddition, the characteristic peaks of CeO2 and ZrO2 shifted tohigher 2θ positions with an increase in hydrothermal agingtemperature, which would be caused by lattice contraction(Guo et al., 2014). The phenomenon implied that the micro-scopic structure of CZW catalysts underwent changes at high
200 300 400 5000
5
10
15
20
25
30
CZW CZW-6-8 CZW-7-8 CZW-8-8 CZW-9-8 CZW CZW-6-8 CZW-7-8 CZW-8-8 CZW9-8
N2O
con
cent
ratio
n (m
g/L
)
50
60
70
80
90
100
N2
sele
ctiv
ity (
%)
a
Reaction temperature (°C)
Fig. 2 – N2O formation and N2 selectivity over (a) CZW catalysts a700°C for different hydrothermal aging times. CZW-m-n refers to
hydrothermal aging temperatures. In order to further investi-gate the influence of hydrothermal treatment on the micro-structure of CZW, the Scherrer formulawas utilized to calculatethe grain size of ceria in CZW catalysts, and the average grainsize of ceria in catalyst are as follows: CZW (26 nm); CZW-6-8(11 nm); CZW-7-8 (23 nm); CZW-8-8 (36 nm); CZW-9-8 (56 nm);CZW-7-24 (40 nm); CZW-7-48 (46 nm); andCZW-7-96 (57 nm). Itwas clear that the average grain size was influenced by thehydrothermal aging temperature and time. Furthermore, noseparate WO3 species were detected for the aged samples,indicating that WO3 existed as amorphous species on thesurface of the CZW catalysts. As shown in Fig. 3b, comparedwith the weak diffraction peaks of CZW-7-8 samples, sharppeaks were observed for aged samples (CZW-7-24, CZW-7-48andCZW-7-96) due to the sintering of crystallites. Nevertheless,no obvious phase change was noticed besides the change inpeak intensities, which indicated that the CZW catalystsexhibited excellent tolerance to hydrothermal shock at 700°C.The results further confirmed that the microstructure of CZWpossessed superior hydrothermal stability.
2.4. HR-TEM results
The general morphologies and microstructures of the freshCZW and aged CZW catalysts hydrothermal aging at 700°Cwere investigated by HR-TEM and representative images areshown in Fig. 4. From Fig. 4a′, b′, and c′, it was clear that thelattice fringes of CZW catalyst became increasingly distinctwith an increase in hydrothermal aging time, indicating highcrystallinity. As shown in Fig. 4a, the average particle size forfresh CZW samples was about 19 nm. A slight increase in thecrystallite size was noticed after hydrothermal treatment at700°C (Fig. 4b and c). The grain size increased from 19 to 30 nmfor the CZW-7-8 sample and from 30 to 37 nm for the CZW-7-96sample with increasing hydrothermal aging time, respectively.The phenomena demonstrated that the aged CZW crystallitesagglomerated to some extent at high temperatures. In addition,WO3 particles were not observed in the images of aged CZWcatalysts. In brief, the HR-TEM results implied that themorphol-ogy of the samples was only slightly affected by hydrothermal
N2O
con
cent
ratio
n (1
0-6)
20 400 300 0 500
0
5
10
15
20
CZW-7-8 CZW-7-24 CZW-7-48 CZW-7-96 CZW-7-8 CZW-7-24 CZW-7-48 CZW-7-96
b50
60
70
80
90
100
N2
sele
ctiv
ity (
%)
Reaction temperature (°C)
ged at different temperatures and (b) CZW catalysts aged atFig. 1. CZW: CeO2–ZrO2–WO3.

Fig. 3 – XRD (X-ray diffraction) patterns of (a) fresh and aged CZW catalysts and (b) CZW catalysts aged at 700°C for differenthydrothermal aging times. CZW: CeO2–ZrO2–WO3.
172 J O U R N A L O F E N V I R O N M E N T A L S C I E N C E S 4 2 ( 2 0 1 6 ) 1 6 8 – 1 7 7
treatment. Therefore, the CZW catalyst possessed excellenthydrothermal stability.
2.5. Raman results
The Raman spectra of CZW catalysts are shown in Fig. 5. Foraged CZW catalysts, a strong band observed at ~465 cm−1
could be due to the F2g Raman-active mode of the fluorite typelattice, which can be attributed to a symmetric breathingmode of the oxygen atoms around cerium ions (Wang et al.,2014). The Raman bands of the samples became noticeably
a' b'
ba
5 nm
50 nm 50 nm
5 nm
Fig. 4 – HR-TEM (high-resolution transmission electronmicroscopy)catalysts. CZW: CeO2–ZrO2–WO3.
broader with an increase in hydrothermal aging temperature,which might be related to morphology and grain size (Spanieret al., 2001). With an increase in hydrothermal aging temper-atures, new bands (146 and 267 cm−1) appeared, which wereascribed to tetragonal ZrO2, and the bands formonoclinic ZrO2
were located around 334 and 386 cm−1. The band intensitiesstrengthened with increasing hydrothermal aging tempera-ture. The phenomena implied that the crystallinity of CZWparticles increased and the phase separation of CeO2 and ZrO2
phases was observed with an increase in hydrothermal agingtemperature. The presence of the broad band at 618 cm−1 was
c
c'
50 nm
5 nm
images of (a′, a) fresh CZW, (b′, b) CZW-7-8, and (c′, c) CZW-7-96

Fig. 5 – Raman spectra of (a) fresh and aged CZW catalysts and (b) CZW catalysts aged for different hydrothermal aging times.CZW: CeO2–ZrO2–WO3.
173J O U R N A L O F E N V I R O N M E N T A L S C I E N C E S 4 2 ( 2 0 1 6 ) 1 6 8 – 1 7 7
assigned to the longitudinal optical (LO) mode of ceria, whichoriginated from the relaxation of symmetry rules (Reddy et al.,2005); oxygen vacancies were responsible for the emergenceof this band. This indicated that the CZW catalysts formed aCeO2–ZrO2 solid solution by substitution of Zr into the CeO2
lattice under high hydrothermal aging temperature condi-tions. The band (~310 cm−1) could be attributed to the dis-placement of oxygen atoms from their ideal fluorite latticepositions (Vidal et al., 2000), which confirmed the presence ofa CeO2–ZrO2 solid solution in the aged samples. For theCZW-8-8 and CZW-9-8 catalysts, the CeO2 peak was sharperand new bands appeared at 815, 925, and 944 cm−1, whichwere observed in spectra of various tungsten trioxide hy-drates (Nonaka et al., 1993; Sadek et al., 2009). This was due tobetter crystallization of the samples at higher hydrothermalaging temperature. From Fig. 5b, it could be seen that all agedsamples subjected to hydrothermal aging at 700°C for differenttimes showed similar profiles except for differences in intensity.This implied that the CZWcatalysts possessed a stable structureand excellent resistance to hydrothermal treatment at hightemperatures. On the basis of the XRD and Raman results, theformation of a CeO2–ZrO2 solid solution might effectivelystabilize the cubic structure and significantly enhance thestructural homogeneity of the CZW catalyst.
Table 1 – Surface atomic concentration of the CZW catalysts by
Sample Surface a
Ce Zr W
CZW 44.51 4.49 1.54CZW-6-8 25.34 15.20 5.5CZW-7-8 21.52 14.54 6.26CZW-8-8 22.34 11.46 5.72CZW-9-8 22.18 15.43 6.99CZW-7-96 31.20 7.29 5.90
CZW-m-n refers to CZW catalysts aged at m × 100°C in the presence of 10X-ray photoelectron spectrum; CZW: CeO2–ZrO2–WO3..
2.6. XPS analysis
To further gain a better understanding of the chemical state ofall elements on the catalysts' surfaces, the surface atomicconcentrations and valence states of elements in the CZWcatalysts were investigated by XPS. The surface atomic con-centrations of Ce, Zr, W, and O were measured and are shownin Table 1. The CZW catalyst had the highest relative surfaceconcentration of Ce atoms (44.51%). The surface concentra-tion of Ce atoms was dramatically decreased on the surface ofaged CZW catalysts. However, the concentrations of Zr and Watoms were increased after hydrothermal aging treatment.This indicated that hydrothermal treatment led to the agglom-eration of CZWparticles, which was consistent with the resultsof XRD.
The chemical states of elements could be identified fromthe XPS results. Fig. 6 shows the spectra of the Ce 3p region forCZW catalysts. It was reported that two sets of spin-orbitalmultiplets for Ce, designated u and v, corresponded to the 3d3/
2 and 3d5/2 contributions, respectively (Gao et al., 2010). Thebands labeled u′ and v′ were assigned to the electronic statecorresponding to Ce3+, while the peaks labeled u, u″, u‴, v, v″and v‴ represented Ce4+ ions. For the aged CZW catalysts, theCe 3d binding energies all shifted to higher values. This
the XPS results.
tomic concentration (at.%)
O Ce3+/(Ce4+ + Ce3+) Oα/(Oα + Oβ)
49.46 14.8 30.553.96 15.8 27.257.68 16.4 24.260.47 18.4 22.155.39 18.2 18.155.61 14.2 25.3
vol.% H2O for n hr. Oα: chemisorbed oxygen; Oβ: lattice oxygen; XPS:

Fig. 6 – XPS (X-ray photoelectron spectroscopy) spectra of Ce3d, O 1 s, and Zr 3d for CZW catalysts. CZW: CeO2–ZrO2–WO3.
174 J O U R N A L O F E N V I R O N M E N T A L S C I E N C E S 4 2 ( 2 0 1 6 ) 1 6 8 – 1 7 7
indicated that the hydrothermal treatment procedure led tointeractions effect between Ce, Zr, and W oxides. This resultwas also consistent with the Ce 3d peaks of ceria-zirconia(Ricote et al., 2006). The phenomena demonstrated that theaged CZW samples maintained the CeO2–ZrO2 solid solutionunder the hydrothermal treatment. Compared with the freshCZW catalyst, it was obvious that the relative peak intensity ofthe Ce 3d peaks dramatically decreased after hydrothermal
treatment. The relative content of Ce3+/(Ce3++Ce4+) over variouscatalysts is listed in Table 1. It can be seen that the percent ofCe3+ was increased with an increase in hydrothermal agingtemperature. This result was consistent with the results fromthe H2-TPR analysis discussed below.
The photoelectron spectra obtained from the fresh and agedsamples in the O 1 s region are shown in Fig. 6. The oxygen in thecatalysts could be categorized into two types of species: latticeoxygen (529.2–530.3 eV, denoted as Oβ) and chemisorbed oxygen(531.3–532.3 eV, denoted as Oα) (Li et al., 2011). It had beenreported that the chemisorbed oxygen (Oα) could be regarded asthe most active oxygen, which was associated with a significantimprovement in oxidation reactions, and a high ratio of Oα/(Oα + Oβ) on the catalyst surface was closely correlated withexcellent SCR activity (Liu et al., 2013). With an increase in theaging temperature, the Oα/(Oα + Oβ) ratio varied as follows:CZW > CZW-6-8 > CZW-7-96 > CZW-7-8 > CZW-8-8 > CZW-9-8.This trend was consistent with the NH3-SCR activity over thewhole temperature range. Meanwhile, this could confirm that alow concentration of surface chemisorbed oxygen resulted in aless reactive oxidation process, which would decrease thelow-temperature activity (below 275°C). Furthermore, the bindingenergy (BE) of Oβ peaks tended to shift towards higher BE(approximately 0.5–1.3 eV) over aged CZW catalysts. This shiftwas related to the partial conversion of Ce4+ into Ce3+ species.
The Zr 3d binding energies of the CZW catalysts areexhibited in Fig. 6. The Zr 3d spectra showed a doubletcorresponding to Zr 3d3/2 at ~184.4 eV and Zr 3d5/2 at~182.1 eV, which was assigned to quadrivalent zirconium(Picasso et al., 2007). As for aged CZW samples, the intensity ofZr 3d peaks increased with an increase in aging temperature.This implied that the sintering of zirconium occurred duringthe aging process, resulting in the formation of more oxidizedzirconium species. It is worth noting that the Zr 3d intensity ofCZW-7-96 became much weaker than that of CZW-7-8,indicating that the aging of the CZW catalyst at 700°C for along time was beneficial to the dispersion of Zr species.Furthermore, a shift of these peaks to higher BE values wasfound, which was associated with the formation of Zr(IV)species bound to more electron attractive species, as reportedin the literature (Younes et al., 2003).
2.7. Redox property analysis
The reducibility of catalysts was investigated by H2-TPRexperiments. Fig. 7 exhibited the H2-TPR profiles of the CZWsamples. Roh et al. (2001) reported that no reduction peakcould be observed over pure ZrO2 below 900°C. The reductionpeaks of the surface oxygen species (Ce4+–O–Ce4+) and thebulk oxygen species (Ce3+–O–Ce4+) of pure ceria were centeredat 509 and 812°C, respectively (Damyanova et al., 2002). FromFig. 7a, a reduction peak was observed centered at 700°C overthe CZW, CZW-6-8, and CZW-7-8 samples, which might beattributed to the stronger interaction between CeO2 and ZrO2.As for CZW-8-8 and CZW-9-8 catalysts, two reduction peakswere clearly observed. The other peaks appearing at hightemperature were assigned to the reduction of Ce3+–O–Ce4+.Furthermore, with an increase in hydrothermal aging tem-perature from 600 to 900°C, the intensity of the reduction peakof Ce4+–O–Ce4+ species decreased, while that of Ce3+–O–Ce4+
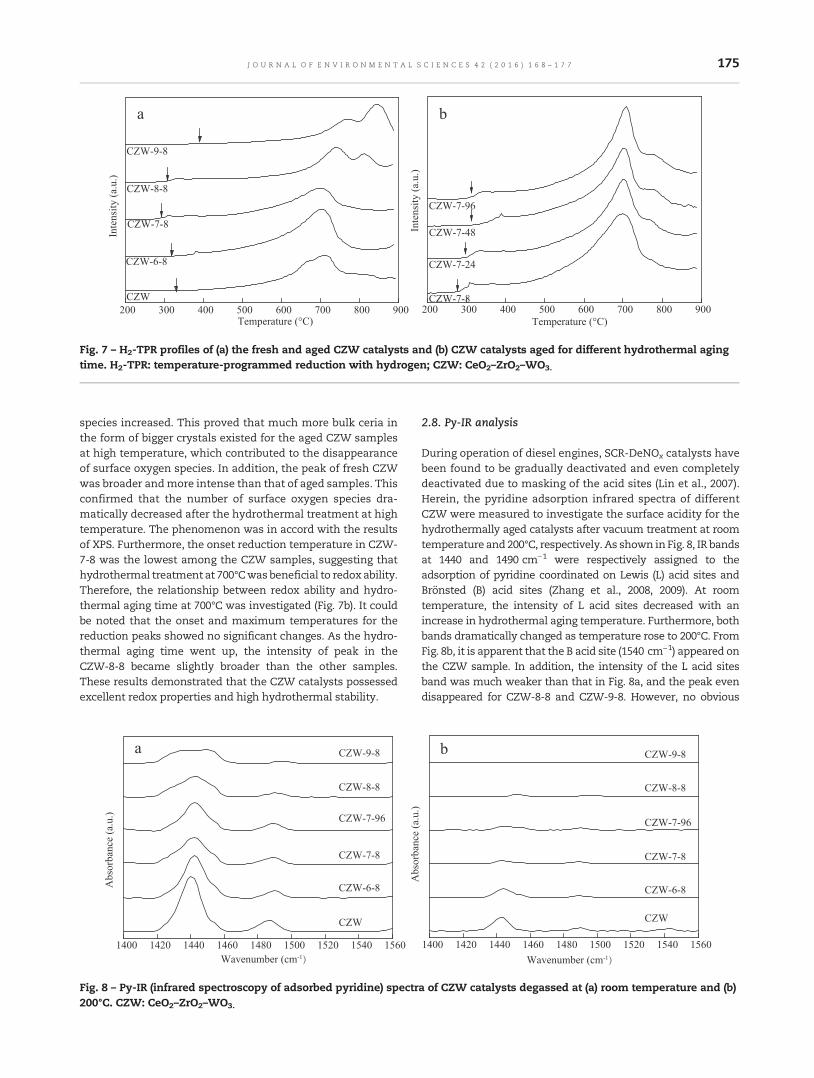
Fig. 7 – H2-TPR profiles of (a) the fresh and aged CZW catalysts and (b) CZW catalysts aged for different hydrothermal agingtime. H2-TPR: temperature-programmed reduction with hydrogen; CZW: CeO2–ZrO2–WO3.
175J O U R N A L O F E N V I R O N M E N T A L S C I E N C E S 4 2 ( 2 0 1 6 ) 1 6 8 – 1 7 7
species increased. This proved that much more bulk ceria inthe form of bigger crystals existed for the aged CZW samplesat high temperature, which contributed to the disappearanceof surface oxygen species. In addition, the peak of fresh CZWwas broader andmore intense than that of aged samples. Thisconfirmed that the number of surface oxygen species dra-matically decreased after the hydrothermal treatment at hightemperature. The phenomenon was in accord with the resultsof XPS. Furthermore, the onset reduction temperature in CZW-7-8 was the lowest among the CZW samples, suggesting thathydrothermal treatment at 700°Cwasbeneficial to redox ability.Therefore, the relationship between redox ability and hydro-thermal aging time at 700°C was investigated (Fig. 7b). It couldbe noted that the onset and maximum temperatures for thereduction peaks showed no significant changes. As the hydro-thermal aging time went up, the intensity of peak in theCZW-8-8 became slightly broader than the other samples.These results demonstrated that the CZW catalysts possessedexcellent redox properties and high hydrothermal stability.
Fig. 8 – Py-IR (infrared spectroscopy of adsorbed pyridine) spectr200°C. CZW: CeO2–ZrO2–WO3.
2.8. Py-IR analysis
During operation of diesel engines, SCR-DeNOx catalysts havebeen found to be gradually deactivated and even completelydeactivated due to masking of the acid sites (Lin et al., 2007).Herein, the pyridine adsorption infrared spectra of differentCZW were measured to investigate the surface acidity for thehydrothermally aged catalysts after vacuum treatment at roomtemperature and 200°C, respectively. As shown inFig. 8, IR bandsat 1440 and 1490 cm−1 were respectively assigned to theadsorption of pyridine coordinated on Lewis (L) acid sites andBrönsted (B) acid sites (Zhang et al., 2008, 2009). At roomtemperature, the intensity of L acid sites decreased with anincrease in hydrothermal aging temperature. Furthermore, bothbands dramatically changed as temperature rose to 200°C. FromFig. 8b, it is apparent that the B acid site (1540 cm−1) appeared onthe CZW sample. In addition, the intensity of the L acid sitesband was much weaker than that in Fig. 8a, and the peak evendisappeared for CZW-8-8 and CZW-9-8. However, no obvious
a of CZW catalysts degassed at (a) room temperature and (b)

176 J O U R N A L O F E N V I R O N M E N T A L S C I E N C E S 4 2 ( 2 0 1 6 ) 1 6 8 – 1 7 7
changes were observed with an increase in hydrothermal agingtime. These indicated that the acid strength of the L and B siteswas weak and medium respectively, but the weak L acid siteswere dominant. In addition, the hydrothermal temperaturesignificantly affected the amount and type of acid sites, but thehydrothermal time had little influence on the acidity. It wasreported that the amounts of L and B acid sites were closelyrelated to NOx conversion (Ma et al., 2012). In other words, theincrease of thenumber ofweak andmediumacid sites improvedthe reactivity of CZW catalysts for the adsorption of ammonia,which was beneficial to ammonia oxidation, and then led toexcellent catalytic activity in the NH3-SCR reaction, especiallylow-temperature activity. This was consistent with the activityresults.
3. Conclusions
In summary, the CZW catalyst exhibited high performance andsuperior hydrothermal stability at high temperature. The cata-lytic activity results revealed that the CZW catalyst hydrother-mally aged at 700°C in the presence of 10%H2O showed over 90%NOx conversion at 250–525°C. The particle size of CZW catalystsincreased from 19 to 37 nmafter hydrothermal aging at 700°C for96 hr.With an increase inhydrothermal aging temperature (from700 to 900°C), the crystallinity of CZW increased dramatically andthe phase separation of CeO2 and ZrO2was observed remarkably.Consequently, the excellent hydrothermal stability of the CZWcatalyst was attributed to its superior redox properties and thepresence of highly dispersed or amorphous WO3 species. Inaddition, the abundant weak and medium acid sites were alsoresponsible for the excellent hydrothermal stability of the CZWcatalyst.
Acknowledgments
This work is supported by the National Natural Science Founda-tion of China (Nos. U1137603, 21307047) and the Opening Projectof Key Laboratory of Green Catalysis of Sichuan Institutes of HighEducation (No. LYJ1309).
R E F E R E N C E S
Brandenberger, S., Kröcher, O., Tissler, A., Althoff, R., 2010. Thedetermination of the activities of different iron species inFe-ZSM-5 for SCR of NO by NH3. Appl. Catal. B Environ. 95 (3-4),348–357.
Casapu, M., Bernhard, A., Peitz, D., Mehring, M., Elsener, M., Kröcher,O., 2011. ANiobia–Ceria basedmulti-purpose catalyst for selectivecatalytic reduction of NOx, urea hydrolysis and soot oxidation indiesel exhaust. Appl. Catal. B Environ. 103 (1-2), 79–84.
Chapman, D.M., 2011. Behavior of titania-supported vanadia andtungsta SCR catalysts at high temperature in reactant streams:tungsten and vanadium oxide and hydroxide vapor pressurereduction by surficial stabilization. Appl. Catal. A Gen. 392(1-2), 143–150.
Damyanova, S., Perez, C.A., Schmal, M., Bueno, J.M.C., 2002.Characterization of ceria-coated alumina carrier. Appl. Catal. AGen. 234 (1-2), 271–282.
Fornasiero, P., Kašpar, J., Sergo, V., Graziani, M., 1999. Redoxbehavior of high-surface-area Rh-, Pt-, and Pd-loadedCe0.5Zr0.5O2 mixed oxide. J. Catal. 182 (1), 56–69.
Gao, X., Jiang, Y., Zhong, Y., Luo, Z.Y., Cen, K.F., 2010. The activityand characterization of CeO2–TiO2 catalysts prepared by thesol-gel method for selective catalytic reduction of NO withNH3. J. Hazard. Mater. 174 (1-3), 734–739.
Guo, R.T., Zhen, W.L., Pan, W.G., Zhou, Y., Hong, J.N., Xu, H.J., et al.,2014. Effect of Cu doping on the SCR activity of CeO2 catalystprepared by citric acid method. J. Ind. Eng. Chem. 20 (4),1577–1580.
Iwasaki, M., Yamazaki, K., Banno, K., Shinjoh, H., 2008.Characterization of Fe/ZSM-5 DeNOx catalysts prepared bydifferent methods: relationships between active Fe sites andNH3-SCR performance. J. Catal. 260 (2), 205–216.
Kim, Y.J., Kwon, H.J., Heo, I., Nam, I.-S., Cho, B.K., Choung, J.W., etal., 2012. Mn–Fe/ZSM5 as a low-temperature SCR catalyst toremove NOx from diesel engine exhaust. Appl. Catal. BEnviron. 126, 9–21.
Lee, S.M., Lee, H.H., Hong, S.C., 2014. Influence of calcinationtemperature on Ce/TiO2 catalysis of selective catalytic oxida-tion of NH3 to N2. Appl. Catal. A Gen. 470, 189–198.
Li, Y., Cheng, H., Li, D.Y., Qin, Y.S., Xie, Y.M., Wang, S.D., 2008.WO3/CeO2–ZrO2, a promising catalyst for selective catalyticreduction (SCR) of NOx with NH3 in diesel exhaust. Chem.Commun. (12), 1470–1472.
Li, H.L., Wu, C.Y., Li, Y., Zhang, J.Y., 2011. CeO2–TiO2 catalysts forcatalytic oxidation of elemental mercury in low-rank coalcombustion flue gas. Environ. Sci. Technol. 45 (17), 7394–7400.
Lin, X.Y., Fan, Y., Shi, G., Liu, H.Y., Bao, X.J., 2007. Coking anddeactivation behavior of HZSM-5 zeolite-based FCC gasolinehydro-upgrading catalyst. Energy Fuel 21 (5), 2517–2524.
Liu, C.X., Chen, L., Chang, H.Z., Ma, L., Peng, Y., Arandiyan, H., etal., 2013. Characterization of CeO2–WO3 catalysts prepared bydifferent methods for selective catalytic reduction of NOx withNH3. Catal. Commun. 40, 145–148.
Ma, L., Li, J.H., Cheng, Y.S., Lambert, C.K., Fu, L.X., 2012. Propenepoisoning on three typical Fe-zeolites for SCR of NOx with NH3:from mechanism study to coating modified architecture.Environ. Sci. Technol. 46 (3), 1747–1754.
Marcotte, N., Coq, B., Savill-Jovitt, C., Bichon, P., Cavalier, R.,Durand, R., et al., 2011. Multi-component zirconia–titaniamixed oxides: catalytic materials with unprecedented perfor-mance in the selective catalytic reduction of NOx with NH3 afterharsh hydrothermal ageing. Appl. Catal. B Environ. 105 (3-4),373–376.
Metkar, P.S., Harold, M.P., Balakotaiah, V., 2012. Selective catalyticreduction of NOx on combined Fe- and Cu-zeolite monolithiccatalysts: sequential and dual layer configurations. Appl.Catal. B Environ. 111–112, 67–80.
Nonaka, K., Takase, A., Miyakawa, K., 1993. Raman spectra ofsol–gel-derived tungsten oxides. J. Mater. Sci. Lett. 12 (5), 274–277.
Picasso, G., Gutiérrez, M., Pina, M.P., Herguido, J., 2007. Preparationand characterization of Ce–Zr and Ce–Mn based oxides forn-hexane combustion: application to catalytic membranereactors. Chem. Eng. J. 126 (2-3), 119–130.
Reddy, B.M., Khan, A., Aouine, P.L.M., Loridant, S., Volta, J.C., 2005.Structural characterization of nanosized CeO2–SiO2, CeO2–TiO2, and CeO2–ZrO2 catalysts by XRD, Raman, and HREMtechniques. J. Phys. Chem. B 109 (8), 3355–3363.
Ricote, S., Jacobs, G., Milling, M., Ji, Y.Y., Patterson, P.M., Davis,B.H., 2006. Low temperature water-gas shift: characterizationand testing of binary mixed oxides of ceria and zirconiapromoted with Pt. Appl. Catal. A Gen. 303 (1), 35–47.
Roh, H.S., Dong, W.S., Jun, K.W., Park, S.E., 2001. Partial oxidationof methane over Ni catalysts supported on Ce–ZrO2 mixedoxide. Chem. Lett. 30, 88–89.
Sadek, A.Z., Zheng, H.D., Breedon, M., Bansal, V., Bhargava, S.K.,Latham, K., et al., 2009. High-temperature anodized WO3

177J O U R N A L O F E N V I R O N M E N T A L S C I E N C E S 4 2 ( 2 0 1 6 ) 1 6 8 – 1 7 7
nanoplatelet films for photosensitive devices. Langmuir 25(16), 9545–9551.
Shan, W.P., Liu, F.D., He, H., Shi, X.Y., Zhang, C.B., 2012. A superiorCe–W–Ti mixed oxide catalyst for the selective catalyticreduction of NOx with NH3. Appl. Catal. B Environ. 115–116,100–106.
Shi, X.Y., Liu, F.D., Xie, L.J., Shan, W.P., He, H., 2013. NH3-SCRperformance of fresh and hydrothermally aged Fe-ZSM-5 instandard and fast selective catalytic reduction reactions.Environ. Sci. Technol. 47, 3293–3298.
Si, Z.C., Weng, D., Wu, X.D., Li, J., Li, G., 2010. Structure, acidity andactivity of CuOx/WOx–ZrO2 catalyst for selective catalyticreduction of NO by NH3. J. Catal. 271 (1), 43–51.
Spanier, J.E., Robinson, R.D., Zhang, F., Chan, S.W., Herman, I.P.,2001. Size-dependent properties of CeO2-γ nanoparticles asstudied by Raman scattering. Phys. Rev. B 64 (24), 245407.
Tang, X.L., Hao, J.M., Xu, W.G., Li, J.H., 2007. Low temperatureselective catalytic reduction of NOx with NH3 over amorphousMnOx catalysts prepared by three methods. Catal. Commun. 8(3), 329–334.
Vidal, H., Kašpar, J., Pijolat, M., Colon, G., Bernal, S., Cordón, A., etal., 2000. Redox behavior of CeO2–ZrO2 mixed oxides: I.Influence of redox treatments on high surface area catalysts.Appl. Catal. B: Environ 27 (1), 49–63.
Wang, J.P., Yan, Z., Liu, L.L., Zhang, Y.Y., Zhang, Z.T., Wang, X.D.,2014. Low-temperature SCR of NO with NH3 over activatedsemi-coke composite-supported rare earth oxides. Appl. Surf.Sci. 309, 1–10.
Wu, X.D., Xu, L.H., Weng, D., 2004. The thermal stability andcatalytic performance of Ce–Zr promoted Rh–Pd/γ-Al2O3
automotive catalysts. Appl. Surf. Sci. 221 (1-4), 375–383.Xu, H.D., Wang, Y., Cao, Y., Fang, Z.T., Lin, T., Gong, M.C., et al.,
2014. Catalytic performance of acidic zirconium-based
composite oxides monolithic catalyst on selective catalyticreduction of NOx with NH3. Chem. Eng. J. 240, 62–73.
Yang, S.J., Wang, C.Z., Li, J.H., Yan, N.Q., Ma, L., Chang, H.Z., 2011.Low temperature selective catalytic reduction of NO with NH3
over Mn–Fe spinel: performance, mechanism and kineticstudy. Appl. Catal. B Environ. 110, 71–80.
Ye, Q., Wang, L.F., Yang, R.T., 2012. Activity, propene poisoningresistance and hydrothermal stability of copper exchangedchabazite-like zeolite catalysts for SCR of NO with ammonia incomparison to Cu/ZSM-5. Appl. Catal. A Gen. 427–428, 24–34.
Younes, M.K., Ghorbel, A., Rives, A., Hubaut, R., 2003. Comparativestudy of the acidity of sulphated zirconia supported onalumina prepared by sol–gel and impregnation methods.J. Sol-Gel Sci. Technol. 26 (1-3), 677–680.
Yu, T., Wang, J., Shen, M.Q., Wang, J.Q., Li, W., 2015. The influenceof CO2 and H2O on selective catalytic reduction of NO by NH3
over Cu/SAPO-34 catalyst. Chem. Eng. J. 264, 845–855.Zhang, X., Wang, J.W., Zhong, J., Liu, A.S., Gao, J.K., 2008.
Characterization and catalytic performance of SAPO-11/Hβ
composite molecular sieve compared with the mechanicalmixture. Microporous Mesoporous Mater. 108 (1-3), 13–21.
Zhang, X., Zhong, J., Wang, J.W., Zhang, L.H., Gao, J.K., Liu, A.S.,2009. Catalytic performance and characterization of Ni-dopedHZSM-5 catalysts for selective trimerization of N-butene. FuelProcess. Technol. 90 (7-8), 863–870.
Zhang, Q.L., Qiu, C.T., Xu, H.D., Lin, T., Gong, M.C., Chen, Y.Q.,2011. Novel promoting effects of tungsten on the selectivecatalytic reduction of NO by NH3 over MnOx–CeO2 monolithcatalyst. Catal. Commun. 16 (1), 20–24.
Zheng, H.S., Keith, J.M., 2004. Ignition analysis of wall-flowmonolith diesel particulate filters. Catal. Today 98 (3), 403–412.
J O U R N A L O F E N V I R O N M E N T A L S C I E N C E S 4 2 ( 2 0 1 6 ) 1 7 8 – 1 8 6
Ava i l ab l e on l i ne a t www.sc i enced i r ec t . com
ScienceDirect
www. jou rna l s . e l sev i e r . com/ j es
Reversibility of the structure and dewaterability of anaerobicdigested sludge
Yiqi Sheng1, Yili Wang1,⁎, Wei Hu1, Xu Qian1, Huaili Zheng2, Xiaoxiu Lun1
1. College of Environmental Science and Engineering, Beijing Key Lab for Source Control Technology of Water Pollution, Beijing ForestryUniversity, Beijing 100083, China. E-mail: [email protected]. College of Urban Construction and Environmental Engineering, Chongqing University, Chongqing 400044, China
A R T I C L E I N F O
⁎ Corresponding author. E-mail: wangyilimai@1
http://dx.doi.org/10.1016/j.jes.2015.08.0041001-0742/© 2015 The Research Center for Ec
A B S T R A C T
Article history:Received 29 April 2015Revised 31 July 2015Accepted 3 August 2015Available online 21 October 2015
The reversibility of the structure and dewaterability of broken anaerobic digested sludge(ADS) is important to ensure the efficiency of sludge treatment or management processes.This study investigated the effect of continuous strong shear (CSS) and multipulse shear(MPS) on the zeta potential, size (median size, d50), mass fractal dimension (DF), andcapillary suction time (CST) of ADS aggregates. Moreover, the self-regrowth (SR) of brokenADS aggregates during slow mixing was also analyzed. The results show that raw ADS withd50 of 56.5 μmwas insensitive to CSS–SR or MPS–SR, though the size slightly decreased afterthe breakage phase. For conditioned ADS with d50 larger than 600 μm, the breakage insmall-scale surface erosion changed to large-scale fragmentation as the CSS strengthincreased. In most cases, after CSS or MPS, the broken ADS had a relatively more compactstructure than before and d50 is at least 200 μm. The CST of the broken fragments fromoptimally dosed ADS increased, whereas that corresponding to overdosed ADS decreased.MPS treatment resulted in larger and more compact broken ADS fragments with a lowerCST value than CSS. During the subsequent slowmixing, the broken ADS aggregates did notrecover their charge, size, and dewaterability to the initial values before breakage. Inaddition, less than 15% self-regrowth in terms of percentage of the regrowth factor wasobserved in broken ADS after CSS at average velocity gradient no less than 1905.6 sec−1.© 2015 The Research Center for Eco-Environmental Sciences, Chinese Academy of Sciences.
Published by Elsevier B.V.
Keywords:Anaerobic digested sludgeShearReversibilityStructureDewaterabilityFloc strength
Introduction
Sewage sludge consists of microbial organisms and colonies,extracellular polymeric substances (EPS) and inorganic matter.The microorganisms are embedded in the gel-like matrix of EPS,which is further linked by EPS to form the flocs or aggregates ofsewage sludge (Dursun, 2007). Coagulation or flocculation condi-tioning is an important process for sewage sludge dewatering,and the applied shear during and after conditioning is crucial foreffective conditioning. In general, additional shear is created in
26.com (Yili Wang).
o-Environmental Science
pipes, pumps, in-line flow meters, and even dewatering devicesduring sewage sludge treatment and management. According tothe previous studies (Novak et al., 1988; Novak and Bandak, 1989;Novak, 1990;Abu-Orf andDentel, 1997;Örmeci andAhmad, 2009),the additional shear breaks flocs and exposes the negativelycharged fresh surfaces, which in turn increase the polymerdemand of sewage sludge conditioning. Moreover, Örmeci andAhmad (2009) indicated that additional shearing after condition-ing had a significant effect on the optimum polymer dose, evendoubling the polymer dose required for conditioning of thebroken sludge flocs after an in-line flowmeter (Werle et al., 1984).Therefore, Örmeci and Ahmad (2009) determined the variations
s, Chinese Academy of Sciences. Published by Elsevier B.V.

Table 1 – Characterization of anaerobic digested sludge(ADS).
Sample CST(sec)
pH TSS(g/L)
VSS(g/L)
VSS/TSS
1 931.6 ± 212.8 7.7 ± 0.10 37.7 ± 0.3 24.0 ± 0.2 64%2 877.6 ± 70.2 7.5 ± 0.02 36.6 ± 0.4 23.3 ± 0.1 64%3 630.0 ± 48.8 7.6 ± 0.01 41.4 ± 0.3 25.2 ± 0.1 61%4 842.2 ± 79.2 7.3 ± 0.03 40.1 ± 0.2 25.3 ± 0.3 63%5 456.4 ± 85.6 7.4 ± 0.04 34.6 ± 1.6 21.7 ± 0.8 63%
CST: capillary suction time, TSS: total suspended solid, VSS:volatile suspended solid.
179J O U R N A L O F E N V I R O N M E N T A L S C I E N C E S 4 2 ( 2 0 1 6 ) 1 7 8 – 1 8 6
of themeasured torquevalues for conditionedanaerobic digestedsludge (ADS) in the under-dose, optimum-dose, and over-doseranges. This rheological information on the additional shearwould be useful to achieve the highest cake solids at the lowestpossible polymer dose and operational costs. Wang and Dentel(2011) observed that the extended mixing intensity did nothave a distinct effect on the capillary suction time (CST) ofconditioned anaerobic digested sludge (ADS) at specific polymerdosages. After sludge flocs were destroyed by the additionalshearing, the possible regrowth of the broken flocs could reducethe optimum dosage requirement for their conditioning. Howev-er our understanding of the effect of additional shear on thereversibility of the structure and dewatering of sewage sludgeremains limited.
Coagulation is awell-established process inwater treatmentfor removing suspended particles by combining small particlesinto larger aggregates. In comparison with sewage sludge, thefloc matrix obtained from coagulation is a type of dilutesuspension with many inorganic components. Many studieshave shown that floc regrowth after exposure to high shearwaslimited for all the investigated flocs, including Fe precipitate,Fe-NOM, Al-NOM (Jarvis et al., 2005a), Al-humics, PACl-humics(Wanget al., 2009), nano-Al13 polymer andPACl coagulated flocs(Xu et al., 2010), kaolin flocs (Yukselen and Gregory, 2002, 2004a,2004b; Li et al., 2007; Yu et al., 2011), and natural organic matter(NOM) flocs (Jarvis et al., 2005a;Wang et al., 2009; Xu et al., 2010;Yu et al., 2010, 2012). To repair the rupture of chemical bondswithin the hydroxide precipitates and improve their regrowthability, a small additional dosage of alum (Yu et al., 2010, 2012)was proven effective. On the other hand, Yukselen andGregory (2004b) observed that clay particles flocculatedwith a cationic polyelectrolyte presented almost completelyreversible floc breakage. Wei et al. (2010) compared theregrowth capacity of flocs formed by different polyferric–polymer dual coagulants and suggested that the chargeneutralization and bridging of the cationic polymer PDADMACis the dominant driving force in the recovery of brokenflocs.
Sewage sludge shows many differences in content, com-ponents, and structure in coagulation compared to theaforementioned flocs. Biggs and Lant (2000) studied the effectof shear on activated sludge (AS) flocculation and determinedthe correlation between shear strength and AS size. Yuan andFarnood (2010) investigated the breakage of raw AS flocsunder turbulent shear conditions as a function of floc size.They obtained the shear stress distribution functions for thebreakage of AS floc samples. Despite the aforementionedadvancements in the breakage and regrowth of flocs in watertreatment, the corresponding research on sewage sludge,especially for the regrowth of broken aggregates, remainslimited. The reversibility of the structure and dewatering ofraw and conditioned sewage sludge aggregates owing toadditional shear affects the conditioning strategy, which isof fundamental and practical significance in sewage sludgetreatment and management. Clearly, these phenomenawarrant further investigation.
This study aims to investigate the reversibility of structureand dewaterability of raw, optimally dosed, and overdosedADS during the continuous strong shear–self-regrowth (CSS–SR) or multipulse shear–self-regrowth (MPS–SR) processes.
The changes in the zeta potential, size (d50), mass fractaldimension (DF), and CST of ADS aggregates during theaforementioned processes was recorded to assess theself-recovery in the structure and dewaterability of the brokenADS flocs under slow mixing. An improved understanding ofthis process would be an important contribution to the field ofsewage sludge conditioning and dewatering.
1. Materials and methods
1.1. Raw sludge
The rawADS tested was collected from awastewater treatmentplant in Beijing, China, which handles 1,000,000 m3 wastewaterper day by using a traditional two-stage activated sludgeprocess. The ADS samples were taken from the anaerobicdigestion tank and then they were immediately transferred tothe laboratory at Beijing Forestry University and stored at 4 °C.Subsequently, experimentswere conductedwithin aweek aftersampling. Prior to each experiment, the ADS samples werewarmed to 25 °C. The total suspended solids (TSS) and volatilesuspended solids (VSS) in ADS were determined accordingto APHA (American Public Health Association) (2005). TheCST was measured with a capillary suction timer (Z304M,Triton Electronic Ltd., USA) to represent ADS dewaterability.The characteristics of the ADS samples are presented inTable 1.
1.2. ADS conditioning
Cationic polyacrylamide WD4960 was chosen as conditioner,with a molecular weight of 20–25 MDa and surface chargedensity of +2.53 meq/g TS. During the experiments, 0.5% stocksolution of WD4960 was prepared and renewed every 24 hr.
Conditioning was conducted with a six-paddle stirringapparatus (JTY-6, Tangshan Dachang Chemicals Ltd., China)as follows: an aliquot of 0.5% WD4960 solution was injectedinto a 1.0 L beaker full of 500 mL raw ADS within 5 sec ofagitation at 800 r/min. Then, themixture was stirred for 1 minat 800 r/min and for 5 min at 62 r/min. The optimum WD4960dosage was 2.9–3.5 g/kg TSS, when the CST of the conditionedADS reached the minimum of 7–10 sec. In addition, a WD4960dosage of 6.0–7.2 g/kg TSS was considered as an over-dosageduring ADS conditioning. All the jar tests were conducted intriplicate to ensure consistency.

180 J O U R N A L O F E N V I R O N M E N T A L S C I E N C E S 4 2 ( 2 0 1 6 ) 1 7 8 – 1 8 6
1.3. Breakage and self-regrowth of ADS
In this study, two shear modes, CSS–SR and MPS–SR, wereimposed for the breakage and regrowth of ADS aggregates. Thecorresponding experiments were conducted with an IKA-2000cantilever agitator (EUROSTAR 20 digital, IKA, Germany) and 1 Ljarwith 500 mLADS. In the CSS–SRmode, ADSwas first stirred at400–1200 r/min for 1 min to break the ADS aggregates, and thento 62 r/min for 15 min to recover the broken aggregates. In theMPS–SR mode, ADS was successively stirred six times, and eachstirring cycle consisted of 10 sec shearing at 1200 r/min and1 min shearing at 62 r/min. After theMPS stage, the sheared ADSaggregates were stirred at 62 r/min for another 15 min to allowthemto regrow.ADSsamples 1–4 inTable 1wereused in theCSS–SR tests, and sample 5 in the MPS–SR tests. During each shearmode, ADS flocs/aggregates were withdrawn before and imme-diately after breakage, and at the end of every 3 min ofself-regrowth. The CST value of each ADS sample was deter-mined immediately. The particle-size distributionwasmeasuredby using a laser diffraction instrument (Mastersizer 2000,Malvern, UK, measurement range of 0.02–2000 μm). Subsequent-ly, the aforementioned ADS samples were centrifuged at 3000 r/min for 15 min, and the zeta potential of the colloidal biosolids inthe supernatant was examined with a Zetasizer 2000 (Malvern,UK) following the methods proposed by Dursun (2007).
In addition, the average velocity gradient G is commonlyused to characterize the turbulent shear rate (Jarvis et al.,2005a) as in the following equation:
G ¼ffiffiffiεν
rð1Þ
where ɛ is the energy dissipation rate and ν is the kinematicviscosity of fluid. According to previous publications (Thomaset al., 1999; Yuan and Farnood, 2010), the breakage mecha-nism of flocs is controlled by the Kolmogorov microscale, λ:
λ ¼ ν3
ε
� �14
ð2Þ
For flocswith characteristic length d, it is suggested that underinertial subrange conditions (d > > λ), flocs aremore likely to breakby large-scale fragmentation, while surface erosion is proposed todominate the breakup in the viscous subrange (d < <λ).
G was calculated according to the relation between G andthe rotary speed proposed by Hermawan et al. (2004), and thecorresponding values of G and λ are presented in Table 2.
1.4. ADS aggregates characterization
The d50, DF and floc strength (strength factor and recovery factor)of the ADS aggregates were derived from the aforementioned
Table 2 – Average velocity gradient (G) and Kolmogorovmicroscale (λ) values at different rotary speeds.
Rotation speed (r/min) G (sec−1) λ (μm)
62 29.4 185.4400 482.1 45.8700 1116.0 30.11000 1905.6 23.01200 2504.9 20.1
particle size distribution data during the breakage-regrowthprocess.
The principles for the DF determination were proposed bySpicer et al. (1998). During the process of small-anglelight-scattering tests, the light beam passes through thesample pool, and the particle size in the sample pool isproportional to the scattered light. The scattered lightintensity (I) is a function of the scattering vector Q, which isthe difference between the incident and scattered light in themedium. Q is given by Eq. (3)
Q ¼ 4πn sin θ=2ð Þλ
ð3Þ
where n is the refractive index of the suspending medium, θ isthe scattering angle, and λ is the wavelength of the radiationin vacuum. For independent scattering, I is related to Q and DF
in Eq. (4):
I∝Q ‐D F ð4Þ
Therefore, DF can be calculated by using linear regressionbetween I and Q at logarithmic scale.
Based on previous studies (Yukselen and Gregory, 2002;Wei et al., 2010; Francois, 1987; Jarvis et al., 2005b), thebreakage factor (BF, %) and regrowth factor (RF, %) are definedas follows:
BF ¼ d2d1
� 100% ð5Þ
RF ¼ d3−d2d1−d2
� 100% ð6Þ
where d1 and d2 represent the floc size before and afterbreakage and d3 represents the stable floc size after regrowth.
2. Results
2.1. Zeta potential of ADS
Fig. 1 shows the change in zeta potential of the ADS biosolidsunder different shear modes. As shown in Fig. 1a, the zetapotentials of raw ADS fluctuated around the initial value of −9.7 mV after CSS, and continued to fluctuate during thesubsequent self-regrowth phase. For the conditioned ADS atthe optimum WD4960 dosage, the CSS treatment markedlydecreased the zeta potential from the initial value of −6.3 mVto around −8.4 mV. The subsequent slow mixing slightlyincreased the zeta potentials of the sheared ADS at 400 and700 r/min, whereas it did not change them at 1000 and 1200 r/min. For the ADS conditioned at an overdosage of WD4960,the zeta potential sharply decreased from the initial value of12.1 mV to −0.3, −5.9, −7.1, and −8.1 mV after the CSSoperation at 400, 700, 1000, and 1200 r/min, respectively. Thefollowing slow agitation for 15 min at 62 r/min changed theaforementioned zeta potentials to −7.4 mV. In addition, forthe ADS after the CSS operation at 400 r/min shearing, thefirst slow mixing for 3 min at 62 r/min slightly increased thezeta potential, and the subsequent slow mixing for 6 minrapidly reduced the zeta potential to −6.2 mV; thereafter, thezeta potential gradually approached a stable value.

0 2 4 6 8 10 12 14 16 18-14
-12
-10
-8
-6
-4
RegrowthBreakage
a
Time (min)
Time (min)
400 r/min:62 r/min 700 r/min:62 r/min
1000 r/min:62 r/min 1200 r/min:62 r/min400 r/min:62 r/min 700 r/min:62 r/min
1000 r/min:62 r/min 1200 r/min:62 r/min
400 r/min:62 r/min 700 r/min:62 r/min
1000 r/min:62 r/min 1200 r/min:62 r/min
0 2 4 6 8 10 12 14 16-11
-10
-9
-8
-7
-6
-5
-4
-3
-2
RegrowthBreakage
b
Time (min)
0 2 4 6 8 10 12 14 16 18-15
-10
-5
0
5
10
15
20
Regrowth
Breakage
c
0 200 400 600 800 1000 1200 1400-16
-14
-12
-10
-8
4
6
8
10
12
14
RegrowthBreakage
d
Zet
a po
tent
ial (
mV
)Z
eta
pote
ntia
l (m
V)
Zet
a po
tent
ial (
mV
)Z
eta
pote
ntia
l (m
V)
Time (sec)
Raw ADS Conditioned ADS at optimum dosage Conditioned ADS at overdosage
18
Fig. 1 – Changes in the zeta potential of anaerobic digested sludge (ADS) with time under different shearmodes. (a) RawADS, (b)optimum dosage-conditioned ADS, (c) overdosage-conditioned ADS under the continuous strong shear (CSS)–self-regrowth(SR) mode, and (d) raw and conditioned ADS under the multipulse shear (MPS)–SR mode.
181J O U R N A L O F E N V I R O N M E N T A L S C I E N C E S 4 2 ( 2 0 1 6 ) 1 7 8 – 1 8 6
In the MPS–SR mode, the zeta potentials of raw andconditioned ADS at the optimum WD4960 dosage fluctuatedduring theMPS phase, and then showed slight increase duringthe subsequent slow mixing phase. For the ADS conditionedat an overdosage of WD4960, its zeta potential decreased fromthe initial value of 11.2 mV to 9.0 mV after the MPS operation.This suggests that the subsequent 1 min mixing at 62 r/mincan slow the decrease in the zeta potential caused by the10 sec strong shearing at 1200 r/min in the MPS cycle. Afterthe slow mixing phase in the MPS–SR mode, the correspond-ing zeta potential decreased to 3.6 mV.
2.2. Geometric characteristics of ADS
2.2.1. ADS floc sizeThe change in ADS floc size (d50) under different shear modesis shown in Fig. 2. As shown in Fig. 2a, the d50 of raw ADS was56.5 μm and slightly decreased to 48.9–51.9 μm after the shearphase. Breakage can be attributed to surface erosion (Francois,1987). Combined with Fig. 1a, it can be seen that little freshsurface of raw ADS was exposed owing to strong shear. The
subsequent slow mixing slightly increased the d50 values ofbroken raw ADS samples after 400, 700, and 1000 r/minshearing. For the conditioned ADS at the optimum WD4960dosage, d50 sharply decreased from the initial value of 630 μmto 391, 300, 250, and 198 μm after 400, 700, 1000, and 1200 r/min shearing, respectively. This suggests that the breakagemechanism passed from small-scale surface erosion tolarge-scale fragmentation as the shearing rate increased.The subsequent slow mixing could lead to the flocculation ofthe broken ADS aggregates after 400 or 700 r/min shearing,and the self-regrown ADS aggregates approached 572 and420 μm, respectively, which is smaller than their initial size.For the broken ADS aggregates after 1000 and 1200 r/minshearing, self-regrowth did not occur during the subsequent15 min slowmixing at 62 r/min. As the ADS conditioned at anoverdosage of WD4960 was subjected to CSS treatment after400 r/min, the size of some initial and broken aggregates wasclose to the measurement limit of the Mastersizer 2000, sothat the corresponding d50 values do not show in Fig. 3c. After700, 1000, and 1200 rpm shearing under CSS mode, the d50values of broken aggregates were 644, 409, and 317 μm,

0 2 4 6 8 10 12 14 16 1830
35
40
45
50
55
60
65
70
75
Time (min)
Breakage Regrowth
a
0 2 4 6 8 10 12 14 16 18100
200
300
400
500
600
700
800
RegrowthBreakage
bd 5
0 (µm
)
d 50 (
µm)
d 50 (
µm)
d 50 (
µm)
Time (min)
0 2 4 6 8 10 12 14 16 18200
300
400
500
600
700
800
900
1000c
RegrowthBreakage
Time (min)0 200 400 600 800 1000 1200 1400
30
40
50
60
200
400
600
800
1000
1200
1400d
RegrowthBreakage
Time (sec)
Raw ADSConditioned ADS at optimum dosageConditioned ADS at overdosage
400 r/min:62 r/min 700 r/min:62 r/min
1000 r/min:62 r/min 1200 r/min:62 r/min
400 r/min:62 r/min 700 r/min:62 r/min
1000 r/min:62 r/min 1200 r/min:62 r/min
400 r/min:62 r/min 700 r/min:62 r/min
1000 r/min:62 r/min 1200 r/min:62 r/min
Fig. 2 – Change in the floc size (d50) of ADSwith time under different shearmodes.(a) RawADS, (b) optimumdosage-conditionedADS, (c) overdosage-conditioned ADS under CSS–SR mode, and (d) raw and conditioned ADS under MPS–SR mode.
182 J O U R N A L O F E N V I R O N M E N T A L S C I E N C E S 4 2 ( 2 0 1 6 ) 1 7 8 – 1 8 6
respectively. This observation suggested that large-scalefragmentation occurred at 1000 and 1200 r/min shearing.
In the MPS–SR mode, the raw ADS did not show noticeablechange in d50 during breakage and self-regrowth. For theconditioned ADS at the optimum WD4960 dosage, d50 sharplydecreased from the initial value of 639 to 248 μmafter the MPSoperation. Then, the subsequent slow mixing did not lead tosignificant regrowth of the broken ADS aggregates, and thecorresponding d50 value was maintained at around 278 μm.The d50 value of ADS conditioned at an overdosage of WD4960also decreased to 297 μm; after the regrowth phase, it wasabout 325 μm. During the MPS process, the partial recoverycaused by 1 min slow mixing at 62 r/min was seen at the 2ndand 3rd cycles for the conditioned ADS at the optimumWD4960 dosage, and the 5th and 6th cycles for the ADSconditioned at an overdosage of WD4960.
2.2.2. Fractal dimension of ADS flocs/aggregatesFig. 3 shows the change in the DF of the ADS flocs/aggregateswith time under different shear modes. As shown in Fig. 3a,the DF of raw ADS was 2.12. The CSS treatment did not change
the structure of raw ADS, and the corresponding DF valuesfluctuated around 2.07–2.13. For the conditioned ADS at theoptimum WD4960 dosage, the initial DF value was 2.15 andslightly changed after the CSS treatment at different speeds.Then, the subsequent slow mixing only increased the DF
values of broken ADS aggregates after 700, 1000, and 1200 r/min shearing to around 2.20. For the ADS conditioned at anoverdosage of WD4960, the DF value could not be determineddue to the size of some aggregates exceeding the measure-ment capability of the Mastersizer 2000. As shown in Fig. 3c,the DF values were stable in the following slow mixing phase.The larger ADS flocs/aggregates were, the lower the DF valueswere, and the looser the structure was.
In the MPS–SR mode, the DF value of raw ADS slightlyincreased during the MPS phase, and then was stable at 2.33during the subsequent 15 min slow mixing phase. For theconditioned ADS at the optimum WD4960 dosage, the first10 sec of strong shear decreased the DF value from 2.35 to 2.12,and then the DF value increased and reached 2.22 at the end ofthe MPS phase. Hereafter, the slow mixing led to a slightincrease in the DF value. For the ADS conditioned at an

0 2 4 6 8 10 12 14 16 181.9
2.0
2.1
2.2
2.3
2.4D
F DF
DFD
F
Time (min)
Time (min)
Breakage Regrowth
a
0 2 4 6 8 10 12 14 16 182.0
2.1
2.2
2.3
2.4
2.5
RegrowthBreakage
Time (min)
0 2 4 6 8 10 12 14 16 181.8
2.0
2.2
2.4
2.6
2.8
3.0
c
RegrowthBreakage
0 200 400 600 800 1000 1200 14002.0
2.2
2.4
2.6
2.8
3.0
RegrowthBreakage
d
Time (sec)
Raw ADSConditioned ADS at opitimum dosageConditioned ADS at overdosage
b 400 r/min:62 r/min 700 r/min:62 r/min
1000 r/min:62 r/min 1200 r/min:62 r/min
400 r/min:62 r/min 700 r/min:62 r/min
1000 r/min:62 r/min 1200 r/min:62 r/min
400 r/min:62 r/min 700 r/min:62 r/min
1000 r/min:62 r/min 1200 r/min:62 r/min
Fig. 3 – Change in the fractal dimension of ADS with time under different shear modes.(a) Raw ADS, (b) optimumdosage-conditioned ADS, (c) overdosage-conditioned ADS under CSS–SRmode, and (d) raw and conditioned ADS under MPS–SRmode.
183J O U R N A L O F E N V I R O N M E N T A L S C I E N C E S 4 2 ( 2 0 1 6 ) 1 7 8 – 1 8 6
overdosage of WD4960, the DF value was 2.51 after MPSshearing. During the regrowth phase, the DF value continu-ously decreased to 2.35.
2.2.3. Flocs/aggregates strengthUsing Eqs. (5) and (6), theBF andRFofADSaggregatesduringCSS–SR and MPS–SR are calculated in Table 3. The d3/d1 values alsoshow recovery for broken ADS aggregates. For the raw ADSaggregates, the BF wasmaintained around 90% after CSS or MPS,indicating that the raw aggregates were insensitive to shearing.In the CSS operation, the BF value of the conditioned ADS at theoptimum WD4960 dosage was lower than that of the
Table 3 – Breakage factor (BF) and recovery factor (RF) of ADS ag
Raw ADS
Shear mode G (sec−1) BF RF/(100 × d3/d1)(%) (%)
CSS–SR 482.1 91 87/991116.0 87 76/971905.6 88 72/97
MPS–SR 2504.9 92 18/932504.9 98 51/99
overdose-conditioned ADS, and the BF values of both ADSaggregates decreased with increasing shear strength. Thissuggests that the conditioned ADS at the optimum WD4960dosage was more easily disrupted by CSS than the overdosage-conditionedADS.Moreover, theRFvalueof thebrokenaggregatesof conditioned ADS at the optimum WD4960 dosage was 76%after 400 r/min CSS. The corresponding d3/d1 value reached 91%,thus suggesting high recovery. Meanwhile, the RF values of thebroken aggregates were 7% and 3% after strong shearing, therebyindicating insignificant recovery. For the broken fragments ofoverdosed ADS aggregates, the RF values in Table 3 showed thatthe recovery was not very strong. The aforementioned result
gregates.
Optimally dosed ADS Overdosed ADS
BF RF/(100 × d3/d1) BF RF/(100 × d3/d1)(%) (%) (%) (%)62 76/91 – –48 36/67 – –40 7/44 51 15/5932 3/34 40 1/4039 8/43 – –
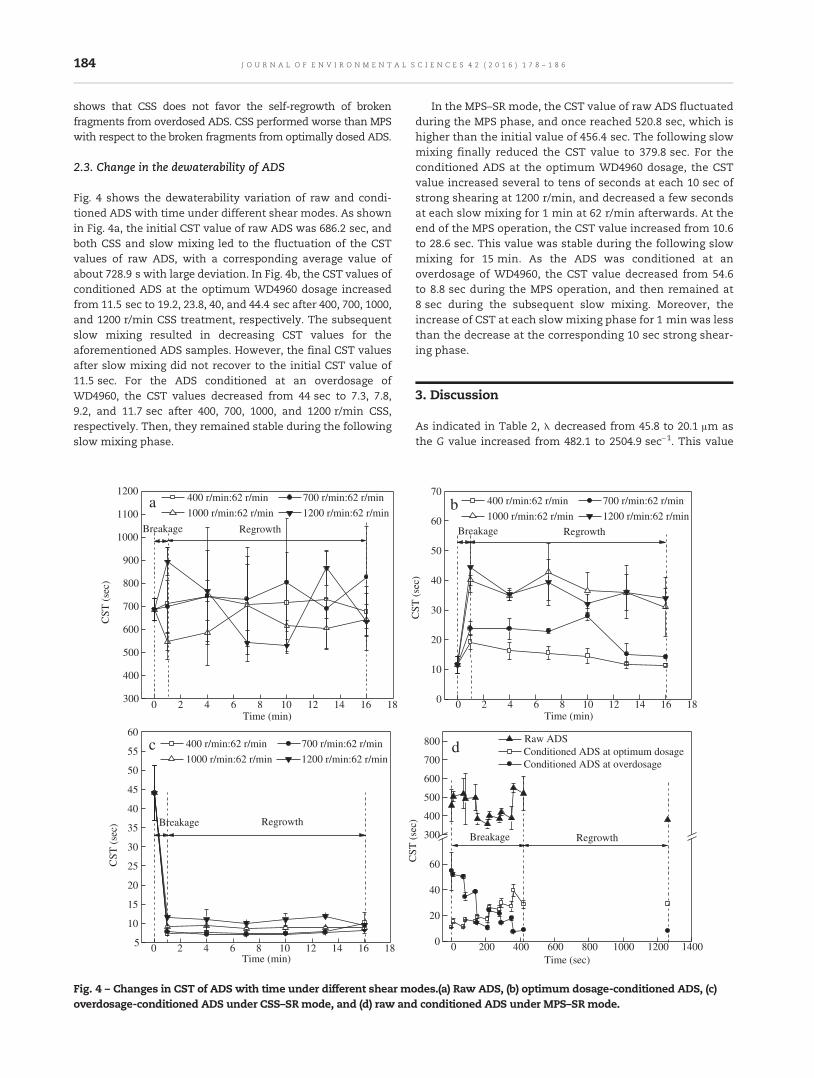
184 J O U R N A L O F E N V I R O N M E N T A L S C I E N C E S 4 2 ( 2 0 1 6 ) 1 7 8 – 1 8 6
shows that CSS does not favor the self-regrowth of brokenfragments from overdosed ADS. CSS performed worse than MPSwith respect to the broken fragments from optimally dosed ADS.
2.3. Change in the dewaterability of ADS
Fig. 4 shows the dewaterability variation of raw and condi-tioned ADS with time under different shear modes. As shownin Fig. 4a, the initial CST value of raw ADS was 686.2 sec, andboth CSS and slow mixing led to the fluctuation of the CSTvalues of raw ADS, with a corresponding average value ofabout 728.9 s with large deviation. In Fig. 4b, the CST values ofconditioned ADS at the optimum WD4960 dosage increasedfrom 11.5 sec to 19.2, 23.8, 40, and 44.4 sec after 400, 700, 1000,and 1200 r/min CSS treatment, respectively. The subsequentslow mixing resulted in decreasing CST values for theaforementioned ADS samples. However, the final CST valuesafter slow mixing did not recover to the initial CST value of11.5 sec. For the ADS conditioned at an overdosage ofWD4960, the CST values decreased from 44 sec to 7.3, 7.8,9.2, and 11.7 sec after 400, 700, 1000, and 1200 r/min CSS,respectively. Then, they remained stable during the followingslow mixing phase.
0 2 4 6 8 10 12 14 16 18300
400
500
600
700
800
900
1000
1100
1200
CST
(se
c)
Time (min)
Breakage Regrowth
a
0 2 4 6 8 10 12 14 16 185
10
15
20
25
30
35
40
45
50
55
60c
RegrowthBreakage
CST
(se
c)
Time (min)
400 r/min:62 r/min 700 r/min:62 r/min
1000 r/min:62 r/min 1200 r/min:62 r/min
400 r/min:62 r/min 700 r/min:62 r/min
1000 r/min:62 r/min 1200 r/min:62 r/min
Fig. 4 – Changes in CST of ADS with time under different shear mooverdosage-conditioned ADS under CSS–SRmode, and (d) raw and
In the MPS–SR mode, the CST value of raw ADS fluctuatedduring the MPS phase, and once reached 520.8 sec, which ishigher than the initial value of 456.4 sec. The following slowmixing finally reduced the CST value to 379.8 sec. For theconditioned ADS at the optimum WD4960 dosage, the CSTvalue increased several to tens of seconds at each 10 sec ofstrong shearing at 1200 r/min, and decreased a few secondsat each slow mixing for 1 min at 62 r/min afterwards. At theend of the MPS operation, the CST value increased from 10.6to 28.6 sec. This value was stable during the following slowmixing for 15 min. As the ADS was conditioned at anoverdosage of WD4960, the CST value decreased from 54.6to 8.8 sec during the MPS operation, and then remained at8 sec during the subsequent slow mixing. Moreover, theincrease of CST at each slowmixing phase for 1 min was lessthan the decrease at the corresponding 10 sec strong shear-ing phase.
3. Discussion
As indicated in Table 2, λ decreased from 45.8 to 20.1 μm asthe G value increased from 482.1 to 2504.9 sec−1. This value
0 2 4 6 8 10 12 14 16 180
10
20
30
40
50
60
70b
RegrowthBreakage
CST
(se
c)
Time (min)
0 200 400 600 800 1000 1200 14000
20
40
60
300
400
500
600
700
800 d
RegrowthBreakage
CST
(se
c)
Time (sec)
Conditioned ADS at optimum dosage Conditioned ADS at overdosage
Raw ADS
400 r/min:62 r/min 700 r/min:62 r/min
1000 r/min:62 r/min 1200 r/min:62 r/min
des.(a) Raw ADS, (b) optimum dosage-conditioned ADS, (c)conditioned ADS under MPS–SRmode.

185J O U R N A L O F E N V I R O N M E N T A L S C I E N C E S 4 2 ( 2 0 1 6 ) 1 7 8 – 1 8 6
was within the size distribution range of raw ADS (d10 to d90 of16.5 μm to 159.9 μm). This finding implied that the slightbreakage of raw ADS aggregates can be ascribed to the surfaceerosion mechanism.
As shown in Fig. 1, both CSS and MPS resulted in decreasingthe zeta potential of conditioned ADS, which implied that thefresh negatively charged surface within the conditioned ADSwas exposed after shearing. Dentel (2001) indicated that rawsludge flocs are fragile and easily disrupted when conditionedsludge aggregates are sheared. Therefore, the aforementionedfresh negatively charged surface could be attributed to thedisruption of raw ADS during CSS or MPS. However, the zetapotential of broken ADS aggregates could not approach thevalue of raw ADS owing to the charge neutralization effect ofthe WD4960-conditioned surface. In addition, this effect wasmore obvious in overdosed ADS aggregates after breakage thanfor the optimally dosed ones. In addition, during theMPS phase,the freshnegatively charged surface on the overdosedADS after10 sec of strong shear could be partially neutralized bytheWD4960-conditioned surface during the subsequentmixingfor 1 minat62 r/min.Also, inmost cases, 15 minmixingat 62 r/minled to stable zeta potential values for the conditioned ADSduring the self-regrowth phase.
In the current study, the size distributions of the optimallydosed and overdosed ADS aggregates ranged from 163.2 μm to>1.2 mm and 564.6 μm to >1.2 mm in terms of d10 to d90,respectively. According to the proposals of Thomas et al.(1999) and Yuan and Farnood (2010), the breakage of condi-tioned ADS aggregates can be attributed to both surfaceerosion and large-scale fragmentation.
Based on the curves in Fig. 2, it can be seen that the d50values of the conditioned ADS after CSS or MPS decreased tono less than 200 μm, which was more than three times largerthan that of the raw ADS. This finding implied that energydissipation of the Kolmogorovmicroscale eddies during eitherCSS or MPS was insufficient to disrupt the fragments ofconditioned ADS further. Moreover, the subsequent 15 minmixing at 62 r/min did not recover the initial value ofconditioned ADS. As shown in Fig. 3, in most cases, both thebroken and the regrown ADS aggregates during CSS–SR orMPS–SR were more compact than the initial conditioned ones.
The findings in Table 3 indicate that the conditioned ADSdisplayed irreversible floc breakage, except for G = 482.1 sec−1.This result was inconsistent with the observation of Yukselenand Gregory (2004b). For clay particles flocculated with acationic polyelectrolyte (Yukselen and Gregory, 2004b), pri-mary particles are bound by electrostatic-type, van derWaals-type, and DLVO-type forces (Yuan and Farnood, 2010).However, EPS entanglement is crucial in the cohesion forceswithin AS and ADS flocs (Mikkelsen and Nielsen, 2001) oranaerobic granules (Wu et al., 2009, 2012). Moreover, Wu et al.(2009) observed that a typical shear rate of 8.3 sec−1 couldstimulate extracellular protein secretion to enhance nucle-ation, whereas Wu et al. (2012) reported that high shear rateand short interval between two contiguous shear conditionsinhibited the extracellular polymer production and bioactivityin upflow anaerobic reactors fed with glucose solution, thendisrupted the anaerobic granules. In this study, the ADS wasused to conduct breakage and self-regrowth experimentswithout a feeding nutrient matrix. The EPS exposed by the
breakage of ADS took on a negative charge and did notpromptly flocculate the fragments under the bridging mech-anism during the 15-min slow mixing period. When ADS wasbroken, fresh surface was exposed with negative charge. Theoptimally dosed or overdosed WD4960 played charge neutral-ization and bridging roles in flocculation of ADS flocs withhigh solid content. No residual WD4960 remained to neutral-ize the negative charge of the fresh surface and performbridge flocculation further; this charge can be neutralizedslightly by the conditioned surface of ADS. Therefore,reflocculation and corresponding self-growth did not occuramong the broken fragments.
For the conditioned ADS at the optimum dosage, CSS orMPS treatment deteriorated dewaterability, and the subse-quent 15 min mixing at 62 r/min did not recover the initialCST before breakage. However, the dewaterability of theoverdosage-conditioned ADS improved after CSS or MPS, andthen remained stable during the following slowmixing phase.
4. Conclusions
Raw ADS was insensitive to CSS–SR or MPS–SR treatment; d50decreased less than 10 μm after breakage. For the conditionedADS, both MPS and CSS generally yielded small and relativelycompact fragments with exposed negatively charged freshsurfaces, and the MPS-treated ADS had larger and morecompact fragments with lower CST than the CSS-treatedADS. During the subsequent slow mixing, the broken ADSaggregates were irreversibly changed in terms of structureand dewaterability. The breakage of overdosed ADS decreasedCST, which suggested that overdosage conditioning may coun-teract the shear experienced by the conditioned ADS. In the ADSdewatering, the optimum cationic polyacrylamide dosage forconditioning determined by Jar test was an under-dose inpractice due to the additional shearing. It is better to employan over-dose based on Jar test values for practical conditioning toweaken the adverse effects of additional shearing.
Acknowledgments
This work was supported by the Fundamental Research Fundsfor the Central Universities, China (No. YX2013-20), the NationalNatural Science Foundation of China (Nos. 51478041, 51078035,and 21177010), the Technology Foundation for Selected OverseasChinese Scholar, Ministry of Personnel of China, and the MajorProjects on Control and Rectification of Water Body Pollution(Nos. 2012ZX07105-002-03 and 2013ZX07202-010).
R E F E R E N C E S
Abu-Orf, M.M., Dentel, S.K., 1997. Effect of mixing on therheological characteristics of conditioned sludge: full-scalestudies. Water Sci. Technol. 36 (11), 51–60.
APHA (American Public Health Association), 2005. Standard Methodsfor the Examination of Water andWastewater. 21st ed. AmericanPublic Health Association, AmericanWater Works AssociationandWater Environment Federation, Washington, DC, USA.
186 J O U R N A L O F E N V I R O N M E N T A L S C I E N C E S 4 2 ( 2 0 1 6 ) 1 7 8 – 1 8 6
Biggs, C.A., Lant, P.A., 2000. Activated sludge flocculation: on-linedetermination of floc size and the effect of shear. Water Res. 34(9), 2542–2550.
Dentel, S.K., 2001. Conditioning. In: Spinosa, S., Vesilind, P.A. (Eds.),Sludge into Biosolids Processing, Disposal andUtilization, 1st ed.IWA Publishing, London, pp. 279–314.
Dursun, D., 2007. Gel-like Behavior of Biosolids in Conditioningand Dewatering Processes. University of Delaware.
Francois, R.J., 1987. Strength of aluminium hydroxide flocs. WaterRes. 21 (9), 1023–1030.
Hermawan, M., Bushell, G.C., Craig, V.S.J., Teoh, W.Y., Amal, R.,2004. Floc strength characterization technique: an insight intosilica aggregation. Langmuir 20 (15), 6450–6457.
Jarvis, P., Jefferson, B., Parsons, S.A., 2005a. Breakage, re-growth,and fractal nature of natural organic matter flocs. Environ. Sci.Technol. 39 (7), 2307–2314.
Jarvis, P., Jefferson, B., Gregory, J., Parsons, S.A., 2005b. A review offloc strength and breakage. Water Res. 39 (14), 3121–3137.
Li, T., Zhu, Z., Wang, D.S., Yao, C.H., Tang, H.X., 2007. The strengthand fractal dimension characteristics of alum–kaolin flocs. Int.J. Miner. Process. 82 (1), 23–29.
Mikkelsen, L.H., Nielsen, P.H., 2001. Quantification of the bondenergy of bacteria attached to activated sludge floc surfaces.Water Sci. Technol. 43 (6), 67–75.
Novak, J.T., 1990. The effect of mixing on the performance ofsludge conditioning chemicals. Water Supply 8, 53–60.
Novak, J.T., Bandak, N., 1989. Chemical conditioning and theresistance of sludges to shear. J. Water Pollut. Control Fed. 61(13), 327–332.
Novak, J.T., Predenville, J.F., Sherrard, J.H., 1988. Mixing intensityand polymer performance in sludge dewatering. J. Environ.Eng. 114 (1), 190–198.
Örmeci, B., Ahmad, A., 2009. Measurement of additional shearduring sludge conditioning and dewatering. Water Res. 43 (13),3249–3260.
Spicer, P.T., Pratsinis, S.E., Raper, J., Amal, R., Bushell, G., Meesters,G., 1998. Effect of shear schedule on particle size, density, andstructure during flocculation in stirred tanks. Powder Technol.97 (1), 26–34.
Thomas, D.N., Judd, S.J., Fawcett, N., 1999. Flocculation modeling:a review. Water Res. 33 (7), 1579–1592.
Wang, Y.L., Dentel, S.K., 2011. The effect of polymer doses andextended mixing intensity on the geometric and rheologicalcharacteristics of conditioned anaerobic digested sludge (ADS).Chem. Eng. J. 166 (3), 850–858.
Wang, Y., Gao, B., Xu, X., Xu,W., Xu, G., 2009. Characterization of flocsize, strength and structure in various aluminum coagulantstreatment. J. Colloid Interface Sci. 332 (2), 354–359.
Wei, J.C., Gao, B.Y., Yue, Q.Y., Wang, Y., 2010. Strength andregrowth properties of polyferric–polymer dual-coagulantflocs in surface water treatment. J. Hazard. Mater. 175 (1-3),949–954.
Werle, C.P., Novak, J.T., Knocke, W.R., Sherrard, J.H., 1984. Mixingintensity and polymer sludge conditioning. J. Environ. Eng. 110(5), 919–934.
Wu, J., Zhou, H.M., Li, H.Z., Zhang, P.C., Jiang, J., 2009. Impacts ofhydrodynamic shear force on nucleation of flocculent sludgein anaerobic reactor. Water Res. 43 (12), 3029–3036.
Wu, J., Bi, L., Zhang, J.B., Poncin, S., Cao, Z.P., Li, H.Z., 2012. Effectsof increase modes of shear force on granule disruptioninupflow anaerobic reactors. Water Res. 46 (10), 3189–3196.
Xu, W., Gao, B., Yue, Q., Wang, Y., 2010. Effect of shear force andsolution pH on flocs breakage and re-growth formed by nano-Al13polymer. Water Res. 44 (6), 1893–1899.
Yu,W.Z., Gregory, J., Campos, L., 2010. Breakage, regrowthofAl-humicflocs—effect of additional coagulant dosage. Environ. Sci. Technol.44 (16), 6371–6376.
Yu, W.Z., Gregory, J., Campos, L., Li, G.B., 2011. The role of mixingconditions on floc growth, breakage and re-growth. Chem. Eng.J. 171 (2), 425–430.
Yu, W.Z., Hu, C.Z., Liu, H.J., Qu, J.H., 2012. Effect of dosage strategyon Al-humic flocs growth and re-growth. Colloids Surf. APhysicochem. Eng. Asp. 404, 106–111.
Yuan, Y., Farnood, R.R., 2010. Strength and breakage of activatedsludge flocs. Powder Technol. 199 (2), 111–119.
Yukselen, M.A., Gregory, J., 2002. Breakage and reformation ofalum flocs. Environ. Eng. Sci. 19 (4), 229–236.
Yukselen, M.A., Gregory, J., 2004a. The effect of rapid mixing onthe break-up and re-formation of flocs. J. Chem. Technol.Biotechnol. 79 (7), 782–788.
Yukselen, M.A., Gregory, J., 2004b. The reversibility of flocsbreakage. Int. J. Miner. Process. 73 (2-4), 251–259.

J O U R N A L O F E N V I R O N M E N T A L S C I E N C E S 4 2 ( 2 0 1 6 ) 1 8 7 – 1 9 5
Ava i l ab l e on l i ne a t www.sc i enced i r ec t . com
ScienceDirect
www. jou rna l s . e l sev i e r . com/ j es
Genomic organization and transcriptional modulation inresponse to endocrine disrupting chemicals of threevitellogenin genes in the self-fertilizing fish Kryptolebiasmarmoratus
Bo-Mi Kim1, Min Chul Lee1, Hye-Min Kang1, Jae-Sung Rhee2,⁎, Jae-Seong Lee1,⁎
1. Department of Biological Science, College of Science, Sungkyunkwan University, Suwon 16419, South Korea2. Department of Marine Science, College of Natural Sciences, Incheon National University, Incheon 22012, South Korea
A R T I C L E I N F O
⁎ Corresponding authors. E-mails: jsrhee@inu
http://dx.doi.org/10.1016/j.jes.2015.08.0061001-0742/© 2015 The Research Center for Ec
A B S T R A C T
Article history:Received 1 May 2015Revised 25 June 2015Accepted 6 August 2015Available online 1 October 2015
Vitellogenin (Vtg) is the precursor of egg yolk proteins, and its expression has been used as areliable biomarker for estrogenic contamination in the aquatic environment. To examinethe biomarker potential of the self-fertilizing killifish Kryptolebias marmoratus Vtgs(Km-Vtgs), full genomic DNAs of Km-Vtgs-Aa, Km-Vtgs-Ab, and Km-Vtgs-C were cloned,sequenced, and characterized. Three Vtg genes in K. marmoratus are tandemly placed in a550 kb section of the same chromosome. In silico analysis of promoter regions revealed thatboth the Km-Vtgs-Aa and Km-Vtgs-Ab genes had an estrogen response element (ERE), but theKm-Vtgs-C gene did not. However, all three Km-Vtgs genes had several ERE-half sites in theirpromoter regions. Phylogenetic analysis demonstrated that the three deduced amino acidresidues were highly conserved with conventional Vtgs protein, forming distinctive cladeswithin teleost Vtgs. Liver tissue showed the highest expression of Km-Vtg transcripts in alltested tissues (brain/pituitary, eye, gonad, intestine, skin, and muscle) in response toendocrine disrupting chemical (EDC)-exposed conditions. Km-Vtg transcripts weresignificantly increased in response to 17β-estradiol (E2), tamoxifen (TMX),4-n-nonylphenol (NP), bisphenol A (BPA), and octylphenol (OP) over 24 hr exposure. TheKm-Vtg-A gene was highly expressed compared to the control in response to NP and OP.EDC-induced modulatory patterns of Km-Vtg gene expression were different depending ontissue, gender, and isoforms.© 2015 The Research Center for Eco-Environmental Sciences, Chinese Academy of Sciences.
Published by Elsevier B.V.
Keywords:Kryptolebias marmoratusVitellogeninEndocrine disrupting chemical
Introduction
In oviparous oogenesis, incorporation of yolk materials (e.g.,vitellogenin) into oocytes and mobilization of these sub-stances during embryogenesis are crucial processes for oocytedevelopment and successful reproduction (Arukwe andGoksøyr, 2003). Vitellogenin (Vtg), the precursor of egg yolk
.ac.kr (Jae-Sung Rhee), jsl
o-Environmental Science
protein, is synthesized by endogenous estrogen regulation inthe hepatocytes of oviparous vertebrates (Mommsen andWalsh, 1988). Vtg synthesis is mainly controlled by estrogen,but it can also be regulated by other hormones (Lubzens et al.,2010). In teleosts, the liver tissue may not be the only sourcefor circulating plasma Vtgs, as extra-hepatic expression of Vtggenes has been detected in several tissues (Islinger et al., 2003;
[email protected] (Jae-Seong Lee).
s, Chinese Academy of Sciences. Published by Elsevier B.V.

188 J O U R N A L O F E N V I R O N M E N T A L S C I E N C E S 4 2 ( 2 0 1 6 ) 1 8 7 – 1 9 5
Wang et al., 2005, 2010; Ma et al., 2009; Tingaud-Sequeira et al.,2012; Zhong et al., 2014). Vtg is secreted into the bloodstreamand incorporated into the growing oocytes to serve as anutritional source for developing embryos and larvae(Lubzens et al., 2010). Previous complementary deoxyribonu-cleic acid (cDNA) cloning and phylogenetic analyses revealedthat teleost Vtgs have undergone lineage-specific geneduplication resulting in multiple types of Vtg paralogousgenes (Finn and Kristofferson, 2007).
Induction of transcription and/or translation of the Vtggene is widely used as a strong biomarker for endocrinedisrupting chemicals (EDCs) (Sumpter and Jobling, 1995; Marinand Matozzo, 2004). Of the diverse xenoestrogens,nonylphenol (NP), octylphenol (OP), and bisphenol A (BPA)are characterized as strong estrogen agonists with estrogenicmimicking actions in binding to the estrogen receptors (ERs),even though these compounds differ slightly structurallyfrom endogenous estrogens (Soto et al., 1991; Krishnan et al.,1993; Arnold et al., 1996; Laws et al., 2000). As Vtg synthesis isunder E2 control, efforts to determine the potential effect ofEDCs have been expanded to monitor for modulatingvitellogenesis.
The self-fertilizing mangrove killifish Kryptolebiasmarmoratus (formerly, known as Rivulus marmoratus) is auseful oviparous teleost for diverse experimental studies, asit is relatively small in size (3–5 cm in adult), has a shortgeneration time (3–4 months), and is easily maintained underlaboratory conditions (Lee et al., 2008). Their unique repro-ductive system offers fish biologists the opportunity to studysex determination and differentiation (Soto et al., 1992; Coleand Noakes, 1997). As an androdioecious species, purefemales do not exist in this species and greater than 60% ofthe hermaphrodites transform into secondary males byovarian atresia in 3 to 4 years after hatching (Harrington,1967). The hermaphrodites have a marbled brownish colorpattern with a caudal peduncle ocellus, while males produceonly sperm and have an orange-pink body color with humeralmottling splotch with a caudal peduncle ocellus that isvariably faint or absent (Lee et al., 2008). Environmentalfactors such as low temperature (18–20°C) and daily lightcontrol the hermaphrodite to secondary male sex ratio(Harrington, 1967). Primary male can be induced by temper-ature alteration at the final stages of embryonic developmentin a laboratory, but artificially induced primary males showedhigh mortality and abnormality (Harrington, 1967). The gonad(ovotestis) of K. marmoratus is composed of ovary-like oogenicand spermatogenic tissues that are not distinctly separated bymembrane (Sakakura et al., 2006). Although diverse ap-proaches have been conducted to understand the underlyingendocrine regulatory metabolism of K. marmoratus (Kanamoriet al., 2006), mechanism of sex determination and differenti-ation mostly remains unknown.
In this study, three Km-Vtg genes were identified andcharacterized with cloning, sequencing, and phylogenetic anal-ysis. Even though one Vtg gene (analyzed as Vtg-Aa in this study)was cloned in our previous study (Kim et al., 2004), to date thecharacterization and gene expression profiles of K. marmoratusVtgs (Km-Vtgs) have not been studied in response to EDCs. Toevaluate their transcriptional sensitivities in response to EDCexposure, transcriptional expression levels were analyzed in
different tissues in EDC-exposed hermaphrodite and male K.marmoratus. Our results facilitate a better understanding of themolecularmode of action and the effects of estrogenic chemicalson vitellogenesis of K. marmoratus.
1. Material and methods
Detailed description on the fish culture condition, in silicoanalysis, and methods for molecular and biochemical tech-niques were incorporated in the supplemental file as de-scribed in our previous studies (Rhee et al., 2011).
1.1. Cloning of three forms of vitellogenin cDNAs
For cloning of partial vitellogenin (Vtg) cDNA fragments, weperformed ClustalW analysis with multiple alignments in-cluding full-length Vtg cDNAs across other fish species anddesigned degenerate oligonucleotides from highly conservedregions. To clone partial cDNA sequence for each Vtg gene,hermaphrodite was sacrificed in ice and its liver tissue wasused to synthesize cDNA in accordance with the guidelines ofthe Animal Welfare Ethical Committee of SungkyunkwanUniversity. Due to their long nucleotide lengths, multiple setsof degenerate primer were used for cloning each Vtg cDNA(Suppl. Fig. S1A). These primers were used to amplify thecorresponding cDNAs from hermaphrodite liver cDNA. Re-verse transcription-polymerase chain reaction (RT-PCR) wascarried out using 2 μM of each primer (Table S1) under thefollowing conditions: 95°C/4 min; 40 cycles of 98°C/25 sec, 55°C/40 sec, 72°C/60 sec; and 72°C/10 min. Same annealingtemperature was used for all primer pairs. The amplifiedPCR products were isolated from 1% agarose gels, cloned intopCR2.1 TA vectors (Invitrogen, Carlsbad, CA, USA), andsequenced using an ABI 3700 DNA analyzer (Bionics Co.,Seoul, South Korea).
1.2. Tissue-preferential mRNA (messenger ribonucleic acid)expression
The expression pattern of Km-Vtg mRNAs was studied inseven different tissues (brain/pituitary, eye, gonad, intestine,liver, muscle, and skin) from hermaphrodites and secondarymales using real-time RT-PCR with primers (Table S1). Thirtyhermaphrodites or secondary males were separated intothree groups. Each group was comprised of 10 fish, and threetechnical replicates of real-time RT-PCR experiments wereperformed for each pooled tissue.
1.3. Endocrine disrupting chemical (EDC) exposure
To study the effect of EDC exposure on Km-Vtg mRNAexpressions, adult hermaphrodites and secondary maleswere exposed to EDCs. Both hermaphrodites and secondarymales (length ≈ 3.5 cm) were exposed in separate tanks in anaqueous static renewal culture system. The dimethyl sulfox-ide (DMSO) concentration in control and treated groups wasmaintained at a concentration of less than 0.01%. Thirtyhermaphrodites or secondary males were separated intothree groups as biological triplicate. Ten fish in each

189J O U R N A L O F E N V I R O N M E N T A L S C I E N C E S 4 2 ( 2 0 1 6 ) 1 8 7 – 1 9 5
treatment group were exposed to 17β-estradiol (E2, 100 ng/Lfor 96 hr), a known natural estrogen, and tamoxifen (10 μg/L),a nonsteroidal estrogen antagonist, for 96 hr. All tissues usedin this study were pooled from 10 fish for analyzing transcriptprofile. E2 and tamoxifen concentrations were chosen fromprevious studies in K. marmoratus and other fish (Lerner et al.,2007; Rhee et al., 2009, 2011; van der Ven et al., 2007). Thewater of treated and control groups was replaced with freshlyprepared water every 24 hr. After exposure for 96 hr, fish weredissected, and the different organs were pooled and used fortotal RNA preparation.
In a time-series experiment, the transcriptional expressionof three Km-Vtg genes was measured in the liver of hermaph-roditic fish. As we described the biomarker potential of Vtggenes via their rapid induction in a short time period, wedecided to analyze the mRNA expressions of Km-Vtg gene for24 hr. Test of Vtg inducibility in the secondary males wasexcluded as the number of secondary male was not enough tovalidate statistics. In general, ovary atresia would take a longtime, and to confirm a pink transitioning secondary male, thefish would have to be sacrificed for gonadal histology. Thirtyhermaphroditic fish were separated into three groups asbiological triplicate. Each group was comprised of 10 fish.They were placed in a glass tank and exposed for 24 hr to eachEDC: linear 4-n-nonylphenol (NP, 300 μg/L), 4-tert-octylphenol(OP, 300 μg/L), and bisphenol A (BPA, 600 μg/L). The concen-trations of EDCs used for exposure are based on our previousgene expression studies in K. marmoratus (Rhee et al., 2009,2011) and that of Tanaka and Grizzle (2002). After exposure for24 hr, fish were dissected, and the liver tissues were pooledand used for total RNA preparation.
Km-VtgAa
Km-VtgAb
Km-VtgC
a
b
Vtg-C
540 Kb
K. marmoratus
Vtg-C
650 Kb
O. latipes
ERE ERE-half
Fig. 1 – (a) Schematic diagram of the genomic structure of K. marmto scale. Black line represents introns and is shown at scale. Eachorganization and putative estrogen responsive elements (EREs) aJapanese medaka. Putative ERE and ERE-half sites are marked w
1.4. Statistical analyses
The SPSS ver. 17.0 (SPSS Inc., Chicago, IL, USA) softwarepackage was used for statistical analyses. Data are expressedas means ± S.D. (standard deviation). Significant differencesbetween control and exposed groups were analyzed usingone-way or multiple-comparison analyses of variance(ANOVAs) followed by Tukey's tests. Differences withP < 0.05 were considered significant.
2. Results
2.1. Km-Vtg genes
Km-Vtg cDNA information was submitted to GenBankwith theaccession nos. AAQ16635 (Km-Vtg-Aa), KJ917549 (Km-Vtg-Ab),and AGA82747 (Km-Vtg-C), respectively. In our previousresearch, we reported solely on one vitellogenin (Km-Vit)(AY279214) gene (Kim et al., 2004), but in this study, weconfirmed the placement of this Km-Vit gene with two Km-Vtggenes by phylogenetic analysis. The Km-Vit sequence wasannotated as Km-Vtg-Aa. Km-Vtg genomic clones are located ina single scaffold (#Km-0026) (Fig. 1a).
The complete cDNA sequence of Km-Vtg-Aa is 5229 bp inlength, including a 59 bp 5′-untranslated region (UTR), a5133 bp open reading frame (ORF), and an 88 bp 3′-UTR witha poly (A) tail (Fig. S2A). The promoter region contains oneputative estrogen responsive element (ERE) and four putativeERE-half sites (Fig. 1b). The ORF encodes a polypeptide of 1711amino acids. The predicted molecular weight and theoretical
1 kb
8513 bp
8500 bp
9455 bp
VtgAb VtgAa
84 Kb
Vtg6 Vtg1
2 kb
oratus vitellogenin genes. Box represents exon and is drawnlength is indicated in the number of nucleotides, (b) genomicsnalyzed in each vitellogenin gene of K. marmoratus andith red and blue inverted triangles, respectively.

Eye Gonad Intestine Liver Muscle Skin
Rel
ativ
e Ph
osvi
tinle
ss m
RN
A e
xpre
ssio
n
0.000
0.003
0.006
0.009
0.012
Hermaphrodite Secondary male
Eye Gonad Intestine Liver Muscle Skin
Rel
ativ
e K
m-V
tgA
b m
RN
A e
xpre
ssio
n
0.000
0.002
0.004
0.006
0.008
0.010
0.012
Eye Gonad Intestine Liver Muscle Skin
Rel
ativ
e K
m-V
tgA
a m
RN
A e
xpre
ssio
n
0.000
0.002
0.004
0.006
0.008
0.010
0.012
Vitellogenin Aa
Vitellogenin Ab
Vitellogenin C
***
**
*
*
***
*
Brain/Pit
Brain/Pit
Brain/Pit
Fig. 2 – Tissue-preferential mRNA expression of K.marmoratus Vtg genes in the hermaphroditic and secondarymale fish. The K. marmoratus 18S rRNA gene was used as areference gene to normalize the expression. Each value is theaverage of three technical replicate samples, and data areshown as means ± S.D. Significant differences of the meansof mRNA expression between hermaphrodites and second-ary males were analyzed using the paired Student's t-test.Asterisks (* and ***) indicate significant change (P < 0.05 andP < 0.001, respectively). mRNA: messenger ribonucleic acid;rRNA: ribosomal ribonucleic acid; S.D.: standard deviation.
190 J O U R N A L O F E N V I R O N M E N T A L S C I E N C E S 4 2 ( 2 0 1 6 ) 1 8 7 – 1 9 5
pI of Km-Vtg-Aa protein were calculated to be 189 kDa and9.24, respectively.
The Km-Vtg-Ab gene is 5201 bp in length including a5100 bp ORF (Fig. S2B). One putative ERE and two putativeERE-half sites were observed in the promoter region of theKm-Vtg-Ab gene (Fig. 1b). The ORF encodes a polypeptide of1700 amino acids with a pI value of 8.9 and amolecular weightof 188 kDa. The full-length Km-Vtg-C contained a 3771 bpcoding region for 1257 amino acid residues with a molecularweight of 142 kDa and pI of 5.72 (Fig. S2C). Three putativeERE-half sites were identified in the promoter region of theKm-Vtg-C gene (Fig. 1b). The similarity of the Km-Vtg-C proteinto both Km-Vtg-Aa and Km-Vtg-Ab was high in the N-terminibut low at the C-termini, as the Km-Vtg-C protein lacks thepolyserine phosvitin region, even though it shared the highlyconserved lipovitellin I and II regions (Fig. S3; lipovitellindomains marked with blue vertical bars) with the two Vtgsequences (Km-Vtg-Aa and Km-Vtg-Ab) (Fig. S3; phosvitinregion marked with a red bar). In addition, phylogeneticanalysis showed that Km-Vtg proteins were separated intothree groups, Vitellogenin Aa, Ab, and C, which formdistinctive clades in fishes (Fig. S4).
2.2. Tissue-preferential mRNA expression
All three Km-Vtg transcripts were abundantly expressed in theliver tissues of both hermaphrodite and secondary males, aswell as in the gonads and intestines (Fig. 2), but the expressionpatterns were different for each gene. Generally, the her-maphroditic adult fish expressed all Vtg genes more than thesecondary males (ovary atresia stage). The expression pat-terns of Km-Vtg-Aa and Km-Vtg-Ab were similar, and theirpatterns were distinctive compared to those of Km-Vtg-C gene.In the case of Km-Vtg-Aa and Km-Vtg-Ab, extrahepatic mRNAexpressions were observed in the brain/pituitary, gonad, andintestine, while the Km-Vtg-C gene was expressed dominantlyin liver tissues of both sexes, but low expression levels alsodetected in the gonad and intestine (Fig. 2).
2.3. Induced transcriptional modulation of Km-Vtg genes indifferent tissues
E2-exposed fish showed significant upregulation of all Km-Vtgtranscripts in the liver tissues of both hermaphrodites andsecondary males (Fig. 3). The Km-Vtg-Ab transcript wasslightly increased in the gonad tissue from hermaphrodites(Fig. 3) compared with secondary males. In E2-exposedhermaphrodites and secondary males, Km-Vtg-C gene expres-sion in gonad (P < 0.05) and intestine (P < 0.05) tissues wassignificantly elevated compared to the control group (Fig. 3).Tamoxifen (10 μg/L), an E2 antagonist, also upregulatedtranscriptional levels of three Vtgs genes in liver tissues ofboth K. marmoratus genders (P < 0.05).
2.4. EDC-induced transcriptional modulation of Km-Vtg genesin the liver tissues of hermaphrodites
All tested EDCs caused upregulation of the three Km-Vtgtranscripts in liver tissues from hermaphrodites after expo-sure for 24 hr (Fig. 4). Interestingly, the expression patterns of
the Km-Vtg genes differed in response to the mode of action ofthe exposed chemicals. NP and OP showed a greater inducingeffect on Km-Vtg transcripts than did BPA. Additionally, eachVtg gene showed a different pattern of expression over time.For example, the liver tissue induction of Km-Vtg-Aa 12 hrafter exposure in response to NP was similarly significant tothat observed after a 24 hr exposure to OP and BPA (Fig. 4). The

Brain/Pit Gonad Intestine Liver Brain / Pit Gonad Intestine Liver
Rel
ativ
e K
m-V
tgC
mR
NA
exp
ress
ion
0.00
0.01
0.02
0.03
0.04
Brain/Pit Gonad Intestine Liver Brain / Pit Gonad Intestine Liver
Rel
ativ
e K
m-V
tg-A
a m
RN
A e
xpre
ssio
n
0.00
0.02
0.04
0.06
0.08
0.10DMSO E2-treated TMX-treated
Brain/Pit Gonad Intestine Liver Brain / Pit Gonad Intestine LiverRel
ativ
e K
m-V
tgA
b m
RN
A e
xpre
ssio
n
0.000
0.005
0.010
0.015
0.020
0.025
0.030
0.035
Secondary maleHermaphrodite
Vitellogenin Aa
Vitellogenin Ab
Vitellogenin C
***
****
*
*
**
**
*
* *
*
**
*
*
*
Fig. 3 – Effect of 17β-estradiol (E2, 100 ng/L for 96 hr) andtamoxifen (TMX, 10 μg/L) on K. marmoratus Vtg mRNAexpressions in hermaphrodites and secondary males. Con-trol fish were treated with solvent DMSO. The expression ofeach Km-Vtg mRNA was analyzed using real-time RT-PCR.The K. marmoratus 18S rRNA gene was used as a referencegene to normalize expression. Each value is an average ofthree technical replicate samples, and data are shown asmeans ± S.D. The symbols (*, **, and ***) indicate significance(P < 0.05, P < 0.01, and P < 0.001, respectively) comparedwith control values. mRNA: messenger ribonucleic acid;DMSO: dimethyl sulfoxide; Km-Vtg: Kryptolebias marmoratusVtgs; RT-PCR: reverse transcription-polymerase chain reac-tion; rRNA: ribosomal ribonucleic acid; S.D.: standarddeviation.
Control 3 6 12 24
Rel
ativ
e K
m-V
tgC
mR
NA
exp
ress
ion
0
2
4
6
8
10
Control 3 6 12 24
Rel
ativ
e K
m-V
tgA
b m
RN
A e
xpre
ssio
n
0
2
4
6
8
10 Vitellogenin Ab
Vitellogenin C
Control 3 6 12 24
Rel
ativ
e K
m-V
tgA
a m
RN
A e
xpre
ssio
n
0
5
10
15
20
25
NP-treated OP-treated BPA-treated
***
***
*** ***
* *
**
****
**
Vitellogenin Aa
* **
****
**
Exposure time (hr)
Exposure time (hr)
Exposure time (hr)
*
*
*
*
*
*
*
Fig. 4 – Transcriptional expression of K. marmoratus Vtggenes in the livers of hermaphroditic fish after 96 hrexposure to 4-n-nonylphenol (300 μg/L), bisphenol A(600 μg/L), and 4-tert-octylphenol (300 μg/L). The expression
191J O U R N A L O F E N V I R O N M E N T A L S C I E N C E S 4 2 ( 2 0 1 6 ) 1 8 7 – 1 9 5
expression of Km-Vtg transcripts was not significantly affect-ed in response to EDCs up to 3 hr.
of each Km-VtgmRNAwas analyzed using real-time RT-PCR.The K. marmoratus 18S rRNA gene was used as a referencegene to normalize expression. Each value is an average ofthree technical replicate samples, and data are shown asmeans ± S.D. The symbols (*, **, and ***) indicate significance(P < 0.05, P < 0.01, and P < 0.001, respectively) comparedwith control values. RT-PCR: reversetranscription-polymerase chain reaction; rRNA: ribosomalribonucleic acid; S.D.: standard deviation.
3. Discussion
Acanthomorpha, or ray-finned fish (i.e., medaka, stickleback,Takifugu, tetraodon), have more than three Vtgs genes, and allof the Vtgs genes are located in a single chromosome in eachspecies (Finn and Kristofferson, 2007; Babin, 2008). VtgAa islocated next to VtgAb and is transcribed in the same direction,while VtgC lacks the phosvitin domain and is found apartfrom both VtgAa and VtgAb; it is also transcribed in the

192 J O U R N A L O F E N V I R O N M E N T A L S C I E N C E S 4 2 ( 2 0 1 6 ) 1 8 7 – 1 9 5
opposite direction (Babin, 2008). Although the main functionof phosvitin domain is still unclear, previous studies sug-gested its potential receptor binding role duringreceptor-mediated endocytosis in vertebrates (Miller et al.,1982; Woods and Roth, 1984; Wang et al., 2000). As shown inother oviparous vertebrates, a well-conserved gene orienta-tion of the Vtg cluster was identified in K. marmoratus as thethree Vtgs genes spanned 550 kb in a single scaffold with theconserved genomic orientation compared to other fishes inthe same class, Acanthomorpha. Phylogenetic analysis sup-ported the similar phylogenetic distance identified inAcanthomorpha in addition to the gene order. Duringvertebrate whole genome duplication (WGD) withlineage-specific gene duplication of teleosts, teleostean Vtgswere divided into three groups: VtgAa, VtgAb, and VtgC. In thephylogenetic tree, Km-Vtg proteins were distinctly clusteredinto Vtg-Aa, Vtg-Ab, and Vtg-C, as has been reported in otherteleosts (Matsubara et al., 2003; Finn and Kristoffersen, 2007;Reading et al., 2009). Of these, the VtgA group of the spinyray-finned teleosts including K. marmoratus was furtherseparated into VtgAa and VtgAb except for salmonoid(Protacanthopterygii) Vtgs, while the duplicated VtgB andVtgD were lost during WGD (Finn and Kristoffersen, 2007).Thus, VtgAsa and VtgAsb observed in salmonoid were notidentified in the K. marmoratus genome. These results areconsistent with teleost Vtg genealogy.
In each Km-Vtgs genes, different numbers of putative EREand/or ERE-half sites were observed. Vtg is a well-knownestrogen-inducible gene that is regulated by ERE in thepromoter region (Gruber et al., 2004). Traditionally, Vtg isregarded to be synthesized in the female liver tissue under thecontrol of estrogen (or E2) via estrogen responsive elements(EREs) that bind to estrogen receptor (ER) and E2-mediatedgenes (Klein-Hitpaß et al., 1986; Burch et al., 1988). To date,ERE-mediated transcriptional regulation of the Vtg genes invertebrates has been reported in several teleosts includingOreochromis aureus (Teo et al., 1998), Cyprinidon variegatus(Denslow et al., 2001), Danio rerio (Wang et al., 2005), andothers. ERE-half sites also could be regulators for the functionof estrogen inducible genes (Tora et al., 1988; Kato et al., 1992).Thus, a different composition of ERE and ERE-half sites in thepromoter regions of three Km-Vtgs can influence the role ofeach Km-Vtg gene in oocyte maturation in response toestrogenic compounds.
In the livers of hermaphroditic K. marmoratus, transcrip-tional levels of all Vtg genes were highly expressed, showingthat the liver is themajor organ for Vtg production. In the caseof Km-VtgAa and -VtgAbmRNAs, both genes were significantlyexpressed in extrahepatic organs including the brain, gonad,and intestine, while Km-VtgC gene expression was notdetected. In general, vtg is expressed in the liver; however,their transcripts can be expressed in extrahepatic tissueswithout any estrogenic compound treatment as shown inseveral teleosts (Islinger et al., 2003; Wang et al., 2005, 2010;Ma et al., 2009; Zhong et al., 2014). Interestingly, three Km-Vtgtranscripts were quite highly expressed in secondary males'livers compared to the other tissues from hermaphroditic fishunder ordinary conditions. In K. marmoratus, the phenotypiccharacteristics of secondary males develop due to atresia ofthe ovary from hermaphrodites, while the liver tissue remains
unchanged phenotypically during hormonal changes, sug-gesting that transcriptional levels of Vtg genes in K.marmoratus are maintained at a relatively high level in thesecondary male liver. In fact, both hermaphrodites andprimary males secreted E2 and 11-ketotestosterone (11-KT),and mean plasma E2 level of hermaphrodite was significantlylower than that of primary male (Minamimoto et al., 2006).Thus, transcriptional regulation of three vtg genes would behighly maintained in the secondary male, as they also secreteestrogen, androgen, and progestin synchronously as shown inhermaphrodites. Investigations of unique tissue-specific ex-pression of Vtg genes with a transcriptional regulation studywould be interesting to better understand the species-specificmode of action of Vtg genes.
In K. marmoratus, significant Vtg mRNA induction inresponse to E2 treatment was observed predominantly in theliver in parallel with strong elevation of choriogenins (Chgs)(Rhee et al., 2009), indicating that the liver plays a major rolein hormone-mediated yolk accumulation in the growingovary; Chgs are precursors of the inner layer of the eggenvelope that are synthesized in hepatocytes under estrogencontrol. Changes in endogenous hormone levels and thetranscriptional modulations of endocrine regulatory genes inresponse to estrogenic compounds were continuously report-ed in K. marmoratus (Kanamori et al., 2006; Minamimoto et al.,2006; Rhee et al., 2011). Therefore, K. marmoratus is verysusceptible for exogenous estrogenic compounds and wouldhave highly sensitive endocrine regulatory system includingvitellogenesis. In teleosts, a similar inducibility in hepatic VtgmRNA with extrahepatic expression and plasma Vtg synthe-sis was extensively shown in response to E2 or17α-ethinylestradiol (EE2) (Bowman et al., 2000; Wang et al.,2000; Takemura and Kim, 2001; Woods and Kumar, 2011;Söffker and Stevens, 2012; Humble et al., 2013, 2014; Zhong etal., 2014). Thus, Vtg gene expression has an interspecificdifference that presumably affects the role of organs and isinvolved in vitellogenesis in response to estrogeniccompounds.
In K. marmoratus, 10 μg/L of TMX (E2 antagonist) caused aslight, but not complete, up-regulation of all three Km-Vtgtranscripts in the livers of both genders compared withE2-exposed K. marmoratus, suggesting that transcriptionalsusceptibility in response to TMX would be different, depend-ing on the TMX concentration used. TMX acts as a directanti-estrogen by forming a relatively stable complex with theestrogen receptor (ER), reducing affinity of subsequent estra-diol binding to receptors (USEPA, 2002). There is still contro-versy surrounding the role of TMX in the formation of fishyolks as TMX has mixed estrogenic/antiestrogenic actions(MacGregor and Jordan, 1998; Sun et al., 2011;Leaños-Castañeda and Van der Kraak, 2007; USEPA, 2002).For example, in bothmale and female zebrafish, Vtg1 and Vtg2mRNAs were induced at low concentrations of TMX (30 μg/L),while their transcription levels were reduced in adose-dependent manner when the fish were exposed to over30 μg/L of TMX (Sun et al., 2010). In Japanese medaka (Oryziaslatipes), Vtgs expression showed a similar pattern to zebrafishmales, while Vtg1 and Vtg2 transcripts were strongly sup-pressed in females in response to TMX in a dose-dependentmanner (Chikae et al., 2004; Sun et al., 2011). Agonistic effect

193J O U R N A L O F E N V I R O N M E N T A L S C I E N C E S 4 2 ( 2 0 1 6 ) 1 8 7 – 1 9 5
of TMX would be dependent on cell type, ERE-promotercontext, and ER types (Watanabe et al., 1997). Taken together,these results suggest that TMX is differentially effective withdifferent compositions of ER/ERE across species in theregulation of Vtg expression.
In K. marmoratus, all xenoestrogen compounds induced thetranscriptional level of three Km-Vtg genes sensitively. Similarexposure conditions of E2 and BPA strongly induced Vtgtranscription with significant increases in mRNA levels ofestrogen receptor (ER) α/β, aromatases, and choriogenins(Rhee et al., 2011). In teleosts, similar elevated patterns werereported, particularly when using male fish to understandeffects of EDCs on Vtg production in teleosts with obvioussexual dimorphism (Hemmer et al., 2002; Pait and Nelson,2003; Miracle et al., 2006; Lerner et al., 2007). OP was a strongerinducer of vitellogenin than either NP or BPA in goldfish, andits Vtg inducibility was confirmed in the male fish offreshwater cichlid (Li et al., 2012; Genovese et al., 2014). Abisphenol analogue BPAF exposure caused significant upreg-ulation of the Vtg transcription in the liver of male zebrafish(Yang et al., 2015). Thus, induction of Vtg gene expressionconfirms the potential for xenoestrogens compounds to exertendocrine-disrupting effects in K. marmoratus. Regardingputative induction pathway with differential sensitivities ofthree Km-Vtg genes, their upregulation would be triggered bydirect induction via ER activation with ERE binding inresponse to EDC exposure. In silico analysis revealed a putativeERE in the promoter region of both Km-VtgAa and VtgAb,suggesting that EDCs exert their endocrine-disrupting effectsvia ERE-mediated transcriptional regulation of Vtg gene. Eventhough Km-VtgC has no putative ERE site in the promoterregion, its mRNA levels also upregulated in response to eachof the three EDCs. Thus, these results in K. marmoratus wouldshed light on the regulatory role of ERE and ERE-half sites forthe induction of Vtg genes as shown in several teleosts (Toraet al., 1988; Kato et al., 1992; Teo et al., 1998; Denslow et al.,2001; Wang et al., 2005). The underlying inductionmechanismor subsequent physiological outcomes should be clarified infurther study.
In conclusion, K. marmoratus is a functional hermaphrodit-ic fish with both ovaries and testes in its body. Under normalconditions, K. marmoratus expresses sex specific hormonessuch as estrogen and testosterone (Minamimoto et al., 2006).Thus, to maintain hermaphroditic function, balanced hor-monal levels must be maintained. Although the informationon the effect of transcriptional changes in Km-Vtg genes inresponse to EDC exposure is unclear as yet, it is likely that thesensitivity of Vtg genes to EDCsmay serve as an early detectorfor EDC contamination in the aquatic environment. Inaddition, our work provides a better understanding of themechanistic view of the differentially-modulated transcrip-tional expression of three Km-Vtg genes in response to EDCexposure in K. marmoratus.
Acknowledgments
We thank Prof. Hans-U. Dahms for his comments on themanuscript and also thank two anonymous reviewers fortheir valuable comments. This work was supported by a grant
(S-2014-0879-000) of Samsung Research Fund, SungkyunkwanUniversity (2014) funded to Jae-Seong Lee.
Appendix A. Supplementary data
Supplementary data to this article can be found online athttp://dx.doi.org/10.1016/j.jes.2015.08.006.
R E F E R E N C E S
Arnold, S.F., Robinson, M.K., Notides, A.C., Guillette Jr., L.J.,McLachlan, J.A., 1996. A yeast estrogen screen for examiningthe relative exposure of cells to natural and xenoestrogens.Environ. Health Perspect. 104 (5), 544–548.
Arukwe, A., Goksøyr, A., 2003. Eggshell and egg yolk proteins infish: hepatic proteins for the next generation: oogenetic,population, and evolutionary implications of endocrine dis-ruption. Comp. Hepatol. 2, 4.
Babin, P.J., 2008. Conservation of a vitellogenin gene cluster inoviparous vertebrates and identification of its traces in theplatypus genome. Gene 413 (1-2), 76–82.
Bowman, C.J., Kroll, K.J., Hemmer, M.J., Folmar, L.C., Denslow,N.D., 2000. Estrogen-induced vitellogeninmRNA and protein insheepshead minnow (Cyprinodon variegatus). Gen. Comp.Endocrinol. 120 (3), 300–313.
Burch, J.B.E., Evans, M.I., Friedman, T.M., O'Malley, P.J., 1988. Twofunctional estrogen response elements are located upstreamof the major chicken vitellogenin gene. Mol. Cell. Biol. 8 (3),1123–1131.
Chikae, M., Ikeda, R., Hasan, Q., Morita, Y., Tamiya, E., 2004. Effectsof tamoxifen, 17α-ethynylestradiol, flutamide, andmethyltestosterone on plasma vitellogenin levels of male andfemale Japanese medaka (Oryzias latipes). Environ. Toxicol.Pharmacol. 17 (1), 29–33.
Cole, K.S., Noakes, D.L.G., 1997. Gonadal development and sexualallocation in mangrove killifish, Rivulus marmoratus (Pisces:Atherinomorpha). Copeia 1997 (3), 596–600.
Denslow, N.D., Bowman, C.J., Ferquson, R.J., Lee, H.S., Hemmer,M.J., Folmar, L.C., 2001. Induction of gene expression insheepshead minnows (Cyprinodon variegatus) treated with 17β-estradiol, diethylstilbestrol, or ethinylestradiol: the use ofmRNA fingerprints as an indicator of gene regulation. Gen.Comp. Endocrinol. 121 (3), 250–260.
Finn, R.N., Kristoffersen, B.A., 2007. Vertebrate vitellogenin geneduplication in relation to the “3R hypothesis”: correlation tothe pelagic egg and the oceanic radiation of teleosts. PLoS One2 (1), e169.
Genovese, G., Regueira, M., Da Cuña, R.H., Ferreira, M.F., Varela,M.L., Lo Nostro, F.L., 2014. Nonmonotonic response of vitello-genin and estrogen receptor α gene expression afteroctylphenol exposure of Cichlasoma dimerus (Perciformes,Cichlidae). Aquat. Toxicol. 156, 30–40.
Gruber, C.J., Gruber, D.M., Gruber, I.M.L., Wieser, F., Huber, J.C.,2004. Anatomy of the estrogen response element. TrendsEndocrinol. Metab. 15 (2), 73–78.
Harrington Jr., R.W., 1967. Environmentally controlled inductionof primary male gonochorists from eggs of the self-fertilizinghermaphroditic fish Rivulus marmoratus Poey. Biol. Bull. 132 (2),174–199.
Hemmer,M.J., Bowman,C.J., Hemmer, B.L., Friedman, S.D.,Marcovich,D., Kroll, K.J., et al., 2002. Vitellogenin mRNA regulation andplasma clearance in male sheepshead minnows, (Cyprinodonvariegatus) after cessation of exposure to 17β-estradiol and p-nonylphenol. Aquat. Toxicol. 58 (1-2), 99–112.

194 J O U R N A L O F E N V I R O N M E N T A L S C I E N C E S 4 2 ( 2 0 1 6 ) 1 8 7 – 1 9 5
Humble, J.L., Hands, E., Saaristo, M., Lindstrom, K., Lehtonen, K.K.,de Cerio, O.D., et al., 2013. Characterization of genes tran-scriptionally upregulated in the liver of sand goby(Pomatoschistus minutus) by 17α-ethinyloestradiol: identifica-tion of distinct vitellogenin and zona radiata protein tran-scripts. Chemosphere 90 (11), 2722–2729.
Humble, J.L., Saaristo, M., Lindström, K., Lehtonen, K.K., Craft, J.A.,2014. Effects of 17α-ethinyl estradiol exposure on estrogenreceptors α and β and vitellogenins A, B and C mRNAexpression in the liver of sand goby (Pomatoschistus minutus).Mar. Environ. Res. 96, 12–18.
Islinger, M., Willimski, D., Völkl, A., Braunbeck, T., 2003. Effects of17a-ethinylestradiol on the expression of three estrogen-responsive genes and cellular ultrastructure of liver and testesin male zebrafish. Aquat. Toxicol. 62 (2), 85–103.
Kanamori, A., Yamamura, A., Koshiba, S., Lee, J.S., Orlando, E.F.,Hori, H., 2006. Methyltestosterone efficiently induces maledevelopment in the self-fertilizing hermaphrodite fish,Kryptolebias marmoratus. Genesis 44 (10), 495–503.
Kato, S., Tora, L., Yamauchi, J., Masushige, S., Bellard, M.,Chambon, P., 1992. A far upstream estrogen response elementof the ovalbumin gene contains several half-palindromic 5′-TGACC-3′ motifs acting synergistically. Cell 68 (4), 731–742.
Kim, I.C., Chang, S.Y., Williams, T.D., Kim, Y.J., Yoon, Y.D., Lee,Y.S., et al., 2004. Genomic cloning and expression of vitello-genin gene from the self-fertilizing fish Rivulus marmoratus(Cyprinodontiformes, Rivulidae). Mar. Environ. Res. 58 (2-5),687–691.
Klein-Hitpaß, L., Schorpp, M., Wagner, U., Ryffel, G.U., 1986. Anestrogen-responsive element derived from the 5′ flankingregion of the Xenopus vitellogenin A2 gene functions intransfected human cells. Cell 46 (7), 1053–1061.
Krishnan, A.V., Stathis, P., Permuth, S.F., Tokes, L., Feldman, D.,1993. Bisphenol-A: an estrogenic substance is released frompolycarbonate flasks during autoclaving. Endocrinology 132(6), 2279–2286.
Laws, S.C., Carey, S.A., Ferrell, J.M., Bodman, G.J., Cooper, R.L.,2000. Estrogenic activity of octylphenol, nonylphenol,bisphenol A and methoxychlor in rats. Toxicol. Sci. 54 (1),154–167.
Leaños-Castañeda, O., Van der Kraak, G., 2007. Functionalcharacterization of estrogen receptor subtypes, ERα and ERβ,mediating vitellogenin production in the liver of rainbow trout.Toxicol. Appl. Pharmacol. 224 (2), 116–125.
Lee, J.S., Raisuddin, S., Schlenk, D., 2008. Kryptolebias marmoratus(Poey, 1880): a potential model species for molecular carcino-genesis and ecotoxicogenomics. J. Fish Biol. 72 (8), 1871–1889.
Lerner, D.T., Björnsson, B.T., McCormick, S.D., 2007. Larvalexposure to 4-nonylphenol and 17β-estradiol affects physio-logical and behavioral development of seawater adaptation inAtlantic salmon smolts. Environ. Sci. Technol. 41 (12),4479–4485.
Li, Z.Y., Zhang, H.L., Gibson, M., Liu, P., 2012. An evaluation of thecombined effects of phenolic endocrine disruptors on vitello-genin induction in goldfish Carassius auratus. Ecotoxicology 21(7), 1919–1927.
Lubzens, E., Young, G., Bobe, J., Cerdà, J., 2010. Oogenesis in teleostfish: how fish eggs are formed. Gen. Comp. Endocrinol. 165 (3),367–389.
Ma, L.W., Li, D.L., Wang, J.W., He, J.Y., Yin, Z., 2009. Effects ofadrenergic agonists on the extrahepatic expression of vitello-genin Ao1 in heart and brain of the Chinese rare minnow(Gobiocypris rarus). Aquat. Toxicol. 91 (1), 19–25.
MacGregor, J.I., Jordan, V.C., 1998. Basic guide to the mecha-nisms of antiestrogen action. Pharmacol. Rev. 50 (2),151–196.
Marin, M.G., Matozzo, V., 2004. Vitellogenin induction as abiomarker of exposure to estrogenic compounds in aquaticenvironments. Mar. Pollut. Bull. 48 (9-10), 835–839.
Matsubara, T., Nagae, M., Ohkubo, N., Andoh, T., Sawaguchi, S.,Hiramatsu, N., et al., 2003. Multiple vitellogenins and theirunique roles in marine teleosts. Fish Physiol. Biochem. 28 (1),295–299.
Miller, M.S., Benore-Parsones, M., White, H.B., 1982. Dephosphor-ylation of chicken riboflavin-binding protein and phosvitindecreases their uptake by oocytes. J. Biol. Chem. 257 (12),6818–6824.
Minamimoto, M., Sakakura, Y., Soyano, K., Akaba, Y., Hagiwara,A., 2006. Plasma sex steroid levels and steroidogenesis in thegonad of the self-fertilizing Fish Rivulus marmoratus. Environ.Biol. Fish 75 (2), 159–166.
Miracle, A., Ankley, G., Lattier, D., 2006. Expression of twovitellogenin genes (Vg1 and Vg3) in fathead minnow(Pimephales promelas) liver in response to exposure to steroidalestrogens and androgens. Ecotoxicol. Environ. Saf. 63 (3),337–342.
Mommsen, T.P., Walsh, P.J., 1988. Vitellogenesis and oocyteassembly. In: Hoar, W.S., Randall, D.J. (Eds.), Fish Physiology:The Physiology of Developing Fish. Academic Press, New York,pp. 347–406.
Pait, A.S., Nelson, J.O., 2003. Vitellogenesis in male Fundulusheteroclitus (killifish) induced by selected estrogenic com-pounds. Aquat. Toxicol. 64 (3), 331–342.
Reading, B.J., Hiramatsu, N., Sawaguchi, S., Matsubara, T., Hara, A.,Lively, M.O., et al., 2009. Conserved and variant molecular andfunctional features of multiple egg yolk precursor proteins(vitellogenins) in white perch (Morone americana) and otherteleosts. Mar. Biotechnol. 11 (2), 169–187.
Rhee, J.S., Kang, H.S., Raisuddin, S., Hwang, D.S., Han, J., Kim, R.O.,et al., 2009. Endocrine disruptors modulate expression ofhepatic choriogenin genes in the hermaphroditic fish,Kryptolebias marmoratus. Comp. Biochem. Physiol. C Toxicol.Pharmacol. 150 (2), 170–178.
Rhee, J.S., Kim, B.M., Lee, C.J., Yoon, Y.D., Lee, Y.M., Lee, J.S., 2011.Bisphenol A modulates expression of sex differentiation genesin the self-fertilizing fish, Kryptolebias marmoratus. Aquat.Toxicol. 104 (3-4), 218–229.
Sakakura, Y., Soyano, K., Noakes, D.L.G., Hagiwara, A., 2006.Gonadal morphology in the self-fertilizing mangrove killifish,Kryptolebias marmoratus. Ichthyol. Res. 53 (4), 427–430.
Söffker, M., Stevens, J.R., 2012. Comparative breeding and behav-ioral responses to ethinylestradiol exposure in wild andlaboratory maintained zebrafish (Danio rerio) populations.Environ. Sci. Technol. 46 (20), 11377–11383.
Soto, A.M., Justicia, H., Wray, J.W., Sonnenschein, C., 1991. p-Nonyl-phenol: an estrogenic xenobiotic released from “modi-fied” polystyrene. Environ. Health Perspect. 92, 167–173.
Soto, C.G., Leatherland, J.F., Noakes, D.L.G., 1992. Gonadal histol-ogy in the self-fertilizing hermaphroditic fish Rivulusmarmoratus (Pisces, Cyprinodontidae). Can. J. Zool. 70 (12),2338–2347.
Sumpter, J.P., Jobling, S., 1995. Vitellogenesis as a biomarker forestrogenic contamination of the aquatic environment. Envi-ron. Health Perspect. 103 (Suppl. 7), 173–178.
Sun, L.W., Wen, L.L., Shao, X.L., Qian, H.F., Jin, Y.X., Liu, W.P., etal., 2010. Screening of chemicals with anti-estrogenicactivity using in vitro and in vivo vitellogenin inductionresponses in zebrafish (Danio rerio). Chemosphere 78 (7),793–799.
Sun, L.W., Shao, X.L., Chi, J., Hu, X.H., Jin, Y.X., Fu, Z.W., 2011.Transcriptional responses in the brain, liver and gonad ofJapanese ricefish (Oryzias latipes) exposed to two anti-estro-gens. Comp. Biochem. Physiol. C Toxicol. Pharmacol. 153 (4),392–401.
Takemura, A., Kim, B.H., 2001. Effects of estradiol-17β treatmenton in vitro and in vivo synthesis of two distinct vitellogenins intilapia. Comp. Biochem. Physiol. A Mol. Integr. Physiol. 129 (2-3), 641–651.

195J O U R N A L O F E N V I R O N M E N T A L S C I E N C E S 4 2 ( 2 0 1 6 ) 1 8 7 – 1 9 5
Tanaka, J.N., Grizzle, J.M., 2002. Effects of nonylphenol on thegonadal differentiation of the hermaphroditic fish, Rivulusmarmoratus. Aquat. Toxicol. 57 (3), 117–125.
Teo, B.Y., Tan, N.S., Lim, E.H., Lam, T.J., Ding, J.L., 1998. A novelpiscine vitellogenin gene: structural and functional analyses ofestrogen-inducible promoter. Mol. Cell. Endocrionol. 146 (1-2),103–120.
Tingaud-Sequeira, A., Knoll-Gellida, A., André, M., Babin, P.J., 2012.Vitellogenin expression in white adipose tissue in femaleteleost fish. Biol. Reprod. 86 (2), 38.
Tora, L., Gaub, M.P., Mader, S., Dierich, A., Bellard, M., Chambon,P., 1988. Cell-specific activity of a GGTCA half-palindromicoestrogen-responsive element in the chicken ovalbumin genepromoter. EMBO J. 7 (12), 3771–3778.
USEPA, 2002. Draft Detailed Review Paper on Fish ScreeningAssays for Endocrine Disruption. Columbus, Ohio.
van der Ven, L.T.M., van den Brandhof, E.J., Vos, J.H., Wester, P.W.,2007. Effects of the estrogen agonist 17β-estradiol and antag-onist tamoxifen in a partial life-cycle assay with zebrafish(Danio rerio). Environ. Toxicol. Chem. 26 (1), 92–99.
Wang, H., Yan, T., Tan, J.T.T., Gong, Z.Y., 2000. A zebrafishvitellogenin gene (vg3) encodes a novel vitellogenin without aphosvitin domain and may represent a primitive vertebratevitellogenin gene. Gene 256 (1-2), 303–310.
Wang, H., Tan, J.T.T., Emelyanow, A., Korzh, V., Gong, Z.Y., 2005.Hepatic and extrahepatic expression of vitellogenin genes inthe zebrafish, Danio rerio. Gene 356, 91–100.
Wang, R.L., Gao, Y., Zhang, L.H., Zhang, Y.K., Fang, Z.Q., He, J.G., etal., 2010. Cloning, expression, and induction by 17β-estradiol(E2) of a vitellogenin gene in the white cloud mountainminnow Tanichthys albonubes. Fish Physiol. Biochem. 36 (2),157–164.
Watanabe, T., Inoue, S., Ogawa, S., Ishii, Y., Hiroi, H., Ikeda, K., etal., 1997. Agonistic effect of tamoxifen is dependent on celltype, ERE-promoter context, and estrogen receptor subtype:functional difference between estrogen receptors α and β.Biochem. Biophys. Res. Commun. 236 (1), 140–145.
Woods, M., Kumar, A., 2011. Vitellogenin induction by 17β-estradiol and 17α-ethynylestradiol in male Murrayrainbowfish (Melanotaenia fluviatilis). Environ. Toxicol. Chem.30 (11), 2620–2627.
Woods, J.W., Roth, T.F., 1984. A specific subunit of vitellogeninthat mediates receptor binding. Biochemistry 23 (24),5774–5780.
Yang, X.X., Liu, Y.C., Li, J., Chen, M.J., Peng, D., Liang, Y., et al., 2015.Exposure to Bisphenol AF disrupts sex hormone levels andvitellogenin expression in zebrafish. Environ. Toxicol. http://dx.doi.org/10.1002/tox.22043.
Zhong, L.Q., Yuan, L., Rao, Y., Li, Z.Q., Zhang, X.H., Liao, T., et al.,2014. Distribution of vitellogenin in zebrafish (Danio rerio)tissues for biomarker analysis. Aquat. Toxicol. 149, 1–7.

J O U R N A L O F E N V I R O N M E N T A L S C I E N C E S 4 2 ( 2 0 1 6 ) 1 9 6 – 2 0 1
Ava i l ab l e on l i ne a t www.sc i enced i r ec t . com
ScienceDirect
www. jou rna l s . e l sev i e r . com/ j es
Impact of undissociated volatile fatty acids on acidogenesis in atwo-phase anaerobic system
Keke Xiao, Yan Zhou, Chenghong Guo⁎, Yogananda Maspolim, Wun Jern Ng⁎
Advanced Environmental Biotechnology Centre, Nanyang Environment and Water Research Institute, Nanyang Technological University, 1Cleantech Loop, Singapore 637141, Singapore. E-mail: [email protected] of Civil and Environmental Engineering, Nanyang Technological University, Singapore 639798, Singapore
A R T I C L E I N F O
⁎ Corresponding authors. E-mail: CHGUO@ntu
http://dx.doi.org/10.1016/j.jes.2015.06.0151001-0742/© 2015 The Research Center for Ec
A B S T R A C T
Article history:Received 3 May 2015Revised 16 June 2015Accepted 17 June 2015Available online 8 September 2015
This study investigated the degradation and production of volatile fatty acids (VFAs) in theacidogenic phase reactor of a two-phase anaerobic system. 20 mmol/L bromoethanesulfonicacid (BESA)was used to inhibit acidogenicmethanogens (whichwerepresent in the acidogenicphase reactor) fromdegrading VFAs. The impact of undissociated volatile fatty acids (unVFAs)on “net” VFAs production in the acidogenic phase reactor was then evaluated, with theexclusion of concurrent VFAs degradation. “Net” VFAs production from glucose degradationwas partially inhibited at high unVFAs concentrations, with 59%, 37% and 60% reduction inproduction rates at 2190 mg chemical oxygen demand (COD)/L undissociated acetic acid(unHAc), 2130 mg COD/L undissociated propionic acid (unHPr) and 2280 mg COD/L undisso-ciated n-butyric acid (unHBu), respectively. The profile of VFAsproduced further indicated thatwhile an unVFA can primarily affect its own formation, there were also unVFAs that affectedthe formation of other VFAs.© 2015 The Research Center for Eco-Environmental Sciences, Chinese Academy of Sciences.
Published by Elsevier B.V.
Keywords:Anaerobic processWaste treatmentSubstrate inhibitionUndissociated volatile fatty acidsAcidogenesis
Introduction
Anaerobic processes have been widely applied in waste andwastewater treatment and recovery of energy via biogasproduction. The process comprises hydrolysis, acidogenesis,acetogenesis and methanogenesis, with volatile fatty acids(VFAs) produced in the first three steps, including short-chainfatty acids with six carbons or fewer (acetic, propionic, butyric,etc.) (Parawira et al., 2004; Ucisik and Henze, 2008; Yu andFang, 2003).
In the conventional single-stage anaerobic system, allmicrobes are kept in the same vessel. However, thesemicrobes require different optimum growth conditions (i.e.,oxido-reductive activities, growth rates and pH values). Thetwo-phase anaerobic process attempts to physically separateacid- and methane-formers in two reactors, so that each
.edu.sg (Chenghong Guo
o-Environmental Science
reactor can be operated optimally (Pohland and Ghosh, 1971).The acidogenic phase can be achieved with shorter solidretention time and at lower pH (5–6), so that methanogenswould be suppressed and hydrolytic and acidogenic bacteriaaccumulated (Zhang and Noike, 1991). However, completedepletion of methanogens from the acidogenic phase reactoris not practical (Beccari et al., 1998). The presence ofmethanogens and the related acetic acid (HAc) degradationin the acidogenic phase reactor has been reported (Xiao et al.,2013). Researchers also reported minor propionic acid (HPr)degradation associated with a low abundance of propionate-oxidizing bacteria in the acidogenic phase reactor (Xiao et al.,2015). However, the acidogenic biomass ability for n-butyricacid (HBu) degradation, which is a syntrophic reaction ofmethanogens and HBu-oxidizing bacteria (Amani et al.,2011), remains unclear.
), [email protected] (Wun Jern Ng).
s, Chinese Academy of Sciences. Published by Elsevier B.V.

Table 1 – Initial volatile fatty acids (VFAs) (acetic acid (HAc), propionic acid (HPr), and n-butyric acid (HBu)) concentrations, pHvalues, and corresponding undissociated volatile fatty acids (unVFAs) (undissociated acetic acid (unHAc), undissociatedpropionic acid (unHPr), and undissociated n-butyric acid (unHBu)) concentrations in the mixed liquor.
HAc(mg COD/L)
pH HPr(mg COD/L)
pH HBu(mg COD/L)
pH unHAc(mg COD/L)
unHPr(mg COD/L)
unHBu(mg COD/L)
3400 6.50 3000 6.50 1700 6.50 60 70 353400 5.50 3000 6.00 3400 6.50 520 215 70900 4.50 3000 5.50 3400 6.00 580 590 2053400 5.00 1500 5.00 3400 5.50 1240 655 5753400 4.50 3000 4.50 3400 5.00 2190 2130 1335
3400 4.50 2280
197J O U R N A L O F E N V I R O N M E N T A L S C I E N C E S 4 2 ( 2 0 1 6 ) 1 9 6 – 2 0 1
Although VFAs production is necessary for methane gener-ation in the anaerobic process, high VFAs concentrations caninhibit the microbial activities (Siegert and Banks, 2005).Undissociated volatile fatty acids (unVFAs) had been reportedto be more inhibitory than the related dissociated VFAs form;VFAs inhibition of microbes was mainly attributed to unVFAs(Esgalhado andRoseiro, 1998;Guldfeldt andArneborg, 1998; Xiaoet al., 2013). The effects of undissociated acetic acid (unHAc) andundissociated n-butyric acid (unHBu) on biohydrogen produc-tion in glucose fermentation have been investigated (van Ginkeland Logan, 2005). To date, little is known about the impact ofunVFAs on VFAs production and composition. This studyinvestigated the impact of undissociated acetic acid (unHAc),propionic acid (unHPr), and n-butyric acid (unHBu)on “net”VFAsproduction and the composition profile of such production.
As was noted, many studies on VFAs production in theacidogenic phase reactor had not considered the effect ofVFAs degradation (Jung et al., 2000; Salomoni et al., 2011).Bromoethanesulfonic acid (BESA) was reported to be effectiveat inhibiting methanogen activities (Chae et al., 2010). Thisstudy investigated the possibility of excluding the effect ofVFAs degradation on the “net” VFAs production (net meansVFAs production without VFAs degradation).
1. Materials and methods
1.1. Inoculum
The inoculum was drawn from the acidogenic phase reactorof a two-phase anaerobic sludge digestion system (workingvolume 7.5 L) operated in continuous stirred tank reactor(CSTR) mode with a hydraulic retention time of 3 days and pHof 5.50 ± 0.30, with details as described by Maspolim et al.(2015). The highest HAc, HPr and HBu concentrations experi-enced by the acidogenic biomass were 1200, 1960 and 1285 mgchemical oxygen demand (COD)/L, respectively.
1.2. Experimental set-up
Inoculum was drawn from the acidogenic phase reactor toinvestigate the impact of unHAc, unHPr and unHBu at variousconcentrations on VFAs production. The inoculum was treatedto remove residual VFAs by centrifugation and re-suspensionwith an equivalent volume of synthetic feedmedia, with detailsas described by Xiao et al. (2013). To inhibit the activities of theacidogenic methanogens (which are present in the acidogenicphase reactor), 20 mmol/L BESA was chosen. The appropriate
BESAconcentrationwas identified via batch testswithdetails asdescribed in (Appendix A Fig. S1). In this experiment, 500 mg/Lglucose was used as the baseline substrate to stimulateacidogenesis, resulting in major acidogenesis products such asHAc, HPr, and HBu (Wang et al., 2011). The unVFAs concentra-tionswere calculated from the total VFAs concentrations and pHvalues as described in Eqs. (1) and (2) (Guldfeldt and Arneborg,1998; van Ginkel and Logan, 2005). The calculated unVFAsconcentrations at different pH values are shown in Table 1.
pH ¼ pKa þ log A−=HAð Þ ð1Þ
A− þHA ¼ Total acid ð2Þ
where, A− (mg/L) and HA (mg/L) are the concentrations ofdissociated and undissociated VFAs, respectively. pKa valueschosen for HAc, HPr and HBu were 4.76, 4.89 and 4.81 at 35°C,respectively (Fukuzaki et al., 1990; van Ginkel and Logan, 2005).
Briefly, 50 mL synthetic feed media (Labib et al., 1992)containing 500 mg/L glucose, 20 mmol/L BESA and differentconcentrations of unVFAs (unHAc, unHPr or unHBu) weremixedwith 50 mL pretreated inoculum, filled into 120 mL serumbottles, and then placed on a shaker (Sartorius Stedim Biotech,Germany) at 35°C and 170 r/min. The unVFAs concentrationswere achieved through addition of total VFAs andmanipulatingpH (Table 1). For example, 60 mg/L unHAc in the serum bottlewas achieved through adding 3400 mg COD/L HAc and manip-ulating pH in the mixed liquor to 6.50. A similar procedure wasadopted with other unHAc, unHPr and unHBu concentrations.pHwas adjustedwith 1 mol/LHCl and 1 mol/LNaOH. Incubationperiods for the unHAc, unHPr and unHBu experiments were23 hr, 19 hr, and19.5 hr, respectively. Theseperiodswere chosenso as not to exhaust the pH buffering capability and to keep pHchanges within the range of 0.10–0.30 pH units. VFAs productionwas calculated based on the net increase in total VFAsconcentrations within the incubation periods and reported asmg COD/L. VFAs production rates were then normalized againstvolatile suspended solid (VSS) concentrations. To estimate thepotential VFAs degradation, a carbon mass balance calculationwas conducted in terms of total chemical oxygen demand(TCOD). At predetermined sampling intervals, 2 mLmixed liquorsample was drawn from the serum bottles for VFAs and CODtests. Each test was performed in triplicate.
1.3. Analysis
VFAs measurement was as described by Xiao et al. (2013).Briefly, a sludge sample was centrifuged at 12,857 ×g for 5 min.

4000
5000
6000
7000
8000
trat
ion
(mg
CO
D/L
)
Start End
a
198 J O U R N A L O F E N V I R O N M E N T A L S C I E N C E S 4 2 ( 2 0 1 6 ) 1 9 6 – 2 0 1
The supernatant was then filtered through a 0.2 μmmembranefilter and mixed with 10% (V/V) formic acid in a 1 mL vial at aratio of 9:1 (V/V). A gas chromatograph (Agilent TechnologiesInc., USA) with a DB-FFAP column (15 m × 0.53 mm × 1.0 μm;length × ID × film)wasused todetermineVFAs concentrations.TCOD and VSS were determined in accordance with standardmethods (APHA, 2005).
0
1000
2000
3000
TC
OD
con
cen
unHAc concentration (mg COD/L)60 520 580 1240 2190
0
1000
2000
3000
4000
5000
6000
7000
8000
9000
TC
OD
con
cent
ratio
n (m
g C
OD
/L)
unHPr concentration (mg COD/L)70 215 590 655 2130
b
0
1000
2000
3000
4000
5000
6000
7000
8000
TC
OD
con
cent
ratio
n (m
g C
OD
/L)
unHBu concentration (mg COD/L)35 70 205 575 1335 2280
c
Fig. 1 – Total chemical oxygen demand (TCOD) concentrationsat the start and end of the experiments with concentrations ofundissociated volatile fatty acids (unVFAs) applying therein:(a) undissociated acetic acid (unHAc); (b) undissociatedpropionic acid (unHPr); (c) undissociated n-butyric acid(unHBu).
2. Results and discussion
Biomass from the acidogenic phase reactor showed inherentminor HBu (Appendix A Fig. S2) and HPr degradation abilities(Xiao et al., 2015). The addition of 20 mmol/L BESA wassufficient in blocking HAc degradation (Appendix A Fig. S1).This would have further limited HPr and HBu degradation sincethe oxidation of HPr (△G°′ = +76.1 kJ/mol at 25°C) and HBu(△G°′ = +48.1 kJ/mol at 25°C) could not occur spontaneouslywithout the activities of H2-scavenging partners (methanogens)(Schink and Stams, 2006). Collectively, VFAs (HAc, HPr andHBu)degradation by the acidogenic biomass was unlikely, and thislaid the foundation for the following experiments to investigatethe “net” VFAs production.
2.1. The effects of unVFAs on VFAs production rate
Given that production of iso-butyric acid, n-valeric acid andiso-valeric acid during glucose degradation was minor (lessthan 5% of total VFAs production), total VFAs production wascalculated based on the concentrations of HAc, HPr and HBu.TCOD concentration remained constant for each batch testwithin the experimental period (Fig. 1). The unchanged TCODconcentrations indicated that there was only minor VFAsdegradation.
As shown in Fig. 2a, with unHAc concentrations increasingfrom 60 to 1240 mg COD/L, VFAs production rates were similar(2.51 ± 0.21 mg COD/(g VSS·hr)). The rate decreased to 1.04 mgCOD/(g VSS·hr) at the unHAc concentration of 2190 mg COD/L.However, the trends were different in the unHPr and unHButests. The VFAs production rate decreased from 3.86 to 2.44 mgCOD/(g VSS·hr) while the unHPr concentration increased from70 to 2130 mg COD/L (Fig. 2b); at the unHBu concentration of2280 mg COD/L, the VFAs production rate was 60% lowercompared against those at 35 and 70 mg COD/L (Fig. 2c). Theseresults showed that higher undissociated acid (i.e., unHAc,unHPr and unHBu) concentrations decreased acidogenic activ-ities. The inhibition caused by undissociated VFAs on the “net”VFAs production could be related to excess energy consumptionto relieve the partition of redundant unVFAs from the mem-brane bilayer (Herrero et al., 1985).
2.2. Impact of unVFAs on VFAs composition
The percentage of individual VFAs to total VFAs producedwas calculated by dividing the individual HAc, HPr or HBuconcentration against the total produced VFAs concentration(HAc + HPr + HBu) at each condition. From Fig. 3a, it can beconcluded that the increase in unHAc (60 to 2190 mg COD/L)resulted in substantial production of HPr and HBu. However,the increase in unHPr from 70 to 2130 mg COD/L resulted
mostly in HAc and HBu (Fig. 3b). Increase in unHBu (35 to2280 mg COD/L) resulted in mostly HAc and HPr products(Fig. 3c) again. Typically, VFAs production from glucosedegradation without unVFAs manipulation would have result-ed mostly in HAc, HPr and HBu (Wang et al., 2011). The resultsfrom this study indicated that VFAs composition could beaffected by the unVFAs present.

0.0
0.5
1.0
1.5
2.0
2.5
3.0
3.5
4.0
a
unHAc concentration (mg COD/L)
Tot
al V
FAs
prod
uctio
n ra
te (
mg
CO
D/(
g V
SS·h
r))
Tot
al V
FAs
prod
uctio
n ra
te (
mg
CO
D/(
g V
SS·h
r))
Tot
al V
FAs
prod
uctio
n ra
te (
mg
CO
D/(
g V
SS·h
r))
60 520 580 1240 2190
0.0
0.5
1.0
1.5
2.0
2.5
3.0
3.5
4.0
unHPr concentration (mg COD/L)70 215 590 655 2130
b
0.0
0.5
1.0
1.5
2.0
2.5
3.0
3.5
4.0
4.5
5.0
5.5
6.0
unHBu concentration (mg COD/L)35 70 205 575 1335 2280
c
Fig. 2 – unVFAs impact on the “net” volatile fatty acids (VFAs)production: (a) unHAc; (b) unHPr; (c) unHBu.
0
10
20
30
40
50
60
70
80
90
100
Perc
enta
ge o
f in
divi
dual
VFA
s to
the
tota
l pro
duce
d V
FAs
(%)
unHAc concentration (mg COD/L)
HBu HPr HAca
60 520 580 1240 2190
0
10
20
30
40
50
60
70
80
90
100
Perc
enta
ge o
f in
divi
dual
VFA
s to
the
tota
l pro
duce
d V
FAs
(%)
unHPr concentration (mg COD/L)
b
70 215 590 655 2130
0
10
20
30
40
50
60
70
80
90
100
unHBu concentration (mg COD/L)
Perc
enta
ge o
f in
divi
dual
VFA
s to
the
tota
l pro
duce
d V
FAs
(%)
c
35 70 205 575 1335 2280
Fig. 3 – Distribution of VFAs produced while manipulatingconcentrations of: (a) unHAc; (b) unHPr; and (c) unHBu.
199J O U R N A L O F E N V I R O N M E N T A L S C I E N C E S 4 2 ( 2 0 1 6 ) 1 9 6 – 2 0 1
The key enzymes in glucose degradation are butyratekinase (BK), phosphotransbutyrylase (PTB), acetate kinase(AK), phosphotransacetylase (PTA), CoA transferase (CoAT),and oxaloacetate transcarboxylase (OAATC) (Fig. 4). Theresults from this study could have been influenced byinhibition of enzymatic activities (i.e., HAc-AK, HBu-BK andHPr-CoAT). Matta-el-Ammouri et al. (1987) reported that theaddition of unHAc (510–4480 mg COD/L) into a pure culturemedium could decrease specific AK activity. When 655 mgCOD/L unHBu was added to the culture medium, the BK
activity was decreased by 33%, with related protein activitydecreasing from 3 to 2 U/mg. However, the inhibitionthreshold of these substrates (HAc, HPr and HBu) on therespective enzymes in this acidogenic biomass requiresfurther study.
3. Conclusions
This study showed that unHAc, unHPr and unHBu couldinhibit the “net” VFAs production in the acidogenic phasereactor. However, each of the three unVFAs investigated had

Glucose
Acetyl-CoA
Acetoacetyl-CoA
Butyryl-CoA
PTB
Butyryl-P
BK
Butyric acid Acetic acid
AK
Acetyl-P
PTA
CoAT
Propionic acid
Succinic acid
Succinyl-CoA
Methylmalonyl-CoA
OAATC
Oxaloacetic acid
Malic acid
Fumaric acid
Pyruvic acid
Propionyl-CoA
Fig. 4 – Metabolic pathway for glucose acidogenesis to acetic acid (HAc), propionic acid (HPr) and n-butyric acid (HBu).Adapted from Feng et al. (2009).
200 J O U R N A L O F E N V I R O N M E N T A L S C I E N C E S 4 2 ( 2 0 1 6 ) 1 9 6 – 2 0 1
different impact on VFAs production. While one unVFA wasable to inhibit production of its VFA, there was another thatdid not. These findings suggested that controlling pH andVFAs accumulation (of the undesirable type) in the acidogenicreactor would be important for subsequent proper operationof the methanogenic phase reactor.
Acknowledgments
This research grant is supported and administered by theSingapore National Research Foundation (NRF-CRP5-2009-2).
Appendix A. Supplementary data
Supplementary data to this article can be found online athttp://dx.doi.org/10.1016/j.jes.2015.06.015.
R E F E R E N C E S
Amani, T., Nosrati, M., Mousavi, S., Kermanshahi, R.K., 2011. Studyof syntrophic anaerobic digestion of volatile fatty acids usingenriched cultures at mesophilic conditions. Int. J. Environ. Sci.Technol. 8 (1), 83–96.
APHA, 2005. Standard Methods for the Examination of Water andWastewater. 21st ed. American Water Work Association,Washington, D.C., USA.
Beccari, M., Majone, M., Torrisi, L., 1998. Two-reactor system withpartial phase separation for anaerobic treatment of olive oilmill effluents. Water Sci. Technol. 38 (4–5), 53–60.
Chae, K.J., Choi, M.J., Kim, K.Y., Ajayi, F.F., Chang, I.S., Kim, I.S.,2010. Selective inhibition of methanogens for the
improvement of biohydrogen production in microbialelectrolysis cells. Int. J. Hydrog. Energy 35 (24), 13379–13386.
Esgalhado, M.E., Roseiro, J.C., 1998. The effect of acid stress on keyenzyme activities and growth kinetics in cultures ofSanthomonas campestris. Process Biochem. 33 (6), 635–640.
Feng, L., Chen, Y., Zheng, X., 2009. Enhancement ofwaste activated sludge protein conversion andvolatile fatty acids accumulation during waste activated sludgeanaerobic fermentation by carbohydrate substrate addition: theeffect of pH. Environ. Sci. Technol. 43 (12), 4373–4380.
Fukuzaki, S., Nishio, N., Shobayashi, M., Nagai, S., 1990. Inhibitionof the fermentation of propionate to methane by hydrogen,acetate, and propionate. Appl. Environ. Microbiol. 56 (3),719–723.
Guldfeldt, L.U., Arneborg, N., 1998. Measurement of the effects ofacetic acid and extracellular pH on intracellular pH ofnonfermenting, individual Saccharomyces cerevisiae cells byfluorescence microscopy. Appl. Environ. Microbiol. 64 (2),530–534.
Herrero, A., Gomez, R.F., Snedecor, B., Tolman, C.J., Roberts, M.F.,1985. Growth inhibition of Clostridium thermocellum bycarboxylic acids: a mechanism based on uncoupling by weakacids. Appl. Microbiol. Biotechnol. 22 (1), 53–62.
Jung, J.Y., Lee, S.M., Shin, P.K., Chung, Y.C., 2000. Effect of pH onphase separated anaerobic digestion. Biotechnol. BioprocessEng. 5 (6), 456–459.
Labib, F., Ferguson, J.F., Benjamin, M.M., Merigh, M., Ricker, N.L.,1992. Anaerobic butyrate degradation in a fluidized-bedreactor: effects of increased concentrations of hydrogen andacetate. Environ. Sci. Technol. 26 (2), 369–376.
Maspolim, Y., Zhou, Y., Guo, C.H., Xiao, K.K., Ng, W.J., 2015.Comparison of single-stage and two-phase anaerobic sludgedigestion systems — performance and microbial communitydynamics. Chemosphere 140, 54–62.
Matta-el-Ammouri, G., Janati-Idrissi, R., Junelles, A.M.,Petitdemange, H., Gay, R., 1987. Effects of butyric and acetic acidson acetone-butanol formation by Clostridium acetobutylicum.Biochimie 69 (2), 109–115.

201J O U R N A L O F E N V I R O N M E N T A L S C I E N C E S 4 2 ( 2 0 1 6 ) 1 9 6 – 2 0 1
Parawira, W., Murto, M., Read, J.S., Mattiasson, B., 2004. Volatilefatty acid production during anaerobic mesophilic digestion ofsolid potato waste. J. Chem. Technol. Biotechnol. 79 (7),673–677.
Pohland, F.G., Ghosh, S., 1971. Developments in anaerobicstabilization of organic wastes — the two-phase concept.Environ. Res. Lett. 1 (4), 255–266.
Salomoni, C., Caputo, A., Bonoli, M., Francioso, O.,Rodriguez-Estrada, M.T., Palenzona, D., 2011. Enhancedmethane production in a two-phase anaerobic digestion plant,after CO2 capture and addition to organic wastes. Bioresour.Technol. 102 (11), 6443–6448.
Schink, B., Stams, A.J., 2006. Syntrophism Among Prokaryotes.Springer, Germany.
Siegert, I., Banks, C., 2005. The effect of volatile fatty acid additionson the anaerobic digestion of cellulose and glucose in batchreactors. Process Biochem. 40 (11), 3412–3418.
Ucisik, A.S., Henze, M., 2008. Biological hydrolysis and acidificationof sludge under anaerobic conditions: the effect of sludge typeand origin on the production and composition of volatile fattyacids. Water Res. 42 (14), 3729–3738.
van Ginkel, S., Logan, B.E., 2005. Inhibition of biohydrogenproduction by undissociated acetic and butyric acids. Environ.Sci. Technol. 39 (23), 9351–9356.
Wang, Y.Y., Ai, P., Hu, C.X., Zhang, Y.L., 2011. Effects of variouspretreatment methods of anaerobic mixed microflora onbiohydrogen production and the fermentation pathway ofglucose. Int. J. Hydrog. Energy 36 (1), 390–396.
Xiao, K.K., Guo, C.H., Zhou, Y., Maspolim, Y., Wang, J.Y., Ng, W.J.,2013. Acetic acid inhibition on methanogens in a two-phaseanaerobic process. Biochem. Eng. J. 75, 1–7.
Xiao, K.K., Zhou, Y., Guo, C.H., Maspolim, Y., Ng, W.J., 2015.Dynamics of propionic acid degradation in a two-phaseanaerobic system. Chemosphere 140, 47–53.
Yu, H.Q., Fang, H.H., 2003. Acidogenesis of gelatin-richwastewater in an upflow anaerobic reactor: influence of pHand temperature. Water Res. 37 (1), 55–66.
Zhang, T.C., Noike, T., 1991. Comparison of one-phase andtwo-phase anaerobic digestion processes in characteristics ofsubstrate degradation and bacterial population levels. WaterSci. Technol. 23 (7/9), 1157–1166.

J O U R N A L O F E N V I R O N M E N T A L S C I E N C E S 4 2 ( 2 0 1 6 ) 2 0 2 – 2 0 9
Ava i l ab l e on l i ne a t www.sc i enced i r ec t . com
ScienceDirect
www. jou rna l s . e l sev i e r . com/ j es
Characteristics of pellets with immobilized activated sludgeand its performance in increasing nitrification in sequencingbatch reactors at low temperatures
Wenjie Dong1, Guang Lu2, Li Yan3,⁎, Zhenjia Zhang4, Yalei Zhang1
1. College of Environmental Science and Engineering, Tongji University, Shanghai 200092, China2. Wenzhou Housing and Urban–Rural Development Committee, Wenzhou 325000, China3. Wenzhou Public Utilities Investment Group Co. Ltd., Wenzhou 325000, China4. Environmental Science and Engineering, Shanghai Jiaotong University, Shanghai 200240, China
A R T I C L E I N F O
⁎ Corresponding author. E-mail: [email protected]
http://dx.doi.org/10.1016/j.jes.2015.09.0021001-0742/© 2015 The Research Center for Ec
A B S T R A C T
Article history:Received 6 May 2015Revised 11 September 2015Accepted 26 September 2015Available online 28 October 2015
Immobilized pellets obtained by means of entrapping activated sludge in waterbornepolyurethane were successfully adapted in ammonium (NH4
+–N) synthetic wastewater. Itsphysicochemical characteristics were determined using scanning electron microscope,pyrosequencing, and microelectrodes, and its influence on the nitrification process insequencing batch reactors (SBRs) at low temperatures was evaluated. A large number ofrod-shaped bacteria were observed on the surface of the immobilized pellet, in whichRudaea spp. (Xanthomonadaceae family) was an important bacterial component (23.44% ofthe total bacteria). The oxygen uptake rate of immobilized pellets reached 240.83 ±15.59 mg O2/(L·hr), and the oxygen was primarily consumed by the bacteria on the pelletsurfaces (0–600 μm). The dosing of the pellets (30 mL/L) into an SBR significantly improvedthe nitrification efficiency at low temperatures of 7–11 °C, achieving an average NH4
+–Nremoval of 84.09%, which is higher than the removal of 67.46% observed for the controlgroup.© 2015 The Research Center for Eco-Environmental Sciences, Chinese Academy of Sciences.
Published by Elsevier B.V.
Keywords:ImmobilizationAcclimationNitrificationLow temperaturesSequencing batch reactor (SBR)
Introduction
Ammonium (NH4+–N) in wastewater is derived from the
enzymatic breakdown of urea, proteins, and other nitrogen-containing materials. It is widely accepted that NH4
+–N is toxicto several fish species in an aqueous solution even at lowconcentrations (0.1 mg/L) (Eshchar et al., 2006) and can betransformed into nitrite (NO2
−–N) andnitrate (NO3−–N) indrinking
water, which can confer risks to human health, such asinfant methemoglobinemia and gastric cancer (Bruning-Fann
om (Li Yan).
o-Environmental Science
and Kaneene, 1993; Ward et al., 2005). Thus, NH4+–N must be
removed from wastewater before being discharged into a waterbody.
As an efficient and economical technology for NH4+–N
removal, biological treatment is widely applied in wastewatertreatment plants (WWTPs), but low temperatures (<15 °C)would sharply reduce the activity of microorganisms, such asnitrobacteria, leading to poor NH4
+–N removal (Fdz-Polanco et al.,1994; Sudarno et al., 2011). Therefore, feasible methods toenhance NH4
+–N removal at low temperatures are desired.
s, Chinese Academy of Sciences. Published by Elsevier B.V.

203J O U R N A L O F E N V I R O N M E N T A L S C I E N C E S 4 2 ( 2 0 1 6 ) 2 0 2 – 2 0 9
Traditional practices have been carried out to improve NH4+–
N removal by adjusting operating parameters, such as sludgeload, return sludge, aeration rate, and hydraulic retentiontime (HRT) (Salem et al., 2003; Wu et al., 2007), but it is stilldifficult to achieve high treatment efficiency or reducedoperation costs in biological systems at low temperatures.Another alternative method is bio-augmentation to enhancethe nitrification process in a biological system via psychro-trophs (Ben et al., 2009; Chevalier et al., 2000; Huang et al.,2015), granular sludge (de Kreuk et al., 2005) or bacterialimmobilization (Isaka et al., 2007, 2008). Due to the slowgrowth of microbes at low temperatures, it is hard to maintainresponsible psychrotrophs as the predominant species or takes along time to form stable granular sludge in biological systems.Therefore, a simpler and more effective method is still desired.
The immobilization technique entraps microorganisms inthe interior of a porous material and has several advantages(Hashimoto and Sumino, 1998; Sumino et al., 1992; Qiao et al.,2010), such as easy preparation, a long biomass retention timeand resistance to shock load, which are especially beneficialfor the slow growth of nitrifying activated sludge. Thus, im-mobilizationmight be an effectivemethod for enhancing NH4
+–Nremoval at low temperatures. Isaka et al. (2007) reported usingnitrifying bacteria entrapped in a polyethylene glycol gel carrierto obtain stable nitrification rates at 10 °C for high concentrationsof NH4
+–N in landfill leachates. Dong et al. (2011) also usedentrapment of activated sludge pellets in waterborne polyure-thane for the continuous treatment of micro-polluted water andachieved an NH4
+–N removal rate of over 80%. Unfortunately,oxygen profiles and oxygen uptake rate have not been wellcharacterized in these pellets. Recently, microelectrode mea-surements have been known as themost reliable techniques todirectly measure the microenvironment and activity of micro-organisms in their habitats with a high spatial and temporalresolution (Xiao et al., 2013; Hou et al., 2014; Ali et al., 2015).Furthermore, little work has been done to evaluate the nitrifica-tion activity for domestic sewage using immobilized pellets atlow temperatures.
Hence, the aim of this work is to reveal the physico-chemical characteristics of pellets obtained from entrappedactivated sludge in waterborne polyurethane by means ofscanning electron microscopy (SEM), pyrosequencing andmicroelectrode measurements. Furthermore, immobilized pel-lets were added to a sequencing batch reactor (SBR) to evaluatethe performance in increasing nitrification for the treatment ofartificial wastewater at low temperatures.
1. Materials and methods
1.1. Immobilized pellets
Elastic gel immobilized pellets (cubes with 3-mm-long sides,black, unscented, density of 1.02 g/cm3) were obtained bymeans of entrapping activated sludge (20 g/L) in waterbornepolyurethane, as described in previous reports (Dong et al.,2011, 2012). Artificial wastewater was used for acclimation ofimmobilized pellets in order to activate and produce morenitrobacterium. The compositions contained (per liter) NH4Cl,306.0 mg; NaHCO3, 936.0 mg; KCl, 18.9 mg; NaCl, 41.0 mg;
Na2HPO4·12H2O, 92.6 mg; CaCl2·2H2O, 18.9 mg and MgSO4·2-H2O, 67.2 mg. The acclimation experiments were conductedin an up-flow inner circulation aerated reactor (Dong et al.,2011). The working volumes of the reactor and pellets were18 L and 1.8 L, respectively (packing ratio of 10%). To ensuresufficient dissolved oxygen (DO: 3–4 mg/L) and mixing, airwas supplied from the bottom of the reactor using a stone airdiffuser. The initial pH was in the range of 7.2–7.4, and thetemperature was 18 °C in the reactor during the acclimatiza-tion period. The HRT was controlled at 4 hr by adjustingthe feed flow rate. About 15 days, the acclimatization wasdeemed to finish when the average NH4
+–N concentrations inthe effluents were less than 5 mg/L.
1.2. Morphological observation by SEM
The surface and cross-sectional morphological characteristicsof the immobilized pellets were examined by SEM (S-3000NSEM, Hitachi, Japan). Pellets sampled from the up-flow innercirculation aerated reactor on day 0 and day 20 representun-acclimated pellets and acclimated pellets, respectively.The collected samples were rinsed with 0.1 mol/L phosphatebuffer three times, fixed with 2.5% glutaraldehyde solution for12 hr at 5 °C, dehydrated through a graded ethanol series upto 100%, and dried with a critical point dryer (K850, QuorumTechnologies Ltd., UK). These samples were cut in half with asterile scalpel for observing cross-sectional images, and thepreparative surfaces and cross sections of the immobilizedpellets were sputtered with gold for SEM observations.
1.3. Microbial community analysis by pyrosequencing
Microbial communities in un-acclimated and acclimated im-mobilized pellets were analyzed by pyrosequencing. Samplepretreatment and DNA extraction were performed accordingto a report by Isaka et al. (2012). Sequences of the 16S rRNAgene including the variable V3 region were amplified withtwo primers: tP2 (5′-acgtacatATTACCGCGGCTGCT-3′) and tP3(5′-acgtacatCCTACGGGAGGCAGCAG-3′) (Zhang et al., 2011). Poly-merase chain reaction (PCR) amplificationwas performedusing athermal cycler PCR system (PCR Sprint, Thermo electron, UK).The PCR products were evaluated by 1.2% (W/V) agarose gelelectrophoresis and purified with a Gel/PCR DNA FragmentExtraction Kit (Geneaid, UKAS). Amplicon libraries were preparedusing a mixture of three independent PCR products for eachsample. The concentration of the PCR amplicons was measuredusing a Fluoroskan Ascent with a Quant-iT PicoGreen dsDNAreagent (Invitrogen, USA). Samples for 454 pyrosequences weresent to theChineseNationalHumanGenomeCenter inShanghai,which performed amplicon pyrosequencing using a standardRoche 454/GS-FLX Titanium (McKenna et al., 2008).
Sequences obtained from pyrosequencing reads were proc-essed to remove short sequences with lengths less than 100nucleotides, primer mismatches, or average quality scores lowerthan 25. The sequences were verified in Ribosomal DatabaseProject II (RDP Release 10) using Chimera Check (http://rdp.cme.msu.edu/index.jsp), and all chimeric sequences were discarded.The taxonomic identities of sequences were assigned using theClassifier program of the RDP-II at a confidence level of 80%(Zhong et al., 2014).

204 J O U R N A L O F E N V I R O N M E N T A L S C I E N C E S 4 2 ( 2 0 1 6 ) 2 0 2 – 2 0 9
1.4. Oxygen uptake rate measurement
The oxygen uptake rate (OUR) is defined as the amount ofoxygen consumed per unit time and per unit volume ofpellets. A micro-respiration system (Unisense, Denmark) wasused for measuring the rate of decrease of the DO concen-tration. This high-precision test system mainly includes anoxygen micro-respiration sensor, micro-respiration cham-bers, a micro-respiration rack, a picoammeter, etc. The detailedprocess of the OUR measurement is as follows. First, the micro-respiration sensor was calibrated at two points: the zero value(achieved by an anoxic alkaline ascorbic acid solution) and thesaturation value (obtained by bubbling with air). Second, feedwater and 0.50 mL of pellets (the actual volumes measured bydrainage) were added into a micro-respiration chamber. Third,the chamberswereplacedona submerged rack in a temperature-regulated water bath. Finally, the sensor was put into thechamber, and the signals of the DO concentration were recordedby micOx software.
Specific oxygen uptake rate (SOUR) of activated sludge inSBRs during the aeration phase is determined by mixed liquorsuspended solids (MLSS) and the rate of decrease of the DOconcentration (d[DO]/dt) of the mixed liquor in the micro-respiration chamber, which is calculated using Eq. (1):
SOUR ¼ 1MLSS
d DO½ �dt
ð1Þ
1.5. Microsensor profiles
Oxygen profiles are obtained using a Clark-type microelec-trode with a tip diameter of 10–20 μm (Unisense, Denmark).The microelectrode was calibrated as the micro-respirationsystem mentioned above. During the calibration procedure,the temperature and salinity in the solutions should be thesame as that of the feed water for accurate measurement. Dueto the minute tip size, excellent response time and insignif-icant stirring sensitivity, the oxygen microelectrode couldprovide reliable and fast measurements with a high spatialresolution. In this test, 0.25-mm acupuncture needles wereused for fixing pellets into a homemade foam box. The fixedpellets were immersed in the oxygen-saturated water, andthey were not allowed to touch the box surface. The entirefoam box was installed at the Unisense lab stand LS18. Theprecise test position of the microelectrode was controlledby a motorized micromanipulator (model MM-33, Unisense,Denmark).
1.6. SBR apparatus and operating conditions
Two SBRs with a working volume of 100 L (length 78.5 cm ×width 40.5 cm × height 39 cm) were applied, in which SBR-1and SBR-2 were used for the experimental group and blankgroup, respectively. Artificial wastewater was used for SBRexperiments. The compositions contained the following (perliter): NH4Cl, 126 mg;NaHCO3, 386 mg;KCl, 7.8 mg;NaCl, 16.9 mg;Na2HPO4·12H2O, 38.2 mg; CaCl2·2H2O, 7.8 mg; MgSO4·2H2O,27.7 mg and glucose, 270 mg. To discharge activated sludge andprevent immobilized pellet loss, a hole with mesh was made atthe bottom of the SBRs. Air was introduced through stone air
diffusers to maintain the DO in a range of 2 to 3 mg/L during theaeration phase. The SBRs were inoculated with activated sludgefrom the aerobic tank of aWWTP inWenzhou, China. Sludge concentrations in the reactors were maintained at 4000–4600 mg/L.The operating cycle of the SBRs comprised four phases lasting1 hr each: the first phase involved feeding in stirred conditions,the second phase was aeration, the third phase was settling, andfinally, treated water discharge was released in the fourth phase.To determine whether the nitrification would be enhanced inSBR-1, acclimated immobilized pellets were added after theremoval rate of chemical oxygen demand (R-CODCr) and NH4
+–Nremained constant at low temperatures. This experiment wasperformed over 180 cycles at temperatures of 7 to 11 °C in water.
NH4+–N, NO2
−–N, NO3−–N, total nitrogen (TN), CODCr, sludge
volume (SV30) and MLSS were determined according to thestandard methods (CEPB, 2002).
2. Results and discussion
2.1. Characteristics of immobilized pellets
2.1.1. SEM observationFig. 1 shows bacteria spatial distributions on un-acclimatedpellets and acclimated pellets. It was observed that un-acclimated pellets contained an embedding matrix with alarge pore space framework (Fig. 1a). These pores were necessaryfor substance transportation into and out of pellets. In this study,both the peripheral surface and the cross-sectional surface werecompared between un-acclimated and acclimated pellets. InFig. 1a and c, few spherical, rod-shaped and irregular particleswere observed on the two surfaces of un-acclimated pellets. Incontrast, there were large amounts of rod-shaped microbescovering the pellet surfaces. In the picture of the cross-sectionalsurface (Fig. 1e), these rod-shaped microbes were primarilydistributed on the outer layer, whereas microbes on the innerlayer were very limited (Fig. 1f). These microbes were tightlyarranged and formed a dense biological film on the pelletsurfaces. The thickness of the biological film was approximately80–120 μm. Thus, the decreasing concentrations of NH4
+–Nduringacclimation periods should be ascribed to the formation of abiological film on the pellet surfaces.
2.1.2. Determination of bacterial species in immobilized pelletsIn the experiment of 454 pyrosequencing, the total number ofeffective sequences that passed quality control was 1796 and2820 in un-acclimated and acclimated pellets, respectively.Table 1 summarizes the bacterial compositions at the phylumand class levels. At the phylum level, Proteobacteria was thepredominant microorganism in both the un-acclimated andacclimated pellets, accounting for 38.04% and 49.43% of thetotal bacteria, respectively. At the class level, Anaerolineae,classified in the Chloroflexi phylum, was the dominantmicroorganism in the un-acclimated pellets (18.22%), but itwas very limited in the acclimated pellets (<1%). In contrast,Gammaproteobacteria, which belongs to the Proteobacteriaphylum, was the dominant microorganism in the acclimatedpellets (26.24%), and its abundance was much higher than thepercentage in the un-acclimated pellets (4.51%). In addition,due to the limited detection techniques, several bacterial

b
a c
e
d f
Fig. 1 – Scanning electron microscopy (SEM) images of the immobilized pellets. (a) Peripheral surface of the un-acclimatedpellets. (×8000) bar length: 5 μm; (b, c) cross-sectional image of un-acclimated pellets. (×1500) bar length: 30 μm and (×80) barlength: 500 μm, respectively; (d) peripheral surface of the acclimated pellets. (×9000) bar length: 5 μm; (e, f ) cross-sectionalimage of the acclimated pellets. (×1500) bar length: 30 μm and (×50) bar length: 1000 μm, respectively.
205J O U R N A L O F E N V I R O N M E N T A L S C I E N C E S 4 2 ( 2 0 1 6 ) 2 0 2 – 2 0 9
sequences could not be classified into any phylum, account-ing for 23.56% and 17.41% of the total bacteria in theun-acclimated and acclimated pellets, respectively.
The community structures between un-acclimated pel-lets and acclimated pellets were further classified at thefamily level. As shown in Fig. 2, the bacteria of the un-acclimatedpellets and the acclimated pellets could be classified into48 and 43 families, respectively. Several bacterial speciesrelated to the nitrification process, including Xanthomonadaceae,Chitinophagaceae,Nitrospiraceae, Comamonadaceae, Cystobacteraceae,Nitrosomonadaceae and Planctomycetaceae, were observed in theacclimated pellets (Fitzgerald et al., 2015; Gomez-Alvarez et al.,2013; Khardenavis et al., 2007), whereas these bacteria weresparse in the un-acclimated pellets. Additionally, at the genus
Table 1 – Percentages of sequences identified to different phylo
Phyla Class
Actinobacteria ActinobacteriaBacteroidetes SphingobacteriaProteobacteria Deltaproteobacteria
BetaproteobacteriaAlphaproteobacteriaGammaproteobacteria
Nitrospira NitrospiraGemmatimonadetes GemmatimonadetesAcidobacteria Acidobacteria_Gp4
Acidobacteria_Gp6Acidobacteria_Gp16
Firmicutes ClostridiaBacilli
Planctomycetes PlanctomycetaciaChloroflexi Anaerolineae
Minor class ⁎
Unclassified Unclassified
⁎ Rare class with less than 1% abundance were grouped as “Minor class
level, a bacterial species named Rudaea spp. was the dominantmicroorganism in theacclimatedpellets, accounting for 23.44%ofthe total bacteria. Rudaea spp. was first classified as an aerobic,rod-shaped bacterium in the Xanthomonadaceae family in 2009(Weon et al., 2009). To our best knowledge, this microbe has notbeen identified as being to the nitrification process; however, itmay play an important role based on the results of this study.Thus, a further identification experiment about the nitrificationfunction of this single species is worth to be carried out.
2.1.3. Respiratory intensity and oxygen distribution in immobilizedpelletsThe activity of bacteria can be reflected by the respiratoryintensities of immobilized pellets. Fig. 3 shows the DO
genies.
Un-acclimated pellets Acclimated pellets
4.68% 4.01%1.50% 7.94%4.12% 5.67%21.50% 10.78%7.91% 6.74%4.51% 26.24%3.84% 5.53%– 3.05%– 1.70%1.06% –– 1.35%2.73% –– 3.16%– 2.59%18.22% –6.35% 3.83%23.56% 17.41%
”.

Aci
dim
icro
biac
eae
Mic
roba
cter
iace
aeSt
rept
omyc
etac
eae
Noc
ardi
acea
eM
ycob
acte
riac
eae
Mic
rom
onos
pora
ceae
Kin
eosp
oria
ceae
Cor
ioba
cter
iace
aeL
epto
spir
acea
eB
acte
roid
acea
eSa
pros
pira
ceae
Chi
tino
phag
acea
eSp
hing
obac
teri
acea
eC
ryom
orph
acea
eF
lavo
bact
eria
ceae
Synt
roph
acea
eB
dell
ovib
rion
acea
eG
eoba
cter
acea
eC
ysto
bact
erac
eae
Pol
yang
iace
aeK
ofle
riac
eae
Nit
roso
mon
adac
eae
Bur
khol
deri
acea
eC
omam
onad
acea
eO
xalo
bact
erac
eae
Hyd
roge
noph
ilac
eae
Rho
docy
clac
eae
Bra
dyrh
izob
iace
aeM
ethy
locy
stac
eae
Phy
llob
acte
riac
eae
Hyp
hom
icro
biac
eae
Cau
loba
cter
acea
eSp
hing
omon
adac
eae
Rho
dosp
iril
lace
aeA
ceto
bact
erac
eae
Rho
doba
cter
acea
eP
seud
omon
adac
eae
Leg
ione
llac
eae
Sino
bact
erac
eae
Xan
thom
onad
acea
eM
ethy
loco
ccac
eae
Chl
orop
last
Nit
rosp
irac
eae
Gem
mat
imon
adac
eae
Igna
viba
cter
iace
aeH
olop
haga
ceae
Clo
stri
diac
eae
1L
achn
ospi
race
aeR
umin
ococ
cace
aeP
epto
stre
ptoc
occa
ceae
Bac
illa
ceae
1P
aeni
baci
llac
eae
1E
rysi
pelo
tric
hace
aeO
pitu
tace
aeV
erru
com
icro
biac
eae
Pla
ncto
myc
etac
eae
Phy
cisp
haer
acea
eA
naer
olin
eace
aeC
aldi
line
acea
e
0
5
10
15
20
25
30
35
40
Un-acclimated pellets
0
5
10
15
20
25
30
35
40
Abu
ndan
ce (
%)
Acclimated pellets
Abu
ndan
ce (
%)
Fig. 2 – Relative phylotype frequency at the family level.
206 J O U R N A L O F E N V I R O N M E N T A L S C I E N C E S 4 2 ( 2 0 1 6 ) 2 0 2 – 2 0 9
concentration changes for un-acclimated pellets (line a) andacclimated pellets (line b). DO (initial concentration of 8.5 mg/L)in the micro-respiration chamber was exhausted after aninoculation of 15 hr, with an average OUR of 5.53 mg O2/(L·hr) ofun-acclimated pellets. In contrast, the DO can be absolutelyconsumed within 1 min, and the average OUR of acclimatedpellets reached 239.63 mg O2/(L·hr), which was 43-fold higherthan that of un-acclimated pellets (Fig. 3, line b). These dataindicate that the microorganisms on the surface of acclimatedpellets have high aerobic activity, consistent with rapid oxygenconsumption during the nitrification process.
The distribution of oxygen in immobilized pellets can reflectthe exact positions at which the oxygen consumption process
2 4 6 8 10 12 14 16
1
2
3
4
5
6
7
8
9
c
DO
(m
g/L
)
Time (hr)
0
b
a
0.15 0.30 0.45 0.600
1
2
3
4
DO
(m
g/L
)
Time (hr)
Fig. 3 – Respiratory intensity of the immobilized pellets. Linea: un-acclimated pellets; Line b: acclimated pellets; Linec: partial enlarged sectional view of Line b.
occurs. Fig. 4 shows the differences in the oxygen distributionsbetween the un-acclimated pellets and the acclimated pellets.The distribution of oxygen on un-acclimated pellets resulted in aV-shaped graph, of which the minimum DO concentrationoccurred at the center of the pellets and its value remainedabove 7.2 mg/L. The average descent gradient of oxygen fromthe surface to the center was only 0.002 mg O2/(L·μm). Thesedata demonstrate that the efficiency of oxygen transfer inthe embedding medium was very high, whereas the oxygenconsumption by microorganisms was very limited in theun-acclimated pellets. In contrast, the oxygen on acclimatedpellets showed a U-shaped distribution. In Fig. 4, the distributionof oxygen shows a drastic decline from the surface to a depth of300 μm, and to a depth of 600 μm, the oxygen concentration
-500 0 500 1000 1500 2000 2500 3000 3500 40000
2
4
6
8
10
12
Un-acclimated pellets
Acclimated pellets
Bulk liquid
Bulk liquid
DO
(m
g/L
)
Depth (µm)
Fig. 4 – Oxygen microprofiles of immobilized pellets. (Depthzero is the pellet surface, mean ± SE, n = 3).

5
10
15
20
25
30
35
40
45
8 mg/L
Stable phaseStart-up phase
NH
4+-N
con
cent
ratio
n (m
g/L
)
Time (day)
3th2th
Influent NH4+
Effluent NH4+-N in SBR-1
Effluent NH4+-N in SBR-2
1th
05 10 15 20 25 300
Fig. 6 – Variations of NH4+–N concentrations in the sequencing
batch reactors (SBRs).
207J O U R N A L O F E N V I R O N M E N T A L S C I E N C E S 4 2 ( 2 0 1 6 ) 2 0 2 – 2 0 9
was close to 0 mg/L. The average oxygen descent gradient of0–300 μm reached 0.035 mg O2/(L·μm) in the acclimatedpellets, which was 17-fold higher than that of the un-acclimatedpellets. The results suggest that the consumption of oxygen wasmainly focused on the surface of acclimated pellets, which wasconsistentwith themicroorganismdistributions and communitycompositions.
2.1.4. Nitrification performance of immobilized pelletsFig. 5 shows the changes in the OUR values and the NH4
+–Nremoval rate during acclimation periods. During initial periods(0–10 days after inoculation), the values of OUR were very low(only in the range of 4.11 to 26.62 mg O2/(L·μm)), consistent withlow efficiencies (0.02%–28.57%) of NH4
+–N removal. These dataindicate that the biological films on the surface of immobilizedpellets are not well formed 10 days after inoculation. In contrast,the values of OUR and NH4
+–N removal efficiency sharplyincreased after 15 days of inoculation, achieving an OUR of240.83 ± 15.59 mg O2/(L·μm) and an NH4
+–N removal efficien-cy of 90%. Similarly, the values of OUR and NH4
+–N removalefficiency remained relatively constant during the latterperiods (15–30 days). This indicates that the biological filmis fully formed on the pellet surfaces on the 15th day afterinoculation. Throughout the whole operational period, therewas a significant positive correlation (R2 = 0.976) betweenOUR and the NH4
+–N removal efficiency, indicating that theoxygen consumption mainly resulted from nitrification.
2.2. SBR experiments
2.2.1. Effects of immobilized pellets on NH4+–N removal
The enhancement in the nitrification performance due to theaddition of acclimated pellets was evaluated, including theoperation in SBR-1 and the control group (only using singleactivated sludge) in SBR-2. Fig. 6 presents the differences inNH4
+–N removal between SBR-1 with immobilized pellets andthe control group in SBR-2. The effluent NH4
+–N concentrations in
0 5 10 150
50
100
150
200
250
300
OUR
Removal efficiency
R2 = 0.976
Tim
NH
4+-N
rem
oval
eff
icie
ncy
(%)
OU
R (
mg
O2/
(L. h
r))
0 50 100 150 200 250 3000
50
100
150
200
250
300
OUR (mg O2/(L.hr))
Fig. 5 – Variations of oxygen uptake rate (OUR) and
the two reactors increased during the initial phase (1–3 days)because the inoculated activated sludgewas not readily availablefor the intermittent operation mode in the SBR systems at lowtemperatures. With the two reactors operating until the 6th–8th day, the NH4
+–N and CODCr concentrations in the effluentsremained relatively stable, indicating that the activated sludgehad adapted to the operation mode. Thus, the immobilizedpellets were first added into SBR-1 on the 8th day afteractivated sludge inoculation. However, there were no significantdifferences in the effluent NH4
+–N concentrations between SBR-1and SBR-2, which is due to the low quality of the pellet additions(10 mL/L). Therefore, more acclimated pellets were added on the10th and 12th day such that the total addition of acclimated pellets was 30 mL/L. As a result, the effluent NH4
+–N concentrationsin SBR-1 began to decline, and the mean value was 5.67 mg/L,which was below the discharge standard (8 mg/L) of WWTPs inChina at low temperatures (<12 °C). In contrast, the averageNH4
+–
20 25 300
20
40
60
80
100
e (day)
NH
4+-N
rem
oval
eff
icie
ncy
(%)
NH4+–N removal efficiency. (mean ± SE, n = 3).

208 J O U R N A L O F E N V I R O N M E N T A L S C I E N C E S 4 2 ( 2 0 1 6 ) 2 0 2 – 2 0 9
N concentration in the effluents from SBR-2 reached 11.59 mg/L,which was obviously higher than that of SBR-1 and did not meetthe discharge standard of WWTPs in China. With the help ofimmobilized pellets, the average removal efficiency of NH4
+–N inSBR increased to 84.09%, whereas without immobilized pellets,NH4
+–N removal was only 67.46%. These data show that theaddition of immobilized pellets can enhance nitrification perfor-mance in SBRs and ensure that the effluent NH4
+–N concentra-tions are below the discharge standards at low temperatures(<12 °C). It is worth noting that the immobilized pellets wereacclimated at 18 °C for the purpose of quick acclimation, but thetemperature in the SBR was lower (7–11 °C), which may cause ashort-term activity of nitrobacteria in the pellets. Fortunately, theresults of NH4
+–N removal efficiency in SBR-1 show that thechange of temperature does not reduce the nitrification of thepellets significantly, which indicated that the pellets have astrong resistance to lower temperatures.
2.2.2. Analysis of nitrogen-containing compounds in the SBRsTo evaluate the effects on the concentrations of nitrogen-containing compounds due to the addition of immobilizedpellets into the SBR, NO2
−–N and NO3−–N and TN were analyzed
in the effluents during the stable phase. The average NO2−–N
concentration of the effluents in SBR-1 and SBR-2 were 1.99and 1.91 mg/L, respectively. The average effluent NO3
−–Nconcentration in SBR-1 (3.58 mg/L) was slightly higher thanthat in SBR-2 (3.12 mg/L). Therefore, the effluent NO2
−–N andNO3
−–N concentrations were not significantly different in thetwo SBRs. The average TN concentration of the effluents was12.01 mg/L in SBR-1, which was lower than 16.96 mg/L inSBR-2. Thus, not only did the addition of immobilized pelletsenhance the nitrification performance in the SBR, but it alsohelped with the removal of TN. The removal of TN is com-pleted by nitrification and denitrification processes and/or thesynthesis of biomass. In this present study, the enhancementof nitrification might supply more substrates for the processof denitrification at low temperatures.
2.2.3. Analysis of activated sludge in the SBRsTo exclude the effects of the differences in activated sludge onthe nitrification process, the characteristics of active sludge inthe two SBRs were evaluated, including SV30, MLSS, SOUR andR-CODCr. As shown in Table 2, the characteristics of activatedsludge were very similar between the two SBRs. This indicatesthat the enhancement of nitrification performance mainlyresults from the addition of acclimated pellets rather than
Table 2 – Characteristics of activated sludge in the SBRs.
Reactors Parameters
0 2
SBR-1 SV30 (%) 28 38MLSS (mg/L) 4616 3309SOUR (mg O2/(g MLSS·hr)) 4.80 2.27R-CODCr (%) 77.60 15.06
SBR-2 SV30 (%) 31 44MLSS (mg/L) 4634 3447SOUR (mg O2/(g MLSS·hr)) 4.67 2.56R-CODCr (%) 75.97 13.14
SV30: sludge settling ratio; MLSS: Mixed liquor suspended solids; SOUR: S
from changes in activated sludge characteristics. In addition,although the R-CODCr in the two SBRs approached 90%, the SOURvalueswere consistently lower than 5.00 mgO2/(gMLSS·hr) in thetwo SBRs, which was much lower than the values reported inother studies (Chen et al., 2001; Gikas and Livingston, 1998),indicating that low temperatures had a serious effect on thesludge activity. In view of the average NH4
+–N concentration, theeffluents from SBR-2 did not meet the discharge standard ofWWTPs in China, and it could be speculated that nitrifyingbacteria in the SBRs were limited by the low temperature. Thus,at low temperatures, the addition of acclimated pellets into theSBR was necessary to achieve effective nitrification.
3. Conclusions
The SEM images revealed that large amounts of rod-shapedbacteria covered the surfaces of immobilized pellets, andRudaea spp. (Xanthomonadaceae family) was importantbacterial species (23.44% of the total bacteria). The meanOUR value of immobilized pellets reached 240.83 ± 15.59 mgO2/(L·hr); the oxygen was consumed by the bacteria on thepellet surfaces (0–600 μm). The SBR experiments demonstrat-ed that the addition of immobilized pellets (30 mL/L) signifi-cantly improved nitrification efficiency at low temperaturesof 7 to 11 °C, removing 84.09% of the total NH4
+–N fromwastewater.
Acknowledgments
The authors gratefully acknowledge the Major Projects ofNational Water Pollution Control and Management Tech-nology of China (No. 2013ZX07312001-01) and the Projects ofWenzhou Key Science and Technology Innovation Team ofChina (No. C20120007).
R E F E R E N C E S
Ali, M.M., Oshiki, M., Rathnayake, L., Ishii, S., Satoh, H., Okabe, S.,2015. Rapid and successful start-up of anammox process byimmobilizing the minimal quantity of biomass in PVA-SA gelbeads. Water Res. 49 (79), 147–157.
Ben, Y., Chen, Z., Xu, Z., Jiang, A., 2009. Application ofimmobilized psychrotrophs in ICCBR to treat domestic
Time (day)
6 9 11 15 22 29
32 27 29 26 31 293437 4493 4592 4145 4676 44504.94 4.66 4.79 4.36 4.66 4.7988.57 89.64 90.70 91.41 89.26 89.5936 27 31 28 25 344260 4311 4338 4473 4290 41224.70 4.26 4.92 4.52 4.34 4.6791.11 87.86 89.42 88.96 92.72 90.54
pecific oxygen uptake rate; R-CODcr: Removal efficiency of COD.

209J O U R N A L O F E N V I R O N M E N T A L S C I E N C E S 4 2 ( 2 0 1 6 ) 2 0 2 – 2 0 9
wastewater and its microbiological investigation. Chin. Sci.Bull. 54 (9), 1599–1606.
Bruning-Fann, C.S., Kaneene, J., 1993. The effects of nitrate, nitriteand N-nitroso compounds on human health: a review. Vet.Hum. Toxicol. 35 (6), 521–538.
CEPB, 2002. Analysis Methods for Water and Wastewater. ChinaEnvironmental Science Press, Beijing.
Chen, G.H., Yip, W.K., Mo, H.K., Liu, Y., 2001. Effect of sludgefasting/feasting on growth of activated sludge cultures. WaterRes. 35 (4), 1029–1037.
Chevalier, P., Proulx, D., Lessard, P., Vincent, W., de la Noue, J.,2000. Nitrogen and phosphorus removal by high latitudemat-forming cyanobacteria for potential use in tertiarywastewater treatment. J. Appl. Phycol. 12 (2), 105–112.
de Kreuk, M., Pronk, M., van Loosdrecht, M., 2005. Formation ofaerobic granules and conversion processes in an aerobicgranular sludge reactor at moderate and low temperatures.Water Res. 39 (18), 4476–4484.
Dong, Y., Zhang, Z., Jin, Y., Li, Z., Lu, J., 2011. Nitrificationperformance of nitrifying bacteria immobilized in waterbornepolyurethane at low ammonia nitrogen concentrations.J. Environ. Sci. 23 (3), 366–371.
Dong, Y., Zhang, Z., Jin, Y., Lu, J., Cheng, X., Li, J., Deng, Y.Y., Feng,Y.N., Chen, D., 2012. Nitrification characteristics ofnitrobacteria immobilized in waterborne Polyurethane inwastewater of corn-based ethanol fuel production. J. Environ.Sci. 24 (6), 999–1005.
Eshchar, M., Lahav, O., Mozes, N., Peduel, A., Ron, B., 2006.Intensive fish culture at high ammonium and low pH.Aquaculture 255 (1), 301–313.
Fdz-Polanco, F., Villaverde, S., Garcia, P., 1994. Temperatureeffect on nitrifying bacteria activity in biofilters: activationand free ammonia inhibition. Water Sci. Technol. 30 (11),121–130.
Fitzgerald, C.M., Camejo, P., Oshlag, J.Z., Noguera, D.R., 2015.Ammonia-oxidizing microbial communities in reactors withefficient nitrification at low-dissolved oxygen. Water Res. 70(1), 38–51.
Gikas, P., Livingston, A., 1998. Use of specific ATP concentrationand specific oxygen uptake rate to determine parameters of astructured model of biomass growth. Enzym. Microb. Technol.22 (6), 500–510.
Gomez-Alvarez, V., Schrantz, K.A., Pressman, J.G., Speitel Jr., G.E.,Wahman, D.G., 2013. Pyrosequencing analysis of bench-scalenitrifying biofilters removing trihalomethanes. Environ. Eng.Sci. 30 (9), 582–588.
Hashimoto, N., Sumino, T., 1998. Wastewater treatment usingactivated sludge entrapped in polyethylene glycol prepolymer.J. Ferment. Bioeng. 86 (4), 424–426.
Hou, J., Miao, L., Wang, C., Wang, P., Ao, Y., Qian, J., et al., 2014.Inhibitory effects of ZnO nanoparticles on aerobic wastewaterbiofilms from oxygen concentration profiles determined bymicroelectrodes. J. Hazard. Mater. 276, 164–170.
Huang, Z., Qie, Y., Wang, Z., Zhang, Y., Zhou, W., 2015. Applicationof deep-sea psychrotolerant bacteria in wastewatertreatment by aerobic dynamic membrane bioreactors at lowtemperature. J. Membr. Sci. 475 (1), 47–56.
Isaka, K., Yoshie, S., Sumino, T., Inamori, Y., Tsuneda, S., 2007.Nitrification of landfill leachate using immobilized nitrifyingbacteria at low temperatures. Biochem. Eng. J. 37 (1), 49–55.
Isaka, K., Date, Y., Kimura, Y., Sumino, T., Tsuneda, S., 2008.Nitrogen removal performance using anaerobic ammoniumoxidation at low temperatures. FEMS Microbiol. Lett. 282 (1),32–38.
Isaka, K., Kimura, Y., Osaka, T., Tsuneda, S., 2012. High-ratedenitrification using polyethylene glycol gel carriersentrapping heterotrophic denitrifying bacteria. Water Res. 46(16), 4941–4948.
Khardenavis, A.A., Kapley, A., Purohit, H.J., 2007. Simultaneousnitrification and denitrification by diverse Diaphorobacter sp.Appl. Microbiol. Biotechnol. 77 (2), 403–409.
McKenna, P., Hoffmann, C., Minkah, N., Aye, P.P., Lackner, A., Liu,Z., et al., 2008. The macaque gut microbiome in health,lentiviral infection, and chronic enterocolitis. Plos Pathog. 4 (2),e20.
Qiao, X.L., Liu, Z., Liu, Z.W., Zeng, Y.L., Zhang, Z.J., 2010.Immobilization of activated sludge in poly (ethylene glycol) byUV technology and its application in micro-pollutedwastewater. Biochem. Eng. J. 50 (1-2), 71–76.
Salem, S., Berends, D., Heijnen, J., Van Loosdrecht, M., 2003.Bio-augmentation by nitrification with return sludge. WaterRes. 37 (8), 1794–1804.
Sudarno, U., Winter, J., Gallert, C., 2011. Effect of varying salinity,temperature, ammonia and nitrous acid concentrations onnitrification of saline wastewater in fixed-bed reactors.Bioresour. Technol. 102 (10), 5665–5673.
Sumino, T., Nakamura, H., Mori, N., Kawaguchi, Y., 1992.Immobilization of nitrifying bacteria by polyethylene glycolprepolymer. J. Ferment. Bioeng. 73 (1), 37–42.
Ward, M.H., DeKok, T.M., Levallois, P., Brender, J., Gulis, G., Nolan,B.T., et al., 2005. Workgroup report: drinking-water nitrate andhealth—recent findings and research needs. Environ. HealthPerspect. 113 (11), 1607–1614.
Weon, H.Y., Yoo, S.H., Kim, Y.J., Lee, C.M., Kim, B.Y., Jeon, Y.A., etal., 2009. Rudaea cellulosilytica gen. nov., sp. nov., isolated fromsoil. Int. J. Syst. Evol. Microbiol. 59 (9), 2308–2312.
Wu, C., Chen, Z., Liu, X., Peng, Y., 2007. Nitrification–denitrification vianitrite in SBR using real-time control strategy when treatingdomestic wastewater. Biochem. Eng. J. 36 (2), 87–92.
Xiao, Y., Wu, S., Yang, Z., Wang, Z., Yan, C., Zhao, F., 2013. In situprobing the effect of potentials on the microenvironment ofheterotrophic denitrification biofilm with microelectrodes.Chemosphere 93 (7), 1295–1300.
Zhang, X., Yue, S., Zhong, H., Hua, W., Chen, R., Cao, Y., et al., 2011.A diverse bacterial community in an anoxicquinoline-degrading bioreactor determined by usingpyrosequencing and clone library analysis. Appl. Microbiol.Biotechnol. 91 (2), 425–434.
Zhong, F., Wu, J., Dai, Y., Yang, L., Zhang, Z., Cheng, S., et al., 2014.Bacterial community analysis by PCR-DGGE and454-pyrosequencing of horizontal subsurface flow constructedwetlands with front aeration. Appl. Microbiol. Biotechnol. 99(3), 1–14.

J O U R N A L O F E N V I R O N M E N T A L S C I E N C E S 4 2 ( 2 0 1 6 ) 2 1 0 – 2 1 4
Ava i l ab l e on l i ne a t www.sc i enced i r ec t . com
ScienceDirect
www. jou rna l s . e l sev i e r . com/ j es
Enhanced methane production in an anaerobic digestion andmicrobial electrolysis cell coupled system with co-cultivationof Geobacter and Methanosarcina
Qi Yin, Xiaoyu Zhu⁎, Guoqiang Zhan, Tao Bo, Yanfei Yang, Yong Tao, Xiaohong He,Daping Li⁎, Zhiying YanKey Laboratory of Environmental and Applied Microbiology, Chengdu Institute of Biology, Chinese Academy of Sciences, Chengdu 610041, ChinaEnvironmental Microbiology Key Laboratory of Sichuan Province, Chengdu 610041, China
A R T I C L E I N F O
⁎ Corresponding authors. E-mail: [email protected]
http://dx.doi.org/10.1016/j.jes.2015.07.0061001-0742/© 2015 The Research Center for Ec
A B S T R A C T
Article history:Received 6 May 2015Revised 13 July 2015Accepted 29 July 2015Available online 23 October 2015
The anaerobic digestion (AD) and microbial electrolysis cell (MEC) coupled system has beenproved to be a promising process for biomethane production. In this paper, it was foundthat by co-cultivating Geobacter with Methanosarcina in an AD–MEC coupled system,methane yield was further increased by 24.1%, achieving to 360.2 mL/g-COD, which wascomparable to the theoretical methane yield of an anaerobic digester. With the presence ofGeobacter, the maximum chemical oxygen demand (COD) removal rate (216.8 mg COD/(L·hr)) and current density (304.3 A/m3) were both increased by 1.3 and 1.8 fold compared tothe previous study without Geobacter, resulting in overall energy efficiency reaching up to74.6%. Community analysis demonstrated that Geobacter and Methanosarcina could coexisttogether in the biofilm, and the electrochemical activities of both were confirmed by cyclicvoltammetry. Our study observed that the carbon dioxide content in total gas generated fromthe AD reactor with Geobacter was only half of that generated from the same reactor withoutGeobacter, suggesting that Methanosarcina may obtain the electron transferred from Geobacterfor the reduction of carbon dioxide to methane. Taken together, Geobacter not only canimprove the performance of the MEC system, but also can enhance methane production.© 2015 The Research Center for Eco-Environmental Sciences, Chinese Academy of Sciences.
Published by Elsevier B.V.
Keywords:AD–MEC coupled systemGeobacterMethanosarcinaCo-cultivationMethane production
Introduction
Biogas, an abundant renewable energy source, is the mostsuccessful biofuel product derived from bio-waste, but its lowproduction and impurities, mainly carbon dioxide, havehampered its value and application potential (Persson, 2003).A new technology which couples an anaerobic digester (AD)with a microbial electrolysis cell (MEC) has been developed toincrease the production and purity of biogas simultaneously(Bo et al., 2014; Cheng et al., 2009; Logan and Rabaey, 2012).Our previous study demonstrated that redundant carbon
c.cn (Xiaoyu Zhu), lidp@c
o-Environmental Science
dioxide produced from AD can be in situ converted toadditional methane by electromethanogens utilizing hydro-gen formed from MEC as an electron donor, generating highquality biogas (Bo et al., 2014).
Various Geobacter species have been found to reducesystem resistance, lower the activation energy barrier andincrease current density in microbial fuel cells (MFCs) becauseGeobacter can directly transfer electrons to the anode or otherbacteria (Malvankar et al., 2011, 2012). Efficient electrontransformation and high current are equally important forMEC (Lovley et al., 2011; Malvankar et al., 2012; Morita et al.,
ib.ac.cn (Daping Li).
s, Chinese Academy of Sciences. Published by Elsevier B.V.

211J O U R N A L O F E N V I R O N M E N T A L S C I E N C E S 4 2 ( 2 0 1 6 ) 2 1 0 – 2 1 4
2011). In recent years, Geobacter has been observed to be able todirectly transfer electrons tomethanogens, such asMethanosaetaand Methanosarcina, to reduce carbon dioxide to methane(Malvankar et al., 2011; Reguera et al., 2005; Rotaru et al.,2014a,b; Zhao et al., 2015). Generally, carbon dioxide reductionto methane is processed via sequential pathways: electron toproton transfer, hydrogen formation and carbon dioxide reduc-tion (Bo et al., 2014). The new pathway (direct interspecieselectron transfer, DIET) without the step of hydrogen formationis apparently more efficient than the traditional pathway.
In order to further increase the methane production in theAD–MEC process, a new method, i.e., co-cultivating Geobacterand Methanosarcina to improve the performance of MEC andregulate the carbon dioxide to methane conversion pathway,is reported. First, the AD and MEC coupling system withco-cultivation of Geobacter and Methanosarcina was developedto increase the production of methane. The syntrophicinteractions of Geobacter and Methanosarcina during methaneproduction in the anaerobic digester reactor were thenstudied. The mechanisms for remarkably high methanebeing produced by co-cultivating Geobacter andMethanosarcinain the coupling system were finally explored.
1. Material and methods
1.1. Inoculum
The Geobacter-containing inoculum was obtained from thesolution from the anode chamber of an existing two-chamberMEC reactor (W.T. Su et al., 2012). Pure Methanosarcina sp. waspurchased from the German Collection of Microorganismsand Cell Cultures (DSM 804).
1.2. Reactor construction
The barrel-shaped, single-chamber reactors were made ofstainless steel (SUS304, 250.0 mL, 10.0 × 7.6 cm). The reactor ADwas inoculated with waste activated sludge (2 mL). The reactorAD–G was inoculated with waste activated sludge (2 mL) andGeobacter-containing inoculum (2 mL). The reactor AD–MEC–Gwas inoculated with waste activated sludge (2 mL), Geobacter-containing inoculum (2 mL) and Methanosarcina sp. culture(2 mL). Reactor AD–MEC–G contained a 5.0 × 5.0 cm carbon feltanode pretreated according to a previous description (W. Su et al.,2012). Titanium wires were used to connect the anode to thebarrel-shaped reactor wall, which served as cathode. An Ag/AgClelectrode (sat. KCl. 0.197 V vs. standardhydrogen electrode)wasused as the reference electrode. A voltage of 1.0 V was appliedto the reactor AD–MEC–G by a DC Power supply (GPD-4303S,GWINSTEK, Taiwan), and a 16-channel voltage collectioninstrument (AD8223, RBH Co., Ltd., China) was used to monitorthe voltage across an external resistor (Rex = 2 Ω) for currentcalculation.
1.3. Experiments
All reactors were operated for three months, feeding withsodium acetate (10.0 g/L) in a buffered nutrient medium (Liuand Logan, 2004). After acclimation, batch tests were conducted
with 230.0 mLof themediumdescribed above. All reactorsweresealed with rubber stoppers and gas was collected in a 2.0 L gasbag. Samples were withdrawn every 12 hr, centrifuged for5 min at 10,000 r/min, diluted 10 times with distilled waterand then filtered by a 0.22 μm filter. All experiments wereconducted in triplicate at a temperature of 25 ± 2°C with initialpH of 6.8.
1.4. Analysis and calculation
Gases (H2, CH4 andCO2)were detected according to our previousprocedure (Jiang et al., 2013). Short chain fatty acids wereanalyzed on an HPLC 1260 (Agilent Technologies, Inc., USA)equipped with an Agilent Hi-Plex H column (300.0 × 6.5 mm)and a refractive index detector (45°C). Microbial samples werescraped from three different sites of the anodic biofilm, andmixed together for DNA extraction and high-throughputsequencing (Caporaso et al., 2011, 2012). Cyclic voltammetrywas conducted in the potential range from −0.5 to 0.4 V at a lowscan rate of 5 mV/sec.
Carbon recovery was based on the total moles of methanecarbon recovered compared to the initial moles of carbon ofthe substrate. Overall energy efficiency relative to both theenergy of the substrate and electrical input was evaluated asper a previous description (Call and Logan, 2008).
2. Results and discussion
2.1. Biogas production rate
As shown in Fig. 1a, the cumulative methane volume in theAD–MEC–G system achieved 642.9 mL in 72 hr, showing amethane yield of 360.2 mL/g-COD, which was increased by59.7% and 32.4% compared to the AD (225.5 mL/g-COD) andAD–G (272.7 mL/g-COD) reactors, respectively. The resultis also higher than that obtained in an AD–MEC reactor(289.6 mL/g-COD) (Bo et al., 2014). We obtained a 24.1%increment by co-cultivating Geobacter and Methanosarcina. Itis well known that the maximum possible methane yield is350.0 mL/g-COD in an anaerobic digester at standard temper-ature and pressure, which is equal to 370.0 mL/g-COD at 25°Cand standard pressure (Zhang et al., 2010). The methaneyields from anaerobic digester processes are usually very farfrom the theoretical upper limit. Nevertheless, the theoreticalvalue was almost achieved in the AD–MEC–G system. Thecarbon recovery based on total moles of carbon for AD–MEC–G,AD–G and AD was 46.6%, 36.6% and 30.0%, respectively.Meanwhile, the COD removal efficiency increased from 55.6%for AD to 100.0% for the AD–MEC–G reactor in 72 hr (Fig. 1b). Themaximum COD removal rate in the AD–MEC–G reactor(216.8 mg COD/(L·hr)) was enhanced by 29.6% compared to ourprevious study (AD–MEC system) of 167.3 mg COD/(L·hr) (Bo etal., 2014).
Generally, more COD degradation should result in morecarbon dioxide emission (CH3COOH → CH4 + CO2). However,the carbon dioxide content in the total gas decreasedgradually from 34.8% for reactor AD to 15.0% for reactor AD–Gand 6.9% for reactor AD–MEC–G (Fig. 1c). The increase ofmethane yield as well as decrease of carbon dioxide content in
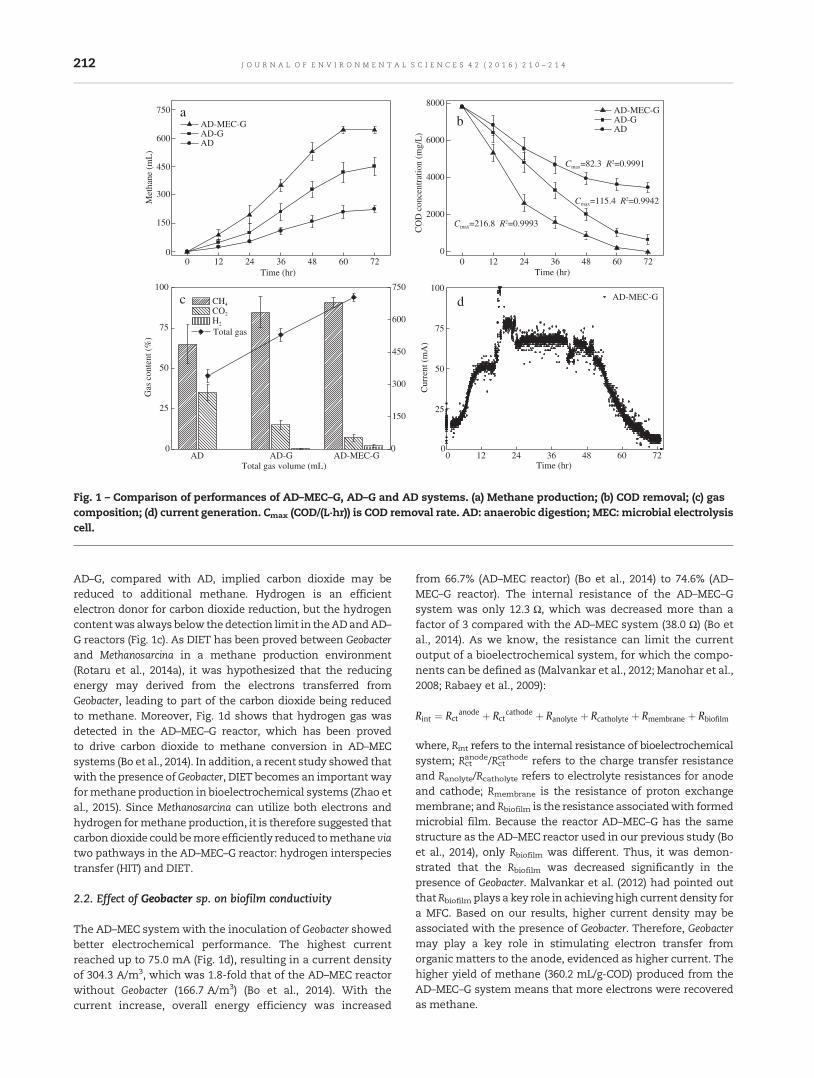
0
150
300
450
600
750
Met
hane
(m
L)
Time (hr)
AD-MEC-G AD-G AD
a
0
2000
4000
6000
8000
CO
D c
once
ntra
tion
(mg/
L)
Time (hr)
AD-MEC-G AD-G AD
b
Cmax=216.8 R2=0.9993
Cmax=82.3 R2=0.9991
Cmax=115.4 R2=0.9942
0
25
50
75
100
Gas
con
tent
(%
)
CH4
CO2
H2
Total gas volume (mL)
0
150
300
450
600
750
Total gas
c
0 12 24 36 48 60 72 0 12 24 36 48 60 72
AD AD-G AD-MEC-G 0 12 24 36 48 60 720
25
50
75
100AD-MEC-G
Cur
rent
(m
A)
Time (hr)
d
Fig. 1 – Comparison of performances of AD–MEC–G, AD–G and AD systems. (a) Methane production; (b) COD removal; (c) gascomposition; (d) current generation. Cmax (COD/(L·hr)) is COD removal rate. AD: anaerobic digestion; MEC: microbial electrolysiscell.
212 J O U R N A L O F E N V I R O N M E N T A L S C I E N C E S 4 2 ( 2 0 1 6 ) 2 1 0 – 2 1 4
AD–G, compared with AD, implied carbon dioxide may bereduced to additional methane. Hydrogen is an efficientelectron donor for carbon dioxide reduction, but the hydrogencontentwas always below thedetection limit in theADandAD–G reactors (Fig. 1c). As DIET has been proved between Geobacterand Methanosarcina in a methane production environment(Rotaru et al., 2014a), it was hypothesized that the reducingenergy may derived from the electrons transferred fromGeobacter, leading to part of the carbon dioxide being reducedto methane. Moreover, Fig. 1d shows that hydrogen gas wasdetected in the AD–MEC–G reactor, which has been provedto drive carbon dioxide to methane conversion in AD–MECsystems (Bo et al., 2014). In addition, a recent study showed thatwith the presence ofGeobacter, DIET becomes an important wayformethane production in bioelectrochemical systems (Zhao etal., 2015). Since Methanosarcina can utilize both electrons andhydrogen formethane production, it is therefore suggested thatcarbon dioxide could bemore efficiently reduced tomethane viatwo pathways in the AD–MEC–G reactor: hydrogen interspeciestransfer (HIT) and DIET.
2.2. Effect of Geobacter sp. on biofilm conductivity
The AD–MEC systemwith the inoculation of Geobacter showedbetter electrochemical performance. The highest currentreached up to 75.0 mA (Fig. 1d), resulting in a current densityof 304.3 A/m3, which was 1.8-fold that of the AD–MEC reactorwithout Geobacter (166.7 A/m3) (Bo et al., 2014). With thecurrent increase, overall energy efficiency was increased
from 66.7% (AD–MEC reactor) (Bo et al., 2014) to 74.6% (AD–MEC–G reactor). The internal resistance of the AD–MEC–Gsystem was only 12.3 Ω, which was decreased more than afactor of 3 compared with the AD–MEC system (38.0 Ω) (Bo etal., 2014). As we know, the resistance can limit the currentoutput of a bioelectrochemical system, for which the compo-nents can be defined as (Malvankar et al., 2012; Manohar et al.,2008; Rabaey et al., 2009):
Rint ¼ Rctanode þ Rct
cathode þ Ranolyte þ Rcatholyte þ Rmembrane þ Rbiofilm
where, Rint refers to the internal resistance of bioelectrochemicalsystem; Rctanode/Rctcathode refers to the charge transfer resistanceand Ranolyte/Rcatholyte refers to electrolyte resistances for anodeand cathode; Rmembrane is the resistance of proton exchangemembrane; and Rbiofilm is the resistance associatedwith formedmicrobial film. Because the reactor AD–MEC–G has the samestructure as the AD–MEC reactor used in our previous study (Boet al., 2014), only Rbiofilm was different. Thus, it was demon-strated that the Rbiofilm was decreased significantly in thepresence of Geobacter. Malvankar et al. (2012) had pointed outthat Rbiofilm plays a key role in achieving high current density fora MFC. Based on our results, higher current density may beassociated with the presence of Geobacter. Therefore, Geobactermay play a key role in stimulating electron transfer fromorganic matters to the anode, evidenced as higher current. Thehigher yield of methane (360.2 mL/g-COD) produced from theAD–MEC–G system means that more electrons were recoveredas methane.

others
AD-G AD-MEC-GAD
Geobacter25.3%
Bacteroidetes18.7%
Firmicutes 8.2%
Methanosarcina18.8%
Hydrogenotrophicmethanogens
Geobacter24.7%
Desulfuromonas
32.9%
Methanosarcina17.9%
methanogensHydrogenotrophic
Clostridia 8.4%
Chloroflexi 7.2%
Proteovacteria 5.5%
3.3%
others
others
Planctomycetes 1.8%Nitrospira 5.9%
Firmicutes 5.9%
Chloroflexi 7.5%
Bact
eroi
dete
s 7.5
%
Ver
ruco
mic
robi
a 9.
9%
Proteobacteria 11.1%
Methanospirillum 2.3%
Methanoregula 7.2%
Methanolinea 8.2%Met
hann
osae
ta
15
.7%
2.7%Firmicutes 3.4%
Proteobacteria 3.9%
Clostridia 4.6%Bacteroidetes 5.3%
Fig. 2 – The relative abundance of prokaryotic community at genus levels.
213J O U R N A L O F E N V I R O N M E N T A L S C I E N C E S 4 2 ( 2 0 1 6 ) 2 1 0 – 2 1 4
2.3. Microbiological compositions and relevant features
In reactor AD–MEC–G, 24.7% of total reads were affiliatedwithGeobacter sp. and 19.7% of total reads were assigned toMethanosarcina sp. (Fig. 2). These two groups of generacomprised the dominant microbiota in the methane produc-ing system. In the AD–G reactor, the dominant microbiotawas also composed of these two genera, Geobacter sp. (25.3%)and Methanosarcina sp. (18.8%). These results confirmed thatGeobacter and Methanosarcina can coexist together in abiofilm. However, there were a variety of methanogens inthe AD reactor, which were dominated by Methanoregula sp.,Methanolliea sp. and Methanosaeta sp. Although Methanosaetahas been reported to use the DIET pathway for methaneformation (Rotaru et al., 2014b), Geobacter in the AD reactorwas less than 0.1%, implying that methane generation in theAD system was probably via the traditional HIT pathway.Desulfuromonas sp. presented 32.9% of total sequences inthe AD–MEC–G reactor. Since Desulfuromonas sp. was reportedto exchange electrons in MFC (Zhang et al., 2014), it mighthave participated in the improvement of AD–MEC–G systemperformance.
-500
-250
0
250
500
750
Potentioal (V vs. Ag/AgCl)
AD-MEC-G AD-G AD
p1
p2
p3
a
-0.6 -0.4 -0.2 0.0 0.2 0.4
Cur
rent
(µA
)
Fig. 3 – (a) Cyclic voltammograms comparison of biofilms in reaccomparison of biofilm of AD–MEC–G reactor before and after metMEC: microbial electrolysis cell.
2.4. Mechanism of methane production enhancement byco-cultivation of Geobacter and Methanosarcina
Cyclic voltammetrywas employed to investigate the bioelectro-chemical behaviors of microorganisms in the AD–MEC–Greactor. The anodic biofilm of reactor AD–MEC–G showed apair of clear oxidation and reduction peaks at −0.3 V (p1 andp2),whereas no electrochemical activities were observed in the ADand AD–G reactors (Fig. 3a). There was a previous report thatobserved a similar peak at −0.3 V representing the electro-chemical activity of methanogens (Bo et al., 2014). Thus,Methanosarcina probably possesses electrochemical activity toaccept electrons from the anode or extracellular electrontransfer components, e.g. Geobacter (Zhu et al., 2012). As Fig. 3bshows, there was a peak (p3) that increased from −0.15 V andthen reached a stable potential of 0.02 V. This was similar tothe reported peak for Geobacter (Zhu et al., 2012). When themethanogen inhibitor (MI) 2-bromoethanesulfonate was ap-plied to reactor AD–MEC–G, p1 and p3 decreased significantly,while p2 almost disappeared from the voltammograms(Fig. 3b). It is well known that 2-bromoethanesulfonate actsspecifically to inhibit the methyl transfer reaction during
-0.6 -0.4 -0.2 0.0 0.2 0.4
-500
-250
0
250
500
750
Cur
rent
(µA
)
Potentioal (V vs. Ag/AgCl)
AD-MEC-G bioanode
AD-MEC-G bioanode with MI
p1
p2
p3
p1'
p2'
p3'
b
tor AD, AD–G and AD–MEC–G. (b) Cyclic voltammogramshanogens inhibiter (MI) addition. AD: anaerobic digestion;
214 J O U R N A L O F E N V I R O N M E N T A L S C I E N C E S 4 2 ( 2 0 1 6 ) 2 1 0 – 2 1 4
methane production (Bouwer and McCarty, 1983). Theinhibition of activity of Geobacter thus implied that DIETwas a methane syntrophic interaction between Geobacter andMethanosarcina in the AD–MEC–G system.
3. Conclusions
Our study clarified that Geobacter and Methanosarcina couldcoexist together in the AD–MEC coupled system, resulting in anenhanced methane yield of 360.2 mL/g-COD, which is compa-rable to the theoretical methane yield of an anaerobic digester.Geobacterwas found to increase the current density and reducesystem resistance of the MEC significantly, leading to moreelectrons being recovered asmethane byMethanosarcina viaHITas well as DIET pathways.
Acknowledgments
This work was supported by the National Natural ScienceFoundation of China (Nos. 31270166, 31300116 and 51408580),and the Chinese Academy of Sciences foundation (Nos.Y4C5011100 and KLCAS-2013-03).
R E F E R E N C E S
Bo, T., Zhu, X., Zhang, L., Tao, Y., He, X., Li, D., et al., 2014. A newupgraded biogas production process: coupling microbialelectrolysis cell and anaerobic digestion in single-chamber,barrel-shape stainless steel reactor. Electrochem. Commun.45, 67–70.
Bouwer, E.J., McCarty, P.L., 1983. Effects of 2-bromoethanesulfonicacid and 2-chloroethanesulfonic acid on acetate utilization ina continuous-flow methanogenic fixed-film column. Appl.Environ. Microbiol. 45, 1408–1410.
Call, D., Logan, B.E., 2008. Hydrogen production in a singlechamber microbial electrolysis cell lacking a membrane.Environ. Sci. Technol. 42, 3401–3406.
Caporaso, J.G., Lauber, C.L., Walters, W.A., Berg-Lyons, D.,Lozupone, C.A., Turnbaugh, P.J., et al., 2011. Global patterns of16S rRNA diversity at a depth of millions of sequences persample. Proc. Natl. Acad. Sci. U. S. A. 108, 4516–4522.
Caporaso, J.G., Lauber, C.L., Walters, W.A., Berg-Lyons, D., Huntley,J., Fierer, N., et al., 2012. Ultra-high-throughput microbialcommunity analysis on the Illumina HiSeq and MiSeqplatforms. ISME J. 6, 1621–1624.
Cheng, S., Xing, D., Call, D.F., Logan, B.E., 2009. Direct biologicalconversion of electrical current into methane byelectromethanogenesis. Environ. Sci. Technol. 43, 3953–3958.
Jiang, Y., Su, M., Zhang, Y., Zhan, G., Tao, Y., Li, D., 2013.Bioelectrochemical systems for simultaneously production ofmethane and acetate from carbon dioxide at relatively highrate. Int. J. Hydrog. Energy 38, 3497–3502.
Liu, H., Logan, B.E., 2004. Electricity generation using anair-cathode single chamber microbial fuel cell in the presenceand absence of a proton exchange membrane. Environ. Sci.Technol. 38, 4040–4046.
Logan, B.E., Rabaey, K., 2012. Conversion of wastes intobioelectricity and chemicals by using microbialelectrochemical technologies. Science 337, 686–690.
Lovley, D.R., Ueki, T., Zhang, T., Malvankar, N.S., Shrestha, P.M.,Flanagan, K.A., et al., 2011. Geobacter: the microbe electric'sphysiology, ecology, and practical applications. Adv. Microb.Physiol. 59, 1–100.
Malvankar, N.S., Vargas, M., Nevin, K.P., Franks, A.E., Leang, C.,Kim, B.-C., et al., 2011. Tunable metallic-like conductivity inmicrobial nanowire networks. Nat. Nanotechnol. 6, 573–579.
Malvankar, N.S., Tuominen, M.T., Lovley, D.R., 2012. Biofilmconductivity is a decisive variable for high-current-densityGeobacter sulfurreducens microbial fuel cells. Energy Environ.Sci. 5, 5790–5797.
Manohar, A.K., Bretschger, O., Nealson, K.H., Mansfeld, F., 2008.The use of electrochemical impedance spectroscopy (EIS) inthe evaluation of the electrochemical properties of a microbialfuel cell. Bioelectrochemistry 72, 149–154.
Morita, M., Malvankar, N.S., Franks, A.E., Summers, Z.M.,Giloteaux, L., Rotaru, A.E., et al., 2011. Potential for directinterspecies electron transfer in methanogenic wastewaterdigester aggregates. MBio 2 (e00159-00111).
Persson, M., 2003. Evaluation of Upgrading Techniques for Biogas.Swedish Gas Center ed.
Rabaey, K., Angenent, L., Schröder, U., Keller, J., 2009.Bioelectrochemical systems: from extracellular electrontransfer to biotechnological application. Int. Water Assoc.
Reguera, G., McCarthy, K.D., Mehta, T., Nicoll, J.S., Tuominen, M.T.,Lovley, D.R., 2005. Extracellular electron transfer via microbialnanowires. Nature 435, 1098–1101.
Rotaru, A.E., Shrestha, P.M., Liu, F., Shrestha, M., Shrestha, D.,Embree, M., et al., 2014a. A new model for electron flow duringanaerobic digestion: direct interspecies electron transfer toMethanosaeta for the reduction of carbon dioxide to methane.Energy Environ. Sci. 7, 408–415.
Rotaru, A.E., Shrestha, P.M., Liu, F., Markovaite, B., Chen, S., Nevin,K., et al., 2014b. Direct interspecies electron transfer betweenGeobacter metallireducens and Methanosarcina barkeri. Appl.Environ. Microbiol. 80, 4599–4605.
Su, W., Zhang, L., Li, D., Zhan, G., Qian, J., Tao, Y., 2012a.Dissimilatory nitrate reduction by Pseudomonas alcaliphila withan electrode as the sole electron donor. Biotechnol. Bioeng.109, 2904–2910.
Su, W.T., Zhang, L.X., Tao, Y., Zhan, G.Q., Li, D.X., Li, D.P., 2012b.Sulfate reduction with electrons directly derived fromelectrodes in bioelectrochemical systems. Electrochem.Commun. 22, 37–40.
Zhang, D., Chen, Y., Zhao, Y., Zhu, X., 2010. New sludgepretreatment method to improve methane production inwaste activated sludge digestion. Environ. Sci. Technol. 44,4802–4808.
Zhang, T., Bain, T.S., Barlett, M.A., Dar, S.A., Snoeyenbos-West,O.L., Nevin, K.P., et al., 2014. Sulfur oxidation to sulfate coupledwith electron transfer to electrodes by Desulfuromonas strainTZ1. Microbiology 160, 123–129.
Zhao, Z.Q., Zhang, Y.B., Wang, L.Y., Quan, X., 2015. Potential fordirect interspecies electron transfer in an electric-anaerobicsystem to increase methane production from sludge digestion.Sci. Rep. 5. http://dx.doi.org/10.1038/srep11094.
Zhu, X., Yates, M.D., Logan, B.E., 2012. Set potential regulationreveals additional oxidation peaks of Geobacter sulfurreducensanodic biofilms. Electrochem. Commun. 22, 116–119.

J O U R N A L O F E N V I R O N M E N T A L S C I E N C E S 4 2 ( 2 0 1 5 ) 2 1 5 – 2 2 6
Ava i l ab l e on l i ne a t www.sc i enced i r ec t . com
ScienceDirect
www. jou rna l s . e l sev i e r . com/ j es
Integrating geochemical (surface waters, stream sediments)and biological (diatoms) approaches to assess AMDenvironmental impact in a pyritic mining area: Aljustrel(Alentejo, Portugal)
Ana Teresa Luís1,2,3,⁎, Nuno Durães1, Salomé Fernandes Pinheiro de Almeida2,Eduardo Ferreira da Silva1
1. University of Aveiro, Department of Geosciences, GeoBioTec — Geobiosciences, Geotechnologies and Geoengineering Research Center,Campus de Santiago, 3810-193 Aveiro, Portugal2. University of Aveiro, Department of Biology, GeoBioTec — Geobiosciences, Geotechnologies and Geoengineering Research Center,Campus de Santiago, 3810-193 Aveiro, Portugal3. Centro de Ciências do Mar, CCMAR, Universidade do Algarve, Campus de Gambelas, 8005-139 Faro, Portugal
A R T I C L E I N F O
⁎ Corresponding author. E-mail: [email protected]
http://dx.doi.org/10.1016/j.jes.2015.07.0081001-0742/© 2015 The Research Center for Ec
A B S T R A C T
Article history:Received 26 April 2015Revised 15 July 2015Accepted 16 July 2015Available online 13 September 2015
Aljustrel mines were classified as having high environmental hazard due to their largetailings volume and high metal concentrations in waters and sediments. To assess acidmine drainage impacted systems whose environmental conditions change quickly, the useof biological indicators with short generation time such as diatoms is advantageous. Thisstudy combined geochemical and diatom data, whose results were highlighted in 3 groups:Group 1, with low pH (1.9–5.1) and high metal/metalloid (Al, As, Cd, Co, Cu, Fe, Mn, Ni, Pb,Zn; 0.65–1032 mg/L) and SO4 (405–39124 mg/L) concentrations. An acidophilic species,Pinnularia aljustrelica, was perfectly adapted to the adverse conditions; in contrast,teratological forms of Eunotia exigua were found, showing that metal toxicity affected thisspecies. The low availability of metals/metalloids in sediments of this group indicates thatmetals/metalloids of the exchangeable fractions had been solubilized, which in fact enablesmetal/metalloid diatom uptake and consequently the occurrence of teratologies; Group 2,with sites of near neutral pH (5.0–6.8) and intermediate metal/metalloid (0.002–6 mg/L) andSO4 (302–2179 mg/L) concentrations; this enabled the existence of typical species ofuncontaminated streams (Brachysira neglectissima, Achnanthidium minutissimum); Group 3,with samples from unimpacted sites, showing low metal/metalloid (0–0.8 mg/L) and SO4
(10–315 mg/L) concentrations, high pH (7.0–8.4) and Cl contents (10–2119 mg/L) and thepresence of brackish to marine species (Entomoneis paludosa). For similar conditions ofacidity, differences in diversity, abundance and teratologies of diatoms can be explained bythe levels of metals/metalloids.© 2015 The Research Center for Eco-Environmental Sciences, Chinese Academy of Sciences.
Published by Elsevier B.V.
Keywords:Surface watersStream sedimentsDiatomsMetals/metalloidsAMDTeratologies
t (Ana Teresa Luís).
o-Environmental Sciences, Chinese Academy of Sciences. Published by Elsevier B.V.

216 J O U R N A L O F E N V I R O N M E N T A L S C I E N C E S 4 2 ( 2 0 1 5 ) 2 1 5 – 2 2 6
Introduction
Acid mine drainage (AMD) input is typical of regions withsulfide mineralization, where minerals from host rocks showlow neutralizing ability through alteration and dissolutionreactions, and are one of the most harmful environmentalissues in those regions. Mining exploitation exposes thesulfide minerals (mainly pyrite) to atmospheric conditionssuitable for their oxidation, allowing the generation of AMD,i.e., acidic waters with high SO4 and metal concentrations(Dragisic et al., 1999).
Several studies in metal-polluted rivers have shown theusefulness of diatoms as bioindicators in the assessment ofstream water and sediment quality conditions (Luís et al.,2009, 2011), due to their short generation time and ubiquity.Diatoms respond to these toxic effects not only at thecommunity level through shifts in dominant taxa (Hirst etal., 2004), but also through changes in diversity (Medley andClements, 1998; Luís et al., 2009). Past research on acidophilicand acid-tolerant algae showed that algae are tolerant tometals, havingmechanisms to avoid toxic effects (Gross, 2000;Lessmann et al., 2000). Diatoms' frustule deformations havebeen correlated with high metal concentrations in a largenumber of studies (Cattaneo et al., 2004; Ferreira da Silva et al.,2009), including in an interesting review published by Falascoet al. (2009). In this sense, determining the chemical specia-tion of dissolved metals/metalloids is crucial to understandthe causes of valve teratologies, since the toxicological effectsvary according to the availability of different metal species.Thus, if a metal/metalloid is found in a more easily andabsorbable chemical form, it is expectable that the biologicaldamage, including diatom valve deformations, will increase,because, in opposition, some of the undissolved metals maybe entrapped by Fe or Mn hydroxides covering the cell wall(Perrein-Ettajani et al., 1999).
The Aljustrel mining area, as well as others from theIberian Pyrite Belt (IPB), were considered of high environmen-tal hazard degree due to large tailings volume (~5 Mt) withhigh amounts of metals (Cu, Pb and Zn) and metalloids (As,Sb) (Matos and Martins, 2006). Therefore the dispersion andmobility of these trace elements affects soils, sediments andwaters as well as biota. In Aljustrel there are several streamsaffected by AMD and for this reason, the environmentalremediation, already ongoing, is considered a priority.
In this study, mining effects are quantified via a water andsediment quality study trying to establish links between theseabiotic factors and diatom community structure and diatomdeformities. More specifically this work intends to: (1) performthe overall geochemical characterization of the sites (surfacewaters and stream sediments), with the aim of assessing thelocal environmental degradation; (2) compare diatom com-munities in unimpacted sites and in sites along a metal/metalloid and pH gradient; (3) explore the diatom communi-ties concerning their diversity, taxonomic composition, rela-tive abundance and morphology (occurrence of deformedvalves), inferring which factors might affect them andestablishing which communities can be used as bioindicatorsof distinct AMD contamination levels. This study wasconducted in a large-scale mining area, where substantial
(and costly) restoration efforts are underway. Thus, thecharacterization and definition of baseline conditions obtain-ed in this study will be of interest as a benchmark againstwhich success or failure of restoration efforts may be judged.
1. Site description
The Aljustrel mining area is located in the South of Portugaland belongs to the IPB, one of the most important and largermetallogenic provinces of the world. With an approximatedarea of 7000 km2 extending from Portugal to Spain, the IPB ischaracterized by the occurrence of volcanogenic massivesulfide deposits (VMS-type). Three main geological units arepart of the IPB: a substrate composed by phyllite and quartziterocks, overlaid by the Volcano-Sedimentary Complex thathosts the mineralization and the Culm (flysch) group(Schermerhorn, 1971). The geology of the Aljustrel area ischaracterized by the occurrence of the volcano-sedimentarysequences in the base, overlapped by a set of schists and thenby a flysch sedimentary sequence. A dolerite intrusion occursalong an important fault. Over these stratigraphic sequences,a succession of fluvial and continental sediments mainlycomposed of silica and carbonates were deposited.
The Aljustrel mines are one of the greatest sulfide depositsof the IPB, containing six mineral masses. These mines have along exploitation history, dating back to pre-Roman periodsuntil the present time, although it was in the XX century anduntil the mid-80s–90s that these mines experienced theirgreatest development. After one decade of inactivity, in 2008,a new concession began for Zn and Cu exploitation andremains until nowadays.
Due to the high environmental impact, site restorationwasinitiated in 2006 and was scheduled to finish in 2014. The costof this project was estimated at more than 10 Million Euros(source: EDM — Empresa de Desenvolvimento Mineiro).
The drainage system of this site is well developed andhierarchized, formed by a set of streams converging to themain water course of this area, the Roxo stream, whose finaldestination is the Sado River, where preserved ecosystems ofmarsh zones occur (Luís et al., 2009). The streams arecharacterized by low slope and depth and are quite similarto each other. A few of them are ephemeral, drying duringsummer, as is the case of Água Azeda and Barranco doFarrobo. The Água Forte stream is the most affected by themine (Fig. 1).
2. Methods
2.1. Sampling, preservation and preparation of samples
Sampling of stream sediments, surface water and biofilms(diatom assemblages) was carried out in 19 sites in 5 distinctperiods (2008: 1— spring, 2— summer; 2009: 3— autumn, 4—spring and 5 — winter). A total of 91 water samples, the samenumber for sediment samples and 155 samples for diatoms,were collected under the mine influence (with clear evidenceof AMD contamination) and also in areas outside the mine
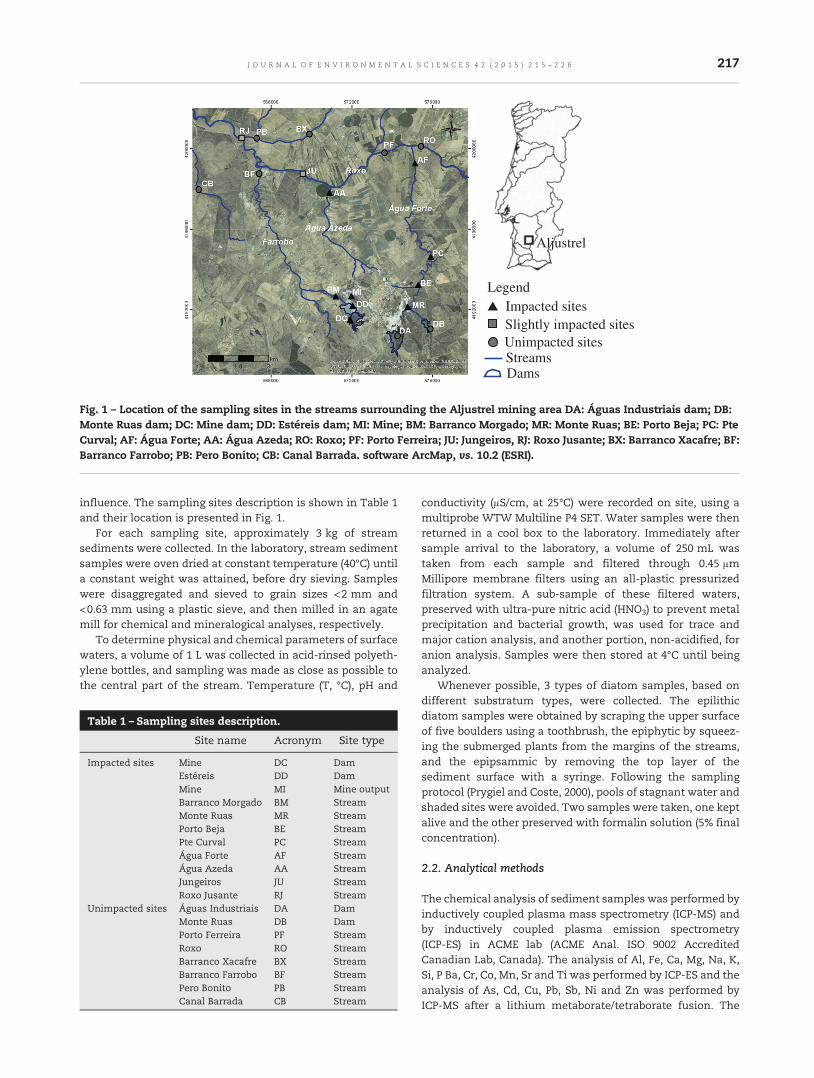
Aljustrel
LegendImpacted sitesSlightly impacted sitesUnimpacted sitesStreamsDams
Fig. 1 – Location of the sampling sites in the streams surrounding the Aljustrel mining area DA: Águas Industriais dam; DB:Monte Ruas dam; DC: Mine dam; DD: Estéreis dam; MI: Mine; BM: Barranco Morgado; MR: Monte Ruas; BE: Porto Beja; PC: PteCurval; AF: Água Forte; AA: Água Azeda; RO: Roxo; PF: Porto Ferreira; JU: Jungeiros, RJ: Roxo Jusante; BX: Barranco Xacafre; BF:Barranco Farrobo; PB: Pero Bonito; CB: Canal Barrada. software ArcMap, vs. 10.2 (ESRI).
217J O U R N A L O F E N V I R O N M E N T A L S C I E N C E S 4 2 ( 2 0 1 5 ) 2 1 5 – 2 2 6
influence. The sampling sites description is shown in Table 1and their location is presented in Fig. 1.
For each sampling site, approximately 3 kg of streamsediments were collected. In the laboratory, stream sedimentsamples were oven dried at constant temperature (40°C) untila constant weight was attained, before dry sieving. Sampleswere disaggregated and sieved to grain sizes <2 mm and<0.63 mm using a plastic sieve, and then milled in an agatemill for chemical and mineralogical analyses, respectively.
To determine physical and chemical parameters of surfacewaters, a volume of 1 L was collected in acid-rinsed polyeth-ylene bottles, and sampling was made as close as possible tothe central part of the stream. Temperature (T, °C), pH and
Table 1 – Sampling sites description.
Site name Acronym Site type
Impacted sites Mine DC DamEstéreis DD DamMine MI Mine outputBarranco Morgado BM StreamMonte Ruas MR StreamPorto Beja BE StreamPte Curval PC StreamÁgua Forte AF StreamÁgua Azeda AA StreamJungeiros JU StreamRoxo Jusante RJ Stream
Unimpacted sites Águas Industriais DA DamMonte Ruas DB DamPorto Ferreira PF StreamRoxo RO StreamBarranco Xacafre BX StreamBarranco Farrobo BF StreamPero Bonito PB StreamCanal Barrada CB Stream
conductivity (μS/cm, at 25°C) were recorded on site, using amultiprobe WTW Multiline P4 SET. Water samples were thenreturned in a cool box to the laboratory. Immediately aftersample arrival to the laboratory, a volume of 250 mL wastaken from each sample and filtered through 0.45 μmMillipore membrane filters using an all-plastic pressurizedfiltration system. A sub-sample of these filtered waters,preserved with ultra-pure nitric acid (HNO3) to prevent metalprecipitation and bacterial growth, was used for trace andmajor cation analysis, and another portion, non-acidified, foranion analysis. Samples were then stored at 4°C until beinganalyzed.
Whenever possible, 3 types of diatom samples, based ondifferent substratum types, were collected. The epilithicdiatom samples were obtained by scraping the upper surfaceof five boulders using a toothbrush, the epiphytic by squeez-ing the submerged plants from the margins of the streams,and the epipsammic by removing the top layer of thesediment surface with a syringe. Following the samplingprotocol (Prygiel and Coste, 2000), pools of stagnant water andshaded sites were avoided. Two samples were taken, one keptalive and the other preserved with formalin solution (5% finalconcentration).
2.2. Analytical methods
The chemical analysis of sediment samples was performed byinductively coupled plasma mass spectrometry (ICP-MS) andby inductively coupled plasma emission spectrometry(ICP-ES) in ACME lab (ACME Anal. ISO 9002 AccreditedCanadian Lab, Canada). The analysis of Al, Fe, Ca, Mg, Na, K,Si, P Ba, Cr, Co, Mn, Sr and Ti was performed by ICP-ES and theanalysis of As, Cd, Cu, Pb, Sb, Ni and Zn was performed byICP-MS after a lithium metaborate/tetraborate fusion. The

218 J O U R N A L O F E N V I R O N M E N T A L S C I E N C E S 4 2 ( 2 0 1 5 ) 2 1 5 – 2 2 6
mineralogy of the <63 μm size fraction from 7 streamsediment samples from unimpacted (PB and CB) and impact-ed (MR, BE, PC, AF and AA) sites was characterized by X-raypowder diffraction (XRD) (analysis carried out in theGeosciences Department at the University of Aveiro) using aX'Pert MPD (Philips, The Netherlands) equipped with anautomatic divergence slit, CuKα (λ = 1.5405 Å) radiation(20 mA and 40 kV) and a Ni filter, in the range of 4–70° (2θ°),with a step increment of 0.5 sec for each 0.02° (2θ°). TheSequential Selective Chemical Extraction (SSCE) procedurewas performed in order to infer the main metal-bearingphases in the stream sediment samples, and to predictmetal/metalloid release ability into the aquatic environment.Samples MR, BE, PC, AF, AA and CB from spring 2008 weresequentially treated with different reagents, in order torelease metals/metalloids from different mineral matrixes(Tessier et al., 1979; Quevauviller et al., 1998). The procedureused followed a 6-step sequential extraction, proposed byCardoso Fonseca and Ferreira da Silva (1998) as follows: Step 1:ammonium acetate (1 mol/L NH4Ac, pH 4.5) — for watersoluble and dissolved exchangeable ions, specificallyadsorbed and carbonate-bound; Step 2: hydroxylamine hy-drochloride (0.1 mol/L NH4OH·HCl, pH 2) — ions bound inMn-oxides; Step 3: ammonium oxalate under dark conditions[0.175 mol/L (NH4)2C2O4–0.1 mol/L H2C2O4, pH 3.3 — Tammreagent] — ions linked to amorphous Fe-oxyhydroxides; Step4: H2O2 35% — ions associated to organic matter; Step 5:ammonium oxalate under UV radiation conditions [0.175 mol/L(NH4)2C2O4–0.1 mol/L H2C2O4, pH 3.3 — Tamm reagent] — ionsassociated to crystalline Fe-oxyhydroxides; Step 6: mixed-acid(HCl + HNO3 + HF) decomposition— ions from lattice positionsin the mineral matrix of resistant silicates, sulfides and someoxides. After each reaction, the solutions were centrifuged andfiltered. Copper, Fe,Mn, Pb andZn fromeachextraction solutionwere analyzed by Atomic Absorption Spectrometry (AAS) usinga 906 spectrophotometer (GBC, Australia) in the GeochemistryLaboratory of the Geosciences Department at the University ofAveiro.
The chemical analysis of water samples was carried out byICP-MS for determination of 23 elements (Al, As, B, Ba, Ca, Cd,Cl, Co, Cr, Cu, Fe, K, La, Li, Mg, Mn, Na, Ni, Pb, Sb, Si, Sr and Zn)in ACME lab (ACME Anal. ISO 9002 Accredited Lab, Canada).Sulfate and NO3
− were determined by ion chromatography andNH4
+ by spectrophotocolorimetry in the Geochemistry Labora-tory of the Geosciences Department at the University ofAveiro. The HCO3
− concentration was determined by titrationwith H2SO4 at 0.08 mol/L in the field. The determination ofchemical oxygen demand (COD) [colorimetric method(MILI 01, internal method)] and P (as P2O5 by colorimetricmethod) took place at IDAD Laboratory at the University ofAveiro. A rigorous quality control program was implementedduring water chemical analysis which included reagentblanks, duplicate samples, and certified reference materials(STANDARD WASTWATRA6). The precision and bias error ofthe chemical analysis were less than 10%.
Live diatom samples were examined to exclude thepossibility of the presence of dead diatoms in order to avoidabundance errors. From the other set of samples (preservedwith formalin), an aliquot (after cleaning off formalin) wastreated with HNO3 (65%) and potassium dichromate (K2Cr2O7)
at room temperature for 24 hr, followed by three centrifuga-tions (1500 r/min) to wash off the excess of acid. Then,permanent slides were prepared using Naphrax®. Diatomswere identified and semi-quantified (400 valves per sample)under a light microscope (Leitz Biomed 20 EB) using a 100×objective (N.A. 1.32). Taxonomy was based on Krammer andLange-Bertalot (1986, 1988, 1991a, 1991b) and Prygiel and Coste(2000) floras. Light microscopy photographs of diatoms weretaken with a Zeiss Axioplan 2 imaging light microscope (CarlZeiss, Oberkochen, Germany) equipped with a DP70 Olympuscamera (Olympus Corp., Tokyo, Japan). Microphotographswere digitally treated and images were made using CorelDrawversion X6.
2.3. Data analysis
Descriptive statistics (minimum/maximum, median andmean) were determined for sediment data analysis. Descrip-tive statistics (minimum/maximum, median and mean) ofwater hydrogeochemical data also were calculated. PrincipalComponent Analysis (PCA) was carried out to reduce thedimensionality of the data set, in which a large number ofcorrelated variables was found, while retaining as much aspossible of the existing variation. The retention factors werecalculated based on the empirical criterion of eigenvalues >1.This matrix was composed by: Al, As, B, Ba, Ca, Cd, Cl, Co, Cr,Cu, Fe, K, La, Li, Mg, Mn, Na, Ni, Pb, Sb, Si, Sr and Zn, SO4
2−,HCO3
−, NH4+, P2O5, NO3
−, COD, pH, temperature (Temp) andelectrical conductivity (Cond). PCA correlations were per-formed in the software Statistica®, version 8.0. Classificationof water samples was carried out through Piper and Ficklindiagrams. The ion activity calculation and the chemicalspeciation distribution of dissolved species for the watersamples were made using PHREEQC (version 3.0, Parkhurstand Appelo, 2013), running with the minteq.v4.dat thermody-namic database. A mass-balance equilibrium model was usedto calculate the elemental aqueous speciation with respect tothe dissolved constituents.
Samples from spring of 2009 (campaign 4) were not usedfor diatom analysis because the minimum of 400 valvescounted was not achieved for most of the samples. In sites MIand DD, no diatoms were observed due to extremely adverseconditions: low light conditions, very low pH and extremelyhigh metal/metalloid concentrations.
A square root transformation, to retain zero values andbalance the contribution of rare and dominant species on thediatom data matrix (244 taxa × 108 samples × 32 environ-mental variables) was carried out. Then, a Bray–Curtisdissimilarity resemblance matrix was constructed for thediatoms data. A distance based redundancy analysis (dbRDA)was performed in order to find linear combinations of thepredictor variables, which explain the greatest variation in thedata cloud. Dams were excluded, since their taxa (mainlyplanktonic) were very different from taxa of stream watersamples. The truly collinear variables (most of the metalswith │r│ ≥ 0.95) were removed from the analysis, and Cu wasused as a surrogate variable, representing all metals; Pb, Asand Sb (showing │r│ < 0.95) were treated as independentvariables. Thus, a final biological/environmental matrixcomposed by 244 taxa × 93 samples × 18 environmental

219J O U R N A L O F E N V I R O N M E N T A L S C I E N C E S 4 2 ( 2 0 1 5 ) 2 1 5 – 2 2 6
variables (Cu, Pb, As, Sb, Si, Ca, Mg, K, Cl, Na, P2O5, SO42−, HCO3
−,NH4
+, COD, pH, Cond and Temp − log10 transformed) wasachieved to run the final dbRDA.
The ANOSIM test (permutational based hypothesis test-ing), analogous to the univariate 1- and 2-way ANOVA(analysis of variance), tested for differences in diatomcommunities, while SIMPER analysis was used to determinethe species responsible for the largest contribution to theBray–Curtis dissimilarity matrix between sites. The dbRDA,SIMPER and ANOSIM were run in the software Primer 6®(Primer-E Ltd, Plymouth, UK).
3. Results
3.1. Sediments
The basic statistics of chemical parameters (maximum/minimum range, median and mean) of the stream sedimentsamples are shown in Table 2. It is possible to see a cleardistinction among samples under and out of the mineinfluence (impacted and unimpacted sites, respectively).
A comparison between chemical parameters in bothgroups (impacted and unimpacted) showed that values ofAs, Ba, Cd, Co, Cu, Ni, Pb, Sb, Sr, Zn, Al, Fe, Mg, Na, K and P(mean concentrations) were 1 to 97 times higher in impactedthan in unimpacted sites, exceeding the normal concentra-tions of metals/metalloids for sediments (Quevauviller et al.,1998). Exceptions were found for Si, Ca, Mn and Cr, whichwereslightly higher in the unimpacted sites.
The mineralogical content was not highly variable be-tween samples from the same group. Quartz and feldsparswere important constituents of both sample groups: impacted(MR, BE, PC, AF and AA) and unimpacted (PB and CB) sites,representing the residual fractions of host rock erosion. Insamples from the unimpacted group, these residual fractions
Table 2 – Geochemical data (minimum, maximum, median andunimpacted sites from Aljustrel mining area (n = 91).
Element Impacted sites
Min–Max Median M
Si (g/kg) 14.5–362 253 24Al (g/kg) 3.86–105 43.5 44Fe (g/kg) 20.2–393 119 12Mg (g/kg) 0.905–13.5 4.16 5.4Ca (g/kg) 0.200–35.7 2.57 4.3Na (g/kg) 0.074–15.1 4.86 5.4K (g/kg) 0.800–26.5 11.8 11P (g/kg) 0.022–2.41 0.508 0.6As (mg/kg) 28–5439 981 12Ba (mg/kg) 42–2957 394 43Cd (mg/kg) 0.2–65 1 6Co (mg/kg) 3–137 12 21Cr (mg/kg) 14–342 55 59Cu (mg/kg) 69–10,000 393 12Mn (mg/kg) 225–1007 465 52Ni (mg/kg) 6–62 21 24Pb (mg/kg) 42–10,000 389 13Sb (mg/kg) 1–955 22 98Sr (mg/kg) 7–181 87 84Zn (mg/kg) 154–10,000 483 16
were dominant. However, clay minerals were also identified.Samples from impacted sites showed an increase in claycontent and the presence of sulfate/oxy-hydroxysulfatephases (e.g., jarosite and gypsum). As jarosite is only stableunder extremely acidic conditions, its absence is understand-able in samples from site AA, where the pH is not very acidic(pH 4–5). Primary sulfides such as pyrite were also identifiedin some of these samples. Probably, these sulfides did notsuffer oxidation due to Fe-oxyhydroxide coatings that precip-itated on their reactive surfaces.
The SSCE method was used to determine the mainbearing-phases of some of the most harmful elements (As,Cu, Fe, Mn, Pb and Zn) in these mining environmentalconditions (Fig. 2), which may be useful to infer informationabout their greater or lesser mobility. Copper was distributedmainly in the residual fraction of the unimpacted samples,but in the remaining samples it seemed to be associated todifferent phases, like Fe-oxyhydroxides. In addition, theacidification seemed to enhance the bioavailability of Cusince an amount was extracted with ammonium acetate inimpacted samples, whereas for PB and CB samples this wasnot verified. Also, a different behavior between the impactedand unimpacted samples was found for Zn. An amount of thismetal seemed to be present in the residual fractions and inthe Fe-oxyhydroxide phases, mainly in the unimpactedsamples. Nevertheless, the amount of Zn extracted from theexchangeable fraction was very high in the impacted samples.This aspect reflects the high ability of Zn to bemobilized. Leadwas mainly associated with Fe-oxyhydroxide phases in bothgroups of samples, but in impacted samples a part of Pb wasextracted from primary sulfides. In the CB sample only, thismetal was in the bioavailable fraction. For As and Fe, no cleardistinction was found between impacted and unimpactedsamples, because these two elements were mainly associatedwith Fe-oxyhydroxide phases, despite the fact that Fe alsoshowed an association with the primary sulfide phases. In
mean values) of stream sediment samples of impacted and
Unimpacted sites
ean Min–Max Median Mean
2 206–412 355 344.2 4.40–87.7 32.8 38.04 11.8–72.5 35.9 36.21 1.20–12.1 4.51 5.392 0.600–33.5 5.40 8.339 0.180–14.2 4.97 4.87.3 0.400–16.1 5.73 6.7644 0.044–0.916 0.310 0.34099 4.0–148 16 290 36–470 207 218
0.1–6 0.1 0.66–72 16 18
18–151 68 7342 9–3302 22 2851 320–2943 1007 10,323
10–50 19 2343 10–315 30 41
0.2–11 0.8 1.011–212 61 68
83 12–4004 43 338
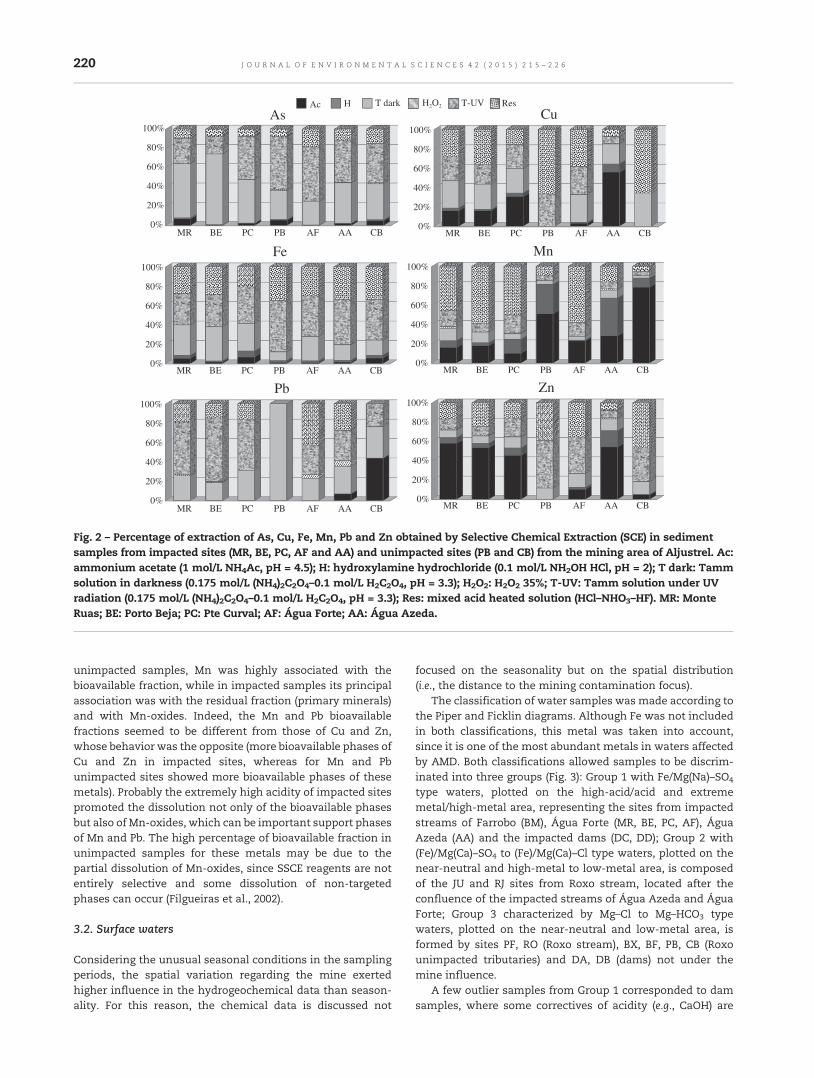
0%
20%
40%
60%
80%
100%
MR BE PC PB AF AA CB
As
0%
20%
40%
60%
80%
100%
MR BE PC PB AF AA CB
Cu
0%
20%
40%
60%
80%
100%
MR BE PC PB AF AA CB
Fe
0%
20%
40%
60%
80%
100%
MR BE PC PB AF AA CB
Mn
0%
20%
40%
60%
80%
100%
MR BE PC PB AF AA CB
Pb
0%
20%
40%
60%
80%
100%
MR BE PC PB AF AA CB
Zn
Ac H T dark H2O2 T-UV Res
Fig. 2 – Percentage of extraction of As, Cu, Fe, Mn, Pb and Zn obtained by Selective Chemical Extraction (SCE) in sedimentsamples from impacted sites (MR, BE, PC, AF and AA) and unimpacted sites (PB and CB) from the mining area of Aljustrel. Ac:ammonium acetate (1 mol/L NH4Ac, pH = 4.5); H: hydroxylamine hydrochloride (0.1 mol/L NH2OH HCl, pH = 2); T dark: Tammsolution in darkness (0.175 mol/L (NH4)2C2O4–0.1 mol/L H2C2O4, pH = 3.3); H2O2: H2O2 35%; T-UV: Tamm solution under UVradiation (0.175 mol/L (NH4)2C2O4–0.1 mol/L H2C2O4, pH = 3.3); Res: mixed acid heated solution (HCl–NHO3–HF). MR: MonteRuas; BE: Porto Beja; PC: Pte Curval; AF: Água Forte; AA: Água Azeda.
220 J O U R N A L O F E N V I R O N M E N T A L S C I E N C E S 4 2 ( 2 0 1 5 ) 2 1 5 – 2 2 6
unimpacted samples, Mn was highly associated with thebioavailable fraction, while in impacted samples its principalassociation was with the residual fraction (primary minerals)and with Mn-oxides. Indeed, the Mn and Pb bioavailablefractions seemed to be different from those of Cu and Zn,whose behavior was the opposite (more bioavailable phases ofCu and Zn in impacted sites, whereas for Mn and Pbunimpacted sites showed more bioavailable phases of thesemetals). Probably the extremely high acidity of impacted sitespromoted the dissolution not only of the bioavailable phasesbut also of Mn-oxides, which can be important support phasesof Mn and Pb. The high percentage of bioavailable fraction inunimpacted samples for these metals may be due to thepartial dissolution of Mn-oxides, since SSCE reagents are notentirely selective and some dissolution of non-targetedphases can occur (Filgueiras et al., 2002).
3.2. Surface waters
Considering the unusual seasonal conditions in the samplingperiods, the spatial variation regarding the mine exertedhigher influence in the hydrogeochemical data than season-ality. For this reason, the chemical data is discussed not
focused on the seasonality but on the spatial distribution(i.e., the distance to the mining contamination focus).
The classification of water samples was made according tothe Piper and Ficklin diagrams. Although Fe was not includedin both classifications, this metal was taken into account,since it is one of the most abundant metals in waters affectedby AMD. Both classifications allowed samples to be discrim-inated into three groups (Fig. 3): Group 1 with Fe/Mg(Na)–SO4
type waters, plotted on the high-acid/acid and extrememetal/high-metal area, representing the sites from impactedstreams of Farrobo (BM), Água Forte (MR, BE, PC, AF), ÁguaAzeda (AA) and the impacted dams (DC, DD); Group 2 with(Fe)/Mg(Ca)–SO4 to (Fe)/Mg(Ca)–Cl type waters, plotted on thenear-neutral and high-metal to low-metal area, is composedof the JU and RJ sites from Roxo stream, located after theconfluence of the impacted streams of Água Azeda and ÁguaForte; Group 3 characterized by Mg–Cl to Mg–HCO3 typewaters, plotted on the near-neutral and low-metal area, isformed by sites PF, RO (Roxo stream), BX, BF, PB, CB (Roxounimpacted tributaries) and DA, DB (dams) not under themine influence.
A few outlier samples from Group 1 corresponded to damsamples, where some correctives of acidity (e.g., CaOH) are

a b
1
10
100
1000
10000
100000
1000000
10000000
100000000
-1 0 1 2 3 4 5 6 7 8 9
Zn+
Cu+
Cd+
Ni+
Co+
Pb (
µg/L
)
pH
Group 1
Group 2
Group 3
Ultra-acid,Ultra-metal
Ultra-acid,Extreme-metal
High-acid,Ultra-metal
High-acid, Extreme-metal
High-acid, High-metal
Acid,Extreme-metal
Acid,High-metal
High-acid,Low-metal
Acid,Low-metal
Near-neutral,Extreme-metal
Near-neutral,High-metal
Near-neutral,Low-metal
1000
0100
100 0
0100
1000
0 100
100
100
00
SO4
2- +
Cl-
Mg
2+
Na + + K
+
Ca 2+ + M
g 2+
Ca2+
CationsCl-
Anions
SO4 2-
CO 3
2- +
HC
O 3-
Fig. 3 – Projection of surface water samples in Piper (a) and Ficklin (b) diagrams.
221J O U R N A L O F E N V I R O N M E N T A L S C I E N C E S 4 2 ( 2 0 1 5 ) 2 1 5 – 2 2 6
added sometimes to increase the pH and precipitate themetals. Another outlier from Group 3 showing high metal andSO4 concentrations can only be explained by a point dis-charge, since this area is not under the mine influence.
In Table 3 the basic statistics of the hydrogeochemical dataof surface waters according to the three groups of samplespreviously defined is shown. The AMD-impacted waters fromGroup 1 showed the highest concentrations of metals (mainlyAl, Cu, Fe, Ni, Pb, Zn), metalloids (As, Sb) and SO4
2− and thelowest pH, but also the highest dispersion in elementconcentrations, especially for Al, As, Cd, Cu, Fe, Pb, Sb, Si,SO4
2−. Also a high dispersion for Al, Cd, Cu, Fe, Pb and Zn (not
Table 3 – Hydrogeochemical data (minimum, maximum, mediaand unimpacted sites from Aljustrel mining area (n = 91).
Element Impacted sites
Group 1
Min–Max Median Mean Min–Ma
Si (mg/L) 1.6–89–
14 23 3.3–9.2
Al (mg/L) 0.001–1817 44 264 0.001–20Fe (mg/L) 0.009–6173 127 1032 0.009–2.1Mg (mg/L) 48–1395 338 406 62–157Ca (mg/L) 71–828 372 393 132–350Na (mg/L) 37–316 166 158 145–210K (mg/L) 0.4–4999 8.3 260 3.2–11P (mg/L) 0.01–28 0.4 1.3 0.1–0.8Cl (mg/L) 0.9–630 170 201 276–506SO4 (mg/L) 405–39,124 3516 7856 302–2179As (μg/L) 1.4–52,175 91 5324 2–11Cd (μg/L) 0.7–3527 271 667 1–41Co (μg/L) 8.5–8289 578 1599 0.3–112Cr (μg/L) 0.4–541 12 81 0.4–6.9Cu (μg/L) 22–347,780 57,814 7186 12–5076Mn (μg/L) 583–250,245 48,407 67,264 37–4122Ni (μg/L) 1–2984 277 666 1–39Pb (μg/L) 0.05–4152 63 743 0.1–9.2Sb (μg/L) 0.13–212 3 28 0.1–0.6Sr (μg/L) 178–1712 486 613 472–872Zn (μg/L) 321–1,728,734 118,590 343,907 176–20,1pH 1.9–5.1 2.9 3.4 3.7–6.8
as high as in Group 1) was found in Group 2. In Group 3, Mnand Cl presented high concentrations, which explains thehigh conductivities of these circumneutral to alkaline waters.
The PCA diagram shows the geochemical data for watersamples. The first three factors (or axes) explained 70% of thetotal variation (variables with values > |0.5|), being the firsttwo factors represented in Fig. 4. Factor 1 explained theassociation between the positive variables (from the highestto the lowest correlation: Co, Ni, Cd, Zn, Conductivity, La, Li,Cu, SO4
2−, Al, Cr, Fe, Si, Mn, B, Mg, COD, As, Sb, K, NO3− and
Ca and pH) and the negative scores, with samples fromÁgua Forte stream being the greater contributors for this
n and mean values) of surface water samples of impacted
Unimpacted sites
Group 2 Group 3
x Median Mean Min–Max Median Mean
5.9 6.1 0.3–16 8.7 8.1
0.03 2.2 0.001–7.1 0.01 0.20.1 0.3 0.009–33 0.01 0.990 93 20–252 110 103163 180 34–290 132 131183 181 59–719 196 2395.1 5.6 0.7–7.1 2.2 3.00.3 0.4 0.01–3.0 0.5 0.6422 404 10–2119 513 596487 634 10–315 67 873 4 2–189 5 1012 14 0.4–12 0.04 0.0425 36 0.02–40 1.5 0.32.4 1.0 0.4–22 0.7 3.171 799 1–1395 3 402110 2163 0.04–1500 59 24418 17 0.1–17 0.2 0.90.9 2.1 0.1–9.0 0.3 1.20.1 0.2 0.1–2.4 0.1 0.4648 642 172–1367 641 644
59 4225 6384 0.4–5860 5.0 1626.5 6.1 6.3–8.7 7.9 7.7

1.0
0.5
0
-0.5
-1.0
Fact
or 2
: 10.
10%
Factor 1: 51.69%-1.0 -0.5 0 0.5 1.0
Fig. 4 – Principal component analysis of surface watersamples (n × p = 32 × 90): projection of the variables on thefirst factorial plane (factor 1/factor 2); n = number ofphysicochemical variables; p = number of samples).
222 J O U R N A L O F E N V I R O N M E N T A L S C I E N C E S 4 2 ( 2 0 1 5 ) 2 1 5 – 2 2 6
distribution. This factor represented the chemical signature ofAljustrel mineralization and host rocks. Factor 2 explained Pband Sr (negative scores), the variables mostly correlated withMI and DD (sites located inside of the mining area), whilefactor 3 explained the association of the variables Cl, HCO3
−, Baand Na, which reflect the typology of the unimpacted watersamples (alkaline and with high salinity). The associationshighlighted in Fig. 4 were similar to the associations found byLuís et al. (2009) in Aljustrel waters.
The metal (Al, Cd, Cu, Fe, Mn, Pb and Zn) speciesdistribution of each group was calculated with PHREEQCcode (Fig. 5), evidencing that free-ion metal form (Men+) wasdominant in Groups 1 and 2 samples, whereas in Group 3 themetals were mainly in the hydroxide form (Me–OH).
3.3. Diatoms
Sampling campaign 4 (spring of 2009) was not considered forthis study since no stable diatom communities were founddue to very atypical conditions (most sites showed low pH,
Group 1 Group
Me2+ Me–SO42- Me–
Fig. 5 – Circular diagrams showing the most important m
especially those of Group 2). This was due to rainfall, andprobably related to some point mining discharge.
The dbRDA indicates the correlation between geochemicalparameters and diatom communities (Fig. 6), evidencingthe samples disposition according to the environmentalvariables, showing the same 3 groups of samples previouslyfound in Ficklin and Piper diagrams. ANOSIM also reinforcedthe existing differences in the three groups: r = 0.88, ρ < 0.001.
The three groups on the dbRDA diagram: Group 1 —impacted sites, associated with metals/metalloids and SO4
2−,with pH values ranging from 1.9 to 5.1. Sites PC and AF wereaffected by highmetal/metalloid concentrations; sites MR andBE were affected by high As, Sb and Si concentrations; andSO4
2− was correlated with BM and AA sites. The main diatomtaxa found in this group were composed by Pinnulariaaljustrelica Luís, Almeida et Ector, Eunotia exigua (Brébissonex Kützing) Rabenhorst and Nitzschia aff. hantzschianaRabenhorst. Group 2 — a transitional group, characterized byslightly acid to circumneutral conditions (pH 5.0–6.8), withAchnanthidium minutissimum (Kützing) Czarnecki andBrachysira neglectissima Lange-Bertalot being the most impor-tant diatom species. Group 3 — showing pH values rangingfrom 7.0 to 8.4, with sites BF, BX, PF, RO and PB beingcorrelated with pH and HCO3
−. Site CB was the furthest awayfrom the other sites, due to strong correlations with Naand Mg. The main diatoms found were Navicula venetaKützing, A. minutissimum, Navicula gregariaDonkin andNitzschiadesertorum Hustedt.
SIMPER analysis identified P. aljustrelica as contributing63.8% for the similarity between samples of impacted sitesfrom Group 1. P. aljustrelica was well correlated (Spearmancorrelation) with As, Al, Cd, Co, Cr, Cu, Fe, Mn, Ni, SO4
2−, Zn, Sb(all metals and metalloids except for Pb), as well as with pHand conductivity. Samples with high P. aljustrelica relativeabundances (from 65% to 100%) showed a pH range between2.0 and 4.0. Also, this species made the largest contribution tothe dissimilarity between Groups 1 and 3, considering theestimated average dissimilarity of 95.3%.
Morphological teratologies (Fig. 7) in samples of impactedsites from Group 1 were observed only for E. exigua and in thesampling campaign fromApril 2008. These deformations wereonly found in sites BM and AF, with low metal/metalloidconcentrations and less acidic conditions (pH 2.6–4.3) com-pared with sites MR and BE, where E. exigua was absent.E. exigua deformed valves appeared in 3 samples of site AFwith: 4% of deformed valves from a total of 60% of E. exigua; 3%
Group 32
OH- Me–Cl- Me3+
etal species in surface water samples of each group.
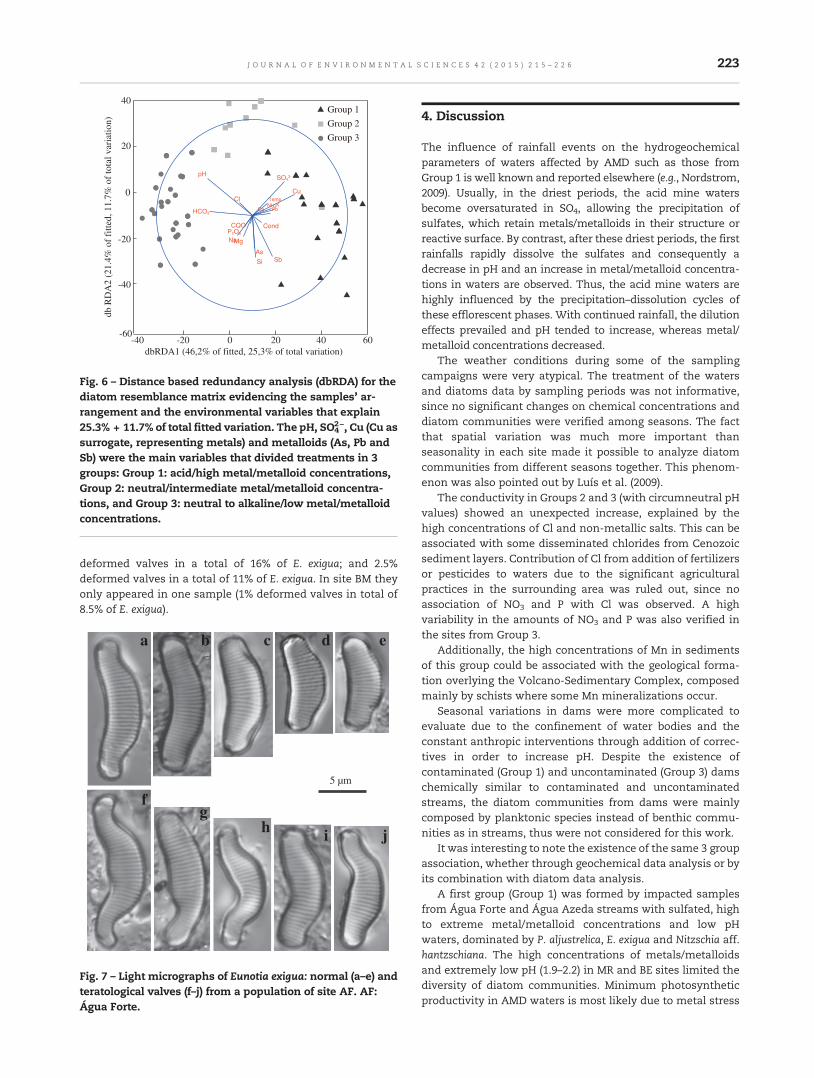
-40 -20 0 20 40 60-60
-40
-20
0
20
40Group 1
Group 2
Group 3
Ca
ClCu
K
MgNaP2O5
Pb
SO42-
SbSi
NH4
HCO3
CQO
pH
Cond
Temp
As
dbRDA1 (46,2% of fitted, 25,3% of total variation)
db R
DA
2 (2
1.4%
of
fitte
d, 1
1.7%
of
tota
l var
iatio
n)
Fig. 6 – Distance based redundancy analysis (dbRDA) for thediatom resemblance matrix evidencing the samples' ar-rangement and the environmental variables that explain25.3% + 11.7% of total fitted variation. The pH, SO4
2−, Cu (Cu assurrogate, representing metals) and metalloids (As, Pb andSb) were the main variables that divided treatments in 3groups: Group 1: acid/high metal/metalloid concentrations,Group 2: neutral/intermediate metal/metalloid concentra-tions, and Group 3: neutral to alkaline/low metal/metalloidconcentrations.
223J O U R N A L O F E N V I R O N M E N T A L S C I E N C E S 4 2 ( 2 0 1 5 ) 2 1 5 – 2 2 6
deformed valves in a total of 16% of E. exigua; and 2.5%deformed valves in a total of 11% of E. exigua. In site BM theyonly appeared in one sample (1% deformed valves in total of8.5% of E. exigua).
5 µm
a b c d e
fg
h i j
Fig. 7 – Light micrographs of Eunotia exigua: normal (a–e) andteratological valves (f–j) from a population of site AF. AF:Água Forte.
4. Discussion
The influence of rainfall events on the hydrogeochemicalparameters of waters affected by AMD such as those fromGroup 1 is well known and reported elsewhere (e.g., Nordstrom,2009). Usually, in the driest periods, the acid mine watersbecome oversaturated in SO4, allowing the precipitation ofsulfates, which retain metals/metalloids in their structure orreactive surface. By contrast, after these driest periods, the firstrainfalls rapidly dissolve the sulfates and consequently adecrease in pH and an increase in metal/metalloid concentra-tions in waters are observed. Thus, the acid mine waters arehighly influenced by the precipitation–dissolution cycles ofthese efflorescent phases. With continued rainfall, the dilutioneffects prevailed and pH tended to increase, whereas metal/metalloid concentrations decreased.
The weather conditions during some of the samplingcampaigns were very atypical. The treatment of the watersand diatoms data by sampling periods was not informative,since no significant changes on chemical concentrations anddiatom communities were verified among seasons. The factthat spatial variation was much more important thanseasonality in each site made it possible to analyze diatomcommunities from different seasons together. This phenom-enon was also pointed out by Luís et al. (2009).
The conductivity in Groups 2 and 3 (with circumneutral pHvalues) showed an unexpected increase, explained by thehigh concentrations of Cl and non-metallic salts. This can beassociated with some disseminated chlorides from Cenozoicsediment layers. Contribution of Cl from addition of fertilizersor pesticides to waters due to the significant agriculturalpractices in the surrounding area was ruled out, since noassociation of NO3 and P with Cl was observed. A highvariability in the amounts of NO3 and P was also verified inthe sites from Group 3.
Additionally, the high concentrations of Mn in sedimentsof this group could be associated with the geological forma-tion overlying the Volcano-Sedimentary Complex, composedmainly by schists where some Mn mineralizations occur.
Seasonal variations in dams were more complicated toevaluate due to the confinement of water bodies and theconstant anthropic interventions through addition of correc-tives in order to increase pH. Despite the existence ofcontaminated (Group 1) and uncontaminated (Group 3) damschemically similar to contaminated and uncontaminatedstreams, the diatom communities from dams were mainlycomposed by planktonic species instead of benthic commu-nities as in streams, thus were not considered for this work.
It was interesting to note the existence of the same 3 groupassociation, whether through geochemical data analysis or byits combination with diatom data analysis.
A first group (Group 1) was formed by impacted samplesfrom Água Forte and Água Azeda streams with sulfated, highto extreme metal/metalloid concentrations and low pHwaters, dominated by P. aljustrelica, E. exigua and Nitzschia aff.hantzschiana. The high concentrations of metals/metalloidsand extremely low pH (1.9–2.2) in MR and BE sites limited thediversity of diatom communities. Minimum photosyntheticproductivity in AMD waters is most likely due to metal stress

224 J O U R N A L O F E N V I R O N M E N T A L S C I E N C E S 4 2 ( 2 0 1 5 ) 2 1 5 – 2 2 6
(Niyogi et al., 2002) or low soluble reactive phosphateconcentrations (Spijkerman et al., 2007). However, low pHitself does not reduce photosynthetic activity (Gyure et al.,1987). A few adapted species can live in these extremeconditions (e.g., P. aljustrelica) as reported by Luís et al.(2012). It is common for AMD-affected streams to beoversaturated with silica resulting from silicate dissolution,which can contribute to the success of this species inAMD-impacted streams by reinforcing the frustule(diatomaceous exoskeleton). In addition, the resistanceof algae to high heavy metal concentrations can resultin limited intracellular transport of metals at low pH(e.g., Skowroński et al., 1991). Some eukaryotic algae possessan effective mechanism of heavy metal detoxificationthrough formation of thiol oligopeptides such as glutathioneand phytochelatins (e.g., Pawlik-Skowrońska, 2003).
On the other hand, the occurrence of teratologies (frustuledeformations) can be associated with weak silicification of theindividuals. Fisher et al. (1981) proposed that metals such asCumight bind to sulfhydryl groups of diatom cell membranes,reducing silica uptake and therefore mimicking the conditionof silica limitation. E. exigua occurred also in AMD impactedsites (site AF), but in pH ranging from 2.8 to 3.3 (not as low asthe pH of the sites where P. aljustrelica was found) and withless metal content in the bioavailable fraction of the sedi-ments. This may indicate that metals/metalloids were alreadydissolved in the waters, being easily absorbed by organisms(e.g., Newman and McIntosh, 1989). This is reinforced by thefact that in these conditions, metals/metalloids were mainlyfound in free ionic forms (Men+), easily absorbed by diatoms.Another explanation for this phenomenon is the precipitationof ferric hydroxide on the sediments (evident at site AF with E.exigua teratologies and pH around 3) that blocks sunlight andcovers the stream bed with a thick red blanket called “yellowboy” (Chon and Hwang, 2000), limiting photosynthesis andcausing the occurrence of teratologies. The bibliographycorroborates both of these findings (low silicification offrustule due to metal uptake and binding and low photosyn-thetic activity due to low light availability caused by sedimentoxy-hydroxide coatings) since teratologies of E. exigua show-ing abnormal valve outlines were found close to a highly acid(pH 2.4) coppermine (Barber and Carter, 1981) and also in siteswith pH levels down to 2.2 (DeNicola, 2000).
However, in this study, the low number of samples withteratological forms did not allow the establishment of goodcorrelations between metals/pH and teratological forms suchas in Luís et al. (2011). Ecologically, E. exigua is an acidobiontictaxon, one of the most widespread species reported fromEurope in lakes receiving AMD (Lessmann et al., 2000), and ithas been found in AMDwaters from Río Tinto (Urrea-Clos andSabater, 2009) and from the Aljustrel area (Luís et al., 2009,2011).
Along a decreasing metal gradient and an increasing pHgradient, a transitional group (Group 2) formed by sites ofstreams located after the confluence of the two acidic streams(Água Azeda and Água Forte) with themain stream (Roxo) wasidentified. What clearly distinguishes this group from Group 1is the alteration in diatom community composition, domi-nated by B. neglectissima and A. minutissimum and the absenceof teratological diatom forms.
A third group (Group 3), composed by sites from Roxostream and its unimpacted tributaries, with low metalcontents and high pH, was intentionally selected as areference group, dominated by N. veneta, A. minutissimum, N.gregaria, and N. desertorum. This group also revealed atypicalcharacteristics like the high conductivities caused by highvalues of Cl and consequently the dominance of diatomspecies (e.g., N. desertorum and Entomoneis paludosa (W. Smith)Reimer) typical from brackish to marine waters.
An important taxon from Groups 2 and 3 was A.minutissimum, which is referenced among the most metaltolerant diatom species (e.g., Falasco et al., 2009), being perfectlyadapted to low AMD waters, and not showing teratologies.
Whichever the explanation is for the morphologicalalterations, these changes are a symptom of a disorder thatcan represent the price for tolerance to some stressfulenvironmental factors, which in the present study we believeare the high metal/metalloid concentrations associated withlow pH. These types of alterations have been observedfrequently in acidic media and/or those impacted by heavymetals, suggesting the existence of biological stress (Luís etal., 2011).
5. Conclusions
In this study, the geochemical conditions of the Aljustrelmining area were evaluated and integrated with biologicalfactors related to the diatom communities.
The selection of AMD-impacted and unimpacted sitesshowed a close association with diatom species. These siteswere divided in 3 groups: a group corresponding to the mostimpacted sites; another with the unimpacted sites; and atransitional group, characterized by slightly impacted sites.
The high pH gradient (from 1.9 to 8.5) along the samplingarea seemed to condition the diatom species, which shiftedfrom acidobiontic to circumneutral. However, the metals/metalloids appeared to be largely responsible for the reduc-tion of diatom abundances as well as for the emergence ofteratologies in the communities. Since AMD is composed of amixture of several metals/metalloids, it was not possible todistinguish which metal(s)/metalloid(s) had the major nega-tive impact on diatoms. Other factors, such as salineconditions, allowed the colonization by species that usuallyappear in brackish or marine environments. In sites withhigh concentrations of Cl ion, and despite their significantcontamination by metals/metalloids (e.g., Mn), teratologiesdid not occur because saline conditions did not allowthe presence of species that normally exhibit teratologies(e.g., E. exigua).
Therefore, in environmental contexts as complex as this,with strong chemical variations in short periods of time,diatoms arise as important bioindicators to assess geochem-ical changes, due to their short generation time. However,their analysis must necessarily be carried out with consider-ation of several geochemical data in addition to pH andmetals/metalloids. New studies are now being developed byour group to weight factors for each component in order todevelop a model/index, similar to what is already done inother types of impairments, like organic, and nutrient

225J O U R N A L O F E N V I R O N M E N T A L S C I E N C E S 4 2 ( 2 0 1 5 ) 2 1 5 – 2 2 6
contamination, but applicable to these environments as aquality parameter to evaluate the contamination degree, andalso to understand which factors mostly affect the abundanceand occurrence of teratologies in diatom communities.
Acknowledgments
The authors are grateful to the Biology and GeosciencesDepartments of the University of Aveiro, Portugal and to theFundação para a Ciência e a Tecnologia, Portugal (grantnumber SFRH/BD/36137/2007).
R E F E R E N C E S
Barber, H.G., Carter, J.R., 1981. Observations on some deformitiesfound in British diatoms. Microscopy 34, 214–226.
Cardoso Fonseca, E., Ferreira da Silva, E., 1998. Application ofselective extraction techniques in metal-bearing phasesidentification: a South European case study. J. Geochem.Explor. 61, 203–212.
Cattaneo, A., Couillard, Y., Wunsam, S., Courcelles, M., 2004.Diatom taxonomic andmorphological changes as indicators ofmetal pollution and recovery in LacDufault (Québec, Canada).J. Paleolimnol. 32, 163–175.
Chon, H.T., Hwang, J.H., 2000. Geochemical characteristics of theacid mine drainage in the water system in the vicinity of theDogye coal mine in Korea. Environ. Geochem. Health 22,155–172.
DeNicola, D.M., 2000. A review of diatoms found in highly acidicenvironments. Hydrobiologia 433, 111–122.
Dragisic, V., Vrvic, M., Milenic, D., Miladinovic, B., 1999. Minewaters and waters of copper deposit tailing disposals of Serbiaand environmental protection. Hydrogeochemical Aspect.Mine, Water & Environment, IMWA Congress. Sevilla, Spain,pp. 527–533.
Falasco, E., Bona, F., Badino, G., Hoffmann, L., Ector, L., 2009.Diatom teratological forms and environmental alterations: areview. Hydrobiologia 623, 1–35.
Ferreira da Silva, E., Almeida, S.F.P., Nunes, M.L., Luís, A.T., Borg,F., Hedlund, M., et al., 2009. Heavymetal pollution downstreamthe abandoned Coval da Mó mine (Portugal) and associatedeffects on epilithic diatom communities. Sci. Total Environ.407, 5620–5636.
Filgueiras, A.V., Lavilla, I., Bendicho, C., 2002. Chemical sequentialextraction for metal partitioning in environmental solidsamples. J. Environ. Monit. 4, 823–857.
Fisher, N.S., Jones, G.J., Nelson, D.M., 1981. Effects of copper andzinc on growth, morphology and metabolism of Asterionellajaponica (Cleve). J. Exp. Mar. Biol. Ecol. 51, 37–56.
Gross, W., 2000. Ecophysiology of algae living in highly acidicenvironments. Hydrobiologia 433, 31–37.
Gyure, R.A., Konopa, A., Brooks, A., Doemel, W., 1987. Algal andbacterial activities in acidic (pH 3) strip mine lakes. Appl.Environ. Microbiol. 53 (9), 2069–2076.
Hirst, H., Chaud, F., Delabie, C., Jüttner, I., Ormerod, S.J., 2004.Assessing the short-term response of stream diatoms toacidity using inter-basin transplantation and chemicaldiffusing substrates. Freshw. Biol. 49 (8), 1072–1088.
Krammer, K., Lange-Bertalot, H., 1986. Süßwasserflora vonMitteleuropa, Bacillariophyceae. Naviculaceae. vol. 1. GustavFischer Verlag, Stuttgart, Germany, p. 876.
Krammer, K., Lange-Bertalot, H., 1988. Süßwasserflora vonMitteleuropa, Bacillariophyceae. Bacillariaceae,
Epithemiaceae, Surirellacea. vol. 2. Gustav Fischer Verlag,Stuttgart, Germany, p. 596.
Krammer, K., Lange-Bertalot, H., 1991 aa. Süßwasserflora vonMitteleuropa, Bacillariophyceae. Centrales, Fragilariaceae,Eunoticeae. vol. 3. Gustav Fischer Verlag, Stuttgart, Germany,p. 577.
Krammer, K., Lange-Bertalot, H., 1991 bb. Süßwasserflora vonMitteleuropa, Bacillariophyceae. Achnanthaceae, KristischeErgänzungen zu Navicula (Lineolatae) und GomphonemaGesamtliteraturverzeichnis. vol. 4. Gustav Fischer Verlag,Stuttgart, Germany, p. 437.
Lessmann, D., Fyson, A., Nixdorf, B., 2000. Phytoplankton of theextremely acidic mining lakes of Lusatia (Germany) withpH < 3. Hydrobiologia 433, 123–128.
Luís, A.T., Teixeira, P., Almeida, S.F.P., Ector, L., Matos, J.X., Ferreirada Silva, E.A., 2009. Impact of acid mine drainage (AMD) onwater quality, stream sediments and periphytic diatomcommunities in the surrounding streams of Aljustrel miningarea (Portugal). Water Air Soil Pollut. 200, 147–167.
Luís, A.T., Teixeira, P., Almeida, S.F.P., Matos, J.X., Ferreira da Silva,E., 2011. Environmental impact of mining activities in theLousal area (Portugal): chemical and diatom characterizationof metal-contaminated stream sediments and surface water ofCorona stream. Sci. Total Environ. 409, 4312–4325.
Luís, A.T., Novais, M.H., Van de Vijver, B., Almeida, S.F.P., Ferreirada Silva, E.A., Hoffmann, L., et al., 2012. Pinnularia aljustrelica sp.nov. (Bacillariophyceae), a new diatom species found in acidicwaters in the Aljustrel mining area (Portugal) and furtherobservations on the taxonomy and ecology of P. acidophilaHofmann et Krammer and P. acoricola Hustedt. Fottea 12 (1),27–40.
Matos, J.X., Martins, L.P., 2006. Reabilitação ambiental de áreasmineiras do sector português da Faixa Piritosa Ibérica: estadoda arte e prespectivas futuras. Bol. Geol. Min. 117 (2), 289–304.
Medley, C.N., Clements, W.H., 1998. Responses of diatomcommunities to heavy metals in streams: the influence oflongitudinal variation. Ecol. Appl. 8, 631–644.
Newman, M.C., McIntosh, A.W., 1989. Appropriateness of Aufwuchsas a monitor of bioaccumulation. Environ. Pollut. 60, 83–100.
Niyogi, D.K., Lewis Jr., W.M., McKnight, D.M., 2002. Effects of stressfrom mine drainage on diversity, biomass, and function ofprimary producers inmountain streams. Ecosystems 5, 554–567.
Nordstrom, D.K., 2009. Acid rock drainage and climate change.J. Geochem. Explor. 100, 97–104.
Parkhurst, D.L., Appelo, C.A.J., 2013. Description of input andexamples for PHREEQC version 3-A computer program forspeciation, batch-reaction, one-dimensional transport, andinverse geochemical calculations. U.S. Geological Survey,Techniques and Methods, book 6, chap. A43p. 497.
Pawlik-Skowrońska, B., 2003. Resistance, accumulation andallocation of zinc in two ecotypes of the green algaStigeoclonium tenue Kütz. coming from habitats of differentheavy metal concentrations. Aquat. Bot. 75, 189–198.
Perrein-Ettajani, H., Amiard, J.C., Haure, J., Renaud, C., 1999.Effects of metals (Ag, Cd, Cu) on the biochemical compositionand compartmentalization of these metals in two microalgaeSkeletonema costatum and Tetraselmis suecica. Can. J. Fish. Aquat.Sci. 56 (10), 1757–1765.
Prygiel, J., Coste, M., 2000. Guide Méthodologique pour la mise enoeuvre de l'Indice Biologique Diatomées NF T 90-354, France.p. 134.
Quevauviller, P., Rauret, G., Muntuau, H., Ure, A.M., Rubio, R.,López-Sánchez, J.F., et al., 1998. Chemical Elements in theEnvironment—Factsheets for the Geochemist andEnvironmental Scientist. Springer–Verlag, Berlin, Germany3-540-63670-6, p. 398.
Schermerhorn, L.J.G., 1971. An outline stratigraphy of the IberianPyrite Belt. Boletín Geológico y Minero de España. 82pp. 238–268.

226 J O U R N A L O F E N V I R O N M E N T A L S C I E N C E S 4 2 ( 2 0 1 5 ) 2 1 5 – 2 2 6
Skowroński, T., Szubińska, S., Pawlik, B., Jakubowski, M., Bilewicz,R., Cukrowska, E., 1991. The influence of pH on cadmiumtoxicity to the green alga Stichococcus bacillaris and on thecadmium forms present in the culture medium. Environ.Pollut. 74, 89–100.
Spijkerman, E., Barua, D., Gerloff-Elias, A., Kern, J., Gaedke, U.,Heckathorn, S.A., 2007. Stress responses and metal toleranceof Chlamydomonas acidophila in metal enriched lake water andartificial medium. Extremophiles 11, 551–562.
Tessier, A., Campbell, P.G.C., Bisson, M., 1979. Sequentialextraction procedure for the speciation of particulate tracemetals. Anal. Chem. 51, 844–851.
Urrea-Clos, G., Sabater, S., 2009. Comparative study of algalcommunities in acid and alkaline waters from Tinto, Odiel andPiedras river basins (SW Spain). Limnetica 28 (2), 261–272.
J O U R N A L O F E N V I R O N M E N T A L S C I E N C E S 4 2 ( 2 0 1 6 ) 2 2 7 – 2 3 5
Ava i l ab l e on l i ne a t www.sc i enced i r ec t . com
ScienceDirect
www. jou rna l s . e l sev i e r . com/ j es
Investigation of colloidal biogenic sulfur flocculation:Optimization using response surface analysis
Fan Chen1, Ye Yuan1, Chuan Chen1, Youkang Zhao1, Wenbo Tan1, Cong Huang1,Xijun Xu1, Aijie Wang1,2,⁎
1. State Key Laboratory of Urban Water Resource and Environment, Harbin Institute of Technology, Harbin 150090, China. E-mail:[email protected]. Key Laboratory of Environmental Biotechnology, Research Center for Eco-Environmental Sciences, Chinese Academy of Sciences, China
A R T I C L E I N F O
⁎ Corresponding author. E-mail: ajwang@rcee
http://dx.doi.org/10.1016/j.jes.2015.07.0071001-0742/© 2015 The Research Center for Ec
A B S T R A C T
Article history:Received 7 May 2015Revised 31 July 2015Accepted 3 August 2015Available online 11 September 2015
The colloidal properties of biogenic elemental sulfur (S0) cause solid–liquid separationproblems, such as poor settling and membrane fouling. In this study, the separation of S0
from bulk liquids was performed using flocculation. Polyaluminum chloride (PAC),polyacrylamide (PAM) and microbial flocculant (MBF) were compared to investigate theirabilities to flocculate S0 produced during the treatment of sulfate-containing wastewater. Anovel approach with response surface methodology (RSM) was employed to evaluate theeffects and interactions of flocculant dose, pH and stirring intensity, on the treatmentefficiency in terms of the S0 flocculation and the supernatant turbidity removal. The doseoptimization results indicated that the S0 flocculation efficiency decreased in the followingorder PAC > MBF > PAM. Optimum S0 flocculation conditions were observed at pH 4.73, astirring speed of 129 r/min and a flocculant dose of 2.42 mg PAC/mg S. During optimumflocculation conditions, the S0 flocculation rate reached 97.53%. Confirmation experimentsdemonstrated that employing PAC for S0 flocculation is feasible and RSM is an efficientapproach for optimizing the process of S0 flocculation. The results provide basic parametersand conditions for recovering sulfur during the treatment of sulfate-laden wastewaters.© 2015 The Research Center for Eco-Environmental Sciences, Chinese Academy of Sciences.
Published by Elsevier B.V.
Keywords:Elemental sulfurFlocculationOptimizationResponse surface methodology (RSM)
Introduction
Sulfate-laden wastewaters are produced by pharmaceuticalenterprises, pulp and paper manufacturers, petrochemicalplants, mineral processes and acid mine drainage resultingfrom mining activities (Knobel and Lewis, 2002). In anaerobicenvironments, sulfate can be converted into sulfide, such asH2S, which is corrosive to metals and toxic to living species(Celis-García et al., 2008). Biological processes for treatingsulfate-laden wastewater mainly include two processes, thereduction of sulfate to sulfide by sulfate-reducing bacteria andthe oxidation of sulfide to sulfur (S0) by sulfide oxidation
s.ac.cn (Aijie Wang).
o-Environmental Science
bacteria (Wang et al., 2005). Yuan et al. (2014a) developed anintegrated reactor system for the simultaneous removal ofCOD, sulfate and ammonium (Integrated C–S–N removalsystem).
The S0 reclaimed from sulfate-laden wastewaters can berecovered as a renewable resource for sulfuric acid produc-tion, fertilizer industries, and as a substrate for bioleachingprocesses (Celis-García et al., 2008). S0-containing effluentsare stable suspensions containing biogenic sulfur colloids thatare either largely associated with biomass or cannot beisolated from the suspension because their particle size istoo small (Schlegel, 1989; Janssen et al., 1994; Sahinkaya et al.,
s, Chinese Academy of Sciences. Published by Elsevier B.V.

228 J O U R N A L O F E N V I R O N M E N T A L S C I E N C E S 4 2 ( 2 0 1 6 ) 2 2 7 – 2 3 5
2011; Yuan et al., 2014b). However, the excessive accumula-tion of biogenic sulfur without efficient isolationmay result inpipe blockage (Beristain-Cardoso et al., 2008; Fortuny et al.,2010) and secondary pollution (Hao et al., 2006). Thus, a highlyeffective biogenic sulfur isolation step is essential for thesuccessful application of the biological process.
Many researchers have studied biogenic sulfur isolationprocesses based on the surface characteristics and aggrega-tion of biogenic sulfur (Yuan et al., 2014b; Janssen et al., 1994;Li et al., 2000, 2006). For example, Li et al. (2000) used the sandfiltration–extraction–distillation process and Paques (Holland)developed an air flotation process to separate biogenic sulfur(Cao et al., 2002). In comparison with separation processessuch as filtration, extraction and flotation, the plain sedimen-tation of sulfur particles is the cheapest and most attractivemethod (Janssen et al., 1996), while flocculation and sedimen-tation can achieve more efficient biogenic sulfur separation(Yuan et al., 2014b).
In the flocculation process, the efficiency is governed byvarious factors, such as the type and dosage of flocculant, pH,mixing speed and time, temperature and retention time(Wang et al., 2011). A proper optimization of these factorscould significantly increase its treatment efficiency. Responsesurface methodology (RSM) is an efficient way to achieve suchan optimization by analyzing and modeling the effects ofmultiple variables and their responses and finally optimizingthe process. This method has been widely used for theoptimization of various processes in food chemistry, materialscience, chemical engineering and biotechnology (Wang et al.,2011). Córdova et al. (2011), Kiran and Thanasekaran (2011),and Özer et al. (2008) studied the biosorption of lead, copperand nickel on Aspergillus terreus, Lyngbya putealis andEnteromorpha prolifera, respectively, using response surfacemethodology. Zheng et al. (2014) investigated the optimiza-tion of the flocculation process using RSM for diethylphthalate removal with anionic polyacrylamide. Jadhav andMahajan (2014) successfully applied RSM in water/wastewatertreatment using Coccinia indica and found that RSM is a highlyeffective tool for optimizing the flocculation process.
Themain objective of this work was to separate S0 using theflocculation process, which was optimized using RSM. Removalefficiencies of both S0 and supernatant turbiditywere chosen asthe dependent output variables. The novel optimization strat-egy used for S0 flocculation in this study is expected to providebasic parameters and conditions for recovering sulfur duringthe treatment of sulfate-laden wastewaters.
Fig. 1 – S0-containing effluent.
1. Materials and methods
1.1. Integrated C–S–N removal system and effluent
The integrated C–S–N removal system modified from Yuanet al. (2014a) was used to produce S0-containing effluent.The plexiglass expanded granular sludge blanket reactorwas a modified version of the reactor developed by Chenet al. (2008). The reactor was kept at 30 ± 1°C. The composi-tions of the medium and the micronutrients were describedby Yuan et al. (2014a). An internally circulating fluid withreflux ratio of 6:1 was used to suspend granules in the
reactor. Adding 1.6 kg TOC/(m3·day), 1 kg SO42−/(m3·day), and
0.6 kg N/(m3·day), respectively, resulted in nearly completeconversion of sulfate, nitrate and TOC to S0, N2 and CO2. Theeffluent from the denitrifying sulfide removal unit (Fig. 1)was a milky white suspension with a turbidity of 350 ± 25nephelometric turbidity units (NTU) and a pH of 9.80 ± 0.20.The zeta potentials of the suspended particles in the S0-containing effluent were −19.6 ± 1.4 mV, and the S0 concen-tration was between 100 and 120 mg/L.
1.2. Preparation of flocculant
Flocculants are classified as inorganic flocculants, such aspolyaluminum chloride (PAC), synthetic organic flocculants,such as polyacrylamide (PAM) derivatives, and natural occur-ring flocculants, such as microbial flocculant (MBF) andchitosan (Bezawada et al., 2013; Prazeres et al., 2013; Riaño andGarcía-González, 2014). Chemical flocculants are commonlyused in water and wastewater treatment industries because oftheir cost-effectiveness and efficient flocculation abilities (Moreet al., 2014). Bioflocculants have attracted research and industryinterest as alternative flocculants due to their high flocculationperformance, ecofriendliness, and biodegradability (Aljuboori etal., 2013, 2014; Bezawada et al., 2013). Therefore, PAC, PAM andMBF were chosen in this study. Moreover, because biogenicsulfur colloids carry a negative charge, cationic polyacrylamidewas used to separate biogenic sulfur. PAC and PAM, purchasedfrom Tianjin Chemical Reagent Co., China, were of analyticalreagent grade and used without further purification. MBF wasproduced by themixed culture of F2 and F6 with the proportionof 1:1 at the following fermentation conditions: fermentationtime of 24 hr, temperature of 30°C, rotation speed of 150 r/min(Zhu et al., 2006). Strain F2 and F6 are Bacillus sp.
1.3. Batch flocculation studies
Batch flocculation experiments were performed in 500 mLbeakers containing 300 mL S0-containing effluent mixed with
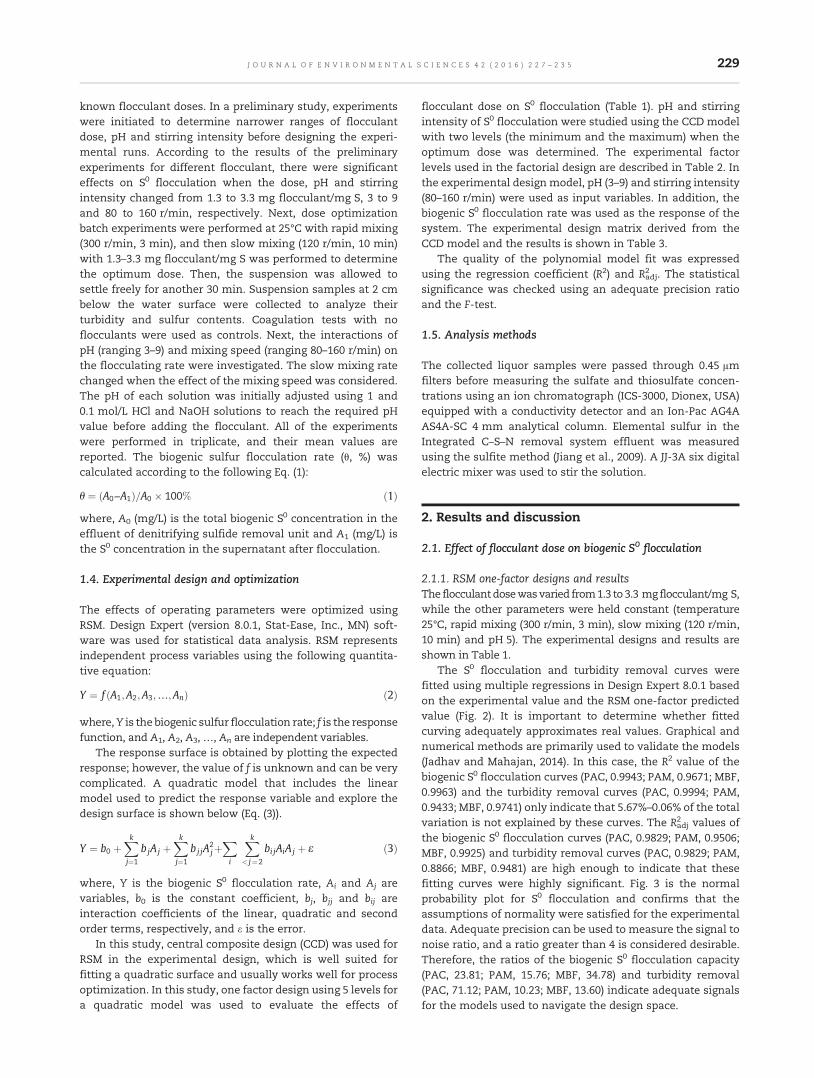
229J O U R N A L O F E N V I R O N M E N T A L S C I E N C E S 4 2 ( 2 0 1 6 ) 2 2 7 – 2 3 5
known flocculant doses. In a preliminary study, experimentswere initiated to determine narrower ranges of flocculantdose, pH and stirring intensity before designing the experi-mental runs. According to the results of the preliminaryexperiments for different flocculant, there were significanteffects on S0 flocculation when the dose, pH and stirringintensity changed from 1.3 to 3.3 mg flocculant/mg S, 3 to 9and 80 to 160 r/min, respectively. Next, dose optimizationbatch experiments were performed at 25°C with rapid mixing(300 r/min, 3 min), and then slow mixing (120 r/min, 10 min)with 1.3–3.3 mg flocculant/mg S was performed to determinethe optimum dose. Then, the suspension was allowed tosettle freely for another 30 min. Suspension samples at 2 cmbelow the water surface were collected to analyze theirturbidity and sulfur contents. Coagulation tests with noflocculants were used as controls. Next, the interactions ofpH (ranging 3–9) and mixing speed (ranging 80–160 r/min) onthe flocculating rate were investigated. The slow mixing ratechanged when the effect of the mixing speed was considered.The pH of each solution was initially adjusted using 1 and0.1 mol/L HCl and NaOH solutions to reach the required pHvalue before adding the flocculant. All of the experimentswere performed in triplicate, and their mean values arereported. The biogenic sulfur flocculation rate (θ, %) wascalculated according to the following Eq. (1):
θ ¼ A0−A1ð Þ=A0 � 100% ð1Þwhere, A0 (mg/L) is the total biogenic S0 concentration in theeffluent of denitrifying sulfide removal unit and A1 (mg/L) isthe S0 concentration in the supernatant after flocculation.
1.4. Experimental design and optimization
The effects of operating parameters were optimized usingRSM. Design Expert (version 8.0.1, Stat-Ease, Inc., MN) soft-ware was used for statistical data analysis. RSM representsindependent process variables using the following quantita-tive equation:
Y ¼ f A1;A2;A3;…;Anð Þ ð2Þ
where,Y is the biogenic sulfur flocculation rate; f is the responsefunction, and A1, A2, A3, …, An are independent variables.
The response surface is obtained by plotting the expectedresponse; however, the value of f is unknown and can be verycomplicated. A quadratic model that includes the linearmodel used to predict the response variable and explore thedesign surface is shown below (Eq. (3)).
Y ¼ b0 þXk
j¼1
bjAj þXk
j¼1
bj jA2jþ
X
i
Xk
< j¼2
bi jAiA j þ ε ð3Þ
where, Y is the biogenic S0 flocculation rate, Ai and Aj arevariables, b0 is the constant coefficient, bj, bjj and bij areinteraction coefficients of the linear, quadratic and secondorder terms, respectively, and ε is the error.
In this study, central composite design (CCD) was used forRSM in the experimental design, which is well suited forfitting a quadratic surface and usually works well for processoptimization. In this study, one factor design using 5 levels fora quadratic model was used to evaluate the effects of
flocculant dose on S0 flocculation (Table 1). pH and stirringintensity of S0 flocculation were studied using the CCD modelwith two levels (the minimum and the maximum) when theoptimum dose was determined. The experimental factorlevels used in the factorial design are described in Table 2. Inthe experimental designmodel, pH (3–9) and stirring intensity(80–160 r/min) were used as input variables. In addition, thebiogenic S0 flocculation rate was used as the response of thesystem. The experimental design matrix derived from theCCD model and the results is shown in Table 3.
The quality of the polynomial model fit was expressedusing the regression coefficient (R2) and Radj
2 . The statisticalsignificance was checked using an adequate precision ratioand the F-test.
1.5. Analysis methods
The collected liquor samples were passed through 0.45 μmfilters before measuring the sulfate and thiosulfate concen-trations using an ion chromatograph (ICS-3000, Dionex, USA)equipped with a conductivity detector and an Ion-Pac AG4AAS4A-SC 4 mm analytical column. Elemental sulfur in theIntegrated C–S–N removal system effluent was measuredusing the sulfite method (Jiang et al., 2009). A JJ-3A six digitalelectric mixer was used to stir the solution.
2. Results and discussion
2.1. Effect of flocculant dose on biogenic S0 flocculation
2.1.1. RSM one-factor designs and resultsThe flocculantdosewasvaried from1.3 to 3.3 mg flocculant/mg S,while the other parameters were held constant (temperature25°C, rapid mixing (300 r/min, 3 min), slow mixing (120 r/min,10 min) and pH 5). The experimental designs and results areshown in Table 1.
The S0 flocculation and turbidity removal curves werefitted using multiple regressions in Design Expert 8.0.1 basedon the experimental value and the RSM one-factor predictedvalue (Fig. 2). It is important to determine whether fittedcurving adequately approximates real values. Graphical andnumerical methods are primarily used to validate the models(Jadhav and Mahajan, 2014). In this case, the R2 value of thebiogenic S0 flocculation curves (PAC, 0.9943; PAM, 0.9671; MBF,0.9963) and the turbidity removal curves (PAC, 0.9994; PAM,0.9433; MBF, 0.9741) only indicate that 5.67%–0.06% of the totalvariation is not explained by these curves. The Radj
2 values ofthe biogenic S0 flocculation curves (PAC, 0.9829; PAM, 0.9506;MBF, 0.9925) and turbidity removal curves (PAC, 0.9829; PAM,0.8866; MBF, 0.9481) are high enough to indicate that thesefitting curves were highly significant. Fig. 3 is the normalprobability plot for S0 flocculation and confirms that theassumptions of normality were satisfied for the experimentaldata. Adequate precision can be used to measure the signal tonoise ratio, and a ratio greater than 4 is considered desirable.Therefore, the ratios of the biogenic S0 flocculation capacity(PAC, 23.81; PAM, 15.76; MBF, 34.78) and turbidity removal(PAC, 71.12; PAM, 10.23; MBF, 13.60) indicate adequate signalsfor the models used to navigate the design space.

Table 1 – Experimental design and flocculant dose optimization results.
Experimentalrun
Flocculant dose(mg flocculant/mg S)
Biogenic S0 flocculation rate (%) Turbidity removal (%)
PAC PAM MBF PAC PAM MBF
1 2.80 (05.) 81 14 76 82 23 402 3.30 (1.0) 75 11 67 70 28 433 2.30(0.0) 86 13 75 88 35 484 3.30 (1.0) 77 12 69 71 27 445 1.30 (−1.0) 63 2 6 45 18 306 1.30 (−1.0) 64 3 8 46 22 327 1.80 (−0.5) 70 7 64 53 36 46
S0: elemental sulfur; PAC: polyaluminum chloride; PAM: polyacrylamide; MBF: microbial flocculant.
Table 3 – Experimental design and biogenic S0
flocculation parameter results.
Run pH Stirringintensity(r/min)
Biogenic S0
flocculation rate(%)
Turbidity removal(%)
PAC PAM MBF PAC PAM MBF
1 3 80 44.2 5.3 26.7 43.4 14.6 26.32 9 80 20.6 3.2 15.9 19.8 10.6 16.13 3 160 71.5 9.1 41.5 68.1 16.4 44.94 9 160 21.5 4.3 18.6 23.7 12.5 17.85 3 120 87.3 10.4 66.2 85.2 18.5 61.4
230 J O U R N A L O F E N V I R O N M E N T A L S C I E N C E S 4 2 ( 2 0 1 6 ) 2 2 7 – 2 3 5
2.1.2. Biogenic S0 flocculation and turbidity removal analysisThe effects of flocculant dose on the S0 flocculation rate byPAC, PAM and MBF are shown in Fig. 2, which also shows thatPAC and MBF were more effective than PAM for S0 floccula-tion. The S0 flocculation capacity of PAC increased up to 2.30–2.80 mg PAC/mg S, and the S0 flocculation rate reached 81%–86% before decreasing as the PAC dose increased. The S0
flocculation capacity of PAM gradually increased to 13%–14%as the PAM dose increased to 2.3–2.8 mg PAM/mg S, and thenremained relatively constant. Compared with PAC and PAM,the effects of the MBF dose on the S0 flocculation rate wereobviously different. The S0 flocculation rate rapidly increasedfrom 1.3 to 1.8 mg MBF/mg S before gradually increasing asthe MBF dose increased to 2.3–2.8 mg MBF/mg S, reaching aflocculation rate of 75%–76% S0. Above 2.3–2.8 mg MBF/mg S,the S0 flocculation capacity of MBF remained stable. Theseresults indicated that excessive flocculant doses resulted incolloidal restabilization, while low doses were insufficient fordestabilizing the aggregates in most of the biogenic S0 colloidsin the effluent, and the both excessive and low doses resultedin low flocculation rates.
Turbidity depends on the degree of water purification andis an important index for evaluating the effects of biogenicsulfur flocculation. The turbidity removal showed trendssimilar to those of S0 flocculation (Fig. 2). The turbiditydecreased as the PAC dose increased to 1.3–1.5 mg PAC/mg Sand increased when greater PAC doses were used. Maximumturbidity removal occurred at 2.3–2.8 mg PAC/mg S, whichcorresponded to a turbidity removal of approximately 82%–88%, and then decreased as the PAC dosage increased. Theremoval of turbidity did not significantly change as the MBFdose increased and fluctuated between approximately 30%–46% (Fig. 2). Meanwhile, the removal rate of turbidityfluctuated between approximately 21% and 36% as the PAMdose increased from 1.3 to 3.3 mg PAM/mg S. When theturbidity removal plateaued, the flocculant dose was approx-imately the same as that during maximum S0 flocculation.
Table 2 – Experimental factor levels used in the factorialdesign.
Factor Code Units Low Central value High
pH A −1 (3.5) 0 (5.25) 1 (7)Stirring intensity B r/min −1 (80) 0 (120) 1 (160)
S0: elemental sulfur.
Fig. 2 shows that optimum S0 biogenic flocculation pointswere observed when using PAC, PAM and MBF. The optimumdose could be obtained by parsing the flocculation curves inDesign Expert 8.0.1. The predicted optimal doses and exper-imental validation results are shown in Table 4. As shown inTable 4, the experimental values of the S0 flocculation ratereached 86.43%, 13.14% and 77.90% at 2.42 mg PAC/mg S,2.75 mg PAM/mg S and 2.38 mg MBF/mg S, respectively.
In the flocculation process, the flocculant was used toagglomerate the destabilized colloidal particles into largeparticles and then precipitates (Wang et al., 2011). The majormechanisms of flocculation of PAC were surface-chargeneutralization and bridging (Gregory, 1996). For PAC,surface-charge neutralization occurred because its chargewas opposite in sign to S0, which result in aggregation causedby specific ion absorption. For PAM, the most importantmechanism of flocculation is the polymer bridging, whichoccurs because segments of a polymer chain get absorbed onvarious particles, thus linking the particles together (Tripathyet al., 2001). Usually, PAM has good adsorption effect on thesmall destablized flocs because of the carboxylic functionalgroups and the molecular chains. But due to its microsize andzeta potential (−19.6 ± 1.4 mV), biogenic S0 exhibits colloidalproperties, hampering its adsorption with PAM. The singlePAM had low efficiency in S0 removal because there is litter
6 9 120 24.3 5.8 24.5 26.2 13.7 24.37 6 80 45.1 6.6 33.4 46.0 16.2 27.88 6 160 70.8 12.9 49.5 69.7 20.3 50.29 6 120 91.7 14.8 73.1 94.3 34.8 69.310 6 120 95.8 15.1 69.2 93.5 33.9 64.711 6 120 93.4 14.6 70.8 91.6 35.6 68.512 6 120 96.7 15.5 72.4 98.4 37.7 67.813 6 120 92.6 15.2 71.2 95.8 36.4 69.4
S0: elemental sulfur.

1.30 1.80 2.30 2.80 3.30Flocculant dose (mg PAC/mg S)
0
20
40
60
80
100
1.30 1.80 2.30 2.80 3.30Flocculant dose (mg PAM/mg S)
0
20
40
60
80
100
1.30 1.80 2.30 2.80 3.30
Flocculant dose (mg PAM/mg S)
Bio
geni
c su
lfur
flo
ccul
atio
n ra
te (
%)
Bio
geni
c su
lfur
flo
ccul
atio
n ra
te (
%)
Bio
geni
c su
lfur
flo
ccul
atio
n ra
te (
%)
0
20
40
60
80
100
1.30 1.80 2.30 2.80 3.30Flocculant dose (mg PAM/mg S)
Tur
bidi
ty r
emov
al (
%)
Tur
bidi
ty r
emov
al (
%)
Tur
bidi
ty r
emov
al (
%)
0
20
40
60
80
100
1.30 1.80 2.30 2.80 3.30Flocculant dose (mg MBF/mg S)
0
20
40
60
80
100
1.30 1.80 2.30 2.80 3.30Flocculant dose (mg MBF/mg S)
0
20
40
60
80
100
Fig. 2 – The effects of dosage on biogenic sulfur flocculation and turbidity removal.
231J O U R N A L O F E N V I R O N M E N T A L S C I E N C E S 4 2 ( 2 0 1 6 ) 2 2 7 – 2 3 5
charge on its polymer to aggregate the suspension during theprocess of flocculation (Zhang et al., 2004) and the adsorptioncapacity of PAM is not enough to destablize the colloidsystem. For MBF, the adsorption bridging and compressingthe electric double layer played the leading role in theflocculation process (Wang et al., 2015). Meanwhile, thenet-catch of MBF can promote the S0 flocculation. As a result,PAC were more effective as flocculating agents for de-stabilizing and sedimenting colloidal S0.
2.2. RSM approach for optimizing the flocculation conditions
2.2.1. Model building and data analysisIn this study, two parameters (pH and mixing speed) werestudied using a CCDmodel with two levels (the minimum andmaximum). As shown in Table 3, the S0 flocculation rate byPAC, PAM and MBF fluctuated between 21.5%–96.7%, 3.2%–15.5% and 15.9%–73.1%, respectively, in the tested pH andstirring intensity ranges. Meanwhile, 91.7%–96.7%, 14.8%–15.5% and 69.2%–73.1% S0 flocculation rates were obtained atpH 6 and at a stirring speed of 120 r/min in the PAC, PAM andMBF case, respectively. These data show that the interactionsbetween pH and the stirring intensity affected S0 flocculation.Statistical analysis of the experimental data is necessary to
Internally studentized residuals
Nor
mal
pro
babi
lity
(%)
-1.50 -1.00 -0.50 0.00 0.50 1.00 1.50
1
51020305070809095
99
Internally stud
Nor
mal
pro
babi
lity
(%)
-2.00 -1.00
1
51020305070809095
99PAC PAM
Normal plot of residuals Normal plo
Fig. 3 – The studentized residuals and normal probability plot f
establish optimal S0 flocculation conditions in the range of thestudied variables. The experimental results were evaluated,and quadratic models of the PAC and MBF flocculationcapacities for S0 were obtained using Eqs. (4)–(5), respectively.
y1 ¼ 91:32−22:77Aþ 8:98B−28:71A2−26:56B2 ð4Þ
y2 ¼ 14:67−1:92Aþ 1:87B−0:67AB−5:65A2−4:00B2 ð5Þ
y3 ¼ 69:93−12:57Aþ 5:60B−3:02AB−21:06A2−24:96B2 ð6Þ
In Eqs. (4)–(5), y1, y2 and y3 are the S0 flocculation ratesfollowing the addition of different PAC, PAM and MBF doses,respectively, and A and B correspond to the independentvariables (pH and stirring intensity).
As shown in Table 5, when “Prob > F” is less than 0.0500,the model terms are significant. In PAC case and in MBF case,the values of A, A2, and B2 were significant model terms. InPAM case, A, B, A2, B2 are significant model terms. The normalprobability and studentized residual plots are shown in Fig. 4for the flocculation of S0 by PAC, PAM and MBF, respectively.The R2 value (PAC, 93%; PAM, 96%; MBF, 95%) indicates thatthe model could explain the majority of the total variations.The experimental values correspond well with the predictedvalues for PAC, PAM and MBF. The statistical analysis results
entized residuals
0.00 1.00 2.00
Internally studentized residuals
Nor
mal
pro
babi
lity
(%)
-2.00 -1.00 0.00 1.00 2.00
1
51020305070809095
99 MBF
t of residuals Normal plot of residuals
or the effects of flocculant dose on biogenic S0 flocculation.
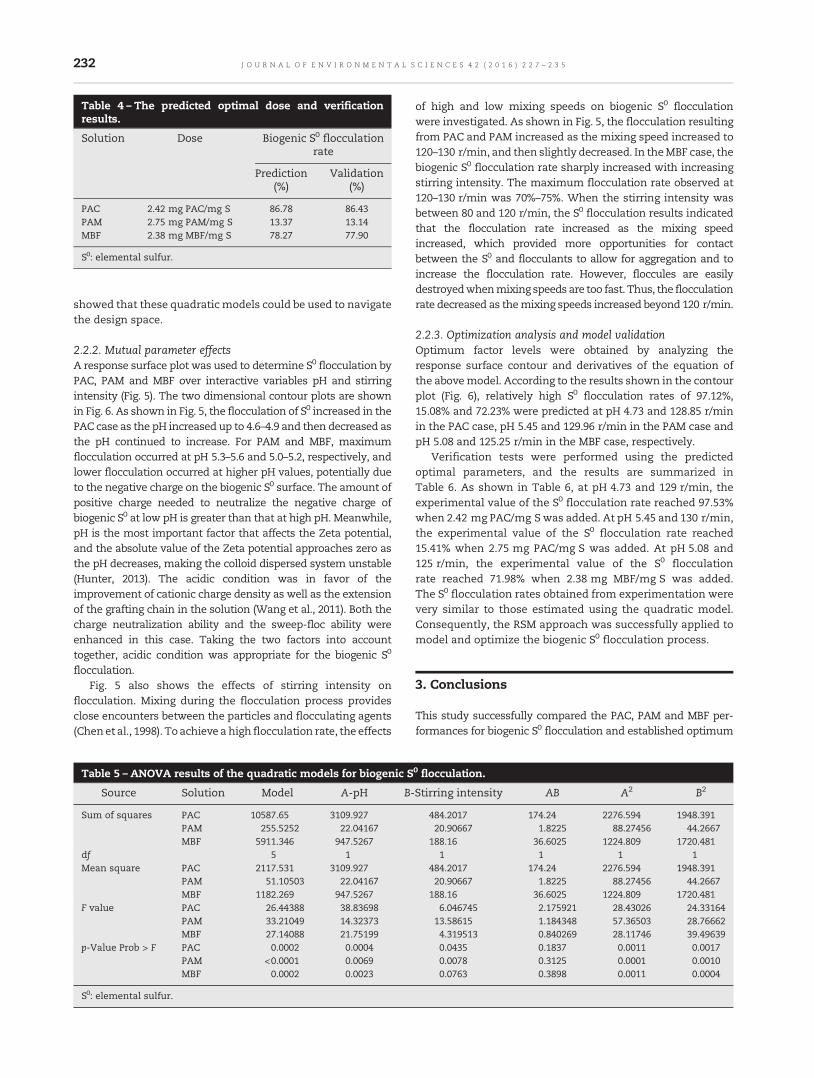
Table 4 – The predicted optimal dose and verificationresults.
Solution Dose Biogenic S0 flocculationrate
Prediction(%)
Validation(%)
PAC 2.42 mg PAC/mg S 86.78 86.43PAM 2.75 mg PAM/mg S 13.37 13.14MBF 2.38 mg MBF/mg S 78.27 77.90
S0: elemental sulfur.
232 J O U R N A L O F E N V I R O N M E N T A L S C I E N C E S 4 2 ( 2 0 1 6 ) 2 2 7 – 2 3 5
showed that these quadratic models could be used to navigatethe design space.
2.2.2. Mutual parameter effectsA response surface plot was used to determine S0 flocculation byPAC, PAM and MBF over interactive variables pH and stirringintensity (Fig. 5). The two dimensional contour plots are shownin Fig. 6. As shown in Fig. 5, the flocculation of S0 increased in thePAC case as the pH increased up to 4.6–4.9 and then decreased asthe pH continued to increase. For PAM and MBF, maximumflocculation occurred at pH 5.3–5.6 and 5.0–5.2, respectively, andlower flocculation occurred at higher pH values, potentially dueto the negative charge on the biogenic S0 surface. The amount ofpositive charge needed to neutralize the negative charge ofbiogenic S0 at low pH is greater than that at high pH. Meanwhile,pH is the most important factor that affects the Zeta potential,and the absolute value of the Zeta potential approaches zero asthe pH decreases, making the colloid dispersed system unstable(Hunter, 2013). The acidic condition was in favor of theimprovement of cationic charge density as well as the extensionof the grafting chain in the solution (Wang et al., 2011). Both thecharge neutralization ability and the sweep-floc ability wereenhanced in this case. Taking the two factors into accounttogether, acidic condition was appropriate for the biogenic S0
flocculation.Fig. 5 also shows the effects of stirring intensity on
flocculation. Mixing during the flocculation process providesclose encounters between the particles and flocculating agents(Chenet al., 1998). Toachieve ahigh flocculation rate, the effects
Table 5 – ANOVA results of the quadratic models for biogenic S
Source Solution Model A-pH B-
Sum of squares PAC 10587.65 3109.927PAM 255.5252 22.04167MBF 5911.346 947.5267
df 5 1Mean square PAC 2117.531 3109.927
PAM 51.10503 22.04167MBF 1182.269 947.5267
F value PAC 26.44388 38.83698PAM 33.21049 14.32373MBF 27.14088 21.75199
p-Value Prob > F PAC 0.0002 0.0004PAM <0.0001 0.0069MBF 0.0002 0.0023
S0: elemental sulfur.
of high and low mixing speeds on biogenic S0 flocculationwere investigated. As shown in Fig. 5, the flocculation resultingfrom PAC and PAM increased as the mixing speed increased to120–130 r/min, and then slightly decreased. In theMBF case, thebiogenic S0 flocculation rate sharply increased with increasingstirring intensity. The maximum flocculation rate observed at120–130 r/min was 70%–75%. When the stirring intensity wasbetween 80 and 120 r/min, the S0 flocculation results indicatedthat the flocculation rate increased as the mixing speedincreased, which provided more opportunities for contactbetween the S0 and flocculants to allow for aggregation and toincrease the flocculation rate. However, floccules are easilydestroyedwhenmixing speeds are too fast. Thus, the flocculationrate decreased as themixing speeds increased beyond 120 r/min.
2.2.3. Optimization analysis and model validationOptimum factor levels were obtained by analyzing theresponse surface contour and derivatives of the equation ofthe abovemodel. According to the results shown in the contourplot (Fig. 6), relatively high S0 flocculation rates of 97.12%,15.08% and 72.23% were predicted at pH 4.73 and 128.85 r/minin the PAC case, pH 5.45 and 129.96 r/min in the PAM case andpH 5.08 and 125.25 r/min in the MBF case, respectively.
Verification tests were performed using the predictedoptimal parameters, and the results are summarized inTable 6. As shown in Table 6, at pH 4.73 and 129 r/min, theexperimental value of the S0 flocculation rate reached 97.53%when 2.42 mg PAC/mg S was added. At pH 5.45 and 130 r/min,the experimental value of the S0 flocculation rate reached15.41% when 2.75 mg PAC/mg S was added. At pH 5.08 and125 r/min, the experimental value of the S0 flocculationrate reached 71.98% when 2.38 mg MBF/mg S was added.The S0 flocculation rates obtained from experimentation werevery similar to those estimated using the quadratic model.Consequently, the RSM approach was successfully applied tomodel and optimize the biogenic S0 flocculation process.
3. Conclusions
This study successfully compared the PAC, PAM and MBF per-formances for biogenic S0 flocculation and established optimum
0 flocculation.
Stirring intensity AB A2 B2
484.2017 174.24 2276.594 1948.39120.90667 1.8225 88.27456 44.2667
188.16 36.6025 1224.809 1720.4811 1 1 1
484.2017 174.24 2276.594 1948.39120.90667 1.8225 88.27456 44.2667
188.16 36.6025 1224.809 1720.4816.046745 2.175921 28.43026 24.33164
13.58615 1.184348 57.36503 28.766624.319513 0.840269 28.11746 39.496390.0435 0.1837 0.0011 0.00170.0078 0.3125 0.0001 0.00100.0763 0.3898 0.0011 0.0004

Internally studentized residuals
Nor
mal
pro
babi
lity
(%)
-3.00 -2.00 -1.00 0.00 1.00 2.00 3.00
1
51020305070809095
99
Internally studentized residuals
Nor
mal
pro
babi
lity
(%)
-3.00 -2.00 -1.00 0.00 1.00 2.00 3.00
1
51020305070809095
99
Internally studentized residuals
Nor
mal
pro
babi
lity
(%)
-3.00 -2.00 -1.00 0.00 1.00 2.00 3.00
1
51020305070809095
99PAC PAM MBF
Normal plot of residuals Normal plot of residuals Normal plot of residuals
Fig. 4 – The studentized residuals and normal probability plot for optimizing the biogenic S0 flocculation conditions.
160Biogenic sulfur flocculation rate (%)
80
233J O U R N A L O F E N V I R O N M E N T A L S C I E N C E S 4 2 ( 2 0 1 6 ) 2 2 7 – 2 3 5
operating parameters for sulfur recovery. The effectsof flocculant dose on biogenic S0 flocculation indicatedoptimal doses of 2.42 mg PAC/mg S, 2.75 mg PAM/mg S and
80 100
120 140
1603.0 4.0 5.0 6.0 7.0 8.0 9.0
0
20
40
60
80
100
Bio
geni
c su
lfur
flo
ccul
atio
n ra
te (
%)
pH Stirring intensity (r/min)
Stirring intensity (r/min)
Stirring intensity (r/min)
80 100
120 140
1603.0
4.0 5.0
6.0 7.0
8.0 9.0
0
5
10
15
20
Bio
geni
c su
lfur
flo
ccul
atio
n ra
te (
%)
pH
80 100
120 140
1603.0 4.0 5.0 6.0 7.0 8.0 9.0
0
20
40
60
80
Bio
geni
c su
lfur
flo
ccul
atio
n ra
te (
%)
pH
PAC
PAM
MBF
Fig. 5 – Effect of the interaction between pH and stirringintensity on biogenic S0 flocculation.
3.0 4.0 5.0 6.0 7.0 8.0 9.080
100
120
140
pH
Stir
ring
inte
nsity
(r/
min
)
20
40
60
80
5
Prediction 97.1155
3.0 4.0 5.0 6.0 7.0 8.0 9.080
100
120
140
160Biogenic sulfur flocculation rate (%)
pH
Stir
ring
inte
nsity
(r/
min
)
55
10
155
Prediction 15.0812
3.0 4.0 5.0 6.0 7.0 8.0 9.080
100
120
140
160Biogenic sulfur flocculation rate (%)
pH
Stir
ring
inte
nsity
(r/
min
)
2040
40
605
Prediction 72.2312
MBF
PAM
PAC
Fig. 6 – Two-dimensional contour plot for biogenic S0
flocculation.

Table 6 – The predicted optimal parameters andverification results.
Solutions pH Stirringintensity(r/min)
Biogenic S0
flocculationrate (%)
PAC Predicted value 4.73 128.85 97.12Experimental value 4.73 129 97.53
PAM Predicted value 5.45 129.96 15.08Experimental value 5.45 130 15.41
MBF Predicted value 5.08 125.25 72.23Experimental value 5.08 125 71.98
S0: elemental sulfur.
234 J O U R N A L O F E N V I R O N M E N T A L S C I E N C E S 4 2 ( 2 0 1 6 ) 2 2 7 – 2 3 5
2.38 mg MBF/mg S, with S0 flocculation rates reaching up to86.78%, 13.37% and 78.27%, respectively. Based on the RSMapproach, which uses CCD for experimental design, and thefitness of the polynomial equation, the optimal S0 flocculationconditions occurred under conditions of pH 4.73, 129 r/minand 2.42 mg PAC/mg S. Under these conditions, the predictedand actual flocculation efficiencies reached 97.12% and97.53%, respectively, in the presence of PAC.
Acknowledgments
This work was supported by the National High-Tech Researchand Development Program (863) of China (No. 2011AA060904),the National Science Foundation for Distinguished YoungScholars (No. 51225802), the Science Fund for Creative ResearchGroups of the National Natural Science Foundation of China(No. 51121062), the National Key Technology Research andDevelopment Program of the Ministry of Science and Technol-ogy of China (No. 2010BAC67B02), the Fundamental ResearchFunds for Central Universities (No. AUGA5710055514) and theNational Natural Science Foundation of China (Nos. 51176037,51308147, 51308147 and 51408591).
R E F E R E N C E S
Aljuboori, A.H.R., Idris, A., Abdullah, N., Mohamad, R., 2013.Production and characterizationof a bioflocculant produced byAspergillus flavus. Bioresour. Technol. 127, 489–493.
Aljuboori, A.H.R., Uemura, Y., Osman, N.B., Yusup, S., 2014.Production of a bioflocculant from Aspergillus niger using palmoil mill effluent as carbon source. Bioresour. Technol. 171,66–70.
Beristain-Cardoso, R., Texier, A.C., Sierra-Álvarez, R., Field, J.A.,Razo-Flores, E., Gomez, J., 2008. Simultaneous sulfide andacetate oxidation under denitrifying conditions using aninverse fluidized bed reactor. J. Chem. Technol. Biotechnol. 83(9), 1197–1203.
Bezawada, J., Hoang, N.V., More, T.T., Yan, S., Tyagi, N., Tyagi, R.D.,et al., 2013. Production of extracellular polymeric substances(EPS) by Serratia sp.1 using wastewater sludge as raw materialand flocculation activity of the EPS produced. J. Environ.Manag. 128, 83–91.
Cao, C.R., Ke, J.M., Cui, G.F., Wang, K.J., 2002. Biological flue gasde-sulfurization technology in Netherlands. Foreign Sci.Technol. China 5, 38–39.
Celis-García, L.B., González-Blanco, G., Meraz, M., 2008. Removalof sulfur inorganic compounds by a biofilm of sulfate reducingand sulfide oxidizing bacteria in a down-flow fluidized bedreactor. J. Chem. Technol. Biotechnol. 83 (3), 260–268.
Chen, L.A., Serad, G.A., Carbonell, R.G., 1998. Effect of mixingconditions on flocculation kinetics of wastewaters containingproteins and other biological compounds using fibrousmaterials and polyelectrolytes. Braz. J. Chem. Eng. 15 (4),358–368.
Chen, C., Ren, N., Wang, A., Yu, Z., Lee, D.J., 2008. Microbialcommunity of granules in expanded granular sludge bedreactor for simultaneous biological removal of sulfate, nitrateand lactate. Appl. Microbiol. Biotechnol. 79 (6), 1071–1077.
Córdova, F.C., León, A.G., Reyes, R.G., González, M.G., Regalado,E.S., González, M.S., et al., 2011. Response surface methodologyfor lead biosorption on Aspergillus terreus. Int. J. Environ. Sci.Technol. 8 (4), 695–704.
Fortuny, M., Guisasola, A., Casas, C., Gamisans, X., Lafuente, J.,Gabriel, D., 2010. Oxidation of biologically produced elementalsulfur under neutrophilic conditions. J. Chem. Technol.Biotechnol. 85 (3), 378–386.
Gregory, J., 1996. Industrial Water Soluble Polymers. The RoyalSociety of Chemistry, Cambridge, UK.
Hao, X.D., Dai, J., Wei, L., 2006. Theoretical and technicalprogresses of biological sulfur removal. Ecol. Environ. China. 15(4), 844–853.
Hunter, R.J., 2013. Zeta Potential in Colloid Science: Principles andApplications vol. 2. Academic Press, New York, USA.
Jadhav, M.V., Mahajan, Y.S., 2014. Application of response surfacemethodology to water/wastewater treatment using Cocciniaindica. Desalin. Water Treat. 52 (34-36), 6403–6411.
Janssen, A.J.H., De Keizer, A., Lettinga, G., 1994. Colloidalproperties of a microbiologically produced sulphur suspensionin comparison to a LaMer sulphur sol. Colloids Surf. B 3 (1),111–117.
Janssen, A., De Keizer, A., Van Aelst, A., Fokkink, R., Yangling, H.,Lettinga, G., 1996. Surface characteristics and aggregation ofmicrobiologically produced sulphur particles in relation to theprocess conditions. Colloids Surf. B 6 (2), 115–129.
Jiang, G., Sharma, K.R., Guisasola, A., Keller, J., Yuan, Z., 2009.Sulfur transformation in rising main sewers receiving nitratedosage. Water Res. 43 (17), 4430–4440.
Kiran, B., Thanasekaran, K., 2011. Copper biosorption on Lyngbyaputealis: application of response surface methodology (RSM).Int. Biodeterior. Biodegrad. 65 (6), 840–845.
Knobel, A.N., Lewis, A.E., 2002. A mathematical model of a highsulphate wastewater anaerobic treatment system. Water Res.36 (1), 257–265.
Li, Y.X., Su, B.Q., Geng, Z.Y., Yao, B.B., Chi, Y.Z., 2000. Biologicaltreatment of acidic wastewater containing sulfate andrecovery of elementary sulfur. WaterWastewater Eng. 26, 28–30.
Li, Y.W., Xie, Q.L., Zhang, P., 2006. New techniques for thetreatment of molasses distillery wastewater. GuangzhouEnviron. Sci. China. 3, 003.
More, T.T., Yadav, J.S.S., Yan, S., Tyagi, R.D., Surampalli, R.Y., 2014.Extracellular polymeric substances of bacteria and theirpotential environmental applications. J. Environ. Manag. 144,1–25.
Özer, A., Gürbüz, G., Çalimli, A., Körbahti, B.K., 2008. Investigationof nickel(II) biosorption on Enteromorpha prolifera: optimizationusing response surface analysis. J. Hazard. Mater. 152 (2),778–788.
Prazeres, A.R., Carvalho, F., Rivas, J., 2013. Fenton-like applicationto pretreated cheese whey wastewater. J. Environ. Manag. 129,199–205.
Riaño, B., García-González, M.C., 2014. On-farm treatment ofswine manure based on solid–liquid separation and biologicalnitrification–denitrification of the liquid fraction. J. Environ.Manag. 132, 87–93.

235J O U R N A L O F E N V I R O N M E N T A L S C I E N C E S 4 2 ( 2 0 1 6 ) 2 2 7 – 2 3 5
Sahinkaya, E., Hasar, H., Kaksonen, A.H., Rittmann, B.E., 2011.Performance of a sulfide-oxidizing, sulfur-producingmembranebiofilm reactor treating sulfide-containing bioreactor effluent.Environ. Sci. Technol. 45 (9), 4080–4087.
Schlegel, H.G., 1989. Allgemline Mikrobiologie. fifth ed. Thieme,Stuttgart, Germany.
Tripathy, T., Karmakar, N.C., Singh, R.P., 2001. Development ofnovel polymeric flocculant based on grafted sodium alginatefor the treatment of coal mine wastewater. J. Appl. Polym. Sci.82 (2), 375–382.
Wang, A.J., Du, D.Z., Ren, N.Q., Van Groenestijn, J.W., 2005. Aninnovative process of simultaneous desulfurization anddenitrification by Thiobacillus denitrificans. J. Environ. Sci. Health40 (10), 1939–1949.
Wang, J.P., Chen, Y.Z., Wang, Y., Yuan, S.J., Yu, H.Q., 2011.Optimization of the coagulation–flocculation process for pulpmill wastewater treatment using a combination of uniformdesign and response surface methodology. Water Res. 45 (17),5633–5640.
Wang, Z., Shen, L., Zhuang, X.L., Shi, J.S., Wang, Y.P., He, N., 2015.Flocculation characterization of a bioflocculant fromBacilluslicheniformis. Ind. Eng. Chem. Res. 54 (11), 2894–2901.
Yuan, Y., Chen, C., Liang, B., Huang, C., Zhao, Y., Xu, X., et al.,2014a. Fine-tuning key parameters of an integrated reactorsystem for the simultaneous removal of COD, sulfate andammonium and elemental sulfur reclamation. J. Hazard.Mater. 269, 56–67.
Yuan, Y., Wang, A., Ma, S., Chen, C., Zhao, Y., Tan, W., et al., 2014b.Distribution characteristics and separation of biological sulfurin denitrifying sulfide removal process. J. Harbin Inst. Technol.China 46 (8), 34–39.
Zhang, K.S., Zhou, Q.X., Xiao, H., 2004. Flocculation performanceof a novel synthesized flocculant with low ecological risk.J. Environ. Sci. 16 (3), 443–446.
Zheng, H., Ma, J., Zhai, J., Zhu, C., Tang, X., Liao, Y., et al., 2014.Optimization of flocculation process by response surfacemethodology for diethyl phthalate removal using anionicpolyacrylamide. Desalin. Water Treat. 52 (28-30), 5390–5400.
Zhu, Y.B., Ma, F., Huang, J.L., Liu, Y.H., 2006. Study on flocculationproperties of bioflocculant and optimization of flocculationconditions. China Water Wastewater. 22 (3), 4–8.

J O U R N A L O F E N V I R O N M E N T A L S C I E N C E S 4 2 ( 2 0 1 6 ) 2 3 6 – 2 4 5
Ava i l ab l e on l i ne a t www.sc i enced i r ec t . com
ScienceDirect
www. jou rna l s . e l sev i e r . com/ j es
Characterisation of dissolved organic matter in stormwaterusing high-performance size exclusion chromatography
Huiping Huang1, Christopher W.K. Chow2,3,⁎, Bo Jin1
1. School of Chemical Engineering, The University of Adelaide, Adelaide, SA 5005, Australia. E-mail: [email protected]. School of Earth and Environmental Sciences, The University of Adelaide, Adelaide, SA 5005, Australia3. Australian Water Quality Centre, SA Water Corporation, 250 Victoria Square, Adelaide, SA 5100, Australia
A R T I C L E I N F O
⁎ Corresponding author. E-mail: chris.chow@
http://dx.doi.org/10.1016/j.jes.2015.07.0031001-0742/© 2015 The Research Center for Ec
A B S T R A C T
Article history:Received 14 May 2015Revised 15 July 2015Accepted 16 July 2015Available online 17 August 2015
Understanding the complexity of dissolved organic matter (DOM) in stormwater has drawna lot of interest, since DOM from stormwater causes not only environmental impacts, butalso worsens downstream aquatic quality associated with water supply and treatability.This study introduced and employed high-performance size exclusion chromatography(HPSEC) coupled with an ultraviolet–visible (UV–vis) diode array detector to assess changesin stormwater-associated DOM characteristics. Stormwater DOM was also analysed inrelation to storm event characteristics, water quality and spectroscopic analysis. Statisticaltools were used to determine the correlations within DOM and water quality measurements.Results showed that dissolved organic carbon (DOC) and UV absorbance at 254 nm (UV254) asconventional DOM parameters were found to be correlated well to the changes in stormwaterquality during each of the three storm events studied. Both detector wavelengths (210and 254 nm) and their ratio (A210/A254) were found to provide additional information on thephysiochemical properties of stormwater-associated DOM. This study indicated that A210/A254
is an important parameter which could be used to estimate the DOM proportions of functionalgroups and conjugated carbon species. This study provided also an understanding ofstormwater quality constituents through assessing variability and sensitivity for variousparameters, and the additional information of rainfall characteristics on runoff qualitydata for a better understanding of parameter correlations and influences.© 2015 The Research Center for Eco-Environmental Sciences, Chinese Academy of Sciences.
Published by Elsevier B.V.
Keywords:StormwaterDissolved organic matterHPSEC
Introduction
Stormwater brings various inorganic and organic substances intothe environments (Göbel et al., 2007; Al-Reasi et al., 2013). Thesechemical discharges canworsen downstreamwater quality if thestormwater is used as water source, as well as impacts on theecosystem. Among these chemical substances, dissolved organicmatter (DOM) has drawn a great interest as it can enter aquaticmatrixes, thus affecting the composition and quality of surface
sawater.com.au (Christop
o-Environmental Science
waters (Chong et al., 2013; McElmurry et al., 2013). DOM is alsonaturally present in the environment and has frequently beendetected in sourcewaters (Matilainen et al., 2011; Xing et al., 2012;Fabris et al., 2013). It can be responsible for the yellow-brownishcolour, unpleasant taste and bad odour of natural waters. Hencethe varying levels and compositions of DOM in stormwatersources need to be taken into account, since its chemicalcharacteristics can be variable at any time depending on thelocal activities, climate conditions and rainfall influences. As
her W.K. Chow).
s, Chinese Academy of Sciences. Published by Elsevier B.V.

Pressure sensor Pump-1
Drain water level
River
Automatic sampler
Pump-2
Catchment area
Fig. 1 – Schematic of the stormwater capturing system used forsequential sampling. (1) Pressure sensor: Placed in the drain tomeasure water level (m) in 5 min intervals and also send signalwhen drain water level changed (up and down) by 25 mm;(2) Pump-1: Installed in the drain to capture stormwater afteractive by the signal frompressure sensor; (3) Automatic sampler(24-bottle carousel): Installed and housed in the cabinet;(4) Pump-2: Part of theautomatic sampler assembly forpumpingstormwater into the sampling bottles.
237J O U R N A L O F E N V I R O N M E N T A L S C I E N C E S 4 2 ( 2 0 1 6 ) 2 3 6 – 2 4 5
a general concern in the course of drinking water treatmentand/or wastewater recycling processes, DOM affects not onlythe performance of each treatment step, such as traditionalcoagulation–flocculation, adsorption and membrane filtration(Chow et al., 2004; Rosenberger et al., 2006; Fabris et al., 2008);but also more importantly, reacts with various disinfectants toproduce harmful disinfection by-products (DBPs) (Richardson etal., 2007; Zhao et al., 2008).
Conventionally, pH, turbidity, colour and inorganics arethe common parameters used to describe water quality, whiledissolved organic carbon (DOC) determination, ultraviolet(UV) adsorption analysis, specific UV absorbance (SUVA) andspecific colour are commonly used as parameters to measureDOM in water sources. They provide both quantitative andqualitative information. Along with substantial improvementin analytical techniques, compared to the earlier work in thisfield, current DOM analytical work has been shifted towardsmore advanced fractionation analysis. A series of advancedanalytical techniques, including resin fractionation, fluores-cence spectroscopy and size exclusion chromatography havebeen widely used in the water research field (Matilainen et al.,2011; Nebbioso and Piccolo, 2013). Hydrophobicity, molecularweight and aromaticity, provided by these techniques asindicators provide more insight into chemical qualitative andstructural features of DOM and more informative outcomes,and either applied as a single technique or in combinations cangenerate additional values on DOM characterisation (Bazrafkanet al., 2012; Chong et al., 2013; Li et al., 2013; Wei et al., 2013).
Molecular weight distribution is an important physicalproperty associated with DOM transport, reactivity andtreatability. High-performance size exclusion chromatogra-phy (HPSEC) has been developed to characterise DOM predom-inantly forwater treatment applications andalso invarious soil,aquatic and marine samples (Matilainen et al., 2011; Nebbiosoand Piccolo, 2013). The principle of HPSEC is based on apparentmolecular weight (AMW) separation. Additionally, it can couplewith various detectors, such as DOC determination (Her et al.,2008), UVabsorbancewith a single ormultiplewavelengths (Heret al., 2008; Korshin et al., 2009; Liu et al., 2010; Bazrafkan et al.,2012; Xing et al., 2012; Yan et al., 2012), excitation emissionfluorescence detection (Li et al., 2013), and mass spectroscopy(Nebbioso and Piccolo, 2013).
An additional advantage of using HPSEC is the ability toseparate inorganic constituents and minimise inorganic inter-ferences, as these are generally in a range of molecular weights(MW) less than 0.25 kDa (Her et al., 2008). Several studies havealso demonstrated that theHPSEC technique is informative andreliable when used to assess water treatability by comparisonbetween raw and treated water based on the HPSEC profilesafter coagulation in drinkingwater treatment (Chow et al., 2008;Fabris et al., 2008; Liu et al., 2010; Xing et al., 2012) or applying apeak-fitting model to predict treatability (Chow et al., 2008).Korshin et al. (2009) investigated the relationships betweenMWand DBP formation. HPSEC in conjunction with UV detector isparticularly useful and informative. More than one wavelengthand/or multi-wavelength absorbance detection have been intro-ducedandapplied by several researchers (Her et al., 2008; Korshinet al., 2009; Yan et al., 2012). The wavelengths at 210 nm and254 nmhavebeenused inpreviousworkbecause thewavelength210 nmallows the detection of DOM functional groups (hydroxyl,
carboxyl, carbonyl, ester and nitrogen-containing compounds)and the wavelength at 254 nm is the recognisable absorbance forthe conjugated aromatic substituents (Her et al., 2008). Thewavelength around 210 nm has also been addressed toassociate particularlywithnitrate concentrations,which relatesto nutrient content and microbial activities (Whitehead andCole, 2006).
Elevated pollutant loadings, particularly of DOM, during astorm event can provide early notice of potential impactsof stormwater discharge on surface waters. Water quality andthe potential risks of stormwater need to be assessed andcontrolled in order to improvewatershedmanagement. The aimof this study was to characterise DOM present in stormwaterthrough extensive sampling of three representative stormeventsand develop some useful tools to understand stormwater DOMproperties. The objectives were (1) to determine stormwaterquality using a series of conventional measurement techniquesand to describe their sensitivity and potential relationships, (2) toextend HPSEC with UV absorbance detection as a monitoringtechnique to characterise stormwater-associated DOM basedon molecular weight distribution, (3) to determine DOMcompositions using two UV wavelengths (210 and 254 nm)of the HPSEC and their ratio for further analysis, and (4) toestimate pollutant loadings using simple statistical methods,combining measured flow data with various water qualityparameters.
1. Materials and methods
1.1. Sampling strategy
A semi-urban catchment, located at Mannum, South Australia,was selected to determine the impact of stormwater quality onsurface water quality, since the stormwater in this area (study)could enter directly into the river and can impact on surfacewater quality. A sampling point located in the underground
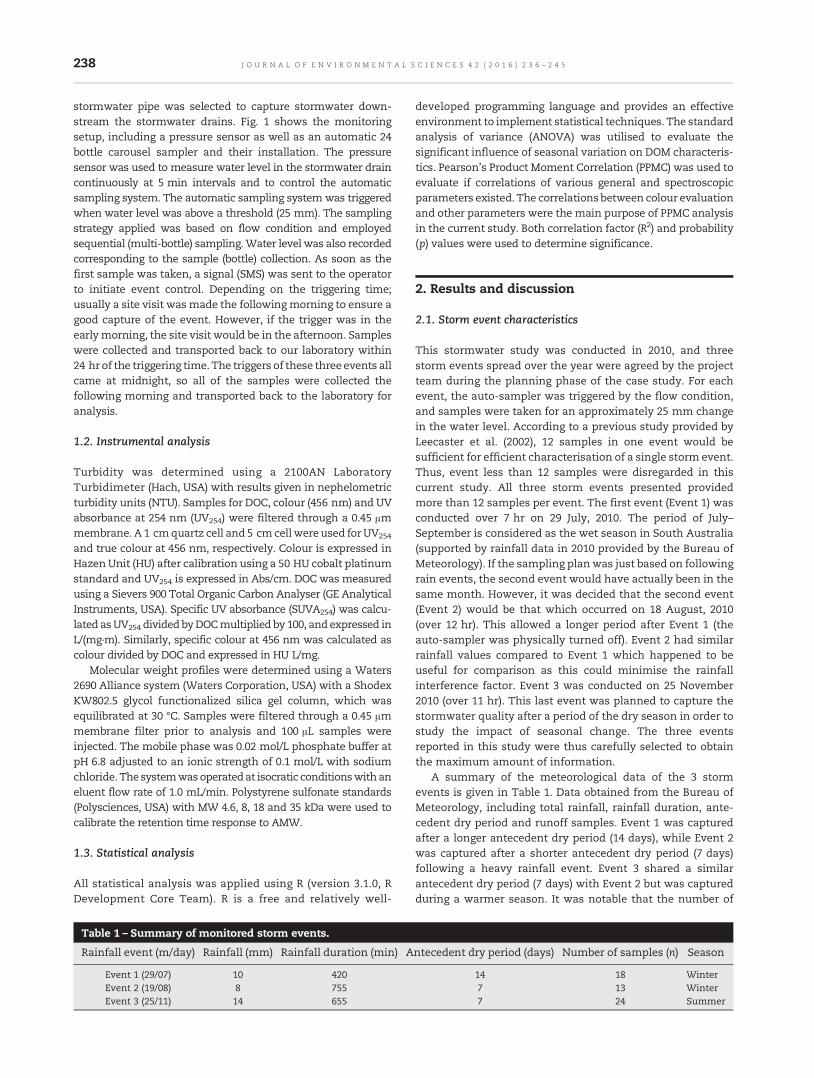
238 J O U R N A L O F E N V I R O N M E N T A L S C I E N C E S 4 2 ( 2 0 1 6 ) 2 3 6 – 2 4 5
stormwater pipe was selected to capture stormwater down-stream the stormwater drains. Fig. 1 shows the monitoringsetup, including a pressure sensor as well as an automatic 24bottle carousel sampler and their installation. The pressuresensor was used to measure water level in the stormwater draincontinuously at 5 min intervals and to control the automaticsampling system. The automatic sampling systemwas triggeredwhen water level was above a threshold (25 mm). The samplingstrategy applied was based on flow condition and employedsequential (multi-bottle) sampling.Water level was also recordedcorresponding to the sample (bottle) collection. As soon as thefirst sample was taken, a signal (SMS) was sent to the operatorto initiate event control. Depending on the triggering time;usually a site visit was made the followingmorning to ensure agood capture of the event. However, if the trigger was in theearlymorning, the site visit would be in the afternoon. Sampleswere collected and transported back to our laboratory within24 hr of the triggering time. The triggers of these three events allcame at midnight, so all of the samples were collected thefollowing morning and transported back to the laboratory foranalysis.
1.2. Instrumental analysis
Turbidity was determined using a 2100AN LaboratoryTurbidimeter (Hach, USA) with results given in nephelometricturbidity units (NTU). Samples for DOC, colour (456 nm) and UVabsorbance at 254 nm (UV254) were filtered through a 0.45 μmmembrane. A 1 cmquartz cell and 5 cmcellwere used forUV254
and true colour at 456 nm, respectively. Colour is expressed inHazenUnit (HU) after calibration using a 50 HU cobalt platinumstandard and UV254 is expressed in Abs/cm. DOC was measuredusing a Sievers 900 Total Organic Carbon Analyser (GE AnalyticalInstruments, USA). Specific UV absorbance (SUVA254) was calcu-lated asUV254 divided byDOCmultiplied by 100, and expressed inL/(mg·m). Similarly, specific colour at 456 nm was calculated ascolour divided by DOC and expressed in HU L/mg.
Molecular weight profiles were determined using a Waters2690 Alliance system (Waters Corporation, USA) with a ShodexKW802.5 glycol functionalized silica gel column, which wasequilibrated at 30 °C. Samples were filtered through a 0.45 μmmembrane filter prior to analysis and 100 μL samples wereinjected. The mobile phase was 0.02 mol/L phosphate buffer atpH 6.8 adjusted to an ionic strength of 0.1 mol/L with sodiumchloride. Thesystemwasoperatedat isocratic conditionswithaneluent flow rate of 1.0 mL/min. Polystyrene sulfonate standards(Polysciences, USA) with MW 4.6, 8, 18 and 35 kDa were used tocalibrate the retention time response to AMW.
1.3. Statistical analysis
All statistical analysis was applied using R (version 3.1.0, RDevelopment Core Team). R is a free and relatively well-
Table 1 – Summary of monitored storm events.
Rainfall event (m/day) Rainfall (mm) Rainfall duration (min) A
Event 1 (29/07) 10 420Event 2 (19/08) 8 755Event 3 (25/11) 14 655
developed programming language and provides an effectiveenvironment to implement statistical techniques. The standardanalysis of variance (ANOVA) was utilised to evaluate thesignificant influence of seasonal variation on DOM characteris-tics. Pearson's Product Moment Correlation (PPMC) was used toevaluate if correlations of various general and spectroscopicparameters existed. The correlations between colour evaluationand other parameters were the main purpose of PPMC analysisin the current study. Both correlation factor (R2) and probability(p) values were used to determine significance.
2. Results and discussion
2.1. Storm event characteristics
This stormwater study was conducted in 2010, and threestorm events spread over the year were agreed by the projectteam during the planning phase of the case study. For eachevent, the auto-sampler was triggered by the flow condition,and samples were taken for an approximately 25 mm changein the water level. According to a previous study provided byLeecaster et al. (2002), 12 samples in one event would besufficient for efficient characterisation of a single storm event.Thus, event less than 12 samples were disregarded in thiscurrent study. All three storm events presented providedmore than 12 samples per event. The first event (Event 1) wasconducted over 7 hr on 29 July, 2010. The period of July–September is considered as the wet season in South Australia(supported by rainfall data in 2010 provided by the Bureau ofMeteorology). If the sampling planwas just based on followingrain events, the second event would have actually been in thesame month. However, it was decided that the second event(Event 2) would be that which occurred on 18 August, 2010(over 12 hr). This allowed a longer period after Event 1 (theauto-sampler was physically turned off). Event 2 had similarrainfall values compared to Event 1 which happened to beuseful for comparison as this could minimise the rainfallinterference factor. Event 3 was conducted on 25 November2010 (over 11 hr). This last event was planned to capture thestormwater quality after a period of the dry season in order tostudy the impact of seasonal change. The three eventsreported in this study were thus carefully selected to obtainthe maximum amount of information.
A summary of the meteorological data of the 3 stormevents is given in Table 1. Data obtained from the Bureau ofMeteorology, including total rainfall, rainfall duration, ante-cedent dry period and runoff samples. Event 1 was capturedafter a longer antecedent dry period (14 days), while Event 2was captured after a shorter antecedent dry period (7 days)following a heavy rainfall event. Event 3 shared a similarantecedent dry period (7 days) with Event 2 but was capturedduring a warmer season. It was notable that the number of
ntecedent dry period (days) Number of samples (n) Season
14 18 Winter7 13 Winter7 24 Summer

239J O U R N A L O F E N V I R O N M E N T A L S C I E N C E S 4 2 ( 2 0 1 6 ) 2 3 6 – 2 4 5
samples captured across a storm event was proportional tothe intensity of rainfall, and was linked to flow conditions butnot rainfall duration. During Event 3, because of the highestrainfall (14 mm), 24 samples were collected, followed by Event−1 (10 mm) 18 samples and Event 2 (8 mm) 13 samples. Fig. 2shows the relationship of water level and rainfall durationduring each storm event when samples were collected. Thisduration graph illustrates that although Event 2 was in thelongest rainfall period, it had relatively more stable and lowerflow (low water level compared to the other two events)during the event, whereas Event 1 and Event 3 had largerdynamic changes of the flow condition during the runoffprocess. Based on the observed flow conditions, samples werecollected more frequently at larger fluctuations of water levelchanges and less frequently at smaller fluctuations of waterlevel changes, and as water level changed rapidly, the timebetween samples decreased. At the beginning of a heavy rain,7 and 11 samples were collected within 100 min for Event 1and Event 3, respectively, whereas only a couple of sampleswere triggered within a similar period time for Event 2. Theseobservations imply the sampling method used in this casestudy could be sufficient to capture the characteristics ofrainfall–runoff process in this catchment area. These sequen-tial samples collected based on flow sampling were analysedto gain insight into the changes of stormwater quality andquantity during each storm event.
2.2. General stormwater quality analysis
Analytical data shown inTable 2 reveal that the characteristics ofthe dissolved components in the stormwater as determined byDOC and UV254 varied significantly among events. The averageDOC concentration from the samples collected in Event 3 was14.7 mg/L which was found to be higher than those in Event 1and Event 2, which were 13.5 mg/L and 9.9 mg/L, respectively.Both UV254 and colour measurements showed similar trends astheDOC concentrations for all three events. The results of UV254
for Events 1, 2 and 3 were 0.432 Abs/cm, 0.301 Abs/cm and0.501 Abs/cm, respectively. Colour for Event 3 stormwatersampleswas detectedwith an average of 99 HU,whichwas alsohigher than those in Event 1 and Event 2,whichwere 77 HU and41 HU, respectively. These analytical data might suggest thatstormwater samples in Event 3 had relatively higher amounts ofhumic substances. A strong correlation betweenDOC andUV254
0.00
0.05
0.10
0.15
0.20
0 10 15 20 55 75 100
115
190
210
230
310
315
335
365
375
395
420 0 80 450
500
565
635
660
665
Time (mi
Wat
er le
vel (
m)
Event 1 Event 2
Fig. 2 – The relationship of water level and t
was also observed (R2 = 0.99, p < 0.001) from all samples basedon statistical PPMC analysis. These observations were predictedto indicate that the stormwater DOM from this site had aromaticstructures in nature. Additionally, it was worth pointing out thatEvent 3 had the most scatted data of DOC, UV254 and colour,resulting in the highest standard deviation values, followed byEvent 1 and Event 2. A possible explanation for this observa-tion could be due to dynamic flow variations during theevent. The stormwater quality would additionally depend onrainfall intensity and environmental conditions. The other twopotential factors, rainfall duration and antecedent dry periodmight be expected tohave less influence on stormwater quality.The chemical loads in Event 3 stormwater were higher thanthose in Event 2 although their antecedent dry periods weresimilar. This could be explained by environmental condi-tions, since temperature has impacts on physicochemicaland biological reactions (Chong et al., 2013; Tang et al., 2013;McElmurry et al., 2013). Event 1hadhigher rainfall intensity andwas likely to lead to higher pollutant loadings in stormwatercompared to Event 2. However, the DOM character and waterquality parameters were not correlated well, since stormwaterrunoff volume could be a potential factor influencing stormwatermonitoring.
2.3. HPSEC profile analysis
A new combined profile based upon use of two wavelengthscoupled with size exclusion chromatography (SEC) was intro-duced. These HPSEC profiles revealed that DOM in all sampleshadmostly similar AMWranges, from0.3 to 2 kDa. Both the firstand last samples collected from each storm event were chosenfor analysis in Fig. 3.
Similar HPSEC profiles were observed for both Event 1 andEvent 2 but there was a difference obviously in Event 3. In allthe HPSEC chromatograms obtained from Event 1 and Event2, aside from the differences of DOM absorbance intensities,insignificant changes of peak patterns were observed acrossof each storm event under various flow conditions or waterlevels. It was also worth noticing that the stronger absorbanceintensitiesweremeasured at the lowerwavelength of 210 nm.Amaximumabsorbance at approximately 0.3–0.5 kDawas follow-ed by weaker absorbance intensities at approximately 1–2 kDa.These high levels of absorbance intensity measured at210 nm could be an indication of DOM enriched with various
670
685
695
715
755 0 5 20 25 35 50 55 60 65 80
100
135
165
180
185
205
215
225
240
270
450
615
620
655
n)
Event 3
he corresponding storm event duration.

Table 2 – Results of dissolved organic matter (DOM) characterisation of the stormwater samples.
Event 1 Event 2 Event 3
Range Mean ± SDa Range Mean ± SDb Range Mean ± SDc
Turbidity (NTU) 47–580 172 ± 172 59–638 352 ± 214 14–431 175 ± 122Colour (HU) 41–112 77 ± 22 34–57 41 ± 7 57–236 99 ± 44UVA254 (Abs/cm) 0.217–1.227 0.432 ± 0.267 0.198–0.497 0.301 ± 0.074 0.278–1.768 0.501 ± 0.378DOC (mg/L) 6.7–47.2 13.5 ± 10.6 6.8–18.9 9.9 ± 2.9 7.3–67.5 14.7 ± 14.3SUVA254 (L/(mg·m)) 2.6–3.9 3.4 ± 0.3 2.6–3.7 3.1 ± 0.3 2.6–4.1 3.7 ± 0.4Specific colour (L HU/mg) 0.13–0.99 0.49 ± 0.24 0.04–0.23 0.13 ± 0.04 0.10–1.23 0.75 ± 0.46
n: number of samples. a n = 18, b n = 13, c n = 24.
240 J O U R N A L O F E N V I R O N M E N T A L S C I E N C E S 4 2 ( 2 0 1 6 ) 2 3 6 – 2 4 5
non-aromatic functional groups (Her et al., 2008; Korshin et al.,2009). Theabsorbance intensity patterns at 254 nm, on theotherhand, were likely to be stable for each sample. These observa-tions support the hypothesis that stormwater DOM had arelatively high concentration of aromatic carbon and/or pheno-lic compounds, regardless of the levels of absorbance intensity(Xing et al., 2012). However, HPSEC profiles for Event 3appeared much more complex and varied prominently throughall samples. For instance, remarkable differences between thefirst and the last samples were exhibited in Fig. 3e and f. Whilethe HPSEC profile for the last sample shared similar dominantpeakswith those fromEvents 1 and 2, presenting totally differentresults. HPSEC profiles for the first sample demonstrated that the
200 500 1000 2000
0.0
0.2
0.4
0.6
0.8 a
AMW (Da)
200 500 1000 2000AMW (Da)
200 1000 50AMW (
200 500 1AMW (D
Abs
(cm
)A
bs (
cm)
Abs
(cm
)
210 nm
A21
0/A
254
b
d e
40
30
20
10
0
0.20
0.15
0.10
0.05
0
Abs
(cm
)
0.20
0.15
0.10
0.05
0
A21
0/A
254
30
25
20
15
10
5
0
0.30
0.20
0.10
0
Fig. 3 – Comparison of A210/A254 values and HPSEC–UV chromafirst-sample, (b) Event 1 last-sample, (c) Event 2 first-sample, (d)last-sample. HPSEC: high-performance size exclusion chromatog
DOM was comprised of relatively higher absorbing compoundswith adsorption maxima at higher AMW fractions, ranging from1 kDa to 5 kDa.Another identified differencewas due to largerAMW absorbance, at approximately 50 kDa. This could beassociated with the contribution of a large amount of plantand/or microorganism cell deaths, and vegetation decay underdry-weather conditions or comprise organic colloidal material(organometallic complexes) (Chow et al., 2008).
DOM fractions with higher AMW values were likely to havea higher absorbance at higher wavelengths (O' Loughlin andChin, 2001). AMW above 1 kDa, for instance, had a strongerabsorbance at wavelengths above 254 nm than AMW below1 kDa. This observation could be explained by the fact that
00 20000Da)
200 1000 5000 20000AMW (Da)
000 2000a)
200 500 1000 2000AMW (Da)
Abs
(cm
)
254 nm A210/A254
A21
0/A
254
c
f
A21
0/A
254
40
30
20
10
0
Abs
(cm
)
0.4
0.3
0.2
0.1
0
30
25
20
15
10
5
0
A21
0/A
254
30
25
20
15
10
5
0
A21
0/A
254
5
4
3
2
1
0
0.12
0.08
0.04
0
tograms obtained at 210 nm and 254 nm: (a) Event 1Event 2 last-sample, (e) Event 3 first-sample, and (f ) Event 3raphy; UV: ultraviolet.

241J O U R N A L O F E N V I R O N M E N T A L S C I E N C E S 4 2 ( 2 0 1 6 ) 2 3 6 – 2 4 5
unsaturated compounds are more sensitive to a higher UVwavelength (254 nm), while functional groups including hydrox-yl, carboxyl, carbonyl, ester and nitrogen-containing compounds,may be associated with a lower wavelength (210 nm) (Her et al.,2008).
2.4. Interpretation of A210/A254 on HPSEC profiles
The absorbance ratio index (ARI) as a spectroscopic parameterhas beenwidely reported associatedwithDOMcharacterisations.The ARI of A210/A254 introduced by Her et al. (2008) was found tobe able to provide information on the relative proportion of UVabsorbance between the non-aromatic and aromatic compo-nents (Yan et al., 2012). The A210/A254 was applied for DOManalysis in the current study in order to gain further insight intothe composition of DOM in stormwater. A210/A254 data wereplotted in corresponding graphs (Fig. 3) for comparison.
In accordance with data shown in Fig. 3, the dominantfraction at 0.3–0.5 kDa was likely to give a couple of sharppeaks for A210/A254 values which were in a range of 10–40.These high readings could imply that the corresponding DOMsources contained a higher functional group proportions whichcould be related to protein-like materials and/or simple aminoacids associated with nutrient organic matter. Her et al. (2008)stated that A210/A254 increaseswith the increase inmicrobiolog-ically derived components that have a high functional groupproportion. The unexpected peak exhibited below 0.3 kDawas considered due to the presence of inorganics, such asnitrate, sulfate and phosphate, as these inorganic specieshave UV absorbance at less than 230 nm wavelengths. Thetwo-wavelength approach on the basis, one being in a rangeof 200–220 nm and the other being selected above 250 nmwas previously applied to estimate nitrate concentration invarious water sources (Edwards et al., 2001). Therefore, thesepeaks could be thought as a result of the presence of nitratecontaining compounds. However, A210/A254 ranging from 1to 3 was observed in some samples in Event 3, such as thefirst-sample (Fig. 3e). These lowA210/A254 values could indicatethat these DOM sources could be comprised of higher aromaticcontent, including a larger amount of both humic acid andfulvic acids. Her et al. (2008) have also confirmed that humicacids and fulvic acids with higher and intermediate aromaticityhave the lower A210/A254 values at 1.59 and 1.88, respectively.The A210/A254 value below 5 for the AMW located at approxi-mately 50 kDa, also suggested these constituents could havehigh aromatic characters. In agreement with the previousliteratures (Her et al., 2008), our study has also illustratedA210/A254 as a phenomenological parameter that can helpcharacterise DOM in stormwater samples.
2.5. Influence of stormwater runoff volume
Several researchers have attempted to model and under-stand rainfall–runoff processes, since it is a crucial factor todetermine pollutant movement and to estimate contami-nants' fate in environments. Many previous studies haveemphasised stormwater rainfall–runoff transformation charac-terisationanalysis, particularly of runoff process, since theyact asamajor pathway for transport of contaminants fromurban areasinto surface water bodies (Avellaneda et al., 2009). Pollutant
wash-off load has generally been assumed proportional to therainfall intensity or runoff volume in previous studies. Thepollutant wash-off load was assumed as a function of runoffvolume, which increases would result in increase in pollutantloads. Runoff volume as a useful parameter allows the analysis ofthe variation of the pollutant mass during storm events anddetermines the total pollutantmass in relation to the total runoffvolume (Chen and Adams, 2007). Following the rainfall–runoffmodel provided by Chen and Adams (2007), the correspondingwater level measured in the drain (Fig. 1) was assumed as runoffvolume, since surface areawas consistent in the current study. Itappears that the action of combining water level data and waterquality parameter results can be also developed and employed asan essential and simple tool for stormwater character analysis.
On the basis of the flow condition sampling process, simplemultiplications of values of general parameters and corre-spondingwater levels could be applied to estimate the pollutantloadings in stormwater at a specific time period during a stormevent. For instance, the DOC loading could be obtained bymultiplyingmeasuredDOC concentration by the correspondingwater level as expressed inmg/m2 (Fig. 4a). Other general waterquality parameters, such as UV254, colour and turbidity werealso interpreted in conjunction with water level shown inFig. 4b–d. This information could be used to evaluate thequalitative and quantitative removal of contaminants from theland surface across a runoff event (Avellaneda et al., 2009). Anadditional advantage of this multiplication appeared to mini-mise stormwater dilution factor and hence enabled to analysepollutant mass distribution during storm events. Event 3 hadthe highest water levels across the storm event and these led tothe highest DOM washed-off load compared to the other twoevents. This observation could be linked to the effects of rainfallintensity. It is also worth pointing out that higher pollutantloadings were observed at the beginning of each event.
Additionally, due to the conversion from concentration tomass-based values, the correlations between general DOMcharacter parameters and general water quality parameterswere improved. Strong statistical correlations (p < 0.001) usingPPMC analysiswere found between colour evaluation and otherparameter determinations, as summarised in Table 3. Similartrends in stormwater quality were observed in most parameteranalysis based on combined water level analysis as illustratedin Fig. 4 and PPMC analysis (Table 3). R2 values above 0.80 wererevealed between colour evaluations and DOM measurements,DOC, UV254 and SUVA254. The highest R2 = 0.92was obtained forthe correlation between colour and UV254. A relatively weakcorrelation was given between colour and turbidity (R2 = 0.61).Turbidity, an indication of the concentration of colloids andsuspended particulates, was measured in an extremely highrange for each storm event from 1 to 3. These relatively highturbidity results are an indication of the stormwater in this areacontaining high and stable portions of solid particles.
The above findings for stormwater quality assessmentindicated that, although water level could be the maincontributor to these phenomena, the stormwater colourappeared to respondproportionally toDOMcharacteristics. Thehigher DOC results tended to be positively correlated withhigher UV254 measurements and higher colour observations,indicatinghigher pollutant concentrations in the runoff process.The outstanding definitive correlation (R2 = 0.99, p < 0.001),

Event 1 Event 2 Event 3
Event 1 Event 2 Event 3
0
1
2
3
4
50 10 15 20 55 75 100
115
190
210
230
310
315
335
365
375
395
420 0 80 450
500
565
635
660
665
670
685
695
715
755 0 5 20 25 35 50 55 60 65 80 100
135
165
180
185
205
215
225
240
270
450
615
620
655
Time (min)
DO
C (
mg/
m2 )
a
Event 1 Event 2 Event 3
0
5
10
15
0 10 15 20 55 75 100
115
190
210
230
310
315
335
365
375
395
420 0 80 450
500
565
635
660
665
670
685
695
715
755 0 5 20 25 35 50 55 60 65 80 100
135
165
180
185
205
215
225
240
270
450
615
620
655
Time (min)
UV
254
b
0
5
10
15
20
0 10 15 20 55 75 100
115
190
210
230
310
315
335
365
375
395
420 0 80 450
500
565
635
660
665
670
685
695
715
755 0 5 20 25 35 50 55 60 65 80 100
135
165
180
185
205
215
225
240
270
450
615
620
655
Time (min)
c
0
20
40
60
010 15 20 55 75
100
115
190
210
230
310
315
335
365
375
395
420 0 80
450
500
565
635
660
665
670
685
695
715
755 0 5 20 25 35 50 55 60 65 80
100
135
165
180
185
205
215
225
240
270
450
615
620
655
Time (min)
d
Col
our
(Hu.
m)
Tur
bidi
ty (
NT
U. m
)
Event 1 Event 2 Event 3
Event 1 Event 2 Event 3
Event 1 Event 2 Event 3
Fig. 4 – The relationship between the results of general parameter values multiplied by water levels and the correspondingstorm event duration, (a) DOC, (b) UV254, (c) colour, and (d) turbidity. DOC: dissolved organic carbon; UV: ultraviolet.
242 J O U R N A L O F E N V I R O N M E N T A L S C I E N C E S 4 2 ( 2 0 1 6 ) 2 3 6 – 2 4 5
between DOM and UV254 indicates that UV254 is also a goodsurrogate for DOM in the stormwater samples in this semi-urbancatchment area. Moreover, as a result of this observation,
stormwater in this area could be considered as naturally high inaromatic content, regardless of the impacts of rainfall intensities.The statistical results revealed that there was a strong

Table 3 – Correlations between colour measurements, otherparameters and the influences of seasonal variation.
ColourPPMC (R2,p < 0.001)
SeasonalvariationANOVA (p)
Colour <0.001Turbidity 0.61 >0.05UVA254 0.92 <0.05DOC 0.85 <0.05SUVA254 0.81 <0.001Specific colour 0.74 <0.001Averaged A210/A254 (1–2 kDa) 0.87 <0.001
243J O U R N A L O F E N V I R O N M E N T A L S C I E N C E S 4 2 ( 2 0 1 6 ) 2 3 6 – 2 4 5
relationship between rainfall intensity and the loads ofpollutants across each storm event. Event 3 had the highestlevels of rainfall intensity which led to the highest pollution.The stormwater quality of Event 2 was lower than that ofEvent 1 which followed also the rainfall intensity levels. Thegood distributions of samples throughout the flow variationsproved that the protocol of an approximately 25 mm change inwater level to trigger sample collection was valid and couldrepresent effectively the character of stormwater flow events.
We also applied statistical analysis tools to evaluate theresults generated from the HPSEC profiles and general waterquality parameters. As a result of multiplying by the corre-sponding water level, the A210/A254 values averaged over a1–2 kDa range were found to be correlated strongly with theSUVA254 (R2 > 0.91), and the A210/A254 values averaged overthe 0.3–2 kDa range were correlated with the specific colour(R2 = 0.83) (Fig. 5). Compared to Fig. 5b, all linear regressionsrepresented in Fig. 5a were stronger on the basis of R2 values.These observations imply that the value of A210/A254 aver-aged over 1–2 kDa range are affected by DOM aromaticity,whereas the specific colour values were not only dependenton aromatic contents associated with AMW 1–2 kDa rangebut were also a reflection of the non-aromatic contentinvolved in AMW below 1 kDa. This finding indicates thatA210/A254 could be used to simplify complex HPSEC profilesand effectively represent DOM character changes during astorm event.
y = 0.5529x-0.0008 R² = 0.9129
y = 0.5919x + 0.0019R² = 0.9358
y = 0.4498x + 0.0132
R² = 0.9317
0
0.05
0.10
0.15
0.20
0.25
0.30
0.35
0.40
0 0.2 0.4 0.6 0.8
Ave
rage
d A
210/
A25
4 (1-
2 kD
a)
SUVA254
a
Even 1
Even 2
Even 3
Fig. 5 – Correlation improved by runoff volume integration (a) betwe(b) between specific colour and A210/A254 averaged over AMW 0.3–2
2.6. Influence of seasonal variation
In order to statistically determine the influences of seasonalvariations on stormwater characteristics,weused the statisticaltools PPMC and ANOVA to assess the correlations betweencolour measurements and those water quality parameters.Table 3 indicates that turbidity was the only parameter foundto be unrelated to season related variables (p > 0.05) whencomparing the results of Event 3 and those of the combinedEvent 1 and Event 2. This could imply that the suspendedsubstances entering into surface water bodies were independentof seasonal changes. Other general parameters and A210/A254
averaged over the AMW range 1–2 kDa of DOMwere found to besignificant (p < 0.05). Due to the limited rainfall and surfacerunoff in the warmer season, microbial processes could explainthe associated increases in aromaticity andhigher results ofDOC,UV254, SUVA254, colour and specific colour.
Considering seasonal change influences as discussed above,both Event 1 and Event 2 occurred during rainy seasons, inwhich the stormwater samples may have had similar DOMcharacterisations, while Event 3 under hot summer conditionsshowed distinctively different DOM. Sharp et al. (2006) investi-gated the seasonal variation in surface water DOM inEngland and found that there was a significant change inDOM composition throughout the year. There was agreementbetween these observations and a similar study reported byChong et al. (2013). These authors also found that the dry-weather storm event differed from another three wet-weatherevents. In addition, fulvic-like and humic acid-like compoundsweremainly attributed to thedry-weather event. Allwet-weatherevent samples had higher concentration of soluble microbialby-product-like substances than other regions.
3. Conclusions
DOC and UV254, as conventional DOM parameters, were foundto be strongly correlated to the changes in stormwater qualityduring each storm event. Colour measurements of stormwaterwere indicative for both non-aromatic and aromatic compoundsof DOM. The profile of HPSEC–UV could provide additional
Ave
rage
d A
210/
A25
4 (0.
3-2
kDa)
y = 0.6231x + 0.0686R² = 0.8314
y = 0.8801x + 0.0051R² = 0.8373
y = 0.3205x + 0.105R² = 0.882
0
0.1
0.2
0.3
0.4
0.5
0.6
0.7
0.8
0 0.5 1 1.5 2Specific colour
b
Even 1
Even 2
Even 3
en SUVA254 and A210/A254 averaged over AMW 1–2 kDa,kDa. SUVA: specific ultraviolet absorbance; A: absorbance.
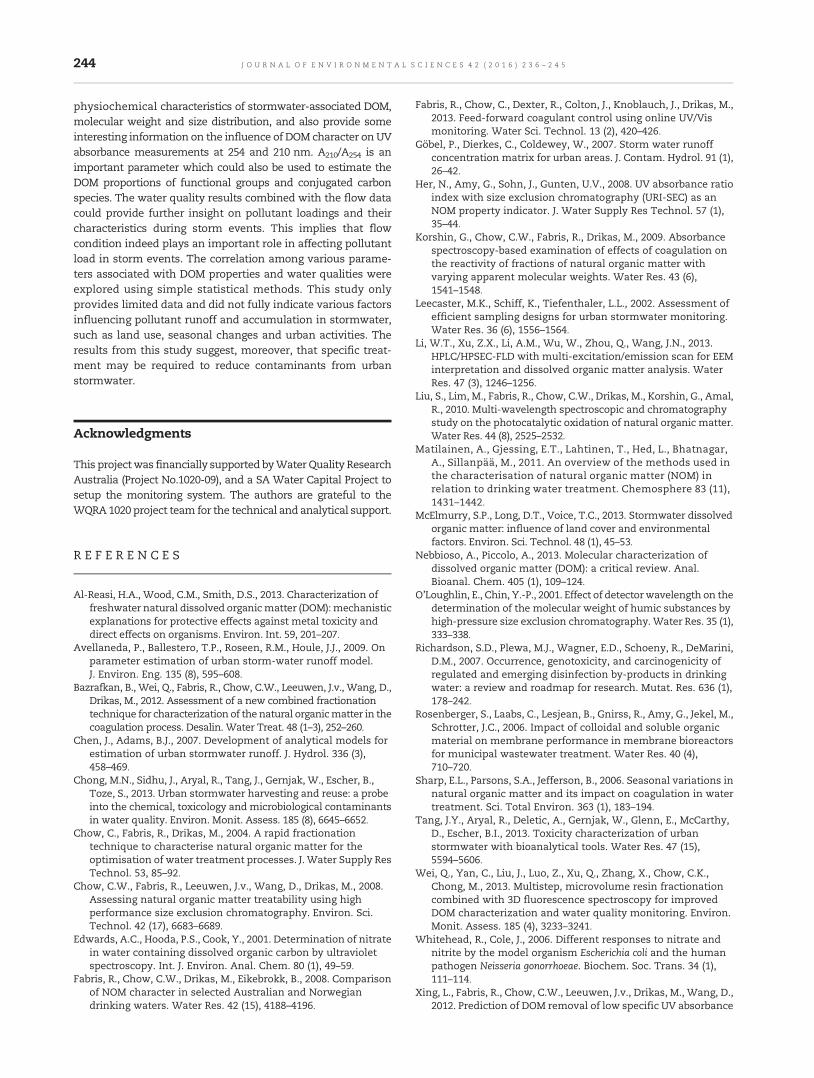
244 J O U R N A L O F E N V I R O N M E N T A L S C I E N C E S 4 2 ( 2 0 1 6 ) 2 3 6 – 2 4 5
physiochemical characteristics of stormwater-associated DOM,molecular weight and size distribution, and also provide someinteresting information on the influence of DOM character onUVabsorbance measurements at 254 and 210 nm. A210/A254 is animportant parameter which could also be used to estimate theDOM proportions of functional groups and conjugated carbonspecies. The water quality results combined with the flow datacould provide further insight on pollutant loadings and theircharacteristics during storm events. This implies that flowcondition indeed plays an important role in affecting pollutantload in storm events. The correlation among various parame-ters associated with DOM properties and water qualities wereexplored using simple statistical methods. This study onlyprovides limited data and did not fully indicate various factorsinfluencing pollutant runoff and accumulation in stormwater,such as land use, seasonal changes and urban activities. Theresults from this study suggest, moreover, that specific treat-ment may be required to reduce contaminants from urbanstormwater.
Acknowledgments
This projectwas financially supported byWater Quality ResearchAustralia (Project No.1020-09), and a SA Water Capital Project tosetup the monitoring system. The authors are grateful to theWQRA 1020 project team for the technical and analytical support.
R E F E R E N C E S
Al-Reasi, H.A., Wood, C.M., Smith, D.S., 2013. Characterization offreshwater natural dissolved organicmatter (DOM):mechanisticexplanations for protective effects against metal toxicity anddirect effects on organisms. Environ. Int. 59, 201–207.
Avellaneda, P., Ballestero, T.P., Roseen, R.M., Houle, J.J., 2009. Onparameter estimation of urban storm-water runoff model.J. Environ. Eng. 135 (8), 595–608.
Bazrafkan, B., Wei, Q., Fabris, R., Chow, C.W., Leeuwen, J.v., Wang, D.,Drikas, M., 2012. Assessment of a new combined fractionationtechnique for characterization of the natural organicmatter in thecoagulation process. Desalin. Water Treat. 48 (1–3), 252–260.
Chen, J., Adams, B.J., 2007. Development of analytical models forestimation of urban stormwater runoff. J. Hydrol. 336 (3),458–469.
Chong, M.N., Sidhu, J., Aryal, R., Tang, J., Gernjak, W., Escher, B.,Toze, S., 2013. Urban stormwater harvesting and reuse: a probeinto the chemical, toxicology and microbiological contaminantsin water quality. Environ. Monit. Assess. 185 (8), 6645–6652.
Chow, C., Fabris, R., Drikas, M., 2004. A rapid fractionationtechnique to characterise natural organic matter for theoptimisation of water treatment processes. J. Water Supply ResTechnol. 53, 85–92.
Chow, C.W., Fabris, R., Leeuwen, J.v., Wang, D., Drikas, M., 2008.Assessing natural organic matter treatability using highperformance size exclusion chromatography. Environ. Sci.Technol. 42 (17), 6683–6689.
Edwards, A.C., Hooda, P.S., Cook, Y., 2001. Determination of nitratein water containing dissolved organic carbon by ultravioletspectroscopy. Int. J. Environ. Anal. Chem. 80 (1), 49–59.
Fabris, R., Chow, C.W., Drikas, M., Eikebrokk, B., 2008. Comparisonof NOM character in selected Australian and Norwegiandrinking waters. Water Res. 42 (15), 4188–4196.
Fabris, R., Chow, C., Dexter, R., Colton, J., Knoblauch, J., Drikas, M.,2013. Feed-forward coagulant control using online UV/Vismonitoring. Water Sci. Technol. 13 (2), 420–426.
Göbel, P., Dierkes, C., Coldewey, W., 2007. Storm water runoffconcentration matrix for urban areas. J. Contam. Hydrol. 91 (1),26–42.
Her, N., Amy, G., Sohn, J., Gunten, U.V., 2008. UV absorbance ratioindex with size exclusion chromatography (URI-SEC) as anNOM property indicator. J. Water Supply Res Technol. 57 (1),35–44.
Korshin, G., Chow, C.W., Fabris, R., Drikas, M., 2009. Absorbancespectroscopy-based examination of effects of coagulation onthe reactivity of fractions of natural organic matter withvarying apparent molecular weights. Water Res. 43 (6),1541–1548.
Leecaster, M.K., Schiff, K., Tiefenthaler, L.L., 2002. Assessment ofefficient sampling designs for urban stormwater monitoring.Water Res. 36 (6), 1556–1564.
Li, W.T., Xu, Z.X., Li, A.M., Wu, W., Zhou, Q., Wang, J.N., 2013.HPLC/HPSEC-FLD with multi-excitation/emission scan for EEMinterpretation and dissolved organic matter analysis. WaterRes. 47 (3), 1246–1256.
Liu, S., Lim, M., Fabris, R., Chow, C.W., Drikas, M., Korshin, G., Amal,R., 2010. Multi-wavelength spectroscopic and chromatographystudy on the photocatalytic oxidation of natural organic matter.Water Res. 44 (8), 2525–2532.
Matilainen, A., Gjessing, E.T., Lahtinen, T., Hed, L., Bhatnagar,A., Sillanpää, M., 2011. An overview of the methods used inthe characterisation of natural organic matter (NOM) inrelation to drinking water treatment. Chemosphere 83 (11),1431–1442.
McElmurry, S.P., Long, D.T., Voice, T.C., 2013. Stormwater dissolvedorganic matter: influence of land cover and environmentalfactors. Environ. Sci. Technol. 48 (1), 45–53.
Nebbioso, A., Piccolo, A., 2013. Molecular characterization ofdissolved organic matter (DOM): a critical review. Anal.Bioanal. Chem. 405 (1), 109–124.
O'Loughlin, E., Chin, Y.-P., 2001. Effect of detectorwavelength on thedetermination of the molecular weight of humic substances byhigh-pressure size exclusion chromatography. Water Res. 35 (1),333–338.
Richardson, S.D., Plewa, M.J., Wagner, E.D., Schoeny, R., DeMarini,D.M., 2007. Occurrence, genotoxicity, and carcinogenicity ofregulated and emerging disinfection by-products in drinkingwater: a review and roadmap for research. Mutat. Res. 636 (1),178–242.
Rosenberger, S., Laabs, C., Lesjean, B., Gnirss, R., Amy, G., Jekel, M.,Schrotter, J.C., 2006. Impact of colloidal and soluble organicmaterial on membrane performance in membrane bioreactorsfor municipal wastewater treatment. Water Res. 40 (4),710–720.
Sharp, E.L., Parsons, S.A., Jefferson, B., 2006. Seasonal variations innatural organic matter and its impact on coagulation in watertreatment. Sci. Total Environ. 363 (1), 183–194.
Tang, J.Y., Aryal, R., Deletic, A., Gernjak, W., Glenn, E., McCarthy,D., Escher, B.I., 2013. Toxicity characterization of urbanstormwater with bioanalytical tools. Water Res. 47 (15),5594–5606.
Wei, Q., Yan, C., Liu, J., Luo, Z., Xu, Q., Zhang, X., Chow, C.K.,Chong, M., 2013. Multistep, microvolume resin fractionationcombined with 3D fluorescence spectroscopy for improvedDOM characterization and water quality monitoring. Environ.Monit. Assess. 185 (4), 3233–3241.
Whitehead, R., Cole, J., 2006. Different responses to nitrate andnitrite by the model organism Escherichia coli and the humanpathogen Neisseria gonorrhoeae. Biochem. Soc. Trans. 34 (1),111–114.
Xing, L., Fabris, R., Chow, C.W., Leeuwen, J.v., Drikas, M., Wang, D.,2012. Prediction of DOM removal of low specific UV absorbance

245J O U R N A L O F E N V I R O N M E N T A L S C I E N C E S 4 2 ( 2 0 1 6 ) 2 3 6 – 2 4 5
surface waters using HPSEC combined with peak fitting.J. Environ. Sci. 24 (7), 1174–1180.
Yan, M., Korshin, G., Wang, D., Cai, Z., 2012. Characterization ofdissolved organic matter using high-performance liquidchromatography (HPLC)–size exclusion chromatography(SEC) with a multiple wavelength absorbance detector.Chemosphere 87 (8), 879–885.
Zhao, Y.-Y., Boyd, J.M., Woodbeck, M., Andrews, R.C., Qin, F.,Hrudey, S.E., Li, X.F., 2008. Formation of N-nitrosamines fromeleven disinfection treatments of seven different surfacewaters. Environ. Sci. Technol. 42 (13), 4857–4862.

J O U R N A L O F E N V I R O N M E N T A L S C I E N C E S 4 2 ( 2 0 1 6 ) 2 4 6 – 2 5 8
Ava i l ab l e on l i ne a t www.sc i enced i r ec t . com
ScienceDirect
www. jou rna l s . e l sev i e r . com/ j es
Emissions from the combustion of eucalypt and pine chips in afluidized bed reactor
E.D. Vicente1, L.A.C. Tarelho1, E.R. Teixeira1, M. Duarte1, T. Nunes1, C. Colombi2,V. Gianelle2, G.O. da Rocha3, A. Sanchez de la Campa4, C.A. Alves1,⁎
1. Centre for Environmental and Marine Studies, Department of Environment and Planning, University of Aveiro, 3810-193 Aveiro, Portugal2. Regional Centre for Air Quality Monitoring, Environmental Monitoring Sector ARPA, Lombardia, 20129 Milan, Italy3. Federal University of Bahia, Chemical Institute, 40170-290, Campus de Ondina, Salvador, BA, Brazil4. Centre for Research in Sustainable Chemistry (CIQSO), Joint Research Unit to CSIC “Atmospheric Pollution”, University of Huelva, Campus ElCarmen, Huelva, Spain
A R T I C L E I N F O
⁎ Corresponding author. E-mail : celia.alves@
http://dx.doi.org/10.1016/j.jes.2015.07.0121001-0742/© 2015 The Research Center for Ec
A B S T R A C T
Article history:Received 16 May 2015Revised 18 July 2015Accepted 20 July 2015Available online 1 October 2015
Interest in renewable energy sources has increased in recent years due to environmentalconcerns about global warming and air pollution, reduced costs and improved efficiency oftechnologies. Under the European Union (EU) energy directive, biomass is a suitablerenewable source. The aim of this study was to experimentally quantify and characterizethe emission of particulate matter (PM2.5) resulting from the combustion of two biomassfuels (chipped residual biomass from pine and eucalypt), in a pilot-scale bubbling fluidizedbed (BFB) combustor under distinct operating conditions. The variables evaluated were thestoichiometry and, in the case of eucalypt, the leaching of the fuel. The CO and PM2.5
emission factors were lower when the stoichiometry used in the experiments was higher(0.33 ± 0.1 g CO/kg and 16.8 ± 1.0 mg PM2.5/kg, dry gases). The treatment of the fuel byleaching before its combustion has shown to promote higher PM2.5 emissions (55.2 ±2.5 mg/kg, as burned). Organic and elemental carbon represented 3.1 to 30 wt.% of theparticle mass, while carbonate (CO3
2−) accounted for between 2.3 and 8.5 wt.%. Theparticulate mass was mainly composed of inorganic matter (71% to 86% of the PM2.5
mass). Compared to residential stoves, BFB combustion generated very high mass fractionsof inorganic elements. Chloride was the water soluble ion in higher concentration in thePM2.5 emitted by the combustion of eucalypt, while calcium was the dominant watersoluble ion in the case of pine.© 2015 The Research Center for Eco-Environmental Sciences, Chinese Academy of Sciences.
Published by Elsevier B.V.
Keywords:BiomassCombustionFluidized bedPM2.5 emissionsChemical composition
Introduction
The growing interest in developing alternatives to fossil fuelshas led the scientific community and other decision makersto consider other sources of energy (Brunner et al., 2009; Khanet al., 2009; McKendry, 2002; Obaidullah et al., 2012; Vamvukaand Sfakiotakis, 2011). The use of renewable energy sources
ua.pt (C.A. Alves).
o-Environmental Science
will become more important as the reserves of fossil fuelsbecome smaller. The renewable energy sources increase thepossibilities for self-sufficiency and can play an importantrole in reducing the greenhouse gas emissions (Nussbaumer,2008; Saidur et al., 2011). Under the European Union (EU)energy directive, biomass is an eligible renewable source. Thedevelopment of competitive biofuel conversion technologies
s, Chinese Academy of Sciences. Published by Elsevier B.V.
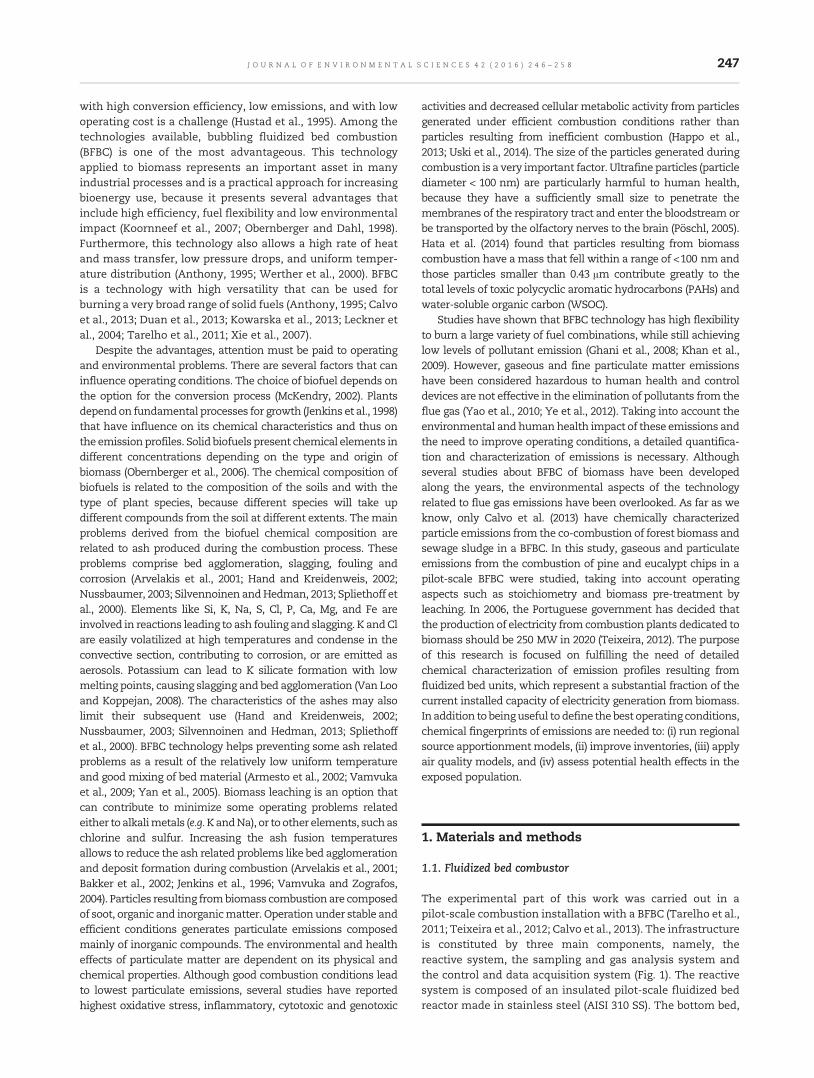
247J O U R N A L O F E N V I R O N M E N T A L S C I E N C E S 4 2 ( 2 0 1 6 ) 2 4 6 – 2 5 8
with high conversion efficiency, low emissions, and with lowoperating cost is a challenge (Hustad et al., 1995). Among thetechnologies available, bubbling fluidized bed combustion(BFBC) is one of the most advantageous. This technologyapplied to biomass represents an important asset in manyindustrial processes and is a practical approach for increasingbioenergy use, because it presents several advantages thatinclude high efficiency, fuel flexibility and low environmentalimpact (Koornneef et al., 2007; Obernberger and Dahl, 1998).Furthermore, this technology also allows a high rate of heatand mass transfer, low pressure drops, and uniform temper-ature distribution (Anthony, 1995; Werther et al., 2000). BFBCis a technology with high versatility that can be used forburning a very broad range of solid fuels (Anthony, 1995; Calvoet al., 2013; Duan et al., 2013; Kowarska et al., 2013; Leckner etal., 2004; Tarelho et al., 2011; Xie et al., 2007).
Despite the advantages, attention must be paid to operatingand environmental problems. There are several factors that caninfluence operating conditions. The choice of biofuel depends onthe option for the conversion process (McKendry, 2002). Plantsdependon fundamental processes for growth (Jenkins et al., 1998)that have influence on its chemical characteristics and thus onthe emissionprofiles. Solid biofuels present chemical elements indifferent concentrations depending on the type and origin ofbiomass (Obernberger et al., 2006). The chemical composition ofbiofuels is related to the composition of the soils and with thetype of plant species, because different species will take updifferent compounds from the soil at different extents. Themainproblems derived from the biofuel chemical composition arerelated to ash produced during the combustion process. Theseproblems comprise bed agglomeration, slagging, fouling andcorrosion (Arvelakis et al., 2001; Hand and Kreidenweis, 2002;Nussbaumer, 2003; Silvennoinen andHedman, 2013; Spliethoff etal., 2000). Elements like Si, K, Na, S, Cl, P, Ca, Mg, and Fe areinvolved in reactions leading to ash fouling and slagging. K andClare easily volatilized at high temperatures and condense in theconvective section, contributing to corrosion, or are emitted asaerosols. Potassium can lead to K silicate formation with lowmelting points, causing slagging and bed agglomeration (Van Looand Koppejan, 2008). The characteristics of the ashes may alsolimit their subsequent use (Hand and Kreidenweis, 2002;Nussbaumer, 2003; Silvennoinen and Hedman, 2013; Spliethoffet al., 2000). BFBC technology helps preventing some ash relatedproblems as a result of the relatively low uniform temperatureand good mixing of bed material (Armesto et al., 2002; Vamvukaet al., 2009; Yan et al., 2005). Biomass leaching is an option thatcan contribute to minimize some operating problems relatedeither toalkalimetals (e.g.KandNa), or toother elements, suchaschlorine and sulfur. Increasing the ash fusion temperaturesallows to reduce the ash related problems like bed agglomerationand deposit formation during combustion (Arvelakis et al., 2001;Bakker et al., 2002; Jenkins et al., 1996; Vamvuka and Zografos,2004). Particles resulting frombiomass combustion are composedof soot, organic and inorganicmatter. Operation under stable andefficient conditions generates particulate emissions composedmainly of inorganic compounds. The environmental and healtheffects of particulate matter are dependent on its physical andchemical properties. Although good combustion conditions leadto lowest particulate emissions, several studies have reportedhighest oxidative stress, inflammatory, cytotoxic and genotoxic
activities and decreased cellular metabolic activity from particlesgenerated under efficient combustion conditions rather thanparticles resulting from inefficient combustion (Happo et al.,2013; Uski et al., 2014). The size of the particles generated duringcombustion is a very important factor. Ultrafine particles (particlediameter < 100 nm) are particularly harmful to human health,because they have a sufficiently small size to penetrate themembranes of the respiratory tract and enter the bloodstream orbe transported by the olfactory nerves to the brain (Pöschl, 2005).Hata et al. (2014) found that particles resulting from biomasscombustion have amass that fell within a range of <100 nm andthose particles smaller than 0.43 μm contribute greatly to thetotal levels of toxic polycyclic aromatic hydrocarbons (PAHs) andwater-soluble organic carbon (WSOC).
Studies have shown that BFBC technology has high flexibilityto burn a large variety of fuel combinations, while still achievinglow levels of pollutant emission (Ghani et al., 2008; Khan et al.,2009). However, gaseous and fine particulate matter emissionshave been considered hazardous to human health and controldevices are not effective in the elimination of pollutants from theflue gas (Yao et al., 2010; Ye et al., 2012). Taking into account theenvironmental andhumanhealth impact of these emissions andthe need to improve operating conditions, a detailed quantifica-tion and characterization of emissions is necessary. Althoughseveral studies about BFBC of biomass have been developedalong the years, the environmental aspects of the technologyrelated to flue gas emissions have been overlooked. As far as weknow, only Calvo et al. (2013) have chemically characterizedparticle emissions from the co-combustion of forest biomass andsewage sludge in a BFBC. In this study, gaseous and particulateemissions from the combustion of pine and eucalypt chips in apilot-scale BFBC were studied, taking into account operatingaspects such as stoichiometry and biomass pre-treatment byleaching. In 2006, the Portuguese government has decided thatthe production of electricity fromcombustion plants dedicated tobiomass should be 250 MW in 2020 (Teixeira, 2012). The purposeof this research is focused on fulfilling the need of detailedchemical characterization of emission profiles resulting fromfluidized bed units, which represent a substantial fraction of thecurrent installed capacity of electricity generation from biomass.In addition to beinguseful todefine the best operating conditions,chemical fingerprints of emissions are needed to: (i) run regionalsource apportionmentmodels, (ii) improve inventories, (iii) applyair quality models, and (iv) assess potential health effects in theexposed population.
1. Materials and methods
1.1. Fluidized bed combustor
The experimental part of this work was carried out in apilot-scale combustion installation with a BFBC (Tarelho et al.,2011; Teixeira et al., 2012; Calvo et al., 2013). The infrastructureis constituted by three main components, namely, thereactive system, the sampling and gas analysis system andthe control and data acquisition system (Fig. 1). The reactivesystem is composed of an insulated pilot-scale fluidized bedreactor made in stainless steel (AISI 310 SS). The bottom bed,

Temperature
PressureSample Gas (SG)
Water (out)
Ter
cear
y ai
r
Prim
ary
air C
H
A
ID
B
N
G
F
H
UCC2
Water (in)
C3H8
E Temperature
Pressure
N2
Zero gas (ZG)
L
UCD0
Pressure
045000
UCD1
SG
ZG
ZG
SG
Sample gas(SG)
UCE1
ADC-O2
UCD3
Com
pres
sed
dry
air
Biomass feeder 1
JWater (out)
Water (in)
Biomass feeder 2
Zirconia cell probe for O2 (ZC)
K
Ice
bath
Condensing material
Ice
bath
SGSG
Pressureregulators
Secondary air
M MIR-CO2, CO
Terceary air
H
Seco
ndar
y ai
r
Cyclone
Exit flue gases to fan
Particlesampling port
Electric circuit
Pneumatic circuit
Fig. 1 – Schematic representation of the pilot-scale combustion installation. A: primary air heating system; B: sand bed; C: bedsolids level control; D: bed solids discharge; E: bed solids discharge silo; F: propane burner system; G: port for bed surfacevisualization; H: air flow meter; I: control and command unit; J: biomass feeder; K: water-cooled gas sampling probe; L: gassampling pump; M: gas condensation unit; N: exhaust duct to cyclone. UCD0, UCD1, and UCD3 refer to command and gasdistribution units, UCC2 refers to control and command unit, UCE1 refers to electronic command unit, and ADC andMIR refer tothe online analyzers.
248 J O U R N A L O F E N V I R O N M E N T A L S C I E N C E S 4 2 ( 2 0 1 6 ) 2 4 6 – 2 5 8
with a static height of 0.20 m, consisted of sand particles(mainly composed of quartz) ranging in size between 0.25 and0.71 mm. The BFBC had an inner diameter of 0.25 m and was3.0 m in height. It integrated a whole set of accessoryelements that allow the operation of the reactor, including aunity responsible for controlling electric and pneumaticcircuits. The system also comprised the fuel feed unit andthe refrigeration water setup.
The biomass feed system was located on the top of thereactor and allows the independent and simultaneous feedingof two fuels; biomass particles were dropped at the bedsurface through a vertical tube located inside the freeboard(Fig. 1). In Portuguese industrial BFB combustors the biomassis typically discharged throughout ports located at the furnacewall and above bed surface. The biomass was injectedthrough rotary valves and air jests in order to spread the fuelat the freeboard region just above the bed, and then the fuelstarted to dry and devolatilize as it dropped at the bed surface.In the pilot-scale BFB combustor used in the present study, avertical tube was installed in order to simulate the fuelfeeding at bed surface, and to allow the adjustment of theheight at which the fuel is dropped-off at bed surface. Theconfiguration used also promoted a pre-drying of the fuel as itfell along the tube in case of using highmoisture fuels and thebiomass was also fed together with air at bed surface.
The combustion air was distributed in three stages: primaryair through the distribution plate, secondary air was added
0.2 m above the bed surface and tertiary air was added at 0.9 mabove the bed surface. The supply of tertiary combustion air inthe burnout zone allowed to almost completely oxidize thegaseous compounds emerging from the first and second stagesof combustion (the lower part of the reactor). The addition oftertiary air to the freeboard region enabled the air to be stagedbetween the bed and the freeboard, for example, forNOx control(Tarelho et al., 2011), and provided increased gas-phase mixingin order to achieve efficient conversion of the fuel. The injectionof combustion air into the BFBC was performed in accordancewith the air staged combustion concept.
The pressure and temperature of the combustion fluegases were monitored through nine water-cooled samplingprobes located at different heights along the reactor. Two ofthem were immersed in the bed and the rest of the samplingprobes were distributed along the freeboard. Every samplingprobe was equipped with an external circulating quenchingwater sleeve, a cooled particle filter at the rear of the probe, aK-type thermocouple, and a cerablanket plug at the tip,located inside the combustion chamber, in order to filterparticles from the flue gas.
The combustion process in a fluidized bed reactor releasedsignificant amounts of heat. The refrigeration system of thefluidized bed intended to control the temperature byextracting heat through water cooled probes located insidethe reactor. In this system, the working fluid was liquid waterand cooling of the fluid was achieved in a refrigeration tower.

Table 1 – Chemical composition of the solid biomass fuels.
Eucalypt Leached eucalypt Pine
Proximate analysis (wt.%, as received)Moisture 11.8 10.4 12.7Ash 2.53 2.07 1.07Volatile matter 80.6 81.2 81.6Fixed carbon 5.12 6.36 4.63
Ultimate analysis (wt.%, dry basis)Ash 2.87 2.31 1.23C 44.58 44.06 48.40H 5.95 5.73 6.47N 0.34 0.41 0.17S nd nd ndO (by difference) 46.3 47.5 43.74
nd: not determined, below detection limit (100 ppm) of themethod.
249J O U R N A L O F E N V I R O N M E N T A L S C I E N C E S 4 2 ( 2 0 1 6 ) 2 4 6 – 2 5 8
1.2. Fuel characteristics
Two types of biomass commonly used in Portugal in indus-trial combustion facilities for heat and power production wereused as fuel in the combustion experiments: residual forestbiomass from eucalypt (Eucalyptus globulus) and pine (Pinuspinaster) felling. The chemical composition of these biofuels isshown in Table 1.
To ensure proper performance of a combustion system, thepre-treatment of biomass is necessary. This pre-treatmentcan include a refinement of its physical (such as particle sizeand density) and chemical characteristics. In this work, theparticle size of biomass fuels was reduced in order to matchthe characteristics of the feed system (screw feeder) of theBFBC. Forest biomass residues were chipped, air dried, andsieved to obtain particles with equivalent size below 10 mm.The effect of biomass leaching on the fuel characteristics wasalso studied. After chipping, a fraction of eucalypt biomasswas allowed to leach under atmospheric conditions (leachingby rainwater at atmospheric conditions) over a six-monthperiod. At the end of the leaching period, this biomass wasthen laid to dry. A more detailed description of the leachingprocess can be found elsewhere (Teixeira et al., 2012). The goalwas to study the effect of leaching on the characteristics of thebiomass and on emissions resulting from the combustionprocess.
1.3. Combustion experiments and operating conditions
During the reactor operation it is possible to distinguish twophases, namely, the pre-heating phase and the biomasscombustion phase. The pre-heating phase was conductedwith propane combustion in order to raise the temperature ofthe reactor until the bed reached a value around 500°C;simultaneously, the fluidizing air was heated through anelectric oven. After that, the addition of solid fuel wasinitiated. When the bed temperature reached about 750°Cthe auxiliary heating systems (gas and electric oven) wereswitched off and the reactor began to operate only with theaddition of solid fuel. The second phase consisted in theoperation under stationary conditions at the desired temper-ature and stoichiometry range.
The experiments were planned to keep similar reactorhydrodynamics. The combustion air was supplied in threestages: primary air (67% of the total combustion air), second-ary combustion air (17% of the total combustion air) andtertiary combustion air (16% of the total combustion air).The stoichiometry of the combustion experiments waspre-established and adjusted through the fuel feed rate. Aset of eight water cooled probes immersed in the bottom bedallowed the control of the temperature of this zone at thedesired value.
The combustion experiments aimed at evaluating theinfluence of the fuel, stoichiometry and biomass leaching onthe flue gas composition and particulate matter characteris-tics (Table 2). The flue gas sampling (gaseous compounds andparticulate matter) was made under steady state operatingconditions of the BFBC. The steady state operating conditionswere evaluated by continuous monitoring of both tempera-ture and pressure along the reactor height, as well as the exit
flue gas composition; the steady condition was considered asachieved when the bed temperature and the exit flue gascomposition were stable along the time.
1.4. Gas sampling and measurement techniques
The gas sampling and analysis system consisted of a set ofsampling probes located along the reactor height, a set ofelectropneumatic control and gas distribution units, a samplingpump, a set of automatic online gas analyzers, a zirconiumprobe located inside the reactor for in-situ monitoring of O2
concentration, 15 thermocouples and a pressure sensor. Com-bustion flue gas was sampled through a sampling probe locatedat 2.2 m height above the distributor plate (Fig. 1). After coolingand drying, the flue gas composition was continuously moni-tored for O2 using a paramagnetic online analyzer (modelO2-700, ADC, UK) with a Servomexmodule, and for CO2 and COusing a non-dispersive infrared analyzer (model MIR 9000,Environnement, France).
1.5. Particle sampling and measurement techniques
Fine particles (PM2.5) were sampled under isokinetic conditionswith the reactor operating under steady state conditions. Eachfilter was sampled over a period that ranged from 5 to 15 min inorder to collect sufficient particulate matter for subsequentchemical analysis and, at the same time, preventing clogging ofthe filters. A low volume sampler (model 2.004.01TCR, Tecora,Italy) was used to collect PM2.5 onto quartz filters with 47 mm indiameter. The sampling equipment is constituted by a specificsampling head (PM2.5), a pump operating in a range between38.0 and 38.5 L/min (at atmospheric pressure and temperature),and a data storage and control unit. PM2.5 was collected after acyclone with approximately 1 m in height and 0.1 mm indiameter (AISI 304 steel plate of 1.5 mm) with tangential inlet.The flue gas temperature in the cyclone was around 135°C, andthe pressure drop across it was typically 0.15 m H2O. In thisequipment, the flue gas is submitted to centrifugal andgravitational forces, which promote the removal of someparticles (Flagan and Seinfeld, 1998). The collection efficiencyof this equipment is high for coarse and heavy particles(>50 μm), but limited for fine particles (Van Loo and Koppejan,

250 J O U R N A L O F E N V I R O N M E N T A L S C I E N C E S 4 2 ( 2 0 1 6 ) 2 4 6 – 2 5 8
2008; Nussbaumer, 2008). For each combustion condition, fivereplicate filters were sampled.
1.6. Data analysis
The PM2.5 and particulate chemical compound emission factorswere calculated according to Eq. (1), in which EFi,Δt (mg/kg) isthe emission factor of compound i, as burned, in the samplinginterval Δt (corresponding to a sampled filter), Ci (mg/Nm3) isthe concentration of compound i in the exit flue gas, QN (Nm3/sec) is themean flow rate during the sampling interval, Δt is thesampling interval time (sec) for a filter and Δm (kg) is the massconsumed (dry basis) during the sampling interval.
EFi ;Δt ¼Ci � Δt � QN
Δmð1Þ
The number of PM2.5 samples collected in the outlet cycloneduct (0.10 m of internal diameter) during each combustionexperiment ranged from 3 to 9. Since the sampling time andthus the mass of fuel consumed during the sampling intervalwas similar in each experiment, the arithmetic mean of theemission factors was performed in order to estimate globalemission factors for each combustion experiment.
For the gaseous components, the emission factors werecalculated according to Eq. (2), in which EFy (g/kg) is theemission factor, dry basis, with y denoted as CO or CO2, Ci (g/Nm3) is the concentration of compound i in the exit flue gas,dry basis, QN (Nm3/sec) is the mean combustion gas flow rate,t (sec) is time, m (kg) is the mass of fuel burned (dry basis)during the sampling interval.
EFy ¼ Cy � t � QN
mð2Þ
1.7. Analytical methodologies
In order to eliminate organic contaminants, the quartz fiberfilters used for particulate matter sampling were baked for6 hr at 600°C previously to the gravimetric determination witha microbalance (model AG245, Mettler Toledo, Switzerland)(readability—0.1 mg/0.01 mg). For each filter, the weight wasobtained from the average of six measurements; the varia-tions were less than 0.02%.
Carbonates in particulatematter samples were determinedby acidification with phosphoric acid (H3PO4) and determina-tion of the CO2 evolved. Two punches of 5 mm in diameterwere used in each analysis. Blank filters were analyzed for thecorrection of the obtained values. After flushing out the glassenclosurewith nitrogen (N2), the samplewas dipped into the acidsolution for about 3 min. After that, the N2 linewas open in order
Table 2 – Experimental conditions during biomass combustion
Experiments Fuel Particle diameter(mm)
Fuel rate (khr)
E Eucalypt <10 4.6LE Leached
Eucalypt<10 3.2
P1 Pine <10 4.0P2 <10 2.4
to carry the CO2 that evolves to the infrared detector. Thequantification of carbonates was carried out by integrating thearea under the curve corresponding to the CO2 concentrationread by the analyzer. The N2 flow rate was about 200 mL/min (atatmospheric pressure and temperature).
The carbonaceous content of PM2.5 was analyzed after theremoval, by acidification, of carbonates in the samples. To thisend, two punches of 9 mm diameter of each sample wereexposed to HCl vapors for 5 hr in a desiccator. Subsequently,HCl in excess was removed by keeping the samples in adesiccator over NaOH for 24 hr. The organic carbon (OC) andelemental carbon (EC) of particulate matter were analyzed by athermo-optical system. Briefly, this method consisted in thevolatilization of the particulate carbon and its differentiation intoseveral fractions by means of controlled heating, with subse-quent conversion by oxidation to CO2 for detection. Themonitoring of the blackening of the filter using a laser beamand a photodetector measuring the filter light transmittanceallowed separating the EC formedbypyrolysis of OC from the onethat was originally in the sample (Gonçalves et al., 2014).
To carry out the determination of levoglucosan, elements andwater soluble ions, circular filter punches from the variousreplicate samples were combined and analyzed together inorder to obtain mean values for each combustion experiment.
Levoglucosan was determined by high-performanceanion-exchange chromatography with pulsed amperometricdetection (HPAE-PAD). The chromatograph (model 881,Metrohm,Switzerland) was equipped with an auto sampler Methrom, anamperometric detector for levoglucosan (module 896, PADmode,Metrohm, Switzerland), and a column Metrosept carb 1(150 mm × 4 mm id). Particulate matter on each filter punch(1.5 cm2) was extracted with Milli-Q water (10 mL) throughultrasonic agitation. After extraction, the solution was filtratedthrough a polypropylene puradisc (0.45 μm porosity, 25 mmdiameter). The detection limit of the method was 0.075 μg/cm2.
Each set of filter punches was subjected to acid digestion (amixture of 1.25 mL HNO3, 2.5 mL HF, and 1.25 mL HClO4)following the method proposed by Querol et al. (2001) for theanalysis of major and trace elements by means of inductivelycoupled plasma atomic emission spectrometry (ICP-AES)(Jarrell Ash IRIS Advantage, Thermo Scientific, USA) andinductively coupled plasma mass spectrometry (ICP-MS) (XSeries II, Thermo Scientific, USA), respectively. Threemulti-elemental solutions Spec® 1 (rare earth elements,REE), Spec® 2 (alkalis, earth alkalis, and metals) and Spec® 4(Nb) were used to develop external calibration curves. Themean precision and accuracy fall below typical analyticalerror and are in the ranges of 3%–5% and <10% for ICP-AESand ICP-MS, respectively, and were controlled by repeatedanalysis of 0.025 mg of NBS-1633b (fly ash) reference material
in the bubbling fluidized bed.
g/ Temperature of bed (°C)
O2 concentration (vol.%, drygases)
808 3.7 ± 0.62807 7.3 ± 0.38
804 3.8 ± 0.33804 9.6 ± 0.17

251J O U R N A L O F E N V I R O N M E N T A L S C I E N C E S 4 2 ( 2 0 1 6 ) 2 4 6 – 2 5 8
(NIST, Gaithersburg, MD, USA). The detection limits were0.01 ng/m3 for most of the trace elements analyzed.
The filter punches for cation and anion analysis wereplaced in a 5 mL screwed cap vial and extracted with 2 mL 2%(V/V) isopropanol (analytical grade, J.T. Baker, USA) andultrapure water under 10 min mechanical agitation. Extractswere filtered through Millex units and the sample extractswere injected in the ion chromatograph. A dual-system ionchromatograph–conductance detector equipped with a cationisocratic module (model ICS 1100, Dionex, USA), an aniongradient module (model ICS 2100, Dionex, USA), an AS-DV 40autosampler, and an eluent regenerator system (RFIC-ER,Dionex, USA) was used in this study. This system enablessimultaneous injection in both cation and anion modules anddetermination of cations and anions simultaneously. Adetailed description of the method and the system can befound elsewhere (Domingos et al., 2012).
It is not possible to provide particulate mass fractions ofelements and water soluble ions in samples from pine combus-tion under condition P1 (pine, 4.9% O2) given that, because of theneed to repeat the analyses of the carbonaceous fraction (OC, ECand CO3
2−), the leftover filter area was not sufficient to carry outthe determination of inorganic constituents.
2. Results and discussion
2.1. Operating conditions
The pressure and temperature profiles along the reactorheight during the combustion experiments are shown inFig. 2. The maximum pressure value was reached at the levelof the primary air injectors, on the base of the bubblingfluidized bed. Pressure decreased with bed height and wasalmost uniform along the freeboard height. The values in thefreeboard were close to atmospheric pressure. Differencesbetween absolute pressure values in the BFBC during thecombustion experiments are related to differences in thevalue of atmospheric pressure in the days when the experi-ments were carried out.
Temperature peaked just above the biomass feedinglocation and secondary air injection (0.40 m above thedistribution plate). The high temperature occurring here isrelated to the gas phase combustion of volatiles released from
Height above distribution plate (cm)
0 50 100 150 200 250
Tem
pera
ture
(ºC
)
0
200
400
600
800
1000
1200
Pre
ssur
e (k
Pa)
101
102
103
104
105Temperature_ETemperature_LEPressure_EPressure_LE
Fix
ed b
ed
Flu
idiz
ed b
ed
Fre
eboa
rdE
xhau
stio
n
BiomassSecondary air
Fig. 2 – Longitudinal temperature and pressure profiles along theeucalypt and pine combustion experiments. E, LE, P1, and P2 ref
biomass, which mainly occurs in this zone (Calvo et al., 2013;Tarelho et al., 2011). Temperature increased from inside thebed to the freeboard, reached its maximum value above thebiomass feeding and secondary air injection points, anddecreased in the space above. In general, the temperature inthe freeboard was higher than that observed inside the bed.For the experiments E (combustion of eucalypt) and P1(Table 2), the lowest temperature was observed in the bed.During the combustion of pine under higher stoichiometry(P2) and leached eucalypt (LE), for points located at 1.70 mabove the distributor plate, the temperature decreased tovalues lower than that observed inside the bed. The highesttemperatures in the BFBC were observed during combustionof pine chips with lower stoichiometry (P1). The O2 concen-tration in the BFBC decreased with the decrease in stoichi-ometry, i.e., with the increase of the biomass fuel/combustionair ratio. Considering that the combustion air flow rate wasmaintained constant for the distinct combustion experi-ments, higher fuel rates originated higher thermal energyoutput, and thus higher temperatures in the BFBC. Thetemperature profiles along the reactor height observed in thepresent work are similar to those observed in other studies(Tarelho et al., 2011).
2.2. Gaseous emissions
The CO2, CO and O2 concentration in the exit flue gas alongtime during the combustion experiments are shown in Fig. 3.The CO2 profile over time showed a behavior complementaryto that observed for O2, i.e., the CO2 concentration decreasedwhen the O2 concentration increased, reflecting the relation-ship between reactant (O2) and product (CO2) in a chemicalreaction.
The CO2 concentration in the flue gas from eucalyptcombustion was, on average, higher (17.2 ± 0.94 vol.%, drygases) in the experiment E and lower (12.9 ± 0.40 vol.%, drygases) in the experiment LE, due to the higher stoichiometryof the latter. For combustion of pine chips, the P2 experimentgenerated the lowest CO2 concentration (10.7 ± 0.22 vol.%, drygases), while the lowest stoichiometry (P1) produced a flue gaswith an average CO2 concentration of 16.6 ± 0.29 vol.% (drygases).
Due to the lower stoichiometry, the average CO concen-tration in the exit flue gas from the combustion of eucalypt
Height above distribution plate (cm)
0 50 100 150 200 250
Tem
pera
ture
(ºC
)
0
200
400
600
800
1000
1200
Pre
ssur
e (k
Pa)
101
102
103
104
105
Temperature_P2Temperature_P1Pressure_P2Pressure_P1
Fix
ed b
ed
Flu
idiz
ed b
ed
Fre
eboa
rdE
xhau
stio
n
BiomassSecondary air
pilot-scale bubbling fluidized bed combustion (BFBC) duringer to Table 2.

252 J O U R N A L O F E N V I R O N M E N T A L S C I E N C E S 4 2 ( 2 0 1 6 ) 2 4 6 – 2 5 8
chips was higher in experiment E (5636 ± 2024 ppmV) (Fig. 3).Although operating under steady state conditions, the COconcentration profiles over time in the experiments witheucalypt showed fluctuations. These fluctuations were relat-ed to irregularities in the fuel feeding, and a consequence ofthe physical characteristics of the chipped eucalypt.
During the experiments with leached eucalypt, the averageO2 and CO2 concentrations in the exit flue gases were 7.3 vol.%and 525 ± 164 ppmV (dry gases), respectively (Table 2). Thislower CO concentration is due to a higher combustion efficiencyassociated with higher stoichiometry when compared to thatobserved during experiment E with chipped eucalypt. Neverthe-less, it was also observed that the biomass feeding conditionswere improved (less fluctuations) during leached eucalyptcombustion, because the biomass particles were more breakableand easily transported by the screw feeder.
For a similar O2 level in the exit flue gases, the COconcentration during pine combustion was lower than thatobserved during eucalypt combustion (see experiments P1 forpine and E for eucalypt in Table 2 and Fig. 3). A more stablefeeding of chipped pine when compared to chipped eucalyptmay explain this result. Thus, CO concentrations presentedlower fluctuations for pine than for eucalypt.
The CO concentration in the exit flue gas during thecombustion of pine with lower stoichiometry (P1) (622 ±252 ppmV, dry gases) was higher than with higher stoichiom-etry (P2) (32.2 ± 9.8 ppmV, dry gases). This latter promotes amore efficient oxidation of the fuel (char and volatiles).
The highest CO2 emission factor was observed for thecombustion of pine with higher stoichiometry (P2) (Fig. 4a).Higher carbon content in pine (Table 1) and better combustionefficiency (lower CO concentration, Fig. 2) contribute to ahigher CO2 emission factor. The CO emission factors foreucalypt chips were higher in experiment E when compared
Time (sec)
CO
2 and
O2 (
vol.%
dry
gas
es)
CO
2 and
O2 (
vol.%
dry
gas
es)
0
2
4
6
8
10
12
14
16
18
20
CO
(pp
mV
dry
gas
es)
0
2000
4000
6000
8000
10000
12000P1
E
CO2
CO2
CO
O2
O2
Time (sec)
0
2
4
6
8
10
12
14
16
18
20
CO
(pp
mV
dry
gas
es)
0
2000
4000
6000
8000
10000
12000
CO
0 200 400 600 800 1000 1200 1400 1600 1800 2000
0 200 400 600 800 1000 1200 1400 1600 1800 2000
Fig. 3 – CO, CO2 and O2 concentrations in the exit flue gases alo
with LE (Fig. 4b) due to a lower combustion efficiency.Leaching the fuel and using a higher stoichiometry seem tobe effective ways of reducing emissions of compounds fromincomplete combustion (Fig. 4b). The t-test (α = 0.05) revealedthat the difference between the two conditions was statisti-cally significant (p = 0.0001). In a similar way, when the fuelwas chipped pine, a higher CO emission factor was observedduring the combustion with lower stoichiometry (P1), whencompared to the operation with higher O2 concentration (P2).The difference between the P1 and P2 experiments was foundto be statistically significant (p = 0.0209). For similar stoichi-ometry, the CO emission factor was lower for pine than foreucalypt (Fig. 4b). There was a significant difference betweenCO emission factors from the two fuels (p = 0.0022). As statedbefore, despite differences in reactivity of the two biomassfuels, this can also derive from a more regular feeding of pine.
2.3. Particulate matter emissions
Generally speaking, primary fine particles can be divided intothree categories according to their origin and formationmechanisms: ash (inorganic), soot (elemental carbon) andorganic material. Ash originates from inorganic non-combus-tible material introduced into the furnace, while soot andorganics are combustible material (Sippula, 2010). The nucle-ation mode consists of aerosols composed mainly of volatilesthat are formed as exhaust gases dilutes and cools. Thegrowth mechanisms of aerosol particles, which are at theorigin of the accumulationmode, involve vapor condensation,coagulation, agglomeration, surface reactions and adsorption(Valmari, 2000). A detailed explanation of the particle forma-tion mechanisms can be found elsewhere (e.g. Obaidullah etal., 2012; Biedermann and Obernberger, 2005). Some worksrefer that fly ashes formed during biomass combustion in
CO
2 and
O2 (
vol.%
dry
gas
es)
CO
2 and
O2 (
vol.%
dry
gas
es)
Time (sec)
0
2
4
6
8
10
12
14
16
18
20
CO
(pp
mV
dry
gas
es)
0
2000
4000
6000
8000
10000
12000P2
CO2
CO2
CO
O2
O2
Time (sec)
0 200 400 600 800 1000 1200 1400 1600 1800 2000
0 200 400 600 800 1000 1200 1400 1600 1800 200002
4
6
8
10
12
14
16
18
20
CO
(pp
mV
dry
gas
es)
0
2000
4000
6000
8000
10000
12000LE
CO
ng time, during eucalypt and pine combustion experiments.

253J O U R N A L O F E N V I R O N M E N T A L S C I E N C E S 4 2 ( 2 0 1 6 ) 2 4 6 – 2 5 8
fluidized bed are dominated by particles with diameters in therange between 5 and 25 μm (Eldabbagh et al., 2005).
Fine particle (PM2.5) mass emission factors depend on manyfeatures, including fuel characteristics and combustion condi-tions, as shown in Fig. 4c. PM2.5 emission factors for softwood(pine) combustion ranged between 16.8 ± 1.00 and 29.3 ±3.09 mg/kg of fuel (as burned). The lowest PM2.5 emission factorwas observed when operating the reactor with high O2 percent-ages (P2), i.e., particulate emissions increased with the decreasein stoichiometry. The difference between the PM2.5 emissionfactors of the experiments P1 and P2 was statistically significant(p = 0.0209). Emission factors for hardwood (eucalypt) combus-tion ranged from 33.0 ± 10.8 to 55.2 ± 2.55 mg/kg of fuel (asburned). The highest PM2.5 emission was registered whenleached eucalypt was burned (LE), although under theseconditions a higher O2 concentration in the flue gases comparedto chipped eucalypt (E) was used. The difference between theparticle emission factors for these two experiments (LE and E)was statistically significant (p = 0.0001). The difference betweenthe PM2.5 emission factors resulting from the combustion of pineand eucalypt, for similar stoichiometry, was not statisticallysignificant (p = 0.5821).
Calvo et al. (2013) studied fine particles fromco-combustion of forest biomass and sewage sludge from apulp and paper industry, using the same pilot scale BFBC ofthe present study, and reported emission factors of (4.0 ±0.2) × 103 mg PM2.5/kg of fuel (as burned) and (3.7 ±0.5) × 103 mg PM2.5/kg of fuel (as burned) for the flue gasbefore and after the cyclone. The difference between themuch higher emissions factors reported by Calvo et al. (2013)and those observed here are related to the biomass fuelcharacteristics. The fuel used by Calvo et al. (2013) wascomposed of 40 wt.% sewage sludge and 60 wt.% of forestbiomass residues. A huge difference between fuels regardingthe ash content was reported: 1.41 wt.% for forest biomassversus 57.4 wt.% for sewage sludge, thus explaining thehigh PM2.5 emission. In this context, attention must bepaid to the characteristics of the biomass used as fuel,because they can greatly influence the particulate matteremissions.
2.4. Particulate matter composition
The health effects caused by particulate matter are dependenton its physical and chemical properties (Bølling et al., 2009;Lamberg et al., 2011). These properties are a function ofbiomass fuel and combustion conditions, which may present
CO
2 em
issi
on f
acto
r(g
/kg
fuel
bur
ned
(dry
bas
is))
CO
em
issi
on f
acto
r(g
/kg
fuel
bur
ned
(dry
bas
is))
0
400
800
1200
1600
2000
012
10
20
30
40
50
E LE P1 P2 E L
a b
Fig. 4 – (a) CO2, (b) CO, and (c) PM2.5 emission factors d
high variability (Bølling et al., 2009). Particles produced underconditions of complete combustion are more likely to inducecellular damage than particles generated in poor combustionconditions with higher dosages (Leskinen et al., 2014).
Fig. 5 presents the mass balance obtained by adding up theconcentrations of the chemical constituents of PM2.5. OCaccounted for around 2 wt.% (LE) to 18 (P1) wt.% of the PM2.5
mass. The difference between the OC mass fraction in PM2.5
produced when burning leached and non-leached eucalyptwas not statistically significant (p = 0.2341). For pine combus-tion under distinct operation conditions (P1 and P2), thedifference in the OC content in PM2.5 is statistically significant(p = 0.0348). Following the procedure of Alves et al. (2011),organic matter (OM) was obtained by multiplying the organiccarbon mass by a factor, which generally takes valuesbetween 1.2 and 2.2, to account for hydrogen, oxygen,nitrogen and other atoms associated with OC (Chazette andLiousse, 2001; Hegg et al., 1997; Pöschl, 2005; Turpin and Lim,2001). The multiplicative factor depends on the aerosolcomposition, its origin and the degree of aging (Puxbaumand Tenze-Kunit, 2003; Stelson and Seinfeld, 1981). The OM/OC ratio adopted in the present study was 1.9, which can beconsidered reasonable for biomass burning particles (Alves etal., 2011). Organic matter accounted for about 3 to 6 wt.% ofthe PM2.5 mass. Contrary to traditional combustion appliances(e.g. fireplace and woodstove), levoglucosan in PM2.5 emittedby the BFBC was always below the detection limit (0.075 μg/cm2), suggesting that this anhydrosugar, normally pointed outas a good biomass burning tracer, may be highly dependenton combustion parameters. This anhydrosugar is formedduring conditions of incomplete combustion resulting fromthe thermal breakdown of the cellulose, hemicellulose andlignin that are released at low temperatures (300 to 500°C)without being further burned (Bølling et al., 2009; Simoneit etal., 1999). In agreement with the present study, Schmidl et al.(2011) has found that levoglucosan was detected in allsamples from manually fired wood combustion systems, butnot during conditions of efficient combustion using automat-ically fired systems. Hedberg et al. (2006) observed that themeasurement of levoglucosan emissions show large varia-tions depending on the type of stove, biofuel quality, andoperator behavior.
EC accounted for around 2 (P2) to 12 (P1) wt.%, whereascarbonates represented 2 (P1) to 9 (LE) wt.% of the PM2.5 mass(Fig. 5). The differences between either the EC or the carbonatecontent of PM2.5 from experiments with leached andnon-leached fuel (eucalypt) were statistically significant
PM2.
5 em
issi
on f
acto
r(g
/kg
fuel
bur
ned
(dry
bas
is))
E P1 P2 E LE P1 P20
10
20
30
40
50
60
70
c
uring eucalypt and pine combustion experiments.

254 J O U R N A L O F E N V I R O N M E N T A L S C I E N C E S 4 2 ( 2 0 1 6 ) 2 4 6 – 2 5 8
(p < 0.0001 and p = 0.0034 for EC and carbonate, respectively).For pine combustion with different O2 levels (experiments P1and P2), a statistically significant difference was observed (p =0.0119 and p = 0.0197 for EC and carbonate, respectively).Unlike residential biomass combustion appliances, whoseparticulate matter emissions present a high carbonaceouscontent (Alves et al., 2011; Fernandes et al., 2011; Fine et al.,2004; Gonçalves et al., 2010; Schmidl et al., 2011), fluidized bedcombustion of biomass seems to generate relative loweramounts of OC and EC in fine particles, as observed in thepresent study and elsewhere (Calvo et al., 2013). In the presentstudy, the OC/EC ratio ranged from 0.8 to 2.0 for eucalypt andfrom 1.5 to 1.6 for pine combustion. These values are close tothe ratio of 2.2 reported by Calvo et al. (2013). The pre-treat-ment of the fuel before the combustion process contributed tothe increase of EC emissions, thereby lowering the ratio.Fernandes et al. (2011) tested three different types of domesticheating appliances. The lowest OC/EC ratios were obtained forthe combustion in the more sophisticated combustion appli-ance, while the highest were found for the open fireplace.Another observation resulting from their study was the muchlower ratio observed for the combustion of softwood (pine)compared to the combustion of hardwood (eucalypt), which isin agreement with the results of the present study. Particlesfrom incomplete combustion, such as soot, condensableorganic particles or char, are not expected to be present insignificant concentration in flue gases from BFBC, becausethese equipments operate under more efficient combustionconditions (Khan et al., 2009). Higher OC and EC massfractions in PM2.5 are generally observed when the combus-tion is more inefficient (Bølling et al., 2009; Fernandes et al.,2011; Obaidullah et al., 2012; Schmidl et al., 2011).
Calvo et al. (2013) found a total carbon (OC + EC) andcarbonate (CO3
2-) content in PM2.5 of 1.9 and 20 wt.% after thecyclone, respectively The higher carbonate content in PM2.5 inthe study of Calvo et al. (2013), compared to the valuesobserved here (2.3–8.5 wt.%), is related to the characteristics ofthe fuel. Calvo et al. (2013) used a fuel mixture includingsewage sludge from the pulp and paper wastewater treat-ment, with a high percentage of calcium carbonates
E LE P2
Perc
enta
ge in
PM
2.5 (
wt.%
)
0
20
40
60
80
100Element oxides OM EC CO3
2-
Fig. 5 – Chemical composition of PM2.5 from eucalypt andpine combustion. OM: organic matter; EC: elemental carbon.
(Tchobanoglous et al., 2001). During the combustion process,some carbonate in the sewage sludge is released with flyashes, thus contributing to the relatively high content inPM2.5.
Inorganic elements accounted for about 48% to 55% (wt.%)of the PM2.5 mass (Fig. 6). Among them, Ca, Fe, K, Mg, Na, P andS were present in all PM2.5 samples. This is in agreement withthe findings by Nussbaumer (2003), who reported thatsubmicron and supermicron particles in fluidized bed com-bustion were composed of K, Cl, S, Na and Ca, while coarseparticles were mainly constituted by Ca, Si, K, S, Na, Al, P andFe. Most of these chemical elements do not exist as singleelements in particulate matter, but rather combined in otherforms, such as oxides (e.g. CaO, Na2O, Fe2O3, Al2O3, MgO, K2O,P2O5, SO3). For example, potassium, which represents one ofthe most abundant elements in particulate matter emissions,is generally found as K2SO4 in submicron fly ashes (Valmari,2000). This element can also be found as KCl and K2CO3
(Obaidullah et al., 2012). After conversion of major chemicalelements to oxides, it was observed that the inorganic fractionaccounted for 71 to 86 wt.% of the PM2.5 mass (Fig. 5). It shouldbe noted that this mass fraction is slightly underestimatedsince other elements, such as Si, were not analyzed. Theparticulate matter emitted from biomass combustion inindustrial type combustion systems consists mainly ofinorganic compounds (Calvo et al., 2013), whereas, whenusing manually fired systems (as domestic combustionequipment), high amounts of particulate carbonaceous mate-rial are emitted (Schmidl et al., 2011). Soot and organicparticles are formed under poor combustion conditions(Bølling et al., 2009; Boman et al., 2004; Obaidullah et al.,2012), whereas inorganic particles are formed under condi-tions of nearly complete combustion (Nussbaumer, 2008).
The PM2.5 samples fromcombustion experiment P2 presenteda high inorganic content. Ca, K, Mg, Na and S contributed tomorethan 95% of the total mass of inorganic elements. PM2.5 from thecombustion experiment with leached eucalypt (LE) showed thelowest inorganic content. Leaching of easily soluble forms ofsome elements (e.g. KCl) during the pre-treatment process of thebiomass by rainfall may explain this result (Teixeira et al., 2012).In fact, in the present study, the potassium content in PM2.5
decreased from experiment E (non-leached fuel) to experimentLE (leached fuel), as also happened with Na and S. This suggeststhat a fraction of water soluble constituents, such as K and Na,was removed from the fuel by leaching. On the other hand, therelative amount of other elements like Ca, Fe, Mg and P haveincreased in PM2.5 from the combustion of leached eucalypt,compared to non-leached eucalypt (Fig. 6). The relative enrich-ment of these elements in fine particles after leaching can beassociated with a lower leaching ability.
The composition of fly ashes from the combustion ofdifferent biomass fuels show considerable differences betweencoarse and fine particles that are driven out with the flue gas(Jokiniemi et al., 2001; Teixeira et al., 2014; Obernberger andSupancic, 2009). For example, during wood chip combustion, theCa content decreases from coarse to fine fly ashes, while the Kcontent increases. Heavy metals like Pb suffer a notable increasein the fine fly ash fraction (Brunner et al., 2001; Obernberger andSupancic, 2009). Thus, it is important to characterize fineparticles emitted during biomass combustion in distinct

Al Ca Fe K Mg Na P S
Frac
tions
in P
M2.
5 (w
t.%)
0246
10
20
30
40E LE P2
Fig. 6 – Mass fractions of major chemical elements in PM2.5
during eucalypt and pine combustion experiments.
255J O U R N A L O F E N V I R O N M E N T A L S C I E N C E S 4 2 ( 2 0 1 6 ) 2 4 6 – 2 5 8
systems, because this size fraction is able of penetrating deeperinto the human respiratory system.
In the present study, K was the predominant element inPM2.5 for experiment E, while in experiments LE and P2 themajor element was Ca. Other studies have suggested that pinecombustion generate lower amounts of potassium in fineparticles (Schauer et al., 2001). The lower potassium massfraction in PM2.5 may be related to the fact that lower K levelsare found in pine wood than in eucalypt (Biedermann andObernberger, 2005). It has been also reported that the Cacontent in coniferous wood is lower compared to deciduouswood (Biedermann and Obernberger, 2005; Vassilev et al.,2010). However, in the present study, the lowest mass fractionof Ca was observed in PM2.5 from experiment E. Calcium inparticulate matter emissions from the combustion of forestresidues can also be somehow related to the forest soil andother impurities mixed with the fuel (Valmari, 2000).
The mass fraction of the minor elements in PM2.5 sampleswas very low (Fig. 7). Among those elements, Cr was one of themost abundant (1.6 wt.% of PM2.5 mass). This high content of Crmay be mostly associated with abrasive or corrosive wearing ofstainless steel from the pilot-scale BFBC walls, as a result ofchemical and thermal decomposition of the material in contactwith the flue gases. Other elements like Rb, Sr, Mo, and Ba foundin the fly ashes account altogether for 0.2 to 0.3 wt.% of theparticulate matter mass (Fig. 7).
Some volatile elements (e.g. Cd and Zn) mainly vaporizeduring combustion and later condense on the surface of the flyashes or form aerosols (Biedermann and Obernberger, 2005).Among heavy metals, Zn, Sn, Cd, Tl and Cu were present in allsamples. The contribution of these elements to the totalmass ofmetals was low, not exceeding 0.3 wt.% (Fig. 7).
The water-soluble ions accounted for about 0.51 to2.39 wt.% of the PM2.5 mass (Table 3). The combustionexperiments with leached eucalypt (LE) generated the lowestwater soluble ionic content in PM2.5. This can be explained bythe fact that during rainfall leaching an import part ofelements in water soluble forms could be already beenleached out, as already discussed. The water soluble cationwith higher contribution to the mass of PM2.5 in combustion
experiments of leached eucalyptus (LE) and pine (P2) was Ca2+,accounting for 0.23 and 0.65 wt.%, respectively. For combustionexperiments with eucalypt (E), Cl- was the soluble anion inhigher concentration (1.05 wt.%), while K+ was the majorsoluble cation (0.73 wt.%) in the PM2.5 samples. In fact, Cl- andK+ are often combined in the biomass and ash components andare highly water soluble. In the present study, the K+ content inPM2.5 samples from softwood combustion (pine) was muchlower than in samples from hardwood (eucalypt) combustion.Some ions like phosphate, lithium, formate and pyruvate werebelow the detection limit of the method (Table 3). Potassium infine particles has been used as a tracer of biomass burningemissions. Alves et al. (2011) studied the composition of fineparticles resulting from residential wood combustion andobserved that Cl- and K+ were the major ionic compounds inthe combustion flue gas samples. Themass fractions of solubleions Cl−and K+ were higher in particles from the combustion ofeucalypt than from pine. Although the type of combustionequipment was very different from the one that was used inthe present study, the same trend was observed.
3. Conclusions
This paper constitutes one of the very few attempts so farto comprehensively characterize particle emissions duringbiomass combustion in a fluidized bed combustor. Despite thelimited number of experiments, the results obtained suggestthat combustion conditions and type of fuel have a significantimpact on the chemical composition of emissions. For thecombustion of eucalypt chips, it was observed that pre-pro-cessing steps applied to biomass, such as rainfall leaching,could be an effective way to improve the combustion process.For pine chips, the highest CO emission factor was observedduring the combustion with lower stoichiometry. The PM2.5
emission factors for softwood (pine) combustion rangedbetween 16.8 ± 1.0 and 29.3 ± 3.1 mg/kg of fuel (dry basis).The lowest PM2.5 emission factor was observed when operat-ing the reactor with higher stoichiometry (higher O2 contentin combustion flue gases). For hardwood (eucalypt) combus-tion, the PM2.5 emission factors ranged from 33.0 ± 10.8 to55.2 ± 2.5 mg/kg of fuel (dry basis). The highest emission wasobserved for the combustion of leached eucalypt despite thehigher stoichiometric conditions. The PM2.5 mass was mainlycomposed of inorganic matter, while organic compoundsrepresented a much smaller fraction. Organic and elementalcarbon accounted for 3.1 to 30 wt.%, whereas carbonaterepresented between 2.3 and 8.5 wt.% of PM2.5 mass. Thelevoglucosan content in the PM2.5 mass was always below thedetection limit of the method, suggesting that, contrary towhat happens with residential combustion equipment (fire-places and woodstoves), it cannot be used to trace emissionsfrom biomass combustion in fluidized bed reactors. Ca, K, Mg,Na and S were present in all PM2.5 samples, representing asignificant mass fraction (higher than 48 wt.%) of particulatemass. Water-soluble ions accounted for about 0.51 to2.39 wt.% of PM2.5 mass, with Cl−, K+ and Ca2+ representingthe major ionic components in samples from the combustionof eucalypt and pine.

0.0
0.1
0.2
0.3
0.6
0.9
1.2
1.5
1.8E LE P2
Cr Ni Cu Zn Rb Sr Zr Mo Ba Mn Pb Li Be V Co Ga Ge As Se Y Cd Sn Sb Cs Ba La Ce Pr NdSmGd Dy Hf W Tl Bi U
Frac
tions
in P
M2.
5 (w
t.%)
Frac
tions
in P
M2.
5 (w
t.%)
0.000
0.001
0.002
0.003
0.010
0.020
0.030
0.040
0.050E LE P2
Fig. 7 –Mass fractions of minor elements in PM2.5 during eucalypt and pine combustion experiments. Sc, Nb, Eu, Tb, Ho, Er, Tm,Yb, Lu, Ta, and Th were all below the limit of detection.
256 J O U R N A L O F E N V I R O N M E N T A L S C I E N C E S 4 2 ( 2 0 1 6 ) 2 4 6 – 2 5 8
This work has demonstrated the feasibility of the combus-tion of residual forest biomass in BFBC. The biomass fuelcharacteristics and operating conditions influence the perfor-mance of the process and respective emissions. A compre-hensive chemical composition of fine particulate matter(PM2.5) was obtained, constituting an important tool forincreasing the knowledge on emissions from BFBC. Thisinformation may also be useful for inventorying emissionsfrom related combustion plants, as well for estimating theircontribution to the atmospheric pollution levels throughreceptor modeling. Additional experiments with differentfeeding rates and stoichiometric conditions should be madeto increase the knowledge about the process.
Acknowledgments
This work was supported by the Portuguese Foundation forScience and Technology through the projects Biom Ash Tech —
Table 3 – PM2.5 mass fractions of water-soluble ions.
E (wt.%) LE (wt.%) P2 (wt.%) Detection limit(μg/L)
Fluoride nd nd nd 0.94Acetate nd nd nd 1.21Propionate 0.01 0.01 0.01 2.72Formate nd nd nd 1.77Butyrate 0.02 nd 0.02 1.72Pyruvate nd nd nd 0.83Chloride 1.05 0.04 0.30 1.67Nitrate nd nd nd 1.23Succinate nd nd nd 0.98Sulfate 0.30 0.08 nd 4.84Oxalate nd nd nd 0.74Phosphate nd nd nd 2.11Citrate 0.06 0.02 0.07 1.92Lithium nd nd nd 0.50Sodium 0.08 0.01 0.05 0.70Ammonium 0.00 nd nd 0.75Potassium 0.73 0.04 0.08 0.50Magnesium 0.14 0.08 nd 1.00Calcium 0.01 0.23 0.65 3.00
nd: not detected, below detection limit of the method.
Ash impacts during thermo-chemical conversion of biomass (No.PTDC/AAC-AMB/116568/2010-FCOMP-01-0124-FEDER-019346)and BIOEMI — Contribution of biomass combustion to airpollutant emissions (No. PTDC/AMB/65706/2006), and EuropeanCommission through the project AIRUSE — Testing and devel-opment of air quality mitigation measures in Southern Europe(No. LIFE 11 ENV/ES/000584).
R E F E R E N C E S
Alves, C., Gonçalves, C., Fernandes, A.P., Tarelho, L., Pio, C., 2011.Fireplace andwoodstove fine particle emissions from combustionof western Mediterranean wood types. Atmos. Environ. 101 (3),692–700.
Anthony, E.J., 1995. Fluidized bed combustion of alternative solidfuels; status, successes and problems of the technology. Prog.Energy Combust. Sci. 21 (3), 239–268.
Armesto, L., Bahillo, A., Veijonen, K., Cabanillas, A., Otero, J., 2002.Combustion behaviour of rice husk in a bubbling fluidised bed.Biomass Bioenergy 23 (3), 171–179.
Arvelakis, S., Vourliotis, P., Kakaras, E., Koukios, E.G., 2001. Effect ofleaching on the ash behavior of wheat straw and olive residueduring fuidizedbed combustion. Biomass Bioenerg. 20 (6), 459–470.
Bakker, R.R., Jenkins, B.M., Williams, R.B., 2002. Fluidized bedcombustion of leached rice straw. Energ. Fuel 16 (2), 356–365.
Biedermann, F., Obernberger, I., 2005. Ash-related ProblemsDuring Biomass Combustion and Possibilities for a SustainableAsh Utilisation. In: Proceedings of the International Confer-ence World Renewable Energy Congress (WREC). UK, Scotland.
Bølling, A.K., Pagels, J., Yttri, K.E., Barregard, L., Sallsten, G.,Schwarze, P.E., et al., 2009. Health effects of residential woodsmoke particles: the importance of combustion conditions andphysicochemical particle properties. Part. Fibre Toxicol. 6, 29.
Boman, C., Nordin, A., Boström, D., Öhman, M., 2004. Character-ization of inorganic particulate matter from residential com-bustion of pelletized biomass Fuels. Energ. Fuel 18 (2), 338–348.
Brunner, T., Obernberger, I., Jöller, M., Arich, A., Pölt, P., 2001.Measurement and Analyses of Aerosols Formed During Fixed-bed Biomass Combustion. Aerosols from Biomass Combustion.Zürich, Verenum, In pp. 75–80.
Brunner, T., Obernberger, I., Scharler, R., 2009. Primary Measures forLow-emission Residential Wood Combustion-Comparison of Oldwith Optimised Modern Systems. In: Proceedings of the 17th
European Biomass Conference & Exhibition. Hamburg, Germany.Calvo, A.I., Tarelho, L.A.C., Teixeira, E.R., Alves, C., Nunes, T.,
Duarte, M., et al., 2013. Particulate emissions from the co-

257J O U R N A L O F E N V I R O N M E N T A L S C I E N C E S 4 2 ( 2 0 1 6 ) 2 4 6 – 2 5 8
combustion of forest biomass and sewage sludge in a bubblingfluidised bed reactor. Fuel Process. Technol. 114, 58–68.
Chazette, P., Liousse, C., 2001. A case study of optical and chemicalground apportionment for urban aerosols in Thessaloniki.Atmos. Environ. 35 (14), 2497–2506.
Domingos, J.S.S., Regis, A.C.D., Santos, J.V.S., de Andrade, J.B., daRocha, G.O., 2012. A comprehensive and suitable method fordetermining major ions from atmospheric particulate mattermatrices. J. Chromatogr. A 1266, 17–23.
Duan, F., Chyang, C., Chin, Y., Tso, J., 2013. Pollutant emissioncharacteristics of rice husk combustion in a vortexing fluidizedbed incinerator. J. Environ. Sci. 25 (2), 335–339.
Eldabbagh, F., Ramesh, A., Hawari, J., Hutny, W., Kozinski, J.A.,2005. Particle-metal interactions during combustion of pulpand paper biomass in a fluidized bed combustor. Combust.Flame 142 (3), 249–257.
Fernandes, A.P., Alves, C.A., Gonçalves, C., Tarelho, L., Pio, C.,Schimdl, C., et al., 2011. Emission factors from residentialcombustion appliances burning Portuguese biomass fuels.J. Environ. Monit. 13 (11), 3196–3206.
Fine, P.M., Cass, G.R., Simoneit, B.R.T., 2004. Chemical character-ization of fine particle emissions from the wood stovecombustion of prevalent United States tree species. Environ.Eng. Sci. 21 (6), 705–721.
Flagan, R.C., Seinfeld, J.H., 1998. Fundamentals of Air PollutionEngineering. Prentice Hall, New Jersey.
Ghani, W.A.W.A.K., Alias, A.B., Savory, R.M., Cliffe, K.R., 2008. Co-combustion of refuse derived fuel with coal in a fluidised bedcombustor. Int. J. Sci. Eng. Technol. 1 (1), 10–14.
Gonçalves, C., Alves, C., Evtyugina, M., Mirante, F., Pio, C., Caseiro,A., et al., 2010. Characterisation of PM10emissions fromwoodstove combustion of common woods grown in Portugal.Atmos. Environ. 44 (35), 4474–4480.
Gonçalves, C., Alves, C., Nunes, T., Rocha, S., Cardoso, J., Cerqueira,M.,et al., 2014. Organic characterisation of PM10 in Cape Verde underSaharan dust influxes. Atmos. Environ. 89, 425–432.
Hand, J.L., Kreidenweis, S.M., 2002. A new method for retrievingparticle refractive index and effective density from aerosol sizedistribution data. Aerosol Sci. Technol. 36 (10), 1012–1026.
Happo, M.S., Uski, O., Jalava, P.I., Kelz, J., Brunner, T., Hakulinen, P.,et al., 2013. Pulmonary inflammation and tissue damage in themouse lung after exposure to PM samples from biomassheating appliances of old and modern technologies. Sci. TotalEnviron. 443, 256–266.
Hata, M., Chomanee, J., Thongyen, T., Bao, L., Tekasakul, S.,Tekasakul, P., et al., 2014. Characteristics of nanoparticlesemitted from burning of biomass fuels. J. Environ. Sci. 26 (9),1913–1920.
Hedberg, E., Johansson, C., Johansson, L., Swietlicki, E., Brorström-Lundén, E., 2006. Is levoglucosan a suitable quantitative tracerfor wood burning? Comparison with receptor modeling ontrace elements in Lycksele, Sweden. J. Air Waste Manag. Assoc.56 (12), 1669–1678.
Hegg, D.A., Livingston, J., Hobbs, P.V., Novakov, T., Russell, P., 1997.Chemical apportionment of aerosol column depth off the Mid-Atlantic coast of the United States. J. Geophys. Res. 102 (D21),25293–25303.
Hustad, J.E., Skreiberg, Ø., Sønju, O.K., 1995. Biomass combustionresearch and utilisation in IEA countries. Biomass Bioenerg. 9(1-5), 235–255.
Jenkins, B.M., Bakker, R.R., Wei, J.B., 1996. On the properties ofwashed straw. Biomass Bioenerg. 10 (4), 177–200.
Jenkins, B.M., Baxter, L.L., Miles Jr., T.R., Miles, T.R., 1998.Combustion properties of biomass. Fuel Process. Technol. 54(1-3), 17–46.
Jokiniemi, J., Lind, T., Hokkinen, J., Kurkela, J., Kauppinen, E., 2001.Modelling and Experimental Results on Aerosol Formation.Deposition and Emissions in Fluidized Bed Combustion of
Biomass In: Aerosols from Biomass Combustion. Zürich,Verenum, pp. 31–40.
Khan, A.A., de Jong, W., Jansens, P.J., Spliethoff, H., 2009. Biomasscombustion in fluidized bed boilers: potential problems andremedies. Fuel Process. Technol. 90 (1), 21–50.
Koornneef, J., Junginger, M., Faaij, A., 2007. Development offluidized bed combustion—an overview of trends, perfor-mance and cost. Prog. Energy Combust. Sci. 33 (1), 19–55.
Kowarska, B., Baron, J., Kandefer, S., Żukowski, W., 2013. Inciner-ation of municipal sewage sludge in a fluidized bed reactor.Engineering 5 (1), 125–134.
Lamberg, H., Nuutinen, K., Tissari, J., Ruusunen, J., Yli-Pirilä, P.,Sippula, O., et al., 2011. Physicochemical characterization of fineparticles from small-scale wood combustion. Atmos. Environ. 45(40), 7635–7643.
Leckner, B., Åmand, L.E., Lücke, K., Werther, J., 2004. Gaseousemissions from co-combustion of sewage sludge and coal/wood in a fluidized bed. Fuel 83 (4-5), 477–486.
Leskinen, J., Tissari, J., Uski, O., Virén, A., Torvela, T., Kaivosoja, T., etal., 2014. Fine particle emissions in three different combustionconditions of a wood chip-fired appliance-particulate physico-chemical properties and induced cell death. Atmos. Environ. 86,129–139.
McKendry, P., 2002. Energy production from biomass (part 2):conversion technologies. Bioresour. Technol. 83 (1), 47–54.
Nussbaumer, T., 2003. Combustion and co-combustion of bio-mass: fundamentals, technologies, and primary measures foremission reduction. Energ. Fuel 17 (6), 1510–1521.
Nussbaumer, T., 2008. Biomass Combustion in Europe Overviewon Technologies and Regulations. NYSERDA, New York.
Obaidullah, M., Bram, S., Verma, V.K., De Ruyck, J., 2012. A reviewon particle emissions from small scale biomass combustion.Int. J. Renew. Energy Technol. 2 (1), 147–159.
Obernberger, I., Dahl, J., 1998. Fractionated Heavy Metal Separationand Ash Utilization in Biomass Combustion and GasificationPlants. Final Publishable Report, The European Commission.
Obernberger, I., Supancic, K., 2009. Possibilities of AshUtilisation fromBiomass Combustion Plants. In: Proceedings of the 17th EuropeanBiomass Conference & Exhibition. Hamburg, Germany.
Obernberger, I., Brunner, T., Bärnthaler, G., 2006. Chemicalproperties of solid biofuels — significance and impact.Biomass Bioenerg. 30 (11), 973–982.
Pöschl, U., 2005. Atmospheric aerosols: composition, transformation,climate and health effects. Angew. Chem. Int. Ed. 44 (46),7520–7540.
Puxbaum, H., Tenze-Kunit, M., 2003. Size distribution and seasonalvariation of atmospheric cellulose. Atmos. Environ. 37 (26),3693–3699.
Querol, X., Alastuey, A., Rodriguez, S., Plana, F., Ruiz, C.R., Cots, N., etal., 2001. PM10 and PM2.5 source apportionment in the BarcelonaMetropolitan Area, Catalonia, Spain. Atmos. Environ. 35 (36),6407–6419.
Saidur, R., Abdelaziz, E.A., Demirbas, A., Hossain, M.S., Mekhilef, S.,2011. A review on biomass as a fuel for boilers. Renew. Sust. Energ.Rev. 15 (5), 2262–2289.
Schauer, J.J., Kleeman, M.J., Cass, G.R., Simoneit, B.R.T., 2001.Measurement of emissions from air pollution sources. 3. C1–C29
organic compounds from fireplace combustion of wood. Environ.Sci. Technol. 35 (9), 1716–1728.
Schmidl, C., Luisser, M., Padouvas, E., Lasselsberger, L., Rzaca, M.,Ramirez-Santa Cruz, C., et al., 2011. Particulate and gaseousemissions from manually and automatically fired small scalecombustion systems. Atmos. Environ. 45 (39), 7443–7454.
Silvennoinen, J., Hedman, M., 2013. Co-firing of agricultural fuels in afull-scale fluidized bed boiler. Fuel Process. Technol. 105, 11–19.
Simoneit, B.R.T., Schauer, J.J., Nolte, C.G., Oros, D.R., Elias, V.O., Fraser,M.P., et al., 1999. Levoglucosan, a tracer for cellulose in biomassburning and atmospheric particles. Atmos. Environ. 33 (2), 173–182.

258 J O U R N A L O F E N V I R O N M E N T A L S C I E N C E S 4 2 ( 2 0 1 6 ) 2 4 6 – 2 5 8
Sippula, O., 2010. Fine Particle Formation and Emissions inBiomass Combustion (PhD thesis) University of Kuopio,Kuopio, Finland.
Spliethoff, H., Scheurer,W., Hein, K.R.G., 2000. Effect of co-combustionof sewage sludge and biomass on emissions and heavy metalsbehaviour. Process Saf. Environ. Prot. 78 (1), 33–39.
Stelson, A.W., Seinfeld, J.H., 1981. Chemical mass accounting ofurban aerosol. Environ. Sci. Technol. 15 (6), 671–679.
Tarelho, L.A.C., Neves, D.S.F., Matos, M.A.A., 2011. Forest biomasswaste combustion in a pilot-scale bubbling fluidised bedcombustor. Biomass Bioenerg. 35 (4), 1511–1523.
Tchobanoglous, G., Burton, F.L., Stensel, H.D., 2001. WastewaterEngineering: Treatment and Reuse. 4th ed. McGraw Hill HigherEducation, New York.
Teixeira, P.A.L., 2012. Estudo da formação de depósitos eaglomeração de cinzas durante a combustão de biomassa emleito fluidizado e co-combustão com carvão para minimizar asua ocorrência (PhD thesis) Faculdade de Ciências.Universidade Nova de Lisboa.
Teixeira, E.R., Tarelho, L.A.C., Sequeira, M.C.E., Santos, C.E.C.,Matos, M.A.A., 2012. Characteristics of Co-combustion ofSewage Sludge with Forest Biomass in Bubbling Fluidized Bed.In: Proceedings of the Conference & Exhibition on Biomass forEnergy. Jönköping, Sweden.
Teixeira, E.R., Tarelho, L.A.C., Reis, J.M.E.T., Soares, S.P.P., 2014.Physical–Chemical Characteristics of Distinct Particle Size AshFraction in a Biomass Thermal Power Plant. In: Proceedings ofthe 22nd European Biomass Conference and Exhibition. Ham-burg, Germany.
Turpin, B.J., Lim, H.J., 2001. Species contributions to PM2.5 massconcentrations: revisiting common assumptions for estimat-ing organic mass. Aerosol Sci. Technol. 35 (1), 602–610.
Uski, O., Jalava, P.I., Happo, M.S., Leskinen, J., Sippula, O., Tissari, J.,et al., 2014. Different toxic mechanisms are activated byemission PM depending on combustion efficiency. Atmos.Environ. 89, 623–632.
Valmari, T., 2000. Potassium Behaviour During Combustion ofWood in Circulating Fluidised Bed Power Plants (PhD thesis)Helsinki University of Technology, Espoo, Finland.
Vamvuka, D., Sfakiotakis, S., 2011. Combustion behaviour ofbiomass fuels and their blends with lignite. Thermochim. Acta526 (1-2), 192–199.
Vamvuka, D., Zografos, D., 2004. Predicting the behaviour of ashfrom agricultural wastes during combustion. Fuel 83 (14-15),2051–2057.
Vamvuka, D., Pitharoulis, M., Alevizos, G., Repouskou, E., Pentari,D., 2009. Ash effects during combustion of lignite/biomassblends in fluidized bed. Renew. Energy 34 (12), 2662–2671.
Van Loo, S., Koppejan, J., 2008. The Handbook of BiomassCombustion and Co-firing. 2nd ed Earthscan Publications Ltd,London, UK.
Vassilev, S.V., Baxter, D., Andersen, L.K., Vassileva, C.G., 2010. Anoverview of the chemical composition of biomass. Fuel 89 (5),913–933.
Werther, J., Saenger, M., Hartge, E.U., Ogada, T., Siagi, Z., 2000.Combustion of agricultural residues. Prog. Energy Combust.Sci. 26 (1), 1–27.
Xie, J.J., Yang, X.M., Zhang, L., Ding, T.L., Song, W.L., Lin, W.G.,2007. Emissions of SO2, NO and N2O in a circulating fluidizedbed combustor during co-firing coal and biomass. J. Environ.Sci. 19 (1), 109–116.
Yan, R., Liang, D.T., Tsen, L., 2005. Case studies-problem solving influidized bed waste fuel incineration. Energy Convers. Manage.46 (7-8), 1165–1178.
Yao, Q., Li, S.Q., Xu, H.W., Zhuo, J.K., Song, Q., 2010. Reprint of:studies on formation and control of combustion particulatematter in China: a review. Energy 35 (11), 4480–4493.
Ye, W., Han, J., Qin, L.B., Li, Y.Q., Masami, F., Yao, H., 2012.Emission characteristics of PM10 during sewage sludge com-bustion. Aerosol Air Qual. Res. 12 (3), 420–425.

J O U R N A L O F E N V I R O N M E N T A L S C I E N C E S 4 2 ( 2 0 1 6 ) 2 5 9 – 2 6 6
Ava i l ab l e on l i ne a t www.sc i enced i r ec t . com
ScienceDirect
www. jou rna l s . e l sev i e r . com/ j es
Nontargeted identification of peptides and disinfectionbyproducts in water
Yanan Tang1, Ying Xu2, Feng Li1, Lindsay Jmaiff1, Steve E. Hrudey1, Xing-Fang Li1,⁎
1. Division of Analytical and Environmental Toxicology, Department of Laboratory Medicine and Pathology, University of Alberta,Edmonton, AB T6G 2G3, Canada. E-mail: [email protected]. Department of Computer Science, University of Alberta, Edmonton, AB T6G 2E8, Canada
A R T I C L E I N F O
⁎ Corresponding author. E-mail: xingfang.li@u
http://dx.doi.org/10.1016/j.jes.2015.08.0071001-0742/© 2015 The Research Center for Ec
A B S T R A C T
Article history:Received 9 July 2015Revised 25 August 2015Accepted 27 August 2015Available online 29 October 2015
A broad range of organic compounds are known to exist in drinking water sources and serveas precursors of disinfection byproducts (DBPs). Epidemiological findings of an associationof increased risk of bladder cancer with the consumption of chlorinated water has resultedin health concerns about DBPs. Peptides are thought to be an important category of DBPprecursors in water. However, little is known about the actual presence of peptides andtheir DBPs in drinking water because of their high sample complexity and lowconcentrations. To address this challenge and identify peptides and non-chlorinated/chlorinated peptide DBPs from large sets of organic compounds in water, we developed anovel high throughput analysis strategy, which integrated multiple solid phase extraction(SPE), high performance liquid chromatography (HPLC) separation, and non-targetidentification using precursor ion exclusion (PIE) high resolution mass spectrometry (MS).After MS analysis, structures of candidate compounds, particularly peptides, were obtainedby searching against the Human Metabolome Database (HMDB). Using this strategy, wesuccessfully detected 625 peptides (out of 17,205 putative compounds) and 617 peptides (outof 13,297) respectively in source and finished water samples. The source and finished watersamples had 501 peptides and amino acids in common. The remaining 116 peptides andamino acids were unique to the finished water. From a subset of 30 putative compounds forwhich standards were available, 25 were confirmed using HPLC-MS analysis. By analyzingthe peptides identified in source and finished water, we successfully confirmed threedisinfection reaction pathways that convert peptides into toxic DBPs.© 2015 The Research Center for Eco-Environmental Sciences, Chinese Academy of Sciences.
Published by Elsevier B.V.
Keywords:Nontargeted detectionWater analysisMass spectrometryPeptideDisinfection byproducts
Introduction
Drinking water safety is an ongoing and ever challenging issuefor the water industry and government agencies. Disinfectionplays a key role to prevent waterborne diseases and ensurewater safety. During disinfection processes, thousands ofdisinfection byproducts (DBPs) are produced through reactions
alberta.ca (Xing-Fang Li).
o-Environmental Science
between various organic compounds in source water anddisinfectants (e.g., chlorine and monochloramine). Disinfectionposes a health risk tradeoff becausemany organics inwater andtheir DBPs have toxic properties, and some are animal carcin-ogens (e.g., nitrosamines) (Komaki et al., 2014; Li et al., 2015;Richardson et al., 2007). Epidemiological studies have shownan association between consumption of chlorinated water and
s, Chinese Academy of Sciences. Published by Elsevier B.V.

260 J O U R N A L O F E N V I R O N M E N T A L S C I E N C E S 4 2 ( 2 0 1 6 ) 2 5 9 – 2 6 6
increased risk of bladder cancer (Villanueva et al., 2004).Peptides represent a large category of organics in water; theyare commonly present in water as degradation products ofbiomaterials (Hayes et al., 2008; Spoof et al., 2003). A few areknown to be toxic and can cause serious disease in humans andother species. For instance,microcystins are cyclic heptapeptidesthat are hepatotoxic and may be tumor promoters (Humpage etal., 2000; Ito et al., 1997). Besides their bioactivities and potentialimpacts on human health, peptides are important organicprecursors of DBPs (Brosillon et al., 2009), as they can bemodifiedduring water disinfection to produce non-chlorinated/chlorinated peptide DBPs. Peptide DBPs could be biologicallysignificant because it is known that some chloro-amino acids aremutagenic in bacterial assays and induce micronuclei inmammalian cells (Garland et al., 2009; Grant, 2009; Tavtigian etal., 2008). Chloro-amino acids can be produced by the reaction ofaqueous chlorine with amino acids in laboratory experiments.Despite their ubiquitous presence and the specific attention on anumber of toxic peptides, there has been no systematic study onthe identification and characterization of this large group ofpotential DBP precursors. This is largely due to the lack ofsensitive and high throughput analytical techniques (Hernandezet al., 2012; Lauby-Secretan et al., 2015).
To develop a novel analytical technique to systematicallyanalyze peptides and non-chlorinated/chlorinated peptideDBPs in water, it is critical to address two specific challenges.First, peptides in water usually occur at extremely lowconcentrations, often from low parts-per-trillion (ppt, ng/L) toparts-per-billion (ppb, μg/L) (Ueno et al., 1996). Second, because ofthe diversity of peptides, the potential formation of their DBPs iscomplex. To address these challenges, we developed a highthroughput liquid chromatography tandem mass spectrometry(LC-MS/MS) strategy (Fig. 1), which applied a non-target analysistechnique to collectively identify peptides and their resulting
Fig. 1 – Experimental workflow of water sample analysiswith the liquid chromatography tandem mass spectrometry(LC-MS/MS) strategy.
DBPs in water samples. Specifically, the strategy consists ofmultiple solid phase extraction (SPE) of complementary reten-tionmechanisms for sample enrichment and high performanceliquid chromatography (HPLC) separation with non-targetidentification provided by high resolution mass spectrometry(MS). A database search against the Human MetabolomeDatabase (HMDB) and bioinformatics analysis was used toidentify possible peptides, amino acids, and non-chlorinated/chlorinated peptide DBPs in drinking water.
1. Materials and methods
1.1. Chemicals and reagents
All chemicals and reagents were purchased from Sigma-Aldrich(Oakville, ON, CA) unless stated otherwise. Methanol (MeOH),acetonitrile (ACN), and LC-MS gradewater were purchased fromFisher Scientific Canada (Edmonton, AB). S-(1,2,dichlorovinyl)-glutathione was purchased from CacheSyn Inc (Mississauga,ON, CA); Asp-Pro, His-Pro, N-nitrosoproline, and aflatoxinB1 were purchased from Cedarlane (Burlington, ON, CA).1,1′-Ethylidenebistryptophan was ordered from LGC Standards(Teddington, UK); bradykinin, leukotriene F4, and pentosidinewere purchased from Cayman Chemicals (Ann Arbor, MI, USA).
1.2. Biosafety
The researchers involved in this study were trained inchemical safety and biosafety. All reagents were handled inthe fume hood. Experiments were performed in a BiosafetyLevel 2 (BSL-2) laboratory. The waste materials were dis-posed of according to the biosafety and chemical safetyprocedures.
1.3. Samples and controls
During water treatment, the source water (plant influent,prior to any water treatment process) goes through thefollowing steps: alum coagulation, sedimentation, sand andactivated carbon filtration, and chlorine/chloramine/UV dis-infection, before being distributed as finished water (planteffluent, after drinking water treatment). Samples of sourcewater and finished water were collected from a watertreatment plant. Throughout this study, LC-MS grade waterwas used as the negative control, and LC-MS grade waterspiked with mixed peptide standards was used as the positivecontrol. In each set of experiments, the samples and thecontrols were analyzed in parallel.
1.4. SPE
An Oasis HLB (Waters, Mississauga, ON, CA), a Bond Elut ENVandaBondElutC18 (Agilent,Mississauga,ON,CA) cartridgewereused to extract organic compounds fromwater samples. The SPEcartridgeswere conditioned before usewithMeOH andH2O. Theextraction process of water samples with SPE cartridges wasperformed according to the manufacturers' instructions.The details of SPE extraction and sample reconstruction aredescribed in the Appendix A: Supporting Information.

261J O U R N A L O F E N V I R O N M E N T A L S C I E N C E S 4 2 ( 2 0 1 6 ) 2 5 9 – 2 6 6
1.5. Liquid chromatography separation
The compounds enriched using SPE extractions were separatedon an Agilent 1290 Infinity Binary LC System (Agilent,Mississauga, ON, CA) before MS analysis. Two columns,AdvanceBio Peptide Mapping C18 column (150 × 2.1 mm,2.7 μm; Agilent, Mississauga, ON, CA) and TSKgel Amide-80hydrophilic interaction liquid chromatography (HILIC) column(250 × 2 mm, 5 μm; Tosoh Bioscience, King of Prussia, PA, USA),were used for separation. The flow rate of LC separation was100 μL/min. LC gradients were optimized respectively for eachcolumn.Thedetails of theoptimized LCgradient for each columnare described in the Appendix A: Supporting Information.
1.6. Mass spectrometry analysis
The organic compounds present in water samples, separatedon C18 and HILIC LC systems, were analyzed using aTripleTOF® 5600 system (AB Sciex, Concord, ON, CA). Allcompounds were analyzed in positive ionization mode. TheMS analysis conditions are illustrated in the Appendix A:Supporting Information. The precursor ion exclusion (PIE)strategy was applied as reported to eliminate redundantidentifications (Wang and Li, 2008).
1.7. Data processing
A Java program was coded to help process the generatedLC-MS/MS data. The m/z value of each precursor ion wasextracted. A mass tolerance of ±0.005 Da was applied whengrouping the precursor ions by their charge states andretention times with a window of ±30 sec. The extractedaccurate masses were searched in the HMDB, which containschemical structures, clinical characteristics, and molecularbiology information for 41,993 organic compounds, includingproteins and peptides, toxins, environmental pollutants,drugs and drug metabolites (Wishart et al., 2013). The searchresults were exported to an Excel file, providing informationthat included the HMDB ID, compound name, theoreticalmass, adduct, experimental mass, and derivative for eachquery.
1.8. Identification validation and bioinformatic analysis
The measured accurate masses of the precursor ions weresearched against HMDB to identify putative compounds.When the measured tandem mass spectrometry (MS/MS)spectra of the precursor ions matched those of the theoreticalfragments of the putative compounds, these compounds wereconsidered to be detected. The detected putative compoundswere further confirmed with available standards using thesame LC-MS analysis conditions as the water sample analysis.
Five peptide standards, Gly–Tyr, Val–Tyr–Val, Leu En-kephalin, Met Enkephalin, and Angiotensin II, were repeat-edly analyzed using the LC-MS method and their retentiontimes were evaluated for inter-day variations. The data areincluded in the Appendix A: Supporting Information. Inthese experiments, we noticed that the hydrophilic peptides,such as Val–Tyr–Val, had retention time shifts up to 100 sec,which is due to partial retention of hydrophilic peptides on
the C18 reverse phase HPLC column. Similarly, the hydro-phobic peptides also experienced larger retention time shiftson the HILIC column because of poor retention of hydropho-bic peptides on the HILIC column. This observation waspreviously reported (Schmidt et al., 2008). Therefore, theretention time window for validation of detection of putativecompounds was set to be 60 sec (Gika et al., 2007; Schmidt et al.,2008), and the m/z tolerance window was 0.005 Da. A peptidewas considered as having been detected only when all threecriteria were satisfied: its retention time was within 60 sec, itsaccuratemass had less than 0.005 Da difference from that of thestandard at the same charge state as the standard. Identifiedpeptides and compounds were searched in the literature anddatabases to evaluate their bioactivities for toxicologicalrelevance.
2. Results and discussion
Fig. 1 illustrates the overall workflow of our strategy. It consistedof comparative analysis of blank, source water, and finishedwater using multiple SPEs for sample preconcentration, HPLCseparation, comprehensive advanced mass spectrometry anal-ysis, and a relevant database search. The combination of thesetechniques confronts the challenges of trace analysis ofcomplex peptides and their DBPs. Manual interpretation ofMS/MS spectra and validation with chemical standards wereperformed to confirm the existence of putative identificationsin water.
2.1. Water sample preparation
SPE enrichment is a critical step to concentrate analytespresent in water because of sample complexity and traceconcentrations (often at ng/L). We applied three commonlyused SPE cartridges (Oasis HLB, Bond Elut ENV, and Bond ElutC18) of complementary retention mechanisms in parallel,to achieve efficient enrichment of a variety of organics inwater. The Oasis HLB cartridge is composed of a hydrophilic–lipophilic balanced polymer and can retain polar and nonpolarorganic compounds. The Bond Elut C18 cartridge is packed witha C18-coated silica reverse stationary phase and can retainmainly hydrophobic compounds, while the Bond Elut ENVcartridge is packed with modified styrene-divinylbenzene poly-mers and can retain hydrophilic and polar organic compounds.Parallel SPEs provide fractionation of different organics that canenhance subsequent MS detection.
Fig. 2 shows representative chromatograms of LC-MS gradewater (blank), finished water, and source water analyzedusing SPE (HLB)-HPLC (C18)-MS/MS analysis. The peaksdetected in the blank are excluded from the list of candidatecompounds detected in the finished water and source water.Similarly, chromatograms containing a large number of peakswere detected using the other two SPEs with HPLC-MS/MSand HILIC-MS/MS analyses. However, each chromatogramresulting from the different SPE and LC-MS/MS methods usedcontains some identical peaks and some unique peaks(Appendix A Figs. S1–S5).
Fig. 3a shows that a total of 8519 putative organic compoundswere detected in a source water sample following enrichment
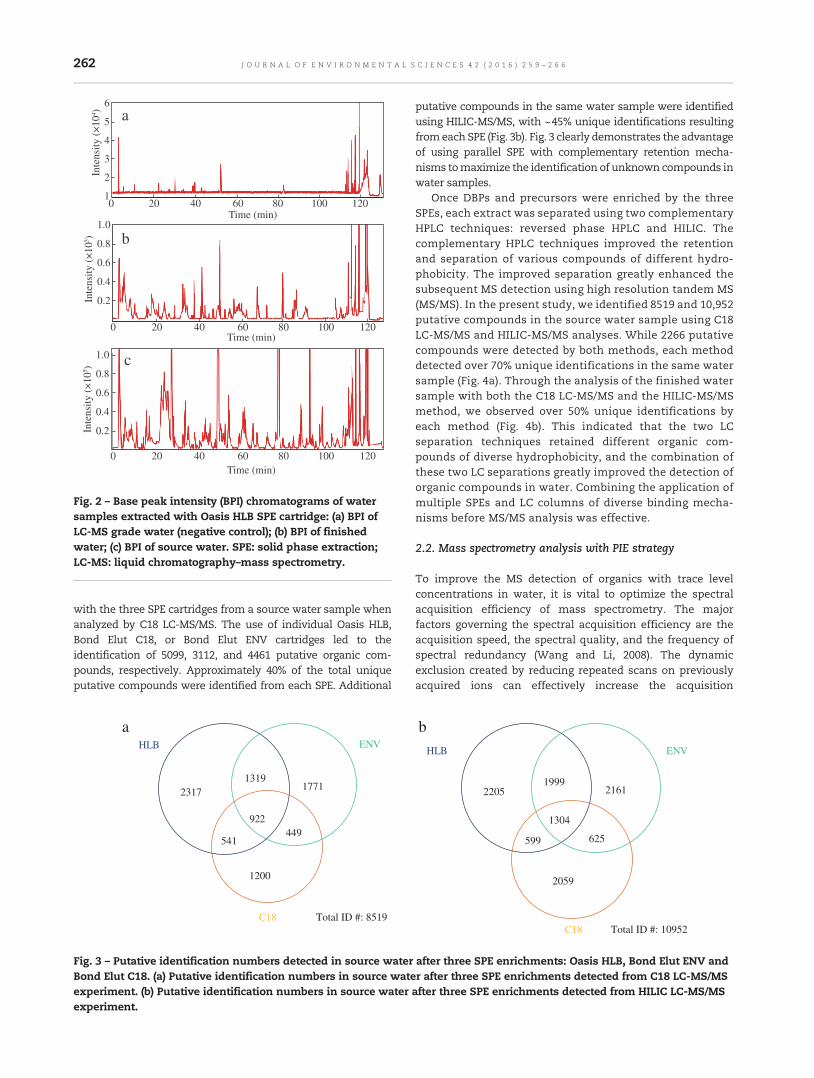
6
5
4
3
2
1
Inte
nsity
(×
104 )
1.0
0.8
0.6
0.4
0.2Inte
nsity
(×
105 )
1.0
0.8
0.6
0.4
0.2Inte
nsity
(×
105 )
a
b
c
0 20 40 60 80 100 120Time (min)
0 20 40 60 80 100 120Time (min)
0 20 40 60 80 100 120Time (min)
Fig. 2 – Base peak intensity (BPI) chromatograms of watersamples extracted with Oasis HLB SPE cartridge: (a) BPI ofLC-MS grade water (negative control); (b) BPI of finishedwater; (c) BPI of source water. SPE: solid phase extraction;LC-MS: liquid chromatography–mass spectrometry.
262 J O U R N A L O F E N V I R O N M E N T A L S C I E N C E S 4 2 ( 2 0 1 6 ) 2 5 9 – 2 6 6
with the three SPE cartridges from a source water sample whenanalyzed by C18 LC-MS/MS. The use of individual Oasis HLB,Bond Elut C18, or Bond Elut ENV cartridges led to theidentification of 5099, 3112, and 4461 putative organic com-pounds, respectively. Approximately 40% of the total uniqueputative compounds were identified from each SPE. Additional
HLB ENV
C18 Total ID #: 8519
922
1319
541449
2317 1771
1200
a
Fig. 3 – Putative identification numbers detected in source waterBond Elut C18. (a) Putative identification numbers in source wateexperiment. (b) Putative identification numbers in source waterexperiment.
putative compounds in the same water sample were identifiedusing HILIC-MS/MS, with ~45% unique identifications resultingfromeach SPE (Fig. 3b). Fig. 3 clearly demonstrates the advantageof using parallel SPE with complementary retention mecha-nisms tomaximize the identification of unknown compounds inwater samples.
Once DBPs and precursors were enriched by the threeSPEs, each extract was separated using two complementaryHPLC techniques: reversed phase HPLC and HILIC. Thecomplementary HPLC techniques improved the retentionand separation of various compounds of different hydro-phobicity. The improved separation greatly enhanced thesubsequent MS detection using high resolution tandem MS(MS/MS). In the present study, we identified 8519 and 10,952putative compounds in the source water sample using C18LC-MS/MS and HILIC-MS/MS analyses. While 2266 putativecompounds were detected by both methods, each methoddetected over 70% unique identifications in the same watersample (Fig. 4a). Through the analysis of the finished watersample with both the C18 LC-MS/MS and the HILIC-MS/MSmethod, we observed over 50% unique identifications byeach method (Fig. 4b). This indicated that the two LCseparation techniques retained different organic com-pounds of diverse hydrophobicity, and the combination ofthese two LC separations greatly improved the detection oforganic compounds in water. Combining the application ofmultiple SPEs and LC columns of diverse binding mecha-nisms before MS/MS analysis was effective.
2.2. Mass spectrometry analysis with PIE strategy
To improve the MS detection of organics with trace levelconcentrations in water, it is vital to optimize the spectralacquisition efficiency of mass spectrometry. The majorfactors governing the spectral acquisition efficiency are theacquisition speed, the spectral quality, and the frequency ofspectral redundancy (Wang and Li, 2008). The dynamicexclusion created by reducing repeated scans on previouslyacquired ions can effectively increase the acquisition
HLB ENV
C18 Total ID #: 10952
2059
1304
19992205
599
2161
625
b
after three SPE enrichments: Oasis HLB, Bond Elut ENV andr after three SPE enrichments detected from C18 LC-MS/MSafter three SPE enrichments detected from HILIC LC-MS/MS

RPLC HILIC
22666253 8686
RPLC HILIC
28833211 7203
a b
Total ID #: 17205 Total ID #: 13297
Fig. 4 – Putative identification numbers detected in source water and finished water samples. (a) Putative identificationnumbers in source water analyzed by C18 LC-MS/MS and HILIC LC-MS/MS. (b) Putative identification numbers in finishedwater analyzed by C18 LC-MS/MS and HILIC LC-MS/MS.
Table 1 – Comparison of identifications in replicate C18LC-MS/MS analyses of source water with theimplementation of PIE.
OasisHLB
BondElut ENV
BondElut C18
No. of IDs in the 1st run 3843 3145 2436No. of IDs in the 2nd run with PIE 3388 3026 1724Unique IDs in the 2nd run 1256 1316 676Increases from the 1st run 32.7% 41.8% 27.8%Total IDs 5099 4461 3112
PIE: precursor ion exclusion.
263J O U R N A L O F E N V I R O N M E N T A L S C I E N C E S 4 2 ( 2 0 1 6 ) 2 5 9 – 2 6 6
efficiency in a LC-MS/MS run. However, dynamic exclusionalone is not sufficient for the acquisition of spectral data of allcompounds in a complex sample due to the co-elution ofmultiple compounds, the formation of multiple adduct ionsfrom one compound, and the limited analysis time andnumber of MS/MS experiments in one LC-MS/MS run.
To address this challenge, we integrated the PIE strategy inthe HPLC-MS/MS analysis. From each HPLC run, the highresolution tandemmass spectrometer collects a huge numberof MS/MS spectra. Setting a lower threshold for triggering MS/MS would allow the collection of MS/MS spectra from moreprecursor ions, thus potentially detecting more compounds.However, more precursor ions mean less time spent oncollecting each MS/MS spectrum, resulting in lower intensityand poorer quality of all MS/MS spectra. To overcomethis problem, we applied the PIE strategy. The PIE strategyexcludes selected preset ions so that more time is devoted tothe detection of other ions. By excluding the highly abundantprecursor ions that were analyzed in the first LC-MS/MS run,PIE allowed the MS instrument to spend more time collectingMS/MS spectra for ions of lower abundance.
To perform PIE, we first collected MS/MS spectra of ions withhigh abundance in the first LC-MS/MS acquisition. Then, anexclusion list of them/z values of these precursor ions alongwiththeir retention time was generated and entered into the ionexclusion program of MS acquisition. These ions were subse-quently excluded from MS/MS analysis in the duplicate LC-MS/MS run. Thus, more analysis time could be spent analyzing ionswith lower abundance, allowing enhanced identification of lowabundance compounds in the second LC-MS/MS run.
Analysis of source water and finished water by LC-MS/MSwith PIE showed an increase of 30%–40% in the number ofcompounds detected in duplicate analyses compared to asingle analysis without using the PIE approach. Table 1 showsthe increase of putative identifications in the source waterfrom C18 LC-MS/MS analysis with the implementation of PIE.In the source water sample enriched by the Oasis HLBcartridge, 1256 unique identifications were found from thesecond LC-MS/MS run with PIE, corresponding to a 32.7%increase compared to a single LC-MS/MS analysis. Similarly,41.8% and 27.8% increases in the number of identifiedputative compounds were obtained with PIE in the sourcewater extracts from Bond Elut ENV and Bond Elut C18cartridges, respectively.
Additionally, the combination of complementary C18-MS/MSand HILIC-MS/MS analyses of a sample resulted in the furtherincrease of the number of compounds detected. The preliminaryresults demonstrated the promise of our new technique, whichintegrates complementaryHPLCseparationswithhigh resolutionMS andMS/MS analysis of a sample to enhance the detection of avariety of compounds.
Using the optimized method, we identified a total of 17,205and 13,297 putative organic compounds in the sourcewater sample and the finished water sample respectively bysearching against the HMDB. For different analytical empha-sis, the LC-MS/MS data generated above can be searched indifferent databases. To identify peptides and their DBPs, wesearched the LC-MS/MS data against the HMDB, as it containsinformation about chemical structures, clinical characteris-tics, and bioactivities of more than 41,000 biomolecules(Wishart et al., 2013).
After identifying a large number of putative organics inwater, wemanually examined their fragmentation patterns inMS/MS, and compared their accurate masses, as well as theirretention times, with chemical standards to validate theiridentifications. As a proof of principle, we selected 30 putativecompounds of interesting bioactivities, including peptides,toxins, and DBPs, to demonstrate the feasibility of our strategy.The experimentalMS/MS spectra of all selected compoundswerecompared with their theoretical fragments. If over 50% of theintensive peaks in the MS/MS spectrum of a precursor ionmatched with its theoretical fragments, this MS/MS spectrumwas considered a good match, and the identification of thisprecursor ion was considered to be potentially valid. Otherwisethe identification was rejected and not considered further. This
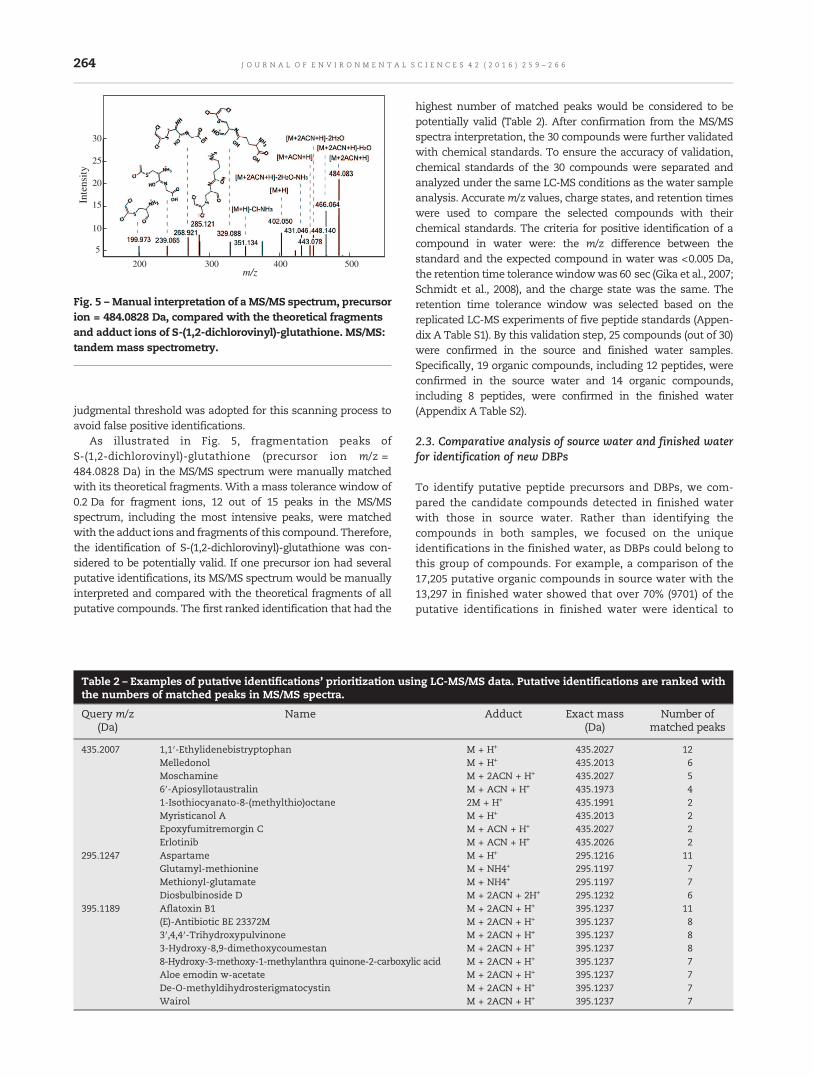
200 300 400 500
5
10
15
20
25
30
m/z
Inte
nsity
Fig. 5 – Manual interpretation of a MS/MS spectrum, precursorion = 484.0828 Da, compared with the theoretical fragmentsand adduct ions of S-(1,2-dichlorovinyl)-glutathione. MS/MS:tandem mass spectrometry.
264 J O U R N A L O F E N V I R O N M E N T A L S C I E N C E S 4 2 ( 2 0 1 6 ) 2 5 9 – 2 6 6
judgmental threshold was adopted for this scanning process toavoid false positive identifications.
As illustrated in Fig. 5, fragmentation peaks ofS-(1,2-dichlorovinyl)-glutathione (precursor ion m/z =484.0828 Da) in the MS/MS spectrum were manually matchedwith its theoretical fragments. With a mass tolerance window of0.2 Da for fragment ions, 12 out of 15 peaks in the MS/MSspectrum, including the most intensive peaks, were matchedwith the adduct ions and fragments of this compound. Therefore,the identification of S-(1,2-dichlorovinyl)-glutathione was con-sidered to be potentially valid. If one precursor ion had severalputative identifications, its MS/MS spectrum would be manuallyinterpreted and compared with the theoretical fragments of allputative compounds. The first ranked identification that had the
Table 2 – Examples of putative identifications' prioritization usithe numbers of matched peaks in MS/MS spectra.
Query m/z(Da)
Name
435.2007 1,1′-EthylidenebistryptophanMelledonolMoschamine6′-Apiosyllotaustralin1-Isothiocyanato-8-(methylthio)octaneMyristicanol AEpoxyfumitremorgin CErlotinib
295.1247 AspartameGlutamyl-methionineMethionyl-glutamateDiosbulbinoside D
395.1189 Aflatoxin B1(E)-Antibiotic BE 23372M3′,4,4′-Trihydroxypulvinone3-Hydroxy-8,9-dimethoxycoumestan8-Hydroxy-3-methoxy-1-methylanthra quinone-2-carboxylAloe emodin w-acetateDe-O-methyldihydrosterigmatocystinWairol
highest number of matched peaks would be considered to bepotentially valid (Table 2). After confirmation from the MS/MSspectra interpretation, the 30 compounds were further validatedwith chemical standards. To ensure the accuracy of validation,chemical standards of the 30 compounds were separated andanalyzed under the same LC-MS conditions as the water sampleanalysis. Accuratem/z values, charge states, and retention timeswere used to compare the selected compounds with theirchemical standards. The criteria for positive identification of acompound in water were: the m/z difference between thestandard and the expected compound in water was <0.005 Da,the retention time tolerancewindowwas 60 sec (Gika et al., 2007;Schmidt et al., 2008), and the charge state was the same. Theretention time tolerance window was selected based on thereplicated LC-MS experiments of five peptide standards (Appen-dix A Table S1). By this validation step, 25 compounds (out of 30)were confirmed in the source and finished water samples.Specifically, 19 organic compounds, including 12 peptides, wereconfirmed in the source water and 14 organic compounds,including 8 peptides, were confirmed in the finished water(Appendix A Table S2).
2.3. Comparative analysis of source water and finished waterfor identification of new DBPs
To identify putative peptide precursors and DBPs, we com-pared the candidate compounds detected in finished waterwith those in source water. Rather than identifying thecompounds in both samples, we focused on the uniqueidentifications in the finished water, as DBPs could belong tothis group of compounds. For example, a comparison of the17,205 putative organic compounds in source water with the13,297 in finished water showed that over 70% (9701) of theputative identifications in finished water were identical to
ng LC-MS/MS data. Putative identifications are ranked with
Adduct Exact mass(Da)
Number ofmatched peaks
M + H+ 435.2027 12M + H+ 435.2013 6M + 2ACN + H+ 435.2027 5M + ACN + H+ 435.1973 42M + H+ 435.1991 2M + H+ 435.2013 2M + ACN + H+ 435.2027 2M + ACN + H+ 435.2026 2M + H+ 295.1216 11M + NH4+ 295.1197 7M + NH4+ 295.1197 7M + 2ACN + 2H+ 295.1232 6M + 2ACN + H+ 395.1237 11M + 2ACN + H+ 395.1237 8M + 2ACN + H+ 395.1237 8M + 2ACN + H+ 395.1237 8
ic acid M + 2ACN + H+ 395.1237 7M + 2ACN + H+ 395.1237 7M + 2ACN + H+ 395.1237 7M + 2ACN + H+ 395.1237 7

Table 3 – Chlorinated peptides detected in source water and finished water.
Source water HMDB ID Name Molecular mass
HMDB30457 Cyclochlorotine 571.1601HMDB60504 S-(1,2-dichlorovinyl)glutathione 401.0215
Finished water HMDB ID Name Molecular mass
HMDB01309 m-Chlorohippuric acid 213.0193HMDB01885 3-Chlorotyrosine 215.0349HMDB30399 N-(carbethoxyacetyl)-4-chloro-L-tryptophan 352.0826HMDB60358 2,3-Dihydro-2-S-glutathionyl-3-hydroxy bromobenzene 479.0362HMDB60504 S-(1,2-dichlorovinyl)glutathione 401.0215HMDB60506 S-(2,2-Dichloro-1-hydroxy)ethyl glutathione 419.0321
HMDB: Human Metabolome Database.
265J O U R N A L O F E N V I R O N M E N T A L S C I E N C E S 4 2 ( 2 0 1 6 ) 2 5 9 – 2 6 6
those detected in the source water. However, nearly 30% of theputative identifications were unique in finished water. Amongall putative compounds, we found 625 peptides in source water(Appendix A Table S3) and 617 peptides in finished water(Appendix A Table S4). We identified 501 peptides in both thesource water and the finished water samples, while theremaining 116 peptides were unique in finished water. As well,124 unique peptides were detected exclusively in source water.
Among the 625 peptides detected in source water, wefound two chlorinated peptides. These two chlorinatedpeptides were also found in finished water. Another fourchlorinated peptides were detected among the 116 uniquepeptides found in finished water (Table 3). These findingsmost likely indicate that chlorination of peptides in wateroccurred during the chlorine disinfection process. Besideschlorination, we observed two nitrosation reactions onpeptides after water disinfection, as shown in Fig. 6, byexamining the 116 and 124 unique peptides detected infinished water and source water. One was S-nitrosation,wherein glutathione is transformed to S-nitrosoglutathione
OH
HO
NH2
O
HOOCl-+a
NHOOC
NH2
NH
OHS
HN
O
COOH+
b
NR
OOH
+ NO
NO3
NN
OOHO
c
Fig. 6 – Three disinfection reactions on peptides in source water(b) S-nitrosation of glutathione during chlorine disinfection of waproline containing dipeptides during chlorine disinfection to pro
in the disinfection process (Choi and Valentine, 2003; Wanget al., 2002). The second N-nitrosation reaction pertained todipeptides containing proline in source water. As reported,these dipeptides containing proline were transformed toN-nitrosoproline and N-nitrosopyrrolidine (Nebelin et al.,1980). This approach allows for the identification ofnon-chlorinated and chlorinated DBPs which have notbeen reported previously. It is novel and effective foradvancing DBP research. The methodology can help in-crease knowledge of the potential precursors and resultingDBPs of biological molecules, which is important for thedesign of water treatment processes.
Acknowledgments
This project was supported by grants from the NaturalSciences and Engineering Research Council of Canada, AlbertaHealth, and Alberta Innovates—Energy and EnvironmentSolutions.
NH2
O
OH
Cl
O
NO3
HOOC
NH2
NH
OS
HN
O
COOH
NO
NN
O
and finished water samples. (a) Chlorination of tyrosine.ter to produce S-nitrosoglutathione. (c) N-nitrosation ofduce N-nitrosoproline and N-nitrosopyrrolidine.

266 J O U R N A L O F E N V I R O N M E N T A L S C I E N C E S 4 2 ( 2 0 1 6 ) 2 5 9 – 2 6 6
Appendix A. Supplementary data
Supplementary data to this article can be found online athttp://dx.doi.org/10.1016/j.jes.2015.08.007.
R E F E R E N C E S
Brosillon, S., Lemasle, M., Renault, E., Tozza, D., Heim, V.,Laplanche, A., 2009. Analysis and occurrence of odorousdisinfection by-products from chlorination of amino acids inthree different drinking water treatment plants andcorresponding distribution networks. Chemosphere 77 (8),1035–1042.
Choi, J., Valentine, R.L., 2003. N-nitrosodimethylamine formationby free-chlorine-enhanced nitrosation of dimethylamine.Environ. Sci. Technol. 37 (21), 4871–4876.
Garland, C.F., Grant, W.B., Boucher, B.J., Cross, H.S., Garland, F.C.,Gillie, O., Gorham, E.D., Heaney, R.P., Holick, M.F., Hollis, B.W.,Moan, J.E., Peterlik, M., Reichrath, J., Zittermann, A., 2009. Openletter to IARC Director Christopher P. Wild Re: IARC WorkingGroup Report 5: vitamin D and cancer. Dermato-endocrinology1 (2), 119–120.
Gika, H.G., Theodoridis, G.A., Wingate, J.E., Wilson, I.D., 2007.Within-day reproducibility of an HPLC-MS-based method formetabonomic analysis: application to human urine.J. Proteome Res. 6 (8), 3291–3303.
Grant,W.B., 2009. A critical reviewof vitaminDandcancer: a report ofthe IARCWorking Group. Dermato-endocrinology 1 (1), 25–33.
Hayes, T.M., Hayes, M.H.B., Skjemstad, J.O., Swift, R.S., 2008.Compositional relationships between organic matter in agrassland soil and its drainage waters. Eur. J. Soil Sci. 59 (4),603–616.
Hernandez, F., Sancho, J.V., Ibanez, M., Abad, E., Portoles, T., Mattioli,L., 2012. Current use of high-resolution mass spectrometry in theenvironmental sciences. Anal. Bioanal. Chem. 403 (5), 1251–1264.
Humpage, A.R., Hardy, S.J., Moore, E.J., Froscio, S.M., Falconer, I.R.,2000. Microcystins (cyanobacterial toxins) in drinking waterenhance the growth of aberrant crypt foci in the mouse colon.J. Toxicol. Environ. Health A 61 (3), 155–165.
Ito, E., Kondo, F., Terao, K., Harada, K., 1997. Neoplastic nodularformation in mouse liver induced by repeated intraperitonealinjections of microcystin-LR. Toxicon 35 (9), 1453–1457.
Komaki, Y., Marinas, B.J., Plewa, M.J., 2014. Toxicity of drinkingwater disinfection byproducts: cell cycle alterations inducedby the monohaloacetonitriles. Environ. Sci. Technol. 48 (19),11662–11669.
Lauby-Secretan, B., Scoccianti, C., Loomis, D., Benbrahim-Tallaa,L., Bouvard, V., Bianchini, F., Straif, K., 2015. Breast-cancerscreening—viewpoint of the IARC Working Group. N. Engl.J. Med. 372 (24), 2353–2358.
Li, J., Wang, W., Moe, B., Wang, H., Li, X.-F., 2015. Chemical andtoxicological characterization of halobenzoquinones, anemerging class of disinfection byproducts. Chem. Res. Toxicol.28 (3), 306–318.
Nebelin, E., Pillai, S., Lund, E., Thomsen, J., 1980. On the formationof N-nitrosopyrrolidine from potential precursors and nitrite.IARC Sci. Publ. (31), 183–193.
Richardson, S.D., Plewa, M.J., Wagner, E.D., Schoeny, R., Demarini,D.M., 2007. Occurrence, genotoxicity, and carcinogenicity ofregulated and emerging disinfection by-products in drinkingwater: a review and roadmap for research. Mutat. Res. 636(1-3), 178–242.
Schmidt, A., Gehlenborg, N., Bodenmiller, B., Mueller, L.N.,Campbell, D., Mueller, M., Aebersold, R., Domon, B., 2008. Anintegrated, directed mass spectrometric approach for in-depthcharacterization of complex peptide mixtures. Mol. Cell.Proteomics 7 (11), 2138–2150.
Spoof, L., Vesterkvist, P., Lindholm, T., Meriluoto, J., 2003.Screening for cyanobacterial hepatotoxins, microcystins andnodularin in environmental water samples by reversed-phaseliquid chromatography-electrospray ionisation massspectrometry. J. Chromatogr. A 1020 (1), 105–119.
Tavtigian, S.V., Greenblatt, M.S., Goldgar, D.E., Boffetta, P., 2008.Assessing pathogenicity: overview of results from the IARCUnclassified Genetic Variants Working Group. Hum. Mutat. 29(11), 1261–1264.
Ueno, Y., Nagata, S., Tsutsumi, T., Hasegawa,A.,Watanabe,M.F., Park,H.D., Chen, G.C., Chen, G., Yu, S.Z., 1996. Detection ofmicrocystins,a blue-green algal hepatotoxin, in drinking water sampled inHaimen and Fusui, endemic areas of primary liver cancer inChina, by highly sensitive immunoassay. Carcinogenesis 17 (6),1317–1321.
Villanueva, C.M., Cantor, K.P., Cordier, S., Jaakkola, J.J., King, W.D.,Lynch, C.F., Porru, S., Kogevinas, M., 2004. Disinfectionbyproducts and bladder cancer: a pooled analysis. Epidemiology15 (3), 357–367.
Wang, N., Li, L., 2008. Exploring the precursor ion exclusionfeature of liquid chromatography-electrospray ionizationquadrupole time-of-flight mass spectrometry for improvingprotein identification in shotgun proteome analysis. Anal.Chem. 80 (12), 4696–4710.
Wang, P.G., Xian, M., Tang, X., Wu, X., Wen, Z., Cai, T., Janczuk, A.J.,2002. Nitric oxide donors: chemical activities and biologicalapplications. Chem. Rev. 102 (4), 1091–1134.
Wishart, D.S., Jewison, T., Guo, A.C., Wilson, M., Knox, C., Liu, Y.,Djoumbou, Y., Mandal, R., Aziat, F., Dong, E., Bouatra, S.,Sinelnikov, I., Arndt, D., Xia, J., Liu, P., Yallou, F., Bjorndahl, T.,Perez-Pineiro, R., Eisner, R., Allen, F., Neveu, V., Greiner, R.,Scalbert, A., 2013. HMDB 3.0—the Human Metabolome Databasein 2013. Nucleic Acids Res. 41 (Database issue), D801–D807.

J O U R N A L O F E N V I R O N M E N T A L S C I E N C E S 4 2 ( 2 0 1 6 ) 2 6 7 – 2 7 4
Ava i l ab l e on l i ne a t www.sc i enced i r ec t . com
ScienceDirect
www.e l sev i e r . com/ loca te / j es
The nitritation performance of biofilm reactor for treatingdomestic wastewater under high dissolved oxygen
Zhaoming Zheng1,⁎, Zebing Li2, Jing Ma1, Jia Du1, Guanghui Chen1,⁎, Wei Bian1,Jun Li1, Baihang Zhao1
1. Key Laboratory of Beijing for Water Quality Science and Water Environment Recovery Engineering, Beijing University of Technology, Beijing100124, China2. School of Water Resources and Environmental Engineering, East China Institute of Technology, Nanchang 330013, China
A R T I C L E I N F O
⁎ Corresponding authors. E-mails: zhengzhao
http://dx.doi.org/10.1016/j.jes.2015.09.0061001-0742/© 2015 The Research Center for Ec
A B S T R A C T
Article history:Received 7 April 2015Revised 14 September 2015Accepted 29 September 2015Available online 7 December 2015
The objective of this study was to investigate the nitritation performance in a biofilmreactor for treating domestic wastewater. The reactor was operated in continuous feedmode from phases 1 to 3. The dissolved oxygen (DO) was controlled at 3.5–7 mg/Lthroughout the experiment. The biofilm reactor showed excellent nitritation performanceafter the inoculation of nitrifying sludge, with the hydraulic retention time being reducedfrom 24 to 7 hr. Above 90% nitrite accumulation ratio (NAR) was maintained in phase 1.Afterwards, nitratation occurred with the low NH4
+–N concentration in the reactor. Theimprovement of NH4
+–N concentration to 20–35 mg/L had a limited effect on the recovery ofnitritation. However, nitritation recovered rapidly when sequencing batch feed mode wasadopted in phase 4, with the effluent NH4
+–N concentration above 7 mg/L. The improvementof ammonia oxidizing bacteria (AOB) activity and the combined inhibition effect of freeammonia (FA) and free nitrous acid (FNA) on the nitrite oxidizing bacteria (NOB) were twokey factors for the rapid recovery of nitritation. Sludge activity was obtained in batch tests.The results of batch tests had a good relationship with the long term operation performanceof the biofilm reactor.© 2015 The Research Center for Eco-Environmental Sciences, Chinese Academy of Sciences.
Published by Elsevier B.V.
Keywords:NitritationHigh dissolved oxygenDomestic wastewaterBiofilm reactorControl measures
Introduction
Wastewater that contains a large amount of ammonium willcause a serious eutrophication problem for the receivingwater. Biological nitrification–denitrification is commonlyused to remove the nitrogen from wastewater. However,these practices usually lead to the need for a large volumereactor and high operating costs. Partial nitritation/anammox(PNA) installations were already successfully operated world-wide in side-stream treatment to reduce aeration energy fornitrogen removal (Gut et al., 2006; Zekker et al., 2013; Lackneret al., 2014). The research focus has now moved to possible
[email protected] (Zhaom
o-Environmental Science
applications of PNA in mainstream treatment. Currentresearch suggests that anammox could be achieved at lowtemperature (about 20°C) and that the biofilm reactor wasefficient in the cultivation of anammox bacteria (Zekker et al.,2012b, 2015a; Gilbert et al., 2014). Some measures for therecovery of anammox under adverse conditions were alsoreported (Jin et al., 2013; Bi et al., 2014; Zekker et al., 2015b).Nevertheless, it is still difficult to achieve nitritation inmainstream wastewater due to the low temperature and lownitrogen concentration. Therefore, it is necessary to investi-gate the feasibility of partial nitrification measures fortreating sewage.
ing Zheng), [email protected] (Guanghui Chen).
s, Chinese Academy of Sciences. Published by Elsevier B.V.

2
5
910
6 7 8
4
13
Fig. 1 – Reactor configuration scheme of biofilm reactor.(1) Influent pump; (2) air flowmeter; (3) air diffuser;(4) electromagnetic valve; (5) effluent of sequencing fedbatch mode; (6) heating rod; (7) pH electrode; (8) dissolvedoxygen (DO) electrode; (9) effluent of continuous fed mode;(10) programmable logic controller (PLC).
268 J O U R N A L O F E N V I R O N M E N T A L S C I E N C E S 4 2 ( 2 0 1 6 ) 2 6 7 – 2 7 4
Nitritation has been achieved by controlling several operationalfactors, such as low dissolved oxygen (DO) (Blackburne et al.,2008a), high pH (Villaverde et al., 1997), high temperature (Hellingaet al., 1998), and heavy free ammonia (FA) and free nitrous acid(FNA) concentrations (Anthonisen et al., 1976; Vadivelu et al., 2007;Park and Bae, 2009). For low-strength, municipal or domesticwastewater, almost all experiments have been conducted insequencing batch reactors (SBRs) with an activated sludge system(Blackburne et al., 2008b; Yin et al., 2014). On the other hand, itwould be a feasible option to achieve nitritation with low DO. Theoxygen saturation coefficients of ammonia oxidizing bacteria(AOB) and nitrite oxidizing bacteria (NOB) are known to be 0.3 and1.1 mg/L, respectively (Wiesmann, 1994).When oxygen is limiting,AOB were suggested to outcompete NOB (Bernet et al., 2001;Blackburne et al., 2008a). Tokutomi (2004) observed that thegrowth rate of AOB was 2.6 times faster than that of NOB whenthe DO was below 1.0 mg/L. However, it was also reported thatNOB could be outcompeted at high DO bulk concentrations, sincethe oxygen supply to the biofilm could be reduced by a thickexternal boundary layer (Antileo et al., 2007; Brockmann andMorgenroth, 2010; Rathnayake et al., 2013; Zekker et al., 2014). Sofar, there is little information about the nitritation performance ofbiofilm reactors for treating domestic wastewater.
It was reported that an alternating aeration strategy waseffective in achieving nitritation (Kornaros et al., 2010; Ge etal., 2014). Kornaros et al. (2010) reported that AOB were notaffected by anoxic disturbance, while the NOB were seriouslyinhibited, with a reduced growth rate. Ge et al. (2014) pointedout that NOB adjusted more slowly than AOB to aerobicconditions after anoxic periods. Slow-growing organisms aresuggested to grow in the inner part of the biofilm, whereasfaster growing organisms are towards to the outer part ofthe biofilm (Brockmann and Morgenroth, 2010; Rikmann et al.,2012; Zekker et al., 2012a). Moreover, reports have shown thatthe growth rate of AOB was higher than that of NOB attemperatures above 25°C (Hellinga et al., 1998). Hence, itshould be feasible to achieve nitritation rapidly in a biofilmreactor at high temperature.
Based on the above discussion, the aim of the presentstudy was to investigate the nitritation performance in abiofilm reactor. For this purpose, the fast achievementof excellent nitritation performance and the effect of ammo-nium concentration on the nitritation performance wereinvestigated. Additionally, the effect of the sequencing batchfeedmode on the recovery performance of nitritation was alsoinvestigated. It is expected that the knowledge obtained inthis study will be critical for developing a novel nitritationprocess and lay the foundation for the application of PNA inmainstream autotrophic nitrogen removal processes.
1. Materials and methods
1.1. Reactor and experimental setup
Fig. 1 shows the reactor configuration scheme of the exper-imental set-up. A biofilm reactor with a working volume of89.5 L was used. Dimensions of the unit were: a height of79 cm and inner diameter of 38 cm. Kaldnes rings (K3 carriers,AnoxKaldnes, Beijing) were used as biomass carriers. The
volume of the carriers was 38% of the working volume of thereactor. The carriers had a cylindrical shape (diameter of25 mm) with a grid of 4 mm. Fig. 6 shows a picture of thecarriers. The temperature was controlled at 30°C by threeheating rods immersed in the reactor (GM1616, Jiyin, China).No pH adjustment was adopted. The air was supplied by an airdiffuser with a constant rate of 500 L/hr at the bottom of thereactor. A programmable logic controller (PCL-812, Advantech,USA) was installed to perform automatic process control. TheDO and pH were detected by online instruments.
1.2. Wastewater and operational conditions
The reactor was operated in four phases. During phases 1 to 3,the reactor was operated in continuous feed mode. Theinfluent was pumped into the bottom and the effluent wasdischarged at the top of the reactor. In phase 1 (days 1 to 33),the hydraulic retention time (HRT) was shortened from 24 to7 hr. The HRT in phase 2 (days 34 to 52) and phase 3 (days 53 to76) was maintained at 7 and 4.6 hr, respectively. In phase 4(days 77 to 95), the reactor was operated in sequencing batchfeed mode with a volume exchange ratio (VER) of 81%. Eachcycle contained: feeding (3 min), aerobic reaction (180 min),settling (10 min), decanting (10 min), and idling (1 min).During phase 4, the floc sludge would be withdrawn fromthe reactor with the effluent since the settling time was10 min and the VER was 81%. No additional sludge wasdischarged from the biofilm reactor.
The seeding sludgewas obtained from an original SBR in ourlab with excellent nitritation performance. The mixed liquorsuspended solids (MLSS) and the volume of the seeding sludgewere 8000 mg/L and 7 L, respectively. The aerobic NH4
+–N andNO2
−–N oxidation activities of the seeding sludge were 0.135 and0.001 g N/(g VSS · day), respectively (Appendix A Fig. S1). As for

Table 2 – Composition of synthetic wastewater in batchtests.
Constituents NH4+–N oxidation test NO2
−–N oxidation test
NH4+–N (mg/L) 70 0
NO2−–N (mg/L) 0 70
NaHCO3 (mg/L) 840 0
269J O U R N A L O F E N V I R O N M E N T A L S C I E N C E S 4 2 ( 2 0 1 6 ) 2 6 7 – 2 7 4
the original SBR reactor, it was fed with the same domesticwastewater as used in this experiment. The temperature wasnot controlled and the DO concentration was maintained at 2–3 mg/L. The original SBR achieved nitritation by stopping theaeration ahead of ammonium complete-oxidation with anactivated sludge system. Domestic wastewater from the resi-dential area nearby the lab was used as feed. The mainwastewater characteristics are summarized in Table 1.
1.2.1. Batch testsBatch tests were performed in serum bottles with a workingvolume of 500 mL. The composition of synthetic wastewateris described in Table 2. The sludge used in batch testswas prepared as follows: suspended sludge taken from thebiofilm reactor was first precipitated in a flask and thesupernatant was withdrawn, then the precipitated sludgewas concentrated in a centrifuge (4000 r/min × 2 min). Thecentrifuged sludge was then mixed with distilled water andreconcentrated again to remove the residual nitrogen species.
About 10 g reconcentrated sludge was then transferred toserum bottles together with 500 mL synthetic wastewater.Meanwhile, about 5 g reconcentrated sludge was processedby the oven and muffle furnace to determine the ratios ofdry solids to reconcentrated sludge and volatile solids toreconcentrated sludge. The MLSS and mixed liquor volatilesuspended solids (MLVSS) in serum bottles were thencalculated according to the former ratios. The aeration wassupplied at a flow rate of 250 mL/min to maintain the DOconcentration above 5 mg/L in case the activity of sludge waslimited by oxygen. Magnetic stirring (200 r/min) was used tokeep the biomass in suspension and increase the masstransfer performance. The temperature was controlled at30°C. Samples were taken at appropriate time intervals.
1.3. Analytical methods
All the samples were filtered with a 0.45 μm filter beforeanalyzing. NH4
+–N, NO2−–N, NO3
−–N, COD, MLSS, MLVSS andalkalinity were measured according to the standard methods(APHA, 1998). DO, pH, and temperature (T) were monitored bya WTW Multi 3420i meter (WTW Company, Germany).
The morphology of the bacteria was observed with ascanning electron microscope (SEM) (FEIQUANTA 200, FEICompany, USA) to acquire more information for better reactorperformance. The samples were fixed with 2.5% glutaralde-hyde for 3 hr and then rinsed in 0.1 mol/L phosphate buffersolution (PBS, pH 7.2) 3 times. Subsequently, the samples weredehydrated with a series of ethanol–water mixtures (25%, 50%,75%, 90% and 100% ethanol). The dewatered samples weredried by the critical point method and further sputter-coatedwith gold for SEM observation.
Table 1 – Characteristics of domestic wastewater.
Parameters pH COD (mg/L) TN (mg/L) NH4+–N (mg/L)
Range 7.1–8.0 200–320 70–120 60–90Mean 7.5 250 90 80
COD: chemical oxygen demand. TN: the summation of NH4+–N, NO2
––N, NO
1.4. Calculation methods
The COD discussed in this study was calculated as Eq. (1)(Liang and Liu, 2007).
COD ¼ CODmeasured −87C NO−
2−Nð Þeffluent ð1Þ
where, C (mg/L) is the concentration.The nitrite accumulation ratio (NAR, %) was calculated as
Eq. (2) (Liang and Liu, 2007).
NAR ¼ NO−2−N
NO−2−NþNO−
3−N� 100%: ð2Þ
The FA and FNA concentrations were calculated by thefollowing Eqs. (3) and (4) (Anthonisen et al., 1976):
FA ¼ 1714
� c NHþ4 −N
� �� 10pH
e6344273þTð Þ þ 10pH
ð3Þ
FNA ¼ 4614
� c NO−2−N
� �
e−2300273þTð Þ � 10pH
ð4Þ
where, T (°C) is temperature.
2. Results and discussion
2.1. Nitritation performance
In phase 1, the biofilm reactor started to achieve excellentnitritation performance (days 1–33). Fig. 2 shows the evolutionof nitrogen compounds and COD of the biofilm reactor. Duringdays 1–12, the HRT was gradually shortened from 24 to 7 hr.As observed, the ammonium loading rate gradually increasedfrom 0.07 to 0.20 kg N/(m3 · day) and the COD loading rateincreased from 0.24 to 0.69 kg N/(m3 · day) (Fig. 2d). Corre-spondingly, the ammonium removal rate rose from 0.06 to0.17 kg N/(m3 · day) and the COD removal rate rose from 0.18to 0.49 kg N/(m3 · day). On day 12, the effluent NH4
+–N, NO2−–N
and NO3−–N concentrations were 11.7, 65.5 and 5.5 mg/L with a
NAR of 92.2% (Fig. 2a and b), indicating the excellentnitritation performance of the biofilm reactor. During days
NO2−–N (mg/L) NO3
−–N (mg/L) Alkalinity (as CaCO3) (mg/L)
<1 <3 300–4000.15 1.2 320
3––N and total organic nitrogen.

0
40
60
80
100
20
0
20
40
60
80
100
Rem
oval
eff
icie
ncy
(%)
Influent NH4+-N
Nitr
ogen
(m
g/L
)a
Influent NO2--N
Influent NO3--N
Phase 4Phase 3Phase 2
Effluent NH4+-N
Phase 1 Phase 4Phase 3Phase 2Phase 1
NH4+-N removal efficiency
Time (day)
0
20
40
60
80
100
0
20
40
60
80
100
NO2--N accumulation rate
Time (day)
b
Nitr
ite a
ccum
ulat
ion
rate
(%
)
Effluent NO2--N
Nitr
ogen
(m
g/L
)
Effluent NO3--N
0
50
100
150
200
250
300
350
0
20
40
60
80
100
Effluent COD
CO
D (
mg/
L)
Influent COD
COD removal efficiency
Time (day)
CO
D r
emov
al e
ffic
ienc
y (%
)
c
0 10 20 30 40 50 60 70 80 90 100 0 10 20 30 40 50 60 70 80 90 100
0 10 20 30 40 50 60 70 80 90 100 0 10 20 30 40 50 60 70 80 90 1000.0
0.5
1.0
1.5
2.0
2.5
0
5
10
15
20
25
Influent NH4+-N loading
HR
T (
hr)
NH4+-N removal rate
Loa
ding
/rem
ove
rate
(kg
/(m
3 . day
))
Time (day)
d
Phase 4Phase 3Phase 2
COD removal rate
Phase 1Phase 4Phase 3Phase 2Phase 1
Influent COD loading
HRT
Fig. 2 – Evolution of nitrogen compounds and chemical oxygen demand (COD) during operation: (a) evolution of nitrogencompounds and the NH4
+–N removal performance; (b) nitrogen compounds and nitrite accumulation ratio (NAR) in the effluent;(c) COD removal performance; (d) influent loading rate, removal rate and hydraulic retention time (HRT) during operation.
270 J O U R N A L O F E N V I R O N M E N T A L S C I E N C E S 4 2 ( 2 0 1 6 ) 2 6 7 – 2 7 4
13–33, the HRTwasmaintained at 7 hr, and a stable conversionof ammonium to nitrite was achieved. The effluent NH4
+–Nconcentration decreased slightly from 13.1 to 7.1 mg/L and theaverage NO2
−–N concentration was 66 mg/L with the averageNAR of 94%. Fig. 3 shows the DO, FA and FNA concentrationsduring phases 1 to 3. In phase 1, the average DO concentrationwas 5.01 mg/L. The average FA and FNA concentrations were
0 10 20 30 400.0
0.4
0.8
1.2
1.6
0
1
2
3
4
5
6
7
8
9
10 Phase
FA (
mg/
L)
Phase 1
pHDO
DO
(m
g/L
)
Time
Fig. 3 – The DO, pH, free ammonia (FA) and free nitrous acid
0.05 and 0.10 mg/L. Fig. 4 shows the sludge activity of differentphases in batch tests. In phase 1 (day 33), the aerobic NH4
+–Nand NO2
−–N oxidation activities of the sludge were 0.366 and0.005 g N/(g VSS · day), respectively.
Fast-growing organisms were located towards to theouter part of the biofilm, and AOB grew significantly fasterthan NOB at temperatures above 25°C (Hellinga et al., 1998;
50 60 70 800
1
2
3
4
5
6
7
8
9
10
0.00
0.05
0.10
0.15
0.20 2 Phase 3
FA
pH
FNA
(m
g/L
)
FNA
(day)
(FNA) concentrations observed during phase 1 to phase 3.

0.0
0.2
0.4
0.6
Phase 4 day 95
Phase 3 day 76
Phase 2 day 52
Phase 1day 33
0.531
0.106
0.366
0.035
0.316
0.005
0.246
0.0030.001
Slud
ge a
ctiv
ity (
g N
/(g
VSS
·day
))
Aerobic ammonium oxidation activity
0.135
Inoculated sludgeday 0
Type of sludge
Aerobic nitrite oxidation activity
Fig. 4 – The sludge activity of batch tests in differentoperational phases.
271J O U R N A L O F E N V I R O N M E N T A L S C I E N C E S 4 2 ( 2 0 1 6 ) 2 6 7 – 2 7 4
Brockmann and Morgenroth, 2010; Rikmann et al., 2012;Zekker et al., 2012a). In the present study, it was beneficialfor AOB to dominate on the surface of the biofilm sinceKaldnes rings were used as biomass carriers and thetemperature was controlled at 30°C.
It has been reported that the oxygen saturation coefficientsfor AOB and NOB were 0.3 and 1.1 mg/L, and that AOB andNOB have to compete for oxygen when oxygen is limiting(Wiesmann, 1994). So far, most research achieved partialnitrification under low DO concentrations (Blackburne et al.,2008a). In the present study, high NAR was achieved in phase1 with the average DO concentration at 5.01 mg/L (Fig. 3). Thebiofilm has been reported to greatly affect the oxygen masstransfer rate. Antileo et al. (2007) reported that the DOconcentration was reduced to 0 and 0.06 mg/L at 30 μm insidethe biofilm when the DO concentration in the liquid bulk was3.3 and 6.8 mg/L, respectively. Subsequently, Rathnayake etal. (2013) pointed out that at 2 mg/L of DO concentration in theliquid bulk, the DO concentration was reduced to 0 mg/L at100 μm inside the biofilm. As shown in Fig. 6, the thickness ofthe biofilm on the carriers was 1 mm. Therefore, the DOconcentration inside the biofilm might be at low values dueto oxygen transfer resistance. The growth of NOB in the innerparts of the biofilm would be largely inhibited. On the otherhand, it was pointed out that the maximum growth rate ofNOB was at 1.01 day (Wiesmann, 1994). The HRT was lessthan 24 hr in this phase, equal to the SRT of the floc sludge.Thus, the NOB in floc sludge would be washed out underhigh DO.
Researchers found that certain concentrations of FA andFNA could inhibit NOB. Anthonisen et al. (1976) reported thatthe threshold FA concentration for NOB inhibition wasbetween 0.1 and 1 mg/L. Similarly, Park and Bae (2009)pointed out that the threshold FA concentration for NOBinhibition was 0.7 mg/L, while the activity of NOB wasinhibited by 50% at FNA concentrations between 0.02 and0.1 mg/L. Vadivelu et al. (2007) also found that the biosyn-thesis of Nitrobacter was totally stopped at the FNA concen-tration of 0.023 mg/L. As a result, the FA levels were belowthe inhibition values for NOB, and the FNA might play a rolein the inhibition of NOB.
2.2. Effect of low NH4+–N concentration on the robustness of
nitritation
In phase 2, in order to investigate the robustness of nitritationat low NH4
+–N concentration, the HRT was controlled at 7 hr(days 34–52). Unexpectedly, nitritation was totally destroyedduring this phase. As Fig. 3 shows, the average DO concen-tration was 4.09 mg/L, while the average FA and FNAconcentrations were 0.03 and 0.02 mg/L. The average FA andFNA concentrations were below the threshold of NOB inhibi-tion. The effluent NH4
+–N concentration was below 7 mg/L(Fig. 2a). As a result, the effluent NO2
−–N concentrationdecreased from 56.6 to 0.42 mg/L, while the effluent NO3
−–Nconcentration increased from 9.2 to 68.8 mg/L (Fig. 2b).Meanwhile, the NAR decreased from 95.0% to 0.62%. Theaerobic NH4
+–N and NO2−–N oxidation activities of the sludge in
phase 2 (day 52) were 0.316 and 0.035 g N/(g VSS · day),respectively (Fig. 4).
The aerobic NH4+–N oxidation activity of sludge in phase 2
decreased by 13.7% compared to that of phase 1. This resultindicated that the sludge activity of AOB was limited in thisphase. Im et al. (2014) reported that the AOB concentrationplayed an important role in the accumulation of nitrite.Previous studies reported that the ammonium affinity con-stant was below 1 mg/L (Wyffels et al., 2004; Van Hulle et al.,2007). Due to the substrate mass transfer resistance, theammonium in the inner part of the biofilm might be far lessthan 1 mg/L when the NH4
+–N concentration was below 7 mg/Lin the reactor. As a result, the AOB activity would be limitedinside the biofilm, and the consumption of DO on the surfaceof the biofilm would decrease. Hence, the NOB on thebiofilm might be able to gain enough DO for the oxidation ofnitrite. Additionally, Fux et al. (2004) reported that NOB couldaccumulate after 11 months of stable nitritation in the MBBR.Similar results were reported, since the biofilm improved theretention of slow growth bacteria (Blackburne et al., 2008b;Brockmann and Morgenroth, 2010).
2.3. Effect of improving NH4+–N concentration on the recovery
of nitritation
In order to investigate the effect of improving NH4+–N con-
centration on the recoverability of nitritation, the HRT wasshortened to 4.6 hr in phase 3 (days 53–76). As Fig. 3 shows,the average DO concentration was 3.8 mg/L, while the averageFA and FNA concentrations were 0.79 and 0.005 mg/L. Theeffluent NH4
+–N concentration maintained at 20–35 mg/L(Fig. 2a). However, NO3
−–N still dominated in the effluent. Theeffluent NO2
−–N concentration was below 5 mg/L while theeffluent NO3
−–N concentration was above 30 mg/L (Fig. 2b). Theaerobic NH4
+–N and NO2−–N oxidation activities of the sludge in
phase 3 (day 76) were 0.246 and 0.106 g N/(g VSS · day),respectively (Fig. 4). The aerobic NH4
+–N oxidation activity ofsludge in phase 3 decreased by 22.2% compared to that ofphase 2. The reason for this was related to the lower HRT inphase 3. With a shorter HRT, the NH4
+–N concentration wasimproved, which was beneficial for the increase of aerobicNH4
+–N oxidation activity. However, a large amount of AOBwould be washed out, resulting in the decrease of aerobicNH4
+–N oxidation activity. As for the NOB, the aerobic NO2−–N

0
20
40
60
80
6.4
6.6
6.8
7.0
7.2
7.4
0 30 60 90 120 150 1800
1
2
3
4
5
6
7
NO3--N
Nitr
ogen
con
cent
ratio
n (m
g/L
)
pH
NO2
--NNH4+-N
pH DO
DO
(m
g/L
)
Time (day)0 30 60 90 120 150 180
0.0
0.4
0.8
1.2
0.00
0.03
0.06
0.09
0.12
0.15
FNA
(m
g/L
)
FA
Time (min)
FA (
mg/
L)
ba FNA
Fig. 5 – Measurements obtained during one cycle of operation: (a) evolution of nitrogen compounds; (b) FA and FNAconcentrations.
1 cm
95 day
Fig. 6 – The photo of Kaldnes ring on day 95.
272 J O U R N A L O F E N V I R O N M E N T A L S C I E N C E S 4 2 ( 2 0 1 6 ) 2 6 7 – 2 7 4
oxidation activity of the sludge in phase 3 was 2 times higherthan that of phase 2. A large amount of NOB would also bewashed out, resulting in the decrease of the aerobic NO2
−–Noxidation activity. Nevertheless, as the aerobic NH4
+–N oxida-tion activity of sludge decreased, the NOB on the biofilmmight show stronger competitive advantage in terms of DO.Therefore, the sludge activity of NOB in phase 3 was strongerthan that of phase 2.
In phase 3, the FA concentrations were in the range ofinhibition values for NOB, while the FNA concentrations werebelow the inhibition level. However, nitratation was notinhibited at the average FA concentration of 0.79 mg/L.Previous studies reported that the acclimation phenomenontook place after NOB were exposed to high FA for long periodsof time. Fux et al. (2004) pointed out that NOB were notinhibited at high FA concentrations between 20 and 25 mg/Lafter a long time of acclimation. Afterwards, Villaverde et al.(2000) also reported that the threshold of specific FA inhibitionon NOB increased from 0.2 to 0.7 mg NH3–N/g VSS after fourmore months of operation. Thus, high FA acclimation of NOBmight contribute to the high aerobic NO2
−–N oxidation activityin this phase.
2.4. Effect of sequencing batch feed mode on the recovery ofnitritation
In phase 4, the biofilm reactor was operated in sequencingbatch feed mode to recover nitritation (days 77–95). As aresult, the biofilm reactor recovered nitritation performancerapidly. The NH4
+–N conversion rate gradually increased andthe effluent NH4
+–N concentration decreased to 7.4 mg/L onday 95 (Fig. 2a). As observed in Fig. 2b, the effluent NO2
−–Nconcentration increased from 33.7 to 63.5 mg/L during days77–82 and then stabilized at 64 mg/L. The effluent NO3
−–Nconcentration was below 6 mg/L in this period. From day 77on, the NAR reached 97% and remained at 95% in thefollowing days. The aerobic NH4
+–N and NO2−–N oxidation
activities of the sludge in phase 4 (day 95) were 0.531 and0.003 g N/(g VSS · day), respectively (Fig. 4). As the reactor wasoperated with a short settling time and a high VER, the MLSSwas constant at about 1000 mg/L. The suspended sludge inthe reactor mainly consisted of the detached sludge from thebiofilm. A certain amount of floc sludge was withdrawn from
the reactor with the effluent. This was beneficial for the rapidwashout of NOB from the reactor.
Fig. 5 shows the performance of the SBR during one cycleon day 95. The aeration was supplied at t = 0 min after theinfluent was completely fed into the reactor. During 0–190 min, the NH4
+–N concentration decreased from 62.3 to7.4 mg/L, while the NO2
−–N concentration increased from 17.1to 67.1 mg/L with the NO3
−–N concentration below 4.2 mg/L.The NH4
+–N removal efficiency and NAR were 88.1% and 94.1%in the effluent. The DO concentration was above 3.35 mg/Lfrom 3 to 190 min. During 0–190 min, the FA concentrationgradually reduced from 1.03 to 0.03 mg/L and the FNAconcentration increased from 0.006 to 0.119 mg/L, respective-ly. That is, the FA concentration was above 0.22 mg/L during0–90 min while the FNA concentration was above 0.03 mg/Lduring 90–180 min.
Nitritation recovered rapidly in phase 4. As observed inFig. 5, the FA during 0–90 min and the FNA during 90–180 minwere in the range of inhibition values for NOB. The phenom-enon of FNA following the disappearance of FA in inhibitingthe NOB activity has been reported by other researchers underdifferent operational conditions (Liu et al., 2008; Wei et al.,2014). Additionally, the aerobic NH4
+–N oxidation activity ofthe sludge in phase 4 was 1.1 times higher than that of phase3. The reason for this higher activity was related to the

Phase 133 day
Phase 376 day
Fig. 7 – The scanning electron microscope (SEM) images of sludge during operation.
273J O U R N A L O F E N V I R O N M E N T A L S C I E N C E S 4 2 ( 2 0 1 6 ) 2 6 7 – 2 7 4
excellent retention performance of sludge in SBR runningmode. As a result, the DO would be reduced inside the biofilmdue to the greater consumption of DO on the surface. It wasbeneficial for the AOB to outcompete NOB. Previous studiesreported that the alternating aeration strategy was consideredto be effective in achieving nitritation (Kornaros et al., 2010; Geet al., 2014). In the present study, as observed in Fig. 5, theaeration was stopped during the filling and drainage period,for 16 min, and the aeration time in one cycle was 177 min.The DO concentration was above 3.35 mg/L from 3–190 min.Therefore, it was long enough for the NOB to recover activityafter anoxic conditions. The anoxic period in sequencingbatch feed mode might have had a limited effect on theinhibition of NOB in this phase. Since studies have reportedthat NOB could accumulate after a long time of stablenitritation in the biofilm reactor (Fux et al., 2004; Blackburneet al., 2008b; Brockmann and Morgenroth, 2010), the stabilityof nitritation in SBR still needs further investigation.
2.5. Morphology observation
A photo of the ring-shaped carriers is shown in Fig. 6. There wasan obvious increase in the thickness of the biofilm after 95 dayoperation. Recently, Gilbert et al. (2014) achieved nitritationunder low DO (0.1–0.5 mg/L) for low-strength wastewater in abiofilm reactor with Kaldnes rings as carriers. Themorphology ofthe sludge in different phases was observed by a SEM (Fig. 7). Itcan be seen that spherical bacteria dominated in phase 3, whileshort rod-shaped bacteria dominated in phases 1 and 4. Severalstudies reported that the morphology of the dominant bacteriawas mainly short rod-shaped in the nitritation phase (Guo et al.,2009; Shen et al., 2014). However, Xu et al. (2012) found thatthe dominant bacteria in nitrifying granules were mainly cocciand bacilli. It was difficult to identify these clusters of bacteria bySEM viewing alone. Therefore, FISH analysis and quantitativereal-time polymerase chain reaction (qPCR) should be performedfor further study.
3. Conclusions
The nitritation performance in treating domestic wastewaterwas studied under high DO conditions in a biofilm reactor.The recovery performance of nitritation was also studied. The
biofilm reactor achieved excellent nitritation performance,with the HRT reducing from 24 to 7 hr within 33 days. The factthat faster-growing organisms were expected to be dominanton the surface of the biofim and themass transfer effect of DOin the biofilm played important roles in the good nitritationperformance in phase 1. Nitritation was destroyed when theNH4
+–N concentration was below 7 mg/L. The high DOconcentration combined with the reduced AOB activityunder low ammonium concentration led to the damage ofnitritation. The improvement of the NH4
+–N concentration to20–35 mg/L had a limited effect on the recovery of nitritation.However, nitritation recovered rapidly after changing thecontinuous feed mode to sequencing batch feed mode. Theimprovement of AOB activity and the combined inhibitioneffect of FA and FNA on the NOB were two key factors on thefast recovery of nitritation.
Acknowledgments
This work is funded by the National Water PollutionControl and Management Technology Major Projects (No.2014ZX 07201-011), the Beijing Natural Science Foundation(No. 8122005) of China, and the Beijing Municipal EducationCommission General Program (No. KM2012-10005028). Wewould like to give our sincere thanks to the peer-reviews fortheir suggestions and discussions.
Appendix A. Supplementary data
Supplementary data to this article can be found online athttp://dx.doi.org/10.1016/j.jes.2015.09.006.
R E F E R E N C E S
Anthonisen, A.C., Loehr, R.C., Prakasam, T., Srinath, E.G., 1976.Inhibition of nitrification by ammonia and nitrous-acid.J. Water Pollut. Control Fed. 48 (5), 835–852.
Antileo, C., Roeckel, M., Lindemann, J., Wiesmann, U., 2007.Operating parameters for high nitrite accumulation duringnitrification in a rotating biological nitrifying contactor. WaterEnviron. Res. 79 (9), 1006–1014.

274 J O U R N A L O F E N V I R O N M E N T A L S C I E N C E S 4 2 ( 2 0 1 6 ) 2 6 7 – 2 7 4
APHA, 1998. Standard Methods for the Examination of Water andWastewater. American Public Health Association,Washington. D.C, USA.
Bernet, N., Dangcong, P., Delgenes, J.P., Moletta, R., 2001.Nitrification at low oxygen concentration in biofilm reactor.J. Environ. Eng. ASCE 127 (3), 266–271.
Bi, Z., Qiao, S., Zhou, J., Tang, X., Cheng, Y., 2014. Inhibition andrecovery of Anammox biomass subjected to short-termexposure of Cd, Ag, Hg and Pb. Chem. Eng. J. 244 (0), 89–96.
Blackburne, R., Yuan, Z.G., Keller, J., 2008a. Partial nitrification tonitrite using low dissolved oxygen concentration as the mainselection factor. Biodegradation 19 (2), 303–312.
Blackburne, R., Yuan, Z.Q., Keller, J., 2008b. Demonstration ofnitrogen removal via nitrite in a sequencing batch reactortreating domestic wastewater. Water Res. 42 (8-9), 2166–2176.
Brockmann, D., Morgenroth, E., 2010. Evaluating operatingconditions for outcompeting nitrite oxidizers and maintainingpartial nitrification in biofilm systems using biofilm modelingand Monte Carlo filtering. Water Res. 44 (6), 1995–2009.
Fux, C., Huang, D., Monti, A., Siegrist, H., 2004. Difficulties inmaintaining long-term partial nitritation of ammonium-richsludge digester liquids in amoving-bed biofilm reactor (MBBR).Water Sci. Technol. 49 (11-12), 53–60.
Ge, S., Peng, Y., Qiu, S., Zhu, A., Ren, N., 2014. Complete nitrogenremoval from municipal wastewater via partial nitrification byappropriately alternating anoxic/aerobic conditions in acontinuous plug-flow step feed process. Water Res. 55, 95–105.
Gilbert, E.M., Agrawal, S., Karst, S.M., Horn, H., Nielsen, P.H.,Lackner, S., 2014. Low temperature partial nitritation/anammoxin a moving bed biofilm reactor treating low strengthwastewater. Environ. Sci. Technol. 48 (15SI), 8784–8792.
Guo, J., Peng, Y.Z., Wang, S.Y., Zheng, Y.A., Huang, H.J., Wang,Z.W., 2009. Long-term effect of dissolved oxygen on partialnitrification performance and microbial community structure.Bioresour. Technol. 100 (11), 2796–2802.
Gut, L., Plaza, E., Trela, J., Hultman, B., Bosander, J., 2006.Combined partial nitritation/anammox system for treatmentof digester supernatant. Water Sci. Technol. 53 (12), 149–159.
Hellinga, C., Schellen, A., Mulder, J.W., van Loosdrecht, M.,Heijnen, J.J., 1998. The SHARON process: an innovative methodfor nitrogen removal from ammonium-rich waste water.Water Sci. Technol. 37 (9), 135–142.
Im, J., Jung, J., Bae, H., Kim, D., Gil, K., 2014. Correlation betweennitrite accumulation and the concentration of AOB in anitritation reactor. Environ. Earth Sci. 72 (1), 289–297.
Jin, R., Zhang, Q., Yang, G., Xing, B., Ji, Y., Chen, H., 2013. Evaluatingthe recovery performance of the ANAMMOX process followinginhibition by phenol and sulfide. Bioresour. Technol. 142 (0),162–170.
Kornaros, M., Dokianakis, S.N., Lyberatos, G., 2010. Partialnitrification/denitrification can be attributed to the slowresponse of nitrite oxidizing bacteria to periodic anoxicdisturbances. Environ. Sci. Technol. 44 (19SI), 7245–7253.
Lackner, S., Gilbert, E.M., Vlaeminck, S.E., Joss, A., Horn, H., vanLoosdrecht, M.C.M., 2014. Full-scale partial nitritation/anammox experiences—an application survey. Water Res. 55(0), 292–303.
Liang, Z., Liu, H., 2007. Control factors of partial nitritation for landfillleachate treatment. J. Environ. Sci. (China) 19 (5), 523–529.
Liu, Y., Wu, W., Tay, J., Wang, H., 2008. Formation and long-termstability of nitrifying granules in a sequencing batch reactor.Bioresour. Technol. 99 (9), 3919–3922.
Park, S., Bae, W., 2009. Modeling kinetics of ammonium oxidationand nitrite oxidation under simultaneous inhibition by freeammonia and free nitrous acid. Process Biochem. 44 (6), 631–640.
Rathnayake, R.M.L.D., Song, Y., Tumendelger, A., Oshiki, M., Ishii, S.,Satoh, H., Toyoda, S., Yoshida, N., Okabe, S., 2013. Sourceidentification of nitrous oxide on autotrophic partial nitrificationin a granular sludge reactor. Water Res. 47 (19), 7078–7086.
Rikmann, E., Zekker, I., Kroon, K., Saluste, A., Vabamae, P., Tenno,T., Menert, A., Loorits, L., Tenno, T., 2012. Sulfate-reducing andnitrite-dependent anammox for ammonium removal.Commun. Agric. Appl. Biol. Sci. 77 (1), 227–230.
Shen, L., Yao, Y., Meng, F., 2014. Reactor performance andmicrobial ecology of a nitritation membrane bioreactor.J. Membr. Sci. 462 (0), 139–146.
Tokutomi, T., 2004. Operation of a nitrite-type airlift reactor at lowDO concentration. Water Sci. Technol. 49 (5-6), 81–88.
Vadivelu, V.M., Keller, J., Yuan, Z., 2007. Free ammonia and freenitrous acid inhibition on the anabolic and catabolic processesof Nitrosomonas and Nitrobacter. Water Sci. Technol. 56 (7),89–97.
Van Hulle, S., Volcke, E., Teruel, J.L., Donckels, B., van Loosdrecht,M., Vanrolleghem, P.A., 2007. Influence of temperature and pHon the kinetics of the Sharon nitritation process. J. Chem.Technol. Biotechnol. 82 (5), 471–480.
Villaverde, S., Fdz-Polanco, F., Garcia, P.A., 2000. Nitrifying biofilmacclimation to free ammonia in submerged biofilters. Start-upinfluence. Water Res. 34 (2), 602–610.
Villaverde, S., GarciaEncina, P.A., FdzPolanco, F., 1997. Influence ofpH over nitrifying biofilm activity in submerged biofilters.Water Res. 31 (5), 1180–1186.
Wei, D., Du, B., Xue, X.D., Dai, P., Zhang, J., 2014. Analysis of factorsaffecting the performance of partial nitrification in asequencing batch reactor. Appl. Microbiol. Biotechnol. 98 (4),1863–1870.
Wiesmann, U., 1994. Biological nitrogen removal fromwastewater. Adv. Biochem. Eng. Biotechnol. 51, 113–154.
Wyffels, S., Van Hulle, S., Boeckx, P., Volcke, E., Van Cleemput, O.,Vanrolleghem,P.A., Verstraete,W., 2004.Modelingandsimulationof oxygen-limited partial nitritation in a membrane-assistedbioreactor (MBR). Biotechnol. Bioeng. 86 (5), 531–542.
Xu, G.J., Xu, X.C., Yang, F.L., Liu, S.T., Gao, Y., 2012. Partialnitrification adjusted by hydroxylamine in aerobic granulesunder high DO and ambient temperature and subsequentanammox for low C/N wastewater treatment. Chem. Eng. J.213, 338–345.
Yin, J., Xu, H.J., Shen, D.S., 2014. Partial nitrification in sequencingbatch reactors treating low ammonia strength syntheticwastewater. Water Environ. Res. 86 (7), 606–614.
Zekker, I., Rikmann, E., Tenno, T., Vabamae, P., Kroon, K., Loorits,L., Saluste, A., Tenno, T., 2012a. Effect of HCO3
− concentrationon anammox nitrogen removal rate in a moving bed biofilmreactor. Environ. Technol. 33 (20), 2263–2271.
Zekker, I., Rikmann, E., Tenno, T., Vabamae, P., Tomingas, M.,Menert, A., Loorits, L., Tenno, T., 2012b. Anammox bacteriaenrichment and phylogenic analysis in moving bed biofilmreactors. Environ. Eng. Sci. 29 (10), 946–950.
Zekker, I., Rikmann, E., Tenno, T., Kroon, K., Vabamae, P., Salo, E.,Loorits, L., Rubin, S., Vlaeminck, S.E., Tenno, T., 2013.Deammonification process start-up after enrichment ofanammox microorganisms from reject water in a moving-bedbiofilm reactor. Environ. Technol. 34 (23), 3095–3101.
Zekker, I., Rikmann, E., Tenno, T., Seiman, A., Loorits, L., Kroon, K.,Tomingas, M., Vabamae, P., Tenno, T., 2014. Nitritating-anammoxbiomass tolerant to high dissolved oxygen concentration and C/Nratio in treatment of yeast factory wastewater. Environ. Technol.35 (12), 1565–1576.
Zekker, I., Rikmann, E., Tenno, T., Kroon, K., Seiman, A., Loorits, L.,Fritze, H., Tuomivirta, T., Vabamae, P., Raudkivi, M., Mandel,A., Tenno, T., 2015a. Start-up of low-temperature anammox inUASB from mesophilic yeast factory anaerobic tank inoculum.Environ. Technol. 36 (2), 214–225.
Zekker, I., Rikmann, E., Tenno, T., Loorits, L., Kroon, K., Fritze, H.,Tuomivirta, T., Vabamae, P., Raudkivi, M., Mandel, A., DcRubin, S.S.C., Tenno, T., 2015b. Nitric oxide for anammoxrecovery in a nitrite-inhibited deammonification system.Environ. Technol. 36 (19), 2477–2487.
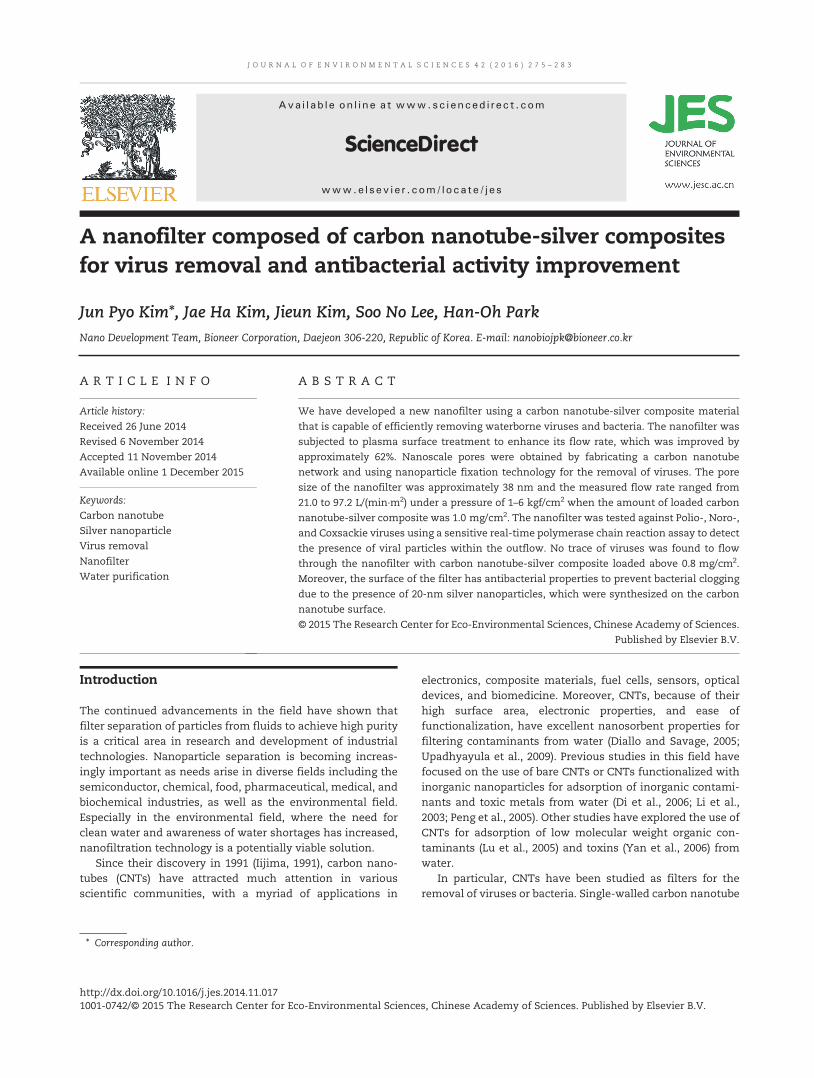
J O U R N A L O F E N V I R O N M E N T A L S C I E N C E S 4 2 ( 2 0 1 6 ) 2 7 5 – 2 8 3
Ava i l ab l e on l i ne a t www.sc i enced i r ec t . com
ScienceDirect
www.e l sev i e r . com/ loca te / j es
A nanofilter composed of carbon nanotube-silver compositesfor virus removal and antibacterial activity improvement
Jun Pyo Kim⁎, Jae Ha Kim, Jieun Kim, Soo No Lee, Han-Oh ParkNano Development Team, Bioneer Corporation, Daejeon 306-220, Republic of Korea. E-mail: [email protected]
A R T I C L E I N F O
⁎ Corresponding author.
http://dx.doi.org/10.1016/j.jes.2014.11.0171001-0742/© 2015 The Research Center for Ec
A B S T R A C T
Article history:Received 26 June 2014Revised 6 November 2014Accepted 11 November 2014Available online 1 December 2015
We have developed a new nanofilter using a carbon nanotube-silver composite materialthat is capable of efficiently removing waterborne viruses and bacteria. The nanofilter wassubjected to plasma surface treatment to enhance its flow rate, which was improved byapproximately 62%. Nanoscale pores were obtained by fabricating a carbon nanotubenetwork and using nanoparticle fixation technology for the removal of viruses. The poresize of the nanofilter was approximately 38 nm and the measured flow rate ranged from21.0 to 97.2 L/(min·m2) under a pressure of 1–6 kgf/cm2 when the amount of loaded carbonnanotube-silver composite was 1.0 mg/cm2. The nanofilter was tested against Polio-, Noro-,and Coxsackie viruses using a sensitive real-time polymerase chain reaction assay to detectthe presence of viral particles within the outflow. No trace of viruses was found to flowthrough the nanofilter with carbon nanotube-silver composite loaded above 0.8 mg/cm2.Moreover, the surface of the filter has antibacterial properties to prevent bacterial cloggingdue to the presence of 20-nm silver nanoparticles, which were synthesized on the carbonnanotube surface.© 2015 The Research Center for Eco-Environmental Sciences, Chinese Academy of Sciences.
Published by Elsevier B.V.
Keywords:Carbon nanotubeSilver nanoparticleVirus removalNanofilterWater purification
Introduction
The continued advancements in the field have shown thatfilter separation of particles from fluids to achieve high purityis a critical area in research and development of industrialtechnologies. Nanoparticle separation is becoming increas-ingly important as needs arise in diverse fields including thesemiconductor, chemical, food, pharmaceutical, medical, andbiochemical industries, as well as the environmental field.Especially in the environmental field, where the need forclean water and awareness of water shortages has increased,nanofiltration technology is a potentially viable solution.
Since their discovery in 1991 (Iijima, 1991), carbon nano-tubes (CNTs) have attracted much attention in variousscientific communities, with a myriad of applications in
o-Environmental Science
electronics, composite materials, fuel cells, sensors, opticaldevices, and biomedicine. Moreover, CNTs, because of theirhigh surface area, electronic properties, and ease offunctionalization, have excellent nanosorbent properties forfiltering contaminants from water (Diallo and Savage, 2005;Upadhyayula et al., 2009). Previous studies in this field havefocused on the use of bare CNTs or CNTs functionalized withinorganic nanoparticles for adsorption of inorganic contami-nants and toxic metals from water (Di et al., 2006; Li et al.,2003; Peng et al., 2005). Other studies have explored the use ofCNTs for adsorption of low molecular weight organic con-taminants (Lu et al., 2005) and toxins (Yan et al., 2006) fromwater.
In particular, CNTs have been studied as filters for theremoval of viruses or bacteria. Single-walled carbon nanotube
s, Chinese Academy of Sciences. Published by Elsevier B.V.

276 J O U R N A L O F E N V I R O N M E N T A L S C I E N C E S 4 2 ( 2 0 1 6 ) 2 7 5 – 2 8 3
(SWCNT) filters have shown high bacterial retention(Brady-Estévez et al., 2008), andmulti-walled carbon nanotube(MWCNT) filters have high viral removal efficiency at lowpressure (Brady-Estévez et al., 2010a), both through theeffects of size exclusion. Moreover, a SWCNT-MWCNThybrid filter achieved efficient bacterial inactivation andviral retention at low pressure (Brady-Estévez et al., 2010b).The application of an external electric field markedlyenhanced the viral removal by the CNT filter, because ofthe increased viral particle transport (Rahaman et al., 2012).Furthermore, in order to enhance the antibacterial ability ofthe CNT filter, vertically aligned MWCNT arrays were combinedwith silver nanoparticles (Akhavan et al., 2011), and CNT/cottonmembrane was combined with silver nanowires (Schoen et al.,2010). A recent study demonstrated scalable applications of thistechnology that use low-cost and widely available CNTs forinactivation of microbes (Kang et al., 2008a,b, 2009). For viralremoval by CNT-hybrid filters, filtration performance was alsotested under various solution chemistries (Brady-Estévez et al.,2010c). These CNT-based filters remove the micrometer-sizedbacterial cells through a sieving mechanism, whereas depth(physicochemical) filtration governs the adsorption of nano-scale viruses throughout the thickness of the matrix.
In this study, we describe a novel, highly permeable,MWCNT-silver (Ag) nanofilter and demonstrate its use forthe effective removal of bacterial and viral pathogens fromwater at low pressure. Although previous studies haveprovided a proof-of-concept for viral removal by filters ofvarious forms using CNTs, a CNT-Ag nanofilter in which Agnanoparticles are synthesized on the CNT surface has notbeen reported. This filter was fabricated by utilizing thefollowing key properties of CNTs and Ag nanoparticles: (1)the small diameter and high surface area of CNTs; (2) thetendency of CNTs to aggregate and form highly porousstructures; (3) the low melting point of Ag nanoparticles;and (4) the antibacterial activity of Ag nanoparticles.We demonstrated that bacteria were completely retainedon the CNT-Ag nanofilter and were effectively inactivatedupon contact with Ag on the MWCNT. We also showed thatviruses could be completely removed by a depth-filtrationmechanism, that is, capture by nanotube bundles inside theCNT-Ag layer.
1. Materials and methods
1.1. Materials
MWCNTs were provided by Hanwah Nanotech (CM-95 grade)in South Korea. Polyvinylpyrrolidone (PVP) was purchasedfrom Fluka (Mw: 40,000). Ethylene glycol, sodium dodecylsulfate (SDS), oleylamine, silver nitrate (AgNO3), ethyl acetate,and hexane were purchased from Sigma-Aldrich. Poliovirus 1(ATCC No. VR-1562), Coxsackie type A9 virus (coxA9 virus,ATCC No. VR-186), and Norovirus GI RNA (ATCC No. VR-3199)were purchased from the American Tissue Culture Collection(ATCC). Staphylococcus aureus (KCTC 1928) and Escherichia coli(KCTC 1039) were purchased from the Korean Collection forType Culture (KCTC).
1.2. Preparation of the CNT-Ag composite
Thin MWCNTs (0.3 g) were loaded into a 500-mL round flaskreactor, to which 280 mL of ethylene glycol was added,followed by stirring for 30 min. Ethylene glycol acts as aweak reductant that slows down the growth of the Ag nuclei.(Ducamp-Sanguesa et al., 1993). Subsequently, the reactor wasplaced in an ultrasonic cleaner, followed by dispersion of thecarbon nanotubes in ethylene glycol for 3 hr using ultrasonicwaves at a temperature of under 50°C. Post-ultrasonication, astirrer was attached to the reactor and a thermometer andcondenser, for cooling, were connected. While stirring thereactor, 1.68 g of PVP and 5.6 mL of oleylamine, to which1.102 g of AgNO3 was added in a stepwise manner, wereadded. A vacuum pump was connected to replace air in thereactor with nitrogen. While the nitrogen was continuouslysupplied, nitrogen was forced to circulate within the reactor toprevent oxygen inflow. A mantle was attached to the bottomof the flask and the temperature of the reactor was raised to200°C for 40 min, followed by reduction for 1 hr. Thetemperature of the reactor was lowered slowly to roomtemperature for 3 hr upon completion of reduction. Thegenerated CNT-Ag composites were filtered with a filterpaper, followed by washing with ethyl acetate and hexaneseveral times (Cha et al., 2005; Kim et al., 2007, 2008).
1.3. CNT-Ag nanofilter preparation
The generated CNT-Ag was uniformly coated on a glass fiber(GF) membrane with a pore size of 0.7 μm (Whatman, USA) byusing a sonication/filtration procedure. Specified quantities ofCNT-Ag (0.03–0.15 g) were suspended in 500 mL of deionizedwater containing 0.5 g of SDS. The suspension was sonicatedfor 1 hr, and then vacuum-filtered through a GF membrane toachieve the various loadings of CNT-Ag on the base filters.Ethanol (100 mL) followed by 500 mL of deionized water werepassed through the CNT-Ag nanofilter to remove residual SDSand ethanol. Then, the fabricated CNT-Ag nanofilter wasdried in an oven for 12 hr at 60°C. Finally, the CNT-Agnanofilter was heat-treated for 10 min at 250°C.
1.4. Characterization of CNT-Ag composite and nanofilter
A field-emission transmission electron microscope (FE-TEM,JEOL, JEM-2010, Japan) at an acceleration voltage of 200 kVwasused to investigate the size and distribution of the silver onthe CNT surface. TEM specimens were prepared by placing afew drops of sample solutions on a carbon grid. Thecrystalline structures of the synthesized CNT-Ag nanocom-posite were investigated using an X-ray diffractometer (XRD).Lyophilized and powdered samples were used, and thediffraction patterns were recorded in the scanning mode onan X'pert Pro diffractometer (PANalytical, Almelo, the Neth-erlands) operated at 40 kV and with a current of 30 mA, withCu/kα radiation (λ = 1.5418 Å) in the range of 20°–80° 2θ.
The surface morphology of the CNT-Ag nanofilter wasstudied using field emission scanning electron microscopy(FE-SEM, S-4300SE, Hitachi, Japan). Wettability measurementswere performed using a Video-Based Optical Contact AngleMeter (Dataphysics, OCA15EC). Distilled water was used as the

277J O U R N A L O F E N V I R O N M E N T A L S C I E N C E S 4 2 ( 2 0 1 6 ) 2 7 5 – 2 8 3
liquid for the static water contact angle measurement. Thesurface chemical compositions of plasma-treated and un-treated CNT-Ag filters were analyzed using an X-ray photo-electron spectroscopy system (XPS, Thermo ESCALAB 250)equipped with a Mg Kα X-ray source with pass energy of1253.6 eV. The analysis was carried out under 10−9–10−10 Torrwith power of 300 W. Photo-emitted electrons were collectedat a take-off angle of 45° and the deconvolution analysis ofC1s peaks was carried out using XPS Peak software. Toanalyze the pore size, CNT-Ag–coated glass filters (CNTloading amounts: 0.8, 1.0 mg/cm2) were tested. The pore sizeof the CNT-Ag coated on the glass filter was analyzed using acapillary flow porometer after drying at 75°C for 24 hr. Poresize analysis was performed by a third party at Korea Instituteof Industrial Technology and the test conditions are shown inTable 1. The filtration system consisted of a 47-mm diameterstainless steel holder (Bioneer Corp.) to support the mem-branes and a pressurized tank system. The flow rate of theprepared CNT-Ag nanofilters was evaluated by measurementof water volume per minute through the filter holder atdifferent pressures. Differential thermal analysis (DTA) wasperformed for the heat analysis of Ag nanoparticles in a TAinstrument (SDT 2960) with a heating rate of 10°C/min from50°C to 250°C in a nitrogen atmosphere with a gas flux of200 mL/min.
1.5. Plasma treatment
To modify the surface of the CNT-Ag nanofilter,atmospheric-pressure plasma surface treatment was employedusing an ATMOS Multi boiler (PLASMART Ltd., South Korea). Thegas used in the plasma treatment was Ar (99.999% purity), whichwas introduced into the chamber at a flow rate of 5 L/min.The plasma treatment power was maintained at 100 W at afrequency of 13.56 MHz. The fabricated CNT-Ag nanofiltersample was moved on a translation stage through the plasmajet at a speed of 0.5 cm/sec for a single treatment. The plasmatreatment was performed five times for 2 min at room temper-ature and atmospheric pressure (Liu et al., 2013).
1.6. Filtration and antibacterial activity test
The CNT-Ag nanofilters were tested for their ability to removevarious viruses and bacteria from water. For inactivation, thecoxA9 virus, Norovirus, and Poliovirus (each at a load of1.1 × 104 copies/mL) were suspended in 10 mL of deionizedwater and heat-treated at 100°C for 20 min. Inactive viruseswere filtered through the CNT-Ag nanofilter and the GF
Table 1 – Test conditions for pore size measurement.
Test condition
Testing M/C Automated capillary flow porometerModel CFP-1200AELProducing company Porous Materials Inc.Test method ASTM F 316Sample diameter 2.1 cmTest type Dry up/wet upFluid Porewick (surface tension: 16.0 dyn/cm)Test Pressure 0–160 psi
membrane (pore size = 0.7 μm; control). Filter efficiency wascalculated by counting the difference between the amount ofcontaminant concentration in the water before and after thefiltration. To evaluate bacteria removal, S. aureus and E. coliwere grown in brain heart infusion (BHI) liquid medium at37°C and harvested at mid-exponential growth phase. Cellswere rinsed and centrifuged twice (2000 rpm, 10 min), andthen diluted to a concentration of the 103 CFU/mL. Afterfiltration with the CNT-Ag nanofilter, cells were cultivated ona BHI agar plate for 24 hr at 37°C. To study the antibacterialactivity of the CNT-Ag nanofilter, S. aureus and E. coli cells(103 CFU/mL) were smeared on a BHI agar plate containing theCNT-Ag nanofilter. Then, the cells were incubated for 24 hr at37°C.
1.7. Virus quantification by real-time quantitative polymerasechain reaction
Extraction of virus ribonucleic acid (RNA) was performed usingthe Exiprep™ 16 Plus (Cat. No. A-5030, Bioneer Corp., SouthKorea) instrument and the Exiprep™ Viral RNA Extraction kit(Cat No. K-3535, Bioneer Corp., South Korea). The master mixwas prepared as follows: 45 μL of master mix was added toAccuPower®Enterovirus Real-Time reverse-transcription quan-titative polymerase chain reaction (Real-Time RT-qPCR) kitwells (Cat No. ENT-1111, Bioneer Corp., South Korea), and then5 μL of extracted viral RNA was added to the wells of theAccuPower®Enterovirus Real-Time RT-qPCR kit. A one-stepreal-time RT-qPCR assay was performed using the Exicycler™96 (Cat No. A-2060, Bioneer Corp., South Korea). The qPCRmixture was incubated 15 min at 45°C for complementarydeoxyribonucleic acid (cDNA) synthesis, followed by 5 min at95°C to activate DNA polymerase. Subsequently, 45 cyclesconsisting of a denaturation step for 5 sec at 95°C and combinedannealing-extension step for 20 sec at 55°C were performed.After the annealing-extension step, the amplification wasmonitored by quantitatively analyzing fluorescence emission.The probe for the internal positive control (IPC) was thecarboxytetramethylrhodamine dye, and all the wells were setwith the appropriate probes. The samples were placed in theExicycler™ 96 as indicated in the manufacturer's instructions.After the reaction was complete, the accompanying Exicycler™96 analysis program was used to analyze the results.
2. Results and discussion
2.1. Structural characterization of CNT-Ag powder
CNT-Ag composite powders were fabricated by a proprietary‘polyol process’ as mentioned in Section 1.2. A “polyol process”for the synthesis of metal nanoparticles been previouslyreported by many research groups (Ayyappan et al., 1996;Hinotsu et al., 2004; Cha et al., 2005; Kim et al., 2007, 2008). Itbasically involves the chemical reduction of a metallic com-pound by a liquid polyol, which also acts as solvent anddispersing agent, nucleation of metal atoms, and growth of themetallic nuclei. Fig. 1a shows FE-TEM images of the CNT-Agcomposite synthesized by our polyol process. Ag nanoparticleswith average diameters of about 20 nm are distributed on CNTs

20 40 60 80 100
0
2000
4000
6000
8000
#*
*
*
Inte
nsity
(C
PS)
2θ (degree)
XRD-CNT-Ag
*
**
* Ag# CNT
a
b
Fig. 1 – Characterization of CNT-Ag nanocomposites. (a)FE-TEM image of CNT-Ag. (b) XRD pattern of CNT-Agnanocomposites. CNT: carbon nanotube; FE-TEM:field-emission transmission electronmicroscope; XRD: X-raydiffractometer.
Temperature (°C)50 100 150 200 250
Hea
t flo
w (
µV/m
g)
-15
-10
-5
0
5
10
15
151.118
a
b
c
Fig. 2 – Structure of the nanofilter made from the CNT-Agpowder. (a) Image of CNT-Ag-coated glass filter (Ö47 mm). (b)DTA curves of the CNT-Ag composite at a heating rate of10°C/min. (c) SEM image of the CNT-Ag composite materialafter heat treatment at 250°C for 10 min. CNT: carbonnanotube; SEM: scanning electron microscopy.
0 1 2 3 4 5 6 7
Pressure (Kgf/cm2)
Flow
rat
e (L
/(m
in. m
2 ))
0
20
40
60
80
100
120
140Non-treatment
Treatment
Fig. 3 – Comparison of the flow rate through the CNT-Agnanofilter with and without surface plasma treatment. Thisexperiment was repeated in each condition by three times.CNT: carbon nanotube.
278 J O U R N A L O F E N V I R O N M E N T A L S C I E N C E S 4 2 ( 2 0 1 6 ) 2 7 5 – 2 8 3
with diameters of 10–40 nm. The CNT-Ag nanocomposites wereanalyzed by XRD as shown in Fig. 1b. The XRD pattern of theCNT-Ag nanocomposites showed peaks at 26°, 38°, 44°, 64°, 77°,and 81°. The diffraction peaks at 2θ of 38°, 44°, 64°, 77°, and 81°were readily indexed to (111), (200), (220), (311), and (222)reflections of silver metal crystals on both hybrid structures,respectively, representing the face-centered cubic (fcc) phase ofsilver. The peak at 26° with prominent peak counts showed thepresence of CNTs, being readily indexed to the (002) reflection ofCNTs (Park and Gong, 2012; Kim et al., 2012).
2.2. Structural characterization of the nanofilter made fromCNT-Ag powder
The filter was developed using a GF-based microporousmembrane (pore size = 0.7 μm) uniformly covered with athin layer of CNT-Ag. Fig. 2a presents a CNT-Ag nanofilterfabricated by deposition of 0.8-mg/cm2 CNT-Ag compositesonto the Ö47 GF membrane base of the filter. As illustrated inFig. 2b, the DTA heating curve for the CNT-Ag composite isshown. A change of the heat flow was observed at 151.1°C,which corresponds to the melting temperature (Tm) of the Agnanoparticles. Since the size of the metal was in thenanoscale, its melting point was at approximately 150°C.Accordingly, when heat treatment was performed at relativelylow temperatures, the silver nanoparticles melted and
generated a carbon nanostructure-silver metal compositewith a network structure. The carbon nanostructure-silvermetal composite and the membrane support were wellcombined (Fig. 2c).
2.3. Flow rate of the CNT-Ag nanofilter
To measure the flow rate of the CNT-Ag nanofilter, 0.8 mg/cm2
CNT-Ag powder was coated on a bare GF filter. The flow rate of

Time (day)0 1 2 3 4 5 6 7
Con
tact
ang
le (
°)
10
20
30
40
50
60
70
Fig. 5 – The stability of the functional groups on CNT-Ag filtersurface after plasma treatment. This experiment wasrepeated in each condition by three times. CNT: carbonnanotube.
279J O U R N A L O F E N V I R O N M E N T A L S C I E N C E S 4 2 ( 2 0 1 6 ) 2 7 5 – 2 8 3
the fabricated CNT-Ag nanofilter was measured at pressuresvarying from 1 to 6 kgf/cm2 after it was mounted on theÖ47-mm stainless steel holder of the filtration system. Asshown in Fig. 3, the flow rate of the fabricated CNT-Ag nanofilterincreased depending on the pressure. However, the flow rate ofan untreated CNT-filter was very low (72.4 L/(min·m2)) even athigh pressure (6 kgf/cm2) because the pore size of the fabricatedCNT-Ag nanofilter was in the nanoscale and the carbonnanotubes had highly hydrophobic surfaces (Liu et al., 2013).Thus, the flow of hydrophilic liquids such as water through thefilter is hindered. Although CNTs are hydrophobic in nature,they can be made hydrophilic via plasma treatment.
Fig. 4 shows contact angle measurements for the CNT-Agfilter surface (a) before and (b) after plasma treatment. In orderto determine to what extent the plasma treatment transformedhydrophobic surfaces to hydrophilic surfaces for the CNT-Agfilter, water contact angle tests were performed and the resultsare shown in Fig. 4. Water contact angles decreased from 131.6°for the control to 38.4° for the plasma-treated sample. Thisdemonstrates clear evidence of wettability change, which is dueto the presence of more hydrophilic groups induced by theplasma treatment. Fig. 5 shows changes in the stability of theCNT-Ag filter surface depending on time after plasma treat-ment. As shown, the CNT-Ag filter surface is very stable andmaintains a constant hydrophilic surface for 7 days afterplasma treatment.
To provide evidence of the presence of functional groupsafter plasma treatment, the CNT-Ag filter surface wasanalyzed by XPS. XPS analysis was conducted to identify thesurface chemical composition changes of the CNT-Ag filtersurface after plasma functionalization. The C1s spectra weredeconvoluted into two characteristic Gaussian peaks (Fig. 6a),including C–C (284.6 ± 0.2 eV, 65.75%), and C–O (285.8 ± 0.2 eV,23.14%) before plasma treatment. By contrast, Fig. 6b shows thatthe C1s spectra were deconvoluted into three characteristicGaussian peaks, including C–C (284.6 ± 0.2 eV, 40.41%), C–O–C(285.15 ± 0.2 eV, 40.86%), and COOH; O–C_O (288.0 ± 0.2 eV,4.94%) after plasma treatment. The C–O–C, COOH and O–C_Ogroups observed on the CNT-Ag filter surface likely resultedfrom plasma-induced oxidation. C–C and C–O ratios decreasedafter plasma treatment, while C–O–C, COOH and O–C_Oincreased.
To transform the hydrophobic CNT-Ag nanofilter into ahydrophilic surface, the CNT-Ag nanofilter was plasma
a
131.6
Fig. 4 – Contact angle measurement in CNT-Ag filter surface (a) b
treated as described in Section 1.5. After plasma treatment,the flow rate of the CNT-Ag nanofilter was increased up to116 L/(min·m2) at a pressure of 6 kgf/cm2, which representedan improvement of approximately 62% over the untreatedCNT-Ag nanofilter. Utilizing plasma treatment methods tomodify the surface of CNT can improve the wettability of theCNT-Ag nanofilter (Liu et al., 2013; Wang et al., 2013; Zhao etal., 2012). The plasma treatment is an efficient approach toimprove the flow rate of the CNT-Ag nanofilter due to theoxygen functionalization of the CNT surface. Therefore, ourCNT-Ag nanofilters were finally treated with plasma.
To fabricate a CNT-Ag nanofilter for virus removal, CNT-Agpowder at various concentrations (0, 0.2, 0.4, 0.6, 0.8, and1.0 mg/cm2) was coated on a bare GF filter. The water-filtrateflux of the fabricated CNT-Ag nanofilter was measured atdifferent pressures. Fig. 7 shows the water flow rate of variousCNT loading amounts. In all cases, the flow rates graduallyincreased with pressure. The control filter (i.e., GF filterwithout CNT-Ag coating) presented a maximum flow rate of188.4 L/(min·m2) at 6 kgf/cm2. The flow rate of the control atall pressure points was higher than that of the CNT-Ag-coatedGF filter, probably because of its larger pore size (0.7 μm). In
b
38.4
efore and (b) after plasma treatment. CNT: carbon nanotube.

Binding energy (eV)
Cou
nt (
s)
0
1000
2000
3000
4000
5000
6000
7000C-C C-O-C COOH ; O-C=O Background Peak sum
Binding energy (eV)280 282 284 286 288 290 292 294280 282 284 286 288 290 292 294
Cou
nt (
s)
0
1000
2000
3000
4000
5000
6000
7000C-CC-OBackgroundPeak sum
a b
Fig. 6 – XPS C1s spectrum of (a) untreated and (b) plasma-treated on CNT-Ag filter surface. CNT: carbon nanotube; XPS: X-rayphotoelectron spectroscopy.
1.0
1.2
280 J O U R N A L O F E N V I R O N M E N T A L S C I E N C E S 4 2 ( 2 0 1 6 ) 2 7 5 – 2 8 3
contrast, the GF filter with 1.0 mg/cm2 CNT-Ag coated on thesurface, which had the smallest pore size, showed a low flowrate of 97.2 L/(min·m2) at 6 kgf/cm2. The flow rate of theCNT-Ag nanofilters decreased with increasing CNT-Ag coat-ing amount. These results indicated that the pore size of theCNT-Ag nanofilter became smaller with higher CNT-Agcoating amounts.
2.4. Virus-removal ability of the CNT-Ag nanofilter
The fabricated CNT-Ag nanofilter was tested for its ability toremove waterborne viruses. CoxA9virus, which belongs to afamily of non-enveloped, linear, single-stranded, andpositive-sense ssRNA viruses Picornaviridae and the genusEnterovirus, was selected as the model virus. Enteroviruses areamong the most common and important human pathogensand its members are normally transmitted through the
Pressure (Kgf/cm2)1 2 3 4 5 6
Flow
rat
e (L
/(m
in. m
2 ))
50
100
150
200
HEPA (control)
0.2 mg/cm of CNT-Ag
0.4 mg/cm of CNT-Ag
0.6 mg/cm of CNT-Ag
0.8 mg/cm of CNT-Ag
1.0 mg/cm of CNT-Ag
Fig. 7 – Comparison of water flow rate with various CNT-Agloading amounts. The curves represent the variations of theCNT-Ag layer thickness and pure water flow rate as afunction of the CNT-Ag loading onto the CNT-Ag nanofilter.The water flow rate experiments were carried out at roomtemperature. This experiment was repeated in eachcondition by three times. CNT: carbon nanotube.
fecal-oral route. The coxA9virus is approximately 30 nm indiameter and has icosahedral symmetry (Melnick et al., 1951).For the virus filtration experiments, equal concentrations ofvirus were filtered through the CNT-Ag-coated module (0.2, 0.4,0.6, 0.8, and 1.0 mg/cm2) and a bare GF filter as the control.
Fig. 8 presents the dependence of the residual virusconcentration at the filter outlet (N/N0) on the CNT-Ag layerthickness. Virus removal efficiency improved with the in-crease of CNT-Ag loading amount. At a CNT-Ag load of0.8 mg/cm2, viruses were completely removed in water.Fig. 9 shows the results of the real-time RT-qPCR analysis.The filtration test was performed with a 0.8 mg/cm2-CNT-Agnanofilter. As shown in Fig. 9a, coxA9 viruses were not
CNT loading (mg/cm2)
0.0 0.2 0.4 0.6 0.8 1.0
Vir
us r
emov
al (
N/N
0)
0.0
0.2
0.4
0.6
0.8
Fig. 8 – Virus removal by the CNT-Ag nanofilter at variousCNT-Ag loadings. Initial virus concentration (N0) was1.1 × 104 copies/mL. Viral passage (N) was normalized by theinitial concentration for the corresponding run (N0). Thegraph describes the normalized residual virus concentrationat the filter outlet (N/N0) versus the CNT-Ag layer thickness.The experiments were carried out at a pressure of 5 kgf/cm2
at room temperature. The experiments were repeated fourtimes and showed reproducible results. CNT: carbonnanotube.
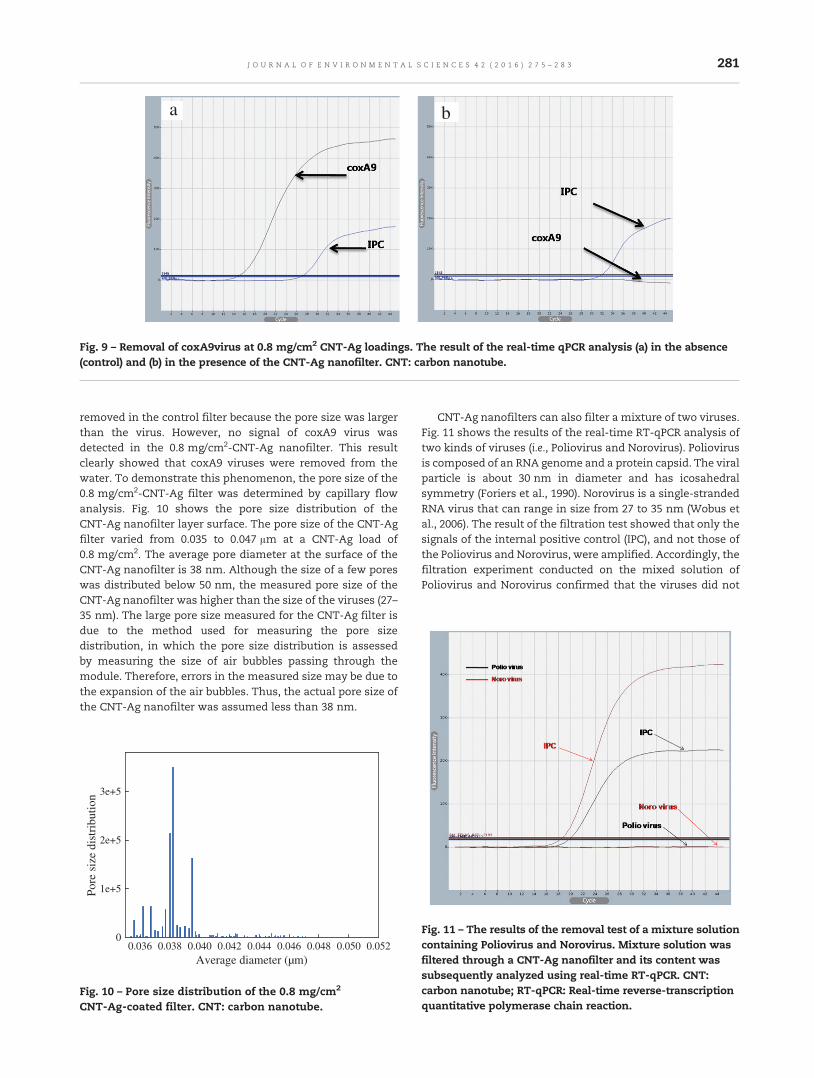
a b
Fig. 9 – Removal of coxA9virus at 0.8 mg/cm2 CNT-Ag loadings. The result of the real-time qPCR analysis (a) in the absence(control) and (b) in the presence of the CNT-Ag nanofilter. CNT: carbon nanotube.
281J O U R N A L O F E N V I R O N M E N T A L S C I E N C E S 4 2 ( 2 0 1 6 ) 2 7 5 – 2 8 3
removed in the control filter because the pore size was largerthan the virus. However, no signal of coxA9 virus wasdetected in the 0.8 mg/cm2-CNT-Ag nanofilter. This resultclearly showed that coxA9 viruses were removed from thewater. To demonstrate this phenomenon, the pore size of the0.8 mg/cm2-CNT-Ag filter was determined by capillary flowanalysis. Fig. 10 shows the pore size distribution of theCNT-Ag nanofilter layer surface. The pore size of the CNT-Agfilter varied from 0.035 to 0.047 μm at a CNT-Ag load of0.8 mg/cm2. The average pore diameter at the surface of theCNT-Ag nanofilter is 38 nm. Although the size of a few poreswas distributed below 50 nm, the measured pore size of theCNT-Ag nanofilter was higher than the size of the viruses (27–35 nm). The large pore size measured for the CNT-Ag filter isdue to the method used for measuring the pore sizedistribution, in which the pore size distribution is assessedby measuring the size of air bubbles passing through themodule. Therefore, errors in the measured size may be due tothe expansion of the air bubbles. Thus, the actual pore size ofthe CNT-Ag nanofilter was assumed less than 38 nm.
Average diameter (µm)0.036 0.038 0.040 0.042 0.044 0.046 0.048 0.050 0.052
Pore
siz
e di
stri
butio
n
0
1e+5
2e+5
3e+5
Fig. 10 – Pore size distribution of the 0.8 mg/cm2
CNT-Ag-coated filter. CNT: carbon nanotube.
CNT-Ag nanofilters can also filter a mixture of two viruses.Fig. 11 shows the results of the real-time RT-qPCR analysis oftwo kinds of viruses (i.e., Poliovirus and Norovirus). Poliovirusis composed of an RNA genome and a protein capsid. The viralparticle is about 30 nm in diameter and has icosahedralsymmetry (Foriers et al., 1990). Norovirus is a single-strandedRNA virus that can range in size from 27 to 35 nm (Wobus etal., 2006). The result of the filtration test showed that only thesignals of the internal positive control (IPC), and not those ofthe Poliovirus and Norovirus, were amplified. Accordingly, thefiltration experiment conducted on the mixed solution ofPoliovirus and Norovirus confirmed that the viruses did not
Fig. 11 – The results of the removal test of a mixture solutioncontaining Poliovirus and Norovirus. Mixture solution wasfiltered through a CNT-Ag nanofilter and its content wassubsequently analyzed using real-time RT-qPCR. CNT:carbon nanotube; RT-qPCR: Real-time reverse-transcriptionquantitative polymerase chain reaction.

282 J O U R N A L O F E N V I R O N M E N T A L S C I E N C E S 4 2 ( 2 0 1 6 ) 2 7 5 – 2 8 3
pass through the CNT-Ag nanofilter. These results supportthe conclusion that viruses are removed from the waterinside the CNT-Ag network layer by attaching to the fibrousCNT-Ag.
2.5. Bacterial removal and antibacterial activity of the CNT-Agnanofilter
The use of the CNT-Ag nanofilters was also evaluated for thesuccessful removal of bacterial contamination from drinkingwater. The gram-positive S. aureus and gram-negative E. colihave been widely used in bacteria-based experiments. S.aureus and E. coli live on the body surface of mammals and,sometimes, they cause infections. Furthermore, since thesebacteria show the unique cell envelope structures ofgram-positive and gram-negative bacteria, these strainswere selected for our antibacterial activity test.
First, S. aureus, which is spherical in shape and 1000 nm indiameter, smaller than E. coli, was cultured at 37°C for 12 hr ina BHI liquid medium to test the bacterial removal ability ofCNT-Ag. The cultured liquid mediumwas filtered through theCNT-Ag nanofilter, and the filtrate was smeared on the BHIplate medium and cultured at 37°C for 12 hr. The resultingphotograph is shown in Fig. 12a. The growth of the bacterialcolonies indicated that the liquid medium was not filteredthrough the nanoporous membrane, while lack of growth ofthe bacterial colonies suggested that the liquid medium wasfiltered through the nanoporous membrane. The resultsshowed that when the S. aureus filtrate was smeared on theBHI plate medium, no colonies were formed on the plate(Fig. 12a), which indicated that S. aureus was effectivelyfiltered out by the carbon nanotube-silver compositenanoporous membrane. This result shows that our CNT-Agfilter, which has nanosized-pores, can effectively removemicrosized-bacteria from water.
Furthermore, our CNT-Ag filter has an antibacterial effectdue to the Ag nanoparticles on the CNT surface. To test theantibacterial activity of the CNT-Ag nanofilter, 100 μL of S.aureus and E. coli culture media (103 CFU/mL) was smeared ona BHI plate medium on which a CNT-Ag nanofilter was placedas shown in Fig. 12b, c, and the cells were cultured at 37°C for24 hr. Fig. 12b, c show that no colony was formed on the plates
ba S. aureusCNT-Ag filter
Fig. 12 – Removal of bacteria by using a carbon nanotube filter cocolonies on the agar plate after filtration. The unfiltered water coplate in the presence of the CNT-Ag nanofilter. In both cases, baCNT-Ag nanofilter. CNT: carbon nanotube.
on which the CNT-Ag nanofilter was placed, which indicatedthat the CNT-Ag nanofilter had an antibacterial effect. Thistest showed that Ag nanoparticles have potent antibacterialactivity against S. aureus and E. coli cells. The antibacterialactivity of Ag nanoparticles is related to the formation ofreactive oxygen species (ROS). The ROS generated by the Agnanoparticles, such as superoxide anion (O2
−), hydroxyl radical(OHU) and singlet oxygen (1O2), can not only cause damage tothe cell membrane, but can also cause damage to the proteins,DNA, and intracellular systems such as the respiratory system(Kim et al., 2011). Moreover, the useful lifetime of a CNT-Agcomposite nanoporous filter can be increased by manufactur-ing it according to the present method due to the antibacterialeffect of the CNT-Ag nanofilter, which prevents biofouling(Gunawan et al., 2011).
3. Conclusions
In this study, our CNT-Ag nanofilter was specifically de-signed for the high-efficiency removal of various viruses andbacteria from water. First, the pore size of the filter wascontrolled according to the CNT-Ag composite loadingamount. This allowed for a very small pore size (below30 nm), which is suitable for filtration schemes such asnanosized virus and microsized bacteria removal. Second,the permeability of the CNT-Ag filter was improved by aplasma treatment process. After plasma treatment, theCNT-Ag filter was changed from having a hydrophobicsurface to a very stable hydrophilic surface. Finally, theintroduction of Ag nanoparticles on the CNT filter surfaceprovided the nanofilter antibacterial activity and preventedbiofouling. Moreover, the fact that additional processes toremove viruses and bacteria are not necessary provides asignificant advantage in terms of manufacturing costs.Because of the small amount of CNT-Ag per filter area, aswell as the ease of preparation through simple CNT-Agdispersion and deposition on a base membrane, the produc-tion costs should not be very high. By considering all theadvantages mentioned above, we believe that our CNT-Agnanofilter provides satisfactory solutions for water treat-ment and other separation processes.
cS. aureusgA-TNCgA-TNC
E. coli
ated with Ag nanoparticles. (a) The absence of S. aureusntaining S. aureus (b) and E. coli (c) was cultured on an agarcterial colonies grew on the agar and did not grow on the

283J O U R N A L O F E N V I R O N M E N T A L S C I E N C E S 4 2 ( 2 0 1 6 ) 2 7 5 – 2 8 3
R E F E R E N C E S
Akhavan, O., Abdolahad, M., Abdi, Y., Mohajerzadeh, S., 2011.Silver nanoparticles within vertically aligned multi-wallcarbon nanotubes with open tips for antibacterial purposes.J. Mater. Chem. 21 (2), 387–393.
Ayyappan, S., Subbanna, G.N., Srinivasa Gopalan, R., Rao, C.N.R.,1996. Nanoparticles of nickel and silver produced by the poyolreduction of the metal salts intercalated in montmorillonite.Solid State Ionics 84 (3-4), 271–281.
Brady-Estévez, A.S., Kang, S., Elimelech, M.A., 2008. Singlewalled-carbon-nanotube filter for removal of viral and bacterialpathogens. Small 4 (4), 481–484.
Brady-Estévez, A.S., Schnoor, M.H., Vecitis, C.D., Saleh, N.B.,Ehmelech, M., 2010a. A multiwalled carbon nanotube filter:improving viral removal at low pressure. Langmuir 26 (18),14975–14982.
Brady-Estévez, A.S., Schnoor, M.H., Kang, S., Elimelech, M., 2010b.SWNT-MWNT hybrid filter attains high viral removal andbacterial inactivation. Langmuir 26 (24), 19153–19158.
Brady-Estévez, A.S., Nguyen, T.H., Gutierrez, L., Elimelech, M.,2010c. Impact of solution chemistry on viral removal by asingle-walled carbon nanotube filter. Water Res. 44 (13),3773–3780.
Cha, S.I., Kim, K.T., Arshad, S.N., Mo, C.B., Hong, S.H., 2005.Extraordinary strengthening effect of carbon nanotubes inmetal-matrix nanocomposites processed by molecular-levelmixing. Adv. Mater. 17 (11), 1377–1381.
Di, Z.C., Ding, J., Peng, X.J., Li, Y.H., Luan, Z.K., Liang, J., 2006.Chromium adsorption by aligned carbon nanotubes supportedceria nanoparticles. Chemosphere 62 (5), 861–865.
Diallo, M.S., Savage, N., 2005. Nanoparticles and water quality.J. Nanoparticle Res. 7 (4-5), 325–330.
Ducamp-Sanguesa, C., Herrera-Urbina, R., Figlarz, M., 1993. Finepalladium powders of uniform particle size and shapeproduced in ethylene glycol. Solid State Ionics 63–65, 25–30.
Foriers, A., Rombaut, B., Boeyé, A., 1990. Use of high-performancesize-exclusion chromatography for the separation of poliovi-rus and subviral particles. J. Chromatogr. 498 (1), 105–111.
Gunawan, P., Guan, C., Song, X.H., Zhang, Q.Y., Leong, S.S.J., Tang,C.Y., et al., 2011. Hollow fiber membrane decorated with Ag/MWNTs: toward effective water disinfection and biofoulingcontrol. ACS Nano 5 (12), 10033–10040.
Hinotsu, T., Jeyadevan, B., Chinnasamy, C.N., Shinoda, K., Tohji,K., 2004. Size and structure control of magnetic nanoparticlesby using a modified polyol process. J. Appl. Phys. 95 (11),7477–7479.
Iijima, S., 1991. Helical microtubules of graphitic carbon. Nature354 (6348), 56–58.
Kang, S., Herzberg, M., Rodrigues, D.F., Elimelech, M., 2008a.Antibacterial effects of carbon nanotubes: size does matter.Langmuir 24 (13), 6409–6413.
Kang, S., Mauter, M.S., Elimelech, M., 2008b. Physicochemicaldeterminants of multiwalled carbon nanotube bacterialcytotoxicity. Environ. Sci. Technol. 42 (19), 7528–7534.
Kang, S., Mauter, M.S., Elimelech, M., 2009. Microbial cytotoxicityof carbon-based nanomaterials: implications for river waterand wastewater effluent. Environ. Sci. Technol. 43 (7),2648–2653.
Kim, K.T., Cha, S.I., Hong, S.H., 2007. Hardness and wear resistanceof carbon nanotube reinforced Cu matrix composites. Mater.Sci. Eng. A 449–451, 46–50.
Kim, K.T., Eckert, J., Menzel, S.B., Gemming, T., Hong, S.H., 2008.Grain refinement assisted strengthening of carbon nanotubereinforced copper matrix composites. Appl. Phys. Lett. 92 (12),121901–121903.
Kim, S.H., Lee, H.S., Ryu, D.S., Choi, S.J., Lee, D.S., 2011.Antibacterial activity of silver-nanoparticles againstStaphylococcus aureus and Escherichia coli. Korean J. Microbiol.Biotechnol. 39 (1), 77–85.
Kim, A., Lim, S., Peck, D.H., Kim, S.K., Lee, B., Jung, D., 2012.Preparation and characteristics of SiOx coated carbonnanotubes with high surface area. Nanomaterials 2 (4),206–216.
Li, Y.H., Ding, Z., Luan, K., Di, Z.C., Zhu, Y.F., Xu, C.L., et al., 2003.Competitive adsorption of Pb2+, Cu2+ and Cd2+ ions fromaqueous solutions by multiwalled carbon nanotubes. Carbon41 (14), 2787–2792.
Liu, X.Y., Pan, D., Choi, H., Lee, J.K., 2013. Superamphiphilic Ag-CNTs electrode by atmosphere plasma treatment. Curr. Appl.Phys. 13, S122–S126.
Lu, C.S., Chung, Y.L., Chang, K.F., 2005. Adsorption of trihalo-methanes from water with carbon nanotubes. Water Res. 39(6), 1183–1189.
Melnick, J.L., Rhian, M., Warren, J., Breese, S.S., 1951. The size ofCoxsackie viruses and Lansing poliomyelitis virus determinedby sedimentation and ultrafiltration. J. Immunol. 67 (2),151–162.
Park, H.S., Gong, M.S., 2012. Facile preparation of nanosilver-decorated MWNTs using silver carbamate complex and theirpolymer composites. Bull. Kor. Chem. Soc. 33 (2), 483–488.
Peng, X.J., Luan, Z.K., Ding, J., Di, Z.H., Li, Y.H., Tian, B.H., 2005.Ceria nanoparticles supported on carbon nanotubes for theremoval of arsenate from water. Mater. Lett. 59 (4), 399–403.
Rahaman, M.S., Vecitis, C.D., Elimelech, M., 2012. Electrochemicalcarbon-nanotube filter performance toward virus removal andinactivation in the presence of natural organic matter.Environ. Sci. Technol. 46 (3), 1556–1564.
Schoen, D.T., Schoen, A.P., Hu, L.B., Kim, H.S., Heilshorn, S.C., Cui,Y., 2010. High speed water sterilization using one-dimensionalnanostructures. Nano Lett. 10 (9), 3628–3632.
Upadhyayula, V.K.K., Deng, S., Mitchell, M.C., Smith, G.B., 2009.Application of carbon nanotube technology for removal ofcontaminants in drinking water: a review. Sci. Total Environ.408 (1), 1–13.
Wang, Z.J., Kwon, D.J., Gu, G.Y., Lee, W.I., Park, J.K., DeVries, K.L., etal., 2013. Evaluation of interfacial properties of atmosphericpressure plasma-treated CNT-phenolic composites by dualmatrix fragmentation and acoustic emission tests. Compos.Part A 52, 151–158.
Wobus, C.E., Thackray, L.B., Virgin, H.W., 2006. Murine norovirus:a model system to study norovirus biology and pathogenesis.J. Virol. 80 (11), 5104–5112.
Yan, H., Gong, A.J., He, H.S., Zhou, J., Wei, Y.X., Lü, L., 2006.Adsorption of microcystins by carbon nanotubes.Chemosphere 62 (1), 142–148.
Zhao, B., Zhang, L., Wang, X.Y., Yang, J.H., 2012. Surfacefunctionalization of vertically-aligned carbon nanotube forestsby radio-frequency Ar/O2 plasma. Carbon 50 (8), 2710–2716.

J O U R N A L O F E N V I R O N M E N T A L S C I E N C E S 4 2 ( 2 0 1 6 ) 2 8 4 – 2 9 2
Ava i l ab l e on l i ne a t www.sc i enced i r ec t . com
ScienceDirect
www.e l sev i e r . com/ l oca te / j es
Use of micellar liquid chromatography for rapid monitoring offungicides post harvest applied to citrus wastewater
Juan Peris-Vicente⁎, Ana Marzo-Mas, Pasqual Roca-Genovés,Samuel Carda-Broch, Josep Esteve-RomeroDepartamento de Química Física i Analítica, ESTCE, Universitat Jaume I, 12071 Castelló, Spain. E-mail: [email protected]
A R T I C L E I N F O
⁎ Corresponding author.
http://dx.doi.org/10.1016/j.jes.2015.12.0121001-0742/© 2016 The Research Center for Ec
A B S T R A C T
Article history:Received 9 October 2015Revised 30 November 2015Accepted 16 December 2015Available online 1 February 2016
A method based on micellar liquid chromatography has been developed to simultaneouslymonitor four pesticides largely post-harvest applied to citrus: thiabendazole, pyrimethanil,o-phenylphenol and imazalil. Water samples were filtered and directly injected without othertreatment, thus avoiding extraction steps. The composition of the mobile phase wasoptimized using a chemometrical approach to achieve and excellent resolution to 0.07 mol/LSDS/5%,V/V 1-pentanol buffered at pH 3.Mobile phase run through a C18 columnat 1 mL/minat room temperature. The detection was performing by UV–Visible absorbance using awavelength program: 0–10 min, 305 nm (for thiabendazole); 10–12; 265 nm (for pyrimethanil)and 12–18, 220 nm (o-phenylphenol and imazalil). The developed method was validatedfollowing the guidelines of the US Environmental Protection Agency in terms of: quantitationrange, (0.5–4 to 15 μg/mL), linearity (r2 > 0.9995), sensitivity (LOD, 0.18–1.4 μg/mL), precision(<9.2%), trueness (93.9%–103.7%), and ruggedness (<9.9%). It was found that the fungicidesremain up to eight days in surface water at outdoor conditions. The method was used toscreen the presence of the analytes in several waste water samples, and was proved to beuseful in routine analysis.© 2016 The Research Center for Eco-Environmental Sciences, Chinese Academy of Sciences.
Published by Elsevier B.V.
Keywords:Direct injectionMicellarPesticidePollutionValidationWater
Introduction
The production of citrus and the related fruit processingindustry have as strong importance in the Castellón area(Spain). In fact, the exportation of fruits has an importantweight in its economy (Montoliu-Vidal, 2010). One of theproblems of fruit trading is the spoilage of citrus during storageand transportation, caused by microorganism, fungi andinsects. This reduces the economic yielding of the agriculturalactivity. To prevent this fruit decay, pesticides are post-harvestadded to fruits (Burden and Wills, 1989). Thiabendazole (TBZ),pyrimethanyl (PYR), o-phenylphenol (OPP), and imazalil (IMZ)are pesticides widely post-harvest applied by citrus traders and
o-Environmental Science
fruit-processing industry to protect crops during storage andtransportation, because of their broad spectrum and strongfungicide activity (US EPA 2015; Smilanick, 2011). TBZ and PYRare also pre-harvest used to protect the tree and citrus duringgrowing against mold and fungi. They are applied to the soil orsprayed over crop fields (Smilanick, 2011; Picón-Zamora et al.,2000).
Because of their intensive use and persistence, pesticidesrepresent an important source of contamination of environ-mental water, especially those near areas with strongfruit-related activity. These pesticides are highly toxic andpotentially carcinogenic, and then represent a serious threatto the local flora and fauna (US EPA, 2015). The population is
s, Chinese Academy of Sciences. Published by Elsevier B.V.

285J O U R N A L O F E N V I R O N M E N T A L S C I E N C E S 4 2 ( 2 0 1 6 ) 2 8 4 – 2 9 2
also exposed to thesehazardous compoundsby dermal contact,accidental ingestion, or inhalation of polluted water. Moreover,the main danger is the ingestion of animals of vegetables,which have been in contact with pollutedwater, due to becausetheir high bioaccumulation in edible tissues of living organisms(Langenbach, 2013). For these reasons, the European WaterFramework Directive recommends the implementation ofactions to avoid these compounds arrive to underground andsurface water (European Commission, 2008).
These pesticides are present inwastewater fromagriculturalfield, drained by rain water (Langenbach, 2013), and in sewagewater from fruit-processing plants. To avoid the pollution ofenvironmental water by pesticides, sewerage and waste waterare purified in wastewater treatment plants (WWTP) beforedischarging to the river streams. In order to evaluate the qualityof waste and sewerage water, several local governmentshave implemented programs to periodically perform pesticidescreening in water samples from their area. Moreover, the fruitprocessing industry has been requested to monitor thesehazardous compounds in their own wastewater before throw-ing it, in order to reduce the environmental impact of theiractivity. The effectiveness of theWWTP treatmentmust also beevaluated by analyzing the influent and effluent flow (EuropeanCommission, 2008). Indeed, they must dispose of a reliable,easy-to-use and sensitive analytical method to simultaneouslyquantify thiabendazole, o-phenyl-phenol, pyrimethanyl andimazalil in water.
The preferred analytical methods to perform multiresiduepesticide analyses in wastewater are gas chromatography andliquid chromatography, coupled to mass spectrometry (Lianget al., 2014). However, this instrumentation is costly andrequires expensive maintenance; thus, the analyses are soldat higher prices. In the current context of economic crisis,industries and government institutions are forced to reducetheir budgets, and increasingly demand less expensivemethods. Liquid chromatography can be coupled to affordableand reasonably selective detector, as UV–Visible, to detect TBZ(Cacho et al., 2009; Santaladchaiyakit and Srijaranai, 2012), PYR(Gao et al., 2012; Baggiani et al., 2007), OPP (Yu et al., 2001; Liuet al., 2014) and IMZ (Gao et al., 2012; Tian et al., 2012) in waterand aqueous samples. However, the resolution of a pesticidemixture is normally performed using gradient-programmedmobile phases, complicating the screening of a large amount ofsamples (Cacho et al., 2009; Santaladchaiyakit and Srijaranai,2012; Yu et al., 2001). Nevertheless, wastewater samplesmay contain sludge particles and oily compounds dispersedin water, which must be removed before analysis (Beltrán-Martinavarro et al., 2013). Thus, tedious and time-consumingclean-up steps must be introduced, as a liquid–liquid(Santaladchaiyakit and Srijaranai, 2012; Gao et al., 2012; Yu etal., 2001) or solid/liquid (Cacho et al., 2009; Baggiani et al., 2007;Liu et al., 2014; Tian et al., 2012) extraction. These steps requirespecific chemicals andmaterials, and increase the possibility ofloss of analyte by low yielding or operator error.
Liquid chromatography using hybridmicellar mobile phases,containing sodium dodecyl sulfate (SDS) as surfactant andshort-chain alcohol (to improve the elution power and theefficiency) as additive, is an interesting alternative to analyzecontaminants inwastewater. The lipophylic environment insidethemicelle allows the solubilization of hydrophobic compounds.
Therefore, after a simple filtration, the water sample can bedirectly injected in the chromatographic system, thus expeditingthe experimental procedure (Romero-Cano et al., 2015). Theretention mechanism is different from hydroorganic reversephase-high performance liquid chromatography (RP-HPLC),because the monomer surfactant modifies the nature of thestationary phase, and the analyte also can interact with the coreof the micelles. Hence, compounds with dissimilar hydropho-bicity can be resolved in the same rununder isocratic conditions.The behavior of the analytes in micellar liquid chromatography(MLC) is highly steady and reproducible. The retention param-eters can be accurately predicted at different SDS/alcoholconcentration by means of a statistical treatment from theresults obtained by testing only few mobile phases. Moreover,SDS solutions are more stable, less toxic, non-flammable,biodegradable, and uses less amount of organic solvent (up to12.5%, V/V), in comparison to hydroorganic mobile phases usedin HPLC (Peris-Vicente et al., 2014). MLC has been already used todetect carbamate pesticides in water (Gil-Agustí et al., 2002;Capella-Peiró et al., 2004; Chin-Chen et al., 2012).
The aim of the work is to develop an analytical procedurebased on micellar liquid chromatography for the screening ofTBZ, PYR, OPP and IMZ in water. The method must be simple,rapid, inexpensive, reliable and environmental friendly. Thesample preparation must be simplified to facilitate the studyof a large amount of samples, in order to apply it to routineanalysis. The analytical procedure would be in-house validat-ed by the Validation and Peer Review of U.S. EnvironmentalProtection Agency (EPA) Chemical Methods of Analysisguideline in terms of selectivity, quantitation range, linearity,sensitivity, precision, trueness and ruggedness (The FEMMethod Validation Team, 2005). The analytical methodwould be applied to evaluate the stability of the fungicidesin outdoor conditions, and to detect the concentration ofpesticides in sewage and WWTP treated water streams.
1. Materials and methods
1.1. Reagents and solutions
The pesticides thiabendazole, pyrimethanil, o-phenyl-phenoland imazalil (purity >99.9%) were purchased from Dr.Ehrerstorfer (Augsburg, Germany). The characteristics aredescribed in Table 1 (Agriculture and Environment ResearchUnit, 2014). SDS (purity >99%)was suppliedbyMerck (Germany).Methanol, 1-butanol and 1-pentanol (HPLC grade) were fromScharlab (Spain). Sodium dihydrogen phosphate monohydrate,hydrochloric acid, sodium hydroxide and 1-propanol wereordered from Panreac (Spain). Ultrapure water was in-situgenerated using a Simplicity UV ultrapure water generatordevice (Millipore S.A.S., France). This ultrapure water was usedto prepare all the aqueous solution throughout thewhole work.
1.2. Solutions and mobile phase preparation
Stock solutions containing 100 μg/mL of each pesticidewere prepared by weighting the appropriate amount ofsolid standard and solving in methanol, and stored at −4°C.Standard solutions were prepared by successive dilutions of

Table 1 – Structure, pKa and logPo/w for the studied pesticides (Agriculture and Environment Research Unit, 2014).
Compound (group) Structure pKa logPo/w
Thiabendazole (benzimidazole) 4.73/12.00 2.39
Pyrimethanil (anilinopyrimidine) 3.52 2.84
o-Phenylphenol (phenol) 9.4 3.18
Imazalil (imidazole) 6.49 2.65
286 J O U R N A L O F E N V I R O N M E N T A L S C I E N C E S 4 2 ( 2 0 1 6 ) 2 8 4 – 2 9 2
stock solutions in water or in wastewater from sample 12, freeof the studied fungicides. These solutions were not stored.
The mobile phases were prepared by weighting theadequate amount of SDS and sodium dihydrogen phosphate.These reagents were solved in water and the pH was adjustedby adding 0.1 mol/L HCl or 0.1 mol/L NaOH. The adequatevolume of alcohol was added to achieve the desired concen-tration. The solution was filled up with water to reach thefinal volume, ultrasonicated and filtered through 0.45 μmnylon membranes (Micron Separations, USA).
1.3. Apparatus and instrumentation
Solids were weighted using a Mettler–Toledo analyticalbalance (Switerland). The pH measurements were performedusing a GLP 22 potentiometer (Crison, Spain) equipped with acombined Ag/AgCl/glass electrode. An Ultrasons-H ultrasonicbath (Selecta, Spain) was used to achieve the completedissolution of the mobile phases.
The chromatographic system was an Agilent TechnologiesSeries 1100 (USA). It was equipped with an isocratic pump, adegasser, an autosampler and UV–Visible diode array detector(DAD). The signal was acquired by a personal computerconnected to the chromatograph by means of an AgilentChemstation version B.01.01.
Chromatograms were treated using Michrom software(Torres-Lapasió, 2000) to extract the chromatographic param-eters: retention time (tR), retention factor (kR), dead time (t0),efficiency (N), asymmetry (B/A) and peak area (A). Themeaning of the chromatographic parameters has been de-scribed by the CHROMacademy (2015).
1.4. Chromatographic conditions
The stationary phase chosen for the analysis was coated in aKromasil C18 column, with the following characteristics: length
150 mm; internal diameter, 4.6 mm; particle size, 5 μm; poresize 100 Å. The selectedmobile phase was an aqueous solutionof 0.07 mol/L SDS — 5%, V/V 1-pentanol — 0.01 mol/L phos-phate buffer at pH 3, flowing at 1 mL/min in isocatic mode atroom temperature. The injection volume was 20 μL. Thedetection was performed by switching the absorbance wave-length as follows: 0–9.20, 305 nm; 9.20–12.0, 265 nm; 12.0–20.0,220 nm. The special care required for liquid chromatographicinstrumentationwhen dealingwithmicellarmobile phases hasbeen detailed by Rambla-Alegre et al. (2010).
1.5. Sample preparation
Wastewater samples were collected and supplied to thelaboratory by Fomento Agricola Castellonense, S.A. (FACSA,Spain), a company managing the integral water cycle and theevaluation of the water quality in the Spanish province ofCastellón. The samples were taken from fruit-processingwastewater, in the influent and effluent stream water inwastewater treatment plants, as well as in the agriculturalsewage water (Table 2). The samples were kept in laboratoryat 4°C and analyzed in less than three days. Before theanalysis, the samples were put out the fridge and maintainedin the laboratory for 30 min to warm up to room temperature.
The standard solutions and water samples were analyzedby filtering an aliquot using a 0.45 μm nylon membrane anddirectly injected in the chromatographic system.
2. Results and discussion
2.1. Optimization of chromatographic conditions
The stationary phase, flow-rate and injection values weretaken as the standard values used in MLC, a C18 column,1 mL/min and 20 μL, respectively. The composition of the

Table 2 – Concentrations (μg/mL) of TBZ, PYR, OPP and IMZ detected in sewage water samples.
Origin of water sample Sample Location TBZ PYR OPP IMZ
Sewage agricultural water 1 Villareal n.d. 0.25–0.5 n.d. n.d.2 La Vilavella 0.18–0.5 0.6 n.d. n.d.3 Betxí n.d. 0.25–0.5 n.d. n.d.4 Alcora 0.18–0.5 n.d. n.d. n.d.5 Onda 0.18–0.5 0.7 n.d. n.d.6 Nules n.d. 1.0 n.d. n.d.
Collector basin of wastewater from a citrus-processing plant 7 Real Export (Vila-real) 2.0 1.0 n.d. 1.4–48 Invicto (Vila-real) 1.4 n.d. 1–3 n.d.9 Serifruit (Vila-real) 0.9 1.5 1–3 n.d.10 Eurococi (Betxí) 1.7 1.3 n.d. 1.4–4
Wastewater from WWTP 11 Influent (Nules-La Vilavella) 1.3 0.8 n.d. n.d.12 Effluent (Nules-La Vilavella) n.d. n.d. n.d. n.d.13 Influent (Vora Riu) 1.4 1.1 1–3 1.4–414 Effluent (Vora Riu) n.d. n.d. n.d. n.d.15 Influent (Mancomunada OBVA) 0.6 n.d. 3.1 n.d.16 Effluent (Mancomunada OBVA) n.d. n.d. n.d. n.d.
n.d. not detected.WWTP: wastewater treatment plants.
287J O U R N A L O F E N V I R O N M E N T A L S C I E N C E S 4 2 ( 2 0 1 6 ) 2 8 4 – 2 9 2
mobile phase (SDS, alcohol and pH) and the detectionwavelength were optimized. The standard solution used forthe optimization analysis was a mixture of 2 μg/mL of TBZand PYR, 5 μg/mL of OPP and 7 μg/mL of IMZ solved inultrapure water.
2.1.1. pH selectionThe pH values can modify the retention mechanism of thepesticides with acidic/basic activity. The mobile phase wasbuffered to avoid the oscillations of pH can affect the retentionconditions. As the chosen column has a working pH range of1.5–7.5, only neutral and acidic pHs were tested.
The influence of the pH was evaluated by analyzing thestandard solution of the pesticides using the optimal mobilephase buffered at pH 3; 5 and 7. For the four pesticides, theretention times were similar at the three studied pH.However, a strong tailing was observed for TBZ at pH 5 and7; but at pH 3 the obtained peak was quite Gaussian. It wasobserved that the shape of PYR, OPP and IMZ do not change byvarying the acidity of the mobile phase. Therefore, the pH 3was selected as optimal.
2.1.2. Selection of surfactant and alcoholThe selected surfactant was SDS, the most widely used inMLC, according to its moderate CMC (8.3 mmol/L), low Krafftpoint (15°C), high solubility in water, biodegradability and lowviscosity of the solutions (Peris-Vicente et al., 2014).
According to themedium-high logPo/w, the pesticides are toohydrophobic to be eluted at a reasonable retention time using aC18 column and a pure aqueous SDS solution them in a usefulretention timeusing a C18 column. The addition of a short chainalcohol would be necessary to increase the elution power ofthe mobile phase to obtain more adequate retention times,and additionally improve the efficiency (Berthod and García-Álvarez-Coque, 2000). Therefore, the selection of the alcoholwasperformed by studying the retention times obtained by analyz-ing the standard solution at several hybrid mobile phasescontaining 1-propanol, 1-butanol and 1-pentanol.
The concentrations of SDS and organic modifier in thetested mobile phases were chosen following a full factorialdesign plus the center: four points, combining the minimumand maximum concentration of SDS and alcohol typicallyrecommended for MLC, and a central point taking theintermediate concentrations (Peris-Vicente et al., 2014). Inthis case, the studied mobile phases were aqueous solutionsbuffered at pH 3 of:
SDS/1-propanol (mol/L/%, V/V): 0.05/2.5; 0.15/2.5; 0.10/7.5;0.15/2.5 and 0.15/12.5.SDS/1-butanol (mol/L/%, V/V): 0.05/1; 0.15/7; 0.10/4; 0.15/1and 0.15/7.SDS/1-pentanol (mol/L/%, V/V): 0.05/2; 0.05/6; 0.10/4; 0.15/2and 0.15/6.
The four pesticides show a binding behavior withSDS-micelles: their retention time decreases at higher concen-trations of SDS.Moreover, the retention time also diminishes byincreasing the concentration and the length of the carbonchain, as it is usual in MLC. In nearly all the tested mobilephases, the elution order was maintained: tR (IMZ) > tR(OPP) > tR(PYR) > tR(TBZ). Besides, even using the mobile phasewith the higher elution power (0.15 mol/L/6% 1-pentanol), theless retained pesticide (TBZ) was eluted enough far (≈4 min)from the dead time (1.04 min).
The use of 1-propanol was discarded, because even at themore eluent conditions (0.15 mol/L/12.5%, V/V 1-propanol), theretention time of IMZ was too high. Comparing 1-butanol and1-pentanol, this last one provide less retention times in all theSDS/alcohol amount combinations. Therefore, 1-pentanol wasselected as the more adequate organic modifier.
2.1.3. Optimization of SDS/1-pentanol concentrationThe optimization criterion was to obtain a mobile phasethat allows the complete separation of the pesticides inan appropriate analysis time. The concentration of SDSand 1-pentanol were simultaneously optimized using an

Fig. 1 – Chromatogram obtained by the analysis of a standardsolution of 2 μg/mL of thiabendazole (TBZ) and pyrimethanil(PYR), 5 μg/mL of o-phenylphenol(OPP) and 7 μg/mL ofimazalil (IMZ) in water.
288 J O U R N A L O F E N V I R O N M E N T A L S C I E N C E S 4 2 ( 2 0 1 6 ) 2 8 4 – 2 9 2
interpretative strategy based on a statistical model describedby Esteve-Romero et al. (2005). It allows the prediction of thechromatographic behavior of each analyte depending on thecomposition of the mobile phase.
The retention factor of a compound is related to theconcentration of SDS and 1-pentanol in the mobile phaseusing the following equation:
k ¼KAS
11þ KADφ
1þ KAM1þ KMDφ1þ KADφ
M½ �ð1Þ
where, [M] (mol/L)) and φ (%, V/V) are the concentration of SDSand 1-pentanol. The constants mean partition coefficientscharacteristics of each analyte, and has been described byEsteve-Romero et al. (2005). Besides, the peak shape, and thenthe efficiency and asymmetry, were modeled using the Eq. (2),which calculates the signal h(t) at each time of the chromato-graphic run (t):
h tð Þ ¼ H0e−0:5 t−tR
s0þs1 t−tRð Þ
� �2
ð2Þ
where, si are constants depending on tR (min), N (number oftheoretical plates) and B/A (dimensionless) (Esteve-Romeroet al., 2005). They are ideally the same for each studiedcompound and mobile phase. H0 (absorbance unit) dependson the concentration of the pesticide.
Michrom software (Torres-Lapasió, 2000) requires theexperimental values of retention factor, N and B/A obtainedat five mobile phases to adjust the Eqs. (1) and (2). Thus, thevalues for each pesticide obtained using the SDS/1-pentanolmobile phases described in Section 2.1.2 were processed.Once known, the statistical model was able to estimatethe theoretical values of the chromatographic parameters(retention factor, efficiency and asymmetry) and peak shapefor TBZ, PYR, OPP and IMZ at intermediate concentrations ofSDS/1-pentanol (0.05–0.15 mol/L/2%–6%, V/V, respectively) byinterpolation. It can utilize this information to draw thecorresponding simulated chromatograms without performingthe analysis and to calculate the theoretical resolution (rij) foreach pair peak (following the valley-peak criterion) and thepredicted global resolution of the chromatogram (Z) calculat-ed as the least rij (Esteve-Romero et al., 2005).
Applying the maximum resolution-minimum analysistime, the optimal mobile phase proposed by the statisticalmodel was 0.07 mol/L SDS — 5%, V/V 1-pentanol at pH 3 (Z =0.9997). The pesticide standard solution was analyzed (n = 3)under these conditions (Fig. 1). The obtained chromatogramshow completely resolved peaks with adequate shape in<18 min. This indicates the specificity of the method, becauseeach pesticide can be unambiguously identified. The experi-mental chromatographic parameters (tR; N; B/A) were: TBZ(8.29; 2272; 1.098), PYR (10.95; 3398; 0.973), OPP (13.19; 2176;1.159), IMZ (15.70; 6637; 12.78). The error in the prediction ofthe retention factor was <5%.
The selected mobile phase permits the resolution of thepesticidemixture in a short time. Besides, as the isocratic run isused, the stabilization time between two injections is notneeded. For these reasons, the achievement ofmany successive
chromatographic runs is facilitated. Moreover, the mobilephase contains lower amount of toxic solvent (5%) thanhydroorganic HPLC (up to 100%), and only requires inexpensivereagents and basic chromatographic instrumentation.
2.1.4. Detection conditionsThe pesticide standard solution was analyzed using theoptimal micellar mobile, and UV–Visible spectra of eachpesticide were registered between 200 and 400 nm using adiode array detector. Therefore, the spectra of each pesticidewere obtained for each pesticide in the same environmentfurthermore used for the analysis.
The maximum absorbance wavelength of each pesticidewas taken as the optimal value for the analysis: 305 nm forTBZ, 265 nm for OPP and 220 nm for PYR and IMZ. Thebaseline noise is higher for PYR and IMZ, because 220 nm is aless selective wavelength, and the absorption of the back-ground increases, especially for aqueous solutions. Thewavelength detection was then modified during the chro-matographic run to quantify each pesticide at its optimalvalue.
2.2. Method validation
The method was in-house validated following the US EPAreview for chemical methods of analysis, applicable for theanalysis of environmental water samples, to check theconcentration range of applicability and the reliability of theobtained data. The studied validation parameters were:linearity, quantitation range, inter- and intraday truenessand precision, and ruggedness (The FEM Method ValidationTeam, 2005). The whole validation was performed usingstandard solutions of TBZ, OPP, PYR and IMZ in effluentwastewater from a WWTP (sample 12), initially without theanalytes. The four pesticides were simultaneously studied.

Table 3 – Calibration parameters and quantitation range(concentrations in μg/mL).
Fungicide Slope y-Intercept r2 LOD LOQ
TBZ 110.3 ± 1.0 0 ± 14 0.99990 0.18 0.5PYR 81.2 ± 1.5 5 ± 6 0.99990 0.25 0.5OPP 89.3 ± 1.3 −50 ± 30 0.9992 1.0 3.0IMA 38.5 ± 1.1 −48 ± 6 0.9990 1.4 4.0
N = 5; LOD: limit of detection; LOQ: limit of quantification.
289J O U R N A L O F E N V I R O N M E N T A L S C I E N C E S 4 2 ( 2 0 1 6 ) 2 8 4 – 2 9 2
2.2.1. Quantitation range and linearityFor calibration studies, several solutions containing increas-ing concentrations of pesticides were analyzed (n = 3) atincreasing concentrations up to 15 μg/mL. The lowest con-centration was different for each analyte (see Table 3). Theslopes, y-intercepts and determination coefficients wereobtained by plotting the peak area versus the correspondingconcentration by the least-square linear regression. Thisprocedure was carried out five days during a 3-months period,and the calibration curve parameters were taken as theaverage values of the five measurements. The quantizationrange covers from the limit of quantification (see below) to15 μg/mL.
The limit of quantification (LOQ) is the minimal concen-tration at which the analyte can be reliably quantified. It wastaken as ten times (10 s-criterion) the standard deviation ofthe blank, taken as the standard deviation of the residual,divided by the sensitivity (slope of the calibration curve)(Esteve-Romero et al., 2005). Levels under LOQ were removed,and the calibration parameters changed accordingly. The finalresults are shown in Table 3. The excellent values fordetermination coefficient (r2 > 0.9990) indicate a good linear-ity in the considered range.
The limit of detection (LOD) is the lowest concentrationthat provides a signal significantly over the baseline noise.Between LOD and LOQ, the analyte is detected, but it cannotbe quantified with enough trueness and precision. The LODwas determined as 3 times the standard deviation of the blankdivided by the sensitivity (3 s-criterion) (Miller and Miller,2010).
Table 4 – Intra- and inter-day trueness and precision for the stu
Intra-day
Pesticide Concentration (μg/mL) Trueness (%) Repeat
TBZ0.5 102.92 101.1
15 98.7
PYR0.5 101.82 98.6
15 97.8
OPP3 103.25 103.0
15 98.9
IMZ4 94.57 104.3
15 97.8
a n=6.b n=5.
2.2.2. Trueness and precisionFor the intraday measurements, the standard solution wasanalyzed 6-times in the same day. Intraday precision (repeat-ability) was determined as the relative standard deviation(RSD) of the peak areas. The intraday trueness was calculatedas the quotient of the average value of the concentrationprovided by the method and true value. For the interdayvalues, the same procedure was performed five different daysover a 3-months period, by renewing the solution at eachoccasion. The interday precision (reproducibility) was the RSDof all the taken peak area, whereas the interday trueness wascalculated as the average value of five intraday values.
The results are shown in Table 4. The measures show goodrecovery (93.9%–103.7%) and low variability (<9.2%) for thequantitative data provided by the method. The high quality ofthe results is due to the quantitative transferring of thealiquot by the direct injection, which reduces the probabilityof loss of analyte.
2.2.3. RuggednessThe modification of the elution power and the sensitivity atslight, but deliberate changes in the main chromatographicparameters (SDS concentration, 1-pentanol, pH and flow-rate)are studied. The influence of each parameter was separatelystudied by analyzing (n = 3) the standard solution using threemobile phases at: the optimal value, slightly under andslightly over, and remaining the others constant. The RSD ofthe three measurements was calculated for retention timeand peak area of the three measurements. The results areshown in Table 5.
Themethod was considered quite robust, as low variationswere observed for retention times (<9.9%) and peak area(<8.8%).
2.3. Stability in surface water
The stability of the pesticides in water under environmentalconditions was evaluated. Thus, the effect of the oscillationsof the temperature and the irradiation was considered. Asolution of 10 μg/mL of TBZ and PYR, and 15 μg/mL of OPP andIMZ spiked in water was kept for eight days reproducing the
died pesticides.a Inter-dayb
ability (RSD, %) Trueness (%) Reproducibility (RSD, %)
4.1 93.9 8.13.2 97.2 1.36.3 98.3 2.96.9 103.7 2.84.4 96.5 1.92.9 98.5 5.43.6 95.5 8.35.1 101.2 3.54.5 103.2 4.79.2 98.7 7.22.1 103.3 0.64.4 97.8 3.8

Table 5 – Evaluation of the ruggedness of the MLC-method.
Pesticide Chromatographic parameters Level Retention time (RSD, %) Peak area (RSD, %)
Thiabendazole SDS concentration (mmol/L) 65–75 4.3 2.61-Pentanol amount (%, V/V) 4.9–5.1 4.0 0.8pH 2.9–3.1 3.5 2.5Flow rate (mL/min) 0.95–1.05 5.4 3.1
Pyrimethanil SDS concentration (mmol/L) 65–75 5.0 4.81-Pentanol amount (%,V/V) 4.9–5.1 3.1 4.5pH 2.9–3.1 5.5 1.1Flow rate (mL/min) 0.95–1.05 5.6 3.3
Phenylphenol SDS concentration (mmol/L) 65–75 4.8 8.61-Pentanol amount (%,V/V) 4.9–5.1 4.5 2.3pH 2.9–3.1 3.1 3.6Flow rate (mL/min) 0.95–1.05 5.4 8.8
Imazalil SDS concentration (mol/L) 65–75 2.9 1.61-Pentanol amount (%,V/V) 4.9–5.1 9.9 5.5pH 2.9–3.1 6.5 4.5Flow rate (mL/min) 0.95–1.05 5.9 8.2
n=3.
290 J O U R N A L O F E N V I R O N M E N T A L S C I E N C E S 4 2 ( 2 0 1 6 ) 2 8 4 – 2 9 2
outdoor weather conditions: without controlling the temper-ature, under the sunlight and warm during the day and indarkness and cold during the night. The flask was thoroughlysealed to avoid water evaporation. An aliquot was analyzedeach day (nearly at noontime), and the peak area wasmeasured for each pesticide. The results can be seen in Fig. 2.
The four pesticides show a detectable and continuousdegradation process. On the first day, the peak area hasdiminished (5%–10%). This decrease continues during thefollowing days, and the analytes become undetectable at theeighth day. TBZ undergo a slow decomposition rate during thefirst six days, since the peak area diminishes nearly 20%during this period. Furthermore, the degradation accelerated,and in only two days the concentration of TBZ falls up tobelow the detection limit. PYR and OPP show a similarbehavior, the peak area lessens at a nearly constant rate of7% per day during the seven first days, and fully decompose inone more day. On the other hand, IMZ undergoes a ratherlinear degradation during seven days, when the concentrationattains undetectable values.
It was deduced that the four pesticides are significantlyaffected by the sun radiation and the high temperatures inaqueous media, and remain a short period. Even using highconcentration as initial conditions, they fall to undetectablelevels in only eight days.
0
20
40
60
80
100
120
0 1 2 3 4 5 6 7 8 9t (day)
A (
arb
itra
ry u
nit
)/A
0
TBZ
PYR
OPP
IMZ
Fig. 2 – Plot of the ratio peak area/initial peak area for thestudied pesticides v.s. storage time under outdoorconditions.
2.4. Analysis of wastewater samples
The concentration of TBZ, PYR, OPP and IMZ was determinedin several samples from agricultural sewage, fruit-processingindustry waste, and WWTP influent and effluent water fromthe Castelló area. The origin and the concentrations can beseen in Table 2. The analytes were resolved without interfer-ences. Fig. 3 shows the chromatogram obtained by analysis ofsample 15.
2.4.1. Optimization of the experimental procedureSeveral samples had sludge or oily drops suspended in theaqueous matrix. These samples were filtered, and directlyinjected, as the aliquot. The pressure does not change, and thenneither precipitation nor obstruction in the needle, column orchromatographic tubes was noticed. Thus, the sample was notdiluted, allowing to keep a reasonable sensitivity level.
Fig. 3 – Chromatogram of sample 15, collected from theinfluent water stream of a wastewater treatment plant.

291J O U R N A L O F E N V I R O N M E N T A L S C I E N C E S 4 2 ( 2 0 1 6 ) 2 8 4 – 2 9 2
This possibility of direct injection, previous filtration,without dilution, clean-up or extraction step can be consid-ered as the main advantage of the method. The simplificationof the experimental procedure allows to reach good quality ofthe validation results, while minimizing the participation oftrained staff, and strongly shortening the analysis time, thenfavoring the analysis of a large amount of samples. Besides,neither chemical nor extraction instrumentation are needed,reducing the cost, the environmental impact and the safety ofthe operator.
2.4.2. Results in real samplesWastewater samples from agricultural origin show a signifi-cant concentration of TBZ and PYR. This indicates that thesepesticides are pre-harvest applied to crops, and remain insludge, prior to be dragged to rain water to the wastewater.The collector basins of the fruit-processing plants contain asignificant amount of TBZ, OPP and IMZ, those used for post-harvest protection. However, considering the large quantity ofpesticides needed to assess a correct storage of the fruits,the results indicate that the plants have implemented apurification treatment to partially purify the wastewater priordischarge.
The influent stream of WWTPs contains a moderateconcentration of the TBZ, PYR, OPP and in one case, IMZ,because they come from areas with a strong agriculture-relatedactivity. The pesticides in effluents were lower than in influent,ensuring the validity of the water purification process.
3. Conclusions
The here-described MLC-method can be used to monitor TBZ,PYR, OPP and IMZ in routine analysis of sewage water. Thesample was directly injected into the chromatographic systemafter a simple filtration, thus avoiding complex and timeconsuming intermediate steps. The analytes were identifiedand elutedwithout interferences from thewastewatermatrix inless than 18 min. As main features, we highlight the low globalanalysis time, and the easy-to-handle sample preparation,which permits the analysis of a large amount of samples perday. The method was validated in terms of quantitation range,linearity, precision, trueness and ruggedness, following theValidation and Peer Review of US EPA for chemical methods ofanalysis. The method meets the requirements of “greenchemistry”, as low amount of toxic reagents are used, thenreducing thewaste of pollutants andminimizing the danger forthe operator health. Besides, the method is quite inexpensive,and then making it accessible even to laboratories with loweconomic power. The stability of the pesticides in water atoutdoor conditions was evaluated. Finally, the method wasapplied to determine the concentration of TBZ, PYR, OPP andIMZ in sewage water from an area with a strong fruit-relatedactivity, and suspected to be contaminated.
Acknowledgments
This work was supported by the projects P1-1B2012-36(Universitat Jaume I) and 11I358.01 (FACSA).
R E F E R E N C E S
Agriculture and Environment Research Unit, 2014. PesticideProperties Database. University of Hertfordshire, Hertfordshire,UK (Available at: http://sitem.herts.ac.uk/aeru/ppdb/en/index.htm (Accessed: 09/10/2015).
Baggiani, C., Baravalle, P., Giraudi, G., Tozzi, C., 2007. Molecularlyimprinted solid-phase extraction method for thehigh-performance liquid chromatographic analysis of fungicidepyrimethanil in wine. J. Chromatogr. 1141 (2), 158–164. http://dx.doi.org/10.1016/j.chroma.2006.12.016.
Beltrán-Martinavarro, B., Peris-Vicente, J., Rambla-Alegre, M.,Marco-Peiró, S., Esteve-Romero, J., Carda-Broch, S., 2013.Quantification of melamine in drinking water and wastewaterby micellar liquid chromatography. J. AOAC Int. 96 (4), 870–874.http://dx.doi.org/10.5740/jaoacint.12-248.
Berthod, A., García-Álvarez-Coque, M.C., 2000. Micellar liquidchromatography. In: Cazes, J. (Ed.), Chromatographic SeriesSience 83. Marcel Dekker, New York, NY, USA.
Burden, J., Wills, R.B.H., 1989. Prevention of post-harvest foodlosses fruits, vegetables and root crops a trainingmanual. FAO,Rome, Italy (Available at: www.fao.org/docrep/T0073E/T0073E00.htm#Contents (Accessed: 19/01/2016)).
Cacho, C., Turiel, E., Pérez-Conde, C., 2009. Molecularly imprintedpolymers: an analytical tool for the determination ofbenzimidazole compounds in water samples. Talanta 78 (3),1029–1035. http://dx.doi.org/10.1016/j.talanta.2009.01.007.
Capella-Peiró, M.E., Bose, D., Durgbanshi, A., Gil-Agustí, M.T.,Carda-Broch, S., Esteve-Romero, J., 2004. Determination ofcarbamate pesticides using micellar liquid chromatography.Indian J. Chem. Sect A 43A, 1417–1422 (Available at: http://nopr.niscair.res.in/bitstream/123456789/20387/1/IJCA%2043A%287%29%201417-1422.pdf (Accessed: 19/01/2016)).
Chin-Chen, M.L., Rambla-Alegre, M., Durgbanshi, A., Bose, D.,Mourya, S.K., Esteve-Romero, J., et al., 2012. Micellar liquidchromatographic determination of carbaryl and 1-naphthol inwater, soil, and vegetables. Int. J. Anal. Chem. 2012, 809513.http://dx.doi.org/10.1155/2012/809513.
CHROMacademy, 2015. The Theory of HPLC ChromatographicParameters. Crawford Scientific, Strathaven, UK (Available at:http://www.chromacademy.com/lms/sco2/Theory_Of_HPLC_Chromatographic_Parameters.pdf (Accessed: 19/01/2016)).
Esteve-Romero, J., Carda-Broch, S., Gil-Agustí, M.T., Capella-Peiró,M.T., Bose, D., 2005. Micellar liquid chromatography for thedetermination of drugmaterials in pharmaceutical preparationsand biological samples. TrAC Trends Anal. Chem. 24 (2), 75–91.http://dx.doi.org/10.1016/j.trac.2004.11.003.
European Commission, 2008. Directive 2008/105/EC of the EuropeanParliament and of the Council of 16 December 2008 onenvironmental quality standards in the field of water policy,amending and subsequently repealing Council Directives 82/176/EEC, 83/513/EEC, 84/156/EEC, 86/280/EEC. OJEC L348: 84–97.Available at http://eur-lex.europa.eu/legal-content/EN/TXT/PDF/?uri=CELEX:32008L0105&from=EN (Accessed: 19/01/2016).
Gao, Z., Wu, Y., Zhao, H., Ji, F., He, Q., Li, S., 2012. Concentrationdetermination of new fungicide in river water byultrasound-assisted emulsification micro-extraction andreversed-phase high performance liquid chromatography. Anal.Methods 4 (8), 2365–2368. http://dx.doi.org/10.1039/C2AY25372K.
Gil-Agustí, M., Alvarez-Rodríguez, L., Monferrer-Pons, L., Bose, D.,Durgbanshi, A., Esteve-Romero, J., 2002. Chromatographicdetermination of carbaryl and other carbamates in formulationsand water using Brij-35. Anal. Lett. 35 (10), 1721–1734. http://dx.doi.org/10.1081/AL-120013051.
Langenbach, T., 2013. Persistence andbioaccumulation of persistentorganic pollutants (POPs) (chapter 13). In: Patil, Y.B., Rao, P. (Eds.),Applied Bioremediation — Active and Passive Approaches.InTech, Rijeka, Croatia (Available at: http://www.intechopen.

292 J O U R N A L O F E N V I R O N M E N T A L S C I E N C E S 4 2 ( 2 0 1 6 ) 2 8 4 – 2 9 2
com/books/applied-bioremediation-active-and-passive-approaches/persistence-and-bioaccumulation-of-persistent-organic-pollutants-pops-#SEC15 (Accessed: 19/01/2016)).
Liang, H.C., Bilon, N., Hay, M.T., 2014. Analytical methods forpesticide residues. Water Environ. Res. 86 (10), 2132–2155.http://dx.doi.org/10.2175/106143014X13975035526185.
Liu, K.F., Feng, R., Zhang, Y.P., Chen, J., Bai, L.Y., 2014. Selectivesolid-phase extraction of bisphenol A using a novel stir barbased on molecularly imprinted monolithic material. J. Chin.Chem. Soc.-TAIP 61 (4), 420–424. http://dx.doi.org/10.1002/jccs.201300568.
Miller, J.N., Miller, J.C., 2010. Statistics and Chemometrics forAnalytical Chemistry. sixth ed. Pearson Education Limited,Harlow, UK.
Montoliu-Vidal, A., 2010. Physiological Responses of Citrus UnderBiotic and Abiotic Stress Conditions. Common and SpecificAspects Ph.D. Thesis Universitat Jaume I, Castelló, SpainAvailable at: http://www.tdx.cat/bitstream/handle/10803/22656/montoliu.pdf (Accessed: 19/01/2016)).
Peris-Vicente, J., Casas-Breva, I., Roca-Genovés, P., Esteve-Romero,J., 2014. Application of micellar liquid chromatography for thedetermination of antitumoral and antiretroviral drugs inplasma. Bioanalysis 6 (14), 1975–1988. http://dx.doi.org/10.4155/bio.14.154.
Picón-Zamora, D., Martínez Galera, M., Garrido Frenich, A.,Martinez-Vidal, J.L., 2000. Trace determination ofcarbendazim, fuberidazole and thiabendazole in water byapplication of multivariate calibration to cross-sections ofthree-dimensional excitation–emission matrix fluorescence.Analyst 125 (6), 1167–1174. http://dx.doi.org/10.1039/A909886K.
Rambla-Alegre, M., Peris-Vicente, J., Marco-Peiró, S., Beltrán-Martinavarro, B., Esteve-Romero, J., 2010. Development of ananalytical methodology to quantify melamine in milk usingmicellar liquid chromatography and validation according to EURegulation 2002/654/EC. Talanta 81 (3), 894–900. http://dx.doi.org/10.1016/j.talanta.2010.01.034.
Romero-Cano, R., Kassuha, D., Peris-Vicente, J., Roca-Genovés, P.,Carda-Broch, S., Esteve-Romero, J., 2015. Analysis of
thiabendazole, 4-tert-octylphenol and chlorpyrifos in wasteand sewage water by direct injection — micellar liquidchromatography. Analyst 140 (5), 1739–1746. http://dx.doi.org/10.1039/c4an01782j.
Santaladchaiyakit, Y., Srijaranai, S., 2012. A simplifiedultrasound-assisted cloud-point extraction method coupledwith high performance liquid chromatography for residueanalysis of benzimidazole anthelmintics in water and milksamples. Anal. Methods 4 (11), 3864–3873. http://dx.doi.org/10.1039/C2AY25569C.
Smilanick, J.L., 2011. Integrated approaches to postharvest diseasemanagement in California citrus packinghouses. ActaHorticult. 905, 145–148 (Available at: http://ucce.ucdavis.edu/files/datastore/234-2136.pdf (Accessed: 19/01/2016)).
The FEM Method Validation Team, Mishalanie, E.A., Lesnik, B.,Araki, R., Segall, R., Munch, D.J., Wasko, M., et al., 2005.Validation and Peer Review of U.S. Environmental ProtectionAgency Chemical Methods of Analysis. U.S. EnvironmentalProtection Agency, Washington, D.C., USA (Available at: http://www2.epa.gov/sites/production/files/2015-01/documents/chemmethod_validity_guide.pdf (Accessed: 19/01/2015)).
Tian, Q., Zhou, Z., Lv, C., Yang, J., 2012. Direct enantiomericseparation of chiral pesticides by liquid chromatography onpolysaccharide-based chiral stationary phases under reversedphase conditions. Anal. Methods 4 (8), 2307–2317. http://dx.doi.org/10.1039/C2AY05890A.
Torres-Lapasió, J.R., 2000. Michrom Software. Marcel Dekker, NewYork, NY, USA.
US EPA, 2015. Pesticides (Available at: http://www.epa.gov/pesticides/ (Accessed: 19/01/2016)).
Yu, Y., Huang, Q., Wang, Z., Zhang, K., Tang, C., Cui, J., et al., 2001.Occurrence and behavior of pharmaceuticals, steroidhormones, and endocrine-disrupting personal care products inwastewater and the recipient river water of the Pearl RiverDelta, South China. J. Environ. Monit. 13 (4), 871–878. http://dx.doi.org/10.1039/c0em00602e.

JOURNAL OF ENVIRONMENTAL SCIENCES环境科学学报(英文版)
www.jesc.ac.cn
Aims and scopeJournal of Environmental Sciences is an international academic journal supervised by Research Center for Eco-Environ-mental Sciences, Chinese Academy of Sciences. The journal publishes original, peer-reviewed innovative research andvaluable findings in environmental sciences. The types of articles published are research article, critical review, rapidcommunications, and special issues.The scope of the journal embraces the treatment processes for natural groundwater, municipal, agricultural and industrialwater and wastewaters; physical and chemical methods for limitation of pollutants emission into the atmospheric environ-ment; chemical and biological and phytoremediation of contaminated soil; fate and transport of pollutants in environments;toxicological effects of terrorist chemical release on the natural environment and human health; development of environ-mental catalysts and materials.For subscription to electronic editionElsevier is responsible for subscription of the journal. Please subscribe to the journal via http://www.elsevier.com/locate/jes.For subscription to print editionChina: Please contact the customer service, Science Press, 16 Donghuangchenggen North Street, Beijing 100717, China.Tel: +86-10-64017032; E-mail: [email protected], or the local post office throughout China (domestic postcode:2-580).Outside China: Please order the journal from the Elsevier Customer Service Department at the Regional Sales Officenearest you.Submission declarationSubmission of the work described has not been published previously (except in the form of an abstract or as part of apublished lecture or academic thesis), that it is not under consideration for publication elsewhere. The publication shouldbe approved by all authors and tacitly or explicitly by the responsible authorities where the work was carried out. If themanuscript accepted, it will not be published elsewhere in the same form, in English or in any other language, includingelectronically without the written consent of the copyright-holder.EditorialAuthors should submit manuscript online at http://www.jesc.ac.cn. In case of queries, please contact editorial office, Tel:+86-10-62920553, E-mail: [email protected]. Instruction to authors is available at http://www.jesc.ac.cn.
Journal of Environmental Sciences (Established in 1989)Volume 42 2016
Supervised by Chinese Academy of Sciences Published by Science Press, Beijing, China
Sponsored by Research Center for Eco-Environmental Elsevier Limited, The Netherlands
Sciences, Chinese Academy of Sciences Distributed by
Edited by Editorial Office of Journal of Domestic Science Press, 16 Donghuangchenggen
Environmental Sciences North Street, Beijing 100717, China
P. O. Box 2871, Beijing 100085, China Local Post Offices through China
Tel: 86-10-62920553; http://www.jesc.ac.cn Foreign Elsevier Limited
E-mail: [email protected] http://www.elsevier.com/locate/jes
Editor-in-chief X. Chris Le Printed by Beijing Beilin Printing House, 100083, China
CN 11-2629/X Domestic postcode: 2-580 Domestic price per issue RMB ¥ 200.00