Pub 059 (1995) Shear zones as a new type of palaeostress indicator
14
Pergamon Journal of Srructwal Geology, Vol. 17. No. 5, pp. 663 to 676. 1995 Copyright 0 1995 Elscvier Science Ltd Printed in Great Britain. All rights reserved 0191-8141/95 $9.50+0.00 0191-8141(94)00084-0 Shear zones as a new type of palaeostress indicator DEEPAK C. SRIVASTAVA,* RICHARD J. LISLE and SARA VANDYCKE Laboratory for Strain Analysis, Department of Earth Sciences, University of Wales, Cardiff CFI 3YE, U.K. (Received 13 September 1993; accepted in revised form 21 July 1994) Abstract-This paper proposes that shear zones act as palaeostress indicators in much the same way as brittle faults. Several hundred shear zones, from both the limbs of the Variscan Langland-Mumbles anticline (South Wales), are treated using the graphical and numerical methods of fault slip analysis. Estimated palaeostress directions derived from shear zones are characterized by greater scatter than where brittle faults are used as stress indicators. An important reason for this is the fact that on some shear zones the direction of maximum shear stress (slip lineation) is not perpendicular to the line of SIC intersection. As a consequence, the use of slip lineations produces better solutions than cases where the slip direction is inferred as a line perpendicular to the SIC intersection. The filtering of data to reduce the scatter in the results produces insignificant improvement and is considered unnecessary. INTRODUCTION Palaeostress and strain analyses provide useful con- straints for understanding the geodynamic evolution of the deformed tectonites (Tobisch et al. 1977, Letouzey 1986, Bergerat 1987, and others). A necessary require- ment for the application of these analyses is the avail- ability of suitable markers or indicators to serve as input data. Numerous types of strain markers (e.g. oolites, pebbles, fossils, boudins, syntectonic fibres and defor- mation twins) have already been recognized resulting in a wealth of literature on strain analyses (Ramsay & Huber 1983). On the other hand, only a limited range of tectonic structures (e.g. joints, stylolites and brittle faults) are traditionally used for palaeostress analysis (Engelder & Geiser 1980, Hancock 1985, BCnard et al. 1990). With the exception of Lisle (1989a) who used sheared dykes as palaeostress indicators, the advanced methods of fault slip analysis have so far only been applied to meso-faults. In many geological situations, such a restrictive approach results in a limitation of palaeostress analysis either for the reason that a suf- ficient number of meso-faults are not exposed or that these faults do not contain lineations revealing unam- biguously the sense and direction of movement. In order to broaden the scope of fault slip analysis we have attempted to use shear zones as stress indicators. APPROACH To test the usefulness of shear zones as palaeostress indicators, we examined shear zones in the Eastern Gower Peninsula, near Swansea, South Wales (Fig. la). This area is particularly suitable for our objectives as meso-scale shear zones are developed abundantly and the structural setting is rather simple (George 1940, *Present address: Department of Earth Sciences, University of Roorkee, Roorkee 247 667, India. Roberts 1979, Hyett 1990). Here, a Lower Carbonifer- ous sequence of carbonate rocks was folded into an anticlinal structure (the ‘Langland-Mumbles anticline’, Hyett 1990) during the Variscan orogeny (Fig. 1b). This fold is characterized by a large interlimb angle (IloO- 136”), steeply dipping axial plane and a low axial plunge (17” towards N104”, Figs. lb & c). A series of N-S striking, oblique slip faults with predominant strike-slip component (George 1940) cuts through the Langland- Mumbles anticline as regional-scale transverse struc- tures (Fig. lb). We have selected four sites (Tutt Head, Rams Tor, Pier Head and Middle Head) to test the use of shear zones as palaeostress indicators. Two of these sites (Tutt Head and Rams Tor) are located on the southern limb and the other two (Pier Head and Middle Head) fall on the northern limb of the Langland-Mumbles anticline (Fig. lb). We describe, in brief, the geometrical charac- teristics of two types of shear zones, ductile shear zones and brittle-ductile shear zones, present at each of the four sites. Ductile shear zones Two distinct sets of ductile shear zones with typical S- C foliations (Berth6 et al. 1979) occur commonly in these rocks (Fig. 2a). The sense of movement is ‘top-to-the- north’ and ‘top-to-the-south’ in the first and second sets, respectively. Several lines of evidence including offset of the beds and fossils (Fig. 2b), deflection of pre-existing bedding-normal stylolites, the sense of movement of hangingwalls and the occurrence of ‘pop-up’ structures (Fig. 2c), all suggest a dominantly thrust type of move- ment on both sets of shear zones. That the deformation producing shear zones had no effect on the wall rocks is amply demonstrated by the undistorted shapes of fossil corals (Fig. 2b). In this regard, these shear zones are similar to brittle faults. The conjugate nature of the two sets of ductile shear zones is evident from the inconsistency of their cross- 663
Transcript of Pub 059 (1995) Shear zones as a new type of palaeostress indicator
Pergamon Journal of Srructwal Geology, Vol. 17. No. 5, pp. 663 to 676. 1995
Copyright 0 1995 Elscvier Science Ltd Printed in Great Britain. All rights reserved
0191-8141/95 $9.50+0.00
0191-8141(94)00084-0
Shear zones as a new type of palaeostress indicator
DEEPAK C. SRIVASTAVA,* RICHARD J. LISLE and SARA VANDYCKE
Laboratory for Strain Analysis, Department of Earth Sciences, University of Wales, Cardiff CFI 3YE, U.K.
(Received 13 September 1993; accepted in revised form 21 July 1994)
Abstract-This paper proposes that shear zones act as palaeostress indicators in much the same way as brittle faults. Several hundred shear zones, from both the limbs of the Variscan Langland-Mumbles anticline (South Wales), are treated using the graphical and numerical methods of fault slip analysis.
Estimated palaeostress directions derived from shear zones are characterized by greater scatter than where brittle faults are used as stress indicators. An important reason for this is the fact that on some shear zones the direction of maximum shear stress (slip lineation) is not perpendicular to the line of SIC intersection. As a consequence, the use of slip lineations produces better solutions than cases where the slip direction is inferred as a line perpendicular to the SIC intersection.
The filtering of data to reduce the scatter in the results produces insignificant improvement and is considered unnecessary.
INTRODUCTION
Palaeostress and strain analyses provide useful con- straints for understanding the geodynamic evolution of the deformed tectonites (Tobisch et al. 1977, Letouzey 1986, Bergerat 1987, and others). A necessary require- ment for the application of these analyses is the avail- ability of suitable markers or indicators to serve as input data. Numerous types of strain markers (e.g. oolites, pebbles, fossils, boudins, syntectonic fibres and defor- mation twins) have already been recognized resulting in a wealth of literature on strain analyses (Ramsay & Huber 1983). On the other hand, only a limited range of tectonic structures (e.g. joints, stylolites and brittle faults) are traditionally used for palaeostress analysis (Engelder & Geiser 1980, Hancock 1985, BCnard et al. 1990). With the exception of Lisle (1989a) who used sheared dykes as palaeostress indicators, the advanced methods of fault slip analysis have so far only been applied to meso-faults. In many geological situations, such a restrictive approach results in a limitation of palaeostress analysis either for the reason that a suf- ficient number of meso-faults are not exposed or that these faults do not contain lineations revealing unam- biguously the sense and direction of movement. In order to broaden the scope of fault slip analysis we have attempted to use shear zones as stress indicators.
APPROACH
To test the usefulness of shear zones as palaeostress indicators, we examined shear zones in the Eastern Gower Peninsula, near Swansea, South Wales (Fig. la). This area is particularly suitable for our objectives as meso-scale shear zones are developed abundantly and the structural setting is rather simple (George 1940,
*Present address: Department of Earth Sciences, University of Roorkee, Roorkee 247 667, India.
Roberts 1979, Hyett 1990). Here, a Lower Carbonifer- ous sequence of carbonate rocks was folded into an anticlinal structure (the ‘Langland-Mumbles anticline’, Hyett 1990) during the Variscan orogeny (Fig. 1 b). This fold is characterized by a large interlimb angle (IloO- 136”), steeply dipping axial plane and a low axial plunge (17” towards N104”, Figs. lb & c). A series of N-S striking, oblique slip faults with predominant strike-slip component (George 1940) cuts through the Langland- Mumbles anticline as regional-scale transverse struc- tures (Fig. lb).
We have selected four sites (Tutt Head, Rams Tor, Pier Head and Middle Head) to test the use of shear zones as palaeostress indicators. Two of these sites (Tutt Head and Rams Tor) are located on the southern limb and the other two (Pier Head and Middle Head) fall on the northern limb of the Langland-Mumbles anticline (Fig. lb). We describe, in brief, the geometrical charac- teristics of two types of shear zones, ductile shear zones and brittle-ductile shear zones, present at each of the four sites.
Ductile shear zones
Two distinct sets of ductile shear zones with typical S- C foliations (Berth6 et al. 1979) occur commonly in these rocks (Fig. 2a). The sense of movement is ‘top-to-the- north’ and ‘top-to-the-south’ in the first and second sets, respectively. Several lines of evidence including offset of the beds and fossils (Fig. 2b), deflection of pre-existing bedding-normal stylolites, the sense of movement of hangingwalls and the occurrence of ‘pop-up’ structures (Fig. 2c), all suggest a dominantly thrust type of move- ment on both sets of shear zones. That the deformation producing shear zones had no effect on the wall rocks is amply demonstrated by the undistorted shapes of fossil corals (Fig. 2b). In this regard, these shear zones are similar to brittle faults.
The conjugate nature of the two sets of ductile shear zones is evident from the inconsistency of their cross-
663

664 D. C. SRIVASTAVA. R. J. LISLE and S. VANDYCKE
Fig. 1. (a) Location of the study area. (b) Geological and structural map of the study arca (double and single headed arrows represent axial tract and axis of the Langland-Mumbles anticline, respectively. F-Fault with down throw side; formation boundaries and fault traces, after Geological Survey of Great Britain 1971). (c)L ower hemisphere, equal area projection of
166 poles to the bedding (/&fold axis of the Langland-Mumbles anticline. contours- I-1@20-30% per 1% area).
cutting relationships, nearly equal numbers and opposite sense of displacement in the complementary sets (Fig. 2c) and the development of ‘hour-glass’ struc- tures at their intersection zones (Fig. 2d). These hour- glass structures, defined by S-foliations are formed upon the locking-up of two shear zones belonging to comp- lementary sets. One consequence of the development of hour-glass structures is that the same foliation is shared by both the sets within the intersection zones suggesting their conjugate nature and synchronous development (Fig. 2e).
On the basis of the nature of their internal fabric. three types of ductile shear zones can be distinguished in order of decreasing abundance, (a) shear zones consist- ing of closely spaced pressure solution seams (S- foliations; Fig. 2a), (b) those consisting of mm-thick and very closely spaced (5 1 mm) en Cchelon calcite veins, and (c) those containing both the pressure solution seams and calcite veins (Fig. 2f). Despite the morpho- logical similarities, the pressure solution seams defining S-foliations in the shear zones are younger than the bedding-normal stylolites. The latter are often deflected as pre-existing markers across the shear zones. Intense foliation located asymmetrically at the shear zone tips reflect high strains associated with the decay of relative displacement at the terminations of shear zones (Fig. 3a; Ramsay & Allison 1979).
Brittle-ductile shear zows
Brittle-ductile shear zones defined by the boundaries of cm-m scale en echelon calcite veins occur as conju-
gate pairs of dextral and sinistral sets (Fig. 3b). These two sets classify as type-1 conjugate pairs of Beach (1975) on the basis of the fact that the boundary of shear zones of one set is parallel to the veins within the complementary set (Fig. 3b). In the Langland-Mumbles area, the brittle-ductile shear zones differ from the ductile shear zones in the following respects. Firstly, the brittle-ductile shear zones show both dextral and sinis- tral types of strike-slip motion, whereas the ductile shear zones show thrust type of movement. Secondly, most brittle-ductile shear zones contain en 6chelon veins whereas the ductile shear zones consist mostly of press- ure solution seams. Finally and most significantly, on all the outcrops where the two types of shear zones occur together, the brittle-ductile shear zones always cut through the ductile shear zones. From these lines of field evidence, we conclude that the brittle-ductile shear zones are younger than the ductile shear zones in the Langland-Mumbles area. Thus the geometry and cross- cutting relationships suggest two shearing events arising from different stress states that can be determined by treating the ductile shear zones and brittle-ductile shear zones separately.
ASSUMPTIONS
Despite the fact that we have assumed that the shear zones behave like brittle faults for the purpose of palaeostress analysis there is a basic difference between these two types of structures. Faults develop in the elastic field whereas shear zones develop in the brittle-

Shear zones as palaeostress indicators
Fig. 2. (a) A typical ‘top-to-the-south’ ductile shear zone (N020”/35”E) showing well developed S-C fabric (length of shear zone 1.5 m). (b) ‘Top-to-the-north’ ductile shear zone (N012”/25”E) offsetting a coral. Note the undeformed shape of the coral (diameter of fossil 2 cm), (c) A conjugate pair of the ductile shcarzones showing pop-up structure formed due to thrust type of movement on both the sets [the orientations of ‘top-to-the-north’ (sinistral) and ‘top-to-the-south’ (dextral) shear zones arc N107”145”S and N023”/31”E, respectively. Diameter of coin 2.4 cm]. (d) An hour-glass structure formed due to the locking up of the complementary sets of a ductile shear zone [the orientations of ‘top-to-the-north’ (sinistral) and ‘top-to- the-south’ (dextral) shear zones are N073”/45”S and N002”/30”E, respectively. Diameter of lens cover 5.5 cm]. (c) Hour- glass structure with an area (indicated by arrow) of foliation which is shared by both shear zones [the orientations of ‘top-to- the-north’ (sinistral) and ‘top-to-the-south’ (dcxtral) shear zones are N110”/50”S and N347”/31”E, respectively, diameter of coin 2.4 cm]. (f) En echelon calcite veins and orthogonally oriented, widely spaced pressure solution seams (indicated by arrow) defining the internal fabric within a ‘top-to-the-north ductile shear zone oriented N005”/27”S. (Diameter of coin 2.4
cm.) Location (a) and (c)-(f) Tutt Head; (b) Middle Head.

Fig. 3. NOW/ set is p
D. C. SRIVASTAVA. R. J. LISLE and S. VANDYCKE
Intense foliations in the shortening sector around the tip of a ‘top-to-the-north’ ductile shear ZOI (diameter of coin 2.3 cm). (b) Beach type-l conjugate pair of brittle-ductile shear zones. The bound
lel to the veins in the complementary set (the orientation of the dcxtral and sinistral sets are N172 N203”/70”W. rcspcctivcly, length of compass 9 cm). Location for (a) & (b) Tutt Head.
oric mtcd ry of each 77”8 f and
666

Shear zones as palaeostress indicators
Ductile shear zones Brittle-ductile shear zones
l P (= o,) axis AC, axis 0T (= 0,) axis Fig. 4. An example of results from the P-T axes method (lower hemisphere, equal area projections). The intermediate stress axes (a2 shown as triangles) are determined by finding the poles to 01-u3 planes. (a) One hundred and eleven ductile
shear zones from Tutt Head. (b) One hundred and twenty-five brittle-ductile shear zones from Tutt Head.
667
ductile or ductile regime and have a relatively long deformation history. In our examples, the shear zones are developed only on mm-m scale and are widely spaced so they contribute little to the regional structural geometry of the area.
The methodology of fault-slip analysis requires (a) slip on all the shear zones in response to a single, homogeneous state of stress, and (b) parallelism be- tween the slip lineation and the direction of maximum resolved shear stress on each shear zone. Commonly, the nature of exposure is such that the C-surface of the shear zone is not available for the direct measurement of the slip lineation. To solve this problem, we have measured the orientation of internal fabric viz., S- foliation in ductile shear zones and veins in brittle- ductile shear zones. The slip direction on the C-surface is assumed to be the line which is perpendicular to the line of intersection of the shear zone (C-surface) and the internal fabric. This assumption of the slip direction being perpendicular to the SIC intersection has been tested independently by directly measuring slip lineation in a few cases and comparing their orientations with the inferred slip directions.
One distinct advantage of using shear zones is the obvious sense of movement for every shear zone; slip sense on faults is frequently ambiguous. The slip sense is indicated unambiguously by the angular relationships between the internal fabric (S-foliation or vein) and the shear zone boundary (C-surface; Simpson & Schmid 1983).
METHODS
Several techniques for palaeostress analysis have been devised and modified during the last couple of decades (McKenzie 1969, Etchecopar et al. 1981, Gephart & Forsyth 1984, Michael 1984, Aleksandrowski 198.5, Lisle Sd 17:5-E
1987, Angelier 1990, Marrett & Allmendinger 1990). All the methods aim at inverting the field data to find the stress tensor responsible for the observed slips on variably oriented faults, assuming that the motion on faults occur in the direction of maximum resolved shear stress. These methods allow the determination of the orientations of three principal stress axes (a, 2 a2 2 03) and a parameter expressing the relative shape of the stress ellipsoid (R in Lisle 1989a and @ in Angelier 1990).
We have analysed shear zone data by both the graphi- cal and numerical methods applied normally to striated faults. The graphical methods include the P-T axes method (Stauder 1962), the right dihedra method (Pegaroro 1972, Angelier & Mechler 1977) and the right trihedra method of Lisle (1988). The numerical analysis includes the direct inversion and four-dimensional ex- ploration methods of Angelier (1990). The graphical forms of analysis are simple and easy to visualize as stereograms showing the potential fields for principal stress directions. Once the results from graphical methods are available, the results from numerical methods serve as a check and add to the accuracy of the results. Several recent papers elaborate these methods in detail (Aleksandrowski 1985, Angelier 1990, Lisle 1992).
The P-T axes method, originally devised to find stresses from calcite twins (Turner 1953) is commonly applied to estimate stresses from focal planes of earth- quakes (Stauder 1962). In this method, a movement plane containing the slip lineation and the pole to the shear zone is constructed. The P and T axes, best estimates of the o1 and o3 axes, respectively, are located in the movement plane at 45” and 135” from the slip lineation using the correct sense of movement. The intermediate axis (u2) is defined by the normal to the movement plane. In the P-T analysis of shear zones, the o?-axis happens to coincide with the line of intersection

668 D. C. SRIVASTAVA, R. J. LISLE and S. VANDYCKE
DUCTILE SHEAR ZONES
Right Dihedra Method
Right Trihedra Method
( ) 01
Right Trihedra Method
( ) 03
Direct Inversion Method
Tutt Head Rams Tor Pier Head Middle Head
Fig. 5. Site-wise results of palaeostress analysis of ductile shear zones. (a)-(d) Ductile shear zones with slip lineations (M- magnetic north, N-geographic north). (e)-(h) R esults from the dihedra method (most likely orientations of the ut- and us- axes are shown by the maximum and the minimum contours filled in black and white, respectively). (i)-(p) Results from the trihedra method [most likely positions of the o,- and os- axes are shown in the Figs. (i)-(l) and (m)-(p), respectively]. (q)-(t) Results from the direct inversion method (inward and outward arrows indicate the directions of the maximum compression and the maximum extension, respectively, cross indicates pole to bedding). Total number of the analysed shear zones at the sites Tutt Head, Rams Tor, Pier Head and Middle Head are 111. 91, 35 and 26, respectively; contour% per 1% area-(e) 1&5&7&8fS90, (f) ltS5&6fL70-80, (g) 20-X&7&80, (h) 10-5&6&70-90, (i) & (j) 30-40-50, (k) 40-45-50, (I) 30-40-50,
(m) 40-45-50, and (n)-(p) 30-40-50. All lower hemisphere, equal area projections.

Shear zones as palaeostress indicators 669
BRITTLE- DUCTILE
SHEAR ZONES
Right Dihedra Method
Right Trihedra Method
( ) 01
Right Trihedra Method
( 1 03
Direct Inversion Method
Tutt Head Rams Tor Pier Head Middle Head
Fie. 6. Site-wise results of nalaeostress analvsis of the brittle-ductile shear zones. (a)-(d) Brittle-ductile shear zones with sli; lincations. (e)-(h) ResLlts from the dihcdra method (most likely positions of the (7,. and u3-axes are shown by the maximum and the minimum contours filled in black and white in each diagram. respectively). (i)-(p) Results from the trihedra method [most likely positions of the u, and 97. axes are shown in the Figs. (i)-(l) and (m)-(p), respectively]. (q)-(t) Results from the direct inversion method (inward and outward arrows indicate directions of the maximum compression and the maximum extension, respectively, cross indicates pole to bedding). Total number of the analysed brittle-ductile shear zones at the sites Tutt Head, Rams Tor. Pier Head and Middle Head are 125,27,38 and 11, respectively; contour% per 1% area -(e)-(g) 10-60-70-80-90. (h) l-77-88-99, (i) 3&3540, (j) 30-40, (k) 30-3540, (I) 504G70, (m) 3WM5-50, (n)
30-3540, (0) 4N5-50, and (p) 50-70. All lower hemisphere, equal area projections.

670 D. C. SRIVASTAVA, R. J. LISLE and S. VANDYCKE
Table 1. Results of palaeostress analyses of ductile shear zones by the P-T axes method, right trihedra method and direct inversion method (DIR WV). TH-Tutt Head, RT-Rams Tor, PH-Pier Head, MH-Middle Head
(7, axis (azimuth/amount)
q axis (azimuth/amount)
u3 axis (azimuth/amount)
Shape of the stress
ellipsoid
Site
Tri- Dir Tri- Dir Tri- Dir No. hedra inv hedra inv hedra inv R of P-T (Lisle (Angelier P-T
data axes &i&y (ALnryer P-T
axes 1988) 1990) axes (LiLi; (yYy;;er (Lisle (AnElier
1989a) 1990)
TH 111 210/08 201/13 212112 115/28 034/77 121103 315161 291/03 020177 0.01 0.01 RT 91 208/18 20905 20X8 295/71 310/34 296109 356169 102/53 052170 0.25 0.20 PH 35 021/24 333/01 352119 328160 241128 087/15 148183 072/62 214166 1.50 0.60 MH 26 353103 357113 354/09 292164 161176 100/60 259153 284/08 259128 0.09 0.08
Table 2. Results of palaeostress analyses of brittle-ductile shear zones by the P-T axes method, right trihedra method and direct inversion method. Abbreviations for sites same as in Table 1
Shape of the (7, axis q axis q axis stress
(azimuth/amount) (azimuth/amount) (azimuth/amount) ellipsoid
Tri- Dir Tri- Dir Tri- Dir No. hedra inv hedra inv hedra inv R
Site Of data P-T ‘11;:; (Ap$er P-T axes axes
(LL;; (~9ge$er P-T axes
(LX& (A;g$er (Lisle (A;ie$er 1989a)
TH 125 201110 198105 19WO6 321171 105136 306169 109117 299153 106/20 1.38 0.58 RT 27 169/11 202/17 011)/13 295/7-l 096142 257159 076114 289147 107127 0.31 0.24 PH 38 193/22 193/08 2@2/ I 7 328/60 089/60 325162 095119 286129 105122 0.54 0.35 MH 11 185/08 187/11 lXWO7 292164 070167 295165 091/25 283120 096124 0.61 0.38
Table 3. Measures of data dispersion indicating the degree of inhomogeneity (scatter) in the results from ductile shear zones given in Table 1. Abbreviations for sites same as in Table 1. ANG-the average angle between the observed slip direction and the direction of maximum shear stress. RUP-a function of the ANG and the amount of the maximum shear stress, PC,,,,-
percentage of the shear zones compatible with the results
Site
P,<X,l Ptotal RUP ANG (4 (41)
No. of (Angelier (Angelier (Lisle (Lisle data 1988) 1988) 1990) 1990)
TH RT PH MH
111 64% 36” 57.17% 57.75% 91 67% 36” 59.91% 58.89% 35 73% 41” 52.66% 53.47% 26 71% 43” 61.44% 58.98%
Table 4. Measures of data dispersion indicating the degree of inhomogeneity (scatter) in the results from brittle-ductile shear zones given in Table 2. Abbreviations for sites same as in Table 1.
ANG. RUP and P,,,;,,-same as in Table 3
Site
TH RT PH MH
RUP ANG No. of (Angelier (Angelier data 1988) 1988)
125 73% 47” 27 83% 55” 38 77% 51” 11 68% 34”
P,O,,l (4
(Lisle 1990)
P,CXd (33)
(Lisle 1990)
50.23% 47.79% 51.71% 70.23%
51.56% 50.17% 51.49% 79.01%
Table 5. Comparison of results from the two methods of generating the slip direction data (example from ductile shear zones at the Tutt Head and Rams Tor sites). The degree of heterogeneity in these results is given in the Figs. 9(c)-(j) in terms of ANG, RUP and P,,,,l%
uI axis (azimuth/amount)
u2 axis (azimuth/amount)
u3 axis (azimuth/amount)
Shape of the stress
ellipsoid
Method for determining slip direction
Tri- Dir Tri- Dir Tri- Dir No. hedra inv hedra inv hedra inv R of P-T
data axes k& (Angelier P-T
1990) axes CLi& (Afr,t,q$er P-T
axes $8”; (A;EFer (Lisle (AnLlier
1989a) 1990)
Directly measured slip lineation Normal to S/C inter- section
22 018/02 178/08 195/01 108110 082/39 104118 280180 284/49 289172 1.32 0.57
22 019/03 218/OY 206103 110/05 318/37 298136 255184 132153 112154 0.22 0.18
Shear zones as palaeostress indicators
Ductile shear zones
671
Paleostress results
Original set Site -Tutt Head
N = 111 ANG = 36” RUP =64% COH = 71% 0 = 0.01
Subset 1
(a subset of the original set)
Subset 2 (a subset of the subset 1)
69
+ G A
i
Subset 3 (a subset of the subset 2)
(g)
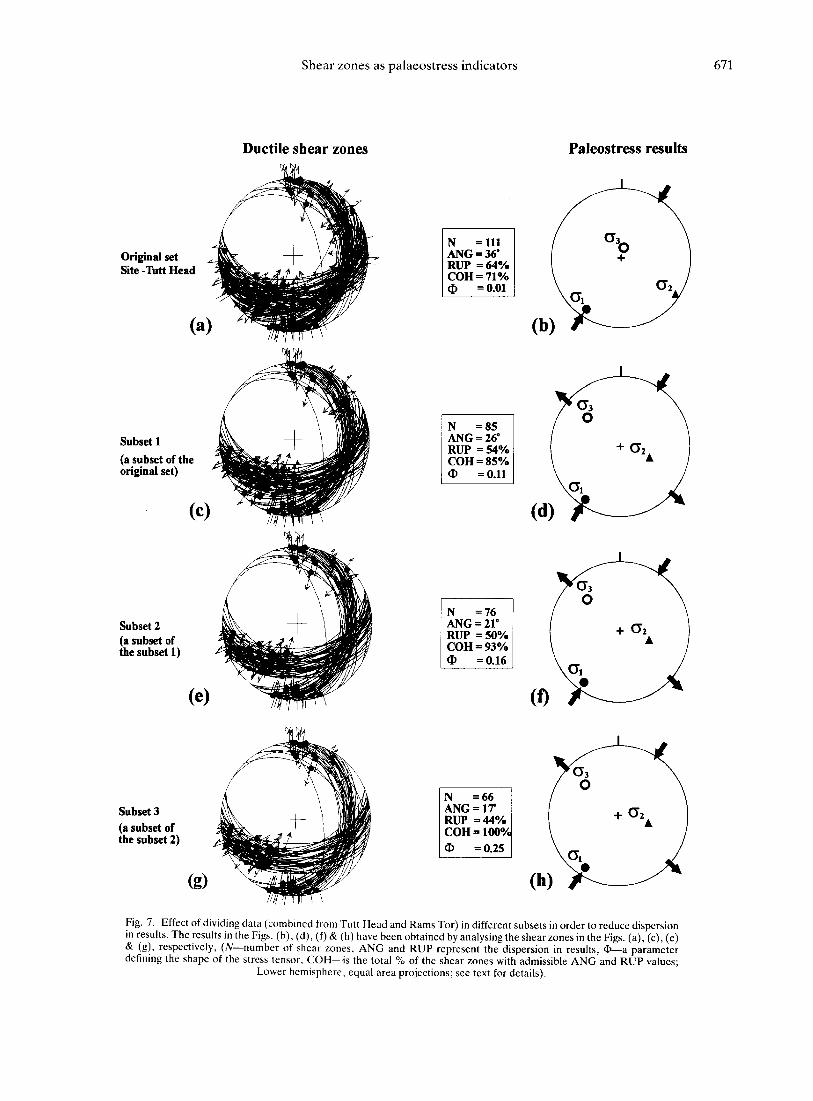
Fig. 7. Effect of dividing data (combined from Tutt Head and Rams Tor) in different subsets in order to reduce dispersion in results. The results in the Figs. (b). (d), (f) & (h) have been obtained by analysing the shear zones in the Figs. (a), (c). (e) & (8). respectively, (W-number of shear zones, ANG and RUP represent the dispersion in results, @-a parameter defining the shape of the stress tensor, COH-is the total % of the shear zones with admissible ANG and RUP values;
Lower hemisphere, equal area projections: see text for details).

672 D. C. SR[VASTAVA, R. J. LISLE and S. VANDYCKE
/
Angular ’
i
, s Directly measured slip lineation diffemce
Direction normal to S/C intersection
Fig. 8. Angular difference (measured in the plane of shear zone) between directly measured and reconstructed slip direction in 22 ductile shear zones combined from Tutt Head and Rams Tor sites
(lower hemisphere, equal area projections).
of shear zone boundary (C-surface) and internal fabric (S-foliation or vein) as the slip direction is assumed to be 90” from the SIC intersection line. The objective of using this method is to gain an initial impression of the results (Fig. 4). The main limitations of this method, however, arise from the implicit assumptions that (a) the defor- mation occurs under plane strain conditions, and (b) the fault planes are the planes of the maximum shear stress.
The right dihedra method is based on the principle that the shear zone and the auxiliary plane (containing the normal to the shear zone and a line within the shear zone at 90” from the slip lineation) constitute a right dihedron dividing the stereogram in two opposite pairs of quadrants, one defining the field containing the ol- axis, the other delimiting the field for the q-axis (McKenzie 1969, Angelier & Mechler 1977). This method examines each three-dimensional direction in turn and assigns a value to it denoting its suitability as a potential al-axis. The suitability is defined by determin- ing the proportion of the sample of faults for which the direction in question lies in the al-quadrant. The nu- merical values associated with each direction are con- toured. On the stereographic output. this orientation is represented as a field enclosed by the contour maxi- mum. Conversely, the contours of minimum values enclose the position of +-axis for most of the shear zones (Figs. 5e-h and 6e-h).
If the movement plane (the plane parallel to the fault’s normal and its movement vector) is added to the right dihedron the resulting set of three mutually perpendicu- lar planes form a right trihedron. The right trihedra
method further narrows down the fields for the maxi- mum and minimum stress axes. This is achieved by applying an additional condition, namely that the ul- and 03-axes must also lie in opposite pair of quadrants defined by the intersection of the auxiliary plane and the movement plane. With these boundary conditions, the program for the right trihedra method (‘ROMSA’ in Lisle 1988) calculates the likelihood for each possible orientation being parallel to the maximum principal stress (al-axis). The points giving maximum likelihood are revealed by a contoured stereogram. The contour maxima indicates the directions that are common to the o,-trihedra for the maximum number of shear zones (Figs. 5i-1 and 6i-1). In contrast to the right dihedra method, in the right trihedra method the lowest values obtained during the search of al-axis do not automati- cally and necessarily signify the orientation of q-axis. For this reason, a separate search for ax-axis is made in the right trihedra method (Figs. 5m-p and 6m-p).
Numerical methods developed and refined by Ange- lier (1984, 1990) lead to the determination of the reduced stress tensor defined by the orientations of the three principal stress axes and the shape of stress ellip- soid (a). We have used the ‘direct inversion’ and the ‘four-dimensional exploration’ methods of Angelier (1984, 1990). The underlying principle in both the methods involves minimization of the angle between slip lineation measured in the field and the direction of maximum shear stress calculated theoretically for every given shear zone of known orientation and sense of movement. The merits of ‘direct inversion’ over ‘four- dimensional exploration’ method are discussed in detail by Angelier (1990).
The numerical methods also yield two important measures of data dispersion viz. the ‘ANG’ and the ‘RUP’ indices (Angelier 1990). The parameter ANG defines the average angle between the slip lineation and the direction of the maximum shear stress computed from the estimated stress tensor. Although the value of ANG can range from 0“ to 180”, in general, the results with average ANG of less than 4.5” are considered to be satisfactory (Angelier 1990). The second measure, RUP, is a function of the parameter ANG and the relative level of resolved shear stress magnitude. The value of RUP can vary between 0% and 200% corre- sponding to the ANG values from 0” to 180”, respect- ively. A critical analysis by Angelier (1990) reveals that the satisfactory palaeostress results from faults generally have a RUP value ~50%.
The number of shear zones compatible with the com- puted stress tensor is given by Ptotal% in the right trihedra method of Lisle (1988). In the numerical methods, the percentage of shear zones with acceptable ANG and RUP values is denoted by a parameter called COH (Angelier 1984). Both Pt,,t,,,% and COH% indi- cate the goodness of results and are directly correlatable with each other.
The relative magnitude of stresses is expressed by the shape parameters R in the trihedra method and CD in the direct inversion method (Lisle 1989a, Angelier 1990).

DUCTILE SHEAR ZONES
Right Dihedra Method
Right Trihedra Method
( 1 01
Right Trihedra Method
( 1 02
Direct Inversion Method
Shear zones as palaeostress indicators
Directly measured lineations
Reconstructed lineations
w e Rtotai=85%
673
Fig. 9. Comparison of the results of palaeostress analysis of 22 ductile shear zones from the Tutt Head and Rams Tor sites. (a) Ductile shear zones with directly measured slip lineations. (b) Ductile shear zones with slip directions reconstructed by finding normal to the S/C intersection. (c) & (d) Results from the dihedra method (contour% 5-70-8G90 and 5-80-90-99, respectively). (e) & (f) Results from the trihedra method showing the most likely orientations of or- axes. Contour % 60- 70-80 in both the diagrams. (g) & (h) Results from the trihedra method showing the most likely orientations of us- axes. Contour % 50-60-80 and 50-60-70, respectively. (i) & (j) Results from the direct inversion method (arrows indicate the direction of the maximum compression). P,,,,,, ANG and RUP are explained in text. All lower hemisphere, equal area
projections.

674 D. C. SRIVASTAVA, R. J. LISLE and S. VANDYCKE
Both these parameters represent the ratio of differential shearing. As a consequence of the axially symmetrical stresses [R = (a*--us) / (oi+*) and @ = (aTus) / (ai-as)] stress ellipsoid, orientation of the u2- and u3-axes were and are related by an expression @ := R/(1 + R). An interchangeable. The instability in the orientations of a2 advantage of R over @ is the fact that the former can be and u3-axes, revealed particularly well by the great circle represented on a Flinn diagram which can be con- girdle patterns in the results from the trihedra method veniently divided into constriction al (0~) > R > l), plane (Figs. 5m-p), ’ p is ossibly a consequence of the low values (R = 1) and flattening (1 > R > 0) types of the stress of the parameters R and @. The sub-vertical and sub- states (Fig. 5 in Lisle 1989a). The abscissa and ordinate horizontal orientations of the 02- and u3-axes, respect- of such a Flinn diagram represent axially symmetric ively, shown by the direct inversion method at the compression (R = 0) and axially symmetric extension (R Middle Head site are due to the combined effects of the = m), respectively. symmetry of stress (low R value) and the scanty develop-
ment of shear zones (Fig. 5t).
RESULTS Development of the brittle-ductile shear zones in a strike-slip regime
The site-wise results of palaeostress analyses of the ductile- and brittle-ductile shear zones are summarized The results from all the methods (except the dihedra
in Figs. 5 and 6 and Tables 1 and 2. For all sites, the same method due to presence of several sub-maxima) reveal
data are analysed by the P-Taxes, the right dihedra, the that brittle-ductile shear zones developed in a strike slip
right trihedra, the direct inversion (DIR INV) and the regime with sub-horizontal ul- and q-axes directed
four-dimensional exploration methods. As both the towards NNE and ESE, respectively (Figs. 6i-t).
direct inversion and four-dimensional exploration In contrast to the ductile shear zones, the brittle-
methods gave identical results, we present here only the ductile shear zones indicate remarkably consistent
results from the direct inversion method (Figs. 5q-t and orientations of the principal axes on both limbs of the
6q-t). Langland-Mumbles anticline (Fig. 6 and Table 2). It is
Only one representative diagram showing the results evident that the brittle mode of deformation was more
from the P-T axes method is given (Fig. 4). For each dominant during this event as a result of which the en
site, all the principal axes orientations obtained by the echelon fractures (veins) were developed regardless of
P-T axes method are further analysed by an orientation the orientation of the local bedding planes. The brittle-
tensor procedure which takes into account the fact that ductile shear zones are distinctly post-folding structures
the mean principal axial orientations must possess an and probably related to the regional-scale transverse
orthogonal relationship (Lisle 1989b). The results of faults with predominant strike-slip component in the
such statistical analysis of the P-T data are tabulated area (Fig. lb).
under the column of P-T axes in the Tables 1 and 2.
Development of the ductile shear zones in a thrust regime LIMITATIONS AND SOURCES OF ERROR
The results of palaeostress analysis from the ductile Our results show larger variability in comparison to shear zones reveal sub-horizontal orientations of the ul- the typical fault slip analysis results normally obtained and u2-axes at all the sites suggesting the development of by using brittle faults as the palaeostress indicators these shear zones in a compressive and thrust tectonic (Angelier 1990). These dispersions, reflected by the regime (Figs. 5q-s). The cri-axis is oriented NNE on the high values of the parameters ANG and RUP and the southern limb (sites: Tutt Head and Rams Tor) and N-S low values of PI,,,,% (Tables 3 and 4), are indicative of to NNW on the northern limb (sites: Pier Head and the fact that a significant number of shear zones may not Middle Head) of the Langland-Mumbles anticline. As be compatible with the computed stress tensors. the unfolding did not bring the orientations of the One reason for large dispersion in the results could be principal stresses on the two limbs any closer, the that the shear zones produced under different stress hypothesis that these shear zones were developed prior conditions have been grouped together in one data set. to the folding is not demonstrable. Despite the fact that In order to test this hypothesis, we subdivided the data the precise age of shearing with respect to folding of the ductile shear zones (from the Tutt Head site) into remains unresolved, the difference in orientation of the different subsets by rejecting the shear zones with larger shear zones on opposite limbs suggests that the orien- values of the ANG (> 45”) in the three successive steps tation of mechanical inhomogeneity in form of bedding (Fig. 7). The data selected (with ANG < 4.5”) at the end surfaces had a significant control on the orientation of of the first, second and third runs were analysed success- the ductile shear zones. ively by the direct inversion method (subsets 1 to 3. Fig.
In general, the values of R and @ are very low (< < 1, 7). Table 1) suggesting a relatively high ul and approxi- With the progressive decrease of the sample size in the matelv eaual magnitudes of Us and Us during the ductile d 1 _T ~~~~~ .~~. .~....... successive runs, significant improvements in the average

Shear zones as palaeostress indicators 675
ANG and RUP values were achieved and eventually all the shear zones during the fourth run (COH = 100%) satisfied the conditions of acceptable ANG and RUP values (Fig. 7h). It is important to emphasize that in spite of these variations, neither the orientations of the principal stresses nor the symmetry of the stress ellipsoid (Q) showed any significant change in the four sets of the results (Fig. 7). This consistency in the orientations of the principal axes and the shape of the stress ellipsoid (regardless of the sample size and the scatter in the result) along with the total lack of any geological evi- dence to suggest more than one generation of the ductile- or brittle-ductile-shear zones confirms that the large dispersion in our results is not due to the grouping of shear zones belonging to different stress tensors into a single data set.
The second possibility to account for the large disper- sion may be the degree to which the assumption of the perpendicularity between the direction of maximum shear stress and the SIC intersection line is satisfied. In order to test the validity of this assumption, we have examined 22 shear zones (combined from Rams Tor and Tutt Head sites) that contain both calcite fibres parallel to the slip direction as well as SIC fabrics. For the same orientation of shear zones, two sets of data are gener- ated, one with the directly measured slip lineations and the other with the slip directions reconstructed by deter- mining a line perpendicular to the SIC intersection on the shear zone surface. For most of the shear zones the orientations of the directly measured and the recon- structed directions are close to each other (Fig. 8). In exceptional cases, however, the angular difference be- tween the reconstructed directions of maximum shear stress and the directly measured lineations can be as much as 55”.
Both the sets of data have been analysed by the P-T axes, the right-dihedra and -trihedra and the numerical methods (Fig. 9 and Table 5). A critical comparison of the results reveals broadly consistent patterns in all the diagrams (Fig. 9). One of the main effects of recon- structing the slip lineations is the lowering of R and Cp values (Table 5). As a consequence of this, the 02- and oJ-axes are somewhat differently oriented in the results from the direct inversion method (Figs. 9i-j and Table 5).
The other major effect of reconstructing the slip directions is reflected on the measures of the data dispersion (Fig. 9). In general, the values of RUP in the direct inversion method and ANG in the four- dimensional exploration method tend to be higher in the case of reconstructed shear directions. Similarly. a lower percentage of total faults (Protar%) is compatible with results from the right trihedra method during the search of both the ol- and as-axes.
On the basis of these results we suggest that the higher RUP, ANG and lower P,,,,,% in our analysis (Fig. 9) are largely a consequence of reconstructing the slip direc- tions and the fact that these slip directions are at signifi- cant angular departure from the directly measured slip lineations, at least, in a few cases (Fig. 8). A greater
degree of the homogeneity in the results from the brittle- ductile shear zones at Middle Head site (last row in the Table 4) is mainly due to the fact that the data available on this site are not sufficient in number to reflect the true heterogeneity of the sample.
DISCUSSION
Our results of an earlier thrust and later strike-slip event as well as the orientations of the principal axes during these two events are similar to those found by Roberts (1979) by an extensive study of tectonic joints in this area. Both the similarity in the pattern of stereo- graphic results from different sites (Figs. 5 and 6) and the consistency of stress axes orientations obtained by different methods at individual sites further corroborate the validity of the results. These results are also consist- ent with an early thrust and late strike-slip motions in other fold and thrust belts (e.g. in the Appalachian Valley and Ridge, see Srivastava & Engelder 1990).
The palaeostress analysis of shear zones in the Langland-Mumbles area reveals a significant variation in the style of deformation (faulting) with the change in state of stress. At a time when the vertical stress (0,) corresponded to the minimum principal stress (oj), and thus when the mean stress was relatively high, the deformation was ductile type leading to the formation of abundant meso-scale ductile shear zones. With the low- ering of the mean stress, implicit from the change of (0,) to become (02), the ductile behaviour gave way to brittle deformation characterized by abundant Beach type-1 en echelon veining in the area.
In spite of a larger scatter, our results demonstrate that the fault slip methods are applicable to the shear zones for the purpose of palaeostress analysis. As dis- cussed earlier, the reason for larger scatter is the fact that in some shear zones the direction of maximum shear stress has a significant angular departure from the in- ferred slip directions.
If the veins within either set of conjugate shear zone represent extension fractures (mode-I), two different orientations of as-axes, each perpendicular to veins in the set, are indicated by a given conjugate pair. Clearly, the Beach type-1 vein systems are indicative of hetero- geneous stresses on the scale of shear zones themselves and would seem to represent an obstacle for the appli- cation of our stress analysis. The results of palaeostress analysis, however. combine numerous data from both the sets and represent an integrated stress tensor on the scale of whole area or site and not on the scale of individual shear zones.
At least, in the study area, there is no geological evidence to suggest more than one phase of brittle- ductile- or ductile-shearing. In such cases, we recom- mend that the data must not be subdivided into different subsets in order to just reduce dispersion in the results. Geological evidence for sorting data into different sub- sets is most critical and must be sought.

676
CONCLUSIONS
Both ductile shear zones and brittle-ductile shear zones are suitable for palaeostress analysis by the fault slip methods. In areas where the slip lineations can be measured directly on the shear zone surface, the degree of homogeneity in results can be expected to be compar- able to those obtained from the brittle faults. Recon- structing the slip directions contributes to a greater scatter in the results and in all such cases the assumption of slip lineation being normal to the S/C intersection must be tested by as many direct measurements as possible.
Despite limitations, the shear zones serve as useful palaeostress indicator as these structures reveal an unambiguous sense of the movement. In the absence of compelling geological evidence, the classification of data into different subsets with an objectiv,e of improving the homogeneity in the results can be insignificant geologi- cally.
Acknowledgements-We are grateful to Professor J. Angclier for permission to use his program ‘TENSOR’ and to Dr Norman Fry for fruitful discussions. Thoughtful reviews by Professor Terry Engelder, Professor C. W. Passchier and Dr R. C. M. W. Franssen improved the paper greatly. This work was funded by the ‘Marie Curie award’ of the European Communities to DCS.
REFERENCES
Aleksandrowski, P. 1985. Graphical determin&ion of principal stress directions for slickenside lincation population: An attempt to modify Arthaud’s method. J. Struct. Crol. 7, 73-82.
Angelier, J. 1984. Tectonic analysis of fault slip data sets. J. geophys. Res. 89.5835-5848.
Angelier, J. 1990. Inversion of ficld data in fault tectonics to obtain the regional stress-III. A new rapid direct inversion method by analyti- cal means. Int. J. Geophys. 106. 3633376.
Angelier, J. & Mechler, P. 1977. Sur une methodc graphique de recherche des contraintes prmcipales Cgalemcnt utilisable en tecto- nique et en s@ismologie: la methode des dittlres droites. Bull. geol. Sot. Fr. 19, 1309-1318.
Beach, A. 1975. The geometry of en Cchclorr vein arrays. Tecrono- physics 28,245-263.
Benard, F., Mascle, A., Le Gall. B., Doligez, B. & Rossi, T. 1990. Palaeostress fields in the Variscan foreland during Carboniferous, microstructural analysis in the British Isles. Tectonophysics 177, l- 13.
Bergerat, F. 1987. Stress fields in the platforrr at the time of Africa- Eurasia collision. Tectonics 6. 99-132.
Berthe, D., Choukroune, P. & Jeguouzo. P. 1979. Orthognciss. mylonite and noncoaxial deformation of granites: the example of the South Armorican shear zone. J. Struct. (;eol. 1. 3142.
Engelder, T. & Geiser, P. 1980. On the USC of regional joint sets as
D. C. SRIVASTAVA, R. J. LISLE and S. VANDYCKE
trajectories of palaeostress fields during the development of the Appalachian plateau. J. geophys. Res. 85, 6319-6341.
Etchecopar, A., Vasseur, G. & Daigenieres, M. 1981. An inverse problem of microtectonics for the determination of stress tensors from fault striation analvsis. J. Struct. Geol. 3, 51-56.
Gephart, J. W. & Forsyth, D. W. 1984. An improved method for determining the regional stress tensor using earthquake focal mech- anism data: an application to the San Fernando earthquake se- quence. J. geophys. Rex 89,9305-9320.
Geological Survey of Great Britain 1971. Ordnance survey sheet SS- 68-NW on 1: 10, 560 or 6 inches to 1 mile scale.
George, T. N. 1940. The structure of Gower. Q. J. geol. Sot. Land. 96, 131-198.
Hancock, P. L. 1985. Brittle microtectonics; principles and practice. J. Struct. Geol. 7, 437-457.
Hyett, A. J. 1990. Deformation around a thrust tip in Carboniferous Limestone at Tutt Head near Swansea, South Wales. J. Struct. Geol. 12,47-58.
Letouzey, J. 1986. Cenozoic palaeostress pattern in the Alpine fore- land and the structural interpretation in a platform basin. Tectono- physics 132,215-231.
Lisle, R. J. 1987. Principal stress orientation from faults: an additional constraint. Annls Tectonicue 1, 155-158.
Lisle, R. J. 1988. ROMSA: a basic program for palaeostress analysis using fault striation data. Comput. and Geosci. 14, 255-259.
Lisle, R. J. 1989a. Palaeostress analysis from sheared dike sets. Bull. geol. Sot. Am. 101.968-972.
Lisle, R. J. 1989b. The statistical analysis of orthogonal orientation data. J. Geol. 97,360-364.
Lisle, R. J. 1992. New method of estimating regional stress orien- tations: an application to focal mechanism data of recent British earthquakes. Int. J. Geophys. 110,27&282.
Marrett, R. & Allmendinger, R. 1990. Kinematic analysis of the fault- slip data. .I. Struct. Geol. 12, 973-986.
McKenzie, D. P. 1969. The relation between fault plane solutions for earthquakes and the direction of principal stresses. Bull. seism. Sot. Am. 59,591-601.
Michael. A. 1984. Determination of stress from slip data: fault and folds. J. geophys. Res. 89, 1 I ,517-I 1,526.
Pegaroro. 6, 1972. Application de la microtectonique a une etude de neotectoniaue. Le Golfe Maliacme (Grece centrale). Thesis, University of Montpellier. ’
Ramsay, J. G. & Allison, I. 1979. Structural analysis of shear zones in an Alpinized Hercynian granite, Maggia Nappe, Penine zone, Central Alps. Schweiz. miner. petrogr. Mitt. 59, 251-279.
Ramsay, J. G. & Huber, M. I. 1983. The Techniques of Modern Structural Geology (volume I: Strain Analysis). Academic Press, London.
Roberts, J. C. 1979. Jointing and minor structuresofthe South Gower, ocninsula between Mumbles Head and Rhossilli Bay, South Wales. i’eol. J. 14. l-14.
Simpson, C. & Schmid. S. 1983. An evaluation of criteria to deduce the scnsc of movement in sheared rocks. Bull. geol. Sot. Am. 94, 1281-1288.
Srivastava, D. C. & Engeldcr. T. 1990. Crack propagation sequence and pore-fluid evolution during fault-bend folding in the Appala- chian Valley and Ridge. central Pennsylvania. Bull. geol. Sot. Am. 102, 116-128.
Staudcr, W. 1962. The focal mechanism of earthquakes. In: Advances in Geophysics (edited by Landsberg, H. E. & van Mieghem, J.). 9, l-71. Academic Press, London.
Tobisch, 0. T., Fiske. R. S., Sacks, S. & Taniguchi, D. 1977. Strain in metamorphosed volcaniclastic rocks and its bearing on the evolution of orogcnic belts. Bull. geol. Sot. Am. 88, 23110.
Turner, F. J. 1953. Nature of dynamic interpretation of deformation lamcllac in calcite of three marbles. Am. J. Sci. 251, 276298.