Special Economic Zones - PHD Chamber
48
Special Economic Zones Performance, Problems and Opportunities A survey based empirical study on SEZs in India April 2017 PHD Research Bureau PHD CHAMBER OF COMMERCE AND INDUSTRY PHD House, 4/2 Siri Institutional Area, August Kranti Marg New Delhi 110016 Phone: 91-11-49545454, Fax 91 11 49545451 Email [email protected], Website www.phdcci.in
-
Upload
khangminh22 -
Category
Documents
-
view
4 -
download
0
Transcript of Special Economic Zones - PHD Chamber
Special Economic Zones Performance, Problems and Opportunities
A survey based empirical study on SEZs in India
April 2017
PHD Research Bureau PHD CHAMBER OF COMMERCE AND INDUSTRY
PHD House, 4/2 Siri Institutional Area, August Kranti Marg New Delhi 110016
Phone: 91-11-49545454, Fax 91 11 49545451
Email [email protected], Website www.phdcci.in

2
PHD Research Bureau
3
PHD Research Bureau
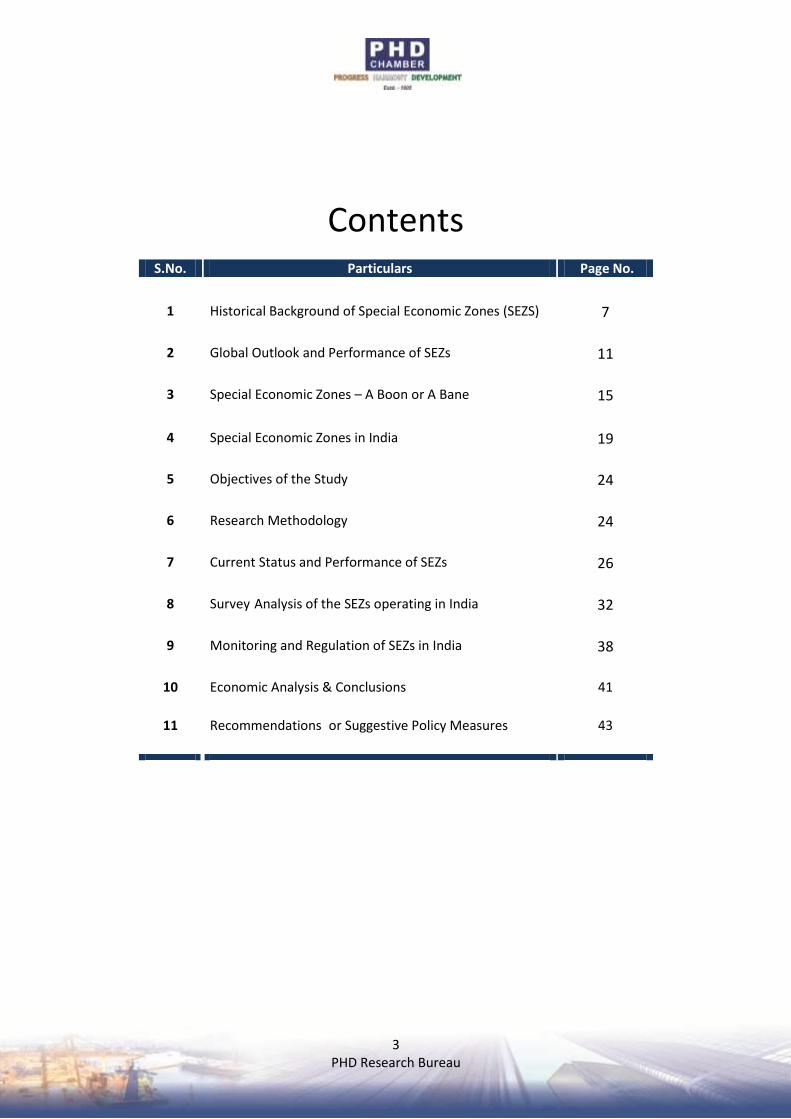
Contents
S.No. Particulars Page No.
1 Historical Background of Special Economic Zones (SEZS) 7
2 Global Outlook and Performance of SEZs 11
3 Special Economic Zones – A Boon or A Bane 15
4 Special Economic Zones in India 19
5 Objectives of the Study 24
6 Research Methodology 24
7 Current Status and Performance of SEZs 26
8 Survey Analysis of the SEZs operating in India 32
9 Monitoring and Regulation of SEZs in India 38
10 Economic Analysis & Conclusions 41
11 Recommendations or Suggestive Policy Measures 43
4
PHD Research Bureau
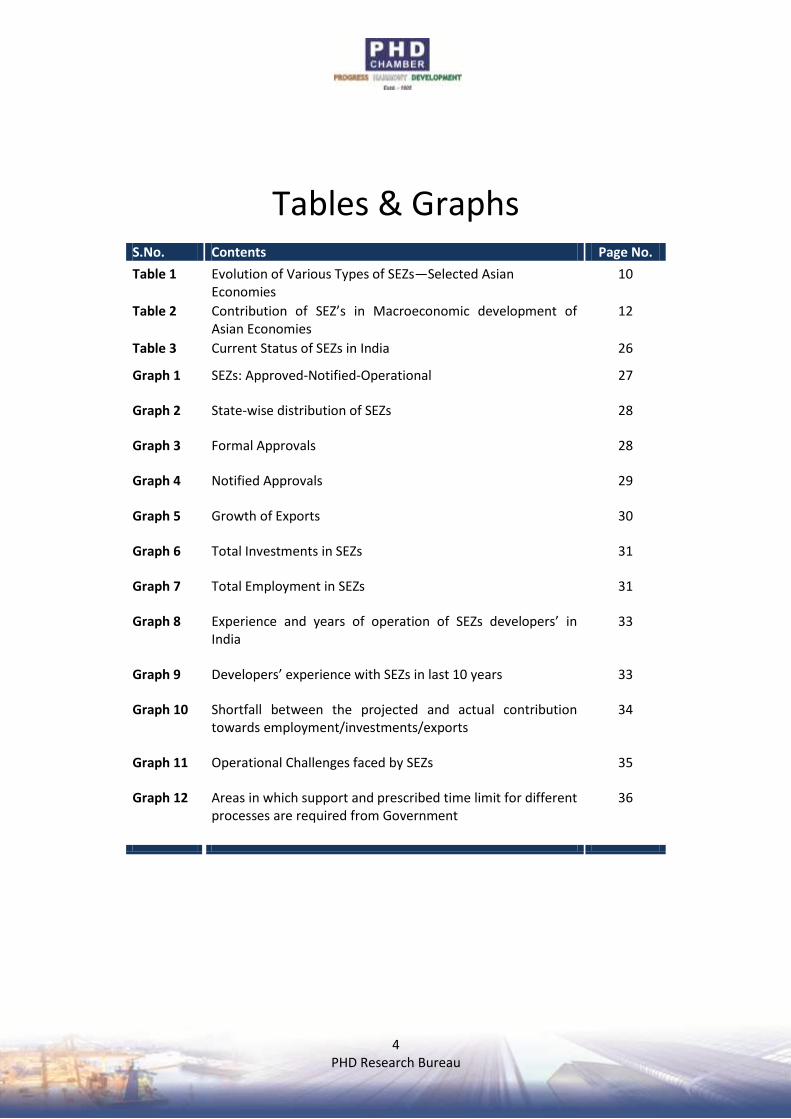
Tables & Graphs
S.No. Contents Page No.
Table 1 Evolution of Various Types of SEZs—Selected Asian Economies
10
Table 2 Contribution of SEZ’s in Macroeconomic development of Asian Economies
12
Table 3 Current Status of SEZs in India 26
Graph 1 SEZs: Approved-Notified-Operational 27
Graph 2 State-wise distribution of SEZs 28
Graph 3 Formal Approvals 28
Graph 4 Notified Approvals 29
Graph 5 Growth of Exports 30
Graph 6 Total Investments in SEZs 31
Graph 7 Total Employment in SEZs 31
Graph 8 Experience and years of operation of SEZs developers’ in India
33
Graph 9 Developers’ experience with SEZs in last 10 years 33
Graph 10 Shortfall between the projected and actual contribution towards employment/investments/exports
34
Graph 11 Operational Challenges faced by SEZs 35
Graph 12 Areas in which support and prescribed time limit for different processes are required from Government
36
5
PHD Research Bureau
Executive Summary
The Asian economies have been using Special Economic Zones (SEZs) as a way to initiate or expand export oriented manufacturing and to promote structural changes more broadly through linkages and demonstration effects. They take their cues mainly from successful East Asian economies that began virtuous growth spirals in the late 1960s and early 1970s. By the 1970s, Zones of various kinds were multiplying, but with mixed results. Nevertheless, their popularity increased over the years with the “miracle of Shenzhen” serving as beacon. Thereafter, Special Economic Zones (SEZs) have been recognized as an important mechanism for trade and investment promotion, creation of infrastructure, employment generation, promotion of regional development, increase in foreign exchange earnings, improving export competitiveness and transfer of skills & technology. In East economies, like China, which launched SEZs on a scale not seen previously, provided a platform for attracting FDI and not only supported the development of China’s export oriented manufacturing sector, but also served as a catalyst for sweeping economic reforms that later were extended throughout the country. In Southeast Asia, Malaysia was the first ASEAN country to adopt an EPZ program in 1971. It was followed by the Philippines (1972), Indonesia (1973) and Thailand (1978) respectively. India witnessed remarkable growth in number of formal, notified and operational approvals post enactment of SEZ Act in 2005, formal approvals have been granted for setting up of 405 SEZs, of which 329 have been notified and 32 have been given In-Principal Approvals as on 31st December, 2016. While, 206 SEZs are operational and around 4218 units are approved within the SEZs as on 31st December, 2016. The spread of SEZs within the States is to achieve balanced growth across all regions of the country. To illustrate, in Andhra Pradesh most of its SEZs are situated in vicinity of the Capital city, Hyderabad. The scenario is similar in other States as well. This might have been because the States could not be fully involved in the SEZs scheme and have not even framed their respective SEZs Act/Policy. The sector wise distribution of SEZ’s clearly shows that majority of the formal approvals granted have been in IT/ITES sector which comprises nearly 64% of the total formal approvals granted till date. This can be as a result of India’s growing prowess in the IT/ITES Sector and availability of trained manpower resulting in outsourcing of such activities to India. Other prominent sectors include; Biotech, Multi Product, Pharma, Engineering etc in addition to 19 formally approved multi-product SEZs. The SEZ scheme in India has shown a tremendous growth in infrastructure investment, employment and exports. Exports have touched Rs. 4,67,337 crore in 2016 vis-à-vis Rs. 22,000 crore in 2005; similarly investment was Rs. 4,06,690 crore till Sep 2016 in comparison to Rs. 4,000 crore in 2005. SEZs have witnessed four-fold generation of
6
PHD Research Bureau
employment from around 3.3 lakh persons in FY2008 to around 16.8 lakh persons in FY2016. As per the survey analysis for reviewing the performances of SEZs in India, we got to understand the SEZs’ developers/units view-points relating to the issues of SEZs and their expectations with regard to the stability in the policy environment and incentives to operate in the SEZs. Almost all the SEZs’ developers/units unanimously felt that, hardly there is any significant export benefits that are left to operate within the SEZs in India over to operate within its DTA. Around 38% of the developers’ found their experience as ugly with respect to acquisition of land process for SEZ and getting permission from the custom authorities or DC and 38% termed their experience as bad with respect to sanctions of claims; process of de-notification & exit. According to the survey, almost 79% of the respondents’ found slowdown in global demand and lack of incentives to operate in the SEZs as major challenges faced by developers. Around 73% of the developers pointed to instability in the policy environment and unfavorable regulatory environment as major hurdles, around 68% of the developers found slowdown in global demand and unfavorable regulatory environment as major hurdles whereas 62% of the respondents termed lack of incentives to operate in the SEZs as the significant challenge. The survey found that with respect to support and fixed time period for different processes, almost all the respondents (93%) felt that a fixed time period needs to be prescribed for getting fast notification by Board of Approval (BOA). However, 87% of the respondents felt that the permission from the custom authorities; 79% of the respondents felt that timely redressal of grievances by UAC/BOA and granting of NOC from various authorities for exiting from SEZ scheme. While, it is observed that SEZs developers/units are facing several challenges in terms of procedural complications; cumbersome land acquisition processes; higher taxes and so on. In the wake of assessing the efficacy of SEZs in India, PHD Chamber has conducted a comprehensive survey to analyze the efficacy of the functioning of SEZs in India. The underlined reasons which are found while conducting secondary analysis and primary survey are rise in cost of operation, global slowdown, fall in market demand, Instability in the policy environment, lack of skilled manpower and primarily the lack of incentives to operate in the SEZs such as imposition of MAT and DDT. Therefore, it is considered that SEZs model could never take off in the country like India. To sum up, SEZs policy in our country with respect to frequent changes in the policy environment is one of the major reasons of slackening the confidence of investors to continue and make fresh investments in SEZs. Therefore, to build a strong confidence amongst the potential/existing investors, it is imperative to frame a stable, favourable and highly transparent SEZs policy with long term perspectives. In addition, policy instruments must be flexible enough to adjust to the evolving needs of the country.
7
PHD Research Bureau
1. Historical Background of Special Economic Zones (SEZs)
The idea of EPZs was carried by the United Nations Industrial Development Organization
from a peripheral area of Europe, Ireland, to the world's economic periphery, the Third
World, in the 1960s and 1970s. In mid-1984 there were 79 Export Processing Zones in 35
Third World countries1. The example of the booming EPZs was emulated in United States'
Foreign Trade Zones, beginning on a large scale in the late 1970s. Great Britain's policy
makers then introduced Enterprise Zones (although we must also note that different forms
of special zones are present in the United States since the 1930s). Proponents of special
zones in the developed countries such as Canada have advocated their creation on the basis
of their proliferation in the Third World and de-industrialization in the First World. In Asian
economies, Chinese government has made use of what seems to be a similar method for
promoting its socialist modernization program, although with a much higher rate of state
intervention and participation.
The Asian economies have been using Special Economic Zones (SEZs) as a way to initiate or
expand export oriented manufacturing and to promote structural change more broadly
through linkages and demonstration effects. They take their cues mainly from successful
East Asian economies that began virtuous growth spirals in the late 1960s and early 1970s.
Within 3 decades, they have had become upper middle or high-income economies.
Although a host of developing economies pursued industrialization in parallel with East Asia,
in most cases their objective was to manufacture home grown substitutes for imported
products. Tariff barriers sheltered their industries, which serviced small domestic markets.
Protection and small scale left productivity low, with high unit costs and no pressure to
upgrade technology or innovate. East Asia also began with import substitution, but quickly
saw the advantage exports held as a means of accelerating growth while bringing in foreign
exchange revenues. However, they approached trade liberalization cautiously and tried to
separate the domestic market from the traded goods sector.
1 World Bank, FIAS 2008: Special Economic Zones, Performance, lessons learned and implications for Zone development, Washington DC: World Bank
In mid- 1984, there were
79 Export Processing
Zones in 35 Third World
countries
Different forms of special zones have been present in the United States since the 1930s.
8
PHD Research Bureau
1.1 Purpose of establishing SEZs worldwide
The SEZs—insulated from the rest of the economy—offered a convenient vehicle for testing
export-led strategies and incentives to produce for the global market. By the 1960s, the
concept of zones for processing exports was already in the air and evidence was
accumulating from a few trials. With the General Agreement on Tariffs and Trade (GATT) a
body formed to initiate trade negotiations and improve prospects for international trade,
several East Asian economies jumped on the trade bandwagon and established export
processing zones (EPZs). The early mover advantages attracted the attention of other
developing economies. By the 1970s, zones of various kinds were multiplying, but with
mixed results. Nevertheless, their popularity increased over the years with the “miracle of
Shenzhen” serving as beacon. They have become a development policy fixture even as
import-substitution fell out of favour with most of the economies adopting market and
trade liberalization.
A wide range of various economic enclaves are created under various economic policies
with different incentives and goals. A significant amount of the international literature has
focused on EPZs—zones specifically aimed at attracting export oriented activities. Since the
establishment of the first EPZ in Europe in 1959, these zones have become popular as tools
to promote industrialization and structural adjustment in primarily unindustrialized nations
by promoting exports2. Empirical research shows that many SEZs have been successful in
generating exports and employment, and come out marginally positive in cost-benefit
assessments3. Many economists, however, still view zones as a second- or even third-best
solution to competitiveness, whose success is restricted to specific conditions over a limited
time frame.4
2 Rubini, L.,Di Tommaso, M.R., Barbieri, E., “Special Economic Zones and cluster dynamics” in Elsevier’s Encyclopedia of the Social and
Behavioral Sciences, Elsevier (2015).
3 cf. Chen 1993; Jayanthakumaran 2003; Mongé-Gonzalez, Rosales-Tijerino, and Arce-Alpizar 2005; Warr 1989 4 Hamada, K. (1974). An economic analysis of the duty free zone. Journal of International Economics .4(3): 225–241.
With the General Agreement on Tariffs and Trade (GATT) initiating trade negotiations,
several East Asian economies jumped on the trade bandwagon and established export
processing zones (EPZs).
Since the establishment of the first EPZ in Europe in 1959, these zones have become
popular as tools to promote industrialization and structural adjustment in primarily
unindustrialized nations by promoting exports
9
PHD Research Bureau
Concerns also have been raised that zones, by and large, have failed to extend benefits
outside their enclaves or to contribute to upgrading of skills and the production base5. A
number of examples, however, also illustrate the catalytic role zones play in processes of
economic growth and adjustment processes6. For example, many of the zones established in
the 1970s and 1980s in East Asia’s “tiger economies” were critical in facilitating their
industrial development and upgrading processes. Similarly, the later adoption of the model
by China, which launched SEZs on a scale not seen previously, provided a platform for
attracting FDI and not only supported the development of China’s export oriented
manufacturing sector, but also served as a catalyst for sweeping economic reforms that
were later extended throughout the country.
In Latin America, countries like the Dominican Republic, El Salvador, and Honduras used
free zones to take advantage of preferential access to U.S. markets and have generated
large-scale manufacturing sectors in economies that previously were reliant on agricultural
commodities. In the Middle East and North Africa, SEZs have played an important role in
catalyzing export-oriented diversification in countries like the Arab Republic of Egypt,
Morocco, and the United Arab Emirates. In Sub-Saharan Africa, Mauritius is an example of
zones operating as a central policy tool supporting a highly successful process of economic
diversification and industrialization.
1.2 Evolution and Expansion of SEZs
The rapid expansion in SEZs is happening in the midst of substantial changes and the global
trade & investment environment is changing in a way that no longer supports the traditional
EPZ model. The rapid growth of EPZ programs around the world over the last few decades,
and their success in contributing to export-led growth in regions like East Asia, is due in part
to an unprecedented globalization of trade and investment that took place since the 1970s
and accelerated during the 1990s and 2000s, which saw trade grow 85 percent faster than
5 cf. Kaplinsky 1993 6 Johansson H. and Nilsson L. (1997), “Export Processing Zones as Catalysts”, World Development, vol. 25, no. 12, pp. 2115-28.
Many of the zones established in the 1970s and 1980s in East Asia’s “tiger economies”
were critical in facilitating their industrial development and upgrading processes.
SEZS in China provided a platform for attracting FDI and supported the development of
China’s export oriented manufacturing sector, but also served as a catalyst for sweeping
economic reforms that later were extended throughout the country.
10
PHD Research Bureau
GDP between 1983 and 2008. This growth was enabled by the vertical and spatial
fragmentation of manufacturing into highly integrated “global production networks,”
particularly in light manufacturing sectors like electronics, automotive components, and
especially apparel, which accounted for the large majority of investment in traditional EPZs.
Especially for countries with low labour costs, scale economies and preferential access to
major consumer markets like the Europe, Japan, and the United States, economic zones
with their access to duty-free inputs, quality, flexible infrastructure, and often generous
fiscal incentives—proved to be a powerful instrument through which to capture increasingly
mobile foreign investment.
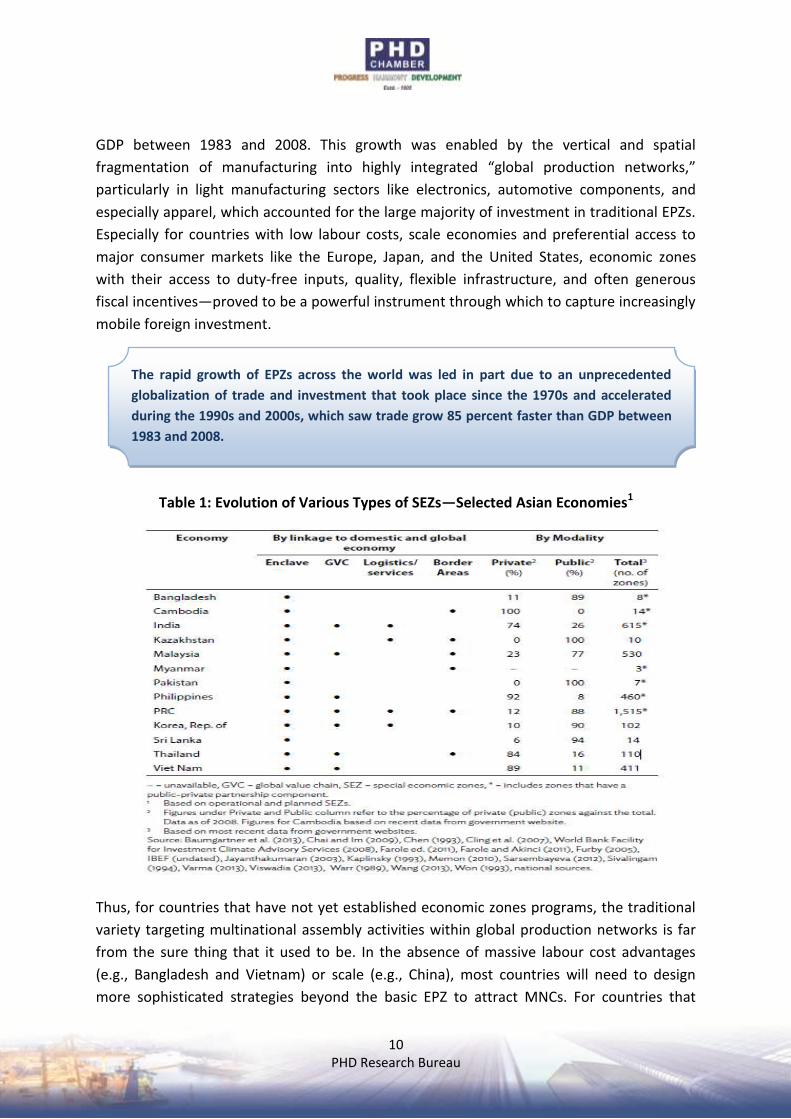
Table 1: Evolution of Various Types of SEZs—Selected Asian Economies1
Thus, for countries that have not yet established economic zones programs, the traditional
variety targeting multinational assembly activities within global production networks is far
from the sure thing that it used to be. In the absence of massive labour cost advantages
(e.g., Bangladesh and Vietnam) or scale (e.g., China), most countries will need to design
more sophisticated strategies beyond the basic EPZ to attract MNCs. For countries that
The rapid growth of EPZs across the world was led in part due to an unprecedented
globalization of trade and investment that took place since the 1970s and accelerated
during the 1990s and 2000s, which saw trade grow 85 percent faster than GDP between
1983 and 2008.
11
PHD Research Bureau
already have established EPZ programs, the challenge is perhaps more acute. It is about
remaining competitive, which in the absence of aggressive & long-term dampening of real
wages, means upgrading production capabilities and attracting investment in higher value-
added activities.
2. Global Outlook and Performance of SEZs
Globally, SEZs are equipped with efficient infrastructure, quality services, favorable business
environment, few regulatory restrictions, and a minimum of red tape. They are set up to
generate a circular and cumulative growth process that requires two-way linkages between
SEZs and the wider economy. Taken together, both approaches require creating a good
climate within and around SEZs—and a parallel upgrading of the domestic economy that
reinforces upgrading of SEZs.
2.1 Performance of East Asian, South and Southeast Asian Economies
Viewed against this analytical framework, the China and the Republic of Korea stand out as
having developed their SEZs and the larger economy away from labor-intensive toward skill
and technology-intensive production. Malaysia also succeeded in developing its electrical
and electronics industry, with the Philippines succeeding in attracting FDI and generating
exports. Both, however, have had limited success in moving up the value chains.
This is similar to Bangladesh, which attracted FDI in garments and generated new trade, but
has had limited success in upgrading and diversifying SEZ exports. Other economies have
had more limited success. Low income economies tend to have more enclave-type SEZs of
the orthodox or heterodox type consistent with their level of development. Cambodia and
Myanmar in Southeast Asia , Mongolia in East Asia, Pakistan in South Asia and most Central
Asian economies fall under this category. Many of their zones are operating below capacity,
because the business enabling environment is weak and firms operating in these zones have
been unable to move up the industrial value chain.
In East Asia, the Republic of Korea; the PRC; Hong Kong, China; and Taipei, China has build
impressive and sustained growth based on outward orientation and strong development
state models since the early 1970s. SEZs have played a crucial role in industrializing these
economies, where SEZs have been credited with technology spillover, increases in national
productivity, and structural transformation. Hong Kong and China were transformed into
Hong Kong and China were transformed into high performing economies by their free
port status. Among the Republic of Korea, Taiwan and China, China arguably has had the
most successful experience in the world, with manufacturing-type SEZs.
12
PHD Research Bureau
high performing economies by their free port status, while the Republic of Korea and
Taiwan have had the most successful experience in the world, with manufacturing-type
SEZs7. These were launched when their economic structure was still dominated by primary
economic activity while pursuing the inward looking policies. Mongolia is known for its
liberal trade regime, but has not demonstrated steady growth partly due to its overreliance
on minerals8.
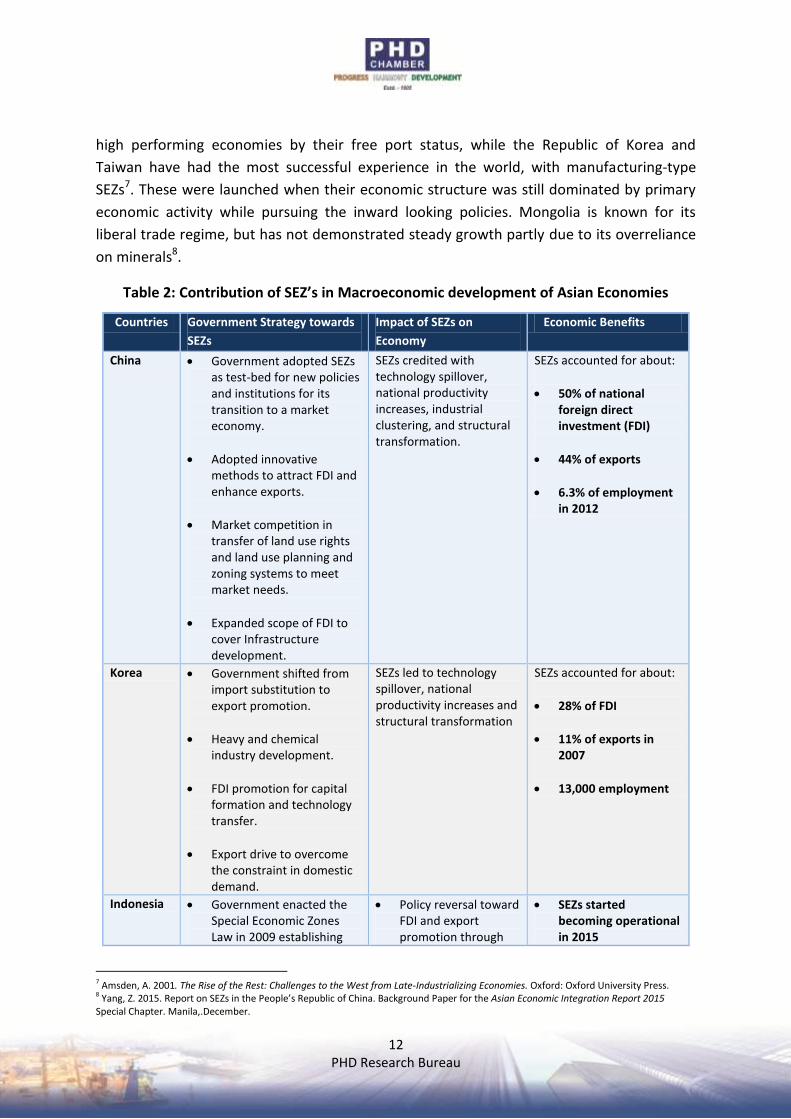
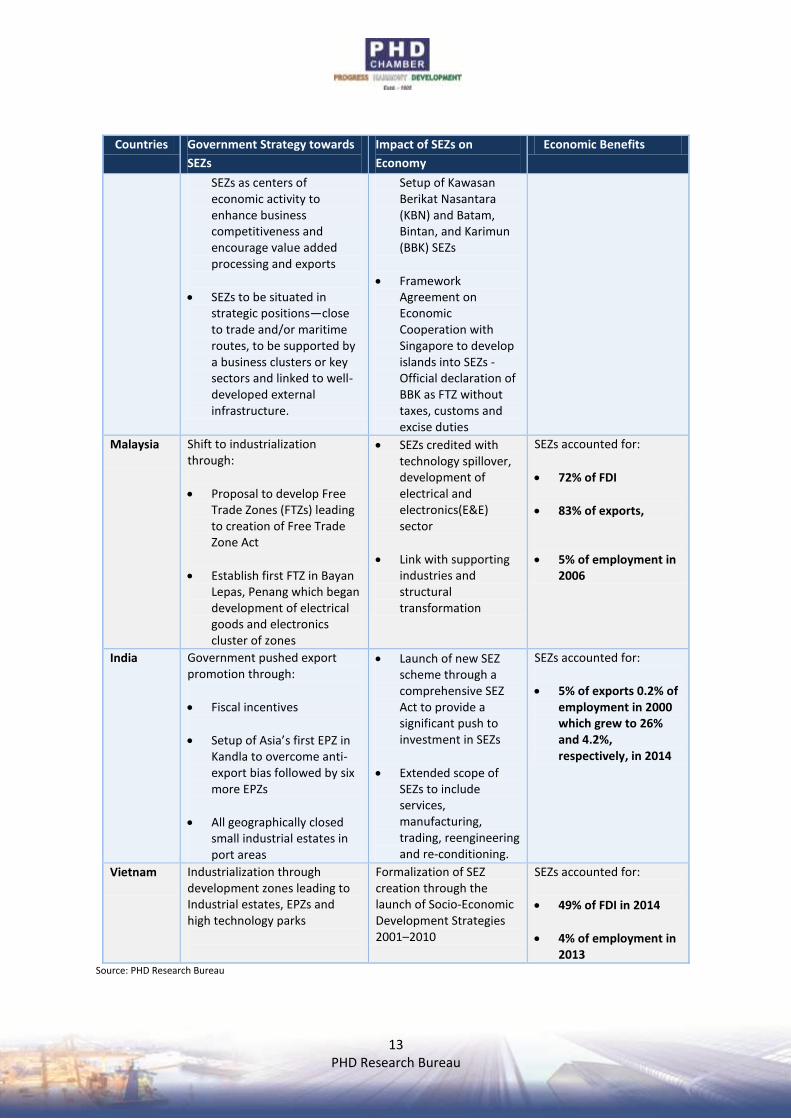
Table 2: Contribution of SEZ’s in Macroeconomic development of Asian Economies
Countries Government Strategy towards
SEZs
Impact of SEZs on
Economy
Economic Benefits
China Government adopted SEZs as test-bed for new policies and institutions for its transition to a market economy.
Adopted innovative methods to attract FDI and enhance exports.
Market competition in transfer of land use rights and land use planning and zoning systems to meet market needs.
Expanded scope of FDI to cover Infrastructure development.
SEZs credited with technology spillover, national productivity increases, industrial clustering, and structural transformation.
SEZs accounted for about:
50% of national foreign direct investment (FDI)
44% of exports
6.3% of employment in 2012
Korea Government shifted from import substitution to export promotion.
Heavy and chemical industry development.
FDI promotion for capital formation and technology transfer.
Export drive to overcome the constraint in domestic demand.
SEZs led to technology spillover, national productivity increases and structural transformation
SEZs accounted for about:
28% of FDI
11% of exports in 2007
13,000 employment
Indonesia Government enacted the Special Economic Zones Law in 2009 establishing
Policy reversal toward FDI and export promotion through
SEZs started becoming operational in 2015
7 Amsden, A. 2001. The Rise of the Rest: Challenges to the West from Late-Industrializing Economies. Oxford: Oxford University Press. 8 Yang, Z. 2015. Report on SEZs in the People’s Republic of China. Background Paper for the Asian Economic Integration Report 2015 Special Chapter. Manila,.December.
13
PHD Research Bureau
Countries Government Strategy towards
SEZs
Impact of SEZs on
Economy
Economic Benefits
SEZs as centers of economic activity to enhance business competitiveness and encourage value added processing and exports
SEZs to be situated in strategic positions—close to trade and/or maritime routes, to be supported by a business clusters or key sectors and linked to well-developed external infrastructure.
Setup of Kawasan Berikat Nasantara (KBN) and Batam, Bintan, and Karimun (BBK) SEZs
Framework Agreement on Economic Cooperation with Singapore to develop islands into SEZs - Official declaration of BBK as FTZ without taxes, customs and excise duties
Malaysia Shift to industrialization through:
Proposal to develop Free Trade Zones (FTZs) leading to creation of Free Trade Zone Act
Establish first FTZ in Bayan Lepas, Penang which began development of electrical goods and electronics cluster of zones
SEZs credited with technology spillover, development of electrical and electronics(E&E) sector
Link with supporting industries and structural transformation
SEZs accounted for:
72% of FDI
83% of exports,
5% of employment in 2006
India Government pushed export promotion through:
Fiscal incentives
Setup of Asia’s first EPZ in Kandla to overcome anti-export bias followed by six more EPZs
All geographically closed small industrial estates in port areas
Launch of new SEZ scheme through a comprehensive SEZ Act to provide a significant push to investment in SEZs
Extended scope of SEZs to include services, manufacturing, trading, reengineering and re-conditioning.
SEZs accounted for:
5% of exports 0.2% of employment in 2000 which grew to 26% and 4.2%, respectively, in 2014
Vietnam Industrialization through development zones leading to Industrial estates, EPZs and high technology parks
Formalization of SEZ creation through the launch of Socio-Economic Development Strategies 2001–2010
SEZs accounted for:
49% of FDI in 2014
4% of employment in 2013
Source: PHD Research Bureau
14
PHD Research Bureau
In Southeast Asia, Brunei Darussalam has an FTZ in the hinterlands of Muara Port (since
1994), while Singapore, a free port, has promoted five FTZs. Malaysia was the first ASEAN
country to adopt an EPZ program in 1971. It was followed by the Philippines (1972),
Indonesia (1973) and Thailand (1978). All adopted zones to kick start export- oriented
industrialization while still pursuing import substitution using an orthodox approach—
having phenomenal success in generating direct benefits. Overall, SEZs have undoubtedly
significantly affected growth and industrial diversification. In 2006, SEZs in Malaysia
accounted for 72% of FDI, 83% of exports, and 5% of employment. They have been credited
with developing a vibrant electrical and electronics (E&E) sector9.
The CLMV are relatively new ASEAN members and late industrializers. Although Vietnam
had a head start and enjoys relatively higher per capita income and industrialization, as a
group they remain primarily agriculture-based and transition economies characterized by
low incomes, high unemployment, high poverty incidence, insufficient infrastructure, and
weak institutions. Most CLMV economies have been developing SEZs as part of a broader
industrial cluster development strategy. The distinction between different industrial parks is
blurred. Following the PRC’s success, the CLMV (plus Thailand) are focusing on generating
agglomeration economies. Till date, Vietnam, which is registering high growth rate, has
been quite successful in its massive industrialization drive.
Central Asia is rich in natural resources with agriculture and minerals dominating in
Kazakhstan, the Kyrgyz Republic, Tajikistan, Turkmenistan and Uzbekistan. They can further
be divided into oil and gas exporting economies (Kazakhstan, Turkmenistan, and Uzbekistan)
and non-oil-exporting economies (the Kyrgyz Republic and Tajikistan). Previously high
energy prices and investments in oil and gas, including petrochemicals, were the main
growth engines for the first group. However, to restructure their economies and help transit
from directive to market systems, these economies have all set up SEZs using the heterodox
approach. However, some continue having difficulties in enhancing benefits from their SEZ
experiments.
9 Akyüz, Y., H. J. Chang and R. Kozul—Wright. 1998. New Perspectives on East Asian Development. The Journal of Development Studies. 34 (6). pp. 4-36.
SEZs in Philippines accounted for 15% of FDI, 49% of exports, 2% of employment in 2011
Central Asian Economies report a total of 27 SEZs, with 10 in Kazakhstan, 7 in
Turkmenistan, 5 in the Kyrgyz Republic, 2 in Uzbekistan and 3 in Tajikistan.
15
PHD Research Bureau
3. SPECIAL ECONOMIC ZONES – A BOON OR A BANE
The Global economy is replete with cases where countries endowed with resources, including talented manpower, have lagged behind in development whereas other countries have progressed enormously. The manufacturing synonymous with industry along with services sector have been major contributors of GDP and employment in the industrialized nations and transgress the narrow boundaries of the nation to emerge as serving platforms for the globe. The concept of competitive advantage also translates itself into competitive cost advantage on scale and scalability front to improve the economies. It is observed that agriculture contributes only about 5 percent to the GDP whereas other sectors like manufacturing and services contributes about 90 percent of United States economy. Even in cases of economies like Australia and New Zealand, which depict a strong leaning towards sectors like agrarian and animal husbandry are also dominated by processing and manufacturing industries and have an munificence in their economy in terms of lower population. Thus development of manufacturing and industries sector is imperative and has no other alternative. India, as a country is endowed with rich and varied resources coupled with a strategic location in the South Asian region and has a vast coastal boundary enabling it to achieve a pivotal role in serving the global economy. As the second largest populated country in the world holding a position of seventh largest country, it would have to serve the global economy for its economic growth in order to improve the standard of living of its people. The need for imports in terms of oil and other goods also makes it inevitable to earn valuable foreign exchange to sustain its balance of payments. 3.1 Regulatory Framework of SEZs in India SEZs in India conceptually involve commitments from government in terms of approval. A robust framework has been incorporated in the SEZ Act, 2005 which also includes an effective supervisory structure. In view of the large commitments involved, normally SEZs are of large scale formats with large land requirements as they have to cater to the ambience sought by world-class players and also are indicative of a lead in the developmental needs before they achieve their ultimate potential. SEZs are also developed by private players under the supervision of statutory structure under SEZ Act, besides the joint sector players as well as pure government entities. Some of the SEZs have a sector specific approach, popularly titled as Queen Bee approach, where an anchor tenant like a big oil PSU, refinery or major automotive manufacturer or base industry gets established and its encircling areas are covered by the downstream or feedstock drawal industries. The induction of a global work culture in the SEZs has also brought in the indirect benefit of healthy labour practices as prevailing in the global scenario and enables cleansing of the
16
PHD Research Bureau
regressive work climate hitherto prevailing. This has also led to a clarion call for enacting labour laws which would be productivity driven without dehumanizing the working class. 3.2 Performance of SEZs in India The employment opportunities and investments in the SEZs are projected on full scale development basis and there could be a lag in their performances due to various external environmental issues like global economy, investor interests, shifting trends in the consumption patterns, social interests, cost factors etc. Another important factor is that SEZs have an export orientation for a net foreign exchange before a given time frame period. The connectivity to the nearest seaports and other outbound facilities improve as a hinterland reinforcement area improving the cascading effect on the economy. They also provide the implicit benefit of competition in the economic structure of the country. The investments accumulated into the SEZs for the period from 2005 to 2017 (as on Sep 2016) amount to Rs. 4,06,690 crores with a accumulated foreign exchange earnings of Rs. 32,62,082 crores. The SEZs in the country already housed 4,218 numbers of units. They have also provided employment to over 16, 88,337 individuals as on Sep 201610. 3.3 Land Acquisition for SEZs in India The SEZ concept also involves s contract farming and fertile lands can be collated under Agri SEZs which would bring in rhythm and rationale in agri -produce processing and exports with opportunities for inducing value chain and brand build-up. SEZs also have brought in the indirect advantage of forcing improvements in land yield as the returns from existing lands are improved on grounds of neccessity as the hitherto luxury is eliminated. SEZs have also helped in consolidation of fragmented holdings and the creation of large parcels of land which have created an environment for tapping into the benefits of consolidated vast holdings and enabled elimination of disguised employment in agriculture besides releasing the scarce water resources for agricultural holdings in a reinforced structured pattern. The basic concept of economics that scarce resources with alternative uses have to be deployed efficiently to enhance the improvement in standards of living of people is being achieved. The land for SEZ is usually obtained through land acquisition Act, alienation of Government land and reinforcement of lands allotted to other government ventures which have not been taken up (including lands allotted to endowment department and unutilized social lands). There is an effective frame work for lands being acquired for SEZs. The acquisitions are done with the recommendations of the state governments under the provisions of Act, with relevant grievance redressal measures including judicial forums, where the rationale is
10 Source – http://www.sezindia.nic.in/writereaddata/pdf/factsheet/pdf
17
PHD Research Bureau
appropriately examined and approved. The flaws in the archaic land acquisition have been replaced by the new land acquisition Act, 2013 which provides for purpose and utilization of the land, balancing the interests of the land takers and land possessors. The compensation, utilization and provisions of the process are clearly enshrined in the new land acquisition Act. The provisions of eminent domain, however repulsive they are, are a necessary evil for the common good and development of the society .The new Act in its preamble incorporates the word of compulsory acquisition while balancing it with fair compensation and other provisions. Another important aspect of the Land acquisition is the provision of Rehabilitation and resettlement, which enables creation of modern colonies and improved standards of living as per the present developments, which significantly benefits the land dis-possessed. These costs are borne by the projects and this enables planned development of residences with appropriate social, commercial and entertainment infrastructure, thereby sparking development and growth opportunities for people in different areas. The SEZ development entities are also statutorily obtained to participate in Corporate Social Responsibility activities by carving out portions of their profits for local area development, thus ensuring the societal reward for accommodating with the projects. The SEZs also have an intrinsic aspect of processing and non-processing areas wherein the utilities serving the processing areas i.e., power, post offices, offshore banking units etc. which are located in the non-processing area, can opt for dual use, i.e., serving the domestic areas as well as processing areas (though they cannot claim any tax benefits). These would be harbingers of prosperity, as domestic tariff areas can avail their world-class service facilities. The SEZ Act also provides for a robust structure in terms of the land requirements and the project proposal being recommended by the appropriate state Government to bring in the social nod for the project and the same progresses towards approval from the ministry of commerce and industry for approval with terms and conditions. Though the land remains under the control of the Developer, the establishment of the units and the management of the land is under the jurisdiction of the Development Commissioner. SEZ lands cannot be sold as per SEZ rules any change in their land use is subject to the approval of the statutory authorities with relevant conditions imposed on them. Contrary to the constant refrain that SEZ lands are being used for real estate purposes, these lands can only be leased to units and the economic value harnessed from these lands is far better than mere change of land through different hands for increasing their value through land trading.
18
PHD Research Bureau
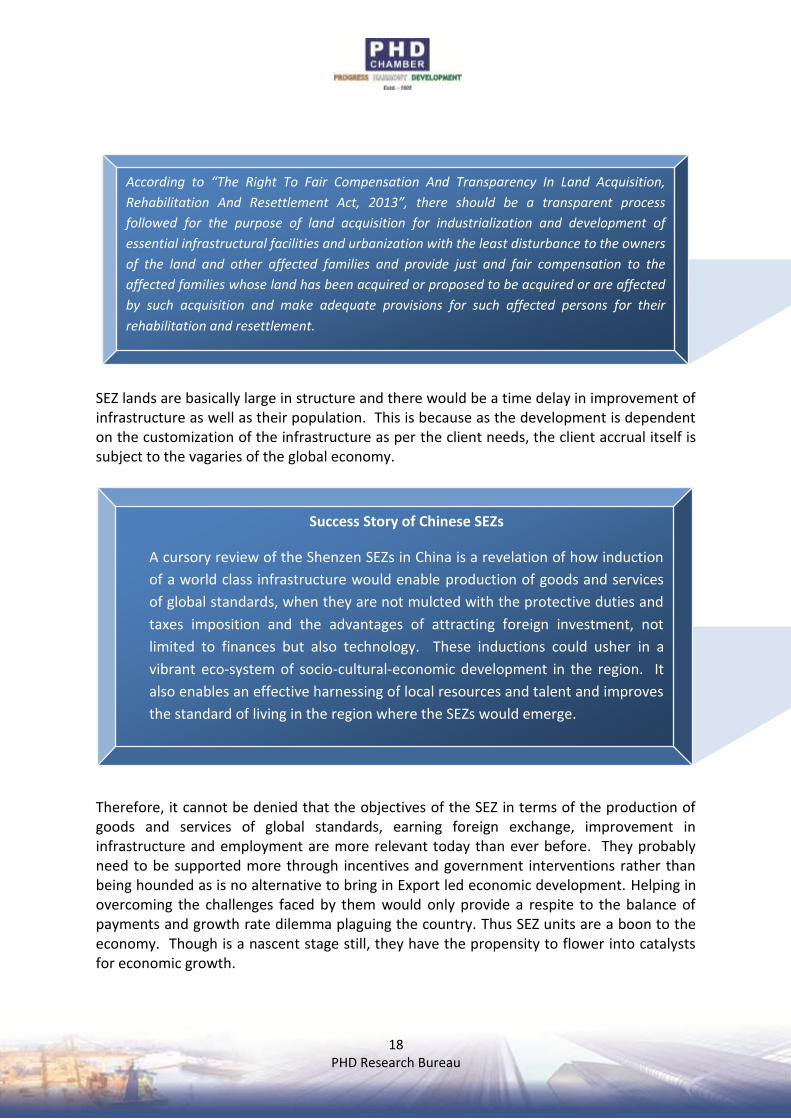
SEZ lands are basically large in structure and there would be a time delay in improvement of infrastructure as well as their population. This is because as the development is dependent on the customization of the infrastructure as per the client needs, the client accrual itself is subject to the vagaries of the global economy. Therefore, it cannot be denied that the objectives of the SEZ in terms of the production of goods and services of global standards, earning foreign exchange, improvement in infrastructure and employment are more relevant today than ever before. They probably need to be supported more through incentives and government interventions rather than being hounded as is no alternative to bring in Export led economic development. Helping in overcoming the challenges faced by them would only provide a respite to the balance of payments and growth rate dilemma plaguing the country. Thus SEZ units are a boon to the economy. Though is a nascent stage still, they have the propensity to flower into catalysts for economic growth.
Success Story of Chinese SEZs
A cursory review of the Shenzen SEZs in China is a revelation of how induction
of a world class infrastructure would enable production of goods and services
of global standards, when they are not mulcted with the protective duties and
taxes imposition and the advantages of attracting foreign investment, not
limited to finances but also technology. These inductions could usher in a
vibrant eco-system of socio-cultural-economic development in the region. It
also enables an effective harnessing of local resources and talent and improves
the standard of living in the region where the SEZs would emerge.
According to “The Right To Fair Compensation And Transparency In Land Acquisition,
Rehabilitation And Resettlement Act, 2013”, there should be a transparent process
followed for the purpose of land acquisition for industrialization and development of
essential infrastructural facilities and urbanization with the least disturbance to the owners
of the land and other affected families and provide just and fair compensation to the
affected families whose land has been acquired or proposed to be acquired or are affected
by such acquisition and make adequate provisions for such affected persons for their
rehabilitation and resettlement.
19
PHD Research Bureau
4. Special Economic Zones in India
India was one of the first in Asia to recognize the effectiveness of the Export Processing
Zone (EPZ) model in promoting exports, with Asia's first EPZ set up in Kandla in 1965. With a
view to overcome the shortcomings experienced on account of the multiplicity of controls
and clearances; absence of world-class infrastructure, an unstable fiscal regime and with a
view to attract larger foreign investments in India, the Special Economic Zones (SEZs) Policy
was announced in April 2000.
The second EPZ, SEEPZ (Santa Cruz Electronics Export processing Zone) was set up in
Maharashtra in 1974. Subsequently, the government set up four more zones namely NEPZ
(Noida Export processing Zone) in Uttar Pradesh, MEPZ (Madras Export Processing Zone) in
Tamil Nadu, CEPZ (Cochin Export Processing Zone) in Kerela, and FEPZ (Falta Export
Processing Zone) in West Begal during the mid-eighties; whereas the VEPZ (Vishakhapatnam
Export Processing Zone) in Andhra Pradesh was commissioned in 1994. Surat EPZ became
operational in 1998. In 2000, the Export – Import (EXIM) policy of India shifted towards a
new scheme of special economic zones (SEZs). Under this scheme, EPZs at Kandla, Santa
Cruz, Cochin and Surat were
converted into SEZs. In 2003, the other existing EPZs at Noida, Falta, Chennai and Vizag (also
know as Vishkhapatnam) were also converted into SEZs.
In all, the EPZs have progressed over four distinct phases over the last five decades which
are discussed briefly below:
I. Initial Phase (1965-1980) - The initial stage witnessed the establishment of the KFTZ
(Kandla Free Trade Zone) in the city of Gujarat in the year 1965 and the
consequent establishment of the SEEPZ (Santacruz Electronics Export Processing Zone) in
Mumbai in 1973. However, it is believed that these EPZs were established with an overall
‘Inward Looking’ policy approach. It was argued that the policies were rigid, infrastructure
India was one of the first in Asia to recognize the effectiveness of the Export Processing
Zone (EPZ) model in promoting exports, with Asia's first EPZ set up in Kandla in 1965
The second EPZ, SEEPZ (Santa Cruz Electronics Export processing Zone) was set up in
Maharashtra in 1974.
20
PHD Research Bureau
was weak and the package of incentives & facilities was not attractive within the zone. To
overcome this, various committees were appointed by the Government of India to review
the working of the zones. Kandla FTZ was reviewed by the Kaul Committee in 1978, while
Santa Cruz FTZ was reviewed by the Review Committee on Electronics in 1979. In 1980,
there was another Committee organised, known as the Tandon Committee, to review both
these zones.
The main objective of the committee was to formulate policy measures for accelerating the
progress of free trade zones and 100% export-oriented units. These committees pointed at
the absence of an implementation authority to centrally coordinate and control the zones,
procedural constraints, infrastructural deficiencies, limited concessions, and limited powers
of the zone authorities to take actions on the spot, resulting in inordinate delays. Moreover,
it was highlighted that there was no clarity of objectives for setting up of EPZs in India until
1988. These committees made several concrete recommendations to improve the
functioning of these zones.
II. Expansionary Phase (1981-1990) - The second phase started in the 1980s, during which
more zones were established based on the Tandon Committee recommendation that the
inward-oriented developmental approach needed to be reorganised by strengthening
outward-oriented export promotion. Followed by the report, the Government decided to
establish four more zones in 1984. The zones established during this phase were NEPZ at
Noida (Uttar Pradesh), FEPZ at Falta (West Bengal), CEPZ at Cochin (Kerala), and MEPZ at
Chennai (Tamil Nadu). Visakhapatnam EPZ in Andhra Pradesh was established in 1989.
Thus, the total number of operational EPZs in India increased to seven. Another significant
step was taken in 1980, when the Government introduced the Export Oriented Units (EOUs)
Scheme. This scheme facilitates the setting up of EOUs beyond the boundaries of EPZs. The
responsibility of administering these units was also entrusted with the zone administration.
While, the primary objectives of these EPZs were not still specified and there were no
significant changes in other laws and procedures governing the EPZs.
During the initial phase, there was no clarity of objectives for setting up of EPZs in India
until 1988.
The zones established during this phase were NEPZ at Noida (Uttar Pradesh), FEPZ at Falta
(West Bengal), CEPZ at Cochin (Kerala), and MEPZ at Chennai (Tamil Nadu). Visakhapatnam
EPZ in Andhra Pradesh was established in 1989.
21
PHD Research Bureau
III. Consolidation Phase (1991-1999) - Since 1991, the Indian economy has undergone
through a paradigm shift in terms of restructuring of economic policies. There was a
transformation from the regime of regulated economic development to a competitive
regime of industrial delicensing, import liberalisation, and removing barriers to exports for
accelerating growth. This phase can be highlighted as the third stage in the development of
EPZs in India. EPZs underwent administrative restructuring, procedural simplification,
delegation and decentralisation of powers at functioning level, and rationalisation of
customs procedures.
One of the significant changes was that the powers of the Board of Approval (BoA) were
decentralized by introducing an automatic approval route for streamlining licensing
procedures and providing operational flexibility. The scope and coverage of the EPZ/EOU
scheme was enlarged in 1992 by permitting agriculture, horticulture, and aquaculture sector
units as well. In 1994, trading, re-engineering and re-conditioning units were also permitted
to be set up. This period was known as a consolidating phase in the transformation of EPZs
which continued until 2000.
IV. Emergence Phase (2000 – 2006) - While the first Indian EPZ was already established in
the 1960s, EPZ policy has not been part of a coherent national strategy and its impact on the
Indian economy was found not much significant. Administrative inefficiencies, lack of
infrastructure, and difficult customs procedures were the major concerns of the EPZs in
India.
However, in April 2000, the Government of India adopted a new policy framework titled
‘Export and Import Policy 2000’ for the establishment of public, private or joint public-
private SEZs. The objective was to provide internationally competitive and business friendly
environment for goods manufacturers and services suppliers. The number of fiscal and non
fiscal incentives was extended to the units operating in the SEZs. Several measures have
been adopted to improve the quality and governance of these zones. These include
relaxation in the conditions for approval process and simplifying the custom rules. SEZ Policy
thus became an identity towards ensuring the success of EPZs.
During the third stage, EPZs underwent administrative restructuring, procedural
simplification, delegation & decentralization of powers at functioning level, and
rationalisation of customs procedures.
In April 2000, the Government of India adopted a new policy framework titled ‘Export and
Import Policy 2000’ for the establishment of public, private or joint public-private SEZs.
22
PHD Research Bureau
In this light, on November 1, 2000, the export processing zones at Kandla, Santa Cruz,
Cochin, and Surat were converted into SEZs. In 2003, the other existing EPZs, namely Noida,
Falta, Chennai, and Vizag, were also converted into SEZs. Altogether, a total of 19 SEZs were
established prior to the promulgation of the SEZ Act. These SEZs in 2005 got a legally
deemed status after the enactment of SEZ Act 2005. This development is further followed
by implementation of SEZ rules in 2006.
V. Growth Phase (2007-2015) - Post enactment of SEZ Act 2005 witnessed the growth in
number of formal approvals, notifications and operational SEZs in India. Number of formal
approvals for setting up SEZs increased from 453 in 2007-08 to 589 in 2011-12, while
number of operational SEZs increased from 87 in 2008-09 to 170 in 2012-13. Though, the
figures are showing the rising trends in the establishment of SEZs in the country, but as
many as 33 developers had surrendered their SEZ projects between December,2008 to July
,2011 was reported.
Post enactment of SEZ Act 2005 witnessed the growth in number of formal approvals,
notifications and operational SEZs in India.
23
PHD Research Bureau
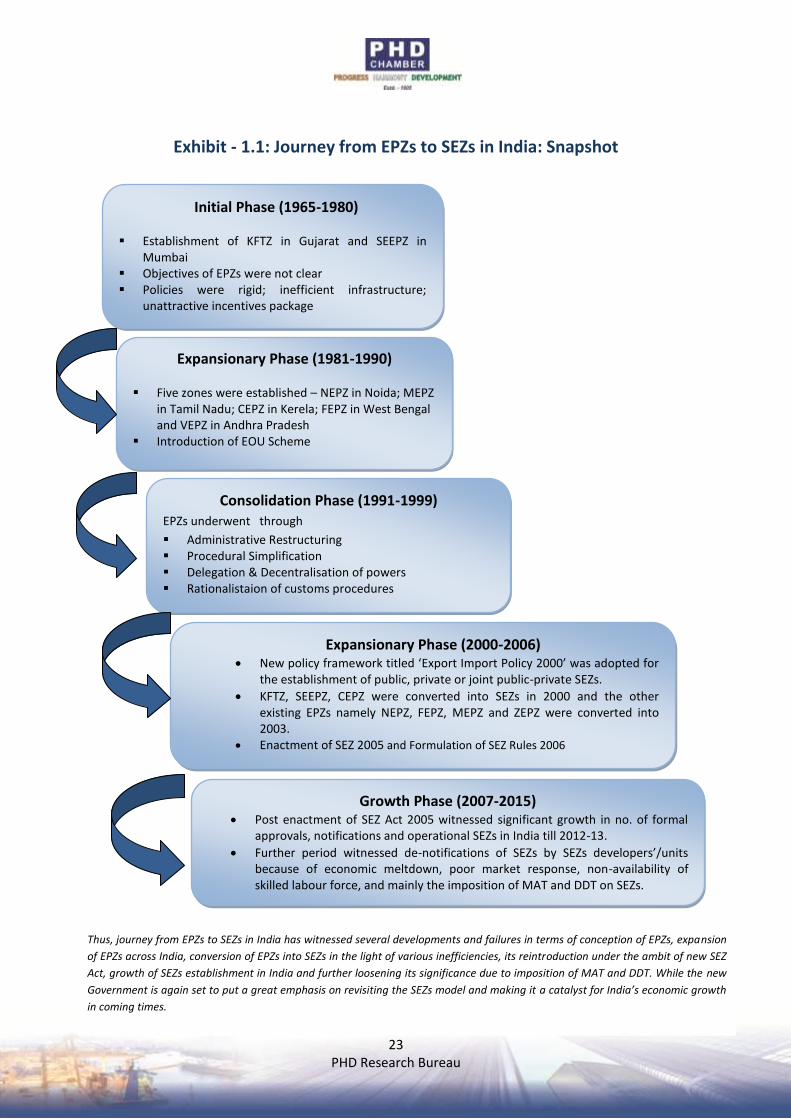
Exhibit - 1.1: Journey from EPZs to SEZs in India: Snapshot
Initial Phase (1965-1980)
Establishment of KFTZ in Gujarat and SEEPZ in Mumbai
Objectives of EPZs were not clear Policies were rigid; inefficient infrastructure;
unattractive incentives package
Expansionary Phase (1981-1990)
Five zones were established – NEPZ in Noida; MEPZ in Tamil Nadu; CEPZ in Kerela; FEPZ in West Bengal and VEPZ in Andhra Pradesh
Introduction of EOU Scheme
Consolidation Phase (1991-1999)
EPZs underwent through
Administrative Restructuring Procedural Simplification Delegation & Decentralisation of powers Rationalistaion of customs procedures
Expansionary Phase (2000-2006) New policy framework titled ‘Export Import Policy 2000’ was adopted for
the establishment of public, private or joint public-private SEZs.
KFTZ, SEEPZ, CEPZ were converted into SEZs in 2000 and the other existing EPZs namely NEPZ, FEPZ, MEPZ and ZEPZ were converted into 2003.
Enactment of SEZ 2005 and Formulation of SEZ Rules 2006
Growth Phase (2007-2015) Post enactment of SEZ Act 2005 witnessed significant growth in no. of formal
approvals, notifications and operational SEZs in India till 2012-13.
Further period witnessed de-notifications of SEZs by SEZs developers’/units because of economic meltdown, poor market response, non-availability of skilled labour force, and mainly the imposition of MAT and DDT on SEZs.
Thus, journey from EPZs to SEZs in India has witnessed several developments and failures in terms of conception of EPZs, expansion
of EPZs across India, conversion of EPZs into SEZs in the light of various inefficiencies, its reintroduction under the ambit of new SEZ
Act, growth of SEZs establishment in India and further loosening its significance due to imposition of MAT and DDT. While the new
Government is again set to put a great emphasis on revisiting the SEZs model and making it a catalyst for India’s economic growth
in coming times.
24
PHD Research Bureau
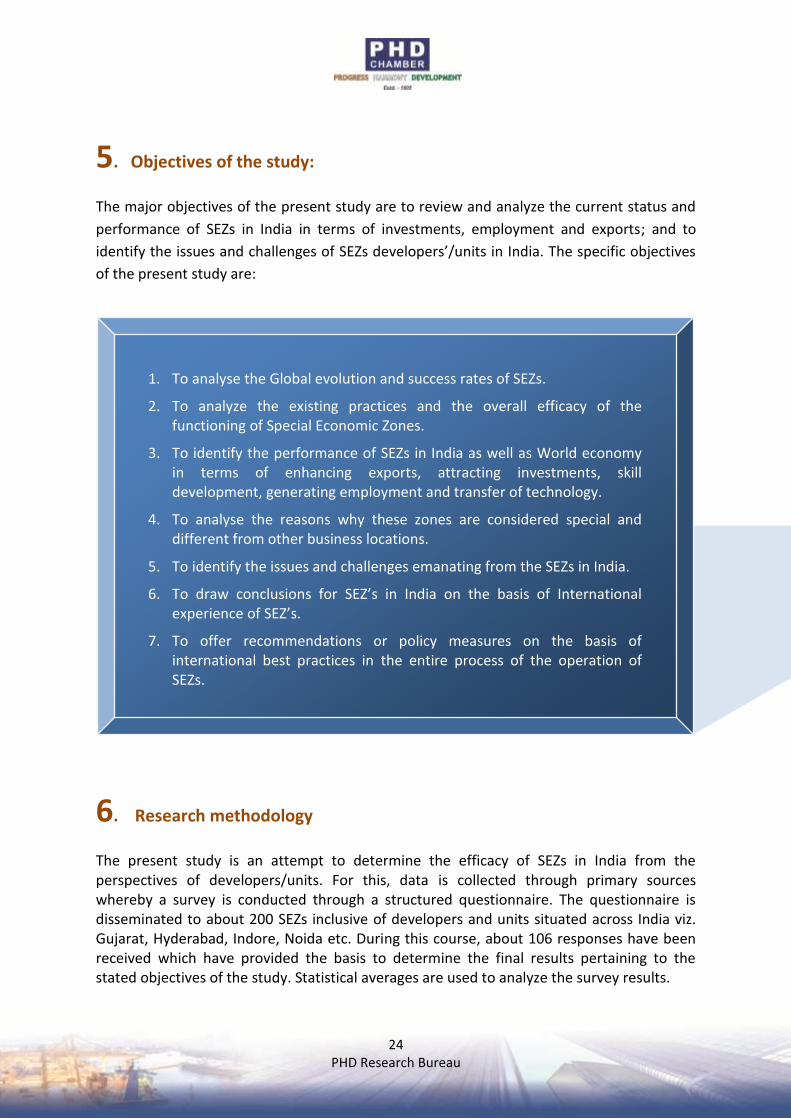
5. Objectives of the study:
The major objectives of the present study are to review and analyze the current status and
performance of SEZs in India in terms of investments, employment and exports; and to
identify the issues and challenges of SEZs developers’/units in India. The specific objectives
of the present study are:
6. Research methodology
The present study is an attempt to determine the efficacy of SEZs in India from the perspectives of developers/units. For this, data is collected through primary sources whereby a survey is conducted through a structured questionnaire. The questionnaire is disseminated to about 200 SEZs inclusive of developers and units situated across India viz. Gujarat, Hyderabad, Indore, Noida etc. During this course, about 106 responses have been received which have provided the basis to determine the final results pertaining to the stated objectives of the study. Statistical averages are used to analyze the survey results.
1. To analyse the Global evolution and success rates of SEZs.
2. To analyze the existing practices and the overall efficacy of the functioning of Special Economic Zones.
3. To identify the performance of SEZs in India as well as World economy in terms of enhancing exports, attracting investments, skill development, generating employment and transfer of technology.
4. To analyse the reasons why these zones are considered special and different from other business locations.
5. To identify the issues and challenges emanating from the SEZs in India.
6. To draw conclusions for SEZ’s in India on the basis of International experience of SEZ’s.
7. To offer recommendations or policy measures on the basis of international best practices in the entire process of the operation of SEZs.
25
PHD Research Bureau
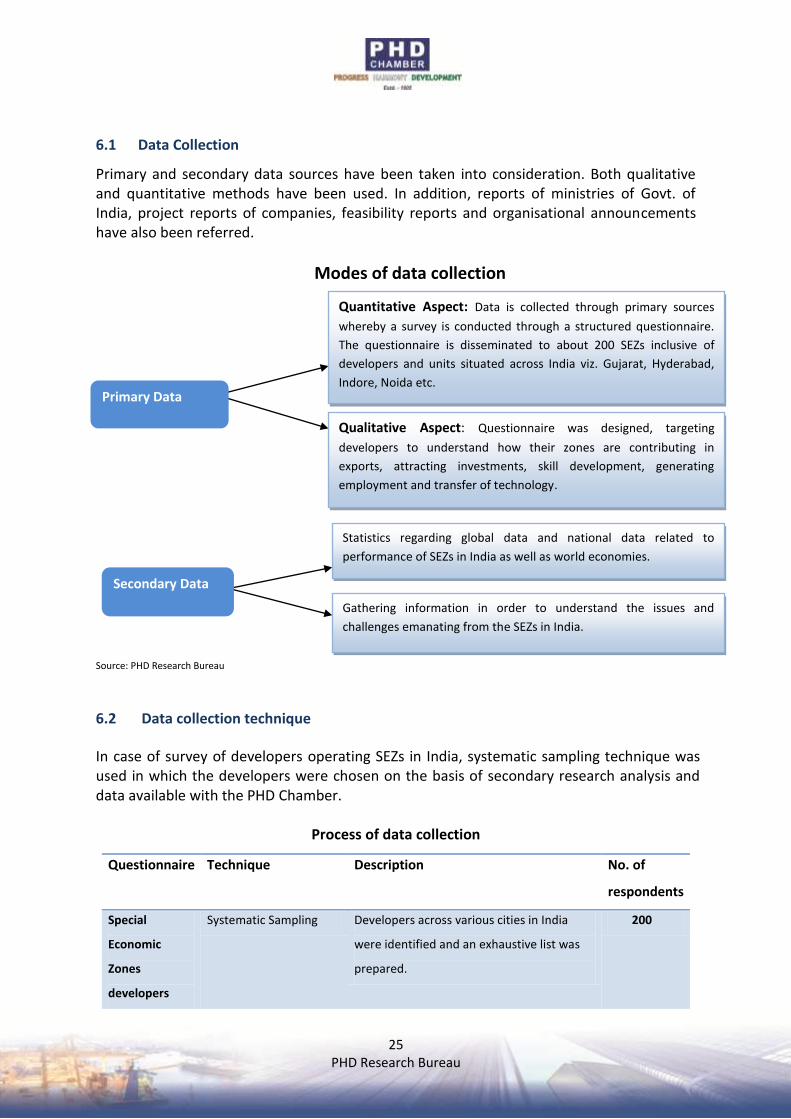
6.1 Data Collection
Primary and secondary data sources have been taken into consideration. Both qualitative and quantitative methods have been used. In addition, reports of ministries of Govt. of India, project reports of companies, feasibility reports and organisational announcements have also been referred.
Modes of data collection
Source: PHD Research Bureau
6.2 Data collection technique
In case of survey of developers operating SEZs in India, systematic sampling technique was used in which the developers were chosen on the basis of secondary research analysis and data available with the PHD Chamber.
Process of data collection
Questionnaire
Technique Description No. of
respondents
Special
Economic
Zones
developers
Systematic Sampling Developers across various cities in India
were identified and an exhaustive list was
prepared.
200
Quantitative Aspect: Data is collected through primary sources
whereby a survey is conducted through a structured questionnaire.
The questionnaire is disseminated to about 200 SEZs inclusive of
developers and units situated across India viz. Gujarat, Hyderabad,
Indore, Noida etc.
Qualitative Aspect: Questionnaire was designed, targeting
developers to understand how their zones are contributing in
exports, attracting investments, skill development, generating
employment and transfer of technology.
Statistics regarding global data and national data related to
performance of SEZs in India as well as world economies.
Gathering information in order to understand the issues and
challenges emanating from the SEZs in India.
Primary Data
Secondary Data
26
PHD Research Bureau
7. Current Status and Performance of SEZs
Since the enactment of SEZ Act in 2005 which came into effect on 10th February, 2006, it
provided for drastic simplification of procedures and for single window clearance on matters
relating to central as well as state governments. The key facts relating to the current
scenario and overall performance of SEZs in India are discussed below:
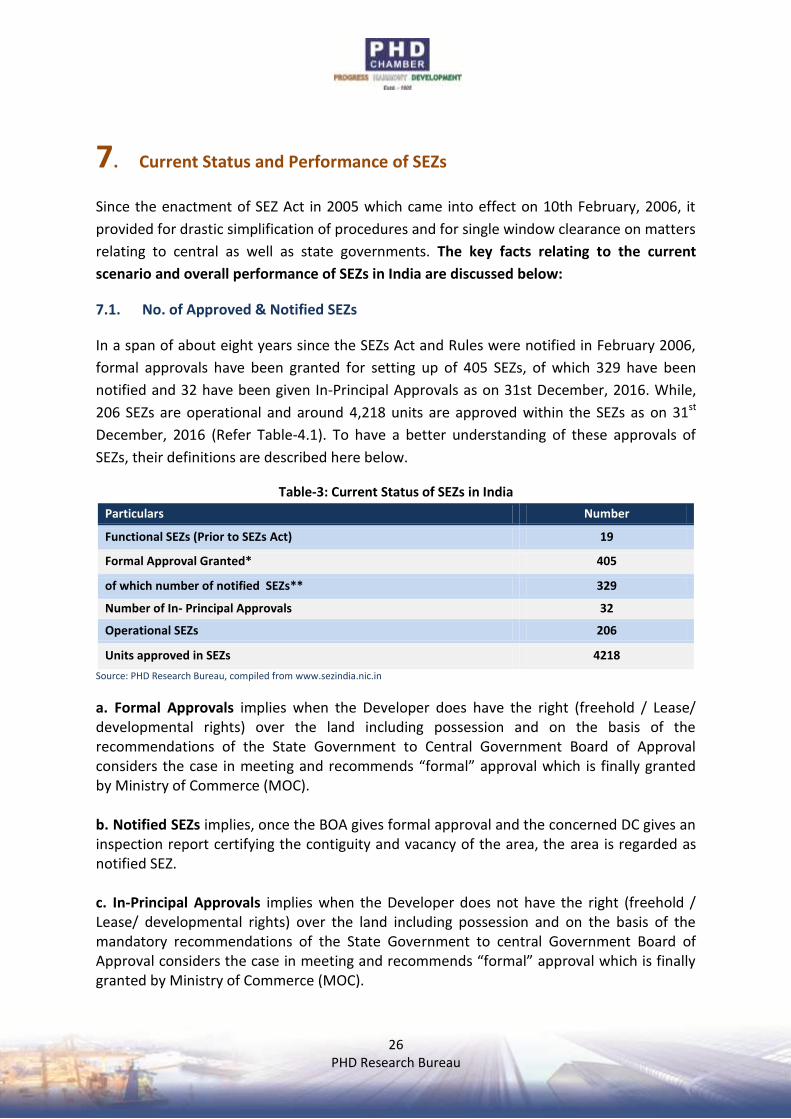
7.1. No. of Approved & Notified SEZs
In a span of about eight years since the SEZs Act and Rules were notified in February 2006,
formal approvals have been granted for setting up of 405 SEZs, of which 329 have been
notified and 32 have been given In-Principal Approvals as on 31st December, 2016. While,
206 SEZs are operational and around 4,218 units are approved within the SEZs as on 31st
December, 2016 (Refer Table-4.1). To have a better understanding of these approvals of
SEZs, their definitions are described here below.
Table-3: Current Status of SEZs in India
Particulars Number
Functional SEZs (Prior to SEZs Act) 19
Formal Approval Granted* 405
of which number of notified SEZs** 329
Number of In- Principal Approvals 32
Operational SEZs 206
Units approved in SEZs 4218
Source: PHD Research Bureau, compiled from www.sezindia.nic.in
a. Formal Approvals implies when the Developer does have the right (freehold / Lease/ developmental rights) over the land including possession and on the basis of the recommendations of the State Government to Central Government Board of Approval considers the case in meeting and recommends “formal” approval which is finally granted by Ministry of Commerce (MOC). b. Notified SEZs implies, once the BOA gives formal approval and the concerned DC gives an inspection report certifying the contiguity and vacancy of the area, the area is regarded as notified SEZ. c. In-Principal Approvals implies when the Developer does not have the right (freehold / Lease/ developmental rights) over the land including possession and on the basis of the mandatory recommendations of the State Government to central Government Board of Approval considers the case in meeting and recommends “formal” approval which is finally granted by Ministry of Commerce (MOC).
27
PHD Research Bureau
d. "Unit" means a Unit set up by an entrepreneur in a Special Economic Zone and includes
an existing Unit, an Offshore Banking Unit and a Unit in an International Financial Services
Centre, whether established before or after the commencement of the Act.
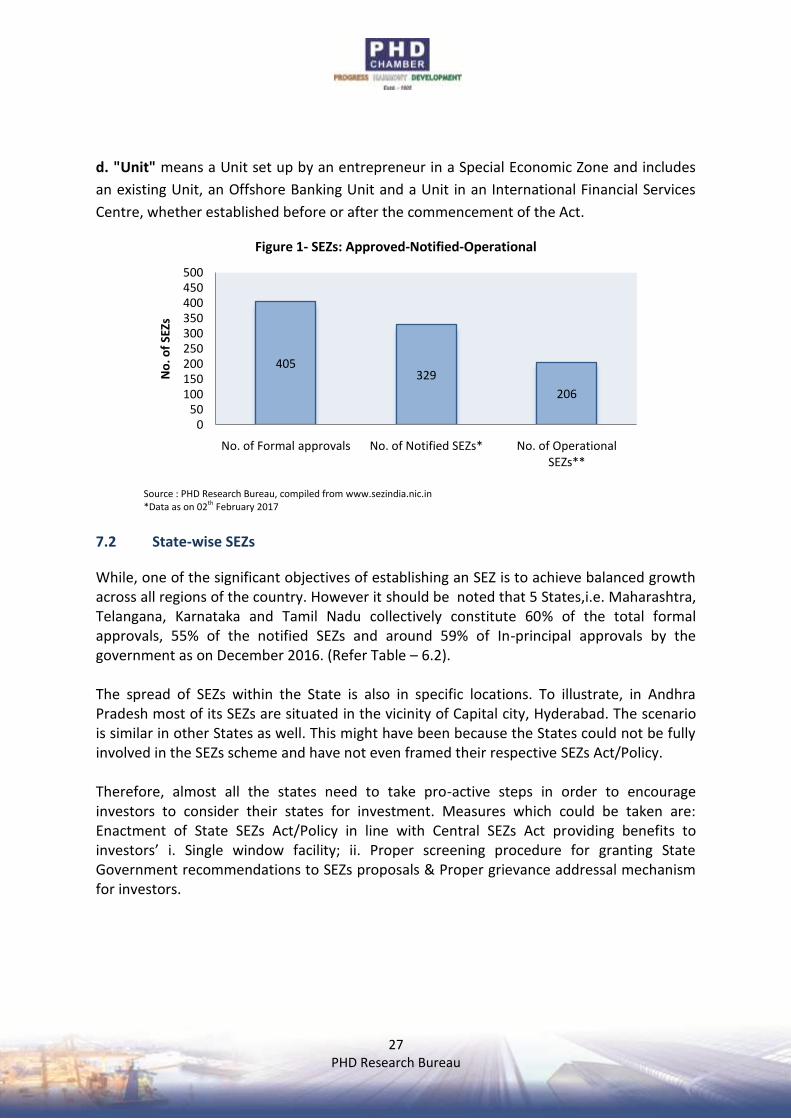
Figure 1- SEZs: Approved-Notified-Operational
Source : PHD Research Bureau, compiled from www.sezindia.nic.in *Data as on 02th February 2017
7.2 State-wise SEZs
While, one of the significant objectives of establishing an SEZ is to achieve balanced growth across all regions of the country. However it should be noted that 5 States,i.e. Maharashtra, Telangana, Karnataka and Tamil Nadu collectively constitute 60% of the total formal approvals, 55% of the notified SEZs and around 59% of In-principal approvals by the government as on December 2016. (Refer Table – 6.2). The spread of SEZs within the State is also in specific locations. To illustrate, in Andhra Pradesh most of its SEZs are situated in the vicinity of Capital city, Hyderabad. The scenario is similar in other States as well. This might have been because the States could not be fully involved in the SEZs scheme and have not even framed their respective SEZs Act/Policy. Therefore, almost all the states need to take pro-active steps in order to encourage investors to consider their states for investment. Measures which could be taken are: Enactment of State SEZs Act/Policy in line with Central SEZs Act providing benefits to investors’ i. Single window facility; ii. Proper screening procedure for granting State Government recommendations to SEZs proposals & Proper grievance addressal mechanism for investors.
405329
206
050
100150200250300350400450500
No. of Formal approvals No. of Notified SEZs* No. of Operational SEZs**
No
. of
SEZs
28
PHD Research Bureau
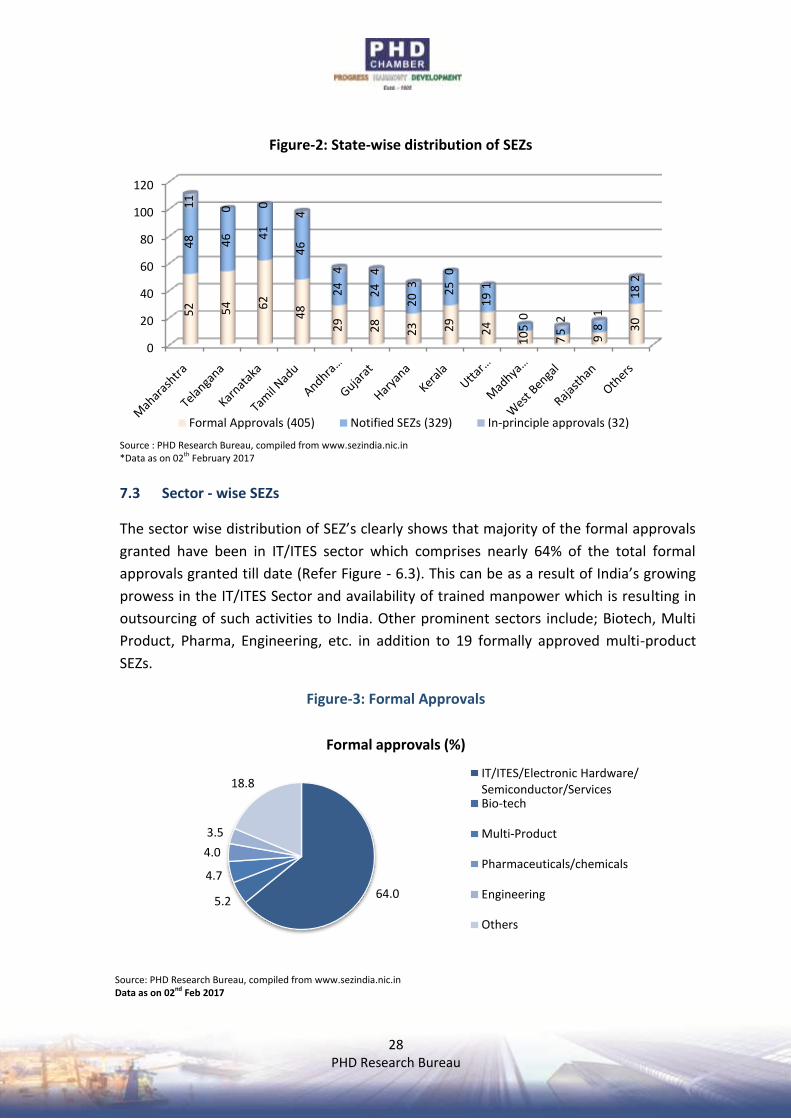
Figure-2: State-wise distribution of SEZs
Source : PHD Research Bureau, compiled from www.sezindia.nic.in *Data as on 02th February 2017
7.3 Sector - wise SEZs
The sector wise distribution of SEZ’s clearly shows that majority of the formal approvals
granted have been in IT/ITES sector which comprises nearly 64% of the total formal
approvals granted till date (Refer Figure - 6.3). This can be as a result of India’s growing
prowess in the IT/ITES Sector and availability of trained manpower which is resulting in
outsourcing of such activities to India. Other prominent sectors include; Biotech, Multi
Product, Pharma, Engineering, etc. in addition to 19 formally approved multi-product
SEZs.
Figure-3: Formal Approvals
Source: PHD Research Bureau, compiled from www.sezindia.nic.in Data as on 02nd Feb 2017
0
20
40
60
80
100
1205
2 54 62
48
29
28
23 29
24
10 7 9
30
48 46 4
1
46
24
24
20 2
5
19
5 5 8
18
11
0 0
4
4 4
3
0
1
0 2 1
2
Formal Approvals (405) Notified SEZs (329) In-principle approvals (32)
64.05.2
4.7
4.0
3.5
18.8
Formal approvals (%)
IT/ITES/Electronic Hardware/Semiconductor/ServicesBio-tech
Multi-Product
Pharmaceuticals/chemicals
Engineering
Others
29
PHD Research Bureau
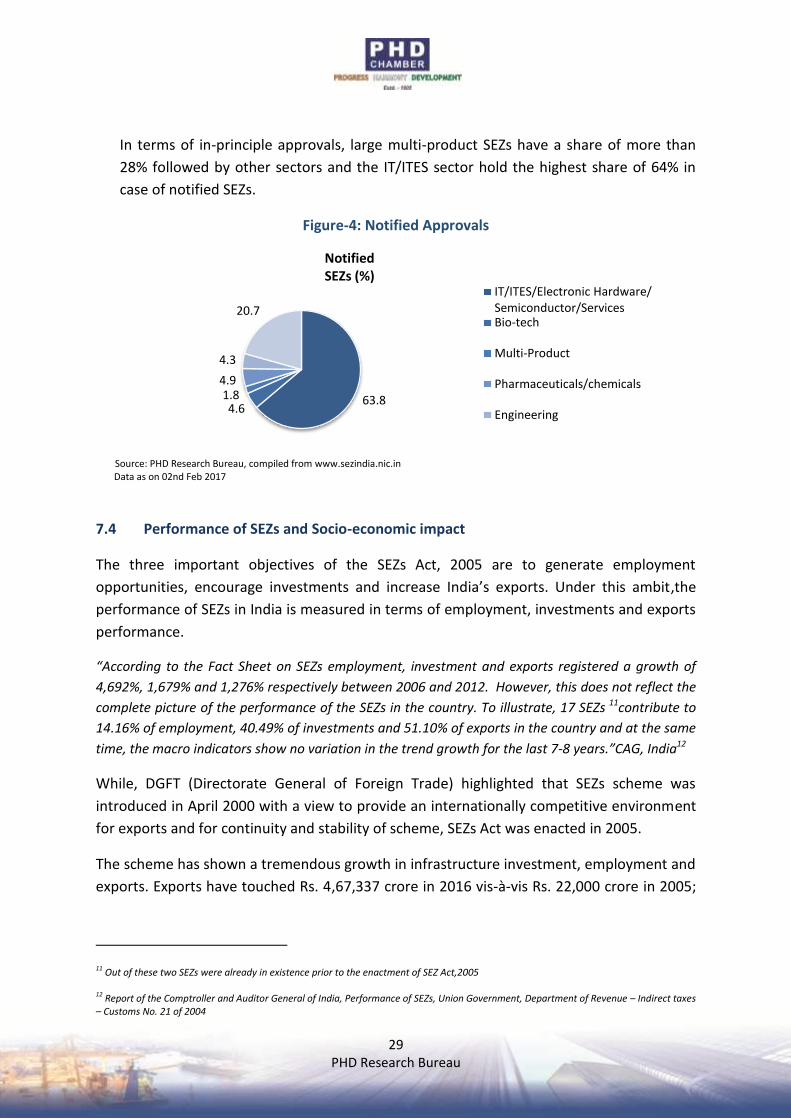
In terms of in-principle approvals, large multi-product SEZs have a share of more than
28% followed by other sectors and the IT/ITES sector hold the highest share of 64% in
case of notified SEZs.
Figure-4: Notified Approvals
Source: PHD Research Bureau, compiled from www.sezindia.nic.in Data as on 02nd Feb 2017
7.4 Performance of SEZs and Socio-economic impact
The three important objectives of the SEZs Act, 2005 are to generate employment
opportunities, encourage investments and increase India’s exports. Under this ambit,the
performance of SEZs in India is measured in terms of employment, investments and exports
performance.
“According to the Fact Sheet on SEZs employment, investment and exports registered a growth of
4,692%, 1,679% and 1,276% respectively between 2006 and 2012. However, this does not reflect the
complete picture of the performance of the SEZs in the country. To illustrate, 17 SEZs 11contribute to
14.16% of employment, 40.49% of investments and 51.10% of exports in the country and at the same
time, the macro indicators show no variation in the trend growth for the last 7-8 years.”CAG, India12
While, DGFT (Directorate General of Foreign Trade) highlighted that SEZs scheme was
introduced in April 2000 with a view to provide an internationally competitive environment
for exports and for continuity and stability of scheme, SEZs Act was enacted in 2005.
The scheme has shown a tremendous growth in infrastructure investment, employment and
exports. Exports have touched Rs. 4,67,337 crore in 2016 vis-à-vis Rs. 22,000 crore in 2005;
11 Out of these two SEZs were already in existence prior to the enactment of SEZ Act,2005 12 Report of the Comptroller and Auditor General of India, Performance of SEZs, Union Government, Department of Revenue – Indirect taxes – Customs No. 21 of 2004
63.84.6
1.84.9
4.3
20.7
NotifiedSEZs (%)
IT/ITES/Electronic Hardware/Semiconductor/ServicesBio-tech
Multi-Product
Pharmaceuticals/chemicals
Engineering
30
PHD Research Bureau
similarly investment attracted was Rs. 4,06,690 crore till Sep 2016 in comparison to Rs.
4,000 crore in 2005.
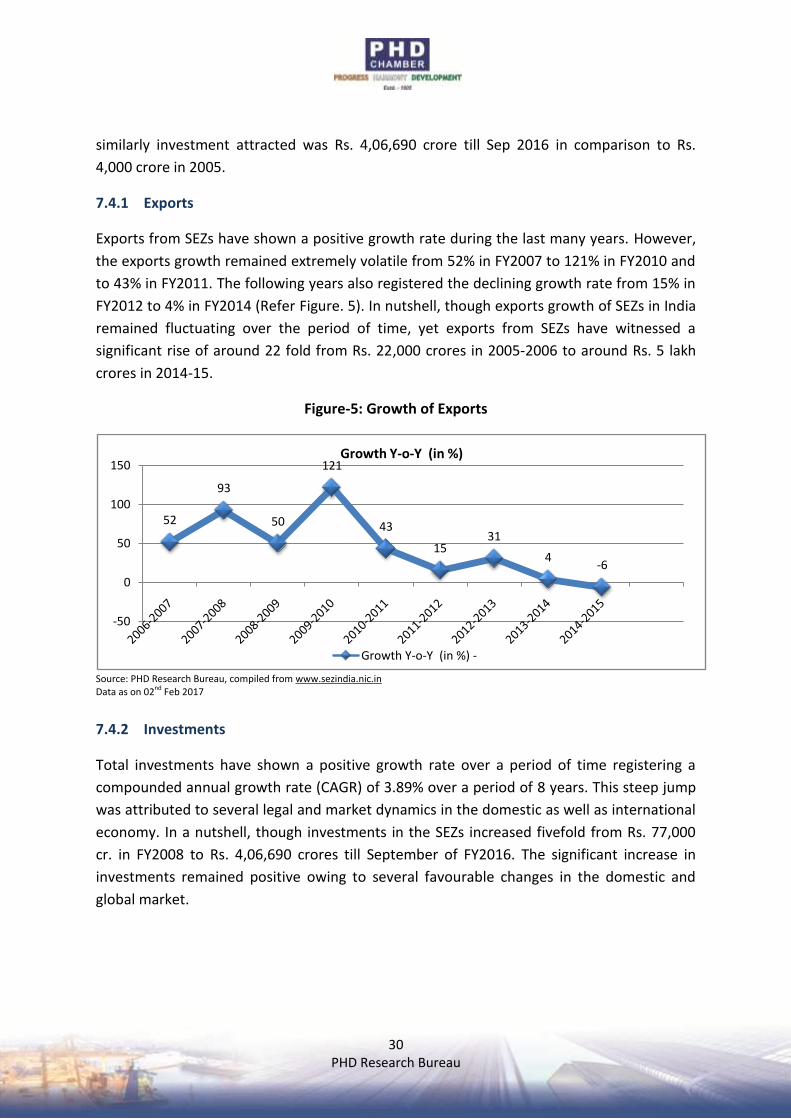
7.4.1 Exports
Exports from SEZs have shown a positive growth rate during the last many years. However,
the exports growth remained extremely volatile from 52% in FY2007 to 121% in FY2010 and
to 43% in FY2011. The following years also registered the declining growth rate from 15% in
FY2012 to 4% in FY2014 (Refer Figure. 5). In nutshell, though exports growth of SEZs in India
remained fluctuating over the period of time, yet exports from SEZs have witnessed a
significant rise of around 22 fold from Rs. 22,000 crores in 2005-2006 to around Rs. 5 lakh
crores in 2014-15.
Figure-5: Growth of Exports
Source: PHD Research Bureau, compiled from www.sezindia.nic.in Data as on 02nd Feb 2017
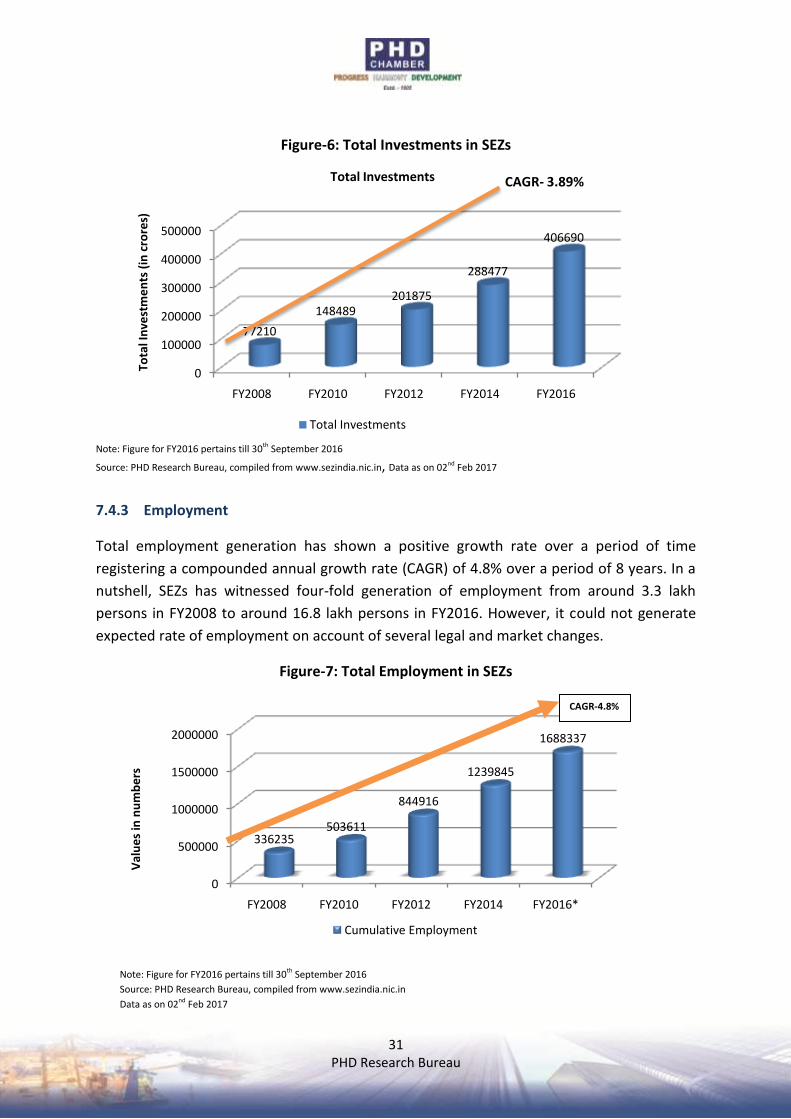
7.4.2 Investments
Total investments have shown a positive growth rate over a period of time registering a
compounded annual growth rate (CAGR) of 3.89% over a period of 8 years. This steep jump
was attributed to several legal and market dynamics in the domestic as well as international
economy. In a nutshell, though investments in the SEZs increased fivefold from Rs. 77,000
cr. in FY2008 to Rs. 4,06,690 crores till September of FY2016. The significant increase in
investments remained positive owing to several favourable changes in the domestic and
global market.
52
93
50
121
43
1531
4-6
-50
0
50
100
150Growth Y-o-Y (in %)
Growth Y-o-Y (in %) -
31
PHD Research Bureau
Figure-6: Total Investments in SEZs
Note: Figure for FY2016 pertains till 30th September 2016
Source: PHD Research Bureau, compiled from www.sezindia.nic.in, Data as on 02nd Feb 2017
7.4.3 Employment
Total employment generation has shown a positive growth rate over a period of time
registering a compounded annual growth rate (CAGR) of 4.8% over a period of 8 years. In a
nutshell, SEZs has witnessed four-fold generation of employment from around 3.3 lakh
persons in FY2008 to around 16.8 lakh persons in FY2016. However, it could not generate
expected rate of employment on account of several legal and market changes.
Figure-7: Total Employment in SEZs
Note: Figure for FY2016 pertains till 30th September 2016
Source: PHD Research Bureau, compiled from www.sezindia.nic.in
Data as on 02nd Feb 2017
0
500000
1000000
1500000
2000000
FY2008 FY2010 FY2012 FY2014 FY2016*
336235503611
844916
1239845
1688337
Val
ue
s in
nu
mb
ers
Cumulative Employment
CAGR-4.8%
0
100000
200000
300000
400000
500000
FY2008 FY2010 FY2012 FY2014 FY2016
77210
148489201875
288477
406690
Tota
l In
vest
me
nts
(in
cro
res)
Total Investments
Total Investments
CAGR- 3.89%
32
PHD Research Bureau
8. Survey analysis of the SEZs operating in India
As per our survey analysis for reviewing the performances of SEZs in India, we got to
understand the SEZs’ developers/units view-points relating to issues of SEZs and their
expectations with regard to stability in the policy environment and incentives to operate in
the SEZs.
The survey found that the approach of SEZs developers/Units towards SEZs has become
pessimistic in the present times. They felt that operating in Domestic Tariff Area (DTA) has
become more beneficial as compared to operating within SEZs especially after withdrawal of
exemption for Minimum Alternate Tax (MAT) and Dividend Distribution Tax (DDT) for the
SEZs.
Signing of more Free Trade Agreements (FTAs) by India which enabled Indian exporters
outside the SEZs to import duty free imports of inputs also acted as a disincentive for
exporters operating within SEZs. In a nutshell, almost all the SEZs’ developers/units
unanimously felt that, hardly there is any significant export benefits that are left to operate
within the SEZs in India over to operate within its DTA.
The detailed survey results w.r.t SEZs developers’ viewpoints towards different aspects are
discussed below:
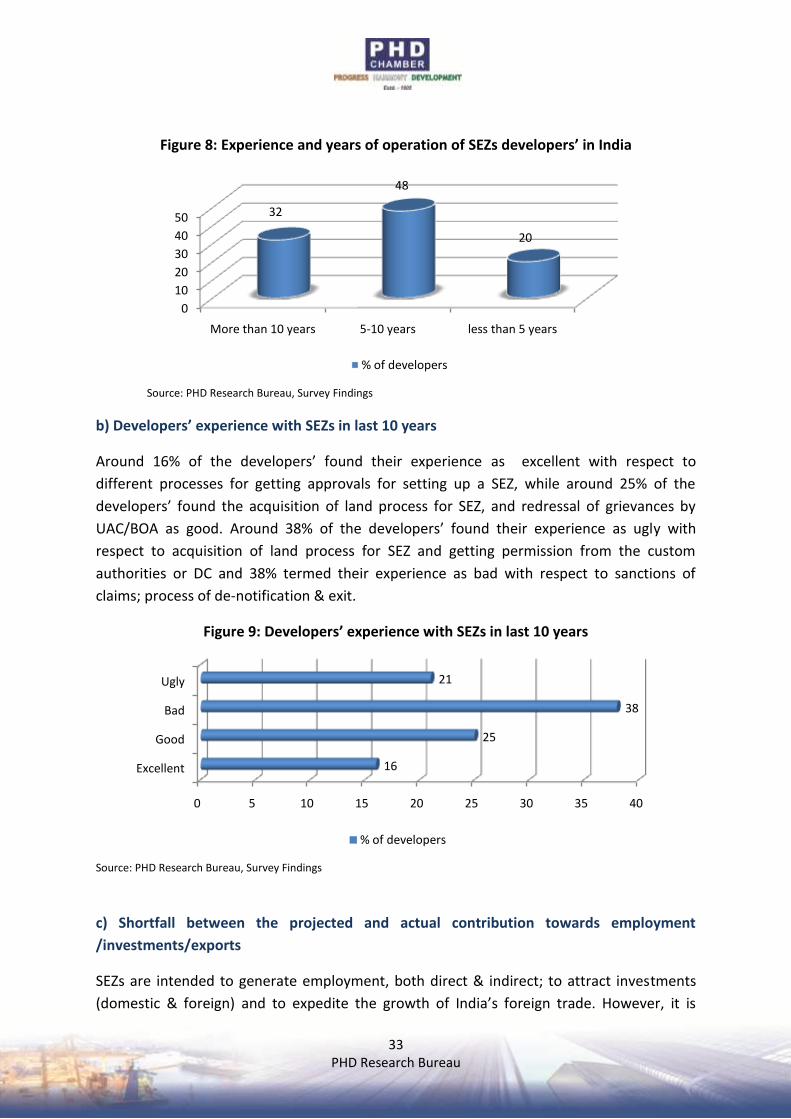
a) Experience and years of operation of SEZs developers’ in India
The Survey revealed that around 32% of the developers are operating for more than 10
years in India, around 48% of the developers are operating for 5-10 years, and only 20% of
the developers are operating for less than 5 years. This could be attributed to enactment of
SEZ 2005 and formulation of SEZ Rules 2006 which witnessed significant growth in no. of
formal approvals, notifications and operational SEZs in India. However, the period from
2012-13 witnessed the fall in number of SEZs by developers’/units because of economic
meltdown, poor market response, non-availability of skilled labour force, and mainly the
imposition of MAT and DDT on SEZs.
33
PHD Research Bureau
Figure 8: Experience and years of operation of SEZs developers’ in India
Source: PHD Research Bureau, Survey Findings
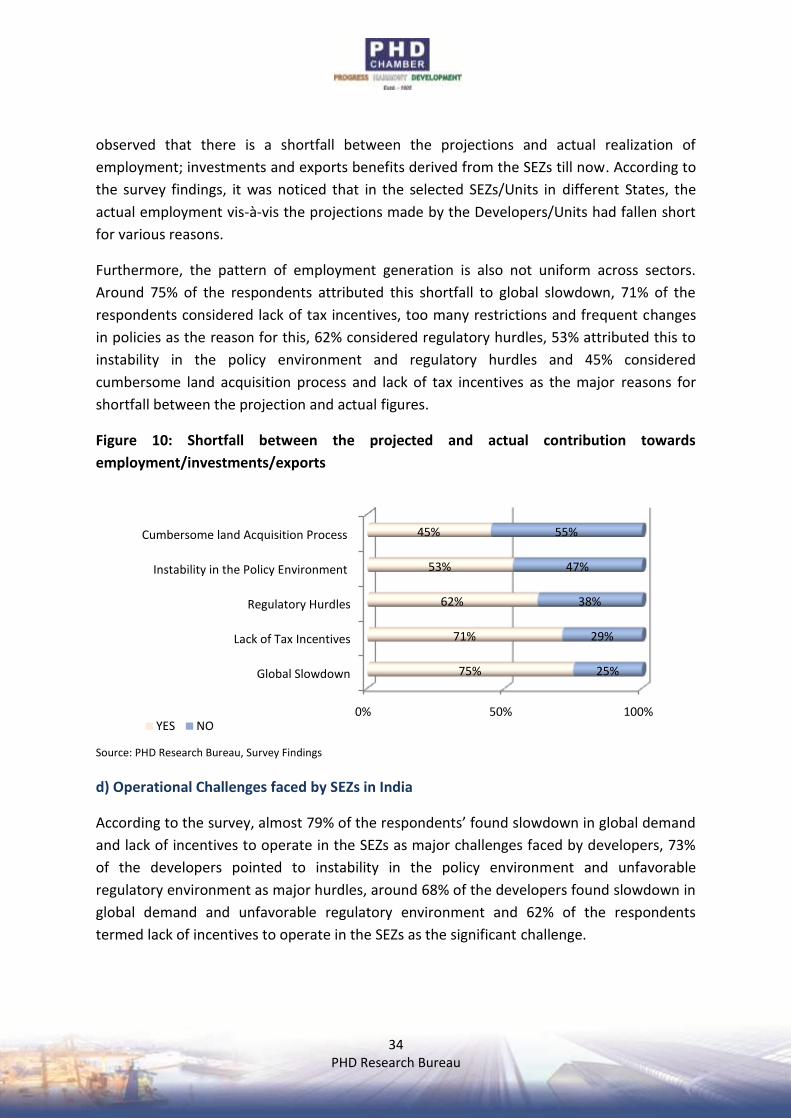
b) Developers’ experience with SEZs in last 10 years
Around 16% of the developers’ found their experience as excellent with respect to
different processes for getting approvals for setting up a SEZ, while around 25% of the
developers’ found the acquisition of land process for SEZ, and redressal of grievances by
UAC/BOA as good. Around 38% of the developers’ found their experience as ugly with
respect to acquisition of land process for SEZ and getting permission from the custom
authorities or DC and 38% termed their experience as bad with respect to sanctions of
claims; process of de-notification & exit.
Figure 9: Developers’ experience with SEZs in last 10 years
Source: PHD Research Bureau, Survey Findings
c) Shortfall between the projected and actual contribution towards employment
/investments/exports
SEZs are intended to generate employment, both direct & indirect; to attract investments
(domestic & foreign) and to expedite the growth of India’s foreign trade. However, it is
0
10
20
30
40
50
More than 10 years 5-10 years less than 5 years
32
48
20
% of developers
0 5 10 15 20 25 30 35 40
Excellent
Good
Bad
Ugly
16
25
38
21
% of developers
34
PHD Research Bureau
observed that there is a shortfall between the projections and actual realization of
employment; investments and exports benefits derived from the SEZs till now. According to
the survey findings, it was noticed that in the selected SEZs/Units in different States, the
actual employment vis-à-vis the projections made by the Developers/Units had fallen short
for various reasons.
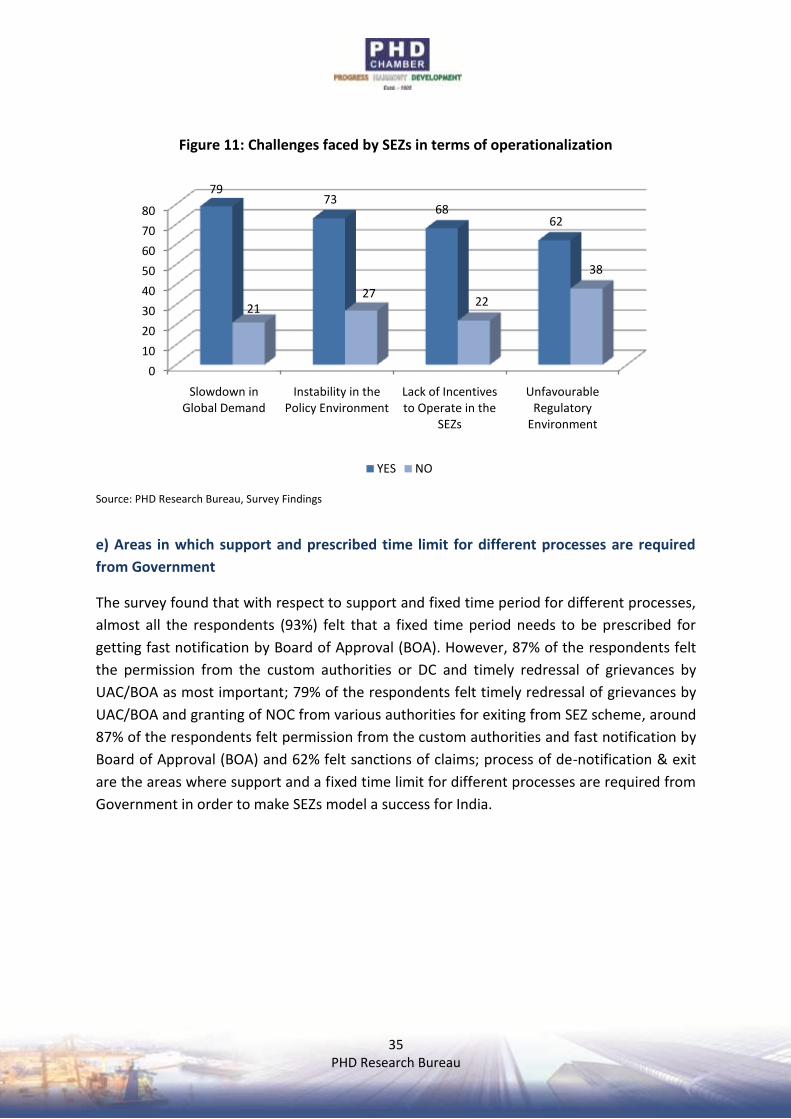
Furthermore, the pattern of employment generation is also not uniform across sectors.
Around 75% of the respondents attributed this shortfall to global slowdown, 71% of the
respondents considered lack of tax incentives, too many restrictions and frequent changes
in policies as the reason for this, 62% considered regulatory hurdles, 53% attributed this to
instability in the policy environment and regulatory hurdles and 45% considered
cumbersome land acquisition process and lack of tax incentives as the major reasons for
shortfall between the projection and actual figures.
Figure 10: Shortfall between the projected and actual contribution towards
employment/investments/exports
Source: PHD Research Bureau, Survey Findings
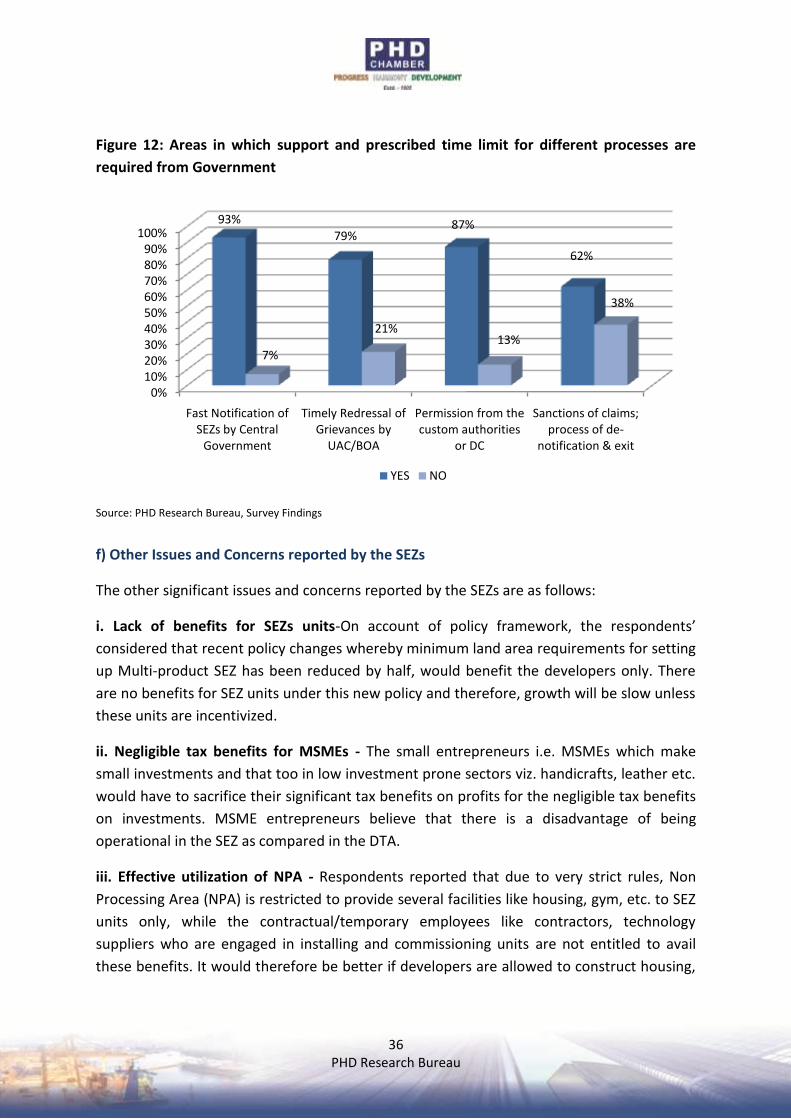
d) Operational Challenges faced by SEZs in India
According to the survey, almost 79% of the respondents’ found slowdown in global demand
and lack of incentives to operate in the SEZs as major challenges faced by developers, 73%
of the developers pointed to instability in the policy environment and unfavorable
regulatory environment as major hurdles, around 68% of the developers found slowdown in
global demand and unfavorable regulatory environment and 62% of the respondents
termed lack of incentives to operate in the SEZs as the significant challenge.
0% 50% 100%
Global Slowdown
Lack of Tax Incentives
Regulatory Hurdles
Instability in the Policy Environment
Cumbersome land Acquisition Process
75%
71%
62%
53%
45%
25%
29%
38%
47%
55%
YES NO
35
PHD Research Bureau
Figure 11: Challenges faced by SEZs in terms of operationalization
Source: PHD Research Bureau, Survey Findings
e) Areas in which support and prescribed time limit for different processes are required
from Government
The survey found that with respect to support and fixed time period for different processes,
almost all the respondents (93%) felt that a fixed time period needs to be prescribed for
getting fast notification by Board of Approval (BOA). However, 87% of the respondents felt
the permission from the custom authorities or DC and timely redressal of grievances by
UAC/BOA as most important; 79% of the respondents felt timely redressal of grievances by
UAC/BOA and granting of NOC from various authorities for exiting from SEZ scheme, around
87% of the respondents felt permission from the custom authorities and fast notification by
Board of Approval (BOA) and 62% felt sanctions of claims; process of de-notification & exit
are the areas where support and a fixed time limit for different processes are required from
Government in order to make SEZs model a success for India.
0
10
20
30
40
50
60
70
80
Slowdown in Global Demand
Instability in the Policy Environment
Lack of Incentives to Operate in the
SEZs
Unfavourable Regulatory
Environment
7973
6862
2127
22
38
YES NO
36
PHD Research Bureau
Figure 12: Areas in which support and prescribed time limit for different processes are
required from Government
Source: PHD Research Bureau, Survey Findings
f) Other Issues and Concerns reported by the SEZs
The other significant issues and concerns reported by the SEZs are as follows:
i. Lack of benefits for SEZs units-On account of policy framework, the respondents’
considered that recent policy changes whereby minimum land area requirements for setting
up Multi-product SEZ has been reduced by half, would benefit the developers only. There
are no benefits for SEZ units under this new policy and therefore, growth will be slow unless
these units are incentivized.
ii. Negligible tax benefits for MSMEs - The small entrepreneurs i.e. MSMEs which make
small investments and that too in low investment prone sectors viz. handicrafts, leather etc.
would have to sacrifice their significant tax benefits on profits for the negligible tax benefits
on investments. MSME entrepreneurs believe that there is a disadvantage of being
operational in the SEZ as compared in the DTA.
iii. Effective utilization of NPA - Respondents reported that due to very strict rules, Non
Processing Area (NPA) is restricted to provide several facilities like housing, gym, etc. to SEZ
units only, while the contractual/temporary employees like contractors, technology
suppliers who are engaged in installing and commissioning units are not entitled to avail
these benefits. It would therefore be better if developers are allowed to construct housing,
0%10%20%30%40%50%60%70%80%90%
100%
Fast Notification of SEZs by Central
Government
Timely Redressal of Grievances by
UAC/BOA
Permission from the custom authorities
or DC
Sanctions of claims; process of de-
notification & exit
93%
79%87%
62%
7%
21%13%
38%
YES NO
37
PHD Research Bureau
hotels, gym etc. in NPA and are permitted to let these facilities out to anybody, if they do
not avail duty benefits.
iv. Implications of FTAs - Respondents also felt that though SEZs have access to duty-free
imports of manufacturing inputs but, as a result of signing free-trade agreements with
different countries where duties on many products are eliminated or reduced substantially
for exporters operating in DTA, have outweighed the advantage of duty free imports
accruing to SEZs .
v. Non-compliance with WTO rules results in export incompetitiveness - The respondents
also reported that SEZs are entitled to get various tax benefits but these are not compliant
with the World Trade Organization (WTO) rules. Therefore, the importing countries impose
countervailing duties on imports from India, to negate the effect of direct tax subsidies
provided to the exporters operating within SEZs. This reduces the cost competitiveness of
exports emanating from SEZs from India.
Therefore, India should not provide direct subsidies to SEZs which violates the WTO rules
and rather provide indirect benefits in terms of sops on power and land acquisition as well
as on services which are compliant with WTO rules. All these issues have discouraged the
existing SEZs developers/units to further operate within the SEZs and also the potential
investors to make investments/setting up in SEZs.
38
PHD Research Bureau
9. Monitoring and Regulation of Special Economic Zones in India
9.1 Changes in Special Economic Zone (SEZ) policy in the country-
The following initiatives have been taken in recent years for implementation of the SEZ policy in the country and resolve the issues therein: i. Minimum Land Area requirement for setting up of new SEZs has been reduced to 50% for Multi-product and Sector-specific SEZs. ii. Sectoral broad-banding has been introduced to encompass similar / related areas under the same Sector. iii. A new sector ''agro-based food processing'' sector has been introduced to encourage agro-based industries in SEZs. iv. Dual use of facilities like Social & Commercial infrastructure by SEZs and non-SEZs entities has been allowed in order to make SEZ operations more viable. v. Online processing of various activities relating to SEZ Developers and Units has been introduced for improving ease of doing business. 9.2 Guidelines by Central Government related to Land Acquisition for setting up SEZs in India-
i) All cases where the land has been allotted by the State Government or its undertaking out of the land acquired by them for industrial purposes before 5th April 2007.
Ii) In case where the land was acquired by the state Government/ its undertakings pursuant to SEZ in-principle approval and land acquisition proceedings are over on or before 5th April 2007 and there are no disputes relating to such land. iii) Where no land acquisition is involved and the applicant is in the possession of the land. iv) The Central Government had however informed that cases in which all persons interested n the land have either not submitted or thus acquiesced in the proposed acquisition of land may be considered. These instruction were again reiterated to the State Governments vide letter dated 18.08.2009. v) It also needs to be pointed out that the Board of Approvals in its 4th meeting held on 21.09.2006 had agreed that even if acquisition of agricultural land become necessary for the purposes of meeting the minimum land area requirements for the SEZ, single crop land should be acquired and the Double crop land should not exceed 10% of the total area of the SEZ.
39
PHD Research Bureau
vi) That the Department of Commerce had intimated to CAG that land is a State subject and it is for the states to frame laws / rules on the subject and it may not be appropriate for the Ministry of Commerce to give direction on the guide lines to frame any such rules. vii) It was also informed that necessary steps have already been taken by the Ministry by issuing instruction no. 29 dated 18.08.2009 and clarification letter dated 13.09.2013 to the Chief Secretaries of States/UTS. It is further submitted that by notification dated 12th August 2013, SEZ rules have been amended and the requirement of land for notification of the SEZ has been reduced to half for setting up the SEZs. Further, the land is de-notified on refunds of concessions / benefits availed as per the relevant provisions of SEZ law, and the same is put to industrial use for setting up new projects in DTA, as per the land use policy of the state government. viii) It is reiterated that certain lands in an operational SEZ could lie vacant as infrastructural development in large scale SEZs consume time and are customized as per the requirements of the incoming unit holder. But once the SEZ is notified with unit commencing imports and exports, the entire land is treated as operational and falls within the jurisdiction of the development commissioner and the land use pattern is subject to regulations in force and is not free to be sold by the Developer in any manner. ix) The appropriate government, i.e. State government shall retain the right to decide on the acquisition of the land on public purpose based on the State’s interest and deploy its administrative machinery for acquisition of land in compliance of the provisions of the Land acquisition Act. Any grievance in this respect can be addressed through the mechanism provided for redressal under the Act besides the judicial forums. Any change in the land use is subject to the approval and permission of the respective governments with terms and conditions. 9.3 Regulatory mechanism for monitoring of SEZs in India i) There is adequate mechanism to monitor the performance of SEZ as a whole and also the performances of the units in the SEZ. Chapter IV of the SEZ rules provides / stipulates the net foreign exchange requirements and monitoring according to which the unit shall achieve positive net foreign exchange earnings to be calculated cumulatively for a period of 5 years from the commencement of production. Rule 54 of SEZ rules stipulates that performance of the unit shall be monitored by the Units approval committee as per the guidelines given in Annexure-I of SEZ rules.
ii) In case approval committee comes to the conclusion that the unit not achieved the positive net foreign exchange earnings or failed to abide by any of terms and conditions of letter of approval, the said unit is liable for penal action under the provisions of the foreign trade (Development and regulations) Act, 1992.
iii) An SEZ could be established on land acquired by the Developer, assigned lands leased by land owners or by the Government or land acquired through award. Establishment of an
40
PHD Research Bureau
SEZ on lease hold land is only one of the methods and the State government basically recommends and approves the various streams in which the SEZ can receive the land.
iv) Where an SEZ established on lease hold land, the units shall receive the land only for the period of lease by the Developer and the SEZ approvals are co-terminus with the lease land approval.
v) In respect of rising of finances, they are governed by the contractual terms between the lender and the borrower and the SEZ Act does not have nay clause forbidding rising of loans. Rule-11(6) of SEZ rules provided that the developer holding the land on lease basis shall again assign lease hold rights to the entrepreneur holding valid letter of approvals.
vi) The withdrawal of benefits of MAT and DDT in respect of SEZs have adversely affected their viability and functioning of the SEZs. De-notification of SEZ land is provided under the SEZ Act within built safe guards of State government recommendations, purposes and reasoning and is subject to the approval of the Ministry of commerce and industry and appended terms and conditions, as they may deem fit. vii) The projected investment, employment and growth figures of SEZ are subject to various internal and external environments and their performance is regulated through the units commitment for achieving net foreign exchange requirements under the pecuniary penalty provisions of levy of taxes, exemptions for which were hitherto obtained by them along with interest. They are monitored through its reports from the Developer and the Units under periodic basis.
41
PHD Research Bureau
10. Economic Analysis and Conclusions:
The Special Economic Zone Act (June, 2005) & the Rules (Feb.2006) came into force with the set of objectives, which included among others to offer SEZs a clear, coherent and viable business and economic rationale anchored in local conditions. Further, SEZs must offer investors something significantly better than what is available in the rest of the economy. Although, SEZs in India have witnessed generation of employment, investments and exports over a period of time, however, it is considered that the SEZs model in India could not reap the expected rate of benefits pertaining to all these aspects. The underlined reasons which are found while conducting secondary analysis and primary survey are rise in cost of operation, global slowdown, fall in market demand, Instability in the policy environment, lack of skilled manpower and the primarily is the lack of incentives to operate in the SEZs such as imposition of MAT and DDT. Therefore, it is considered that SEZs model in India could never take off in the country. Pertaining to the different stated aspects of survey, several positive and negative facts are observed and analysed. The survey reveals that SEZs’ developers/ units are satisfied with regard to approvals, processes, creation and acquisition of SEZs processes of the government. They also feel that concerned authorities are well coordinated to handle operational activities and their notification process is also satisfactory. However, with respect to getting permission from the custom authorities or DC (for procuring / exporting / temporary /removal/sub-contracting of materials/ services etc.) and to get sanctions of claims, their experience is not satisfactory. The survey also observed the shortfall between the projections and actuals of exports/employment/investment in the SEZs and found global slowdown, recession in the shipping industry, too many restrictions & frequent changes in policies as the major reasons for this shortfall. More often than not, expectations with regard to SEZs are often inflated; objectives are overstated and strategic planning remains inadequate—resulting in stagnant development, unsustainable growth or low returns on investment. In addition, SEZ development programs should be integrated into the broader economic policy framework and the national investment environment, and be fine-tuned to be consistent with the capacity of the government. SEZ programs should be closely coordinated or linked with wider economic strategies as they evolve, supporting domestic investment in SEZs and promoting linkages, training and upgrading along the value chain. At every stage, both the broader development program and the SEZs need clear, consistent and credible political commitments at the highest levels of government. SEZ progression up the developmental scale needs to be well-timed so as to take advantage of GVC participation, and opportunities such as new FTAs or technological developments affecting outsourcing and transport costs. Balanced economic development should be taken into account for the strategic, logistical positioning over time as the economy matures. Advanced SEZs should be factored into the planning of economic or logistics corridors
42
PHD Research Bureau
connecting actual and potential SEZs with markets and regional neighbours—giving impetus to cross-border SEZs and contributing to enhanced regional and subregional cooperation. If these preconditions are approximately met, then SEZs could achieve better footing and with good policies, can become a focus of economic activity.
43
PHD Research Bureau
11. Recommendations or suggestive policy measures
On the basis of observations and analysis, following suggestions are recommended for the
fruitful outcomes of SEZs in India:
1. The administrative procedures should be streamlined wherein overall clearance mechanism should be speedy, robust and effective to transform zones as arenas for employment, new investment and development catalysts rather than enclaves for absorbing underemployed workers.
2. Relative advantages enjoyed by SEZs in terms of fiscal and other incentives vis-à-vis domestic tariff areas appear to have declined because of schemes such as Duty Drawback Scheme, Focus Product Scheme, Focus Market Scheme, etc. Therefore, zones need to be treated differently from the domestic economy and should be provided significant incentives & opportunities for domestic participation, knowledge-sharing, innovation and skills development.
3. Several success stories demonstrate the effective use of SEZs as policy tools to increase employment and exports, attract FDI and improve economic growth supported by various factors—fiscal incentives, skills upgrading, access to infrastructure & location, among others.
4. Maximizing EPZs benefits depends on how much they are integrated with their host
economies and with the overall trade and investment reform agenda. In particular, when zones are designed to pilot legal and regulatory reforms within a planned policy framework, they are more likely to reach development objectives.
5. SEZs policy in our country with respect to frequent changes in the policy environment is one of the major reasons of slackening the confidence of investors to continue and make fresh investments in SEZs. Therefore to build a strong confidence amongst the potential/existing investors, it is imperative to frame a stable, favorable and highly transparent SEZs policy with long term perspectives. In addition, policy instruments must be flexible enough to adjust to the evolving needs of the country. In addition, SEZs should remain a viable tool for developing economies, especially when reform initiatives are ex ante part of the overall strategy.
44
PHD Research Bureau
Project Team
Dr. S P Sharma
Chief Economist & Director of Research
Dr S P Sharma has more than 20 years of diverse experience in the various areas of economy and
businesses. He had begun his career with the Economic & Statistical Organisation, Government of
Punjab and subsequently worked with Government of India, the ASSOCHAM,
PricewaterhouseCoopers and the Tata Capital. Currently, he is working with PHD Chamber of
Commerce and Industry as Chief Economist to facilitate dialogue between private sector
stakeholders and Government; to represent the various industry issues to Ministries/Departments of
Govt. of India and respective State Governments. He holds M.Phil in Industrial Economics and is a
PhD in International Business from Panjab University, Chandigarh.
Ms. Rashmi Singh
Associate Economist
Currently she is looking after the Global Economy and International Relations department of PHD
Research Bureau and engaged in conducting research studies and projects. Prior to joining PHDCCI,
she has worked with RIS, Ministry of External Affairs and Ehsaas Foundation for five years as a
Consultant. Ms. Singh is a Ph.D from Center for Indo Pacific studies, Jawaharlal Nehru University. She
has also done Master of Philosophy from Centre for Indo-Pacific Studies, School of International
Studies, Jawaharlal Nehru University, New Delhi.
We are thankful to Ms. Neha Gupta, Research Associate for her assistance and support.
45
PHD Research Bureau
Disclaimer
“Special Economic Zones: Performance, Problems and Opportunities” is prepared by PHD
Chamber of Commerce and Industry to provide a broad view of Special Economic Zones in
India. This report may not be reproduced, wholly or partly in any material form, or modified,
without prior approval from the Chamber.
It may be noted that this report is for guidance and information purposes only. Though due
care has been taken to ensure accuracy of information to the best of the PHD Chamber’s
knowledge and belief, it is strongly recommended that readers should seek specific
professional advice before taking any decisions.
Please note that the PHD Chamber of Commerce and Industry does not take any
responsibility for outcome of decisions taken as a result of relying on the content of this
report. PHD Chamber of Commerce and Industry shall in no way, be liable for any direct or
indirect damages that may arise due to any act or omission on the part of the Reader or
User due to any reliance placed or guidance taken from any portion of this report.
Copyright 2017
PHD Chamber of Commerce and Industry
ISBN NO : 978 93 84145 39 2
ALL RIGHTS RESERVED.
No part of this report including the cover, shall be reproduced, stored in a retrieval system,
or transmitted by any means, electronic, mechanical, photocopying, recording or otherwise,
without the prior written permission of, and acknowledgement of the publisher (PHD
Chamber of Commerce and Industry).
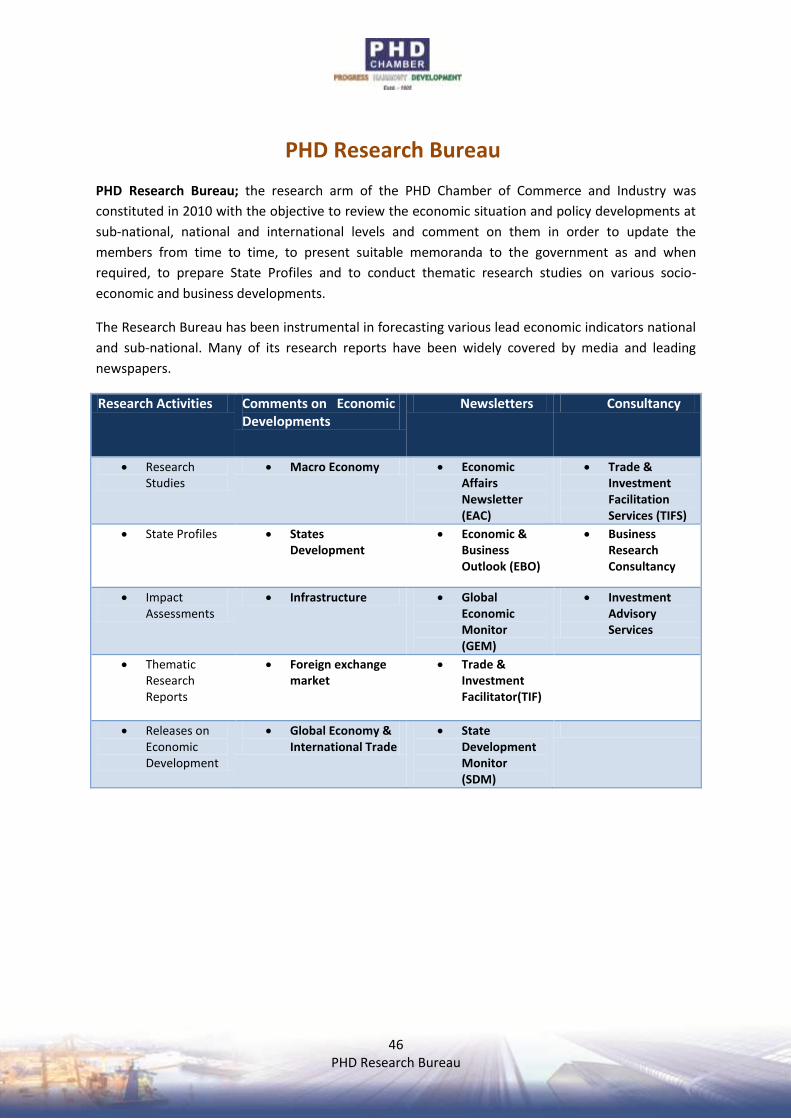
46
PHD Research Bureau
PHD Research Bureau
PHD Research Bureau; the research arm of the PHD Chamber of Commerce and Industry was
constituted in 2010 with the objective to review the economic situation and policy developments at
sub-national, national and international levels and comment on them in order to update the
members from time to time, to present suitable memoranda to the government as and when
required, to prepare State Profiles and to conduct thematic research studies on various socio-
economic and business developments.
The Research Bureau has been instrumental in forecasting various lead economic indicators national
and sub-national. Many of its research reports have been widely covered by media and leading
newspapers.
Research Activities Comments on Economic Developments
Newsletters Consultancy
Research Studies
Macro Economy Economic Affairs Newsletter (EAC)
Trade & Investment Facilitation Services (TIFS)
State Profiles States Development
Economic & Business Outlook (EBO)
Business Research Consultancy
Impact Assessments
Infrastructure Global Economic Monitor (GEM)
Investment Advisory Services
Thematic Research Reports
Foreign exchange market
Trade & Investment Facilitator(TIF)
Releases on Economic Development
Global Economy & International Trade
State Development Monitor (SDM)
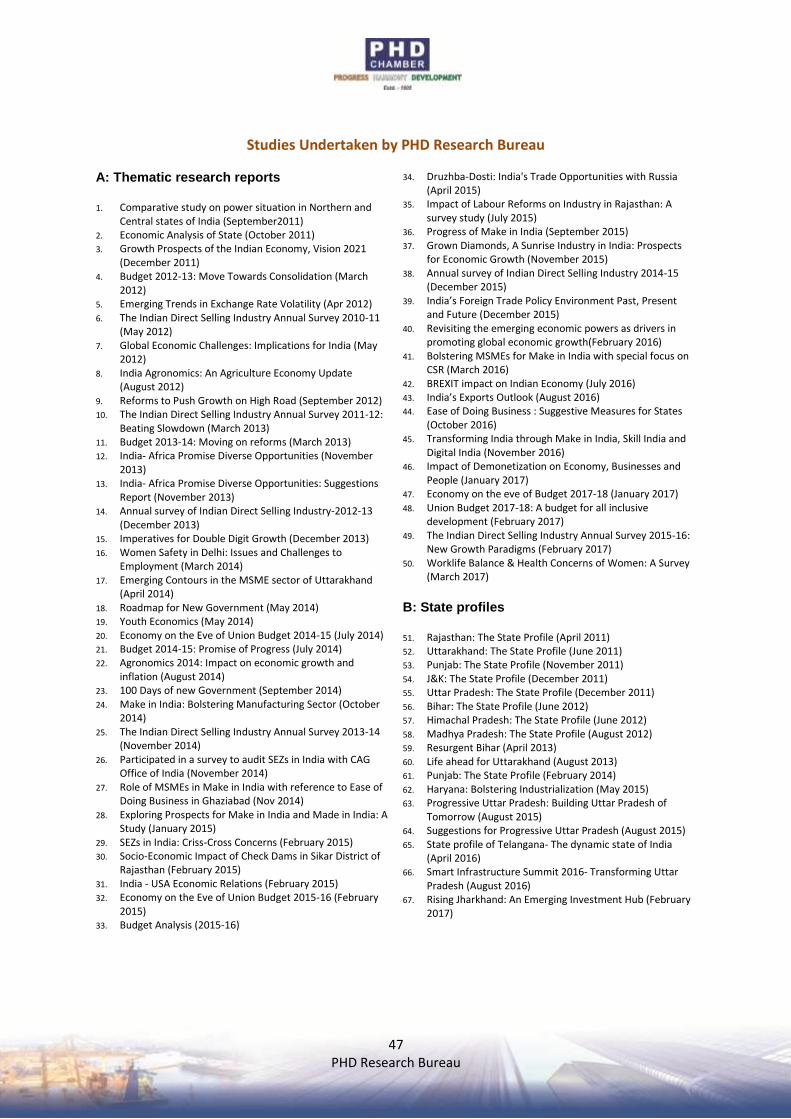
47
PHD Research Bureau
Studies Undertaken by PHD Research Bureau
A: Thematic research reports
1. Comparative study on power situation in Northern and Central states of India (September2011)
2. Economic Analysis of State (October 2011) 3. Growth Prospects of the Indian Economy, Vision 2021
(December 2011) 4. Budget 2012-13: Move Towards Consolidation (March
2012) 5. Emerging Trends in Exchange Rate Volatility (Apr 2012) 6. The Indian Direct Selling Industry Annual Survey 2010-11
(May 2012) 7. Global Economic Challenges: Implications for India (May
2012) 8. India Agronomics: An Agriculture Economy Update
(August 2012) 9. Reforms to Push Growth on High Road (September 2012) 10. The Indian Direct Selling Industry Annual Survey 2011-12:
Beating Slowdown (March 2013) 11. Budget 2013-14: Moving on reforms (March 2013) 12. India- Africa Promise Diverse Opportunities (November
2013) 13. India- Africa Promise Diverse Opportunities: Suggestions
Report (November 2013) 14. Annual survey of Indian Direct Selling Industry-2012-13
(December 2013) 15. Imperatives for Double Digit Growth (December 2013) 16. Women Safety in Delhi: Issues and Challenges to
Employment (March 2014) 17. Emerging Contours in the MSME sector of Uttarakhand
(April 2014) 18. Roadmap for New Government (May 2014) 19. Youth Economics (May 2014) 20. Economy on the Eve of Union Budget 2014-15 (July 2014) 21. Budget 2014-15: Promise of Progress (July 2014) 22. Agronomics 2014: Impact on economic growth and
inflation (August 2014) 23. 100 Days of new Government (September 2014) 24. Make in India: Bolstering Manufacturing Sector (October
2014) 25. The Indian Direct Selling Industry Annual Survey 2013-14
(November 2014) 26. Participated in a survey to audit SEZs in India with CAG
Office of India (November 2014) 27. Role of MSMEs in Make in India with reference to Ease of
Doing Business in Ghaziabad (Nov 2014) 28. Exploring Prospects for Make in India and Made in India: A
Study (January 2015) 29. SEZs in India: Criss-Cross Concerns (February 2015) 30. Socio-Economic Impact of Check Dams in Sikar District of
Rajasthan (February 2015) 31. India - USA Economic Relations (February 2015) 32. Economy on the Eve of Union Budget 2015-16 (February
2015) 33. Budget Analysis (2015-16)
34. Druzhba-Dosti: India's Trade Opportunities with Russia (April 2015)
35. Impact of Labour Reforms on Industry in Rajasthan: A survey study (July 2015)
36. Progress of Make in India (September 2015) 37. Grown Diamonds, A Sunrise Industry in India: Prospects
for Economic Growth (November 2015) 38. Annual survey of Indian Direct Selling Industry 2014-15
(December 2015) 39. India’s Foreign Trade Policy Environment Past, Present
and Future (December 2015) 40. Revisiting the emerging economic powers as drivers in
promoting global economic growth(February 2016) 41. Bolstering MSMEs for Make in India with special focus on
CSR (March 2016) 42. BREXIT impact on Indian Economy (July 2016) 43. India’s Exports Outlook (August 2016) 44. Ease of Doing Business : Suggestive Measures for States
(October 2016) 45. Transforming India through Make in India, Skill India and
Digital India (November 2016) 46. Impact of Demonetization on Economy, Businesses and
People (January 2017) 47. Economy on the eve of Budget 2017-18 (January 2017) 48. Union Budget 2017-18: A budget for all inclusive
development (February 2017) 49. The Indian Direct Selling Industry Annual Survey 2015-16:
New Growth Paradigms (February 2017) 50. Worklife Balance & Health Concerns of Women: A Survey
(March 2017)
B: State profiles
51. Rajasthan: The State Profile (April 2011) 52. Uttarakhand: The State Profile (June 2011) 53. Punjab: The State Profile (November 2011) 54. J&K: The State Profile (December 2011) 55. Uttar Pradesh: The State Profile (December 2011) 56. Bihar: The State Profile (June 2012) 57. Himachal Pradesh: The State Profile (June 2012) 58. Madhya Pradesh: The State Profile (August 2012) 59. Resurgent Bihar (April 2013) 60. Life ahead for Uttarakhand (August 2013) 61. Punjab: The State Profile (February 2014) 62. Haryana: Bolstering Industrialization (May 2015) 63. Progressive Uttar Pradesh: Building Uttar Pradesh of
Tomorrow (August 2015) 64. Suggestions for Progressive Uttar Pradesh (August 2015) 65. State profile of Telangana- The dynamic state of India
(April 2016) 66. Smart Infrastructure Summit 2016- Transforming Uttar
Pradesh (August 2016) 67. Rising Jharkhand: An Emerging Investment Hub (February
2017)
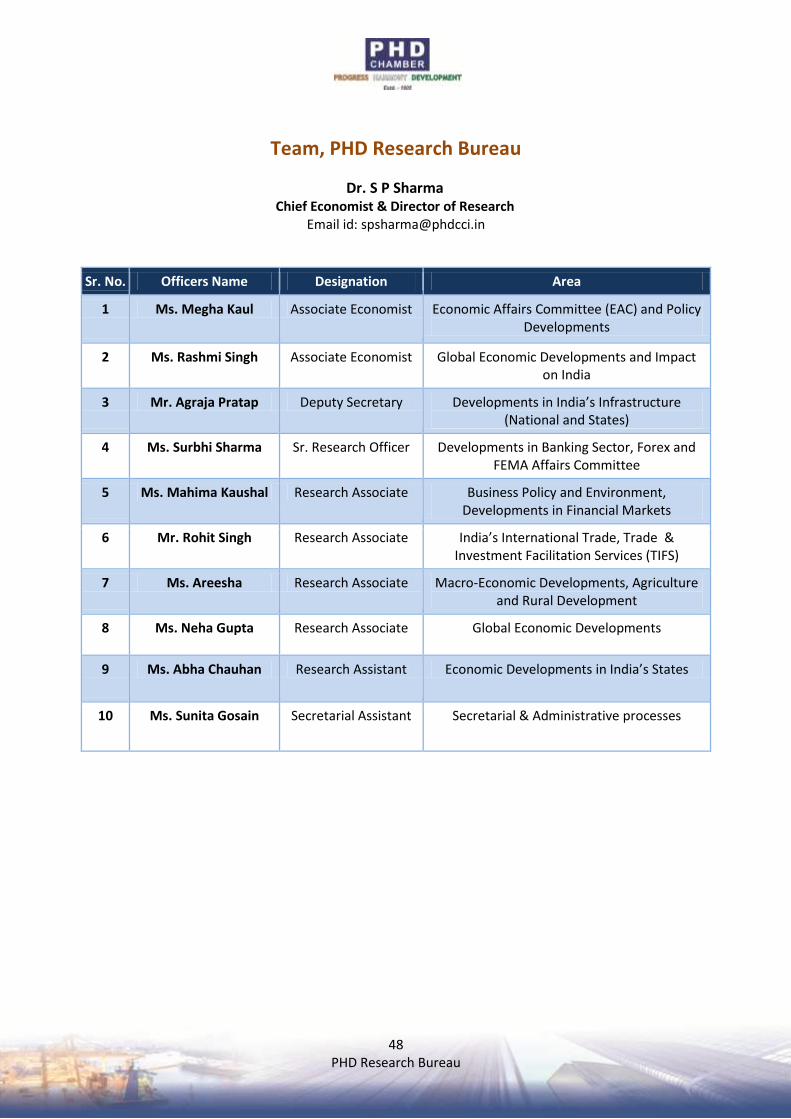
48
PHD Research Bureau
Team, PHD Research Bureau
Dr. S P Sharma Chief Economist & Director of Research
Email id: [email protected]
Sr. No. Officers Name Designation Area
1 Ms. Megha Kaul Associate Economist Economic Affairs Committee (EAC) and Policy Developments
2 Ms. Rashmi Singh Associate Economist Global Economic Developments and Impact on India
3 Mr. Agraja Pratap Deputy Secretary Developments in India’s Infrastructure (National and States)
4 Ms. Surbhi Sharma Sr. Research Officer Developments in Banking Sector, Forex and FEMA Affairs Committee
5 Ms. Mahima Kaushal Research Associate Business Policy and Environment, Developments in Financial Markets
6 Mr. Rohit Singh Research Associate India’s International Trade, Trade & Investment Facilitation Services (TIFS)
7 Ms. Areesha Research Associate Macro-Economic Developments, Agriculture and Rural Development
8 Ms. Neha Gupta Research Associate Global Economic Developments
9 Ms. Abha Chauhan Research Assistant Economic Developments in India’s States
10 Ms. Sunita Gosain Secretarial Assistant Secretarial & Administrative processes