Assembly constraints drive co-evolution among ribosomal constituents

Ptc6 Is Required for Proper Rapamycin-Induced Down-Regulation of the Genes Coding for Ribosomal and rRNAProcessing Proteins in S. cerevisiaeAsier Gonzalez¤, Carlos Casado, Joaquın Arino, Antonio Casamayor*
Institut de Biotecnologia i Biomedicina (IBB) and Departament de Bioquımica i Biologia Molecular, Facultat de Veterinaria, Universitat Autonoma de Barcelona, Cerdanyola
del Valles, Spain
Abstract
Ptc6 is one of the seven components (Ptc1-Ptc7) of the protein phosphatase 2C family in the yeast Saccharomyces cerevisiae.In contrast to other type 2C phosphatases, the cellular role of this isoform is poorly understood. We present here acomprehensive characterization of this gene product. Cells lacking Ptc6 are sensitive to zinc ions, and somewhat tolerant tocell-wall damaging agents and to Li+. Ptc6 mutants are sensitive to rapamycin, albeit to lesser extent than ptc1 cells. Thisphenotype is not rescued by overexpression of PTC1 and mutation of ptc6 does not reproduce the characteristic geneticinteractions of the ptc1 mutation with components of the TOR pathway, thus suggesting different cellular roles for bothisoforms. We show here that the rapamycin-sensitive phenotype of ptc6 cells is unrelated to the reported role of Pt6 incontrolling pyruvate dehydrogenase activity. Lack of Ptc6 results in substantial attenuation of the transcriptional responseto rapamycin, particularly in the subset of repressed genes encoding ribosomal proteins or involved in rRNA processing. Incontrast, repressed genes involved in translation are Ptc6-independent. These effects cannot be attributed to the regulationof the Sch9 kinase, but they could involve modulation of the binding of the Ifh1 co-activator to specific gene promoters.
Citation: Gonzalez A, Casado C, Arino J, Casamayor A (2013) Ptc6 Is Required for Proper Rapamycin-Induced Down-Regulation of the Genes Coding forRibosomal and rRNA Processing Proteins in S. cerevisiae. PLoS ONE 8(5): e64470. doi:10.1371/journal.pone.0064470
Editor: Veerle Janssens, University of Leuven (KU Leuven), Faculty of Medicine, Belgium
Received October 5, 2012; Accepted April 16, 2013; Published May 21, 2013
Copyright: � 2013 Gonzalez et al. This is an open-access article distributed under the terms of the Creative Commons Attribution License, which permitsunrestricted use, distribution, and reproduction in any medium, provided the original author and source are credited.
Funding: Supported by grants BFU2009-11593 to A.C. and EUI2009-04147 (SysMo2) and BFU2011-30197-C3-01 to J.A., and Ministry of Science and Innovation,Spain, and FEDER. J.A. is the recipient of ‘‘Ajut de Suport a les Activitats dels Grups de Recerca’’ (Grant 2009SGR-1091) and an ICREA Academia Award (Generalitatde Catalunya). The funders had no role in study design, data collection and analysis, decision to publish, or preparation of the manuscript.
Competing Interests: The authors have declared that no competing interests exist.
* E-mail: [email protected]
¤ Current address: Department of Biochemistry, Biozentrum, University of Basel, Basel, Switzerland
Introduction
Type 2C Ser/Thr protein phosphatases (PP2Cs) are a group of
monomeric enzymes highly conserved throughout evolution. The
classification of these proteins according to their primary structure
shows that in fungi there are five major groups of PP2Cs [1]. In
the budding yeast Saccharomyces cerevisiae the PP2C family is
composed of seven members (Ptc1-7) that include representatives
of all structural groups previously described. The last member
incorporated to the Ptc family was YCR079w (PTC6), which was
presumed for many years to encode a type 2C enzyme [2,3], but
whose phosphatase activity was only recently demonstrated [4]. It
is known that the PTC7 gene can produce 2 different polypeptides
by differential splicing [5]. As occurs in higher eukaryotes, yeast
PP2Cs were initially associated to the regulation of cell growth and
stress signaling. Our current knowledge, however, suggests that
PP2C functions are much more diverse (for a review see [1] and
references therein). While the subcellular localization of Ptc1-4 is
cytoplasmatic or nuclear [6,7], Ptc5, Ptc6 and the spliced version
of Ptc7 are located in the mitochondria [5,8–11]. There is some
controversy, however, about the localization of Ptc6 within this
organelle because it has been proposed that it is localized to either
the mitochondrial intermembrane space or the mitochondrial
matrix [11,12].
In spite of the growing body of knowledge, our understanding of
the function(s) and regulatory mechanisms for each specific PP2C
isoform is still rather limited, and this is particularly true for the
mitochondrially-located isoforms. For instance, only one cellular
target for Ptc6 has been described so far. Both, Ptc6 and Ptc5,
seem to dephosphorylate Ser313 of Pda1, a component of the E1asubunit of the pyruvate dehydrogenase (PDH) complex that
catalyzes the oxidative decarboxylation of pyruvate to form acetyl-
CoA thus connecting glycolysis and the tricarboxylic acid cycle
[13]. In fact, the PDH complex activity in ptc6 or ptc5 strains is
greatly reduced [10,13]. Moreover, ptc6 mutants are unable to
degrade aconitase in a Pep4-dependent fashion and have impaired
mitochondrial transport into the vacuole after prolonged station-
ary phase, suggesting that Ptc6 plays a role in the mitochondrial
degradation process known as mitophagy (see [14] and references
therein). As a consequence, Ptc6 is necessary for survival of lactate-
growing stationary phase cells [11]. The role of Ptc6 in mitophagy
is probably exerted through Rtg3, the transcription factor that
mediates the RTG (retrograde signaling pathway) response [15].
Due to this function in mitophagy, Ptc6 has received the Aup1 (for
autophagy-related protein phosphatase) alias [11].
Remarkably, among the ptc family mutants, only ptc1 and ptc6
are sensitive to rapamycin (an inhibitor of the activity of Tor
kinases) and caffeine (a compound that has been related with the
PLOS ONE | www.plosone.org 1 May 2013 | Volume 8 | Issue 5 | e64470
cell wall integrity pathway and that can also act as an inhibitor of
Tor kinases) [4,16–19]. On the other hand, overexpression of
PTC6 renders cells tolerant to rapamycin [4]. The TOR (target of
rapamycin) pathway is a conserved signaling network (for a review,
see [20] and references therein) important for cell growth control
that involves the phosphatidylinositol kinase-related protein kinase
(PIKK) Tor1 and Tor2. These kinases are found in two
functionally and structurally distinct multiprotein complexes:
TORC1 and TORC2, each of which signals through a different
set of effector pathways. TORC1 is rapamycin-sensitive, whereas
TORC2 is rapamycin insensitive [21]. TORC1 activates cell
growth by positively regulating diverse anabolic processes, such as
transcription, protein synthesis, ribosome biogenesis, nutrient
transport, and mitochondrial metabolism, whereas it represses
several catabolic pathways, such as mRNA degradation, ubiquitin-
dependent proteolysis, autophagy and apoptosis. However, the
molecular mechanisms by which TORC1 signals to these diverse
processes in both yeast and mammals are still open to discussion.
In particular, only a few substrates of either TORC1 or its direct
effectors such as the AGC kinase Sch9 [22] or the Tap42/Tip41-
PP2A/Sit4 system (see [20] and references therein) are known.
The rapamycin-sensitive phenotype of the ptc1 mutant lead us to
recently uncover a role for Ptc1 in normal signaling through the
TORC1 pathway, possibly by regulating a step upstream of Sit4/
Tip41 function [19]. Consequently, we also decided to investigate
the nature of the possible functional connection between Ptc6 and
this pathway. Our results suggest that the role of Ptc1 and Ptc6 in
maintaining the normal function of TORC1 pathway is different.
Genetic studies also indicate that the rapamycin-sensitive pheno-
type derived by the lack of Ptc6 is not mediated by its role on the
regulation of the PDH complex or the mitophagy process.
Remarkably, transcriptomic analyses show that mutation of
PTC6 significantly attenuates the transcriptional changes caused
by rapamycin, mainly at the level of repressed genes. In this study
we propose that the inability to repress transcription of certain
genes in response to rapamycin may be the cause of the
phenotypes observed in Ptc6-deficient cells.
Materials and Methods
Yeast and Escherichia coli growth conditionsYeast cells were incubated at 28uC in YPD medium (1% yeast
extract, 2% peptone and 2% glucose) or in synthetic medium [23]
containing 2% glucose and lacking the appropriate selection
requirements. The Low Ammonium medium is synthetic medium
containing 2% glucose and supplemented with 10 mM ammoni-
um sulphate, 40 mg/l methionine, 20 mg/l histidine and 100 mg/
l leucine.
E. coli DH5a cells were used as plasmid DNA host and were
grown at 37uC in LB broth supplemented with 50 mg/ml
ampicillin, when required. Bacterial and yeast cells were
transformed using standard methods. Standard recombinant
DNA techniques were performed as described elsewhere.
The sensitivity of yeast cells to diverse stressing agents was
evaluated by growth on agar plates (drop tests) as described in
[24]. Sensitivity of each strain to rapamycin was evaluated in
liquid cultures as previously described [25] and represented as
relative growth respect the untreated strain.
Gene disruptions and plasmid constructionThe S. cerevisiae strains used in this work are listed in the Table 1.
Single kanMX deletion mutants in the BY4741 background were
generated in the context of the Saccharomyces Genome Deletion
Project [26]. Replacement of the PTC6 coding region by the nat1
marker from Streptomyces noursei was accomplished as follows: the
1.40 kbp DNA fragment containing the nat1 gene, flanked by
genomic sequences corresponding to 240/+5 and +1310/+1352
relative to the PTC6 ATG codon, was amplified from the plasmid
pAG25 [27] with the oligonucleotides 59-PTC6-disr_nat and 39-
PTC6-disr_nat (Table S1). The ptc6::nat1 disruption cassette was
transformed in the appropriate strains and positive clones were
selected in the presence of 100 mg/ml nourseothricin (Werner
BioAgents). Double mutants ptc2 ptc6 and ptc3 ptc6 were
constructed by introducing the ptc6::nat1 disruption cassette in
the ptc2:kanMX and ptc3::kanMX mutants from the BY4741
deletion bank.
The plasmids containing LacZ translational fusions with the
promoters of GAP1, GLN1, GDH1 and MEP1 have been previously
described in [19]. The construction of plasmids YEp195-PTC1
and YEp195-PTC1[D58N] was reported earlier in [28] and [19],
respectively. Plasmid pJU676 (pRS416-SCH9-5HA) was a gener-
Table 1. Yeast strains used in this work.
Name Relevant genotype Source/Reference
BY4741 MATa his3D1 leu2Dmet15D ura3D
[26]
AGS71 BY4741 ptc6::nat1 This work
MAR14 BY4741 ptc1::nat1 [52]
CCV190 BY4741 ptc2::kanMX4ptc6::nat1
This work
CCV191 BY4741 ptc3::kanMX4ptc6::nat1
This work
AGS60 BY4741 ptc6::kanMX4ptc1::nat1
This work
CCV22 BY4741 ure2::kanMX4ptc6::nat1
This work
CCV24 BY4741 gat1::kanMX4ptc6::nat1
This work
AGS72 BY4741 tor1::kanMX4ptc6::nat1
This work
AGS73 BY4741 tip41::kanMX4ptc6::nat1
This work
AGS74 BY4741 sit4::kanMX4ptc6::nat1
This work
CCV25 BY4741 ptc5::kanMX4ptc6::nat1
This work
CCV26 BY4741 lpd1::kanMX4ptc6: nat1
This work
AGS75 BY4741 pda2::kanMX4ptc6::nat1
This work
AGS76 BY4741 pkp1::kanMX4ptc6::nat1
This work
AGS77 BY4741 pdb1::kanMX4ptc6::nat1
This work
CCV29 BY4741 pep4::kanMX4ptc6::nat1
This work
CCV30 BY4741 atg1::kanMX4ptc6::nat1
This work
YVM70 W303-1A Ifh1-myc13 [45]
AGS82 W303-1A Ifh1-myc13
ptc6::nat1This work
The single kanMX deletion mutants in the BY4741 background that weregenerated in the context of the Saccharomyces Genome Deletion Project arenot listed here.doi:10.1371/journal.pone.0064470.t001
Functional Characterization of Yeast Ptc6
PLOS ONE | www.plosone.org 2 May 2013 | Volume 8 | Issue 5 | e64470

ous gift from R. Loewith (Department of Molecular Biology
Sciences. University of Geneva. Switzerland).
RNA purification, cDNA synthesis and DNA microarrayanalysis
For RNA purification, 30 ml of yeast cultures of wild type
BY4741 and its derivatives mutant strains were grown at 28uC in
YPD medium until A660 0.6–0.8 and, when required, treated with
200 ng/ml rapamycin or drug vehicle alone (90% ethanol and
10% Tween P20) for 1 hour. Cells were harvested by centrifuga-
tion and washed with cold water. Dried pellets were kept at
280uC until RNA purification. Total RNA was extracted using
the RiboPure-Yeast kit (Ambion) following the manufacturer’s
instructions. RNA quality was assessed by electrophoresis in
denaturing 0.8% agarose gel and quantified by measuring A260 in
a BioPhotometer (Eppendorf). Transcriptional analyses using
DNA microarrays developed in our laboratory were performed
exactly as described in [29]. Briefly, 8 mg of total RNA for each
sample were employed for the cDNA synthesis and labeling using
the indirect labeling kit (CyScribe Post-Labeling kit, GE-Amer-
sham Biosciences) in conjunction with Cy3-dUTP and Cy5-dUTP
fluorescent nucleotides. The cDNA obtained was dried and
resuspended in the hybridization buffer. The amount of DNA
and the labeling efficiency was evaluated with a Nanodrop
spectrophotometer (Nanodrop Technologies). Fluorescently la-
beled cDNAs were combined and hybridized to yeast genomic
microchips constructed in our laboratory by arraying 6014
different PCR-amplified open reading frames (ORFs) from S.
cerevisiae [30,31]. Pre-hybridization, hybridization and washing
conditions were essentially as described previously [32]. The slides
were scanned with a ScanArray 4000 apparatus (Packard
BioChips Technologies), and the output was analyzed using
GenePix Pro 6.0 software. Spots with either a diameter smaller
than 120 mm or fluorescence intensities for Cy3 (indocarbocya-
nine) and Cy5 (indodicarbocyanine) lower than 150 units, were
not considered for further analysis.
Three different sets of microarray experiments were performed.
In the first set of experiments we compared the expression profiles
of ptc6 mutant cells with that of wild type cells by performing two
independent experiments (biological replicates), each in duplicate
(dyes were swapped to avoid dye-specific bias). In the second series
of experiments, we compared the transcriptomic profiles of ptc1
ptc6 double mutant cells with that of wild type cells. Two indepen-
dent experiments were performed, each in duplicate. For these two
set of experiments we only considered for further analysis genes
with data in at least two out four spots. In the last set of experi-
ments we compared the transcriptomic profiles of WT, ptc6, and
ptc1ptc6 cells in the presence and the absence of rapamycin. In this
case, data from duplicate experiments were combined, and the
mean was calculated. A given gene was considered to be induced
or repressed when the expression ratio was higher than 2.0 or
lower than 0.50, respectively. The GEPAS3.0 software, now
implemented in the Babelomics tool (http://babelomics.bioinfo.
cipf.es/), was used to pre-process the data [33]. The MIPS
Functional Catalogue Database [34], at http://mips.helmholtz-
muenchen.de/proj/funcatDB/search_main_frame.html, and Gene
Ontology Enrichment tool available at YeastMine [35] (http://
yeastmine.yeastgenome.org), were used for the functional distri-
bution of gene lists.
Different levels of dependence on Ptc6 were defined as ‘‘totally
dependent’’ (TD), ‘‘strongly dependent’’ (SD), ‘‘weakly depen-
dent’’ (WD) and independent, according to the expression of up-
or down-regulated genes after rapamycin treatment in ptc6 cells in
comparison with wild type cells, as previously reported [36]. The
data discussed in this publication have been deposited in NCBI’s
Gene Expression Omnibus database [37] and are accessible
through GEO SuperSeries accession number GSE38260.
Chromatin immunoprecipitation assaysChromatin cross-linking and immunoprecipitation were carried
out based on previously described methods [38] with several
modifications. Forty ml cultures were grown up to OD660 0.6–0.8
on YPD medium, and cells were exposed to 200 ng/ml rapamycin
for 5, 15, 30 and 45 min. Then, cells were treated with 1.1 ml of
37% formaldehyde (1% final concentration) for 15 min at 24uCand quenched by addition of 2 ml of 2.5 M glycine for 5 min at
24uC. Cells were collected by centrifugation and washed twice
with 10 ml of ice-cold HBS (50 mM HEPES-KOH, pH 7.5,
140 mM NaCl) and once with 1.5 ml of Lysis buffer (50 mM
HEPES-KOH, pH 7.5, 140 mM NaCl, 1 mM EDTA, 1%
Nonidet P 40, 0.1% sodium deoxycholate). The pellet was
resuspended in 300 ml of Lysis buffer with 1 mM phenylmethyl-
sulfonyl fluoride (PMSF) and complete protease inhibitor mixture
(Roche Applied Science). One volume of zirconia-silica 0.5 mm
beads (BioSpec) was added and cells were broken at 4uC by
vigorous shaking (5 times for 25 s each at setting 5.5, with intervals
of 1 min on ice) in a Fast Prep cell breaker (FastPrep 24, MP
Biomedicals). The chromatin was sheared using a Bioruptor Plus
UCD-300 sonication device (Diagenode) (high intensity, ten cycles
of 30 s sonication interspersed with 60 s pause). The cleared lysate
(whole cell extract, WCE) was recovered by centrifugation at
93006g for 5 min at 4uC. For chromatin immunoprecipitation,
50 ml of Protein G-Sepharose (GE Healthcare) was coupled to
2.5 mg of anti c-myc monoclonal antibody (Covance). The anti-
myc-Protein G-Sepharose complexes were incubated overnight
with 200 ml of WCE (4 mg) at 4uC in a rotator. Sepharose-protein
complexes were transferred to 96-well filter plates (MultiScreen,
Millipore) and extensively washed at 4uC with 250 ml of the
indicated solutions as follows: Four times with lysis buffer for
1 min, four times with lysis buffer containing 500 mM NaCl, twice
with washing buffer (10 mM Tris-HCl, pH 7.5, 1 mM EDTA,
250 mM LiCl, 0.5% Nonidet P-40, 0.5% sodium deoxycholate),
and twice with TE (10 mM Tris-HCl, pH 7.5, 1 mM EDTA).
Washes were discarded by centrifugation at 1806g. Protein-DNA
complexes were recovered from beads by incubation with 80 ml of
elution buffer (50 mM Tris-HCl, pH 8.0, 10 mM EDTA, 1%
SDS) at 65uC for 20 min. The supernatant was removed (60 ml),
240 ml of elution buffer were added, and samples were incubated
overnight at 65uC. WCE controls were prepared from untagged
cells by mixing 10 ml of WCE with 240 ml of elution buffer and
incubating overnight at 65uC. Formaldehyde cross-links were
reversed by incubation with 150 mg of proteinase K for 1 h at
37uC. The eluted DNA was purified with phenol-chloroform,
precipitated with isopropanol, and dissolved in 30 ml (immuno-
precipitated samples) or 50 ml of TE (WCE samples), and stored at
220uC. For PCR assays, 30 ng of the immunoprecipitated DNA
was used. Oligonucleotides for PCR were designed to amplify 50-
to 100-bp fragments (Table S1).
Western blot and chemical fragmentation analysisThe Sch9 detection experiments were performed essentially as
described in [22]. Briefly, yeast strains were grown on YPD to
OD660 0.5–0.6 at 28uC. Nine ml of cultures were mixed with TCA
(final concentration 6%) and put on ice for at least 10 min before
cells were pelleted at 16806g for 2 min. The pellet was washed
twice with 1 ml cold acetone and dried at 37uC. One-hundred ml
of urea buffer (50 mM Tris pH 7.5, 5 mM EDTA, 6 M urea, 1%
SDS, 1 mM PMSF) was added to the pellet and cell lysis was
Functional Characterization of Yeast Ptc6
PLOS ONE | www.plosone.org 3 May 2013 | Volume 8 | Issue 5 | e64470

performed with zirconia-silica 0.5 mm beads (BioSpec) by
vigorous shaking in a Fast Prep cell breaker (FastPrep 24, MP
Biomedicals) as described above. Then, samples were heated for
10 min at 65uC. For NTCB (2-nitro-5-thiocyanatobenzoic acid)
cleavage, 30 ml of 0.5 M CHES (pH 10.5) and 20 ml of NTCB
(7.5 mM in H2O) were added and samples were incubated
overnight at 24uC. Then, one volume of 26 sample buffer was
added. Samples were fractionated by SDS-PAGE in 7.5%
polyacrylamide gels and transferred to Immobilon PVDF mem-
branes (Millipore). Membranes were incubated overnight with
anti-HA antibody (Covance) at 1:2000 dilution followed by the
secondary HRP-conjugated anti-mouse IgG antibody (GE
Healthcare) at 1:20000 dilution. The immunocomplexes were
visualized using ECL Western blotting detection kit (GE
Healthcare). Chemiluminescence was detected using a LAS-3000
equipment (Fuji).
For Aco1 detection, whole cell lysates (10 ml of culture) were
prepared by resuspending the cells in 200 ml of extraction buffer
(50 mM Tris-HCl pH 7.5, 150 mM NaCl, 0.1% Triton X-100,
1 mM dithiothreitol, 10% glycerol, 2 mM phenylmethylsulfonyl
fluoride and Complete inhibitor mixture (Roche Applied Science)).
One volume of zirconia-silica 0.5 mm beads (BioSpec) was added
and cells were broken at 4uC by vigorous shaking as above. After
sedimentation at 5006g for 10 min at 4uC, the cleared lysate was
recovered and the protein concentration was determined by
Bradford assay. Total proteins (40 mg) were fractionated by SDS-
PAGE in 10% polyacrylamide gels and transferred to Immobilon
PVDF membranes (Millipore). Membranes were incubated
overnight with anti-Aco1 antibody (a generous gift of Dr. S.
Atrian, Universitat de Barcelona) at 1:10000 dilution followed by
the secondary HRP-conjugated anti-rabbit IgG antibody (GE
Healthcare) at 1:20000 dilution. The immunocomplexes were
visualized using ECL Western blotting detection kit (GE
Healthcare). Chemiluminescence was detected using a LAS-3000
equipment (Fuji).
Other techniquesTotal RNA was prepared as described above. Semi-quantitative
RT-PCRs were performed using 100 ng of total RNA (except for
MEP1 amplifications, where 200 ng were used) and the Ready-
To-Go RT-PCR Beads kit (GE Healthcare). Specific pairs of
oligonucleotides were used (Table S1) to determine the levels of
GAP1 and ACT1 (25 amplification cycles) and MEP1 (30
amplification cycles). The PCR products were visualized in 2%
agarose gels.
For quantitative RT-PCR, cDNA was synthesized from 1.5 mg
of each RNA with the Superscript III First-Strand Synthesis
System (Life Technologies). Five ng of each cDNA were used as a
template, together with the pairs of oligonucleotides specified in
the Table S1 and the Power SYBR green PCR Master mix
(Applied Biosystems). Amplification reactions were carried out in a
StepOnePlus Real-Time PCR System (Applied Biosystems). Fold-
changes were calculated using the 22DCt method.
Evaluation of the promoter activity of diverse NCR-sensitive
genes in response to rapamycin or to Low Ammonium Medium
was performed using LacZ-reporters as described in [19].
Vacuolar staining and visualization was carried out using the
lipophilic styryl dye FM4-64 (Molecular Probes) as described in
[39].
Msn2 subcellular localization was performed using the pMSN2-
GFP plasmid (a generous gift of F. Estruch, University of Valencia)
as described in [19].
Results
Functional characterization of the ptc6 mutantBecause of the striking rapamycin-sensitive phenotype of ptc6
cells, we considered necessary to carry out a comprehensive
analysis of phenotypes derived from this mutation, and compare
the phenotypes with those of the ptc1 mutant, the only other ptc
mutant that has been reported as sensitive to rapamycin [19]. We
have found that cells lacking ptc6, in contrast to ptc1 mutants, are
not sensitive to high temperature (37uC), alkaline pH, or high
amounts of calcium, copper or iron (not shown) and can grow on
glycerol and ethanol as carbon sources (not shown). Similarly, the
vacuolar structure of ptc6 cells appears to be normal, whereas it is
highly fragmented in the ptc1 mutant (Figure 1A). The ptc6
mutation renders cells slightly sensitive to zinc, albeit to less extent
than that of PTC1. Remarkably, the ptc6 mutant is somewhat
tolerant to cell-wall damaging agents such as calcofluor white or
Congo Red, as well as to Li+ ions (Figure 1B) and, in fact, lack of
Ptc6 improves to some extent the deficient growth caused by the
ptc1 mutation under these conditions.
To gain insight into the possible cellular roles of Ptc6, we
investigated by microchip analysis the changes in the global
transcriptional profile caused by the ptc6 mutation in cells growing
under standard conditions. Disappointingly, we observe that lack
of PTC6 had almost no effect on the expression profile. The level
of mRNA of only two genes, excluding PTC6 itself, was found
decreased (FIT3 and TIS11) and, although mRNA levels of several
genes involved in the lysine biosynthesis (LYS1, LYS20, LYS21,
LYS12 and LYS9) were slightly increased, they did not reach the
defined threshold (2-fold increase). In any case, when we
compared the reported expression profile of the ptc1-5 mutants
[29], obtained using the same DNA microarray platform and yeast
genetic background, together with that of ptc6 cells, it became
evident that the expression profile of ptc6 cells is quite different of
that obtained for the ptc1-5 mutants (Fig. 1C). We also evaluated
the expression profile of ptc1 ptc6 cells. Simultaneous deletion of
PTC1 and PTC6 genes provoked more transcriptional changes
than those observed previously for the single deletion of the PTC1
gene (Fig. 1D). We found that the levels of mRNA for 80 genes
were upregulated, whereas 14 genes, including PTC1 and PTC6,
were down-regulated in ptc1 ptc6 double mutant cells, when
compared to the wild type strain (see Tables S2 and S3 for the
complete list of genes).
A substantial number of genes considered up-regulated in ptc1
ptc6 cells (30 genes or 37.5% of the induced) were either related to
the cell wall function or were found induced by cell-wall stress
[40], as previously described for the ptc1 mutant [29]. In fact, 18
out 20 genes whose expression was up-regulated at least two-fold
in ptc1 mutant cells [29] with valid data for the ptc1 ptc6 mutant,
were also up-regulated in ptc1 ptc6 cells. The expression of the two
other genes was either found consistently elevated (NCA3) or not
induced at all (PHO89) in ptc1 ptc6 cells.
Changes in the expression levels were quantitatively higher in
the ptc1 ptc6 double mutant than in ptc1 cells. The average of the
values of induction (in log2) for the set of 18 genes found
simultaneously up-regulated (more than 2-fold) in both strains was
higher in ptc1 ptc6 (1.93, equivalent to 3.82-fold) than in ptc1 cells
(1.45, equivalent to 2.74-fold). This is also true when only the set of
genes involved in cell wall integrity was considered.
Among the 60 genes specifically induced in ptc1 ptc6 but not in
ptc1 or ptc6 cells it is worth noting the presence of a set of 17 genes
involved in carbon-compound and carbohydrate metabolism (p-
value: 3.88E-06), six of them (TSL3, GLC3, GIP2, GSC2, PGM2
and GDB1) were involved in the metabolism of energy reserves (p-
Functional Characterization of Yeast Ptc6
PLOS ONE | www.plosone.org 4 May 2013 | Volume 8 | Issue 5 | e64470

value: 1.51E-05). We also found 7 genes (ARN2, PDR5, FIT3,
MEP2, ARN1, FIT1 and FIT2) involved in ion transport (p-value:
5.71E-04).
Taken together, the comparison of the phenotypic and
transcriptomic data presented here, as well as the previously
reported results [29] suggest that the cellular functions of Ptc6 are
substantially different from those of Ptc1 and also from Ptc2-Ptc5.
Ptc6 and Ptc1 participate in the TOR signaling pathwayby different mechanisms
As previously described, the ptc1 strain is more sensitive to
rapamycin than ptc6 cells. We show here that the double mutant
ptc1 ptc6 was even more sensitive to this compound than ptc1 cells
(Figure 2A). Interestingly, the rapamycin-sensitive phenotype of
ptc1 is not altered at all by further deletion of PTC2 or PTC3,
which encode the closest structural relatives to Ptc1 (data not
shown). The observation that the mutation of PTC6 in a ptc1
background is specific and additive suggests that Ptc1 and Ptc6
phosphatases could interact with the TOR pathway at different
levels. It has been reported that certain vps mutants fail to recover
from rapamycin-induced arrest [41]. Since ptc1 shows diverse
phenotypes alike to vps mutants [29] we tested the ability to resume
growth in rapamycin-treated ptc1 cells after the drug is removed.
We observed that, indeed, the ptc1 and ptc1 ptc6 strains do not
recover from the drug treatment (Fig. 2B). In contrast, ptc6
mutants recover nearly as a wild type strain, indicating that, in
spite of the common rapamycin-sensitive phenotype, only Ptc1 is
essential for resumption of growth after treatment with the drug.
This result also supports the notion that Ptc1 and Ptc6 interact
with the TOR pathway in a different manner.
It is reasonable to assume that if Ptc1 would be affecting the
Ptc6 target(s) in the TOR pathway, its over-expression could
rescue the hypersensitivity to rapamycin of the ptc6 mutant. As
shown in Figure 2C, overexpression of native Ptc1 rescues the ptc1
phenotype and, as previously reported [19], is even able to confer
some tolerance to rapamycin, whereas a catalytically impaired
version of the phosphatase (D58N) does not. In contrast,
overexpression of Ptc1 does not increase at all the tolerance of
the ptc6 mutant to the drug.
Our previous results indicated that Ptc1 acts on the TOR
pathway by regulating Tip41 or Sit4 function, since the deletion of
PTC1 in sit4 or tip41 cells did not alter the phenotype displayed by
these mutants [19]. We now deleted the PTC6 gene in strains
carrying mutations in diverse non-essential components of the
pathway (Fig. 3A), and the sensitivity to rapamycin was tested
measuring the growth in liquid cultures. As observed in Fig. 3B
Figure 1. Characterization of ptc6 mutant cells. A) Vacuole morphology is not altered in ptc6 cells. Representative microscopic fields of wildtype BY4741 (WT), ptc1, ptc6 and ptc1 ptc6 cells labeled with the lipophilic fluorescent dye FM4-64 to visualize vacuole morphology (61000). B)Sensitivity of ptc6 mutants to different stressing conditions. 1:5 serial dilutions containing the same amount of cells of the strains above were spottedon YPD plates containing 6 mM ZnCl2, or the indicated concentrations of LiCl, Calcofuor White (CFW) or Congo Red (CR). Growth was monitored after3 days, except for the plate of 150 mM LiCl (4 days). C) Clustering of the global expression profiles from mutants in each of the analyzed Ptc mutants.The dendrogram is based on the expression profiles previously obtained for each PTC mutant [29] with respect to the wild type strain and has beenobtained using the Cluster Server (unweighted pair group method using arithmetic averages and correlation distance) at GEPAS [33]. D) Venndiagram showing the number of genes whose expression was considered to be induced (top) or repressed (bottom) in both ptc1 and ptc1 ptc6double mutant cells exponentially growing on YPD. Data for the ptc1 strain was taken from [29].doi:10.1371/journal.pone.0064470.g001
Functional Characterization of Yeast Ptc6
PLOS ONE | www.plosone.org 5 May 2013 | Volume 8 | Issue 5 | e64470

deletion of PTC6 increased the rapamycin hypersensitive pheno-
type of tor1 cells, similarly to that observed for the deletion of PTC1
[19]. However, contrary to the previously observed for the ptc1
mutants, deletion of the PTC6 gene in the sit4 or tip41
backgrounds decreased the tolerance to the drug. Therefore, our
data suggest that, in contrast to what happens in the case of ptc1,
the sit4 and tip41 mutations are not epistatic to the ptc6 mutation.
Therefore, taking together these results indicate that both Ptc6
and Ptc1 are involved in the normal functioning of the TOR
signaling pathway but they are affecting different mechanisms.
Rapamycin-induced mitophagy is blocked in ptc6mutants growing on glucose
One of the events controlled by the TOR signaling pathway,
together with Ras-PKA signaling and the general stress response
pathways, is mitophagy, a vacuole-dependent mitochondrial
degradation process [42]. Several circumstances have been
described that lead to yeast mitophagy, including those that
inhibit the TOR pathway, such as entry in stationary phase,
nitrogen starvation or treatment with rapamycin [11]. By
following the degradation of the mitochondrial protein aconitase
(Aco1), a well-established method to monitor mitophagy [11], we
confirmed that rapamycin treatment in wild type cells exponen-
tially growing in YPD medium induced mitophagy, since the
protein was not detectable after 3 h of treatment with the
compound (Fig. 4A). In contrast, when ptc6 mutant cells were
exposed to the same concentration of rapamycin, Aco1 was still
detectable for at least 6 h, indicating that rapamycin-induced
mitophagy in wild type cells is, at least in part, dependent of Ptc6.
This behavior is similar to that of cells lacking one of the main
vacuolar hydrolases (the proteinase A, encoded by the PEP4 gene),
which have been shown unable to degrade Aco1 when growing on
lactate upon rapamycin incubation [43]. Thus, cells lacking Ptc6
have an impaired mitophagy phenotype when treated with
rapamycin in medium containing glucose as carbon source.
Therefore, our results extend those reported by Tal and coworkers
showing that Ptc6 was required for efficient mitophagy in
prolonged stationary-phase incubation in medium containing
lactate, a non-fermentable carbon source [11]. Ptc6 is also
required for the delay in Aco1 degradation observed in wild type
cells treated with rapamycin in a non-fermentable carbon source
such as glycerol (Fig. 4A). We next asked whether the ptc6 mutant
would be similarly sensitive to rapamycin irrespectively of the
carbon source. Interestingly, as shown in Figure 4B, wild type and
ptc6 cells display a similar sensitivity to rapamycin, in spite that the
wild type strain still shows some degree of mitophagy and the ptc6
mutant does not (Fig. 4A), thus indicating that mitophagy and the
rapamycin-sensitive phenotype could be dissociated. This notion is
further reinforced by the observation that there are strains, such as
the uth1 mutant, that are unable to induce mitophagy in lactate-
grown cells challenged with rapamycin, but are tolerant to
rapamycin irrespectively of the carbon source ([43], Figure 4C).
In fact, deletion of the PTC6 gene decreases tolerance to
rapamycin of the uht1 mutant (Figure 4C).
The rapamycin-sensitive phenotype of the ptc6 mutant isindependent of the lack of PDH activity
The only cellular target for Ptc6 described so far is Pda1, which
is also dephosphorylated by Ptc5. As shown in Figure 5A, five
proteins form the three structural components of the PDH
complex. In addition, two protein phosphatases (Ptc6 and Ptc5)
and two protein kinases (Pkp1 and Pkp2) are regulatory elements,
responsible for the increase and decrease of PDH activity,
respectively. Interestingly, Gey and coworkers demonstrated that
lack of Ptc6 causes a dramatic drop in the PDH activity and it has
been reported that deletion Pda1 [13] or Pdb1 [18] results in
sensitivity to rapamycin. Therefore, it could be speculated that a
link between the rapamycin-sensitive phenotype of ptc6 cells and
the role of the phosphatase in activating PDH activity could exist.
To test this possibility we evaluated the sensitivity to rapamycin of
mutants in genes involved in regulation of PDH activity in the
presence and in the absence of the PTC6 gene. As shown in
Figure 5B, deletion of PTC6 in the ptc5 background (which is not
rapamycin-sensitive) decreases tolerance to the drug to achieve
ptc6 levels. Remarkably, we observe that the pkp1 strain, which
does not show a decrease in PDH activity [13,18], is also
hypersensitive to rapamycin and that deletion of PTC6 further
decreases the tolerance to the drug. Similarly, lack of Ptc6
decreases tolerance to rapamycin in cells lacking structural
components of the PDH complex, such as in the pdb1, lat1 or
lpd1 strains (Figure 5C). Therefore, deletion of PTC6 decreases
rapamycin tolerance irrespectively of an increase or decrease of
PDH activity, thus suggesting that decreased PDH activity is not
the cause of the hypersensitivity to rapamycin described for the
ptc6 mutant. Because the slightly increased sensitivity to rapamycin
observed in mutant cells lacking either structural components of
the PDH complex or the PKP1 gene, we cannot discard a role of
these components in the pathway regulated by rapamycin.
The rapamycin-induced transcriptional response isattenuated in ptc6 mutant cells
Short-term treatment of wild type cells with rapamycin results in
strong remodeling of gene expression. To identify the effect of ptc6
Figure 2. Ptc1 and Ptc6 differentially regulate the TORsignaling pathway. A) Wild-type strain BY4741 and the indicatedmutants were spotted onto YPD plates containing the specifiedconcentrations of rapamycin. Growth was monitored after 3 days ofincubation at 28uC. B) Exponentially growing BY4741 cells and theindicated mutants at a OD600 of 0.8–1.0 growing in YPD medium wereincubated either with 200 ng/ml rapamycin (+) or the vehicle (2), for6 h. Cells were then washed twice, resuspended in YPD, spotted ontoYPD plates and the growth monitored after 3 days. C) The BY4741 strainand its ptc1 and ptc6 derivatives were transformed with an empty high-copy-number YEplac195 vector (YEp-Ø) or with the same vector bearingeither the wild type or a catalytically inactive form of Ptc1 (PTC1[D58N]).Cells were spotted as described above and incubated for 3 days.doi:10.1371/journal.pone.0064470.g002
Functional Characterization of Yeast Ptc6
PLOS ONE | www.plosone.org 6 May 2013 | Volume 8 | Issue 5 | e64470

mutation in the global expression pattern after rapamycin
treatment, we performed microarray experiments comparing the
rapamycin-induced transcriptional response of wild type and ptc6
mutants. Considering only the genes with valid data in both
experiments (3332 genes) we found that rapamycin caused
changes in the expression levels of 1115 genes (33.4%) in wild
type cells (476 up-regulated and 639 down-regulated). In ptc6
mutant cells, rapamycin changed the levels of 884 transcripts
(26.5%), being the number of up-regulated and down-regulated
genes of 375 and 509, respectively (Fig. 6A, upper panel). In the
case of the ptc1 ptc6 mutant, from the total number of genes with
valid data (3355), the rapamycin-induced genes were 417 (12.4%)
and the down-regulated ones were 564 (16.8%) (Fig. 6A, lower
panel). These figures suggest that lack of Ptc6 may cause an
attenuation of the transcriptional response to rapamycin. The
alterations provoked by the ptc1 and ptc6 mutations in the response
induced by rapamycin were verified in a set of four rapamycin-
responsive, nitrogen catabolite repression (NCR) regulated genes
(GAP1, GLN1, GDH1 and MEP1), required for adaptation to non-
preferred nitrogen sources and whose expression is controlled by
the Gln3 transcription factor. As shown in Fig. 6B, when cells were
challenged with rapamycin, it became evident that the response of
these genes to the drug was attenuated in Ptc6-deficient cells,
although somewhat less than in ptc1 cells. The transcription
attenuation of the GAP1 and MEP1 genes in response to
rapamycin in the ptc6 strain was also validated by RT-PCR (not
shown).
To explore the extent of the transcriptional attenuation in the
response to rapamycin caused by the ptc6 mutation, we plotted the
transcriptional changes (log2 values) for wild type (X axis) and ptc6
(Y axis) after rapamycin treatment, and the value of the slope of
the fitted line obtained by simple linear regression was taken as an
‘‘attenuation index’’ (Figure S1). Therefore, if the global responses
to the drug in both strains were similar, the expected slope value
would be close to unity, whereas a weakened response in the ptc6
cells would decrease this index. The values of the slope for the
genes consider up- ad down-regulated by rapamycin in ptc6 cells
respect wild type cells were 0.8186 and 0.7424. As a reference, the
corresponding indexes for the same treatment with rapamycin in
ptc1 respect wild type cells were 0.7502 and 0.9268, respectively
[19]. We also performed a similar calculation with the ptc1 ptc6
cells, and the corresponding slopes were 0.6671 and 0.8869
(Figure S1). Thus, changes in the transcriptional profiles in
response to rapamycin were attenuated in all three mutants
analyzed, being this attenuation more relevant for the down-
regulated genes in the ptc6 strain, and for the up-regulated genes in
the ptc1 ptc6 strain.
One of the cellular responses to rapamycin is the translocation
to the nucleus of the Msn2 transcription factor that collaborated in
the regulation of the general stress response. We have already
described that lack of Ptc1 prevents the nuclear translocation of
Msn2 in response to rapamycin [19]. When similar experiments
were performed with ptc6 mutant cells, we observed only a
moderate decrease in the number of cells with nuclear localization
Figure 3. Epistatic analysis of ptc6 and mutations affecting the TOR pathway. A) A simplified model of signaling through the TOR pathway,focused on the regulation of NCR genes and displaying the proposed role for Ptc1 [19]. B) Growth in the presence of the indicated concentrations ofrapamycin of diverse mutants in genes involved in the TOR pathway in combination with deletion of PTC6. Relative growth is represented as apercentage respect the growth of each strain in YPD without rapamycin. Six experiments were performed and the mean 6 SEM is represented.doi:10.1371/journal.pone.0064470.g003
Functional Characterization of Yeast Ptc6
PLOS ONE | www.plosone.org 7 May 2013 | Volume 8 | Issue 5 | e64470

of Msn2, when compared to wild type cells (Figure S2A).
Consistently, when the attenuation in the expression change in
ptc6 cells of genes known to be under the regulation of Msn2/
Msn4 was compared with that of genes independent of these
transcriptional factors, no significant differences were observed
(Figure S2B). Cells lacking both genes, PTC1 and PTC6, however,
resulted in a stronger prevention of the nuclear localization that
the observed for ptc1 cells.
Ptc6 is important for the rapamycin-induced down-regulation of the genes involved in ribosome biogenesis
We next investigated if the ptc6 mutation affected specific gene
families whose expression was altered by rapamycin-treatment.
We have found that the expression level of 476 genes was up-
regulated by rapamycin in wild type cells, when genes with valid
data for the ptc6 strain were considered. The most relevant
category among these genes was the metabolism of aminoacids (67
genes, p-value: 7.65E-22). Only 86 genes were, at some extent,
dependent of Ptc6. The additional 390 genes were up-regulated in
a Ptc6-independent manner. Among them, the family of genes
involved in the metabolism of aminoacids was the most relevant
(55 genes, p-value: 7.43E-18).
Concerning the 639 genes whose expression was found down-
regulated by rapamycin in wild type cells we observed, in
agreement with previous reports, a very strong predominance of
genes related to protein synthesis (217 genes, p-value 4.98E-102),
particularly those involved in ribosomal biogenesis and translation
(Table S4).
We also observed a significant enrichment in genes related to
transcription (144 genes, p-value 3.09E-5), predominantly those
associated to rRNA processing (70 genes, p-value 3.87E-22). When
the level of dependence on Ptc6 for transcriptional down-
regulation was examined, we found 290 genes (45.4%) exhibiting
some degree of dependence (9 totally, 83 strong and 198 weakly
dependent on Ptc6). Interestingly, while globally considered, genes
related to protein synthesis did not exhibit a particular trend
regarding Ptc6-dependence, the down-regulation of the subset
corresponding to ribosome biogenesis showed a tendency to be
Ptc6-dependent, in particular those coding for ribosomal proteins
(p-value of 4.68E-41 for the Ptc6-dependent vs 6.14E-24 for the
Figure 4. Rapamycin-induced mitophagy is dependent on Ptc6. A) Wild type BY4741 and isogenic ptc6 and pep4 derivatives were grown inYPD or YP Glycerol (2%) medium until OD660 1.0 and then rapamycin (200 ng/ml) was added. Samples were taken at the indicated times and 40 mg oftotal protein from each sample were analyzed by immunoblotting with anti-aconitase and anti-actin antibodies. Ponceau staining (Pon S) is shown asloading control. Quantification of band intensities was performed by the GelAnalyzer software (http://www.gelanalyzer.com) and shown as Aco1/actin signals ratio. B) Wild-type strain BY4741 and the isogenic ptc6 mutant were spotted onto plates containing glucose (YPD) or glycerol (YPGly) ascarbon source, and the indicated concentrations of rapamycin. Growth was monitored after 3 (YPD plates) or 4 days (YPGly plates) of incubation at28uC. C) The indicated strains were grown in the presence of the different concentrations of rapamycin as described in the legend of Fig. 3B.doi:10.1371/journal.pone.0064470.g004
Functional Characterization of Yeast Ptc6
PLOS ONE | www.plosone.org 8 May 2013 | Volume 8 | Issue 5 | e64470

Ptc6-independent). In general, the degree of dependence for this
gene family was weak (Table S4). In contrast, rapamycin-repressed
genes related to translation turned out to be largely independent of
Ptc6. When genes involved in transcription were considered, we
observed a predominance of Ptc6-dependent genes (Table S4).
Remarkably, this tendency is not general for all functional
subcategories, but it is particularly strong for genes related to
rRNA processing (53 genes, p-value 5.34E-27, vs 17 genes, p-value
4.92E-2, for independent genes). Attenuation of repression of
genes within this category in response to rapamycin was, in many
cases, largely dependent on the presence of Ptc6, with predom-
inance of TD- or SD- dependent genes (Table S4).
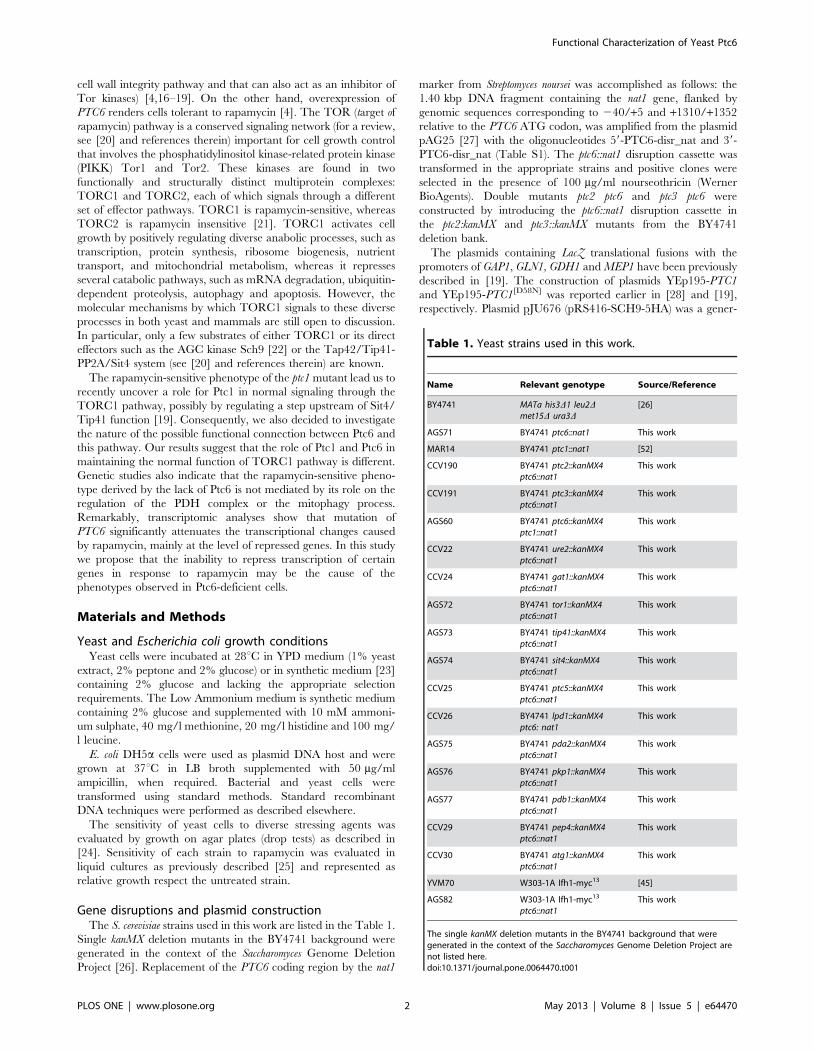
Ptc6 is not required for rapamycin-induceddephosphorylation of Sch9
It is known that TORC1 directly phosphorylates Sch9, a
member of the AGC family of protein kinases, thus triggering
expression of genes involved in ribosome biogenesis [22].
Interestingly, comparison of the response profile to rapamycin of
cells carrying a constitutively active version of Sch9, that mimics a
TORC1-phosphorylated form (SCH92D3E allele) with that of the
native protein reveals an attenuation of the response to drug that is
qualitatively and quantitatively similar to that observed here for
ptc6 mutants. Thus, when the ‘‘attenuation index’’ described above
was calculated for all genes repressed after 90 min of exposure to
rapamycin, a value of 0.706 was obtained, in close agreement with
that obtained for ptc6 cells (0.742). The similarity extends to the
differential level of dependence when gene families were
considered. Repression of genes coding for proteins involved in
rRNA processing showed an important grade of dependence for
both Ptc6 and Sch9. These dependences were weaker in both
cases for the set of genes related to the ribosomal protein synthesis
(Figure 7A). Down-regulation of the genes of the regulon Ribi was
also found attenuated in both mutants (Figure S3).
This raised the possibility that Ptc6 might exert its function in
the TOR pathway by directly or indirectly dephosphorylating and
inactivating Sch9. To test this, we examined the phosphorylation
state of Sch9 in wild type cells and ptc6 mutants in response to
Figure 5. Epistatic analysis of ptc6 and mutations affecting the PDH complex. A) Schematic representation of the pyruvate dehydrogenasecomplex based in the information available at the Yeast Biochemical Pathway Database, at the SGD website [51]. The different components of thepyruvate dehydrogenase complex (black ovals) as well as the protein kinases and phosphatases regulating its activity (black rectangles) by targetingPda1, a component of the E1 complex, are shown. Grey rectangles denote the following enzymatic activities: Pyruvate dehydrogenase (PDH),Dihydrolipoyl lysine acetyltransferase (DLAT) and Dihydrolipoyl dehydrogenase (DLD). The following abbreviations have been used to label thereaction products: Pyr, Pyruvate, LLys (N6-(lipoyl)lysine), SLys (N6-(S-acetyldihydrolipoyl)lysine) and DHLys (N6-(dihydrolipoyl)lysine). B) Growth in thepresence of the indicated concentrations of rapamycin of diverse strains lacking genes involved in regulating the E1 component of the pyruvatedehydrogenase complex in combination with the deletion of PTC6. Growth is represented as a percentage respect the growth of the each strain inYPD without rapamycin. Data are mean 6 SEM from six experiments. C) Rapamycin sensitivity of diverse mutants lacking structural components ofthe PDH complex and the PTC6 gene. Experimental conditions are identical to those described above.doi:10.1371/journal.pone.0064470.g005
Functional Characterization of Yeast Ptc6
PLOS ONE | www.plosone.org 9 May 2013 | Volume 8 | Issue 5 | e64470

rapamycin (Figure 7B). However, our results indicate that the
phosphorylation state of Sch9 remains unchanged irrespective of
the presence or absence of Ptc6, suggesting that the phosphatase is
not responsible for the control of the kinase.
Down-regulation of the genes controlled by Ifh1 inresponse to rapamycin requires Ptc6
According to our microarray data, ptc6 mutant cells showed a
weakened down-regulation of the gene expression caused by the
inhibition of TOR for genes encoding cytosolic RP (ribosomal
proteins). These results were also validated by quantitative RT-
PCR (Figure S4) and semiquantitative RT-PCR (not shown) for
three RP and a member of the Ribi regulon. Therefore, we
hypothesized that Ptc6 might be involved in the regulation of
expression of these genes. Ifh1 is a co-activator of the Forkhead-
like Fhl1 transcription factor that is recruited to the promoters of
the ribosomal protein encoding genes during optimal growth
conditions by Fhl1 and is absent when transcription is repressed
Figure 6. Cells lacking Ptc6 have an attenuated transcriptional response to rapamycin. A) Venn diagram showing the number of geneswhose expression was considered to be induced or repressed by rapamycin in wild type and ptc6 cells (left panel) or wild type and ptc1 ptc6 cells(right panel). Datasets with valid data in each case contained 3332 and 3810 genes, respectively. B) Decreased response of diverse NCR-sensitivegenes to rapamycin treatment. The indicated constructs were introduced into wild type BY4741 and the indicated derivatives, and cells were treatedwith 200 ng/ml rapamycin (Rap) for 60 (for GAP1, GLN1 and GDH1 promoters) or 90 min (for MEP1). Control cells (- Rap) received only the solvent. b-Galactosidase activity was measured as indicated in the text. Data are mean 6 SEM from six independent clones.doi:10.1371/journal.pone.0064470.g006
Functional Characterization of Yeast Ptc6
PLOS ONE | www.plosone.org 10 May 2013 | Volume 8 | Issue 5 | e64470
[44]. Rapamycin treatment is one of the known situations that
decrease the binding of Ifh1 to RP promoters [45]. Therefore, it
was conceivable that Ptc6 might influence binding of Ifh1 to its
target promoters. To test this hypothesis we examined the binding
of a myc-tagged version of Ifh1 to the promoters of diverse RP
genes after rapamycin treatment in both wild type and ptc6 cells by
chromatin-immunoprecipitation (ChIP) followed by PCR assays.
For all three RP genes analyzed, we detected a marked decrease
(50–60%) of Ifh1 binding to the promoters after 5 min of
rapamycin treatment in wild type cells and this effect was even
more prominent at longer times (,20% of binding after 45 min).
In ptc6 cells, however, Ifh1 binding was clearly higher for the
promoters of RPL16A and RPL37A, particularly after 30 minutes
of exposition to rapamycin (Figure 8). It is worth noting that
RPL16A was found to be strongly dependent on Ptc6 according to
our microarray data, whereas for RPL30 the effect of lack of the
phosphatase was only marginal. Although no microarray data for
RPL37A was available, quantitative RT-PCR results (Figure S4)
indicate a significant effect of the ptc6 mutation on RPL37A mRNA
accumulation. This suggests that the attenuation of the repression
of the genes encoding RP described for the ptc6 mutant cells could
be due, at least in part, to a defect in releasing Ifh1 from their
promoters.
Discussion
We have accomplished an extensive characterization of the
phenotypes shown by Ptc6-deficient cells, identifying novel
phenotypes for the ptc6 mutant cells not reported in a previous
work that characterized mutants in non-essential catalytic subunits
of protein phosphatases [46]. The transcriptional profiling of the
ptc6 mutants is more similar to that of the ptc1 strain than to other
ptc-deficient cells, such as ptc5 (Figure 1C). This is somewhat
surprising, since it has been proposed that ptc5 and ptc6 share the
same subcellular location (mitochondria) and a regulatory function
on the PDH complex [13]. In spite of the similarity of their
transcriptional profiles, most ptc6 phenotypes differ from those
displayed by ptc1 mutant. For example, ptc1 cells were hypersen-
sitive to alkaline pH as well as to high calcium concentrations [29],
phenotypes that are landmarks of deficient vacuolar function [47].
Indeed, cells lacking PTC1 displayed highly fragmented vacuoles.
In contract, ptc6 cells were not sensitive to either high pH or
calcium and, accordingly, their vacuolar morphology was normal.
Figure 7. Ptc6 does not influence Sch9 phosphorylation in response to rapamycin. A) Representation of the percentages of the genesdown-regulated by rapamycin involved in rRNA processing (open bars) or ribosomal proteins (closed bars) whose repression was totally dependent/strongly dependent (TD/SD), weakly dependent (WD) or independent (IND) on the presence of Ptc6 (left panel, data from this work). The same genefamilies were also classified according to the level of dependence on Sch9 in response to rapamycin (right panel). Data for Sch9 was taken from [22]and processed according to the same method used for establishing Ptc6 dependence. B) Exponentially growing wild type and ptc6 mutant cellsexpressing HA-tagged Sch9 were treated with rapamycin (200 ng/ml) for 30 min, as detailed in the Materials and Methods section. TORC1phosphorylation of the C-terminal portion of Sch9-HA, that leads to activation of Sch9, was determined in the lysates by NTCB treatment andimmunodetected with anti-HA antibodies.doi:10.1371/journal.pone.0064470.g007
Functional Characterization of Yeast Ptc6
PLOS ONE | www.plosone.org 11 May 2013 | Volume 8 | Issue 5 | e64470

Another relevant difference between ptc6 and ptc1 strains is that
ptc6 cells are tolerant to both, cell-wall stressors and excess of LiCl,
while ptc1 cells are sensitive. However, ptc1 and ptc6 cells do share
some phenotypes, such as hypersensitivity to rapamycin, suggest-
ing that Ptc6 may be involved in the TOR pathway. Nevertheless,
several lines of evidence suggest that both enzymes impact the
TOR pathway at different levels: i) the rapamycin-sensitive
phenotypes of the ptc1 and ptc6 mutations are additive. ii)
overexpression of PTC1 cannot rescue the rapamycin-sensitive
phenotype of the ptc6 strain, iii) exposure to high concentrations of
rapamycin causes an irreversible halt in growth in ptc1 mutants,
whereas Ptc6-deficiente cells can survive when the drug is removed
from the medium, and iv) the ptc6 mutation does not shown the
epistatic relationships with relevant components of the TOR
pathway displayed by the ptc1 mutation [19].
Early work on Ptc6 [13] suggested that the rapamycin-sensitive
phenotype of the ptc6 mutant could derive from the proposed role
of the phosphatase in activating PDH activity. However, we
cannot find a relationship between the effect of a given mutation
on PDH activity and the effect of such mutation on rapamycin
sensitivity. For instance, using liquid cultures we observe that lack
of ptc6, which should inhibit Pda1, causes a stronger rapamycin-
sensitive phenotype than deletion of the PDA1 gene (not shown).
Similarly, deletion of both PTC5 on the ptc6 background, which
should fully eliminate the ability to dephosphorylate the PDH
complex, does not result in increased sensitivity to rapamycin.
More importantly, lack of PKP1, encoding a Pda1 kinase, also
results in sensitivity to rapamycin which is further aggravated by
lack of Ptc6 (Figure 5B). Therefore, our results do not support the
hypothesis linking the sensitivity to rapamycin of the ptc6 mutant
and the role of this phosphatase in the regulation of PDH activity.
Similarly, our data also demonstrate that whereas the rapamycin-
sensitive phenotype of the ptc6 mutant is dependent on the carbon
source, it cannot be linked to the occurrence of mitophagy upon
exposure to rapamycin (Figure 4).
We observed that the expression of genes coding for proteins
involved in both the ribosome biogenesis and the rRNA processing
were down-regulated in a Ptc6 dependent manner (Table S4). It is
known that repression of these sets of genes after inhibition of the
TOR pathway may be under the control of Sch9 [22,48] and that
Sch9 is activated by phosphorylation [22]. Therefore, it could be
hypothesized that Ptc6 might directly or indirectly promote Sch9
dephosphorylation and deactivation. However, we did not detect
changes in the phosphorylation state of Sch9 in the absence of
Ptc6 and, consequently, we conclude that Ptc6 must have targets
other than Sch9. This would be in agreement with the fact that,
whereas it has been reported that Sch9 mediates TORC1
regulation of transcription initiation [22], we find that rapamy-
cin-induced repression of most genes related to this function is
largely independent of the presence of Ptc6 (Table S4). Similarly,
whereas Sch9 is not involved in the expression of Gln3-regulated
genes [22], we observe attenuated expression of this kind of genes
Figure 8. Lack of Ptc6 influences Ifh1 release from Fhl1-regulated promoters. A) Chromatin immunoprecipitation experiments wereperformed using W303-1A wild type (WT) and ptc6 mutant strains carrying a MYC-tagged IFH1 version. Tagging of Ifh1 did not affect the sensitivity torapamycin of ptc6 cells (not shown). After the addition of rapamycin (200 ng/ml) samples were taken at the indicated times. The immunoprecipitatedDNA was used as a template for PCR by using specific primers for the promoters of the indicated genes (see Table S1). The PCR products wereresolved in 2.5% agarose gel. Representative results from one out of three independent experiments are shown. WCE, Whole cell extract. B)Quantification of the relative amount of the PCR-products obtained, for the indicated promoters of the ribosomal protein-encoding genes shownabove, for wild type cells (open bars) and ptc6 mutant cells (closed bars). Four independent experiments were performed. Error bars represent thestandard deviation.doi:10.1371/journal.pone.0064470.g008
Functional Characterization of Yeast Ptc6
PLOS ONE | www.plosone.org 12 May 2013 | Volume 8 | Issue 5 | e64470

in ptc6 cells (Figure 6B), indicating the existence of alternative Ptc6
cellular targets.
Expression of ribosomal protein- and pre-rRNA processing-
encoding genes is also under the control of the Fhl1 forkhead
transcription factor [44,49]. When the TOR pathway is active, the
coactivator Ifh1 binds to Fhl1, thus promoting expression of Fhl1-
regulated genes. Inactivation of the TOR pathway results in Yak1-
mediated phosphorylation of the Crf1 corepressor, promoting its
binding to Fhl1, displacement of Ifh1, and switching off
transcription of the Fhl1-regulated genes [49]. We observe that
in cells lacking Ptc6, rapamycin-induced release of Ifh1 from Fhl1-
regulated promoters is delayed or abolished. Since failure to
effectively release Ifh1 from its target promoters would interfere
with transcriptional switch off, this might contribute to explain, at
least in part, the attenuation of rapamycin-induced repression of
genes involved in ribosome biogenesis. The mechanisms for this
effect would be open to conjecture. One possibility is that Ptc6
may regulate the phosphorylation state of Crf1. If so, Ptc6 could
not act as a Crf1 phosphatase, since lack of Ptc6 would lead to
hyperphosphorylation of Crf1 and this would lead to the
potentiating of the repressor effects of rapamycin on target genes
expression. It would be possible, however, that Ptc6 could
negatively regulate the input of the TOR pathway on Yak1
activation. It must be noted that in vivo phosphorylation of Ifh1
has been reported in high-throughput studies. Interestingly, it has
been recently shown that Ifh1 can be phosphorylated in vitro by
Yak1 [50]. Therefore, the hypothetic regulation of Yak1 activity
by Ptc6 could also impact on Ihf1 itself. In addition, it has been
shown that Ifh1 is in a complex with casein kinase 2 (CK2), Utp22
and Rrp7 (CURI complex) are implicated in the processing of pre-
rRNA and that CK2 phosphorylates in vitro Ifh1 [44]. Therefore,
CK2-mediated phosphorylation of Ifh1 could also be a target for
Ptc6 function.
Supporting Information
Figure S1 Linear regression analyses were used toestimate the transcriptional attenuation caused by thelack of ptc6 or ptc1 and ptc6. Linear regression analysis of the
plotted values for the changes in the level of expression triggered
by rapamycin in wild type and in the indicated mutant strains. The
obtained equation is indicated for each case. A) Set of 476 genes
up-regulated by rapamycin in wild type cells plotted against their
expression value in the ptc6 mutant. B) Set of 639 genes down-
regulated by rapamycin in wild type cells plotted against their
expression value in the ptc6 mutant. C) Set of 494 genes up-
regulated by rapamycin in wild type cells plotted against their
expression value in the ptc1 ptc6 mutant. D) Set of 619 genes down-
regulated by rapamycin in wild type cells plotted against their
expression value in the ptc1 ptc6 mutant.
(TIF)
Figure S2 Lack of Ptc6 moderately affects rapamycin-induced down-regulation of the Msn2/Msn4-controledgenes. A) Intracellular localization of Msn2-GFP at the indicated
times after addition of rapamycin to the cultures of WT, ptc1, ptc6
and ptc1 ptc6 cells. Cells from each strain were distributed into
three categories according to the intracellular localization of
Msn2-GFP: cytosolic (black bars), cytosolic and nuclear (grey bars)
and nuclear (white bars). B) Plots of the log2 values for the changes
in the level of expression consequence of the treatment with
rapamycin in both WT (dots) and ptc6 strains (closed triangles) for
the 150 most up-regulated genes (top panel) and 150 most down-
regulated (bottom panel) genes in the WT strain. The expression
values for the genes documented targets of Msn2 or Msn4
described in YEASTRACT [53] plus those identified elsewhere
[54] in ptc6 cells are denoted as open squares.
(TIF)
Figure S3 Comparison of transcriptional changes inptc6 mutants and cells expressing a constitutive activeversion of Sch9. Representation of the averages of the changes
in the level of expression (in log2) induced by rapamycin for the
genes included in the specified categories that constitute the Ribi
regulon [55]. Left panel shows data corresponding to yeast (W303
background) expressing normal and constitutively active Sch9
(SCH92D3E) after 90 min treatment with rapamycin obtained from
the GEO database (series reference GSE7660) [22]. Right panel
shows data from the experiments described in this work.
(TIF)
Figure S4 ptc6 mutant cells exhibit an attenuation in therepression of genes involved in the ribosome biogenesiscaused by rapamycin. Wild type BY4741 and its isogenic ptc6
derivatives were grown in YPD and treated with rapamycin as
described in Figure 4A. Samples were collected at different times
and total RNA was prepared. Quantitative RT-PCR were
performed by duplicate using specific oligonucleotides, as
described in the Materials and Methods section, and the levels
of expression of the RNA for the specified genes in wild type
BY4741 (empty bars) and ptc6 mutant cells (filled bars), after actin
normalization, are represented as a percentage respect the
quantity of RNA in untreated cells. Error bars represent the
standard deviation.
(TIF)
Table S1 Oligonucleotides used in this study.
(DOCX)
Table S2 Genes up-regulated in ptc1 ptc6 cells.
(DOCX)
Table S3 Genes down-regulated in ptc1 ptc6 cells.
(DOCX)
Table S4 Major functional categories of genes down-regulated by rapamycin. The set of genes in each category
(according to the MIPS Functional Catalogue Database) is
classified as affected (dependent) or unaffected (independent) by
the absence of Ptc6. Ptc6-dependent genes are further classified
into totally plus strongly dependent (TD+SD) and weakly
dependent (WD).
(XLS)
Acknowledgments
The skillful technical help of Montse Robledo and Anna Vilalta is
acknowledged. The contribution of Amparo Ruiz and Marta Anglada to
the initial steps of the project is acknowledged. We thank Silvia Atrian
(Universitat de Barcelona), Francisco Estruch (Universitat de Valencia)
David Shore and Robbie Loewith (University of Geneva) for reagents.
Thanks are also given to the Servei de Genomica i Bioinformatica (IBB-
MRB, Universitat Autonoma de Barcelona).
Author Contributions
Conceived and designed the experiments: JA AC AG. Performed the
experiments: AG AC CC. Analyzed the data: AC AG. Wrote the paper: JA
AC AG.
Functional Characterization of Yeast Ptc6
PLOS ONE | www.plosone.org 13 May 2013 | Volume 8 | Issue 5 | e64470

References
1. Arino J, Casamayor A, Gonzalez A (2011) Type 2C protein phosphatases in
fungi. Eukaryot Cell 10: 21–33.2. Stark MJ (1996) Yeast protein serine/threonine phosphatases: multiple roles and
diverse regulation. Yeast 12: 1647–1675.3. Cheng AY, Ross KE, Kaldis P, Solomon MJ (1999) Dephosphorylation of
cyclin-dependent kinases by type 2C protein phosphatases. Genes & Develop-
ment 13: 2946–2957.4. Ruan H, Yan Z, Sun H, Jiang L (2007) The YCR079w gene confers a
rapamycin-resistant function and encodes the sixth type 2C protein phosphatasein Saccharomyces cerevisiae. FEMS Yeast Res 7: 209–215.
5. Juneau K, Nislow C, Davis RW (2009) Alternative splicing of PTC7 in
Saccharomyces cerevisiae determines protein localization. Genetics 183: 185–194.6. Huh WK, Falvo JV, Gerke LC, Carroll AS, Howson RW, et al. (2003) Global
analysis of protein localization in budding yeast. Nature 425: 686–691.7. Saito H, Tatebayashi K (2004) Regulation of the osmoregulatory HOG MAPK
cascade in yeast. Journal of Biochemistry 136: 267–272.8. Ramos CW, Guldener U, Klein S, Hegemann JH, Gonzalez S, et al. (2000)
Molecular analysis of the Saccharomyces cerevisiae YHR076w gene. IUBMB Life 50:
371–377.9. Sickmann A, Reinders J, Wagner Y, Joppich C, Zahedi R, et al. (2003) The
proteome of Saccharomyces cerevisiae mitochondria. Proceedings of the NationalAcademy of Sciences 100: 13207–13212.
10. Krause-Buchholz U, Gey U, Wunschmann J, Becker S, Rodel G (2006)
YIL042c and YOR090c encode the kinase and phosphatase of the Saccharomyces
cerevisiae pyruvate dehydrogenase complex. Febs Letters 580: 2553–2560.
11. Tal R, Winter G, Ecker N, Klionsky DJ, Abeliovich H (2007) Aup1p, a yeastmitochondrial protein phosphatase homolog, is required for efficient stationary
phase mitophagy and cell survival. J Biol Chem 282: 5617–5624.12. Adler E, DonellaDeana A, Arigoni F, Pinna LA, Stragier P (1997) Structural
relationship between a bacterial developmental protein and eukaryotic PP2C
protein phosphatases. Molecular Microbiology 23: 57–62.13. Gey U, Czupalla C, Hoflack B, Rodel G, Krause-Buchholz U (2008) Yeast
pyruvate dehydrogenase complex is regulated by a concerted activity of twokinases and two phosphatases. Journal of Biological Chemistry 283: 9759–9767.
14. Abeliovich H (2011) Stationary-phase mitophagy in respiring Saccharomyces
cerevisiae. Antioxid Redox Signal 14: 2003–2011.15. Journo D, Mor A, Abeliovich H (2009) Aup1-mediated Regulation of Rtg3
during Mitophagy. Journal of Biological Chemistry 284: 35885–35895.16. Sakumoto N, Matsuoka I, Mukai Y, Ogawa N, Kaneko Y, et al. (2002) A series
of double disruptants for protein phosphatase genes in Saccharomyces cerevisiae andtheir phenotypic analysis. Yeast 19: 587–599.
17. Parsons AB, Brost RL, Ding HM, Li ZJ, Zhang CY, et al. (2004) Integration of
chemical-genetic and genetic interaction data links bioactive compounds tocellular target pathways. Nature Biotechnology 22: 62–69.
18. Xie MW, Jin FL, Hwang H, Hwang SM, Anand V, et al. (2005) Insights intoTOR function and rapamycin response: Chemical genomic profiling by using a
high-density cell array method. Proceedings of the National Academy of
Sciences of the United States of America 102: 7215–7220.19. Gonzalez A, Ruiz A, Casamayor A, Arino J (2009) Normal function of the yeast
TOR pathway requires the type 2C protein phosphatase Ptc1. Mol Cell Biol 29:2876–2888.
20. Loewith R, Hall MN (2011) Target of rapamycin (TOR) in nutrient signalingand growth control. Genetics 189: 1177–1201.
21. Loewith R, Jacinto E, Wullschleger S, Lorberg A, Crespo JL, et al. (2002) Two
TOR complexes, only one of which is rapamycin sensitive, have distinct roles incell growth control. Mol Cell 10: 457–468.
22. Urban J, Soulard A, Huber A, Lippman S, Mukhopadhyay D, et al. (2007) Sch9Is a Major Target of TORC1 in Saccharomyces cerevisiae. Mol Cell 26: 663–674.
23. Adams A, Gottschling DE, Kaiser CA, Stearns T (1997) Methods in Yeast
Genetics. Cold Spring Harbor Laboratory Press, NY.24. Calero F, Gomez N, Arino J, Ramos J (2000) Trk1 and Trk2 define the major
K(+) transport system in fission yeast. J Bacteriol 182: 394–399.25. Posas F, Camps M, Arino J (1995) The Ppz protein phosphatases are important
determinants of salt tolerance in yeast-cells. Journal of Biological Chemistry 270:
13036–13041.26. Winzeler EA, Shoemaker DD, Astromoff A, Liang H, Anderson K, et al. (1999)
Functional characterization of the S. cerevisiae genome by gene deletion andparallel analysis. Science 285: 901–906.
27. Goldstein AL, McCusker JH (1999) Three new dominant drug resistancecassettes for gene disruption in Saccharomyces cerevisiae. Yeast 15: 1541–1553.
28. Munoz I, Simon E, Casals N, Clotet J, Arino J (2003) Identification of multicopy
suppressors of cell cycle arrest at the G(1)-S transition in Saccharomyces cerevisiae.Yeast 20: 157–169.
29. Gonzalez A, Ruiz A, Serrano R, Arino J, Casamayor A (2006) Transcriptionalprofiling of the protein phosphatase 2C family in yeast provides insights into the
unique functional roles of Ptc1. J Biol Chem 281: 35057–35069.
30. Alberola TM, Garcia-Martinez J, Antunez O, Viladevall L, Barcelo A, et al.(2004) A new set of DNA macrochips for the yeast Saccharomyces cerevisiae: features
and uses. International Microbiology 7: 199–206.
31. Viladevall L, Serrano R, Ruiz A, Domenech G, Giraldo J, et al. (2004)
Characterization of the Calcium-mediated Response to Alkaline Stress in
Saccharomyces cerevisiae. J Biol Chem 279: 43614–43624.
32. Hegde P, Qi R, Abernathy K, Gay C, Dharap S, et al. (2000) A concise guide to
cDNA microarray analysis. BioTechniques 29: 548–556.
33. Herrero J, Valencia A, Dopazo J (2001) A hierarchical unsupervised growing
neural network for clustering gene expression patterns. Bioinformatics 17: 126–
136.
34. Ruepp A, Zollner A, Maier D, Albermann K, Hani J, et al. (2004) The FunCat,
a functional annotation scheme for systematic classification of proteins from
whole genomes. Nucleic Acids Research 32: 5539–5545.
35. Balakrishnan R, Park J, Karra K, Hitz BC, Binkley G, et al. (2012) YeastMine –
an integrated data warehouse for Saccharomyces cerevisiae data as a multipurpose
tool-kit. Database 2012.
36. Casamayor A, Serrano R, Platara M, Casado C, Ruiz A, et al. (2012) The role of
the Snf1 kinase in the adaptive response of Saccharomyces cerevisiae to alkaline pH
stress. Biochem J 444: 39–49.
37. Edgar R, Domrachev M, Lash AE (2002) Gene Expression Omnibus: NCBI
gene expression and hybridization array data repository. Nucleic Acids Research
30: 207–210.
38. Ruiz A, Serrano R, Arino J (2008) Direct regulation of genes involved in glucose
utilization by the calcium/calcineurin pathway. J Biol Chem 283: 13923–13933.
39. Ferrer-Dalmau J, Gonzalez A, Platara M, Navarrete C, Martinez JL, et al.
(2010) Ref2, a regulatory subunit of the yeast protein phosphatase 1, is a novel
component of cation homoeostasis. Biochem J 426: 355–364.
40. Garcia R, Rodrıguez-Pena JM, Bermejo C, Nombela C, Arroyo J (2009) The
high osmotic response and cell wall integrity pathways cooperate to regulate
transcriptional responses to zymolyase-induced cell wall stress in Saccharomyces
cerevisiae. Journal of Biological Chemistry 284: 10901–10911.
41. Zurita-Martinez SA, Puria R, Pan X, Boeke JD, Cardenas ME (2007) Efficient
Tor signaling requires a functional class C Vps protein complex in Saccharomyces
cerevisiae. Genetics 176: 2139–2150.
42. Mendl N, Occhipinti A, Muller M, Wild P, Dikic I, et al. (2011) Mitophagy in
yeast is independent of mitochondrial fission and requires the stress response
gene WHI2. Journal of Cell Science 124: 1339–1350.
43. Kissova I, Deffieu M, Manon S, Camougrand N (2004) Uth1p Is involved in the
autophagic degradation of mitochondria. Journal of Biological Chemistry 279:
39068–39074.
44. Rudra D, Mallick J, Zhao Y, Warner JR (2007) Potential interface between
ribosomal protein production and pre-rRNA processing. Molecular and Cellular
Biology 27: 4815–4824.
45. Schawalder SB, Kabani M, Howald I, Choudhury U, Werner M, et al. (2004)
Growth-regulated recruitment of the essential yeast ribosomal protein gene
activator Ifh1. Nature 432: 1058–1061.
46. Sakumoto N, Mukai Y, Uchida K, Kouchi T, Kuwajima J, et al. (1999) A series
of protein phosphatase gene disruptants in Saccharomyces cerevisiae. Yeast 15: 1669–
1679.
47. Kane PM (2006) The where, when, and how of organelle acidification by the
yeast vacuolar H+-ATPase. Microbiology and Molecular Biology Reviews 70:
177–191.
48. Huber A, French SL, Tekotte H, Yerlikaya S, Stahl M, et al. (2011) Sch9
regulates ribosome biogenesis via Stb3, Dot6 and Tod6 and the histone
deacetylase complex RPD3L. EMBO J 30: 3052–3064.
49. Martin DE, Soulard A, Hall MN (2004) TOR regulates ribosomal protein gene
expression via PKA and the Forkhead Transcription Factor FHL1. Cell 119:
969–979.
50. Kim EM, Kim J, Kim YG, Lee P, Shin DS, et al. (2011) Development of high-
throughput phosphorylation profiling method for identification of Ser/Thr
kinase specificity. J Peptide Sci 17: 392–397.
51. Christie KR, Weng S, Balakrishnan R, Costanzo MC, Dolinski K, et al. (2004)
Saccharomyces Genome Database (SGD) provides tools to identify and analyze
sequences from Saccharomyces cerevisiae and related sequences from other
organisms. Nucleic Acids Research 32: D311–D314.
52. Ruiz A, Gonzalez A, Garcia-Salcedo R, Ramos J, Arino J (2006) Role of protein
phosphatases 2C on tolerance to lithium toxicity in the yeast Saccharomyces
cerevisiae. Mol Microbiol 62: 263–277.
53. Abdulrehman D, Monteiro PT, Teixeira MC, Mira NP, Lourenco AB, et al.
(2011) YEASTRACT: providing a programmatic access to curated transcrip-
tional regulatory associations in Saccharomyces cerevisiae through a web services
interface. Nucleic Acids Research 39: D136–D140.
54. Causton HC, Ren B, Koh SS, Harbison CT, Kanin E, et al. (2001) Remodeling
of yeast genome expression in response to environmental changes. Mol Biol Cell
12: 323–337.
55. Jorgensen P, Rupes I, Sharom JR, Schneper L, Broach JR, et al. (2004) A
dynamic transcriptional network communicates growth potential to ribosome
synthesis and critical cell size. Genes & Development 18: 2491–2505.
Functional Characterization of Yeast Ptc6
PLOS ONE | www.plosone.org 14 May 2013 | Volume 8 | Issue 5 | e64470
Copyright © 2022 FDOKUMEN