Proton and pion production in Au+ Au collisions at 10.8 A GeV/c
24
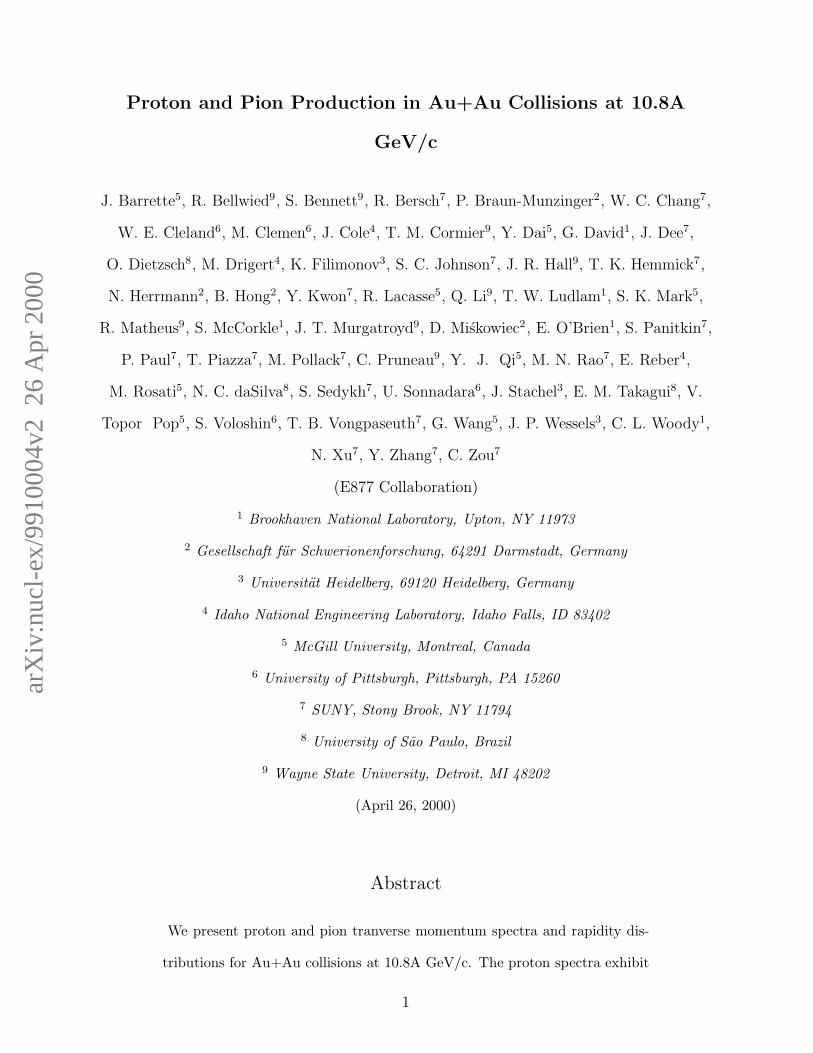
arXiv:nucl-ex/9910004v2 26 Apr 2000 Proton and Pion Production in Au+Au Collisions at 10.8A GeV/c J. Barrette 5 , R. Bellwied 9 , S. Bennett 9 , R. Bersch 7 , P. Braun-Munzinger 2 , W. C. Chang 7 , W. E. Cleland 6 , M. Clemen 6 , J. Cole 4 , T. M. Cormier 9 , Y. Dai 5 , G. David 1 , J. Dee 7 , O. Dietzsch 8 , M. Drigert 4 , K. Filimonov 3 , S. C. Johnson 7 , J. R. Hall 9 , T. K. Hemmick 7 , N. Herrmann 2 , B. Hong 2 , Y. Kwon 7 , R. Lacasse 5 , Q. Li 9 , T. W. Ludlam 1 , S. K. Mark 5 , R. Matheus 9 , S. McCorkle 1 , J. T. Murgatroyd 9 , D. Mi´ skowiec 2 , E. O’Brien 1 , S. Panitkin 7 , P. Paul 7 , T. Piazza 7 , M. Pollack 7 , C. Pruneau 9 , Y. J. Qi 5 , M. N. Rao 7 , E. Reber 4 , M. Rosati 5 , N. C. daSilva 8 , S. Sedykh 7 , U. Sonnadara 6 , J. Stachel 3 , E. M. Takagui 8 , V. Topor Pop 5 , S. Voloshin 6 , T. B. Vongpaseuth 7 , G. Wang 5 , J. P. Wessels 3 , C. L. Woody 1 , N. Xu 7 , Y. Zhang 7 , C. Zou 7 (E877 Collaboration) 1 Brookhaven National Laboratory, Upton, NY 11973 2 Gesellschaft f¨ ur Schwerionenforschung, 64291 Darmstadt, Germany 3 Universit¨ at Heidelberg, 69120 Heidelberg, Germany 4 Idaho National Engineering Laboratory, Idaho Falls, ID 83402 5 McGill University, Montreal, Canada 6 University of Pittsburgh, Pittsburgh, PA 15260 7 SUNY, Stony Brook, NY 11794 8 University of S˜ ao Paulo, Brazil 9 Wayne State University, Detroit, MI 48202 (April 26, 2000) Abstract We present proton and pion tranverse momentum spectra and rapidity dis- tributions for Au+Au collisions at 10.8A GeV/c. The proton spectra exhibit 1
Transcript of Proton and pion production in Au+ Au collisions at 10.8 A GeV/c
arX
iv:n
ucl-
ex/9
9100
04v2
26
Apr
200
0
Proton and Pion Production in Au+Au Collisions at 10.8A
GeV/c
J. Barrette5, R. Bellwied9, S. Bennett9, R. Bersch7, P. Braun-Munzinger2, W. C. Chang7,
W. E. Cleland6, M. Clemen6, J. Cole4, T. M. Cormier9, Y. Dai5, G. David1, J. Dee7,
O. Dietzsch8, M. Drigert4, K. Filimonov3, S. C. Johnson7, J. R. Hall9, T. K. Hemmick7,
N. Herrmann2, B. Hong2, Y. Kwon7, R. Lacasse5, Q. Li9, T. W. Ludlam1, S. K. Mark5,
R. Matheus9, S. McCorkle1, J. T. Murgatroyd9, D. Miskowiec2, E. O’Brien1, S. Panitkin7,
P. Paul7, T. Piazza7, M. Pollack7, C. Pruneau9, Y. J. Qi5, M. N. Rao7, E. Reber4,
M. Rosati5, N. C. daSilva8, S. Sedykh7, U. Sonnadara6, J. Stachel3, E. M. Takagui8, V.
Topor Pop5, S. Voloshin6, T. B. Vongpaseuth7, G. Wang5, J. P. Wessels3, C. L. Woody1,
N. Xu7, Y. Zhang7, C. Zou7
(E877 Collaboration)
1 Brookhaven National Laboratory, Upton, NY 11973
2 Gesellschaft fur Schwerionenforschung, 64291 Darmstadt, Germany
3 Universitat Heidelberg, 69120 Heidelberg, Germany
4 Idaho National Engineering Laboratory, Idaho Falls, ID 83402
5 McGill University, Montreal, Canada
6 University of Pittsburgh, Pittsburgh, PA 15260
7 SUNY, Stony Brook, NY 11794
8 University of Sao Paulo, Brazil
9 Wayne State University, Detroit, MI 48202
(April 26, 2000)
Abstract
We present proton and pion tranverse momentum spectra and rapidity dis-
tributions for Au+Au collisions at 10.8A GeV/c. The proton spectra exhibit
1

collective transverse flow effects. Evidence of the influence of the Coulomb in-
teraction from the fireball is found in the pion transverse momentum spectra.
The data are compared with the predictions of the RQMD event generator.
PACS number(s) : 25.75.+r
Typeset using REVTEX
2

I. INTRODUCTION
One of the main motivations of the relativistic heavy-ion program is the formation of
baryonic matter at extreme temperatures and densities, and the subsequent characterization
of such matter. Of central importance is the ability to understand to what extent the nuclear
matter has been compressed and heated. At the AGS, Au+Au collisions at about 11A
GeV/c have been characterized rather completely in terms of the global observables such as
transverse energy [1] and charged particle multiplicity [2]. From these measurements, it was
concluded that central Au+Au collisions exhibit a large degree of stopping and leads to larger
energy density than lighter systems at the same bombarding energy. Through comparisons
with models that reproduce the experimental data, it has been concluded that one reaches
baryon densities of up to 10 times normal nuclear matter density and energy densities of the
order of 2 GeV/fm3 in the center of the fireball [3]. These are in the range of parameters
where based on QCD calculations one expects a baryon-rich deconfined phase. Distributions
in rapidity and transverse momentum of the particles emitted in such collisions contain more
complete information about the degree of stopping attained and provide more sensitive tests
of the validity of the model predictions. Semi-inclusive proton and pion distributions from
central Au+Au reactions at 11.6A GeV/c have been reported in Ref [4]. It was observed
that the rapidity distribution for protons has a maximum around mid-rapidity consistent
with a large degree of stopping and hence high baryon density. In this paper we present
measurements of the forward-rapidity inclusive double differential multiplicities and rapidity
distributions for proton and pions in central Au+Au collisions at a beam momentum of 10.8A
GeV/c.
II. EXPERIMENT
The experiment was performed using the E877 apparatus at the AGS at the Brookhaven
National Laboratory. The E877 set-up used in this experiment is an upgrade of the E814
3
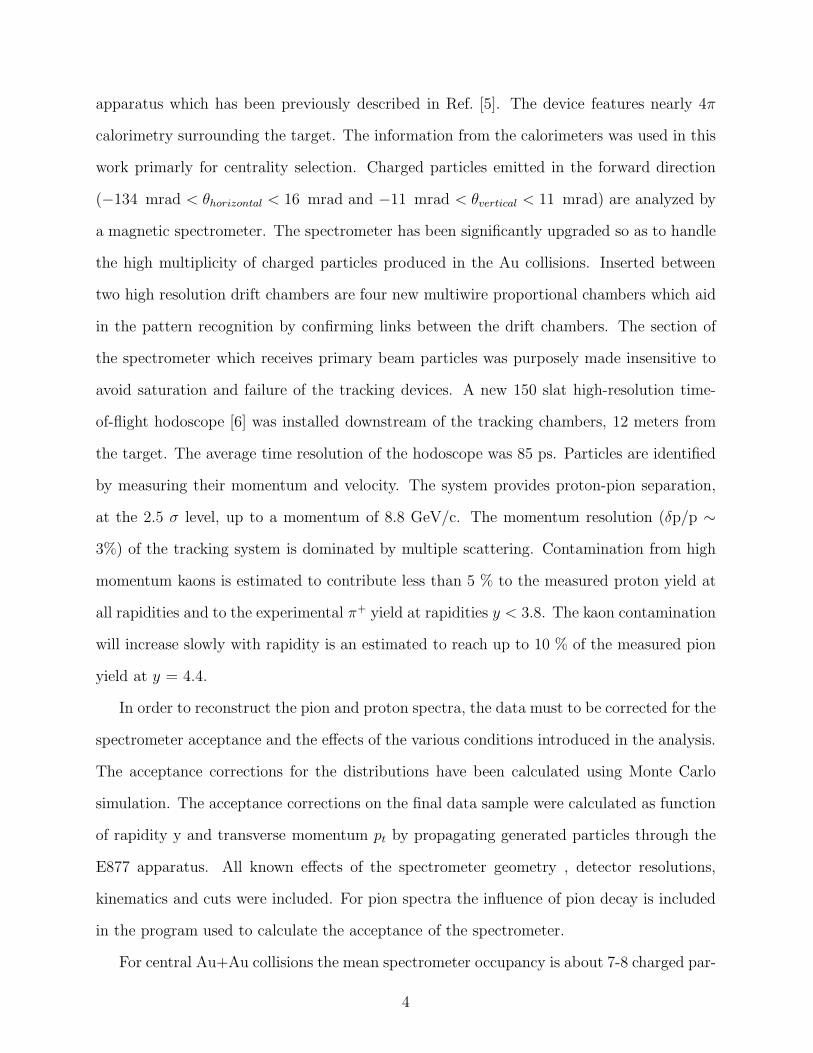
apparatus which has been previously described in Ref. [5]. The device features nearly 4π
calorimetry surrounding the target. The information from the calorimeters was used in this
work primarly for centrality selection. Charged particles emitted in the forward direction
(−134 mrad < θhorizontal < 16 mrad and −11 mrad < θvertical < 11 mrad) are analyzed by
a magnetic spectrometer. The spectrometer has been significantly upgraded so as to handle
the high multiplicity of charged particles produced in the Au collisions. Inserted between
two high resolution drift chambers are four new multiwire proportional chambers which aid
in the pattern recognition by confirming links between the drift chambers. The section of
the spectrometer which receives primary beam particles was purposely made insensitive to
avoid saturation and failure of the tracking devices. A new 150 slat high-resolution time-
of-flight hodoscope [6] was installed downstream of the tracking chambers, 12 meters from
the target. The average time resolution of the hodoscope was 85 ps. Particles are identified
by measuring their momentum and velocity. The system provides proton-pion separation,
at the 2.5 σ level, up to a momentum of 8.8 GeV/c. The momentum resolution (δp/p ∼
3%) of the tracking system is dominated by multiple scattering. Contamination from high
momentum kaons is estimated to contribute less than 5 % to the measured proton yield at
all rapidities and to the experimental π+ yield at rapidities y < 3.8. The kaon contamination
will increase slowly with rapidity is an estimated to reach up to 10 % of the measured pion
yield at y = 4.4.
In order to reconstruct the pion and proton spectra, the data must to be corrected for the
spectrometer acceptance and the effects of the various conditions introduced in the analysis.
The acceptance corrections for the distributions have been calculated using Monte Carlo
simulation. The acceptance corrections on the final data sample were calculated as function
of rapidity y and transverse momentum pt by propagating generated particles through the
E877 apparatus. All known effects of the spectrometer geometry , detector resolutions,
kinematics and cuts were included. For pion spectra the influence of pion decay is included
in the program used to calculate the acceptance of the spectrometer.
For central Au+Au collisions the mean spectrometer occupancy is about 7-8 charged par-
4

ticles per event, and is strongly position dependent in the bending plane of the spectrometer,
varying from 1% to 18% per drift chamber sense wire. Track reconstruction efficiency de-
creases abruptly when two tracks are closer than twice the wire spacing in a drift chamber.
The occupancy variation introduces a position dependent efficiency for track reconstruction
and is a source of systematic error. Two correction procedures were developed as part of
a set of independent data analyses. Each of the procedures used the measured occupancy
in all tracking devices as its basis, thereby avoiding model dependence in the correction.
The first method [7] involved a detailed model of the track reconstruction efficiency as a
function of track separation. Each track is given a weight that, to first order, accounts for
the tracks that are lost due to the presence of the track seen. No tracks are removed from
the data sample in this method. The other method rejected every pair of tracks which in
a given detector failed a minimum separation cut below which the tracking efficiency is less
than unity [8,9]. In this case the effect of the cut was calculated either by adding virtual
tracks to the events and computing the probability that such tracks fail the minimum cut.
The correction factor varies from 1.1 to 1.3, the largest correction being for tracks passing
near the deadened beam region. The two correction methods give very similar results with
maximum differences of 5%. The second correction procedure was also tested in a simulation
using the GEANT [10] package. Application of the correction procedure to the Monte Carlo
generated data tracked through the spectrometer reproduces the initial distribution with
maximum deviations of 5%. Considering the agreement both between the two correction
methods and with the GEANT simulation, and the systematic uncertainties in overall single
track reconstruction efficiency, we deduce a combined systematic error of less than 10%. All
data points in the figures have statistical error bars only, which are often smaller than the
data point symbol.
Central collisions were defined as those producing high transverse energy in the pseudo-
rapidity interval −0.5 < η < 0.8, where η = −ln[tan(θ/2)], such that σcentral is 4% of the
geometric cross section. The resolution on the centrality has been estimated by studying
the fluctuation in the transverse energy (Et) distribution in the solid angle covered by the
5

target calorimeter TCAL that is used to determine the collision centrality. This results in a
smooth cut-off in the impact parameter distribution that is taken into account in generating
the calculated spectra. Based on RQMD simulations it is estimated that the selected events
correspond to a mean impact parameter of about 2.4 fm. For the 0− 4% centrality cut this
resolution in impact parameter is estimated to be ≈ 0.7 fm.
III. RESULTS
A. Protons
Fig. 1 shows the measured proton transverse mass spectra for central Au+Au collisions.
The vertical axis is (1/m2t ) × (d2N/dmtdy), the representation in which a Boltzmann (or
thermal) distribution is a pure exponential in mt (mt =√
p2t + m2). The spectra are close to
exponential. One notes, however, a steep component at low mt for rapidities near ybeam=3.14,
which in Si+A collisions was identified as due to the projectile spectator nucleons [11].
Also plotted are the results of two component Boltzmann fits to the data (full lines).
The dashed lines near beam rapidity show the contribution from the component with large
inverse slope parameter TB that can be attributed to emission from the central “fireball”.
This component always dominates at mt − m larger than 0.1 GeV/c2. The histograms
correspond to the prediction of the RQMD event generator [12] (RQMD 1.08).
As it was done for the experimental data, the analysis of the RQMD generated events
included selection of the 4% most central collisions from the produced Et in the pseudo-
rapidity interval −0.5 < η < 0.8. RQMD treats the projectile and target as an unbound
ensemble of nucleons with Fermi energy distributions. This introduces a large unphysical
excess in the number of calculated spectator nucleons. These were removed by considering
in the calculated spectra only protons that have had one or more interactions.
RQMD reproduces quite well the average multiplicities but the calculated spectra are
consistently steeper than the data.
6

The systematic differences between the data and the model predictions are better shown
in Fig. 2 where we compare the values of fitted inverse slope parameters TB as a function of
rapidity, with RQMD predictions. At each rapidity the calculated spectra were fitted over
the range covered by experimental data.
The rapidity dependences of the measured and predicted inverse slope parameters are
very similar but the RQMD spectra give values that are systematically about 20% lower
than the data. The derived slope parameters increase very rapidly near central rapidity.
This is different than what was observed for Si+Al collisions [5,13] and also deviate from
the 1/cosh(y) dependence expected for an isotropically expanding fireball.
The observed behavior can be explained by the presence of strong transverse collective
flow in the measured spectra near midrapidity. Transverse collective flow leads to deviation
from the exponential shape expected for a pure thermal source [14–16].
In particular, transverse flow results in flatter distribution (i.e. higher value of TB) at
low mt. This flattening which has been observed [4] is predicted to increase with the flow
velocity and with the mass of the produced particles. The fact that the measured spectra
are flatter than the calculated spectra suggests that the pure cascade version of RQMD
as implemented in RQMD 1.08 predicts a too small collective flow. A similar conclusion
has been reached in Ref. [17] from a study of the proton and pion azimuthal distributions
measured relative to the reaction plane.
This is also consistent with the results shown in Fig. 3 where we compare the proton
spectra predicted by RQMD 2.3 for Au+Au collisions in cascade mode and including the
effect of mean field. The introduction of mean-field in RQMD gives somewhat flatter spectra
particularly at low value of mt and close to mid-rapidity.
The predicted effect of the mean field on the deduced inverse slope parameter in our
acceptance is shown in Fig. 4. The cascade results are in good agreement with those in Fig.
2 when taken into account the shift ∆y = 0.03 in the center of mass rapidity between the
two energies. The introduction of mean field in RQMD 2.3 has little effect on the inverse
slope parameter at the most forward rapidities , but give results in much better agreement
7

with the data closer to midrapidity.
The proton rapidity distribution dN/dy is presented in Fig. 5. It has been obtained by
integrating over the transverse mass using the measurements where available and extending
the integral analytically to pt = 0 and pt → ∞ using the results from the exponential
fits. This procedure was tested using the spectra calculated with RQMD. The data points
nearest to the center of mass have been omitted since the limited mt range of the measured
spectra results in large systematic errors. It is estimated that the extrapolation leads to
an overestimation of the yield for the first data point in Fig. 5 at y=2.55 by a maximum
of roughly 15 % while the systematic error is negligible for data points at y ≥ 2.85. The
stars represent the contribution to the total proton multiplicity from the low mt component
calculated from the fitted spectra. As expected, it is centered near ybeam=3.14. It is a
relatively small contribution to the total proton multiplicity. The peak near beam rapidity
integrates to one proton. In the measured rapidity range, RQMD (histogram) reproduces
fairly well the measured rapidity distribution. The calculated distribution shows a weak
inflexion near beam rapidity that can be associated with spectator-like protons that have
had minimal interaction in the collision.
B. Pions
The transverse mass spectra for π+ and π− are presented in Fig. 6. The solid curves show
Boltzmann fits to the data. Exponential functions are fitted to the data above to mt − mπ
≥ 175 MeV/c2 in the rapidity bins where available, y ≤ 3.4 for π+ and y ≤ 3.9 for π−,and
starting from mt − mπ = 0 GeV/c2 at higher rapidities.
As observed for Si+Pb system [18], the spectra show a significant enhancement over a
Boltzmann distribution at low mt. This has been attributed to the contribution from the
decay of ∆ resonances and higher mass resonances [18–21]. The rapidity dependence of
the shape of the spectra and the magnitude of low pt enhancement attributed to resonance
decay pions are well reproduced by RQMD. The calculation slightly over-estimates the yield
8
of negative pions especially at high rapidities.
The pion rapidity distributions for π+ and π− are obtained by integrating over the
transverse mass, using the measured yield where available and extrapolating the integral
analytically to large mt. The results are compared to the predictions of RQMD in Fig. 7.
The shape of the rapidity distribution is rather well reproduced by RQMD over the entire
range in rapidity covered by the present data. A similar agreement was also observed for
the Si+A systems [22,23]. Small but significant deviations in the tail of the distribution
are better visualized in the insets of the figure where the same distributions are shown on
a logarithmic scale. In the range of our measurement the yields of both the positive and
negative pions are systematically overpredicted by the RQMD 1.08 model with deviations
that increase with rapidity and reaches a factor ≃ 1.5 at rapidity y=4.
C. π−/π+ ratio
Close inspection of the transverse mass curves of Fig. 6 reveals that the deviations from
a pure exponential emission are systematically smaller for π+ than for π−. This charge
asymmetry of the pion distributions is better studied by plotting the ratio of π− to π+
cross section as done in Fig. 8. In order to improve statistical errors on the ratio, the
data were grouped into three larger rapidity bins. A strong charge asymmetry is observed
starting at mt − mπ < 0.2 GeV/c2 with a maximum value of dN/dy(π−)/dN/dy(π+) ≃ 1.6
at mt − mπ = 0 GeV/c2 for the y = 2.9 − 3.2 rapidity slice. The measured asymmetry
systematically decreases as a function of rapidity. The observed rapidity dependence is in
agreement with the charge asymmetry measured by the E802 collaboration near ycm for
similar centrality [4].
The observed pion charge asymmetry and its rapidity dependence can be attributed to
the different Coulomb potentials seen by the two type of pions at freeze-out. The Coulomb
origin of this effect is supported by the results of the RQMD calculations which do not
take into account final state interaction of the reaction products (second row of Fig. 8). As
9

expected, RQMD predicts no significant mt dependence in the ratio of the pion cross section
with an overall excess of negative pions of ≈ 20%.
In heavy systems, anomalously large π−/π+ ratios have been attributed to the effect of
Coulomb interaction over a wide range of beam energies [24–31]. At the AGS, the first
evidence of Coulomb effects in heavy systems was reported in 28Si induced reactions [32,33].
We have used a simple model to study if the measured rapidity and mt dependence of
the π−/π+ ratio can be explained by the Coulomb interaction. The model is built along the
line of the argument presented in [34,35] and similar to that discussed in [31]. It uses an
effective central Coulomb potential to simplify the difficult many-body problem.
Assuming that the fireball is at rest in the center-of-mass and neglecting its time evo-
lution, the effective Coulomb potential VC seen by a singly-charged test particle is given
by,
VC =Zeff · e2
ri
(1)
where the effective charge Zeff < ZA + ZB is expected to be smaller than the total charge
present in A + B collisions and ri is the radius at which the particle leaves the fireball.
After exiting from the Coulomb potential well, the measured energy E(p) of a test particle
of positive/negative charge becomes
E(p) = E(pi) ± VC (2)
where pi are the initial momentum and position at freeze-out. The number of particles
per unit of momentum is then expressed as
n(p) = n(pi)d3pi
d3p=
piE(pi)
pE(p)n(pi) (3)
where n(pi) is the initial particle distribution and d3pi/d3p is the Jacobian deduced from
energy conservation [35]. The initial single particle distribution n(pi) is therefore changed in
magnitude as well as distorted by the Coulomb field. The Coulomb field induced distortion
C, can then be written as :
10

C± =piE(pi)
pE(p)(4)
=√
p2 ∓ 2E(p)VC + V 2C · (E(p) ∓ VC)
pE(p)(5)
for positively/negatively charged particles. The Coulomb distortion of the pion ratio is
expressed in terms of measured momenta p as
π−
π+(p) = R · C
−
C+· n(p−i )
n(p+i )
(6)
= R ·
√
p2 + 2E(p)VC + V 2C
√
p2 − 2E(p)VC + V 2C
· (E(p) + VC)
(E(p) − VC)· n(p−i )
n(p+i )
(7)
where R is an overall normalization constant. The transverse momentum and rapidity
dependences are introduced by substituting E = mt cosh(y) and p =√
E2 − m2. Thus, the
model predicts the shape of the π−/π+ ratio as well as its rapidity dependence with only
two free parameters: the effective Coulomb potential VC and the normalization constant R.
The model neglects the deflection of the particle trajectories induced by the Coulomb
interaction. It is assumed that the initial angle of the particle (pt/pz) is conserved. Possible
quantum mechanical effects are ignored and we also neglect the possible contribution from
the spectators. Such a contribution has been discussed at lower energies [34,36]. However,
our analysis concerns only the most central collisions where the fraction of the total charge
carried by the spectators is relatively small. Also, the projectile spectators are far from
the central fireball at t≈9 fm/c, the typical pion emission time determined by 2 particle
correlation studies [39]. The model also assumes a static effective potential that is identical
for all the particles. This approximation is not valid in general. However, here we discuss
mainly high rapidity pions that are in the tail of the dN/dy rapidity distribution. Thus,
on the average, these pions see a relatively similar central fireball at freeze out. This also
justifies the neglect of the expansion of the fireball. These approximations are less valid as
one approaches mid-rapidity.
The undistorted n(p±i ) distributions are not accessible experimentally. In the present
calculation, in agreement with the RQMD prediction, we assume that both distributions
11

are similar in shape. The initial spectral shapes are generated using mean values of the
parameters used in the two-exponential description of the data (see Fig. 6).
The model predictions are compared to the measured ratios of pion transverse mass
spectra in Fig. 9. The predictions of the Coulomb distortion model (solid lines) are obtained
from a fit to the first four measured distributions where the observed effect is the largest.
The values of VC ≈ 31±22 MeV and R ≈ 0.92±0.14 are found to best describe the shape and
rapidity dependences of the pion ratio. These parameters are found to be still in agreement
with the data at larger rapidities. The errors of the fitted values (dotted lines) are rather
large, because there is a strong correlation between the effect of the relative normalization
constant R and that of the effective Coulomb potential value.
The Coulomb induced distortion has two components: a Coulomb factor C−/C+ and
an amplitude factor n(p−i )/n(p+i ) that is related to the shape of the initial pion spectra.
The effects of R and VC can not be distinguished above transverse mass values of about
0.25 GeV/c2 since the Coulomb distortion is rather flat and affects mainly the ratio of the
pion yield. At low mt, the two factors distort the shape of the pion ratio in a similar way,
but quantitatively most of the distortion is attributable to the Coulomb factor.
Note, that secondary π− from lambda decay will generate an excess of negative pions.
This effect was studied by a Monte Carlo simulation using as input the lambda spectrum
predicted by RQMD and taking into account the acceptance of the E877 spectrometer. This
calculation shows that in the rapidity range discussed here the contribution from Λ decay
is negligible above mt − mπ− = 0.1 GeV/c2 and contribute at most 10-15% of the observed
asymmetry at mt −mπ− = 0, where this effect is maximum.We verified the influence of this
uncertainty on the derived values of VC by modifying the data set in agreement with the
calculated influence of Λ decay. The effect on the results was found to be of the order of 2
MeV and thus negligible when compare to the large uncertainty originating from the strong
correlation between VC and R.
The present value of VC is in a good agreement with the Coulomb potential obtained
from a similar analysis of the pion spectra in Au+Au collisions at a bombarding energy of
12

1 GeV/nucleon [31].
The uncertainty on the value of the R and VC constants could be improved with a larger
data sample, e.g. by providing a measurement that would extend to larger values of mt.
Such data would better fix the relative values of R and VC while the shape at low mt would
fix the magnitude of VC . We remark also, that a more precise estimate of the effect of the
Coulomb field on the measured pion spectra should take into account the effect of radial
flow and emission time [37,38].
The pion rapidity distribution should also show effects of the Coulomb interaction since
this interaction not only affects the transverse momentum but also the final rapidity of
the emitted pions. We have shown in Fig. 7 that the π+ and π− have similar rapidity
distributions reasonably well reproduced by RQMD with, however, increasing deviations
at very forward rapidity. In Fig. 10, the ratio of the pion yield dN/dy(π−)/dN/dy(π+) is
plotted as a function of rapidity. One observes that the ratio shows a systematic decrease
towards high rapidities while the RQMD 1.08 model (dashed histogram) predicts a very flat
if anything slightly opposite rapidity dependence.
We have used the Coulomb distortion model developed here to determine if we can
provide a consistent description of the effects observed both in the transverse mass spectra
and in the rapidity dN/dy distribution. The dN/dy ratios calculated using the parameters
VC = 31 MeV and R = 0.92 deduced from the shape of the mt spectra are shown by the solid
line in Fig. 10. The calculated ratios are obtained by integrating the calculated distorted
transverse mass distribution.
The rapidity dependence of the data is very well reproduced by the model over the entire
measured rapidity range. The effective Coulomb field in Au+Au collisions is strong enough
to significantly distort the rapidity distributions of light particles and, as shown in the figure,
the ratio of pion dN/dy can vary by more than 20% depending on the rapidity at which it
is measured. This result shows that light particle yield ratios should be interpreted with
care and the comparison of yield ratios from experiments performed at different rapidities
should take into account potential Coulomb effects.
13

It is interesting to compare the expected Coulomb potential viewed by the first pions
that are ejected from the fireball to the effective Coulomb potential VC obtained from our
simple model. Using a simple geometrical model it is estimated that the mean total charge
of the participants for the present event sample is Z ≈ 150. Handbury-Brown-Twiss (HBT)
analysis of pion correlations provides an estimate of the fireball radius. One-dimensional
HBT analysis of Au+Au central gives radius of ≈ 6.0 fm [40–43]. These numbers lead to
uniformly-charged-sphere Coulomb potential values of V ≈ 36 MeV, an estimate consisten
with the value obtained from our simple model of the Coulomb interaction.
IV. CONCLUSIONS
In summary, we have presented new results on the spectra and multiplicity distributions
of protons and pions emitted at forward rapidity in Au+Au collisions at 10.8A GeV/c.
When combined with the data from E802 experiment [4] we now have a measurements of
proton and pion production in central Au+Au collisions at AGS energy over the complete
phase space.
The shape of the rapidity distribution of the protons over the entire range in rapidity
covered by the present data, is rather well reproduced by RQMD 1.08 . The measured
transverse momentum spectra have, however, larger inverse slope parameters than predicted
by the model. This is consistent with the presence of a larger collective tranverse flow than
predicted by a pure cascade model.
The shape of the spectra and mutiplicity distributions of the pions are very well described
by RQMD. Systematic differences between the π− and π+ spectra at low values of the
tranverse momentum are, however, observed that are not predicted by the model. It is
shown using a simple model that the observed effect is consistent with that expected from
the different Coulomb potential felt by the two types of pions. Our simple analysis shows that
the π−/π+ ratio provides an additional way, complementary to the Hanbury-Brown-Twiss
interferometry and particle correlation analysis, for studying source sizes and dynamics.
14
ACKNOWLEDGMENTS
We wish to thank the Brookhaven Tandem and AGS staff for their excellent support
and are particularly grateful for the expert help of W. McGahern and Dr. H. Brown. We
also wish to acknowledge the important technical support provided by R. Hutter and J.
Sondericker. Financial support by the US DoE, the NSF, the Canadian NSERC, and CNPq
Brazil is acknowledged.
15

REFERENCES
[1] J. Barrette et al., the E814/E877 Collaboration, Phys. Rev. Lett. 70, 2996 (1993).
[2] J. Barrette et al., the E877 Collaboration, Phys. Rev. C 51, 3309 (1995).
[3] J. Stachel, Nucl. Phys. A654, 119 (1999); Proceedings of Int. Nucl. Phys. Conf.
(INPC98), Paris, France, 24-28 August, 1998 ; nucl-ex/9903007
[4] L. Ahle et al., the E802 Collaboration, Phys. Rev. C 57, R466 (1998).
[5] J. Barrette et al., the E814 Collaboration, Phys. Rev. C 50, 3047 (1994).
[6] R. Lacasse et al., Nucl. Instr. Meth. in Phys. Res. 408, 408 (1998).
[7] R. Lacasse, Ph.D. thesis, McGill University, 1998.
[8] T. W. Piazza, Ph.D. thesis, SUNY at Stony Brook, 1997.
[9] S. Voloshin, E877 note HD-96/08/15 .
[10] R. Brun et al., Geant 3 Users Guide, CERN Data Handling Division Report No.
DD/EE/84-1, 1984.
[11] J. Barrette et al., the E814 Collaboration, Phys. Rev. C 45, 819 (1992).
[12] H. Sorge, H. Stocker, W. Greiner, Ann. Phys. (N.Y.) 192, 266 (1989).
[13] T. Abbott et al., the E802 Collaboration, Phys. Rev. C 50, 1024 (1994).
[14] P. Braun Munzinger, J. Stachel, J. P. Wessels, Xu Nu, Phys. Lett. B344, 43 (1995).
[15] R. Mattiello, A. Jahns, H. Sorge, H. Stocker, and W. Greiner, Phys. Rev. Lett. 74, 2180
(1995).
[16] P. Braun Munzinger, J. Stachel, J. P. Wessels, Xu Nu, Phys. Lett. B365, 1 (1996).
[17] J. Barrette et al., the E877 Collaboration, Phys. Rev. C 56, 3254 (1997).
[18] J. Barrette et al., the E814 Collaboration, Phys. Lett. B351, 93 (1995).
16
[19] G.E. Brown, J. Stachel, and G.M. Welke, Phys. Lett. B253, 19 (1991).
[20] B.-A. Li, Phys. Letts. B254, 335 (1991).
[21] J. Sollfrank, P. Koch, and U. Heinz, Phys. Letts. B252, 256 (1990).
[22] T.K. Hemmick for the E814 Collaboration, Nucl. Phys. A566, 435c (1994).
[23] M. Gonin, Ole Hansen, R. Moskowitz, F. Videbæk, H. Sorge, R. Matiello, Phys. Rev.
C 51, 310 (1995).
[24] W. Beneson et al., Phys. Rev. Lett. 43, 683 (1979).
[25] G. Bertsch, Nature 283, 280 (1980).
[26] K. L. Wolf et al., Phys. Rev. Lett. 42, 1448 (1979).
[27] S. Nagamiya et al., Phys. Rev. C 24, 971 (1981).
[28] K. L. Wolf et al., Phys. Rev. C 26, 2572 (1982).
[29] B.-A. Li, Phys. Lett. B346, 5 (1995).
[30] H. Bœggild et al., Phys. Lett. B372, 339 (1996).
[31] A. Wagner et al., Phys. Lett. B420, 20 (1998).
[32] M. Gonin for the E802/E866 Collaboration, Nucl. Phys. A566, 601c (1994).
[33] F. Videbæk for the E802 Collaboration, Nucl. Phys. A590, 249c (1995).
[34] M. Gyulassy and S. K. Kauffmann, Nucl. Phys. A362, 503 (1981).
[35] G. Baym and P. Braun-Munzinger, Nucl. Phys. A610, 286c (1996).
[36] K. G. Libbrecht and S. E. Koonin, Phys. Rev. Lett. 43, 1581 (1979).
[37] M. G.-H. Mostafa and C.-Y. Wong, Phys. Rev. C 51, 2135 (1995).
[38] H. W. Barz, J. P. Bondorff, J. J. Gaardhœje, and H. Heiselberg, Phys. Rev. C 56, 1553
17

(1997).
[39] J. Barrette et al., the E814 Collaboration, Phys. Lett. B333, 33 (1994).
[40] J. Barrette et al., the E877 Collaboration, Phys. Rev. Lett. 78, 2916 (1997).
[41] D. Miskowiec for the E877 Collaboration, Nucl. Phys. A610, 227c (1996).
[42] M. D. Baker for the E859/E866 Collaboration, in HIPAGS ’96 (Wayne State University,
Detroit, 1996), pp. 159–165.
[43] M. D. Baker for the E802 Collaboration, Nucl. Phys. A610, 213c (1996).
18

10-1
1
10
10 2
10 3
10 4
10 5
10 6
10 7
10 8
10 9
10 10
10 11
10 12
10 13
10 14
10 15
-0.1 0 0.1 0.2 0.3 0.4 0.5 0.6 0.7 0.8
mt-mp (GeV/c2)
1/m
t2 d2 N/
dmtdy
(c
6 /GeV
3 )
y=2.2-2.3
y=2.5-2.6
y=3.2-3.3
x1010
x10
FIG. 1. Transverse mass spectra for protons produced in central (σcentral/σgeom=0.04) Au+Au
collisions. The dots correspond to constant pt bins of 20 MeV, and y bins of 0.1 units. Beginning
with rapidity bin y=3.3-3.4, spectra have been multiplied by successively increasing factors of ten.
Full lines are two component exponential fits to the data. The histograms are RQMD predictions.
19

0
50
100
150
200
250
300
2.2 2.4 2.6 2.8 3 3.2 3.4 3.6
TB (
MeV
)
y
σ/σgeom=4 %
Thermal protons
Spectators
RQMD 1.08
10.8A GeV/c
FIG. 2. Inverse slope parameters deduced from fits to the proton mt spectra for central Au+Au
collisions. The solid circles correspond to the high mt component and the open circles correspond
to the low mt component. The squares are the results for the high mt component of a similar fit
to the calculated spectra.
1
10
10 2
1
10
10 2
0 0.2 0.4 0.6 0 0.2 0.4 0.6 0.8
mt-mp (GeV/c2)
Au + Au → p + X11.5A GeV/cσ/σgeom = 4 %
RQMD 2.3mean fieldcascade
y = 2.2 - 2.3 y = 2.4 - 2.5
y = 2.6 - 2.7 y = 2.8 - 2.9
(1/
mt2 )
d2 N
/dm
tdy
(c6 /G
eV3 )
FIG. 3. Comparison of the proton transverse mass spectra for central Au+Au collisons at 11.5A
Gev/c predicted by RQMD 2.3 run in a cascade mode (dashed histograms) and including the effects
of mean field (full histograms).
20
0
50
100
150
200
250
300
2.2 2.4 2.6 2.8 3 3.2 3.4 3.6
TB (
MeV
)
y
σ/σgeom=4 %
Thermal protons
RQMD v2.3-mean
11.5A GeV/c
RQMD v2.3-casc
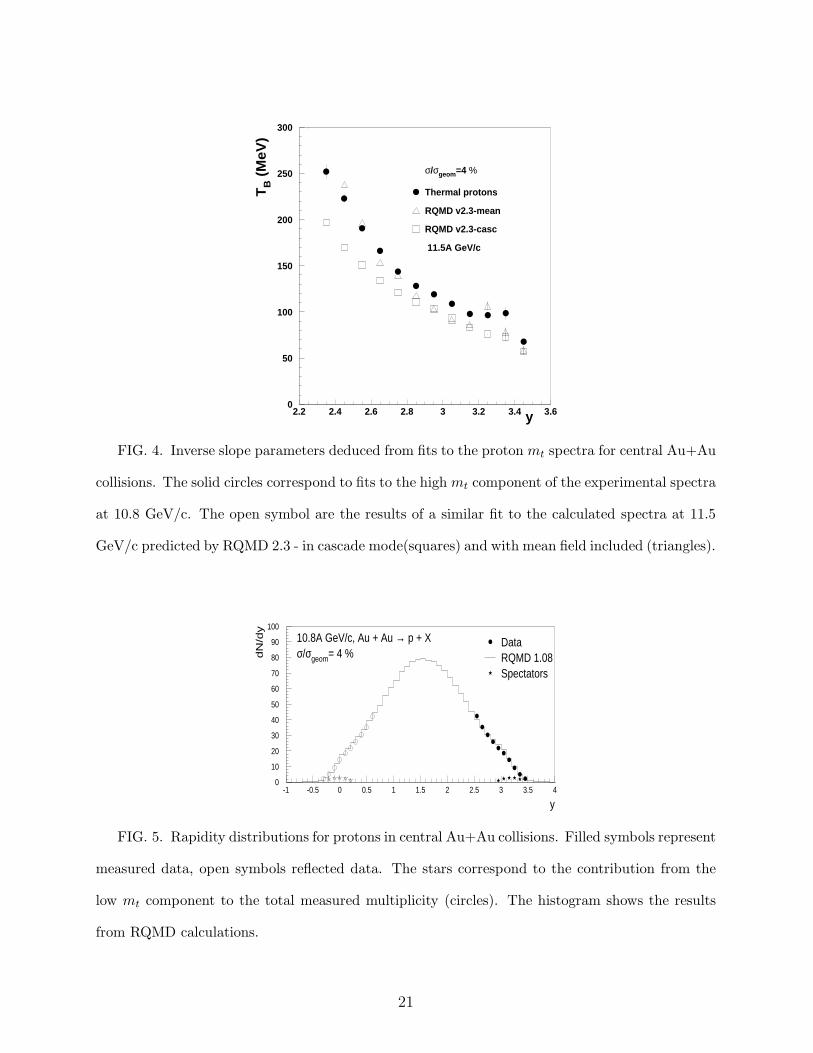
FIG. 4. Inverse slope parameters deduced from fits to the proton mt spectra for central Au+Au
collisions. The solid circles correspond to fits to the high mt component of the experimental spectra
at 10.8 GeV/c. The open symbol are the results of a similar fit to the calculated spectra at 11.5
GeV/c predicted by RQMD 2.3 - in cascade mode(squares) and with mean field included (triangles).
0
10
20
30
40
50
60
70
80
90
100
-1 -0.5 0 0.5 1 1.5 2 2.5 3 3.5 4
y
dN
/dy
RQMD 1.08
10.8A GeV/c, Au + Au → p + Xσ/σgeom= 4 %
Data
Spectators
FIG. 5. Rapidity distributions for protons in central Au+Au collisions. Filled symbols represent
measured data, open symbols reflected data. The stars correspond to the contribution from the
low mt component to the total measured multiplicity (circles). The histogram shows the results
from RQMD calculations.
21

1
10 2
10 4
10 6
10 8
10 10
10 12
10 14
10 16
10 18
10 20
10 22
0 0.2 0.4 0.6 0.8
1/m
t2 d
2N
/dm
tdy
(c
6/G
eV
3)
π+y=2.8-2.9
y=3.4-3.5
y=3.8-3.9
y=4.2-4.3
x10
0 0.2 0.4 0.6 0.8
mt-mπ (GeV/c2)
π-y=2.8-2.9
y=3.4
-3.5
y=3.8-3.9
y=4.2-4.3
x10
FIG. 6. Pion transverse mass spectra for central (σcentral/σgeom=0.04) Au+Au collisions. Be-
ginning with y=4.4-4.5, the spectra have been multiplied by successively increasing factors of ten.
Full lines are the results of Boltzmann fits to the data over a limited range (see text). The his-
tograms are RQMD predictions.
22

0
10
20
30
40
50
60
70
80
90
10.8A GeV/c Au+Au→π++X
σ/σgeom=4%
dN/d
y
0
10
20
30
40
50
60
70
80
90
-1 0 1 2 3 4
10.8A GeV/c Au+Au→π-+X
y
dN/d
y
1
10
3 4
1
10
3 4
FIG. 7. Rapidity distributions for charged pions (dots) in central Au+Au collisions. Measure-
ments are reflected (open symbols) about mid rapidity. Also shown are the results from RQMD
calculations (histogram). The insets show the high rapidity part of the distributions on a logarith-
mic scale.
0
0.5
1
1.5Data
y=2.9-3.2 y=3.2-3.5 y=3.5-3.8
mt-mπ (GeV/c2)
dN/d
y(π- )/
dN/d
y(π+
)
0
0.5
1
1.5
0 0.25 0.5
RQMD 1.08
y=2.9-3.2
0 0.25 0.5
y=3.2-3.5
0 0.25 0.5
y=3.5-3.8
FIG. 8. Top row; transverse mass dependence of the experimental pion cross section ratio
π−/π+ for three rapidity intervals. Bottom row; corresponding RQMD predictions for the π−/π+
cross section ratio.
23

0
0.5
1
1.5
y=3.0-3.1
dN
/dy(
π- )/dN
/dy(
π+)
y=3.2-3.3
0
0.5
1
1.5
y=3.4-3.5
0
0.5
1
1.5
0 0.25 0.5
y=3.6-3.7
0 0.25 0.5 0 0.25 0.5
y=3.8-3.9
mt-mπ (GeV/c2)
FIG. 9. The π−/π+ ratio as a function of transverse mass for nine rapidity intervals. The solid
line is the result from a Coulomb distortion calculation. The dotted lines show the statistical error
of the fit.
0
0.2
0.4
0.6
0.8
1
1.2
1.4
3 3.2 3.4 3.6 3.8 4 4.2 4.4 4.6
Data
RQMD 1.08
Coulomb distorted ratio
dN
/dy
(π- )/
dN
/dy
(π+)
y
FIG. 10. Rapidity distribution of the experimental π−/π+ cross section ratio (dots). Also
shown are the calculated ratio taking into account the effect of Coulomb distortion (full line) and
the results from RQMD calculations (histogram).
24