Delta phi Delta eta correlations in central Au plus Au collisions at root S-NN = 200 GeV
16
Physics Physics Research Publications Purdue University Year Delta phi Delta eta correlations in central Au plus Au collisions at root S-NN = 200 GeV J. Adams, M. M. Aggarwal, Z. Ahammed, J. Amonett, B. D. Anderson, M. Anderson, D. Arkhipkin, G. S. Averichev, Y. Bai, J. Balewski, O. Barannikova, L. S. Barnby, J. Baudot, S. Bekele, V. V. Belaga, A. Bellingeri-Laurikainen, R. Bellwied, B. I. Bezverkhny, S. Bharadwaj, A. Bhasin, A. K. Bhati, H. Bichsel, J. Bielcik, J. Bielcikova, L. C. Bland, C. O. Blyth, S. L. Blyth, B. E. Bonner, M. Botje, J. Bouchet, A. V. Brandin, A. Bravar, M. Bystersky, R. V. Cadman, X. Z. Cai, H. Caines, Mcdb Sanchez, J. Castillo, O. Catu, D. Cebra, Z. Chajecki, P. Chaloupka, S. Chattopadhyay, H. F. Chen, J. H. Chen, Y. Chen, J. Cheng, M. Cherney, A. Chikanian, H. A. Choi, W. Christie, J. P. Coffin, T. M. Cormier, M. R. Cosentino, J. G. Cramer, H. J. Crawford, D. Das, S. Das, M. Daugherity, M. M. de Moura, T. G. Dedovich, M. DePhillips, A. A. Derevschikov, L. Didenko, T. Dietel, P. Djawotho, S. M. Dogra, W. J. Dong, X. Dong, J. E. Draper, F. Du, V. B. Dunin, J. C. Dunlop, M. R. D. Mazumdar, V. Eckardt, W. R. Edwards, L. G. Efimov, V. Emelianov, J. Engelage, G. Eppley, B. Erazmus, M. Estienne, P. Fachini, R. Fatemi, J. Fedorisin, K. Filimonov, P. Filip, E. Finch, V. Fine, Y. Fisyak, J. Fu, C. A. Gagliardi, L. Gaillard, J. Gans, M. S. Ganti, V. Ghazikhanian, P. Ghosh, J. E. Gonzalez, Y. G. Gorbunov, H. Gos, O. Grebenyuk, D. Grosnick, S. M. Guertin, Ksff Guimaraes, Y. Guo, N. Gupta, T. D. Gutierrez, B. Haag, T. J. Hallman, A. Hamed, J. W. Harris, W. He, M. Heinz, T. W. Henry, S. Hepplemann, B. Hippolyte, A. Hirsch, E. Hjort, G. W. Hoffmann, M. J. Horner, H. Z. Huang, S. L. Huang, E. W. Hughes, T. J. Humanic, G. Igo, P. Jacobs, W. W. Jacobs, P. Jakl, F. Jia, H. Jiang, P. G. Jones, E. G. Judd, S. Kabana, K. Kang, J. Kapitan, M. Kaplan, D. Keane, A. Kechechyan, V. Y. Khodyrev, B. C. Kim, J. Kiryluk, A. Kisiel, E. M. Kislov, S. R. Klein, D. D. Koetke, T. Kollegger, M. Kopytine, L. Kotchenda, V. Kouchpil, K. L. Kowalik, M. Kramer, P. Kravtsov, V. I. Kravtsov, K. Krueger, C. Kuhn, A. I. Kulikov, A. Kumar, A. A. Kuznetsov, M. A. C. Lamont, J. M. Landgraf, S. Lange, S. LaPointe, F. Laue, J. Lauret, A. Lebedev, R. Lednicky, C. H. Lee, S. Lehocka, M. J. LeVine, C. Li, Q. Li, Y. Li, G. Lin, S. J. Lindenbaum, M. A.
-
Upload
independent -
Category
Documents
-
view
1 -
download
0
Transcript of Delta phi Delta eta correlations in central Au plus Au collisions at root S-NN = 200 GeV

Physics
Physics Research Publications
Purdue University Year
Delta phi Delta eta correlations in
central Au plus Au collisions at root
S-NN = 200 GeVJ. Adams, M. M. Aggarwal, Z. Ahammed, J. Amonett, B. D. Anderson, M.Anderson, D. Arkhipkin, G. S. Averichev, Y. Bai, J. Balewski, O. Barannikova,L. S. Barnby, J. Baudot, S. Bekele, V. V. Belaga, A. Bellingeri-Laurikainen, R.Bellwied, B. I. Bezverkhny, S. Bharadwaj, A. Bhasin, A. K. Bhati, H. Bichsel,J. Bielcik, J. Bielcikova, L. C. Bland, C. O. Blyth, S. L. Blyth, B. E. Bonner, M.Botje, J. Bouchet, A. V. Brandin, A. Bravar, M. Bystersky, R. V. Cadman, X.Z. Cai, H. Caines, Mcdb Sanchez, J. Castillo, O. Catu, D. Cebra, Z. Chajecki, P.Chaloupka, S. Chattopadhyay, H. F. Chen, J. H. Chen, Y. Chen, J. Cheng, M.Cherney, A. Chikanian, H. A. Choi, W. Christie, J. P. Coffin, T. M. Cormier, M.R. Cosentino, J. G. Cramer, H. J. Crawford, D. Das, S. Das, M. Daugherity, M.M. de Moura, T. G. Dedovich, M. DePhillips, A. A. Derevschikov, L. Didenko,T. Dietel, P. Djawotho, S. M. Dogra, W. J. Dong, X. Dong, J. E. Draper,F. Du, V. B. Dunin, J. C. Dunlop, M. R. D. Mazumdar, V. Eckardt, W. R.Edwards, L. G. Efimov, V. Emelianov, J. Engelage, G. Eppley, B. Erazmus,M. Estienne, P. Fachini, R. Fatemi, J. Fedorisin, K. Filimonov, P. Filip, E.Finch, V. Fine, Y. Fisyak, J. Fu, C. A. Gagliardi, L. Gaillard, J. Gans, M. S.Ganti, V. Ghazikhanian, P. Ghosh, J. E. Gonzalez, Y. G. Gorbunov, H. Gos,O. Grebenyuk, D. Grosnick, S. M. Guertin, Ksff Guimaraes, Y. Guo, N. Gupta,T. D. Gutierrez, B. Haag, T. J. Hallman, A. Hamed, J. W. Harris, W. He,M. Heinz, T. W. Henry, S. Hepplemann, B. Hippolyte, A. Hirsch, E. Hjort, G.W. Hoffmann, M. J. Horner, H. Z. Huang, S. L. Huang, E. W. Hughes, T. J.Humanic, G. Igo, P. Jacobs, W. W. Jacobs, P. Jakl, F. Jia, H. Jiang, P. G.Jones, E. G. Judd, S. Kabana, K. Kang, J. Kapitan, M. Kaplan, D. Keane, A.Kechechyan, V. Y. Khodyrev, B. C. Kim, J. Kiryluk, A. Kisiel, E. M. Kislov, S.R. Klein, D. D. Koetke, T. Kollegger, M. Kopytine, L. Kotchenda, V. Kouchpil,K. L. Kowalik, M. Kramer, P. Kravtsov, V. I. Kravtsov, K. Krueger, C. Kuhn,A. I. Kulikov, A. Kumar, A. A. Kuznetsov, M. A. C. Lamont, J. M. Landgraf,S. Lange, S. LaPointe, F. Laue, J. Lauret, A. Lebedev, R. Lednicky, C. H. Lee,S. Lehocka, M. J. LeVine, C. Li, Q. Li, Y. Li, G. Lin, S. J. Lindenbaum, M. A.

Lisa, F. Liu, H. Liu, J. Liu, L. Liu, Z. Liu, T. Ljubicic, W. J. Llope, H. Long,R. S. Longacre, M. Lopez-Noriega, W. A. Love, Y. Lu, T. Ludlam, D. Lynn, G.L. Ma, J. G. Ma, Y. G. Ma, D. Magestro, D. P. Mahapatra, R. Majka, L. K.Mangotra, R. Manweiler, S. Margetis, C. Markert, L. Martin, H. S. Matis, Y.A. Matulenko, C. J. McClain, T. S. McShane, Y. Melnick, A. Meschanin, M. L.Miller, N. G. Minaev, S. Mioduszewski, C. Mironov, A. Mischke, D. K. Mishra,J. Mitchell, B. Mohanty, L. Molnar, C. F. Moore, D. A. Morozov, M. G. Munhoz,B. K. Nandi, C. Nattrass, T. K. Nayak, J. M. Nelson, P. K. Netrakanti, V. A.Nikitin, L. V. Nogach, S. B. Nurushev, G. Odyniec, A. Ogawa, V. Okorokov, M.Oldenburg, D. Olson, M. Pachr, S. K. Pal, Y. Panebratsev, S. Y. Panitkin, A. I.Pavlinov, T. Pawlak, T. Peitzmann, V. Perevoztchikov, C. Perkins, W. Peryt,V. A. Petrov, S. C. Phatak, R. Picha, M. Planinic, J. Pluta, N. Poljak, N. Porile,J. Porter, A. M. Poskanzer, M. Potekhin, E. Potrebenikova, Bvks Potukuchi, D.Prindle, C. Pruneau, J. Putschke, G. Rakness, R. Raniwala, S. Raniwala, R. L.Ray, S. V. Razin, J. Reinnarth, D. Relyea, F. Retiere, A. Ridiger, H. G. Ritter,J. B. Roberts, O. V. Rogachevskiy, J. L. Romero, A. Rose, C. Roy, L. Ruan,M. J. Russcher, R. Sahoo, I. Sakrejda, S. Salur, J. Sandweiss, M. Sarsour, P.S. Sazhin, J. Schambach, R. P. Scharenberg, N. Schmitz, K. Schweda, J. Seger,I. Selyuzhenkov, P. Seyboth, A. Shabetai, E. Shahaliev, M. Shao, M. Sharma,W. Q. Shen, S. S. Shimanskiy, E. Sichtermann, F. Simon, R. N. Singaraju,N. Smirnov, R. Snellings, G. Sood, P. Sorensen, J. Sowinski, J. Speltz, H. M.Spinka, B. Srivastava, A. Stadnik, T. D. S. Stanislaus, R. Stock, A. Stolpovsky,M. Strikhanov, B. Stringfellow, A. A. P. Suaide, E. Sugarbaker, M. Sumbera,Z. Sun, B. Surrow, M. Swanger, T. J. M. Symons, A. S. de Toledo, A. T. J.Takahashi, A. H. Tang, T. Tarnowsky, D. Thein, J. H. Thomas, A. R. Timmins,S. Timoshenko, M. Tokarev, S. Trentalange, R. E. Tribble, O. D. Tsai, J. Ulery,T. Ullrich, D. G. Underwood, G. Van Buren, N. van der Kolk, M. van Leeuwen,A. M. V. Molen, R. Varma, I. M. Vasilevski, A. N. Vasiliev, R. Vernet, S. E.Vigdor, Y. P. Viyogi, S. Vokal, S. A. Voloshin, W. T. Waggoner, F. Wang,G. Wang, J. S. Wang, X. L. Wang, Y. Wang, J. W. Watson, J. C. Webb, G.D. Westfall, A. Wetzler, C. Whitten, H. Wieman, S. W. Wissink, R. Witt, J.Wood, J. Wu, N. Xu, Q. H. Xu, Z. Xu, P. Yepes, I. K. Yoo, V. I. Yurevich, W.Zhan, H. Zhang, W. M. Zhang, Y. Zhang, Z. P. Zhang, Y. Zhao, C. Zhong, R.Zoulkarneev, Y. Zoulkarneeva, A. N. Zubarev, and J. X. Zuo
This paper is posted at Purdue e-Pubs.
http://docs.lib.purdue.edu/physics articles/767

PHYSICAL REVIEW C 75, 034901 (2007)
�φ�η correlations in central Au+Au collisions at√
sN N = 200 GeV
J. Adams,2 M. M. Aggarwal,29 Z. Ahammed,44 J. Amonett,19 B. D. Anderson,19 M. Anderson,6 D. Arkhipkin,12
G. S. Averichev,11 Y. Bai,27 J. Balewski,16 O. Barannikova,32 L. S. Barnby,2 J. Baudot,17 S. Bekele,28 V. V. Belaga,11
A. Bellingeri-Laurikainen,39 R. Bellwied,47 B. I. Bezverkhny,49 S. Bharadwaj,34 A. Bhasin,18 A. K. Bhati,29 H. Bichsel,46
J. Bielcik,49 J. Bielcikova,49 L. C. Bland,3 C. O. Blyth,2 S.-L. Blyth,21 B. E. Bonner,35 M. Botje,27 J. Bouchet,39
A. V. Brandin,25 A. Bravar,3 M. Bystersky,10 R. V. Cadman,1 X. Z. Cai,38 H. Caines,49 M. Calderon de la Barca Sanchez,6
J. Castillo,27 O. Catu,49 D. Cebra,6 Z. Chajecki,28 P. Chaloupka,10 S. Chattopadhyay,44 H. F. Chen,37 J. H. Chen,38 Y. Chen,7
J. Cheng,42 M. Cherney,9 A. Chikanian,49 H. A. Choi,33 W. Christie,3 J. P. Coffin,17 T. M. Cormier,47 M. R. Cosentino,36
J. G. Cramer,46 H. J. Crawford,5 D. Das,44 S. Das,44 M. Daugherity,41 M. M. de Moura,36 T. G. Dedovich,11 M. DePhillips,3
A. A. Derevschikov,31 L. Didenko,3 T. Dietel,13 P. Djawotho,16 S. M. Dogra,18 W. J. Dong,7 X. Dong,37 J. E. Draper,6 F. Du,49
V. B. Dunin,11 J. C. Dunlop,3 M. R. Dutta Mazumdar,44 V. Eckardt,23 W. R. Edwards,21 L. G. Efimov,11 V. Emelianov,25
J. Engelage,5 G. Eppley,35 B. Erazmus,39 M. Estienne,17 P. Fachini,3 R. Fatemi,22 J. Fedorisin,11 K. Filimonov,21 P. Filip,12
E. Finch,49 V. Fine,3 Y. Fisyak,3 J. Fu,48 C. A. Gagliardi,40 L. Gaillard,2 J. Gans,49 M. S. Ganti,44 V. Ghazikhanian,7 P. Ghosh,44
J. E. Gonzalez,7 Y. G. Gorbunov,9 H. Gos,45 O. Grebenyuk,27 D. Grosnick,43 S. M. Guertin,7 K. S. F. F. Guimaraes,36 Y. Guo,47
N. Gupta,18 T. D. Gutierrez,6 B. Haag,6 T. J. Hallman,3 A. Hamed,47 J. W. Harris,49 W. He,16 M. Heinz,49 T. W. Henry,40
S. Hepplemann,30 B. Hippolyte,17 A. Hirsch,32 E. Hjort,21 G. W. Hoffmann,41 M. J. Horner,21 H. Z. Huang,7 S. L. Huang,37
E. W. Hughes,4 T. J. Humanic,28 G. Igo,7 P. Jacobs,21 W. W. Jacobs,16 P. Jakl,10 F. Jia,20 H. Jiang,7 P. G. Jones,2 E. G. Judd,5
S. Kabana,39 K. Kang,42 J. Kapitan,10 M. Kaplan,8 D. Keane,19 A. Kechechyan,11 V. Yu. Khodyrev,31 B. C. Kim,33 J. Kiryluk,22
A. Kisiel,45 E. M. Kislov,11 S. R. Klein,21 D. D. Koetke,43 T. Kollegger,13 M. Kopytine,19 L. Kotchenda,25 V. Kouchpil,10
K. L. Kowalik,21 M. Kramer,26 P. Kravtsov,25 V. I. Kravtsov,31 K. Krueger,1 C. Kuhn,17 A. I. Kulikov,11 A. Kumar,29
A. A. Kuznetsov,11 M. A. C. Lamont,49 J. M. Landgraf,3 S. Lange,13 S. LaPointe,47 F. Laue,3 J. Lauret,3 A. Lebedev,3
R. Lednicky,12 C.-H. Lee,33 S. Lehocka,11 M. J. LeVine,3 C. Li,37 Q. Li,47 Y. Li,42 G. Lin,49 S. J. Lindenbaum,26 M. A. Lisa,28
F. Liu,48 H. Liu,37 J. Liu,35 L. Liu,48 Z. Liu,48 T. Ljubicic,3 W. J. Llope,35 H. Long,7 R. S. Longacre,3 M. Lopez-Noriega,28
W. A. Love,3 Y. Lu,48 T. Ludlam,3 D. Lynn,3 G. L. Ma,38 J. G. Ma,7 Y. G. Ma,38 D. Magestro,28 D. P. Mahapatra,14 R. Majka,49
L. K. Mangotra,18 R. Manweiler,43 S. Margetis,19 C. Markert,19 L. Martin,39 H. S. Matis,21 Yu. A. Matulenko,31 C. J. McClain,1
T. S. McShane,9 Yu. Melnick,31 A. Meschanin,31 M. L. Miller,22 N. G. Minaev,31 S. Mioduszewski,40 C. Mironov,19
A. Mischke,27 D. K. Mishra,14 J. Mitchell,35 B. Mohanty,44 L. Molnar,32 C. F. Moore,41 D. A. Morozov,31 M. G. Munhoz,36
B. K. Nandi,15 C. Nattrass,49 T. K. Nayak,44 J. M. Nelson,2 P. K. Netrakanti,44 V. A. Nikitin,12 L. V. Nogach,31
S. B. Nurushev,31 G. Odyniec,21 A. Ogawa,3 V. Okorokov,25 M. Oldenburg,21 D. Olson,21 M. Pachr,10 S. K. Pal,44
Y. Panebratsev,11 S. Y. Panitkin,3 A. I. Pavlinov,47 T. Pawlak,45 T. Peitzmann,27 V. Perevoztchikov,3 C. Perkins,5 W. Peryt,45
V. A. Petrov,47 S. C. Phatak,14 R. Picha,6 M. Planinic,50 J. Pluta,45 N. Poljak,50 N. Porile,32 J. Porter,46 A. M. Poskanzer,21
M. Potekhin,3 E. Potrebenikova,11 B. V. K. S. Potukuchi,18 D. Prindle,46 C. Pruneau,47 J. Putschke,21 G. Rakness,30
R. Raniwala,34 S. Raniwala,34 R. L. Ray,41 S. V. Razin,11 J. Reinnarth,39 D. Relyea,4 F. Retiere,21 A. Ridiger,25 H. G. Ritter,21
J. B. Roberts,35 O. V. Rogachevskiy,11 J. L. Romero,6 A. Rose,21 C. Roy,39 L. Ruan,21 M. J. Russcher,27 R. Sahoo,14
I. Sakrejda,21 S. Salur,49 J. Sandweiss,49 M. Sarsour,40 P. S. Sazhin,11 J. Schambach,41 R. P. Scharenberg,32 N. Schmitz,23
K. Schweda,21 J. Seger,9 I. Selyuzhenkov,47 P. Seyboth,23 A. Shabetai,21 E. Shahaliev,11 M. Shao,37 M. Sharma,29
W. Q. Shen,38 S. S. Shimanskiy,11 E. Sichtermann,21 F. Simon,22 R. N. Singaraju,44 N. Smirnov,49 R. Snellings,27 G. Sood,43
P. Sorensen,3 J. Sowinski,16 J. Speltz,17 H. M. Spinka,1 B. Srivastava,32 A. Stadnik,11 T. D. S. Stanislaus,43 R. Stock,13
A. Stolpovsky,47 M. Strikhanov,25 B. Stringfellow,32 A. A. P. Suaide,36 E. Sugarbaker,28 M. Sumbera,10 Z. Sun,20 B. Surrow,22
M. Swanger,9 T. J. M. Symons,21 A. Szanto de Toledo,36 A. Tai,7 J. Takahashi,36 A. H. Tang,3 T. Tarnowsky,32 D. Thein,7
J. H. Thomas,21 A. R. Timmins,2 S. Timoshenko,25 M. Tokarev,11 S. Trentalange,7 R. E. Tribble,40 O. D. Tsai,7 J. Ulery,32
T. Ullrich,3 D. G. Underwood,1 G. Van Buren,3 N. van der Kolk,27 M. van Leeuwen,21 A. M. Vander Molen,24 R. Varma,15
I. M. Vasilevski,12 A. N. Vasiliev,31 R. Vernet,17 S. E. Vigdor,16 Y. P. Viyogi,44 S. Vokal,11 S. A. Voloshin,47 W. T. Waggoner,9
F. Wang,32 G. Wang,19 J. S. Wang,20 X. L. Wang,37 Y. Wang,42 J. W. Watson,19 J. C. Webb,16 G. D. Westfall,24 A. Wetzler,21
C. Whitten Jr.,7 H. Wieman,21 S. W. Wissink,16 R. Witt,49 J. Wood,7 J. Wu,37 N. Xu,21 Q. H. Xu,21 Z. Xu,3 P. Yepes,35
I.-K. Yoo,33 V. I. Yurevich,11 W. Zhan,20 H. Zhang,3 W. M. Zhang,19 Y. Zhang,37 Z. P. Zhang,37 Y. Zhao,37 C. Zhong,38
R. Zoulkarneev,12 Y. Zoulkarneeva,12 A. N. Zubarev,11 and J. X. Zuo38
(STAR Collaboration)1Argonne National Laboratory, Argonne, Illinois 60439, USA
2University of Birmingham, Birmingham, United Kingdom3Brookhaven National Laboratory, Upton, New York 11973, USA
4California Institute of Technology, Pasadena, California 91125, USA5University of California, Berkeley, California 94720, USA
6University of California, Davis, California 95616, USA7University of California, Los Angeles, California 90095, USA
8Carnegie Mellon University, Pittsburgh, Pennsylvania 15213, USA9Creighton University, Omaha, Nebraska 68178, USA
0556-2813/2007/75(3)/034901(14) 034901-1 ©2007 The American Physical Society

J. ADAMS et al. PHYSICAL REVIEW C 75, 034901 (2007)
10Nuclear Physics Institute AS CR, 25068 Rez/Prague, Czech Republic11Laboratory for High Energy (JINR), Dubna, Russia12Particle Physics Laboratory (JINR), Dubna, Russia
13University of Frankfurt, Frankfurt, Germany14Institute of Physics, Bhubaneswar 751005, India
15Indian Institute of Technology, Mumbai, India16Indiana University, Bloomington, Indiana 47408, USA
17Institut de Recherches Subatomiques, Strasbourg, France18University of Jammu, Jammu 180001, India
19Kent State University, Kent, Ohio 44242, USA20Institute of Modern Physics, Lanzhou, People’s Republic of China
21Lawrence Berkeley National Laboratory, Berkeley, California 94720, USA22Massachusetts Institute of Technology, Cambridge, MA 02139, USA
23Max-Planck-Institut fur Physik, Munich, Germany24Michigan State University, East Lansing, Michigan 48824, USA
25Moscow Engineering Physics Institute, Moscow, Russia26City College of New York, New York City, New York 10031, USA27NIKHEF and Utrecht University, Amsterdam, The Netherlands
28Ohio State University, Columbus, Ohio 43210, USA29Panjab University, Chandigarh 160014, India
30Pennsylvania State University, University Park, Pennsylvania 16802, USA31Institute of High Energy Physics, Protvino, Russia
32Purdue University, West Lafayette, Indiana 47907, USA33Pusan National University, Pusan, Republic of Korea
34University of Rajasthan, Jaipur 302004, India35Rice University, Houston, Texas 77251, USA
36Universidade de Sao Paulo, Sao Paulo, Brazil37University of Science & Technology of China, Hefei 230026, People’s Republic of China
38Shanghai Institute of Applied Physics, Shanghai 201800, People’s Republic of China39SUBATECH, Nantes, France
40Texas A&M University, College Station, Texas 77843, USA41University of Texas, Austin, Texas 78712, USA
42Tsinghua University, Beijing 100084, People’s Republic of China43Valparaiso University, Valparaiso, Indiana 46383, USA
44Variable Energy Cyclotron Centre, Kolkata 700064, India45Warsaw University of Technology, Warsaw, Poland
46University of Washington, Seattle, Washington 98195, USA47Wayne State University, Detroit, Michigan 48201, USA
48Institute of Particle Physics, CCNU (HZNU), Wuhan 430079, People’s Republic of China49Yale University, New Haven, Connecticut 06520, USA
50University of Zagreb, Zagreb, HR-10002, Croatia(Received 6 July 2006; published 8 March 2007)
We report charged particle pair correlation analyses in the space of �φ (azimuth) and �η (pseudorapidity),for central Au+Au collisions at
√sNN = 200 GeV in the STAR detector. The analysis involves unlike-sign
charged pairs and like-sign charged pairs, which are transformed into charge-dependent (CD) signals and charge-independent (CI) signals. We present detailed parametrizations of the data. A model featuring dense gluonic hotspots as first proposed by Van Hove predicts that the observables under investigation would have sensitivity tosuch a substructure should it occur, and the model also motivates selection of transverse momenta in the range0.8 < pt < 2.0 GeV/c. Both CD and CI correlations of high statistical significance are observed, and possibleinterpretations are discussed.
DOI: 10.1103/PhysRevC.75.034901 PACS number(s): 25.75.Gz, 12.38.Mh, 12.38.Qk
I. INTRODUCTION
The search for a quark-gluon plasma (QGP) [1,2] hasbeen a high priority task at the BNL Relativistic HeavyIon Collider (RHIC) [3]. Central Au+Au collisions at RHIC
exceed [4] the initial energy density that is predicted by latticeQCD to be sufficient for production of QGP [5]. Van Hoveand others [6–8] have proposed that bubbles localized inphase space (dense gluon-dominated hot spots) could be the
034901-2

�φ�η CORRELATIONS IN CENTRAL Au+Au . . . PHYSICAL REVIEW C 75, 034901 (2007)
sources of the final state hadrons from a QGP. Such structureswould have smaller spatial dimensions than the region ofthe fireball viewed in this midrapidity experiment, and thecorrelations resulting from these smaller structures mightpersist in the final state of the collision. The bubble hypothesishas motivated this study, and the model described in Ref. [8]has led to our selection of transverse momenta in the range0.8 < pt < 2.0 GeV/c. The Hanbury-Brown and Twiss (HBT)results demonstrate that for
√sNN = 200 GeV, midrapidity
central Au+Au, when pt > 0.8 GeV/c, the average final statespace geometry for pairs close in momentum is approximatelydescribable by dimensions of around 2 fm [9]. This shouldlead to observable modification to the �η�φ correlation. Thepresent experimental analysis is model independent, and itprobes correlations that could have a range of explanations.
We present an analysis of charged particle pair correlationsin two dimensions—�φ and �η—based on 2 million centralAu+Au events observed in the STAR detector at
√sNN =
200 GeV [10].1 The analysis leads to a multiterm correla-tion function (Secs. III C and III E) which fits the �η-�φ
distribution well. It includes terms describing correlationsknown to be present: collective flow, resonance decays, andmomentum and charge conservation. Data cuts are applied tomake track-merging effects, HBT correlations, and Coulombeffects negligible. Instrumental effects resulting from detectorcharacteristics are accounted for in the correlation function.What remains are correlations whose origins are as yet unclear,and these are the main topic of this paper. We presenthigh statistical precision correlations which can provide aquantitative test of the bubble model [8] and other quantitativesubstructure models that may be developed. We also addresspossible jet phenomena. These precision data could stimulateother new physics ideas as possible explanations of theobserved correlations.
This paper is organized as follows. Section II describes thedata utilized and its analysis. Section III describes finding aparameter set that fits the data well. Section IV presents anddiscusses the charge-dependent (CD) and charge-independent(CI) signals. Section V presents and discusses net chargefluctuation suppression. Section VI discusses the systematicerrors. Section VII is a discussion section. Section VIIIcontains the summary and conclusions. Appendices provideexplanatory details.
II. DATA ANALYSIS
A. Data utilized
The data reported here comprise the full sample of STARevents taken at RHIC during the 2001 running period forcentral Au+Au collisions at
√sNN = 200 GeV. The data were
taken using a central trigger with the full STAR magnetic field(0.5 Tesla).
The central trigger requires a small signal, coincident intime, in each of two zero degree calorimeters, which arepositioned so as to intercept spectator neutrons, and it also
1�φ = φ1–φ2 and �η = η1–η2.
requires a large number of counters in the central trigger barrelto fire. Approximately 90% of the events are in the top 10%of the minimum bias multiplicity distribution, which is calledthe 0–10% centrality region. About 5% are in the 10–12%centrality region, with the remainder mostly in the 12–15%centrality region. To investigate the sensitivity of our analysesto the centrality of the data sample fitted, we compared fits ofthe entire data sample to fits of the data in the 5–10% centralityregion. Both sets of fits had consistent signals within errors.Thus, no significant sensitivity to the centrality was observedin the correlation data from the central triggers.
About half the data were taken with the magnetic fieldparallel to the beam axis direction (z) and the other half inthe reverse field direction in order to determine if directionalbiases are present. As discussed later in this section, our χ2
analyses demonstrated there was no evidence of any differencein the data samples from the two field directions, and thus noevidence for directional biases.
The track reconstruction for each field direction wasdone using the same reconstruction program. Tracks wererequired to have at least 23 hits in the time projectionchamber (TPC), which for STAR eliminates split tracks, andto have pseudorapidity η between −1 and 1. Each event wasrequired to have at least 100 primary tracks. These tracks areconsistent with the criteria that they are produced by a Au+Aubeam-beam interaction. This cut rarely removed events. Thesurviving events totaled 833 000 for the forward field and1.1 million for the reverse field. The transverse momentumselection 0.8 < pt < 2.0 GeV/c was then applied.
Based on the z (beam axis) position of the primary vertex,the events were sorted into ten 5 cm wide bins covering −25to +25 cm. The events for the same z bin, thus the sameacceptance, were then merged to produce 20 files, one foreach z bin for each sign of the magnetic field.
The files were analyzed in two-dimensional (2-D) his-tograms of the difference in η (�η), and the difference in φ
(�φ) for all the track pairs in each event. Each 2-D histogramhad 72 �φ bins (5◦) from −180◦ to 180◦ and 38 �η bins(0.1) from −1.9 to 1.9. The sign of the difference variable waschosen by labeling the positively charged track as the first ofthe pair for the unlike-sign charged pairs, and the larger pt trackas the first for the like-sign charged pairs. Our labeling of theorder of the tracks in a pair allows us to range over four �φ�η
quadrants and to investigate possible asymmetric systematicerrors due to space, magnetic field direction, behavior ofoppositely charged tracks, and systematic errors dependenton pt . Our consistently satisfactory results for our extensiveχ2 tests of these quadrants for fits to these precision datarevealed no evidence for such effects.
Then we compared the �φ�η data for the two fielddirections on a bin-by-bin basis. In the reverse field data, wereversed the track curvature due to the change in the fielddirection, and changed the sign of the z axis, thereby makingthe magnetic field be in the same direction as the positivez direction. This is done by reflecting along the z axis, andsimultaneously reflecting along the y axis. In the 2-D �φ�η
space, this transformation is equivalent to a reflection in �φ
and �η. For each pair, we changed the sign of its �φ and�η in the reverse field data. We then calculated a χ2 based
034901-3
J. ADAMS et al. PHYSICAL REVIEW C 75, 034901 (2007)
η ∆-1.5 -1-0.5 0 0.5 1
1.5 (deg)
φ ∆
-150-100
-500
50100
150
2
4
6
8
10
12
610×
(a)
Unlike-sign pairs
η ∆-1.5 -1-0.5 0 0.5 1
1.5 (deg)
φ ∆
-150-100
-500
50100
150
2
4
6
8
10
12
610×
(b)
Like-sign pairs
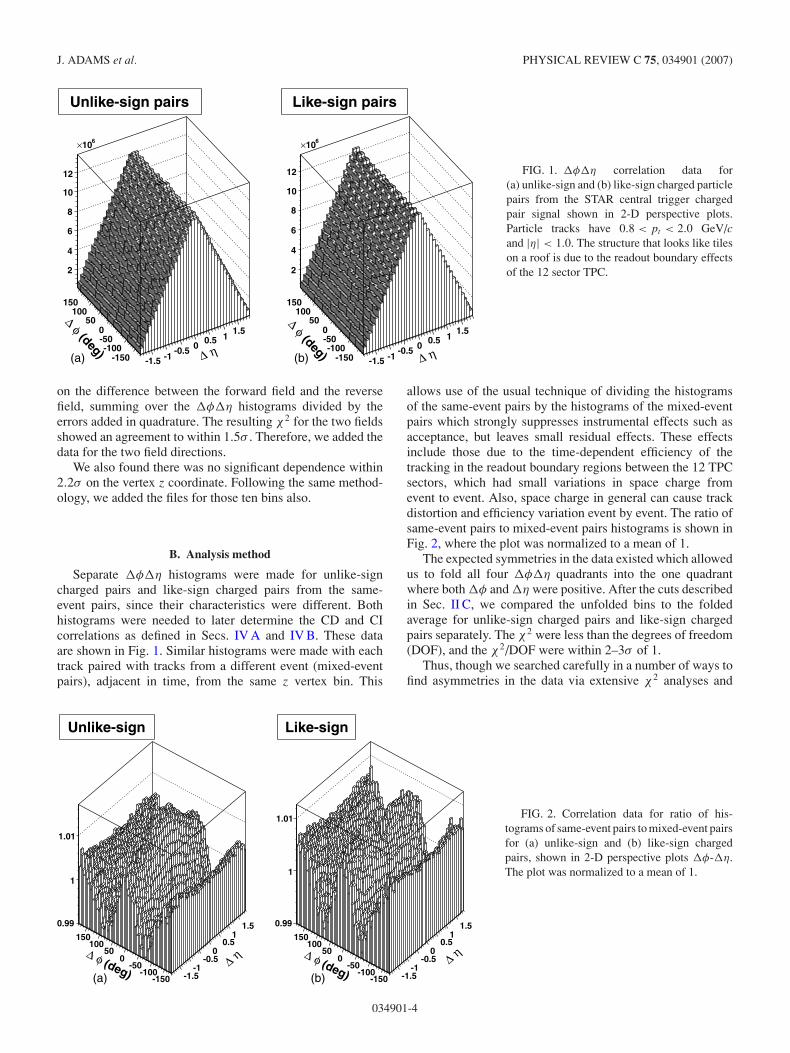
FIG. 1. �φ�η correlation data for(a) unlike-sign and (b) like-sign charged particlepairs from the STAR central trigger chargedpair signal shown in 2-D perspective plots.Particle tracks have 0.8 < pt < 2.0 GeV/cand |η| < 1.0. The structure that looks like tileson a roof is due to the readout boundary effectsof the 12 sector TPC.
on the difference between the forward field and the reversefield, summing over the �φ�η histograms divided by theerrors added in quadrature. The resulting χ2 for the two fieldsshowed an agreement to within 1.5σ . Therefore, we added thedata for the two field directions.
We also found there was no significant dependence within2.2σ on the vertex z coordinate. Following the same method-ology, we added the files for those ten bins also.
B. Analysis method
Separate �φ�η histograms were made for unlike-signcharged pairs and like-sign charged pairs from the same-event pairs, since their characteristics were different. Bothhistograms were needed to later determine the CD and CIcorrelations as defined in Secs. IV A and IV B. These dataare shown in Fig. 1. Similar histograms were made with eachtrack paired with tracks from a different event (mixed-eventpairs), adjacent in time, from the same z vertex bin. This
allows use of the usual technique of dividing the histogramsof the same-event pairs by the histograms of the mixed-eventpairs which strongly suppresses instrumental effects such asacceptance, but leaves small residual effects. These effectsinclude those due to the time-dependent efficiency of thetracking in the readout boundary regions between the 12 TPCsectors, which had small variations in space charge fromevent to event. Also, space charge in general can cause trackdistortion and efficiency variation event by event. The ratio ofsame-event pairs to mixed-event pairs histograms is shown inFig. 2, where the plot was normalized to a mean of 1.
The expected symmetries in the data existed which allowedus to fold all four �φ�η quadrants into the one quadrantwhere both �φ and �η were positive. After the cuts describedin Sec. II C, we compared the unfolded bins to the foldedaverage for unlike-sign charged pairs and like-sign chargedpairs separately. The χ2 were less than the degrees of freedom(DOF), and the χ2/DOF were within 2–3σ of 1.
Thus, though we searched carefully in a number of ways tofind asymmetries in the data via extensive χ2 analyses and
η ∆-1.5
-1-0.5
00.5
11.5
(deg)φ ∆
-150-100
-500
50100
150
0.99
1
1.01
(a)
Unlike-sign
η ∆-1.5
-1-0.5
00.5
11.5
(deg)φ ∆
-150-100
-500
50100
150
0.99
1
1.01
(b)
Like-sign
FIG. 2. Correlation data for ratio of his-tograms of same-event pairs to mixed-event pairsfor (a) unlike-sign and (b) like-sign chargedpairs, shown in 2-D perspective plots �φ-�η.The plot was normalized to a mean of 1.
034901-4

�φ�η CORRELATIONS IN CENTRAL Au+Au . . . PHYSICAL REVIEW C 75, 034901 (2007)
η ∆
0
0.5
1
1.5 (deg)
φ ∆
0
50
100
150
0.99
1
1.01
(a)
Unlike-sign
η ∆
0
0.5
1
1.5 (deg)
φ ∆
0
50
100
150
0.99
1
1.01
(b)
Like-sign
FIG. 3. Folded correlation data for(a) unlike-sign and (b) like-sign chargedpairs on �φ and �η based on demonstratedsymmetries in the data. This increases thestatistics in a typical bin by a factor of 4.Henceforth, we will be dealing with folded dataonly.
observation of fit behavior, none of any significance werefound. By folding four quadrants into one, we quadrupled thestatistics in each bin analyzed. Figure 3 shows this folded dataafter cuts were made (see Sec. II C) to make track-merging,Coulomb, and HBT effects negligible. Henceforth, the foldedand cut data will be used for our fits.
C. Cuts
At small �φ and small �η (i.e., small space angles), track-merging effects occur. To determine the cuts needed to reducethese effects to a negligible level, we varied small �φ andsmall �η cuts. Simultaneously, the χ2 of an approximate fit tothe data using Eqs. (3), (4), and (5) was studied as a functionof the bins included in the fit. With larger cuts, the χ2 behavedproperly until one or more of the cut-out bins were included inthe fit. This caused a huge increase in χ2, revealing that thosebins were distorted by merging effects. We confirmed by visualinspection that track-merging effects clearly became importantin the cut-out bins. The track merging caused a substantialreduction in track recognition efficiency and supported thequantitative results of our χ2 analysis. The sharp sensitivityof the χ2 to the cuts showed how localized the merging losseswere. We adopted these cuts, and they are included in thefolded data analyzed
For the unlike-sign charged pairs, we cut out the datafrom the regions 0.0 < �η < 0.1 when 0◦ < �φ < 20◦, and0.1 < �η < 0.2 when 0◦ < �φ < 10◦. These cuts to maketrack-merging effects negligible also made the Coulomb effectnegligible, since it is effective within a �p of 30 MeV/c. Thiscorresponds to a 2◦ opening angle at pt of 0.8 GeV/c. The 2◦along the beam axis near 90◦ corresponds to a �η of 0.035.
For the like-sign charged pairs, we cut out the data from theregion 0.0 < �η < 0.2 when 0◦ < �φ < 5◦. The HBT effectis already small because of track merging within a �p of50 MeV/c, corresponding to a 4◦ opening angle at 0.8 GeV/c.The 4◦ along the beam corresponds to a �η of 0.07. All thecuts described above were also applied to the mixed events.Thus, the final track-merging cuts selected reduce the tracking
problems due to overlap and merging to negligible levels; theyalso reduce Coulomb and HBT effects to negligible levels.
The fits to the subsequently shown data were made overthe whole �φ range. The data for |�η| > 1.5 were cut out,since the statistics were low (see Fig. 1) and tracking efficiencyvaries at higher |�η|.
III. PARAMETRIZATION OF DATA
We want to obtain a set of functions that will fit the data welland are interpretable, to the greatest extent practicable. Weutilized parametrizations representing known, expectedphysics, or attributable to instrumentation effects. Any re-maining terms required to obtain good fits to the data wereconsidered as signals of new physical effects. Thus signal≡ data – (known and expected) effects. The three knowneffects—elliptic flow, residual instrumental effects, and mo-mentum and charge conservation terms—were parametrized.We then found parameters for the signal terms necessary toachieve a good fit to our high statistical precision data.
In the following, we discuss the relative importance of theeffects which are determined by χ2 in our final overall fit toEqs. (3)–(5).
A. Elliptic flow
Elliptic flow is a significant contributor to two-particlecorrelations in heavy ion collisions, and it must be accountedfor in our analysis. Elliptic flow is not a significant contributorto two-particle correlations in pp collisions. The ellipticflow for STAR Au+Au data has been investigated in anextensive series of measurements and analyses [11] usingfour-particle cumulant methods and two-particle correlations.This determines a range of amplitudes (v2) for cos(2 �φ) termsbetween the four-particle cumulant that is the lower flow rangeboundary of v2(v2 = 0.035) and the average value of the four-and two-particle cumulant that is the upper range boundaryof v2(v2 = 0.047). These results were determined for the
034901-5

J. ADAMS et al. PHYSICAL REVIEW C 75, 034901 (2007)
pt range 0.8–2 GeV/c by weighting the central triggerspectrum as a function of multiplicity and centrality comparedwith the minimum bias trigger data for which the v2 wasmeasured.
The constraint is used in the following way. We find ourbest fit to the data by allowing the parameters in the fit tovary freely until the χ2 is minimized. However, there is inthe case of the v2 parameter the constraint that it must lie inthe flow range cited above. Since our best fit was consistentwith the bottom of the flow range, it was not affected by thisconstraint. The value of v2 cannot be varied to lower valuesbecause of the constraint, and thus our best fit corresponds tothe lower boundary of the flow range and had a v2 of 0.035.However, v2 can be varied to higher values until either wereach the upper boundary or the fit worsens by 1σ, which is aχ2 change of 32. As discussed in Sec. VI, our fit worsens by1σ when v2 is increased to 0.042, well within the flow range0.035–0.047. This represents a systematic error due to flowand is the dominant error (see Sec. VI). Appendix A gives adetailed description of multiparameter fitting and error rangedeterminations.
B. Instrumental effects
In addition to the tracking losses resulting from overlappingtracks in the TPC, which we handled by cuts, there aretracks lost in the boundary areas of the TPC between the12 sectors. These regions result in a loss of acceptance inthe φ measurements since the particle tracks cannot be readout by electronics. This produces a φ dependence with aperiod of 30◦ which is greatly reduced from about a 4%amplitude to about 0.02% (reduction by a factor of 200),by the normalization to mixed-event pairs. However, it isnot completely eliminated, since STAR still has small time-dependent variations from event to event, such as space chargeeffects and slight differences in detector and beam behavior.To correct for the residual readout �φ dependence, a termwith a 30◦ period to represent the TPC boundary periodicityand a first harmonic term with a 60◦ period were used. Theunlike-sign and like-sign charged pairs behave differently overthe TPC boundary regions in φ, because positive tracks arerotated in one direction and negative tracks are rotated in theopposite direction. This requires that the sector terms have anindependent phase associated with each. In Tables I and II,the terms are labeled “sector” and “sector2,” “phase” and“phase2.” The functional form for these sector effects is
Sectors (�φ) = S sin(12�φ − ϕ) + S2 sin(6�φ − ϕ2). (1)
There is a φ-independent effect which we attribute to lossesin the larger η tracking in the TPC. We utilized mixed-eventpairs with a similar z vertex to take into account these losses.Imperfections in this procedure leave a small bump near �η =1.15 to be represented in the fit by the terms labeled “�η bumpamp” and “�η bump width” in the tables. The width of thisbump should be independent of the charge of the tracks, so weconstrained it to be the same for like- and unlike-sign chargedpairs to improve the fit stability. Thus , the functional form forthis instrumental effect is
Etabump (�η) = Ee−(�η−1.15)2/2σ 2E . (2)
TABLE I. Unlike-sign charged pair fit parametersfor Eqs. (3) and (4). The table has three sections: Topsection lists parameter names, values, and errors for theapproximate Gaussian signal fit (lump). Fourth(f ) isthe additional term in the exponent. The source of theabove is Sec. III E. The upper error is the change in eachparameter when one increases the elliptic flow until thefit is 1σ worse. The lower error is determined by varyingeach parameter at the lower range of the elliptic flowwhile all the other parameters are free to readjust untilthe fit loses 1σ in significance. Middle section has thenormalization and a small background term followed bysix momentum and charge conservation terms. Source isSec. III C. Bottom section has instrumental terms. Fourterms due to TPC sector gaps and two due to largeη tracking errors. Source is Sec. III B. Uncertaintiesare dominantly systematic, assessed as described inAppendix A.
Parameter Value
Lump amplitude (Au) 0.02426−0.00498+0.00048
Lump �φ width (σ�φ) 32.68−2.12+0.79
Lump �η width (σ�η) 1.058−0.137+0.065
Fourth (f ) 0.100+0.031−0.028
Constant (B00) 0.99497+0.00142−0.00021
�η2 (B02) 0.00078∓0.00018cos �φ (B10) −0.00710+0.00230
−0.00035
�η cos �φ (B11) 0.00092∓0.00078�η2 cos �φ (B12) −0.00049 ∓ 0.00057
cos 3�φ (B30) 0.00058+0.00028−0.00020
�η cos 3�φ (B31) 0.00030±0.00062�η2 cos 3�φ (B32) −0.00014 ∓
0.00044
Sector (S) 0.00016±0.00006Phase (ϕ) 8.6±2.1Sector 2 (S2) 0.00006±0.00007Phase 2 (ϕ2) 23.0±10.0�η bump amp (E) 0.00030∓0.00025�η bump width (σE) 0.189 (fixed)
χ 2/DOF 572/517
In our final 3σ fits for the combined like- and unlike-signcharged pairs (see Tables I and II), leaving out the instrumentalcorrections would cause our 3σ fit to deteriorate to a 16σ fit,which is unacceptable. It should be noted that standard χ2
analyses are often not considered credible if the fit exceeds2–3σ statistical significance.
C. Correlations associated with momentum andcharge conservation
It is important to ensure that momentum and chargeconservation correlation requirements are satisfied. For ran-dom emission of single particles with transverse momentumconservation globally imposed, a negative cos(�φ) term alone
034901-6

�φ�η CORRELATIONS IN CENTRAL Au+Au . . . PHYSICAL REVIEW C 75, 034901 (2007)
TABLE II. Same as Table I, but for like-sign chargedpairs. Top section lists parameter names, values, anderrors for the primary Gaussian signal fit (lump). Thisis followed by a much smaller Gaussian (dip). The restis as described for Table II.
Parameter Value
Lump amplitude (Al) 0.01823−0.00482+0.00069
Lump �φ width (σ�φl) 32.02−2.91+1.02
Lump �η width (σ�ηl) 1.847−0.315+0.220
Dip amplitude (Ad ) −0.00451−0.00092+0.00090
Dip �φ width (σ�φd ) 14.23−2.64+2.91
Dip �η width (σ�ηd ) 0.228+0.050−0.041
Constant (B00) 0.99581+0.00136−0.00019
�η2 (B02) 0.00100∓.00017cos �φ (B10) −0.00737−0.00221
−0.00040
�η cos �φ (B11) 0.00075+0.00072−0.00073
�η2 cos �φ (B12) −0.00015−0.00054+0.00055
cos 3�φ (B30) 0.00070+0.00033−0.00020
�η cos 3�φ (B31) −0.00027−0.00064+0.00065
�η2 cos 3�φ (B32) 0.00026+0.00044−0.00045
Sector (S) 0.00021±0.00006Phase (ϕ) 22.6∓1.5Sector2 (S2) 0.00007±0.00007Phase2 (ϕ2) 32.8∓7.0
�ηbump amp (E) 0.00022+0.00024−0.00022
�ηbump width (σE) 0.189 (fixed)
χ 2/DOF 588 / 519
can represent this effect. However, the complex correlationsthat occur at RHIC result in multiple uncorrelated sourceswhich are presently not understood. It was not possible to fitour data with the cos(�φ) term alone. This fit was rejectedby 100σ . This was not surprising since random emission ofsingle particles with momentum conservation would not leadto the particle correlations observed at RHIC. Therefore, wesuspected that a more complete description of the momentumand charge conservation was required. No one has succeededin solving this complex problem in closed form even in thetheoretical case where you observe all particles. Hence, areasonable approach was to try to solve it for the tracks weare observing in order to obtain a good fit. We used Fourierexpansion in the two variables we have, namely, �φ and �η.
Assuming that the cos(�φ) term for random single-particleemission was the first term in a Fourier expansion of oddterms, a second term cos(3�φ) was added and found toaccount for about 95% of the 100σ rejection. Based on theresidual analysis, we concluded the remaining 5% required�η-dependent terms for its removal. Therefore, we multipliedterms of the type cos(�φ) and cos(3�φ) by a �η-dependentpolynomial expansion cutting off at �η2. This essentiallyremoved the remaining 5% rejection.
Some of the �η-dependent terms make quite small contri-butions in the fits, but in the aggregate they improve our overall
fit by about 4σ . Thus, a good fit of 3σ is downgraded to anunacceptable one of 7σ without the �η-dependent expansion,since they add. One should note that fits exceeding 3σ areoften not considered credible by experienced practitioners ofprecision data analysis, and a precision data analysis was aprime objective of this paper. In addition, we found that weneeded an overall �η2-dependent fit parameter.
Summing the terms we have in Secs. III A–III C, we obtain
Bk = (Known + Expected)Effects
= B00 + B02�η2 + B10 cos �φ + B11�η cos �φ
+B12�η2 cos �φ + 2v22 cos(2�φ) + B30 cos(3�φ)
+B31�η cos(3�φ) + B32�η2 cos(3�φ)
+ Sectors (�φ) + Etabump (�η) (3)
D. Fitting with Bk
We used the well-known result [12] that for a large numberof degrees of freedom (DOF), where the number of parametersis a small fraction of DOF and the statistics are high, theχ2 distribution is normally distributed about the DOF. Thesignificance of the fit decreases by 1σ whenever the χ2 increaseis equal to
√2(DOF), which for our 517–519 DOF is equal
to 32. Appendix A gives further details.If we fit the functional form of Bk [Eq. (3)] to both the
unlike- and like-sign charged pairs, i.e., the whole data set, χ2
is about 10 400 for about 1045 DOF.The standard deviation on 1045 DOF is about 46, so the
fit is rejected by around 200σ . We used many free parameters(15) in Eq. (3), yet additional unknown terms appear to beso sharply varying that it is clearly impossible for the Bkfunctional form to fit the data. A more detailed discussionof the statistical methods used in the data analyses and thetreatment of systematic and other errors in this paper is givenin Appendix A.
E. Signal terms
Many signal terms in physics are Gaussian-like. Wetherefore tried fitting the signal data using 2-D Gaussiansor approximate Gaussians. The unlike-sign charged paircorrelations were well fit (2σ ) by adding to Bk an additional2-D approximate Gaussian in �η and �φ [Fig. 4(a)] given by
Unlike − sign Signal = Aue−(�φ2/2σ 2
φ +�η2/2σ 2η −f �η4). (4)
Considering the enormous improvement in fit qualityafforded by the addition of this signal term, we concludethat this function in Eq. (4) provides a compact analyticdescription of the signal component of the unlike-sign chargedpair correlation data. The fit was improved by the addition ofa term dependent on �η4 in the exponent (called “fourth” inTable I). The fit for the unlike-sign charged pair signal data isshown in Fig. 4(a). The unlike-sign charged pair signal datacorresponding to the fit (unlike-sign charged pair data minusBk) is shown in Fig. 4(b).
The like-sign charged pair data, which also could not be fitby Bk alone, were well described (2σ ) when we added [see
034901-7

J. ADAMS et al. PHYSICAL REVIEW C 75, 034901 (2007)
η ∆
00.2
0.40.6
0.81
1.21.4
(deg)
φ ∆
0
50
100
150
0
0.01
0.02
(a)
Unlike-sign signal fit
η ∆
00.2
0.40.6
0.81
1.21.4
(deg)
φ ∆
0
50
100
150
0
0.01
0.02
(b)
Signal Unlike-sign
FIG. 4. (Color online) (a) 2-D approxi-mately Gaussian signal shape of Eq. (4) fromthe fit to the normalized and folded unlike-signcharged pair signal data. (b) Unlike-sign chargedpair signal data corresponding to the adjoiningsignal function in (a).
Fig. 3(b)] a positive 2-D Gaussian and a small negative 2-DGaussian dip given by
Like − sign Signal = Ale−(�φ2/2σ 2
φl+�η2/2σ 2ηl )
+Ade−(�φ2/2σ 2
φd+�η2/2σ 2ηd ). (5)
Therefore, we conclude that Eq. (5) provides an efficientdescription of the signal component of the like-sign chargedpair data. The large signal referred to in Table II as “lump”in the like-sign charged pair correlation is a 2-D Gaussiancentered at the origin. It is accompanied by a small narrower2-D Gaussian “dip” (also centered at the origin) subtractedfrom it. The terms are labeled in the fits as lump amplitude,dip amplitude, lump �φ width, lump �η width, dip �φ width,and dip �η width. Note that the volume of the dip is about1.6% of the volume of the large lump signal. However, if weneglect to include this small dip, our fit deteriorates by 28σ .This dip might be caused by suppression of like-sign chargedparticle pair emission from localized neutral sources such as
gluons. The function fit to the like-sign charged pair signal datais shown in Fig. 5(a). The like-sign charged pair signal data(like-sign charged pair data minus Bk) is shown in Fig. 5(b).The uncertainties quoted throughout this paper correspond toa change in χ2 of �χ2 = 32, rather than the more commonlyused �χ2 = 1 (see Appendix A for more details).
F. Summary of parametrizations
Equations (3) + (4) yield a 2σ fit for the unlike-sign chargedpair correlation, and thus is an appropriate and sufficientparameter set.
Equations (3) + (5) yield a 2σ fit for the like-sign chargedpair correlation, and thus is an appropriate and sufficientparameter set.
Equations (3) + (4) + (5) yield a 3σ fit for the entire data set,unlike-sign charged pair correlation + like-sign charged paircorrelation, and thus is an appropriate and sufficient parameterset for the entire data set.
η ∆
00.2
0.40.6
0.81
1.21.4
(deg)
φ ∆
0
50
100
150
0
0.01
(a)
Like-sign signal fit
η ∆
00.2
0.40.6
0.81
1.21.4
(deg)
φ ∆
0
50
100
150
0
0.01
(b)
Like-sign signal
FIG. 5. (Color online) (a) Perspective plotof fit to 2-D like-sign charged pair signal shapeof Eq. (5). (b) Like-sign charged pair signal datacorresponding to the adjacent signal fit in (a).
034901-8

�φ�η CORRELATIONS IN CENTRAL Au+Au . . . PHYSICAL REVIEW C 75, 034901 (2007)
η ∆
00.2
0.40.6
0.81
1.21.4
(deg)
φ ∆
0
50
100
150
0
0.01
(a)
CD (Difference) signal fit
η ∆
00.2
0.40.6
0.81
1.21.4
(deg)
φ ∆
0
50
100
150
0
0.01
(b)
CD (Difference) signal
FIG. 6. (Color online) (a) CD signal shapeis a 2-D approximate Gaussian which is sym-metrical. Average Gaussian width is 27.5◦ ±3.2◦ (0.48 ± 0.056 rad) both in �φ and �η.Thus we are observing a greater probability forunlike-sign charged pairs of particles than forlike-sign charged pairs emitted randomly on 2-Dηφ directions. (b) CD signal data correspondingto the adjacent signal fit in (a).
The complex multidimensional χ2 surface makes χ2
increase nonlinearly with the number of error ranges (1σ )given in Tables I and II. Therefore, in order to determine thesignificance of a parameter or group of parameters, one mustfit without them and determine by how many σ the fit hasworsened. Then, one uses the normal distribution curve todetermine the significance of the omitted parameter(s). Theresults of such an investigation were
(i) Leave out cos(3�φ) and the fit worsens by 95σ .(ii) Leave out dip and the fit worsens by 28σ .
(iii) Leave out sector terms and the fit worsens by 11.7σ .(iv) Leave out η-dependent cos(�φ) and cos(3�φ) terms
and the fit worsens by 4.3σ .(v) Leave out η bump terms and the fit worsens by 1.54σ .
(vi) Leave out sector 2 and the fit worsens by 1.41σ .
Since our global fit with all the above terms is at the 3σ
level, we conclude that the above terms are necessary. The hugenumber of σ we get for some of the parameters are only to betaken as a qualitative indication of the need for the parametersto fit our high precision data. Because of the uncertainties indetermining the number of σ far out on the tails of the normaldistribution (i.e., > 10σ ), a quantitative interpretation of themcannot be made.
IV. CD AND CI SIGNALS
A. Charge-dependent (CD) signal
If we subtract the entire like-sign charged pair correla-tion [Eq. (5)] from the unlike-sign charged pair correlation[Eq. (4)], we obtain the CD correlation. However, it is observedthat the backgrounds (Bk) of the two terms are close enoughin value to cancel each other in the subtraction. Thus the CDsignal is essentially the same as the entire CD correlation. In theextensive study of the balance function [13] for the correlationdue to unlike-sign charged pairs which are emitted from thesame space and time region, it is argued that the emissioncorrelation of these pairs can be approximately estimated fromthe balance function. The balance function for these charged
pairs is proportional to the unlike-sign charged pairs minusthe like-sign charged pairs. Therefore, the CD signal whichis approximately equal to the CD correlation is a qualitativemeasure of the emission correlation of unlike-sign chargedpairs emitted from the same space and time region. In additionto the approximations involved in the balance function, thereis the modification to the CD signal discussed in Sec. IV D.
Figure 6(a) shows the fit to the CD signal; Fig. 6(b) showsthe CD signal data that were fit. The signal form is a simpleGaussian in both �φ and �η. The Gaussian width in �φ
is 28.3◦ ± 3.4◦ (0.49 ± 0.059 rad), and the Gaussian �η
width is 0.485 ± 0.054. Converting this pseudorapidity toa θ angle yields a width of 26.7◦ ± 3.0◦ (0.47 ± 0.052 rad).This correlation has the same angular range in �η and �φ.Therefore, we observe pairs of oppositely charged particlesemitted randomly in the η and φ direction with a correlationwhich has an average Gaussian width of about 27.5◦ ± 3.2◦(0.48 ± 0.056 rad) in the θ angle corresponding to �η andalso in the azimuth �φ.
B. Charge-independent (CI) signal
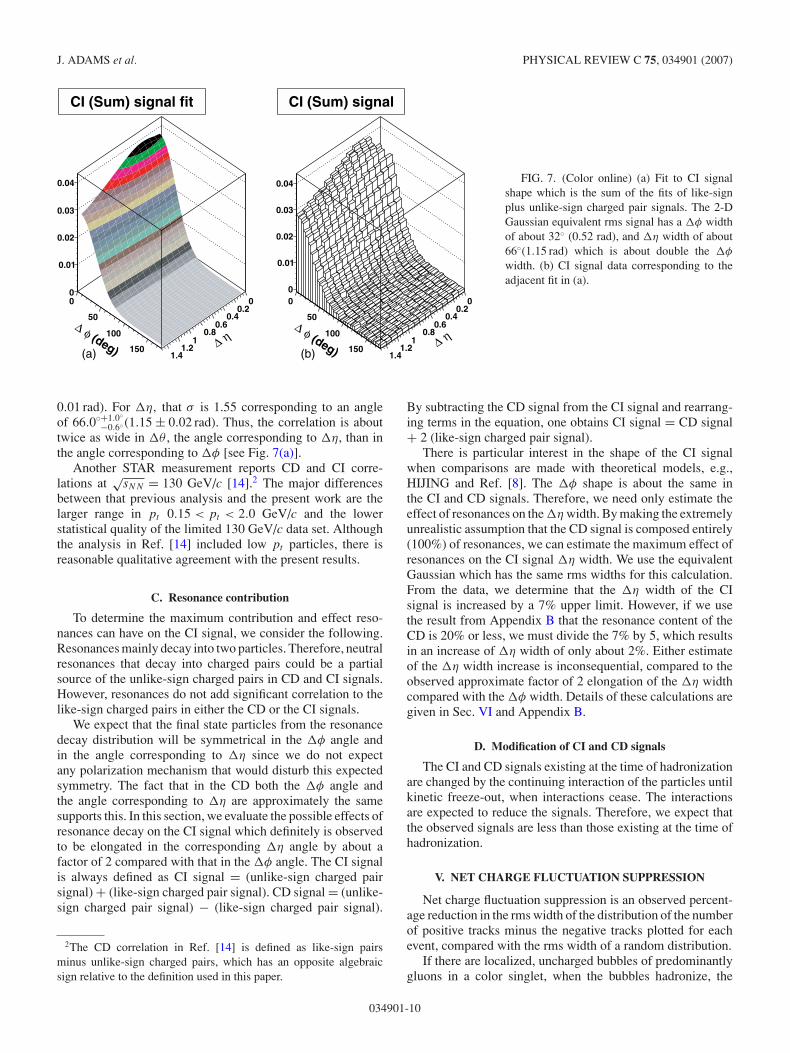
If we add the like-sign charged pair signal to theunlike-sign charged pair signal, we obtain the CI signal.The CI signal fit shown in Fig. 7(a) displays the averagestructure of the correlated emitting sources. Figure 7(b) showsthe CI signal data that were fit by the analytic distributionshown in Fig. 7(a).
To obtain a good fit to the shape, both in �η and �φ,we needed a more complicated form than one simple 2-DGaussian. The CI signal actually contains an approximateGaussian from the unlike-sign charged pair signal plus twoGaussians from the like-sign charged pair signal.
We want to obtain a measure of the effective �φ and�η widths of the overall pattern of the CI signal. A goodmethod for doing this is to compare the CI signal with asingle Gaussian which yields the same rms values as theactual good fit described above involving two Gaussians and anapproximate Gaussian. For �φ, that σ is 32.0◦ ± 0.6◦(0.56 ±
034901-9
J. ADAMS et al. PHYSICAL REVIEW C 75, 034901 (2007)
η ∆
00.2
0.40.6
0.81
1.21.4
(deg)
φ ∆
0
50
100
150
0
0.01
0.02
0.03
0.04
(a)
CI (Sum) signal fit
η ∆
00.2
0.40.6
0.81
1.21.4
(deg)
φ ∆
0
50
100
150
0
0.01
0.02
0.03
0.04
(b)
CI (Sum) signal
FIG. 7. (Color online) (a) Fit to CI signalshape which is the sum of the fits of like-signplus unlike-sign charged pair signals. The 2-DGaussian equivalent rms signal has a �φ widthof about 32◦ (0.52 rad), and �η width of about66◦(1.15 rad) which is about double the �φ
width. (b) CI signal data corresponding to theadjacent fit in (a).
0.01 rad). For �η, that σ is 1.55 corresponding to an angleof 66.0◦+1.0◦
−0.6◦ (1.15 ± 0.02 rad). Thus, the correlation is abouttwice as wide in �θ , the angle corresponding to �η, than inthe angle corresponding to �φ [see Fig. 7(a)].
Another STAR measurement reports CD and CI corre-lations at
√sNN = 130 GeV/c [14].2 The major differences
between that previous analysis and the present work are thelarger range in pt 0.15 < pt < 2.0 GeV/c and the lowerstatistical quality of the limited 130 GeV/c data set. Althoughthe analysis in Ref. [14] included low pt particles, there isreasonable qualitative agreement with the present results.
C. Resonance contribution
To determine the maximum contribution and effect reso-nances can have on the CI signal, we consider the following.Resonances mainly decay into two particles. Therefore, neutralresonances that decay into charged pairs could be a partialsource of the unlike-sign charged pairs in CD and CI signals.However, resonances do not add significant correlation to thelike-sign charged pairs in either the CD or the CI signals.
We expect that the final state particles from the resonancedecay distribution will be symmetrical in the �φ angle andin the angle corresponding to �η since we do not expectany polarization mechanism that would disturb this expectedsymmetry. The fact that in the CD both the �φ angle andthe angle corresponding to �η are approximately the samesupports this. In this section, we evaluate the possible effects ofresonance decay on the CI signal which definitely is observedto be elongated in the corresponding �η angle by about afactor of 2 compared with that in the �φ angle. The CI signalis always defined as CI signal = (unlike-sign charged pairsignal) + (like-sign charged pair signal). CD signal = (unlike-sign charged pair signal) − (like-sign charged pair signal).
2The CD correlation in Ref. [14] is defined as like-sign pairsminus unlike-sign charged pairs, which has an opposite algebraicsign relative to the definition used in this paper.
By subtracting the CD signal from the CI signal and rearrang-ing terms in the equation, one obtains CI signal = CD signal+ 2 (like-sign charged pair signal).
There is particular interest in the shape of the CI signalwhen comparisons are made with theoretical models, e.g.,HIJING and Ref. [8]. The �φ shape is about the same inthe CI and CD signals. Therefore, we need only estimate theeffect of resonances on the �η width. By making the extremelyunrealistic assumption that the CD signal is composed entirely(100%) of resonances, we can estimate the maximum effect ofresonances on the CI signal �η width. We use the equivalentGaussian which has the same rms widths for this calculation.From the data, we determine that the �η width of the CIsignal is increased by a 7% upper limit. However, if we usethe result from Appendix B that the resonance content of theCD is 20% or less, we must divide the 7% by 5, which resultsin an increase of �η width of only about 2%. Either estimateof the �η width increase is inconsequential, compared to theobserved approximate factor of 2 elongation of the �η widthcompared with the �φ width. Details of these calculations aregiven in Sec. VI and Appendix B.
D. Modification of CI and CD signals
The CI and CD signals existing at the time of hadronizationare changed by the continuing interaction of the particles untilkinetic freeze-out, when interactions cease. The interactionsare expected to reduce the signals. Therefore, we expect thatthe observed signals are less than those existing at the time ofhadronization.
V. NET CHARGE FLUCTUATION SUPPRESSION
Net charge fluctuation suppression is an observed percent-age reduction in the rms width of the distribution of the numberof positive tracks minus the negative tracks plotted for eachevent, compared with the rms width of a random distribution.
If there are localized, uncharged bubbles of predominantlygluons in a color singlet, when the bubbles hadronize, the
034901-10

�φ�η CORRELATIONS IN CENTRAL Au+Au . . . PHYSICAL REVIEW C 75, 034901 (2007)
total charge coming from the bubbles is very close to zero.Therefore, if we are detecting an appreciable sample of suchbubbles, we expect to see net charge fluctuation suppression.
It should be noted that net charge fluctuation suppressioncan be deduced from the CD correlation given previously. Netcharge fluctuation suppression previously analyzed at lowermomenta has been found consistent with resonance decay [15].However, the present analysis has different characteristics.Furthermore, Ref. [8] has made specific estimates of netcharge fluctuation suppression applicable to this experiment.We performed a charge difference analysis for tracks withincuts of 0.8 < pt < 2.0 GeV/c and |η| < 0.75. This wouldallow a comparison with Ref. [8].
For each event, we determined the difference of the positivetracks minus the negative tracks in our cuts. There was a netmean positive charge of 4.68 ± 0.009. The width of the chargedifference distribution given by rms was 11.149 ± 0.017. Todetermine the net charge fluctuation suppression, we need tocompare this width with the width of the appropriate randomdistribution, which would have no net charge fluctuationsuppression. However, we must arrange a slight bias towarda positive charge so that we end up with the same net meanpositive charge as observed. If we now assign a random chargeto each track with a slight bias toward being positive such thatthe mean net charge is also 4.68 ± 0.009, the width (rms)becomes 11.865 ± 0.017. The percentage difference in thewidths, which measures the net charge fluctuation suppression,is 6.0% ± 0.2%.
VI. SYSTEMATIC ERRORS
Systematic errors were minimized using cuts and correc-tions. The cuts (see Sec. II C) were large enough to make thecontributions from track merging, Coulomb, and HBT effectsnegligible.
Systematic checks utilized χ2 analyses which verified thatthe experimental results did not depend on the magnetic fielddirection, the vertex z coordinate, or the folding procedures(see Secs. II A and II B). By cutting the track η at 1.0, we keepthe systematic errors of the track angles below about 1◦ [16].
In Sec. IV C, we referred to a simulation in Ref. [8], whichestimated that the background resonance contribution to theCD correlation cannot be more than 20% (see Appendix B).From the resonance calculations discussed in Appendix B,the background resonance contribution to the unlike-signcharged pair correlation would be reduced to 5%. The detailsthat justify this are the following. Our analyses measuredan average of 19 unlike-sign charged signal pairs per eventfrom the CD correlation signal. The total average number ofunlike-sign charged signal pairs is 88. Therefore, with theextreme assumption that all of the CD correlation signal is dueto background resonances, 21.6% of the unlike-sign chargedsignal pairs are due to resonances. However, as discussed inAppendix B, the estimated contribution of resonances to theCD correlation is 20% or less. Therefore, 21.6%/5 = 4.3% isthe resonance content of the unlike-sign charged signal pairs,which we rounded to 5%.
We also concluded via an upper limit calculation with theabove extremely unrealistic assumption that the shape of theCI signal could only have the measured width in �η increasedby about 7%. This is inconsequential compared to the factorof 2 increase in �η width compared with �φ width. For thesimulation discussed above, in which resonance backgroundscontribute 20% to the CD correlation, the increase in the CIcorrelation �η width would be limited to about 2%.
The CI and CD signals are more physically significant thanthe unlike- and like-sign charged pair signals, since they arephysically interpretable. The CI signal fit displays the averagestructure of the correlated emitting sources (Sec. IV B).The analysis suggests that the CD signal (Sec. IV A) is aqualitative representation of the emission correlation of theunlike-sign charged pairs emitted from the same space and timeregion. Elliptic flow contributions to the like- and unlike-signcharged pair signals are approximately equal and thereforecancel in the CD signal. Thus, the CD signal is not affected byuncertainty in the elliptic flow amplitude.
In Fig. 8(a) we show the CI signal data with the lower flowrange value of mean elliptic flow amplitude (weighted over thept range of the data) used in the fit, namely, v2 = 0.035. This
η ∆
00.20.40.60.811.21.4
(deg)
φ ∆0
50
100
150
0
0.01
0.02
0.03
0.04
(a)
CI (Sum) signal - best V2
η ∆
00.20.40.60.811.21.4
(deg)
φ ∆0
50
100
150
0
0.01
0.02
0.03
0.04
(b)
CI (Sum) signal - V2 up one sigma
FIG. 8. (a) CI signal data with the lower rangeof elliptic flow amplitude and the best χ 2 [sameas Fig. 7(b)] plotted as a 2-D perspective plot on�φ vs �η. (b) CI signal data with the maximumelliptic flow amplitude used in our analysis(χ 2 was worse by 1σ ).
034901-11

J. ADAMS et al. PHYSICAL REVIEW C 75, 034901 (2007)
is our best fit, in which the value of v2 is consistent with thelower flow range. Thus, Fig. 8(a) is the same as Fig. 7(b). InFig. 8(b), we show the CI signal data with our maximumamount of elliptic flow allowed. This value of elliptic flowcauses our fit to be 1σ worse and corresponds to a χ2 increaseof 32. This results in a mean weighted v2 = 0.042. Thisvalue of elliptic flow lies in the determined flow range, butis smaller than the upper limit of 0.047 [11]. The upper errorranges in Tables I and II are determined by the effect of thischange in the elliptic flow (0.042 > v2 > 0.035), since it isthe dominant error that results in these range values. The mainchange in Fig. 8(b) compared to Fig. 8(a) is that the peakamplitude is reduced by 25%, and the 2-D area is reducedby 34%. However, the most significant CI signal parametersin comparing to theoretical models are those that measurethe shape, namely, the ratio of rms �φ and �η widths, of aGaussian equivalent to the fit. For our best fit, �φ width =32.0◦ ± 0.6◦ (0.56 ± 0.01 rad), and �η width = 1.55, whichis equivalent to 66.0◦+1.0◦
−0.6◦ (1.15 ± 0.02 rad). The ratio �η
equivalent angle/�φ = 2.06. For the case of the maximumelliptic flow value, the determined widths were �φ = 30.1◦(0.53 rad), and �η = 1.375 (61.6◦or 1.08 rad). The ratio�η/�φ = 2.05. Thus, the important shape ratio has changedby about 1%.
Let us now address the errors due to contamination byincluding secondary particles arising from weak decays andthe interaction of antiprotons and other particles in thebeampipe and material near the beampipe. These secondaryparticle backgrounds have been estimated to be about 10–15%[17]. In this analysis, we are concerned mainly with the anglesof the secondary particles relative to the primaries that surviveour high pt cut, not their identity or exact momentum magni-tude. Our correlations almost entirely depend on angular mea-surements of �φ and �η. In the range 0.8 < pt < 2.0 GeV/c,we have considered the behavior of weakly decaying particlesand other nonprimary particles that could satisfy our distanceof closest approach to the primary vertex and pt cuts. Becausehigh pt secondary particles are focused in the same direction asthe primaries, only a fraction of these particles have sufficientchange in angle that would cause an appreciable error in ourcorrelation. Hence, our estimate is a systematic error of about4% due to secondary particles.
Next we summarize our extensive discussion of systematicerrors. Track-merging errors, Coulomb, and HBT effectswere made negligible by cutting out effected bins at smallspace angles. Instrumental errors were corrected for in theparametrization. Elliptic flow error is our dominant systematicerror, because of the uncertainty that exists in the ellipticflow analyses [11]. It should be noted that the size of theupper error range of our parameter errors in Tables I and IIare determined by the maximum value of the elliptic flowwe allowed (v2 = 0.042), which corresponds to a χ2 changeof 32 (1σ ). The sizable change to the CI signal shown inFig. 8(b) compared with that in Fig. 8(a) is due to thismaximum allowed value of elliptic flow. As shown above, theshape ratio of the CI signal, which is important for theoreticalcomparison, is changed, fortunately, by only about 1%. Whenmore accurate elliptic flow results become available, it willbe a simple matter to insert these in the fits and reduce the
resultant error. The next smaller systematic error is due topossible background resonance errors. The smallest systematicerror is due to secondary contamination. As discussed above,none of these errors significantly affect our important physicalconclusions.
VII. DISCUSSION
Highly significant correlations are observed for unlike-signand like-sign charged pairs, and consequently for charge-dependent and charge-independent signals. The CD signal iswell described (with a 1σ fit) by a symmetrical 2-D Gaussianwith a rms width of about 30◦ in both �φ and �η. Conservativesimulations in Ref. [8] indicate that the contribution to thisCD signal from background resonance decay is less than 20%.Simulations (see Appendix B) estimate that the only significantchange due to the background resonances is an increase in theCD amplitude of 20% or less. The CI signal is more complexand is the sum of the unlike-sign charged pair signal andthe like-sign charged pair signal fits. Therefore, it containsan approximate Gaussian from the unlike-sign charged pairsignal, and a large positive Gaussian plus a small negativeGaussian (dip) from the like-sign charged pair signal. Thedip contains only 1.6% of the like-sign charged signal volume.This small dip, observed for the first time, has high significancein the fit. This feature is consistent with what one wouldexpect for suppression of like-sign charged pair emission froma localized neutral source such as gluons.
A 2-D Gaussian which yields the same rms widths as ouroverall CI signal has a σ along the �φ direction of 32.0◦ ± 0.6◦(0.56 ± 0.01 rad). However, the �η σ is 1.55 correspondingto an angle of approximately 66◦(1.15 rad) and thus is twiceas wide.
The mean charge difference for tracks within the chosenanalysis cuts is 4.68 ± 0.009 net positive charges, and the rmsvariation of this quantity from event to event is 11.149 ± 0.017.A random charge assignment constrained to produce the samemean net charge has a larger width of 11.865 ± 0.017. Thedifference, 6.0% ± 0.2%, measures the net charge fluctuationsuppression.
The HIJING model produces jets in our pt range whichare nearly symmetrical in �φ and the angle corresponding to�η [18]. The proper way to compare our data with HIJING isto compare our CI signal with the above-mentioned HIJINGCI correlation from jets. As shown in Sec. IV B, our CI signalis highly asymmetric because the angle corresponding to �η
is about twice the angle �φ, thus it strongly contradicts thesebasic characteristics of HIJING jet correlations.
A detailed comparison of the STAR data presented herewith a model based on a ring of localized bubbles emittingcharged particles from the central fireball surface at kineticfreeze-out reported a good consistency between the STARdata and the model [19].
VIII. SUMMARY AND CONCLUSIONS
We performed an experimental investigation of particle-paircorrelations in �φ and �η using the main time projection
034901-12

�φ�η CORRELATIONS IN CENTRAL Au+Au . . . PHYSICAL REVIEW C 75, 034901 (2007)
chamber of the STAR detector at RHIC. We investigatedcentral Au+Au collisions at
√sNN = 200 GeV, selecting
tracks having transverse momenta 0.8 < pt < 2.0 GeV/c andthe central pseudorapidity region |η| < 1.0. The data sampleconsists of 2 million events, and the symmetries of the data in�η and �φ allow four quadrants to be folded into one. Theentire data set (unlike-sign charged pairs and like-sign chargedpairs) was fit by a reasonably interpretable set of parameters,17 for the unlike-sign charged pairs and 19 for the like-signcharged pairs. These parameters are small in number comparedwith the total number of degrees of freedom, which was over500 for each of the two types of pairs. Every fit reportedhere using these parameters was a good fit of 2 to 3 σ orless.
From our analysis of the systematic errors, we conclude thatthe important features of our data and the conclusions drawnhave not been significantly affected by the systematic errors.
This paper serves as an excellent vehicle for makingdetailed comparisons with and testing of various theoreticalmodels such as the bubble model [8] and other relevantmodels.
ACKNOWLEDGMENTS
We thank the RHIC Operations Group and RCF at BNL,and the NERSC Center at LBNL for their support. This workwas supported in part by the Offices of NP and HEP withinthe U.S. DOE Office of Science; the U.S. NSF; the BMBF ofGermany; IN2P3, RA, RPL, and EMN of France; EPSRC ofthe United Kingdom; FAPESP of Brazil; the Russian Ministryof Science and Technology; the Ministry of Education and theNNSFC of China; IRP and GA of the Czech Republic; FOMof the Netherlands; DAE, DST, and CSIR of the Governmentof India; Swiss NSF; the Polish State Committee for ScientificResearch; SRDA of Slovakia; and the Korea Science andEngineering Foundation.
APPENDIX A: MULTIPARAMETER FITTING IN THELARGE DOF REGION AND SYSTEMATIC
UNCERTAINTIES
Let us now consider the details of multiparameter dataanalysis in the large DOF region in terms of change of χ2
for our 517–519 n for unlike-sign and like-sign charged pairs.A 1σ change in the significance of the individual fits requirethe change in χ2 of 32. The reader is referred to Ref. [12] fromwhich we quote: “For large n(DOF), the χ2 p.d.f.(probabilitydensity function) approaches a Gaussian with mean = n andvariance (σ ) squared = 2n.” For n > 50–100, this result hasbeen considered applicable, and it remains applicable andbecomes more accurate as n increases toward infinity. Thus,for our 517–519 n, 1σ = √
2n = 32.The statistical significance of any fit in this paper can be
obtained by the following procedure. The number of σ of fit =(χ2 − n)/32. The number of σ refer to the normal distributioncurve.
For large DOF(bins-parameters) fluctuations occur becauseof the many bins. When one fits the parameters, one will try
to describe some of these fluctuations. Therefore, we need tocheck whether the fluctuations in the data sample are largeenough to significantly distort the parameter values. This hastraditionally been done by using the confidence level tables vsχ2 which allows a reasonable determination of the fluctuationsdue to binning. The approximation (described above) we haveused is an accurate extension of the confidence level tables.
Let us consider our method of assigning systematic errorranges to the parameters. Our objective is to obtain errorranges that are not likely to be exceeded if future independentdata samples taken under similar conditions are obtained byrepetition of the experiment by STAR or others. We want toavoid the confusion and uncertainty of apparent significantdifferences in parameters when the fit to new data doesnot differ significantly from a previous fit. We allow eachparameter, one at a time, to be varied (increased and thendecreased) in both directions while all the other parameters arefree to readjust until the overall fit χ2 degrades in significanceby 1σ . This corresponds to an increase of χ2 of 32 for theunlike-sign and like-sign charged pair fits. The χ2 surface hasbeen observed, and χ2 increases very nonlinearly with smallincreases of the parameter beyond the error range.
When one assumes that the parameter error is given by a χ2
change of 1 in the best fit [20], this is correct for the case whereyou know the underlying physics. The purpose of our use ofparameters is not to determine their true values, since we donot know the underlying physics. We use the parameters todetermine an analytic description of the data that fits the datawithin 2–3σ .
Let us address how one determines the significance of aparameter or a particular group of parameters in the case ofthis multiparameter analysis. It is entirely incorrect to comparethe error ranges in Tables I and II with the parameter value. Theonly correct way to determine the significance of a parameteror group of parameters in the multiparameter fit is to leavethe parameters out of the fit and refit without them. Onethen determines by how many σ the overall fit has degradedcompared with a change of 32 for 1σ .
One should note that the upper error range on a parameter inTables I and II represents the change in value of the parameteras we increase v2, our dominant error, from our best fituntil the fit worsens by 1σ (χ2 increases by 32). The otherparameters are free to readjust during the foregoing variation.The lower error range is the result of changing the parameterin the opposite direction of it in the upper range while theother parameters are free to readjust until the fit decreases insignificance by 1σ . The largest error that dominates the uppersystematic error range determination is the variation of the v2
error. However, the constraint of v2 to the flow range, and thefact that our best fit is at the lower end of the range, meansthat flow is not varied when we determine the lower error.Therefore, the elimination of the large flow variation leads togenerally smaller lower error ranges and thus the observedasymmetry between the upper and lower error ranges.
Finally if one fixes any one of the parameters at the end ofthe error ranges with the correct v2 assigned (0.042 upper and0.035 lower) and lets all the other parameters readjust, one willachieve an overall fit which is only worse by 1σ (a χ2 increaseof 32).
034901-13

J. ADAMS et al. PHYSICAL REVIEW C 75, 034901 (2007)
APPENDIX B: RESONANCE CALCULATIONS
In this section, we discuss background resonances havingthe following meaning. Background resonances are resonancesthat only contribute to the unlike-sign charged pair correlation.Any resonance that is emitted as part of a correlated emitterwill also have a like-sign charge correlation. This is becauseany of the charges will have another particle of the same chargewith which to correlate that is also emitted by the correlatedemitter. The background resonances we are discussing are notpart of the correlated emitters we want to study, but will addto the CD correlation.
In Ref. [8], a table of resonances and particles wasconsidered in a thermal resonance gas model. The resonancecontent was adjusted to cause the 20% net charge fluctuationsuppression observed at lower momentum in a STAR experi-ment for central Au+Au collisions. The result of this modelcalculation is a 20% contribution of resonances to the CDcorrelation. The pt range of the analysis 0.8 < pt < 2.0 GeV/c
tends to have the symmetric pairs of particles from resonanceproduction decay into angles within the range of our cuts.However, asymmetric decays only contribute one particle ofthe pair and thus do not add to the correlation. Therefore,effectively, only a part of the estimated resonance contributionaffects the correlation measurement. Our simulations revealthat the only significant change that the background resonancecontribution would introduce into the CD correlation is anincrease in amplitude of 20% or less. The CI signal =CD signal + 2(like-sign charged pair signal). The resonancecontribution to the like-sign charged pair signal is small. Theaffect of resonances on the CI signal elongation in the �η widthis estimated by the model simulation to be a factor of 5 lowerthan the extreme maximum case previously assumed, namely,that the entire CD correlation is composed of backgroundresonances. Thus, this would result in a �η width elongationof the CI signal of approximately 2% instead of the upper limitof 7%.
[1] J. Adams et al. (STAR Collaboration), Nucl. Phys. A757, 102(2005).
[2] For an overview, see Quark Matter Formation and Heavy IonCollisions, Proceedings Biefield Workshop (May 82), QuarkMatter 2004, J. Phys. G 30, s633 (2004).
[3] Special Issue: The Relativistic Heavy Ion Collider Project RHICand Its Detectors, Nucl. Instrum. Methods A 499, 235 (2003).
[4] J. Adams et al. (STAR Collaboration), Phys. Rev. C 70, 054907(2004).
[5] F. Karsch, Nucl. Phys. A698, 199c (2002).[6] L. Van Hove, Hadronization Quark-Gluon Plasma in Ultra-
Relativistic Collisions, CERN-TH (1984) 3924; L. Van Hove,Z. Phys. C 27, 135 (1985).
[7] S. J. Lindenbaum and R. S. Longacre, J. Phys. G 26, 937 (2000).This paper contains earlier (1985 onward) references by theseauthors.
[8] S. J. Lindenbaum, R. S. Longacre, and M. Kramer, Eur. Phys.J. C 30, 241 (2003).
[9] J. Adams et al. (STAR Collaboration), Phys. Rev. C 71, 044906(2005); S. S. Adler et al. (PHENIX Collaboration), Phys. Rev.Lett. 93, 152302 (2004).
[10] C. Adler et al., Nucl. Instrum. Meth. A 499, 433 (2003); K. H.Ackermann et al., ibid. 499, 624 (2003); M. Anderson et al.,ibid. 499, 659 (2003); F. S. Bieser et al., ibid. 499, 766 (2003).
[11] K. H. Ackerman et al. (STAR Collaboration), Phys. Rev. Lett.86, 402 (2001); C. Adler et al. (STAR Collaboration), ibid. 90,032301 (2003); J. Adams et al. (STAR Collaboration), Phys.Rev. C 72, 014904 (2005).
[12] S. Eidelman et al., Phys. Lett. B592, 1 (2004), see p. 278.[13] S. A. Bass, P. Danielewicz, and S. Pratt, Phys. Rev. Lett.
85, 2689 (2000); S. Cheng, S. Petriconi, S. Pratt, M. Skoby,C. Gale, S. Jeon, V. T. Pop, and Q. H. Zhang, Phys. Rev. C 69,54906 (2004); P. Christakoglou, A. Petridis, and M. Vassiliou,Nucl. Phys. A749, 279c (2005).
[14] J. Adams et al. (STAR Collaboration), Phys. Rev. C 73, 064907(2006); Phys. Lett. B634, 347 (2006).
[15] J. Adams et al. (STAR Collaboration), Phys. Rev. C 68, 044905(2003).
[16] C. Adler et al. (STAR Collaboration), Phys. Rev. Lett. 90,082302 (2003).
[17] C. Adler et al. (STAR Collaboration), Phys. Rev. Lett. 87,112303 (2001); J. Adams et al. (STAR Collaboration), ibid.92, 112301 (2004).
[18] X. N. Wang and M. Gyulassy, Phys. Rev. D 44, 3501(1991).
[19] S. J. Lindenbaum and R. S. Longacre, Eur. Phys. J. C. 49, 767(2007).
[20] S. Eidelman et al., Phys. Lett. B592, 1 (2004), see p. 279.
034901-14