Measurements of Dihadron Correlations Relative to the Event Plane in Au+Au Collisions at...
50
arXiv:1010.0690v2 [nucl-ex] 16 May 2013 Measurements of Dihadron Correlations Relative to the Event Plane in Au+Au Collisions at √ s NN = 200 GeV H. Agakishiev, 17 M. M. Aggarwal, 29 Z. Ahammed, 21 A. V. Alakhverdyants, 17 I. Alekseev , 15 J. Alford, 18 B. D. Anderson, 18 C. D. Anson, 27 D. Arkhipkin, 2 G. S. Averichev, 17 J. Balewski, 22 D. R. Beavis, 2 N. K. Behera, 13 R. Bellwied, 49 M. J. Betancourt, 22 R. R. Betts, 7 A. Bhasin, 16 A. K. Bhati, 29 H. Bichsel, 48 J. Bielcik, 9 J. Bielcikova, 10 B. Biritz, 5 L. C. Bland, 2 W. Borowski, 40 J. Bouchet, 18 E. Braidot, 26 A. V. Brandin, 25 A. Bridgeman, 1 S. G. Brovko, 4 E. Bruna, 51 S. Bueltmann, 28 I. Bunzarov, 17 T. P. Burton, 2 X. Z. Cai, 39 H. Caines, 51 M. Calder´ on de la Barca S´ anchez, 4 D. Cebra, 4 R. Cendejas, 5 M. C. Cervantes, 41 Z. Chajecki, 27 P. Chaloupka, 10 S. Chattopadhyay, 46 H. F. Chen, 37 J. H. Chen, 39 J. Y. Chen, 50 L. Chen, 50 J. Cheng, 43 M. Cherney, 8 A. Chikanian, 51 K. E. Choi, 33 W. Christie, 2 P. Chung, 10 M. J. M. Codrington, 41 R. Corliss, 22 J. G. Cramer, 48 H. J. Crawford, 3 S. Dash, 12 A. Davila Leyva, 42 L. C. De Silva, 49 R. R. Debbe, 2 T. G. Dedovich, 17 A. A. Derevschikov, 31 R. Derradi de Souza, 6 L. Didenko, 2 P. Djawotho, 41 S. M. Dogra, 16 X. Dong, 21 J. L. Drachenberg, 41 J. E. Draper, 4 J. C. Dunlop, 2 L. G. Efimov, 17 M. Elnimr, 49 J. Engelage, 3 G. Eppley, 35 M. Estienne, 40 L. Eun, 30 O. Evdokimov, 7 R. Fatemi, 19 J. Fedorisin, 17 A. Feng, 50 R. G. Fersch, 19 P. Filip, 17 E. Finch, 51 V. Fine, 2 Y. Fisyak, 2 C. A. Gagliardi, 41 D. R. Gangadharan, 5 A. Geromitsos, 40 F. Geurts, 35 P. Ghosh, 46 Y. N. Gorbunov, 8 A. Gordon, 2 O. Grebenyuk, 21 D. Grosnick, 45 S. M. Guertin, 5 A. Gupta, 16 W. Guryn, 2 B. Haag, 4 O. Hajkova, 9 A. Hamed, 41 L-X. Han, 39 J. W. Harris, 51 J. P. Hays-Wehle, 22 M. Heinz, 51 S. Heppelmann, 30 A. Hirsch, 32 E. Hjort, 21 G. W. Hoffmann, 42 D. J. Hofman, 7 B. Huang, 37 H. Z. Huang, 5 T. J. Humanic, 27 L. Huo, 41 G. Igo, 5 P. Jacobs, 21 W. W. Jacobs, 14 C. Jena, 12 F. Jin, 39 J. Joseph, 18 E. G. Judd, 3 S. Kabana, 40 K. Kang, 43 J. Kapitan, 10 K. Kauder, 7 H. Ke, 50 D. Keane, 18 A. Kechechyan, 17 D. Kettler, 48 D. P. Kikola, 21 J. Kiryluk, 21 A. Kisiel, 47 V. Kizka, 17 A. G. Knospe, 51 D. D. Koetke, 45 T. Kollegger, 11 J. Konzer, 32 I. Koralt, 28 L. Koroleva, 15 W. Korsch, 19 L. Kotchenda, 25 V. Kouchpil, 10 P. Kravtsov, 25 K. Krueger, 1 M. Krus, 9 L. Kumar, 18 P. Kurnadi, 5 M. A. C. Lamont, 2 J. M. Landgraf, 2 S. LaPointe, 49 J. Lauret, 2 A. Lebedev, 2 R. Lednicky, 17 J. H. Lee, 2 W. Leight, 22 M. J. LeVine, 2 C. Li, 37 L. Li, 42 N. Li, 50 W. Li, 39 X. Li, 32 X. Li, 38 Y. Li, 43 Z. M. Li, 50 M. A. Lisa, 27 F. Liu, 50 H. Liu, 4 J. Liu, 35 T. Ljubicic, 2 W. J. Llope, 35 R. S. Longacre, 2 W. A. Love, 2 Y. Lu, 37 E. V. Lukashov, 25 X. Luo, 37 G. L. Ma, 39 Y. G. Ma, 39 D. P. Mahapatra, 12 R. Majka, 51 O. I. Mall, 4 L. K. Mangotra, 16 R. Manweiler, 45 S. Margetis, 18 C. Markert, 42 H. Masui, 21 H. S. Matis, 21 Yu. A. Matulenko, 31 D. McDonald, 35 T. S. McShane, 8 A. Meschanin, 31 R. Milner, 22 N. G. Minaev, 31 S. Mioduszewski, 41 A. Mischke, 26 M. K. Mitrovski, 11 B. Mohanty, 46 M. M. Mondal, 46 B. Morozov, 15 D. A. Morozov, 31 M. G. Munhoz, 36 M. Naglis, 21 B. K. Nandi, 13 T. K. Nayak, 46 P. K. Netrakanti, 32 L. V. Nogach, 31 S. B. Nurushev, 31 G. Odyniec, 21 A. Ogawa, 2 Oh, 33 Ohlson, 51 V. Okorokov, 25 E. W. Oldag, 42 D. Olson, 21 M. Pachr, 9 B. S. Page, 14 S. K. Pal, 46 Y. Pandit, 18 Y. Panebratsev, 17 T. Pawlak, 47 H. Pei, 7 T. Peitzmann, 26 C. Perkins, 3 W. Peryt, 47 S. C. Phatak, 12 P. Pile, 2 M. Planinic, 52 M. A. Ploskon, 21 J. Pluta, 47 D. Plyku, 28 N. Poljak, 52 A. M. Poskanzer, 21 B. V. K. S. Potukuchi, 16 C. B. Powell, 21 D. Prindle, 48 C. Pruneau, 49 N. K. Pruthi, 29 P. R. Pujahari, 13 J. Putschke, 51 H. Qiu, 20 R. Raniwala, 34 S. Raniwala, 34 R. L. Ray, 42 R. Redwine, 22 R. Reed, 4 H. G. Ritter, 21 J. B. Roberts, 35 O. V. Rogachevskiy, 17 J. L. Romero, 4 A. Rose, 21 L. Ruan, 2 J. Rusnak, 10 N. R. Sahoo, 46 S. Sakai, 21 I. Sakrejda, 21 T. Sakuma, 22 S. Salur, 4 J. Sandweiss, 51 E. Sangaline, 4 A. Sarkar, 13 J. Schambach, 42 R. P. Scharenberg, 32 A. M. Schmah, 21 T. R. Schuster, 11 J. Seele, 22 J. Seger, 8 I. Selyuzhenkov, 14 P. Seyboth, 23 E. Shahaliev, 17 M. Shao, 37 M. Sharma, 49 S. S. Shi, 50 Q. Y. Shou, 39 E. P. Sichtermann, 21 F. Simon, 23 R. N. Singaraju, 46 M. J. Skoby, 32 N. Smirnov, 51 H. M. Spinka, 1 B. Srivastava, 32 T. D. S. Stanislaus, 45 D. Staszak, 5 S. G. Steadman, 22 J. R. Stevens, 14 R. Stock, 11 M. Strikhanov, 25 B. Stringfellow, 32 A. A. P. Suaide, 36 M. C. Suarez, 7 N. L. Subba, 18 M. Sumbera, 10 X. M. Sun, 21 Y. Sun, 37 Z. Sun, 20 B. Surrow, 22 D. N. Svirida, 15 T. J. M. Symons, 21 A. Szanto de Toledo, 36 J. Takahashi, 6 A. H. Tang, 2 Z. Tang, 37 L. H. Tarini, 49 T. Tarnowsky, 24 D. Thein, 42 J. H. Thomas, 21 J. Tian, 39 A. R. Timmins, 49 D. Tlusty, 10 M. Tokarev, 17 V. N. Tram, 21 S. Trentalange, 5 R. E. Tribble, 41 Tribedy, 46 O. D. Tsai, 5 T. Ullrich, 2 D. G. Underwood, 1 G. Van Buren, 2 G. van Nieuwenhuizen, 22 J. A. Vanfossen, Jr., 18 R. Varma, 13 G. M. S. Vasconcelos, 6 A. N. Vasiliev, 31 F. Videbæk, 2 Y. P. Viyogi, 46 S. Vokal, 17 M. Wada, 42 M. Walker, 22 F. Wang, 32 G. Wang, 5 H. Wang, 24 J. S. Wang, 20 Q. Wang, 32 X. L. Wang, 37 Y. Wang, 43 G. Webb, 19 J. C. Webb, 2 G. D. Westfall, 24 C. Whitten Jr., 5 H. Wieman, 21 S. W. Wissink, 14 R. Witt, 44 W. Witzke, 19 Y. F. Wu, 50 Xiao, 43 W. Xie, 32 H. Xu, 20 N. Xu, 21 Q. H. Xu, 38 W. Xu, 5 Y. Xu, 37 Z. Xu, 2 L. Xue, 39 Y. Yang, 20 P. Yepes, 35 K. Yip, 2 I-K. Yoo, 33 M. Zawisza, 47 H. Zbroszczyk, 47 W. Zhan, 20 J. B. Zhang, 50 S. Zhang, 39 W. M. Zhang, 18 X. P. Zhang, 43 Y. Zhang, 21 Z. P. Zhang, 37 J. Zhao, 39 C. Zhong, 39 W. Zhou, 38 X. Zhu, 43 Y. H. Zhu, 39 R. Zoulkarneev, 17 and Y. Zoulkarneeva 17 (STAR Collaboration)
Transcript of Measurements of Dihadron Correlations Relative to the Event Plane in Au+Au Collisions at...
arX
iv:1
010.
0690
v2 [
nucl
-ex]
16
May
201
3
Measurements of Dihadron Correlations Relative to the Event Plane in Au+Au
Collisions at√sNN
= 200 GeV
H. Agakishiev,17 M. M. Aggarwal,29 Z. Ahammed,21 A. V. Alakhverdyants,17 I. Alekseev ,15 J. Alford,18
B. D. Anderson,18 C. D. Anson,27 D. Arkhipkin,2 G. S. Averichev,17 J. Balewski,22 D. R. Beavis,2
N. K. Behera,13 R. Bellwied,49 M. J. Betancourt,22 R. R. Betts,7 A. Bhasin,16 A. K. Bhati,29 H. Bichsel,48
J. Bielcik,9 J. Bielcikova,10 B. Biritz,5 L. C. Bland,2 W. Borowski,40 J. Bouchet,18 E. Braidot,26 A. V. Brandin,25
A. Bridgeman,1 S. G. Brovko,4 E. Bruna,51 S. Bueltmann,28 I. Bunzarov,17 T. P. Burton,2 X. Z. Cai,39
H. Caines,51 M. Calderon de la Barca Sanchez,4 D. Cebra,4 R. Cendejas,5 M. C. Cervantes,41 Z. Chajecki,27
P. Chaloupka,10 S. Chattopadhyay,46 H. F. Chen,37 J. H. Chen,39 J. Y. Chen,50 L. Chen,50 J. Cheng,43
M. Cherney,8 A. Chikanian,51 K. E. Choi,33 W. Christie,2 P. Chung,10 M. J. M. Codrington,41 R. Corliss,22
J. G. Cramer,48 H. J. Crawford,3 S. Dash,12 A. Davila Leyva,42 L. C. De Silva,49 R. R. Debbe,2 T. G. Dedovich,17
A. A. Derevschikov,31 R. Derradi de Souza,6 L. Didenko,2 P. Djawotho,41 S. M. Dogra,16 X. Dong,21
J. L. Drachenberg,41 J. E. Draper,4 J. C. Dunlop,2 L. G. Efimov,17 M. Elnimr,49 J. Engelage,3 G. Eppley,35
M. Estienne,40 L. Eun,30 O. Evdokimov,7 R. Fatemi,19 J. Fedorisin,17 A. Feng,50 R. G. Fersch,19 P. Filip,17
E. Finch,51 V. Fine,2 Y. Fisyak,2 C. A. Gagliardi,41 D. R. Gangadharan,5 A. Geromitsos,40 F. Geurts,35 P. Ghosh,46
Y. N. Gorbunov,8 A. Gordon,2 O. Grebenyuk,21 D. Grosnick,45 S. M. Guertin,5 A. Gupta,16 W. Guryn,2 B. Haag,4
O. Hajkova,9 A. Hamed,41 L-X. Han,39 J. W. Harris,51 J. P. Hays-Wehle,22 M. Heinz,51 S. Heppelmann,30
A. Hirsch,32 E. Hjort,21 G. W. Hoffmann,42 D. J. Hofman,7 B. Huang,37 H. Z. Huang,5 T. J. Humanic,27 L. Huo,41
G. Igo,5 P. Jacobs,21 W. W. Jacobs,14 C. Jena,12 F. Jin,39 J. Joseph,18 E. G. Judd,3 S. Kabana,40 K. Kang,43
J. Kapitan,10 K. Kauder,7 H. Ke,50 D. Keane,18 A. Kechechyan,17 D. Kettler,48 D. P. Kikola,21 J. Kiryluk,21
A. Kisiel,47 V. Kizka,17 A. G. Knospe,51 D. D. Koetke,45 T. Kollegger,11 J. Konzer,32 I. Koralt,28 L. Koroleva,15
W. Korsch,19 L. Kotchenda,25 V. Kouchpil,10 P. Kravtsov,25 K. Krueger,1 M. Krus,9 L. Kumar,18 P. Kurnadi,5
M. A. C. Lamont,2 J. M. Landgraf,2 S. LaPointe,49 J. Lauret,2 A. Lebedev,2 R. Lednicky,17 J. H. Lee,2 W. Leight,22
M. J. LeVine,2 C. Li,37 L. Li,42 N. Li,50 W. Li,39 X. Li,32 X. Li,38 Y. Li,43 Z. M. Li,50 M. A. Lisa,27 F. Liu,50
H. Liu,4 J. Liu,35 T. Ljubicic,2 W. J. Llope,35 R. S. Longacre,2 W. A. Love,2 Y. Lu,37 E. V. Lukashov,25 X. Luo,37
G. L. Ma,39 Y. G. Ma,39 D. P. Mahapatra,12 R. Majka,51 O. I. Mall,4 L. K. Mangotra,16 R. Manweiler,45
S. Margetis,18 C. Markert,42 H. Masui,21 H. S. Matis,21 Yu. A. Matulenko,31 D. McDonald,35 T. S. McShane,8
A. Meschanin,31 R. Milner,22 N. G. Minaev,31 S. Mioduszewski,41 A. Mischke,26 M. K. Mitrovski,11 B. Mohanty,46
M. M. Mondal,46 B. Morozov,15 D. A. Morozov,31 M. G. Munhoz,36 M. Naglis,21 B. K. Nandi,13 T. K. Nayak,46
P. K. Netrakanti,32 L. V. Nogach,31 S. B. Nurushev,31 G. Odyniec,21 A. Ogawa,2 Oh,33 Ohlson,51 V. Okorokov,25
E. W. Oldag,42 D. Olson,21 M. Pachr,9 B. S. Page,14 S. K. Pal,46 Y. Pandit,18 Y. Panebratsev,17 T. Pawlak,47
H. Pei,7 T. Peitzmann,26 C. Perkins,3 W. Peryt,47 S. C. Phatak,12 P. Pile,2 M. Planinic,52 M. A. Ploskon,21
J. Pluta,47 D. Plyku,28 N. Poljak,52 A. M. Poskanzer,21 B. V. K. S. Potukuchi,16 C. B. Powell,21 D. Prindle,48
C. Pruneau,49 N. K. Pruthi,29 P. R. Pujahari,13 J. Putschke,51 H. Qiu,20 R. Raniwala,34 S. Raniwala,34 R. L. Ray,42
R. Redwine,22 R. Reed,4 H. G. Ritter,21 J. B. Roberts,35 O. V. Rogachevskiy,17 J. L. Romero,4 A. Rose,21
L. Ruan,2 J. Rusnak,10 N. R. Sahoo,46 S. Sakai,21 I. Sakrejda,21 T. Sakuma,22 S. Salur,4 J. Sandweiss,51
E. Sangaline,4 A. Sarkar,13 J. Schambach,42 R. P. Scharenberg,32 A. M. Schmah,21 T. R. Schuster,11 J. Seele,22
J. Seger,8 I. Selyuzhenkov,14 P. Seyboth,23 E. Shahaliev,17 M. Shao,37 M. Sharma,49 S. S. Shi,50 Q. Y. Shou,39
E. P. Sichtermann,21 F. Simon,23 R. N. Singaraju,46 M. J. Skoby,32 N. Smirnov,51 H. M. Spinka,1 B. Srivastava,32
T. D. S. Stanislaus,45 D. Staszak,5 S. G. Steadman,22 J. R. Stevens,14 R. Stock,11 M. Strikhanov,25
B. Stringfellow,32 A. A. P. Suaide,36 M. C. Suarez,7 N. L. Subba,18 M. Sumbera,10 X. M. Sun,21 Y. Sun,37 Z. Sun,20
B. Surrow,22 D. N. Svirida,15 T. J. M. Symons,21 A. Szanto de Toledo,36 J. Takahashi,6 A. H. Tang,2 Z. Tang,37
L. H. Tarini,49 T. Tarnowsky,24 D. Thein,42 J. H. Thomas,21 J. Tian,39 A. R. Timmins,49 D. Tlusty,10 M. Tokarev,17
V. N. Tram,21 S. Trentalange,5 R. E. Tribble,41 Tribedy,46 O. D. Tsai,5 T. Ullrich,2 D. G. Underwood,1
G. Van Buren,2 G. van Nieuwenhuizen,22 J. A. Vanfossen, Jr.,18 R. Varma,13 G. M. S. Vasconcelos,6
A. N. Vasiliev,31 F. Videbæk,2 Y. P. Viyogi,46 S. Vokal,17 M. Wada,42 M. Walker,22 F. Wang,32 G. Wang,5
H. Wang,24 J. S. Wang,20 Q. Wang,32 X. L. Wang,37 Y. Wang,43 G. Webb,19 J. C. Webb,2 G. D. Westfall,24
C. Whitten Jr.,5 H. Wieman,21 S. W. Wissink,14 R. Witt,44 W. Witzke,19 Y. F. Wu,50 Xiao,43 W. Xie,32
H. Xu,20 N. Xu,21 Q. H. Xu,38 W. Xu,5 Y. Xu,37 Z. Xu,2 L. Xue,39 Y. Yang,20 P. Yepes,35 K. Yip,2 I-K. Yoo,33
M. Zawisza,47 H. Zbroszczyk,47 W. Zhan,20 J. B. Zhang,50 S. Zhang,39 W. M. Zhang,18 X. P. Zhang,43 Y. Zhang,21
Z. P. Zhang,37 J. Zhao,39 C. Zhong,39 W. Zhou,38 X. Zhu,43 Y. H. Zhu,39 R. Zoulkarneev,17 and Y. Zoulkarneeva17
(STAR Collaboration)

2
1Argonne National Laboratory, Argonne, Illinois 60439, USA2Brookhaven National Laboratory, Upton, New York 11973, USA
3University of California, Berkeley, California 94720, USA4University of California, Davis, California 95616, USA
5University of California, Los Angeles, California 90095, USA6Universidade Estadual de Campinas, Sao Paulo, Brazil
7University of Illinois at Chicago, Chicago, Illinois 60607, USA8Creighton University, Omaha, Nebraska 68178, USA
9Czech Technical University in Prague, FNSPE, Prague, 115 19, Czech Republic10Nuclear Physics Institute AS CR, 250 68 Rez/Prague, Czech Republic
11University of Frankfurt, Frankfurt, Germany12Institute of Physics, Bhubaneswar 751005, India13Indian Institute of Technology, Mumbai, India
14Indiana University, Bloomington, Indiana 47408, USA15Alikhanov Institute for Theoretical and Experimental Physics, Moscow, Russia
16University of Jammu, Jammu 180001, India17Joint Institute for Nuclear Research, Dubna, 141 980, Russia
18Kent State University, Kent, Ohio 44242, USA19University of Kentucky, Lexington, Kentucky, 40506-0055, USA
20Institute of Modern Physics, Lanzhou, China21Lawrence Berkeley National Laboratory, Berkeley, California 94720, USA22Massachusetts Institute of Technology, Cambridge, MA 02139-4307, USA
23Max-Planck-Institut fur Physik, Munich, Germany24Michigan State University, East Lansing, Michigan 48824, USA
25Moscow Engineering Physics Institute, Moscow Russia26NIKHEF and Utrecht University, Amsterdam, The Netherlands
27Ohio State University, Columbus, Ohio 43210, USA28Old Dominion University, Norfolk, VA, 23529, USA
29Panjab University, Chandigarh 160014, India30Pennsylvania State University, University Park, Pennsylvania 16802, USA
31Institute of High Energy Physics, Protvino, Russia32Purdue University, West Lafayette, Indiana 47907, USA
33Pusan National University, Pusan, Republic of Korea34University of Rajasthan, Jaipur 302004, India35Rice University, Houston, Texas 77251, USA36Universidade de Sao Paulo, Sao Paulo, Brazil
37University of Science & Technology of China, Hefei 230026, China38Shandong University, Jinan, Shandong 250100, China
39Shanghai Institute of Applied Physics, Shanghai 201800, China40SUBATECH, Nantes, France
41Texas A&M University, College Station, Texas 77843, USA42University of Texas, Austin, Texas 78712, USA
43Tsinghua University, Beijing 100084, China44United States Naval Academy, Annapolis, MD 21402, USA
45Valparaiso University, Valparaiso, Indiana 46383, USA46Variable Energy Cyclotron Centre, Kolkata 700064, India
47Warsaw University of Technology, Warsaw, Poland48University of Washington, Seattle, Washington 98195, USA
49Wayne State University, Detroit, Michigan 48201, USA50Institute of Particle Physics, CCNU (HZNU), Wuhan 430079, China
51Yale University, New Haven, Connecticut 06520, USA52University of Zagreb, Zagreb, HR-10002, Croatia
Dihadron azimuthal correlations containing a high transverse momentum (pT ) trigger particle aresensitive to the properties of the nuclear medium created at RHIC through the strong interactionsoccurring between the traversing parton and the medium, i.e. jet-quenching. Previous measure-ments revealed a strong modification to dihadron azimuthal correlations in Au+Au collisions withrespect to p+p and d+Au collisions. The modification increases with the collision centrality, suggest-ing a path-length dependence to the jet-quenching effect. This paper reports STAR measurementsof dihadron azimuthal correlations in mid-central (20-60%) Au+Au collisions at
√sNN
= 200 GeVas a function of the trigger particle’s azimuthal angle relative to the event plane, φs = |φt − ψEP|.The azimuthal correlation is studied as a function of both the trigger and associated particle pT .The subtractions of the combinatorial background and anisotropic flow, assuming Zero Yield At

3
Minimum (zyam), are described. The away-side correlation is strongly modified, and the modifica-tion varies with φs, which is expected to be related to the path-length that the away-side partontraverses. The pseudo-rapidity (∆η) dependence of the near-side correlation, sensitive to long range∆η correlations (the ridge), is also investigated. The ridge and jet-like components of the near-sidecorrelation are studied as a function of φs. The ridge appears to drop with increasing φs whilethe jet-like component remains approximately constant. High-order harmonics arising from fluctua-tions, particularly triangular flow, are not sufficient to explain the ridge or the away-side double-peakstructure. The dropping ridge with φs could be attributed to a φs-dependent elliptic anisotropy,however, the physics mechanism of the ridge remains an open question. Even with a φs-dependentelliptic flow, the away-side correlation structure is robust. These results, with extensive systematicstudies of the dihadron correlations as a function of φs, trigger and associated particle pT , andthe pseudo-rapidity range ∆η, should provide stringent inputs to help understand the underlyingphysics mechanisms of jet-medium interactions in high energy nuclear collisions.
PACS numbers: 25.75.-q, 25.75.Dw
I. INTRODUCTION
Collisions at the Relativistic Heavy Ion Collider(RHIC) of Brookhaven National Laboratory have createda medium with properties that resemble a nearly perfectliquid of strongly interacting quarks and gluons [1–4].This conclusion is based upon two pillars of evidence: (i)the strong elliptic flow and (ii) jet-quenching– suppres-sion of high transverse momentum (pT ) single hadronyield and dihadron correlation in heavy-ion collisions rel-ative to elementary p+p interactions. While suppres-sion of high pT single hadron yields has limited sen-sitivity to the medium core, dihadron correlation mea-surements provide richer and more valuable informationabout the properties of the created medium [5]. Thereare several key observations that can be made from di-hadron correlations with a high pT trigger particle. (i)The correlated hadron yield at high pT , while not muchchanged on the near side of the trigger particle (whereazimuth difference between correlated and trigger par-ticles |∆φ| < π/2), is strongly suppressed on the awayside (where |∆φ| > π/2) [6]. This lends strong supportto the partonic energy loss picture [7–9]. (ii) The cor-related hadron yields at low pT are strongly enhancedon both the near and away side [10]. In particular,the near-side enhancement is tied to long-range corre-lations in pseudo-rapidity – the ridge [10–12]. (iii) Theaway-side correlation broadens from peripheral to cen-tral collisions, and exhibits double peaks for select trig-ger and associated particle pT ranges [10, 13, 14]. Thedouble peak structure opens up a new opportunity tostudy the underlying physics mechanisms for partonic en-ergy loss, such as gluon radiation [15, 16] or Mach-coneshock-wave excitation [17–20]. Recent three-particle jet-like correlation studies indicate that the conical emissionpattern of correlated hadrons is characteristic of Mach-cone shock-waves [21]. (iv) The away-side associated par-ticles are partially equilibrated with the bulk mediumin mid-central to central collisions, and a higher degreeof equilibration is observed for particles which are morealigned back-to-back with the trigger particles [10, 13].This observation underscores the connection between themedium’s path-length and partonic energy loss.
We study the path-length dependence of partonic en-ergy loss in detail in non-central collisions where the over-lap region between the two colliding nuclei is anisotropic:the size in the reaction-plane direction is shorter thanthat perpendicular to it. The reaction plane (RP) is de-fined by the beam direction and the line connecting thecenters of two colliding nuclei. It can be estimated innon-central collisions by determining the azimuthal an-gle with the highest particle emission probability, usingthe fact that the particles have an elliptic emission pat-tern. The estimated angle is called the event plane (EP)to emphasize that it is an experimental estimate of thereaction plane with finite resolution. By selecting thetrigger particle direction with respect to the event plane,φs = |φt −ψEP| (where φt is the trigger particle azimuthand ψEP is the event-plane azimuth), we effectively se-lect different path-lengths through the medium that theaway-side parton traverses, providing differential infor-mation unavailable to inclusive jet-correlation measure-ments.Previously, the Solenoidal Tracker at RHIC (STAR)
experiment has performed an exploratory measurementof azimuthal correlations at high pT with trigger particlesin-plane (φs < π/4) and out-of-plane (φs > π/4) usingnon-central 20-60% Au+Au collisions [22]. The resultshinted that the away-side correlation with out-of-planetrigger particles is more strongly suppressed than thatwith in-plane trigger particles. In this paper, we extendthose measurements to finer bins in φs and to lower as-sociated and trigger pT ranges [23]. We also present in-clusive jet-correlation results from minimum bias d+Aucollisions as a reference to the Au+Au data.
We further study the ridge as a function of φs, andinvestigate the systematics of the ridge in an attempt toidentify the underlying physics mechanism for the forma-tion of the ridge.
The paper is organized as follows. In Sec. II we de-scribe in detail our data analysis of dihadron correlationsrelative to the event plane. In Sec. III we discuss ourextensive studies of the systematic uncertainties of ourresults. In Sec. IV we report and discuss our results of di-hadron correlations relative to the event plane. We finallyconclude in Sec. V. We present all raw and background-
4
subtracted dihadron correlation functions relative to theevent plane in Appendix C.
II. EXPERIMENT AND DATA ANALYSIS
The data used in this analysis were taken by the STARexperiment [25] at RHIC at the nucleon-nucleon centerof mass energy of
√sNN
= 200 GeV. The minimum-bias Au+Au data were from Run IV in 2004 at RHIC.The reference minimum-bias d+Au data used for com-parison were from Run III in 2003. The minimum-biastriggers for Au+Au and d+Au collisions were providedby the Central Trigger Barrel [26] and the Zero DegreeCalorimeters [27].
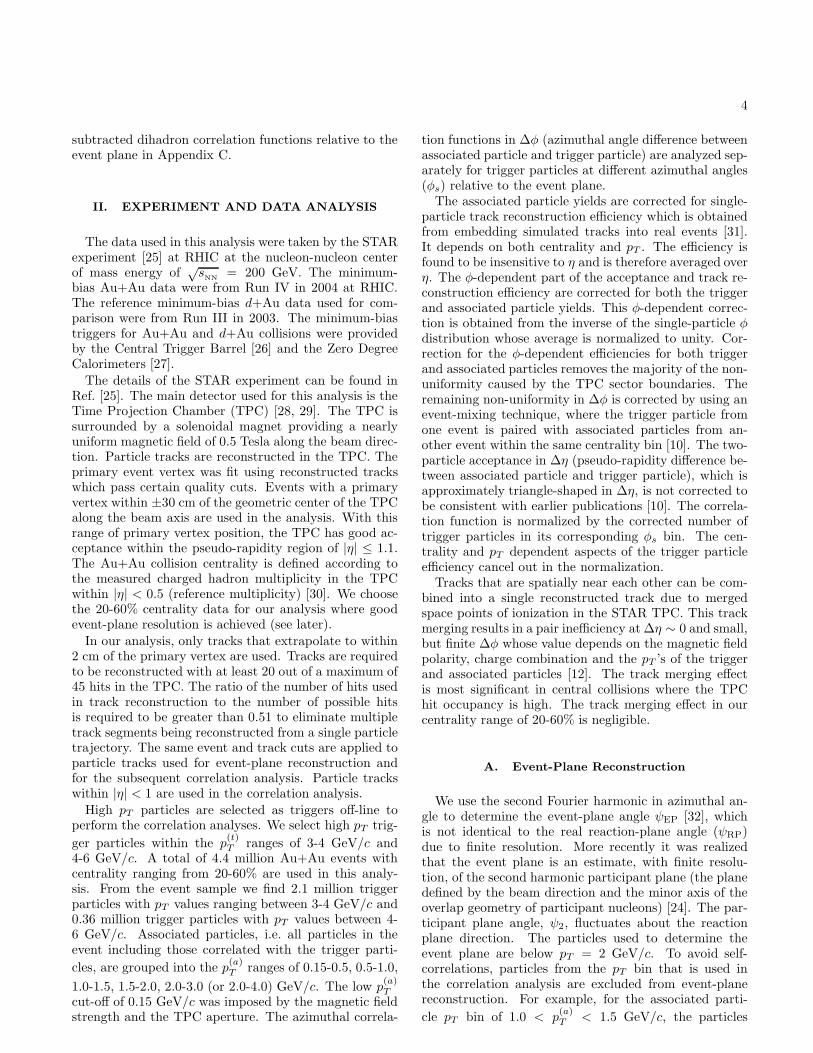
The details of the STAR experiment can be found inRef. [25]. The main detector used for this analysis is theTime Projection Chamber (TPC) [28, 29]. The TPC issurrounded by a solenoidal magnet providing a nearlyuniform magnetic field of 0.5 Tesla along the beam direc-tion. Particle tracks are reconstructed in the TPC. Theprimary event vertex was fit using reconstructed trackswhich pass certain quality cuts. Events with a primaryvertex within ±30 cm of the geometric center of the TPCalong the beam axis are used in the analysis. With thisrange of primary vertex position, the TPC has good ac-ceptance within the pseudo-rapidity region of |η| ≤ 1.1.The Au+Au collision centrality is defined according tothe measured charged hadron multiplicity in the TPCwithin |η| < 0.5 (reference multiplicity) [30]. We choosethe 20-60% centrality data for our analysis where goodevent-plane resolution is achieved (see later).
In our analysis, only tracks that extrapolate to within2 cm of the primary vertex are used. Tracks are requiredto be reconstructed with at least 20 out of a maximum of45 hits in the TPC. The ratio of the number of hits usedin track reconstruction to the number of possible hitsis required to be greater than 0.51 to eliminate multipletrack segments being reconstructed from a single particletrajectory. The same event and track cuts are applied toparticle tracks used for event-plane reconstruction andfor the subsequent correlation analysis. Particle trackswithin |η| < 1 are used in the correlation analysis.
High pT particles are selected as triggers off-line toperform the correlation analyses. We select high pT trig-
ger particles within the p(t)T ranges of 3-4 GeV/c and
4-6 GeV/c. A total of 4.4 million Au+Au events withcentrality ranging from 20-60% are used in this analy-sis. From the event sample we find 2.1 million triggerparticles with pT values ranging between 3-4 GeV/c and0.36 million trigger particles with pT values between 4-6 GeV/c. Associated particles, i.e. all particles in theevent including those correlated with the trigger parti-
cles, are grouped into the p(a)T ranges of 0.15-0.5, 0.5-1.0,
1.0-1.5, 1.5-2.0, 2.0-3.0 (or 2.0-4.0) GeV/c. The low p(a)T
cut-off of 0.15 GeV/c was imposed by the magnetic fieldstrength and the TPC aperture. The azimuthal correla-
tion functions in ∆φ (azimuthal angle difference betweenassociated particle and trigger particle) are analyzed sep-arately for trigger particles at different azimuthal angles(φs) relative to the event plane.The associated particle yields are corrected for single-
particle track reconstruction efficiency which is obtainedfrom embedding simulated tracks into real events [31].It depends on both centrality and pT . The efficiency isfound to be insensitive to η and is therefore averaged overη. The φ-dependent part of the acceptance and track re-construction efficiency are corrected for both the triggerand associated particle yields. This φ-dependent correc-tion is obtained from the inverse of the single-particle φdistribution whose average is normalized to unity. Cor-rection for the φ-dependent efficiencies for both triggerand associated particles removes the majority of the non-uniformity caused by the TPC sector boundaries. Theremaining non-uniformity in ∆φ is corrected by using anevent-mixing technique, where the trigger particle fromone event is paired with associated particles from an-other event within the same centrality bin [10]. The two-particle acceptance in ∆η (pseudo-rapidity difference be-tween associated particle and trigger particle), which isapproximately triangle-shaped in ∆η, is not corrected tobe consistent with earlier publications [10]. The correla-tion function is normalized by the corrected number oftrigger particles in its corresponding φs bin. The cen-trality and pT dependent aspects of the trigger particleefficiency cancel out in the normalization.Tracks that are spatially near each other can be com-
bined into a single reconstructed track due to mergedspace points of ionization in the STAR TPC. This trackmerging results in a pair inefficiency at ∆η ∼ 0 and small,but finite ∆φ whose value depends on the magnetic fieldpolarity, charge combination and the pT ’s of the triggerand associated particles [12]. The track merging effectis most significant in central collisions where the TPChit occupancy is high. The track merging effect in ourcentrality range of 20-60% is negligible.
A. Event-Plane Reconstruction
We use the second Fourier harmonic in azimuthal an-gle to determine the event-plane angle ψEP [32], whichis not identical to the real reaction-plane angle (ψRP)due to finite resolution. More recently it was realizedthat the event plane is an estimate, with finite resolu-tion, of the second harmonic participant plane (the planedefined by the beam direction and the minor axis of theoverlap geometry of participant nucleons) [24]. The par-ticipant plane angle, ψ2, fluctuates about the reactionplane direction. The particles used to determine theevent plane are below pT = 2 GeV/c. To avoid self-correlations, particles from the pT bin that is used inthe correlation analysis are excluded from event-planereconstruction. For example, for the associated parti-
cle pT bin of 1.0 < p(a)T < 1.5 GeV/c, the particles
5
used to calculate the event plane are from pT ranges of0.15 < pT < 1.0 GeV/c plus 1.5 < pT < 2.0 GeV/c. Weuse the pT -weight method [32] which gives better event-plane resolution due to the stronger anisotropy at largerpT . The slight non-uniform efficiency and acceptance inazimuthal angle were corrected as mentioned previouslyin the event-plane reconstruction. Figure 1 shows exam-ples of the constructed event plane azimuthal angle distri-butions. As seen from the figure, the constructed eventplane ψEP distribution is approximately uniform. Weweight the events by the inverse of the event-plane angledistributions in Fig. 1 in our correlation analysis. How-ever, we found negligible difference in our results withand without this event-plane weighting.
-1.5 -1 -0.5 0 0.5 1 1.50.6
0.7
0.8
0.9
1
1.1
1.2
| > 0.5lead
η - η| < 1 and |ηEP by particles |
/ndf = 92/882χ, EP
ψFit curve: 1 - 0.0044 cos2
/ndf = 106/892χConstant fit
| < 1ηEP by particles |
[rad]EP
ψ
EP
ψdev
tdN
evt
Nπ1
FIG. 1: (Color online) Constructed event plane azimuthal an-gle (ψEP) distributions by the modified reaction-plane (mrp)method (points) and the traditional reaction-plane method(histogram). The particles used for constructing the eventplane shown in this figure are from 0.15 < pT < 1 GeV/c or1.5 < pT < 2 GeV/c, to be used for correlation analysis for
the associated particle p(a)T
bin of 1 < p(a)T
< 1.5 GeV/c.
Nonflow correlations, such as di-jets, can influence thedetermination of the event plane. To reduce this effect,we exclude from EP reconstruction particles within pseu-dorapidity difference of |∆η| = |η − ηtrig| < 0.5 fromthe trigger particle. This method is called the modi-fied reaction-plane (mrp) method [33]. The traditionalreaction-plane method, on the other hand, does not ex-clude from EP reconstruction those particles in the ηvicinity of the trigger particle. Remaining possible bi-ases due to correlations between trigger particles and EPparticles may be assessed by comparing our results rel-ative to the EP reconstructed from these two differentmethods with their respective EP resolutions. The re-sults are found qualitatively similar, suggesting that anybiases may be small. See Appendix A for details.To extract the near-side jet-like component, we use the
difference in azimuthal correlations between analyzed atsmall and large |∆η|. The mrp method, which excludesparticles within |∆η| < 0.5 of the trigger particle in theevent, would have different systematic biases on the ∆φcorrelations at small and large |∆η|. Thus, we use thetraditional reaction-plane method for the jet-like com-
ponent. Figure 1 shows the ψEP distributions from themodified reaction-plane method (data points) and thetraditional reaction-plane method (histogram). We havechecked the correlation between the event plane anglesconstructed from the traditional method and the mrp
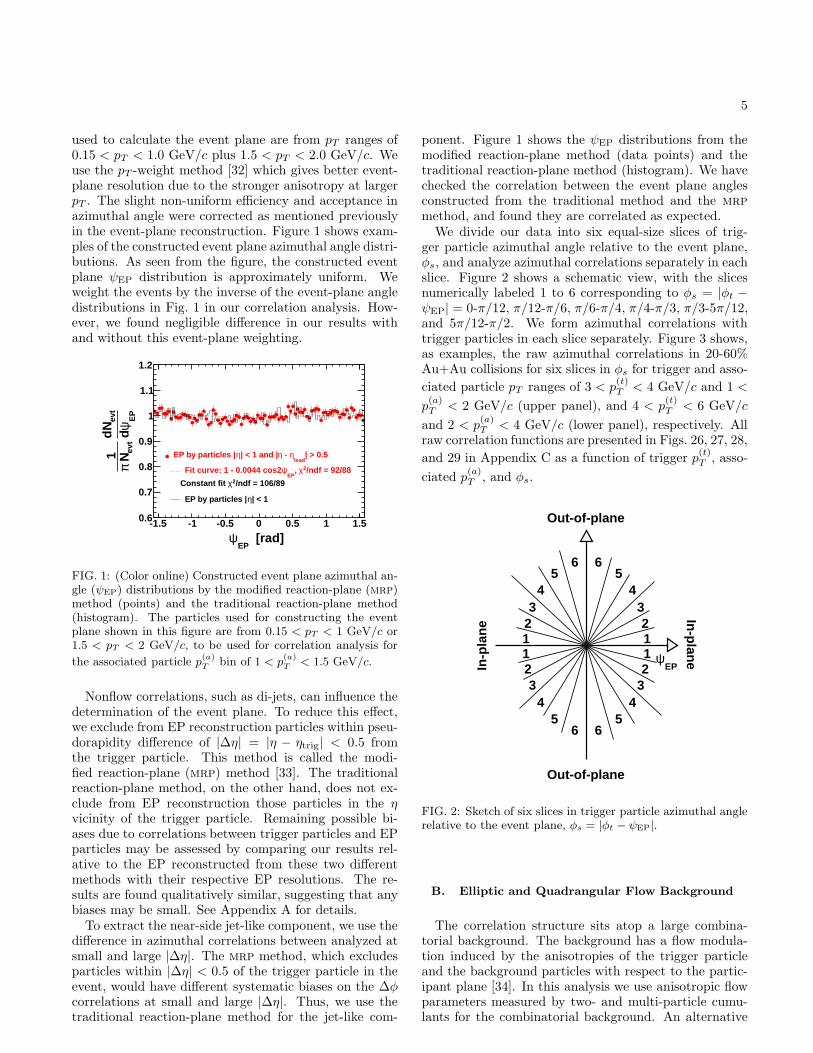
method, and found they are correlated as expected.We divide our data into six equal-size slices of trig-
ger particle azimuthal angle relative to the event plane,φs, and analyze azimuthal correlations separately in eachslice. Figure 2 shows a schematic view, with the slicesnumerically labeled 1 to 6 corresponding to φs = |φt −ψEP| = 0-π/12, π/12-π/6, π/6-π/4, π/4-π/3, π/3-5π/12,and 5π/12-π/2. We form azimuthal correlations withtrigger particles in each slice separately. Figure 3 shows,as examples, the raw azimuthal correlations in 20-60%Au+Au collisions for six slices in φs for trigger and asso-
ciated particle pT ranges of 3 < p(t)T < 4 GeV/c and 1 <
p(a)T < 2 GeV/c (upper panel), and 4 < p
(t)T < 6 GeV/c
and 2 < p(a)T < 4 GeV/c (lower panel), respectively. All
raw correlation functions are presented in Figs. 26, 27, 28,
and 29 in Appendix C as a function of trigger p(t)T , asso-
ciated p(a)T , and φs.
In-plane
In-p
lane
Out-of-plane
Out-of-plane
EPψ
12
34
566
54
321123
45
6 65
4321
FIG. 2: Sketch of six slices in trigger particle azimuthal anglerelative to the event plane, φs = |φt − ψEP|.
B. Elliptic and Quadrangular Flow Background
The correlation structure sits atop a large combina-torial background. The background has a flow modula-tion induced by the anisotropies of the trigger particleand the background particles with respect to the partic-ipant plane [34]. In this analysis we use anisotropic flowparameters measured by two- and multi-particle cumu-lants for the combinatorial background. An alternative
6
o-15o0
7
8
9
10
o-30o15
7
8
9
10
o-45o30
7
8
9
10
o-60o45
7
8
9
10
o-75o60
7
8
9
10
o-90o75
7
8
9
10
0 2 4
0.6
0.8
1
0 2 4
0.6
0.8
1
0 2 4
0.6
0.8
1
0 2 4
0.6
0.8
1
0 2 4
0.6
0.8
1
0 2 4
0.6
0.8
1
=s
φ
[rad]t
φ - φ = φ∆
φ∆)
dN/d
trig
(1/N
<2 GeV/c(a)
T<4 GeV/c, 1<p
(t)
TAu+Au 20-60%, 3<p
<4 GeV/c(a)
T<6 GeV/c, 2<p
(t)
TAu+Au 20-60%, 4<p
FIG. 3: (Color online) Raw dihadron ∆φ correlations with trigger particles in six slices of azimuthal angle relative to the eventplane, φs = |φt − ψEP|. The data are from minimum-bias 20-60% Au+Au collisions. The trigger and associated particle pT
ranges are 3 < p(t)T
< 4 GeV/c and 1 < p(a)T
< 2 GeV/c (upper panel), and 4 < p(t)T
< 6 GeV/c and 2 < p(a)T
< 4 GeV/c(lower panel), respectively. Note the lower panels correspond to the kinematic range used in Ref. [6]. Both the trigger andassociated particles are restricted to within |η| < 1. The triangle two-particle ∆η acceptance is not corrected. Statistical errorsare smaller than the symbol size. The curves are flow modulated zyam background including v2 and v4{ψ2} by Eq. (1). Theused v2 values are given in Table I from four-particle v2{4} and two-particle v2{2, ηgap=0.7} (dashed curves) and the averagev2 from the two methods (solid curve). The v4{ψ2} is taken from the parameterization in Eq. (15).
approach that has been used to describe dihadron cor-relation data treats the anisotropic flow modulations asfree parameters in a multi-parameter model fit to thedihadron correlation functions in 2-dimensional ∆η-∆φspace [61, 62]. Results from this alternative approach tothe inclusive dihadron correlation data (without a high-pT trigger or cutting on φs) can be found in Ref. [61, 62].
The multi-parameter fit approach to our φs-dependenthigh-pT triggered dihadron correlations is considered inSec. III E, but a detailed discussion of the differences inassumptions and conclusions of the two approaches is be-yond the scope of this paper.In this analysis, the flow correlated background is given
by [35]
dN
d∆φ= B
[
1 + 2v(a)2 v
(t,R)2 cos(2∆φ) + 2v
(a)4 {ψ2}v(t,R)
4 {ψ2} cos(4∆φ)]
, (1)
where B is the background normalization. In
Eq. (1) v(a)2 and v
(a)4 {ψ2} are the associated par-
ticle’s second and fourth harmonics with respect to
the second harmonic event plane, ψ2, and v(t,R)2 and
v(t,R)4 {ψ2} are the average harmonics of the trigger par-
ticles, v(t,R)2 = 〈cos [2 (φt − ψ2)]〉(R)
and v(t,R)4 {ψ2} =
〈cos [4 (φt − ψ2)]〉(R), respectively. The superscript ‘(R)’
indicates that the averages are taken within the φt regionof a slice of width 2c at φs: φs − c < |φt − ψEP| < φs + c(where c = π/24 in our analysis). Note that we have usedφs here and in Eq. (3) to be the center value of a |φt−ψEP|bin, while elsewhere we simply use φs = |φt−ψEP| to in-dicate a narrow bin in |φt − ψEP|. For the nth harmonic
anisotropy we have [35],
v(R)n =
v(t)n + δn,evenTn +
∑
k=2,4,6,...
(
v(t)k+n + v
(t)|k−n|
)
Tk
1 +∑
k=2,4,6,... 2v(t)k Tk
.
(2)Here Tk is a short-hand notation for
Tk = cos(kφs)sin(kc)
kc〈cos(k∆ψ)〉 , (3)
〈cos(k∆ψ)〉 ≡ 〈cos k(ψEP − ψ2)〉 is the event-plane res-olution with respect to the kth harmonic, and δ is Kro-necker’s delta. Since the correlation signal we are study-ing is on the order of a few percent of the background,we need to keep the flow correction in Eq. (2) up to the
order v2v4 ∼ 0.1%. Keeping terms for v(t,R)2 up to v4 and

7
for v(t,R)4 {ψ2} up to v2, we have
v(t,R)2 ≈ T2 + (1 + T4)v
(t)2 + (T2 + T6)v
(t)4 {ψ2}
1 + 2T2v(t)2 + 2T4v
(t)4 {ψ2}
, (4)
and
v(t,R)4 {ψ2} ≈ T4 + (T2 + T6)v
(t)2 + (1 + T8)v
(t)4 {ψ2}
1 + 2T2v(t)2 + 2T4v
(t)4 {ψ2}
≈ T4 + (T2 + T6)v(t)2
1 + 2T2v(t)2
. (5)
Note the v(t)4 {ψ2} above is with respect to the second
harmonic plane ψ2. The final flow correction is given byEqs. (1), (4), and (5).The event-plane resolutions, 〈cos(k∆ψ)〉 (k = 2, 4, 6),
are obtained from the sub-event method [32]. The eventis randomly divided into two sub-events a and b withequal multiplicities. The sub-events, excluding the as-sociated particle pT region, are analyzed to yield event-plane angles which, ideally, should be identical. The dif-ference between the obtained event-plane angles, ψa−ψb,gives the uncertainty in the event-plane determination ofthe sub-events [32]
〈cos(k∆ψ)〉sub-event =√
〈cos k(ψa − ψb)〉. (6)
The event-plane resolution of the full event can be ap-proximated by [32]
〈cos(k∆ψ)〉 ≈√2〈cos(k∆ψ)〉sub-event (7)
in the limit of small event-plane resolution. The factor√2 comes in because the multiplicities of the sub-events
are smaller than the full event multiplicity by a factorof 2. We use the approximate form of Eq. (7) to assesssystematic uncertainties in the event-plane resolutions bydifferent ways of dividing the event into sub-events (seeSec. III B).The precise form of the event-plane resolution of the
full event is given by [32]
〈cos(k∆ψ)〉 =√
π
2
(χk
2
)
e−χ2
k4
[
I0
(
χ2k
4
)
+ I1
(
χ2k
4
)]
(8)where
χk(N) = vk√2N
〈pT 〉√
〈p2T 〉(9)
depends on the harmonic anisotropy magnitude vk andthe number of particlesN used in event-plane reconstruc-tion. The pT enters into Eq. (9) because we weighted eachparticle by its pT in constructing the event plane. In dataanalysis we solve for the sub-event χk(N/2) by Eq. (8)and the known event-plane resolution of the sub-eventsfrom Eq. (6) employing an iterative procedure [32]. From
Eq. (9) we obtain the full event χk(N) =√2χk(N/2).
We then use Eq. (8) to determine the event-plane resolu-tion of the full event [32]. The event-plane resolutions arelisted in Table I. The resolutions depend on the pT binbecause particles in a given pT bin (to be used for corre-lation analysis) are excluded from the event-plane recon-struction to avoid self-correlations as aforementioned.
One would naively expect that the event-plane res-olution should be different for different trigger particleorientations from the event plane because the influenceof di-jets on the event-plane determination should vary:a di-jet aligned with the reaction plane enhances theevent-plane reconstruction resulting in a better resolu-tion, whereas a di-jet perpendicular to the reaction planereduces the accuracy of the constructed event plane re-sulting in a poorer resolution. However, this is a posteffect due to the selection of the trigger particle angle rel-ative to the event plane. The resolutions used in Eq. (1),on the other hand, are those of all triggered events beforeany selection of the trigger particle orientation is made.We have also verified this with Monte Carlo toy modelsimulations.
Since only triggered events enter into our correlationmeasurements, the event-plane resolutions are measuredusing only these events. The event-plane resolutions frominclusive events (minimum-bias events within the givencentrality bin) are found to be within a couple of percentof that from the triggered events (see systematic uncer-tainty discussion in Sec. III B).
We analyzed the elliptic flow in each of the pT bins usedin our correlation analysis. The obtained elliptic flowparameters are tabulated in Table I together with theirsystematic uncertainties. The analysis of the elliptic flowand the assessment of its systematic uncertainty are bothdescribed in Sec. III A. We used these v2 parameters forbackground subtraction. The calculated magnitudes of
the elliptic flow modulation, 2v(a)2 v
(t,R)2 , are listed in Ta-
ble II together with their systematic uncertainties. Thecalculated background curves are superimposed in Fig. 3.
As mentioned previously, our trigger particle pT ranges
are 3 < p(t)T < 4 GeV/c and 4 < p
(t)T < 6 GeV/c. In
elementary p+p and d+Au collisions, the particles inthese pT ranges originate mainly from hard-scatteringsand jets. In relativistic heavy ion colllisions, however,a large baryon to meson ratio was observed in the pTregion around 3 GeV/c [36, 37]. The reason for thelarge ratio and the sources of those high pT particles arestill under debate. The coalescence and recombinationmodels [38–40] can elegantly explain the large baryon tomeson ratio from a thermal bath of constituent quarks.On the other hand, the jet-like correlations at small an-
gles relative to trigger particles of p(t)T > 3 GeV/c, with
the long range ridge correlation removed, are measuredto be invariant from p+p, d+Au, peripheral to centralAu+Au collisions [42], and independent of the reactionplane direction in Au+Au collisions as will be shown inthis work. These experimental evidences strongly sug-
gest that those p(t)T > 3 GeV/c particles are mostly of jet
8
TABLE I: Elliptic flow and event-plane resolutions as a function of pT in 20-60% minimum-bias Au+Au collisions. Theresolutions depend on the pT bin because particles in a given pT bin are excluded from the event-plane reconstruction to avoidself-correlations. The errors on v2 are systematic uncertainties given by two-particle v2{2, ηgap=0.7} (with a reference particle0.15 < pT < 2 GeV/c) and four-particle v2{4} (with three reference particles). Systematic uncertainties on the resolutions arenegligible.
pT (GeV/c) v2 〈cos(2∆ψ)〉 〈cos(4∆ψ)〉 〈cos(6∆ψ)〉0.15 - 0.5 0.038 ± 0.003 0.673 0.324 0.127
0.5 - 1 0.082 ± 0.006 0.596 0.247 0.082
1 - 1.5 0.128 ± 0.010 0.637 0.286 0.104
1.5 - 2 0.164 ± 0.011 0.676 0.328 0.129
2 - 3 0.189 ± 0.012 0.704 0.360 0.150
3 - 4 0.194 ± 0.013
4 - 6 0.163 ± 0.020
TABLE II: The elliptic flow modulation in the correlation background, 2v(a)2 v
(t,R)2 , calculated using measurements in Table I,
as a function of p(a)T (in rows) and φs = |φt − ψEP| (in columns) in minimum-bias 20-60% Au+Au collisions. Both trigger
particle pT ranges of 3 < p(t)T< 4 GeV/c and 4 < p
(t)T< 6 GeV/c are listed. Quoted errors are systematic uncertainties. Note
the significantly smaller systematic uncertainties out-of-plane than in-plane.
p(a)T (GeV/c) 0− π/12 π/12− π/6 π/6− π/4 π/4− π/3 π/3− 5π/12 5π/12− π/2
3 < p(t)T < 4 GeV/c
0.15 - 0.5 0.0544 ± 0.0046 0.0433 ± 0.0039 0.0229 ± 0.0025 −0.0028 ± 0.0006 −0.0270 ± 0.0015 −0.0416 ± 0.0028
0.5 - 1 0.1098 ± 0.0096 0.0884 ± 0.0082 0.0490 ± 0.0055 −0.0004 ± 0.0018 −0.0466 ± 0.0022 −0.0745 ± 0.0045
1 - 1.5 0.1793 ± 0.0149 0.1435 ± 0.0128 0.0776 ± 0.0085 −0.0054 ± 0.0024 −0.0831 ± 0.0042 −0.1301 ± 0.0081
1.5 - 2 0.2376 ± 0.0178 0.1892 ± 0.0152 0.0999 ± 0.0100 −0.0128 ± 0.0025 −0.1186 ± 0.0057 −0.1825 ± 0.0105
2 - 3 0.2814 ± 0.0194 0.2233 ± 0.0166 0.1159 ± 0.0108 −0.0199 ± 0.0024 −0.1473 ± 0.0067 −0.2243 ± 0.0121
4 < p(t)T< 6 GeV/c
0.15 - 0.5 0.0535 ± 0.0047 0.0421 ± 0.0041 0.0213 ± 0.0028 −0.0045 ± 0.0008 −0.0284 ± 0.0013 −0.0427 ± 0.0026
0.5 - 1 0.1073 ± 0.0101 0.0853 ± 0.0088 0.0451 ± 0.0062 −0.0045 ± 0.0025 −0.0502 ± 0.0017 −0.0777 ± 0.0041
1 - 1.5 0.1758 ± 0.0156 0.1390 ± 0.0136 0.0717 ± 0.0095 −0.0115 ± 0.0034 −0.0883 ± 0.0035 −0.1344 ± 0.0074
1.5 - 2 0.2337 ± 0.0186 0.1838 ± 0.0162 0.0928 ± 0.0113 −0.0201 ± 0.0038 −0.1246 ± 0.0048 −0.1872 ± 0.0097
2 - 3 0.2773 ± 0.0202 0.2174 ± 0.0177 0.1080 ± 0.0123 −0.0280 ± 0.0039 −0.1537 ± 0.0057 −0.2291 ± 0.0113
origin in Au+Au collisions just as in p+p and d+Au col-lisions. It is possible that recombination may still be atwork in our trigger particle pT ranges, in such that theparton(s) prior to recombination have already imprintangular correlations related to hard-scatterings [41].
Different sources, such as the recombination [38–40]and jet fragmentation discussed above, will likely give dif-ferent anisotropies to those high pT particles. However,the anisotropy of the trigger particles to be used in back-ground subtraction in Eqs. (1), (2), (4), and (5) shouldstill be the experimentally measured net anisotropy [43],as we have done in this work, irrespective of the differentorigins.
C. Triangular and High-Order Harmonic Flow
Background
In Eq. (1) we have neglected the odd harmonic terms,
such as 2v(a)1 v
(t,R)1 cos(∆φ) and 2v
(a)3 v
(t,R)3 cos(3∆φ).
Due to symmetry at mid-rapidity, the averages of the oddharmonic coefficients v1, v3, and etc. vanish. However,their fluctuations would yield non-vanishing averages of
the products of v(a)1 v
(t)1 and v
(a)3 v
(t)3 , thereby contributing
to the background in the dihadron correlations. If one as-sumes that the amplitude of the v1 (directed flow) fluctu-ations is of the same order of magnitude as the maximumv1 in our pseudorapidity range (which was measured tobe small [44]), then the v1 fluctuation contribution canbe neglected [45, 46]. In the present work we neglect anydirect flow fluctuation effect in our background subtrac-tion. Recent developments in the understanding of initialgeometry fluctuations, however, suggest that v1 fluctua-tion effects (sometimes called rapidity-even v1) may not
9
be small as originally thought [45, 46]. We remark inSec. IVF on the magnitude of the possible v1 fluctuationeffects using preliminary measurements.Note that the possible effect of statistical global mo-
mentum conservation can generate a negative dipolewhich has the same shape as the v1 fluctuation effect.However, the statistical momentum conservation effectis not from v1 fluctuations, but part of the correlationsignal, as same as momentum conservation by any othermechanisms, such as dijet production.Recently, it was argued that the initial fluctuations
in the overlap geometry (spatial distribution of partic-ipating nucleons) may give rise to v3 (triangular flow)fluctuations [47, 48, 51]. It was found from the MonteCarlo Glauber model that the triangularity due to geom-etry fluctuations can be comparable to the magnitude of
the eccentricity which is connected to the elliptic flow.It is thus possible that large triangular flow fluctuationscan arise which would give triangular peaks in the flowbackground [47, 48, 51]. This appears to be the case inthe AMPT (A Multi-Phase Transport) model and theUrQMD (Ultrarelativistic Quantum Molecular Dynam-ics) model studied in Ref. [48] and [51], respectively.
Since the orientation of the triangular overlap shapedue to fluctuations is random relative to the event-planedirection, determined by the elliptic anisotropy, the ef-fect of any triangular flow is independent of the reac-tion plane. In other words, the triangular flow back-
ground would be proportional to 2v(a)3 v
(t,R)3 cos(3∆φ) =
2v(a)3 v
(t)3 cos(3∆φ) independent of φs. With triangular
flow, the flow background of Eq. (1) becomes
dN
d∆φ= B
[
1 + 2v(a)2 v
(t,R)2 cos(2∆φ) + 2v
(a)4 {ψ2}v(t,R)
4 {ψ2} cos(4∆φ) + 2v(a)3 v
(t)3 cos(3∆φ)
]
. (10)
We may estimate the effect of triangular flow fluctua-tions in our correlation measurements. The AMPT andUrQMD models indicate that in the 20-60% centralityrange the triangular flow fluctuation effect is about 10%of the elliptic flow for our trigger and associated pT bins,v23/v
22 ≈ 0.1 [48, 49, 51]. Experimental data on inclu-
sive two-particle correlations at pT > 2 GeV/c indicate aratio of the harmonic coefficients also of the magnitudev23/v
22 ≈ 0.1 within 20-60% centrality [52]. Recent mea-
surements on triangular anisotropy are consistent withthese estimates [53, 54]. This suggests that the mea-sured third harmonic term in the inclusive two-particlecorrelations at low pT may be dominated by triangularflow fluctuations, just as the second harmonic term dom-inated by elliptic flow. As we will show in Sec. IVC,the effect of the triangular flow of this magnitude is rel-
atively small in our dihadron correlation measurementswith high pT trigger particles. Because of the lack ofsystematic measurements of v3 fluctuations and the poorknowledge about nonflow effects in v3 measurements, thepossible contributions from v3 anisotropy is neglected inthe main work of our study of high-pT dihadron corre-lations relative to the EP. Nevertheless, we discuss inSec. IVF the effect of the presently measured v3 on ourdihadron correlation results.
So far only the v4 contribution correlated with the sec-ond harmonic plane ψ2 has been considered as in Eq. (1).This part of v4 is referred to v4{ψ2}. The other part ofv4 arises from fluctuations and is uncorrelated to ψEP.We refer to this part as V4{uc}. The flow background isthen given by
dN
d∆φ= B
[
1 + 2v(a)2 v
(t,R)2 cos(2∆φ) + 2v
(a)4 {ψ2}v(t,R)
4 {ψ2} cos(4∆φ) + 2v(a)3 v
(t)3 cos(3∆φ) + 2V4{uc} cos(4∆φ)
]
.
(11)
Section IVF discusses how V4{uc} is obtained in thepresent analysis.
Glauber model calculations also show that the quad-rangularity, pentagonality, and hexagonality due to ge-ometry fluctuations equal to the triangularity, all largeand comparable to the eccentricity. However, it was sug-gested that those higher order eccentricities were inef-ficient to generate sizeable high-order harmonic flow infinal state momentum space [49]. Experimental data also
indicate that the magnitudes and fluctuations of v4 andv6 are small relative to the magnitude of v2 [55]. Further-more, there is no evidence of a large v24 , v
25 , or v
26 contribu-
tion in two-particle correlation measurements [10, 13, 14].Although we include V4{uc} in our flow background ofEq. (11), the effect of V4{uc} is small as will be discussedin Sec. IVF. It is safe to neglect v25 and the higher orderanisotropic fluctuation terms in the flow background ofEq. (1).
10
D. Background Normalization by zyam
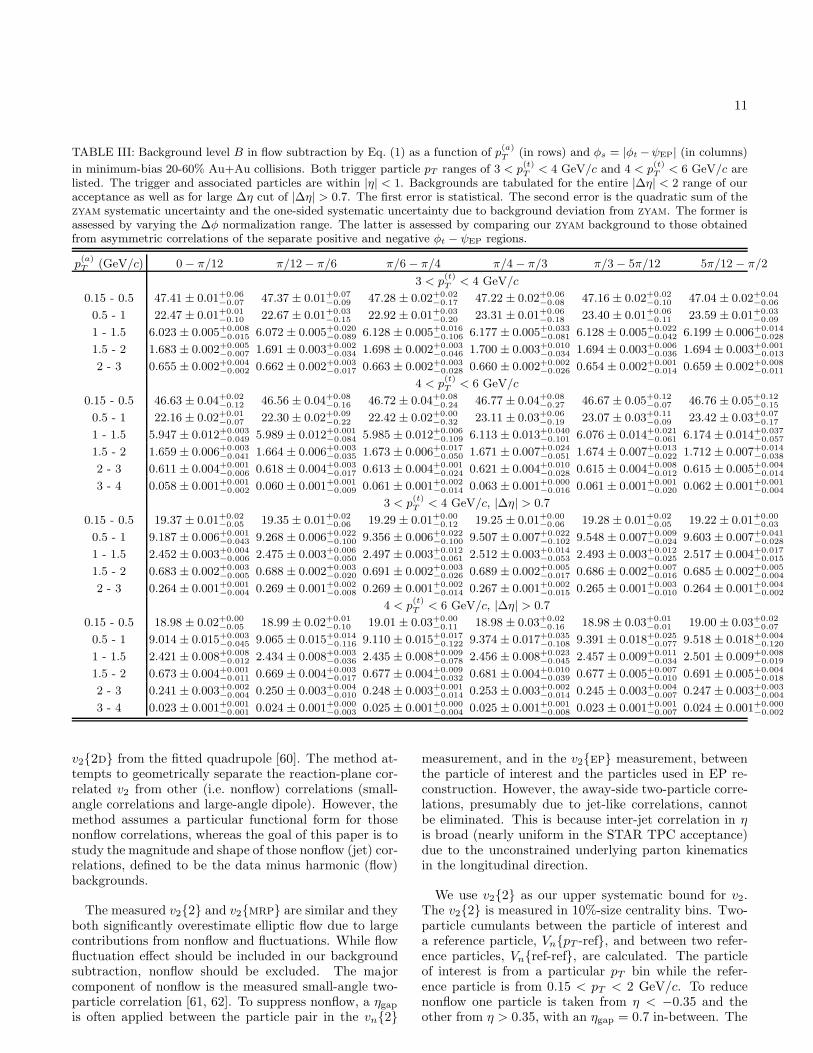
The flow correlated backgrounds given by Eq. (1)are shown in Fig. 3 as solid curves. The back-ground curves have been normalized assuming that thebackground-subtracted signal has Zero Yield At Mini-mum (zyam) [10, 56]. To obtain the zyam normalizationfactor, we fold the raw correlation function to within therange of 0 < ∆φ < π because of the symmetry of thecorrelation function. We take the ratio of the folded rawcorrelation to the background curve of Eq. (1), where Bis set to unity before taking the ratio. We obtain a con-tinuous range of the size of π/6 where the average ratiois the smallest. This smallest average ratio is the nor-malization factor B to be used in the flow background ofEq. (1), which is then subtracted from the raw correlationfunction to obtain the final correlation signal.The background levels can be different for the different
φs slices because of the net effect of the variations injet-quenching with φs and the centrality cuts in totalcharged particle multiplicity in the TPC within |η| < 0.5.Thus, in our correlation analysis, the background level Bis treated independently in individual φs slices.Table III lists the obtained background level B as a
function of φs and p(a)T in 20-60% Au+Au collisions. Re-
sults from both trigger particle pT ranges of 3 < p(t)T <
4 GeV/c and 4 < p(t)T < 6 GeV/c are listed. The back-
ground levels listed are not only for the correlation func-tions with the |∆η| < 2 region within our acceptance, butalso for those in the large ∆η region of |∆η| > 0.7. Thelatter is used for the ridge studies (see Sec. IVC). Onenotices that the background level for the lower trigger
particle p(t)T range is slightly larger. This is due to the
fact that relatively more events contain multiple jets with
the lower trigger particle p(t)T and those events are used
multiple times in our di-hadron correlation analysis [13].It is worthwhile to emphasize here that our quantita-
tive results depend on the assumption of the zyam back-ground normalization. However, as will be discussed inSec. III E, our qualitative conclusions are not affected bythe zyam normalization.
III. SYSTEMATIC UNCERTAINTIES
Background subtraction is the major source of sys-tematic uncertainty in our results. The background,as given by Eq. (1), has three important ingredients:the anisotropic flow measurements v2 and v4, the event-plane resolutions, and the background magnitude B. Wediscuss these systematic uncertainties in Sections III A-IIID, respectively. They have effects on dihadron cor-relation functions presented in Sec. IVA and away-sidecorrelation widths and magnitudes presented in IVB.We also report results on near-side jet-like and ridge
correlations in Sec. IVC. Uncertainties in v2 and thezyam background normalization contribute to the un-
certainties in the ridge correlation results. They donot affect the jet-like correlation results in which theylargely cancel because v2 is approximately independent ofpseudo-rapidity within our acceptance. Additional sys-tematic uncertainties arise from the assumption of a uni-form ridge in ∆η, which affects both the ridge and jet-like results. These additional systematic uncertaintiesare discussed in Sec. III F.
A. Systematic Uncertainty due to Anisotropic Flow
The anisotropic flow (mainly elliptic flow) backgroundwhich is to be subtracted from the dihadron correla-tion is the anisotropy caused by particle correlations tothe participant plane [57, 58]. There are several mea-surements of elliptic flow; many of them are affectedto various degrees by nonflow contributions that arecaused by particle correlations unrelated to the reactionplane (or participant plane), such as resonance decaysand jet-correlations. One technique, called the event-plane method, is to construct the event plane from allcharged particles except those of interest and then calcu-late v2{ep}= 〈cos 2(φ−ψEP)〉/〈cos 2∆ψ〉 for the particlesof interest, where 〈cos 2∆ψ〉 is the event-plane resolu-tion [32]. This method is affected by nonflow contribu-tions in both sets of particles, those of interest and thoseused to construct the event plane. The v2{ep} alreadycontains flow fluctuation effects which should be includedin the jet-correlation background.Another method, called the two-particle method, is to
calculate v2{2} =√
〈cos 2∆φ〉 using all particle pairs ofinterest [32]. This method is affected by nonflow onlyin the interested particles used for correlation studies.This flow parameter also contains flow fluctuation ef-fects. The two-particle cumulant method can be alsoapplied between the particle of interest and a referenceparticle. The anisotropy of the particle of interest is thenthe ratio of the two-particle cumulant to the anisotropyof the reference particles, which can be in turn obtainedfrom the two-particle cumulant between reference par-ticle pairs. (More details are given in Sec. IVF.) Thismethod of mixed pair cumulant is intrinsically similar tothe event-plane method.The third method, called the four-particle method, is
to obtain v2{4} from the four-particle cumulant [59].This method is less affected by nonflow from particleclustering because the nonflow arising from two parti-cle correlations is eliminated, and the nonflow from threeparticle correlations does not contribute. This methodis subject to nonflow from higher orders (four-particlecorrelation and above) but those contributions are sup-pressed by high orders of multiplicity [59]. The flow fluc-tuation will give a negative contribution to v2{4}. [59]The fourth method is to decompose the low pT two-
particle correlation (the so-called untriggered correlation,without the requirement of a trigger particle) into a near-angle Gaussian, a dipole, and a quadrupole, and infer
11
TABLE III: Background level B in flow subtraction by Eq. (1) as a function of p(a)T
(in rows) and φs = |φt −ψEP| (in columns)
in minimum-bias 20-60% Au+Au collisions. Both trigger particle pT ranges of 3 < p(t)T< 4 GeV/c and 4 < p
(t)T< 6 GeV/c are
listed. The trigger and associated particles are within |η| < 1. Backgrounds are tabulated for the entire |∆η| < 2 range of ouracceptance as well as for large ∆η cut of |∆η| > 0.7. The first error is statistical. The second error is the quadratic sum of thezyam systematic uncertainty and the one-sided systematic uncertainty due to background deviation from zyam. The former isassessed by varying the ∆φ normalization range. The latter is assessed by comparing our zyam background to those obtainedfrom asymmetric correlations of the separate positive and negative φt − ψEP regions.
p(a)T (GeV/c) 0− π/12 π/12− π/6 π/6− π/4 π/4− π/3 π/3− 5π/12 5π/12− π/2
3 < p(t)T < 4 GeV/c
0.15 - 0.5 47.41 ± 0.01+0.06−0.07 47.37 ± 0.01+0.07
−0.09 47.28 ± 0.02+0.02−0.17 47.22 ± 0.02+0.06
−0.08 47.16 ± 0.02+0.02−0.10 47.04 ± 0.02+0.04
−0.06
0.5 - 1 22.47 ± 0.01+0.01−0.10 22.67 ± 0.01+0.03
−0.15 22.92 ± 0.01+0.03−0.20 23.31 ± 0.01+0.06
−0.18 23.40 ± 0.01+0.06−0.11 23.59 ± 0.01+0.03
−0.09
1 - 1.5 6.023 ± 0.005+0.008−0.015 6.072 ± 0.005+0.020
−0.089 6.128 ± 0.005+0.016−0.106 6.177 ± 0.005+0.033
−0.081 6.128 ± 0.005+0.022−0.042 6.199 ± 0.006+0.014
−0.028
1.5 - 2 1.683 ± 0.002+0.005−0.007 1.691 ± 0.003+0.002
−0.034 1.698 ± 0.002+0.003−0.046 1.700 ± 0.003+0.010
−0.034 1.694 ± 0.003+0.006−0.036 1.694 ± 0.003+0.001
−0.013
2 - 3 0.655 ± 0.002+0.004−0.002 0.662 ± 0.002+0.003
−0.017 0.663 ± 0.002+0.003−0.028 0.660 ± 0.002+0.002
−0.026 0.654 ± 0.002+0.001−0.014 0.659 ± 0.002+0.008
−0.011
4 < p(t)T< 6 GeV/c
0.15 - 0.5 46.63 ± 0.04+0.02−0.12 46.56 ± 0.04+0.08
−0.16 46.72 ± 0.04+0.08−0.24 46.77 ± 0.04+0.08
−0.27 46.67 ± 0.05+0.12−0.07 46.76 ± 0.05+0.12
−0.15
0.5 - 1 22.16 ± 0.02+0.01−0.07 22.30 ± 0.02+0.09
−0.22 22.42 ± 0.02+0.00−0.32 23.11 ± 0.03+0.06
−0.19 23.07 ± 0.03+0.11−0.09 23.42 ± 0.03+0.07
−0.17
1 - 1.5 5.947 ± 0.012+0.003−0.049 5.989 ± 0.012+0.001
−0.084 5.985 ± 0.012+0.006−0.109 6.113 ± 0.013+0.040
−0.101 6.076 ± 0.014+0.021−0.061 6.174 ± 0.014+0.037
−0.057
1.5 - 2 1.659 ± 0.006+0.003−0.041 1.664 ± 0.006+0.003
−0.035 1.673 ± 0.006+0.017−0.050 1.671 ± 0.007+0.024
−0.051 1.674 ± 0.007+0.013−0.022 1.712 ± 0.007+0.014
−0.038
2 - 3 0.611 ± 0.004+0.001−0.006 0.618 ± 0.004+0.003
−0.017 0.613 ± 0.004+0.001−0.024 0.621 ± 0.004+0.010
−0.028 0.615 ± 0.004+0.008−0.012 0.615 ± 0.005+0.004
−0.014
3 - 4 0.058 ± 0.001+0.001−0.002 0.060 ± 0.001+0.001
−0.009 0.061 ± 0.001+0.002−0.014 0.063 ± 0.001+0.000
−0.016 0.061 ± 0.001+0.001−0.020 0.062 ± 0.001+0.001
−0.004
3 < p(t)T< 4 GeV/c, |∆η| > 0.7
0.15 - 0.5 19.37 ± 0.01+0.02−0.05 19.35 ± 0.01+0.02
−0.06 19.29 ± 0.01+0.00−0.12 19.25 ± 0.01+0.00
−0.06 19.28 ± 0.01+0.02−0.05 19.22 ± 0.01+0.00
−0.03
0.5 - 1 9.187 ± 0.006+0.001−0.043 9.268 ± 0.006+0.022
−0.100 9.356 ± 0.006+0.022−0.100 9.507 ± 0.007+0.022
−0.102 9.548 ± 0.007+0.009−0.024 9.603 ± 0.007+0.041
−0.028
1 - 1.5 2.452 ± 0.003+0.004−0.006 2.475 ± 0.003+0.006
−0.050 2.497 ± 0.003+0.012−0.061 2.512 ± 0.003+0.014
−0.053 2.493 ± 0.003+0.012−0.025 2.517 ± 0.004+0.017
−0.015
1.5 - 2 0.683 ± 0.002+0.003−0.005 0.688 ± 0.002+0.003
−0.020 0.691 ± 0.002+0.003−0.026 0.689 ± 0.002+0.005
−0.017 0.686 ± 0.002+0.007−0.016 0.685 ± 0.002+0.005
−0.004
2 - 3 0.264 ± 0.001+0.001−0.004 0.269 ± 0.001+0.002
−0.008 0.269 ± 0.001+0.002−0.014 0.267 ± 0.001+0.002
−0.015 0.265 ± 0.001+0.003−0.010 0.264 ± 0.001+0.004
−0.002
4 < p(t)T < 6 GeV/c, |∆η| > 0.7
0.15 - 0.5 18.98 ± 0.02+0.00−0.05 18.99 ± 0.02+0.01
−0.10 19.01 ± 0.03+0.00−0.11 18.98 ± 0.03+0.02
−0.16 18.98 ± 0.03+0.01−0.01 19.00 ± 0.03+0.02
−0.07
0.5 - 1 9.014 ± 0.015+0.003−0.045 9.065 ± 0.015+0.014
−0.116 9.110 ± 0.015+0.017−0.122 9.374 ± 0.017+0.035
−0.108 9.391 ± 0.018+0.025−0.077 9.518 ± 0.018+0.004
−0.120
1 - 1.5 2.421 ± 0.008+0.008−0.012 2.434 ± 0.008+0.003
−0.036 2.435 ± 0.008+0.009−0.078 2.456 ± 0.008+0.023
−0.045 2.457 ± 0.009+0.011−0.034 2.501 ± 0.009+0.008
−0.019
1.5 - 2 0.673 ± 0.004+0.001−0.011 0.669 ± 0.004+0.003
−0.017 0.677 ± 0.004+0.009−0.032 0.681 ± 0.004+0.010
−0.039 0.677 ± 0.005+0.007−0.010 0.691 ± 0.005+0.004
−0.018
2 - 3 0.241 ± 0.003+0.002−0.004 0.250 ± 0.003+0.004
−0.010 0.248 ± 0.003+0.001−0.014 0.253 ± 0.003+0.002
−0.014 0.245 ± 0.003+0.004−0.007 0.247 ± 0.003+0.003
−0.004
3 - 4 0.023 ± 0.001+0.001−0.001 0.024 ± 0.001+0.000
−0.003 0.025 ± 0.001+0.000−0.004 0.025 ± 0.001+0.001
−0.008 0.023 ± 0.001+0.001−0.007 0.024 ± 0.001+0.000
−0.002
v2{2d} from the fitted quadrupole [60]. The method at-tempts to geometrically separate the reaction-plane cor-related v2 from other (i.e. nonflow) correlations (small-angle correlations and large-angle dipole). However, themethod assumes a particular functional form for thosenonflow correlations, whereas the goal of this paper is tostudy the magnitude and shape of those nonflow (jet) cor-relations, defined to be the data minus harmonic (flow)backgrounds.
The measured v2{2} and v2{mrp} are similar and theyboth significantly overestimate elliptic flow due to largecontributions from nonflow and fluctuations. While flowfluctuation effect should be included in our backgroundsubtraction, nonflow should be excluded. The majorcomponent of nonflow is the measured small-angle two-particle correlation [61, 62]. To suppress nonflow, a ηgapis often applied between the particle pair in the vn{2}
measurement, and in the v2{ep} measurement, betweenthe particle of interest and the particles used in EP re-construction. However, the away-side two-particle corre-lations, presumably due to jet-like correlations, cannotbe eliminated. This is because inter-jet correlation in ηis broad (nearly uniform in the STAR TPC acceptance)due to the unconstrained underlying parton kinematicsin the longitudinal direction.
We use v2{2} as our upper systematic bound for v2.The v2{2} is measured in 10%-size centrality bins. Two-particle cumulants between the particle of interest anda reference particle, Vn{pT -ref}, and between two refer-ence particles, Vn{ref-ref}, are calculated. The particleof interest is from a particular pT bin while the refer-ence particle is from 0.15 < pT < 2 GeV/c. To reducenonflow one particle is taken from η < −0.35 and theother from η > 0.35, with an ηgap = 0.7 in-between. The
12
vn are referred to as vn{2, ηgap=0.7} or simply as vn{2}.The cumulants are calculated by the Q-cumulant methodand divided by the corresponding number of pairs in eachevent. The cumulants are averaged over the event samplewith a unit weight (not weighted by the number of pairs).The anisotropy of the particle of interest is simply givenby
vn{2}(pT ) =Vn{pT -ref, ηgap=0.7}
√
Vn{ref-ref, ηgap=0.7}. (12)
The vn{2} of the four individual centralities are averagedby weighting each centrality by the number of particlesof interest.The measured v2{4} likely underestimates elliptic flow
because the flow fluctuation effect in v2{4} is nega-tive [59]. We note that v2{4} may still contain some non-flow effects. However, the agreement between v2{4} andthe elliptic flow measurement using the Lee-Yang-Zeromethod suggests that such nonflow effects are small [63].We therefore use v2{4} as our lower bound of v2 system-atic uncertainty, as same as in Refs. [10, 13]. The v2{4} isobtained as follows. Two four-particle cumulants are cal-culated. One is for quadralets of one particle of interestand three reference particles, referred to as V2{pT -ref3}.The other is for quadralets of four reference particles, re-ferred to as V2{ref4}. Since nonflow is negligible in vn{4},no ηgap is applied; all four particles are from the entire re-gion of |η| < 1. Similar to v2{2}, the Q-cumulant methodis used to calculate v2{4}. Self-correlations are properlyremoved. The four-particle anisotropy of the particle ofinterest is given by
v2{4}(pT ) = V2{pT -ref3}/(V2{ref4})3/4 . (13)
Again the v2{4}(pT ) of the four individual centralitiesare averaged by weighting each centrality by the numberof particles of interest.As the default v2, we use the average
v2 = (v2{2}+ v2{4})/2 . (14)
We use the range bracketed by v2{2} and v2{4} as oursystematic uncertainty on v2. Table I lists the default v2values together with systematic uncertainties for differentpT bins in 20-60% Au+Au collisions.We parameterized the v4 measurement [33] as
v4{ψ2} = 1.15v22 , (15)
and used this parameterization for both trigger and as-sociated particles in our flow correction [21]. The un-certainties in v2 are propagated to v4. Note that the v4fluctuation effects related to the second harmonic eventplane, which should be included in our flow background,are already included in the v4 measurement which wascarried out with respect to the second harmonic eventplane [33, 55]. Fluctuations in v4 related to the fourthharmonic event plane could be potentially not small [55]and are not included in the available measurement of
v4, however, these fluctuation effects come into our two-particle correlation background as v24 (not through thecross-term of v2v4) and are therefore negligible for ourcentrality range. Nevertheless, in Sec. IVF, we also in-clude this fluctuation effect in flow subtraction.The flow backgrounds are shown by the solid curves in
Fig. 3. The systematic uncertainties due to anisotropicflow parameters are shown by the dashed curves. Thenormalization of each background curve is adjusted byzyam to match the raw correlation function such thatthe background-subtracted correlation is zero at mini-mum (see Sec. II D). As seen from the figures, the dashedcurves are not symmetric about the solid curve. This ismainly due to the zyam normalization as the normaliza-tion region is around ∆φ ≈ ±1, not at ±π/2.The coefficient v
(a)2 v
(t,R)2 in Eq. (1) determines the size
of the modulation in the flow background. These coeffi-cients are tabulated in Table II. For in-plane trigger parti-
cles, v(t,R)2 is positive as given by Eq. (2) or (4). The cor-
related elliptic flow uncertainties in v(a)2 and v
(t,R)2 gives
a large uncertainty in v(a)2 v
(t,R)2 . For out-of-plane trig-
ger particles, however, v(t,R)2 is negative. The correlated
uncertainty in v(a)2 and v
(t,R)2 tends to cancel each other,
resulting in a small uncertainty in v(a)2 v
(t,R)2 . This is ap-
parent in the systematic uncertaities listed in Table II. Itis shown in the systematic uncertainty background curvesin Fig. 3, where the uncertainty for in-plane correlationsis large, while for out-of-plane correlations it is small.
B. Systematic Uncertainty due to Event-Plane
Resolution
The event-plane resolutions enter into the flow back-ground modulation together with the anisotropic flow pa-rameters, via vn〈cos(k∆ψ)〉. Terms with k = n are notaffected by uncertainties in the event-plane resolutions,because vn〈cos(n∆ψ)〉 are the measured anisotropic flowparameters. The event-plane resolutions 〈cos(k∆ψ)〉 ofdifferent k’s are likely correlated, hence the uncertaintyin vn〈cos(k∆ψ)〉 for k 6= n due to uncertainties in the res-olutions may be greatly reduced. To be conservative, weassume the uncertainties in the event-plane resolutionsto be uncorrelated in our estimation of their effects onour correlation results.The systematic uncertainty of the event-plane resolu-
tion was determined by repeating the sub-event method,but splitting the particles by charge instead of by ran-dom determination, as done in the default case. Theyare also assessed by comparing the event-plane resolutionfrom triggered events only (default) to inclusive events,and by applying a weighting of the number of triggerparticles (default) and not applying this weighting. Inaddition, differences in event-plane resolutions are as-sessed with (default) and without event-plane flatteningby weighting of the inverse of φ-dependent efficiencies.The event-plane resolution uncertainties thus estimated
13
are typically less than 1% for 〈cos(2∆ψ)〉, and less than2-3% for 〈cos(4∆ψ)〉 and 〈cos(6∆ψ)〉.The effects of the estimated event-plane resolution un-
certainties on the final background-subtracted correla-tion functions are significantly smaller than those causedby the uncertainties on anisotropic flow, and are thereforeneglected.
C. Effect of Finite Centrality Bin Width
For the data reported in this paper, the entire 20-60%Au+Au centrality range is treated as a single central-ity bin in which the event-plane resolutions and ellip-tic flow are obtained and the azimuthal correlation isanalyzed. Alternatively, the analysis was repeated ineach of the four 10%-size centrality bins using the cor-responding event-plane resolutions and the elliptic flowmeasurements. Those correlation results are added to-gether, weighted by the number of trigger particles ineach centrality bin. The recombined results are consis-tent with using a single 20-60% centrality bin, well withinthe systematic uncertainties due to those in flow sub-traction and zyam normalization. This is because themeasured elliptic flow v2 is fairly constant over the entire
20-60% centrality range, so that 〈v(t)2 v(a)2 〉 ≈ 〈v(t)2 〉〈v(a)2 〉.
The event-plane resolutions vary with centrality mainlydue to the multiplicity change. However, the event-planeresolutions enter into the flow background of Eq. (1) lin-early, and because the high pT trigger particle multiplic-ity scales almost linearly with the total multiplicity, theeffect of the centrality-varying event-plane resolution isminimal in the flow correction calculated from the single20-60% centrality bin or summed from multiple narrowercentrality bins.
D. Systematic Uncertainty due to zyam
Background Normalization
Naively one would expect the background level B inEq. (1) to be the same for all φs slices because the un-derlying background should not depend on the signal (ororientation of the trigger particle). However, there couldbe biases in the event samples with trigger particles atdifferent φs such that they contain slightly different un-derlying background multiplicities due to the possible dif-ference in jet-like correlated multiplicities at different φsand the overall constraints caused by centrality cuts onthe reference multiplicity. In our analysis we use differ-ent B values for different φs slices, each independentlyobtained using zyam on the correlation function of thecorresponding slice.One source of systematic uncertainty on B is due to the
limited range in ∆φ where the background-subtractedcorrelations appear to have a minimum ‘plateau’. Thispart of the systematic uncertainty is assessed by varying
the size of the normalization range in ∆φ between π/12and π/4 (default range is π/6), similarly to Ref. [10].The zyam assumption likely gives an upper limit to
the underlying background level. One could make animproved assessment of the background level with morestringent requirements, such as using three-particle corre-lation zyam [21]. However, the analysis of three-particlecorrelation within a limited φs range of the trigger par-ticle is difficult.In this paper, we assess this part of the systematic un-
certainty on B by comparing to the zyam backgroundsobtained separately from correlation functions at posi-tive φt −ψEP and negative φt −ψEP. Those zyam back-grounds are always lower than our default B from zyam
of the combined correlation function of positive and neg-ative φt − ψEP. This is because the separately analyzedcorrelation functions are asymmetric about ∆φ = 0 and∆φ = π, and the zyam is determined by only one sideof the correlation function [64, 65], whereas in our com-bined correlation functions reported here, the two sides ofthe separately analyzed asymmetric correlation functionsare averaged. We treat the difference between the zyam
background from this paper and that obtained from theasymmetric correlation functions as an additional, one-sided systematic uncertainty on B.We may also study the background level by fitting the
zyam-background-subtracted correlation functions witha combination of Gaussians and a free parameter for anoffset from zero. Specifically we fit the correlation datato three Gaussians (a near-side Gaussian at ∆φ = 0 andtwo away-side Gaussians symmetric about ∆φ = π), andfour Gaussians (adding a fourth Gaussian at ∆φ = πwith the same width as the near-side Gaussian). Someof the fits yielded unphysical offsets because of the limitedconstraint of the correlation data on the fit model. Forthe other fits, the fitted offsets are comparable to thesystematic uncertainty obtained from the comparisonsto the asymmetric correlation functions discussed above.The Gaussian fits to the correlation functions withoutthe offset will be discussed in Sec. IVE.The different sources of systematic uncertainties on B
are added in quadrature. The total systematic uncer-tainty is listed in Table III together with the statisticaluncertainty. We take the quadratic sum of the statisticaland systematic uncertainties as the total uncertainty forB on our correlation results.
E. Is the Away-Side Double-Peak an Artifact of
zyam?
As will be shown in IVA, the background-subtractedcorrelation functions on the away side are single-peakedat ∆φ = π for triggered particles in-plane, but double-peaked for trigger particles out-of-plane beyond theflow systematic uncertainties. Since the subtractedbackground is flow-modulated, the natural question iswhether the away-side double-peak structure is due to
14
an unrealistic systematic uncertainty. To address thisquestion, it is worthwhile to note that the flow back-ground modulation changes phase when the trigger par-ticle moves from in-plane to out-of-plane, as shown inFig. 3. A smaller elliptic flow would make the in-planecorrelation more peaked at ∆φ = 0 and π and the out-of-plane correlation more dipped at π (hence more doublepeaked on the away side). On the other hand, a largerelliptic flow would make the out-of-plane away-side corre-lation less double-peaked. One would need a ∼15% larger
v(a)2 v
(t,R)2 than in Table II, significantly beyond the sys-
tematic uncertainty from the anisotropy measurements,to eliminate the away-side double-peak for the out-of-
plane φs slice. However, this large v(a)2 v
(t,R)2 would result
in double-peaked away-side correlations for some of theother φs slices.The background magnitude affects the absolute mag-
nitude of the flow modulation subtracted from the rawdata in obtaining the correlation signal. Since the back-ground normalization is determined by the zyam descrip-tion, the question arises whether the away-side double-peak for the out-of-plane φs slices is an artifact of a sig-nificantly smaller background level than zyam beyondthe zyam normalization systematic uncertainty. The an-swer is negative because the flow background is the lowestat ∆φ = π for out-of-plane trigger particles. Allowinga non-zero flow-modulated “pedestal” into the correla-tion signal will exaggerate the double-peak feature, i.e.,the dip at ∆φ = π will be even deeper than the doublepeaks. In other words, if the true background is lowerthan zyam, then the away-side correlation functions forout-of-plane trigger particles will be more double-peaked.Only when the background is larger than zyam would thedihadron correlation signal become single-peaked; how-ever, as a result the signal strength would become nega-tive.In summary, to eliminate the away-side double-peak,
one needs either a larger anisotropic flow than measuredwhile fixing the background normalization by zyam, ora larger background normalization than zyam while fix-ing the anisotropic flow as measured. To investigate fur-ther the interplay between background normalization andanisotropic flow and its effect on the dihadron correlationsignal, we performed a study of free fits to the raw cor-relation data, treating the anisotropic flow and the back-ground magnitude as free parameters. In order to do so,one needs a prescription for the correlation signal func-tional form. It has been shown that the sum of a near-sideGaussian, a negative dipole, and a quadrupole (reflectingelliptic flow) can adequately describe the two-particle az-imuthal correlation at low pT without the requirement ofa high pT trigger particle [61, 62]. Thus, we fit our rawcorrelation data by
dN
d∆φ= B (1 + 2V2 cos 2∆φ+ 2V4 cos 4∆φ) +
Ans exp
(
− (∆φ)2
2σ2ns
)
−Adipole cos∆φ, (16)
treating the flow modulations V2 and V4, the near-sideGaussian parameters Ans and σns, and the negativedipole magnitude Adipole as free parameters. Figure 4(upper panels) shows the fits by Eq. (16) to the raw cor-
relation functions in six φs slices for 3 < p(t)T < 4 GeV/c
and 1 < p(a)T < 2 GeV/c. The fits are shown in the solid
curves. The dashed curves show the fitted flow back-grounds. The lower panels of Fig. 4 show the correlationfunctions after subtracting the fitted flow backgrounds.The fitted near-side Gaussian and the negative dipole aredepicted individually.
As seen from the χ2/ndf written in each upper panel,the fits by Eq. (16) are generally good. This is also
true for the other p(t)T and p
(a)T bins. However, the fit-
ted flow modulations (written in the lower panels) aresignificantly larger than the measured ones for the out-of-plane φs slices, much beyond their systematic uncer-tainties quoted in Table II. In other words, in order toeliminate the away-side double-peak, an anisotropic flowthat is much larger than that measured by two-particlecumulant method is required, consistent with our earlierobservation. Moreover, the deviations of the fitted flowmodulations from the measured ones vary from slice toslice (non-monotonically), which should not be the case ifthe measured flow parameters that we used were simplyin error. Qualitatively the same features are observed for
the other p(t)T and p
(a)T bins. These free fit results suggest
that the near-side Gaussian and the negative dipole inthe fit model of Eq. (16) likely do not correspond to thenonflow dihadron correlation signal sought after in thisanalysis with a high pT trigger particle.We have also used other single-peaked functional
forms, e.g., a near-side Gaussian and an away-side Gaus-sian, in our fit. Similar conclusions were reached. Theaway-side double-peak for the out-of-plane trigger parti-cles cannot be eliminated without using a flow subtrac-tion much larger than experimentally determined, eitherwith or without zyam. Thus, we conclude that the away-side double-peak structure is not an artifact of the zyamflow subtraction procedure used in this analysis.
F. Systematic Uncertainties on Jet-Like and Ridge
Correlations
To obtain the jet-like component we take the differ-ence of the correlation functions from |∆η| < 0.7 and|∆η| > 0.7 (properly weighted by the relative two-particle∆η acceptance). The assumption in this procedure isthat the ridge is uniform in ∆η (after taking into accountthe trivial two-particle ∆η acceptance) and is thereforesubtracted away in the difference [11]. Measurementsat low pT without a trigger particle indicate that theridge is broad but drops with increasing ∆η [66]. If thisis true for trigger particle correlations as studied here,our “jet” measurement contains a residual ridge contri-bution. To estimate this effect, we study ∆η correlation
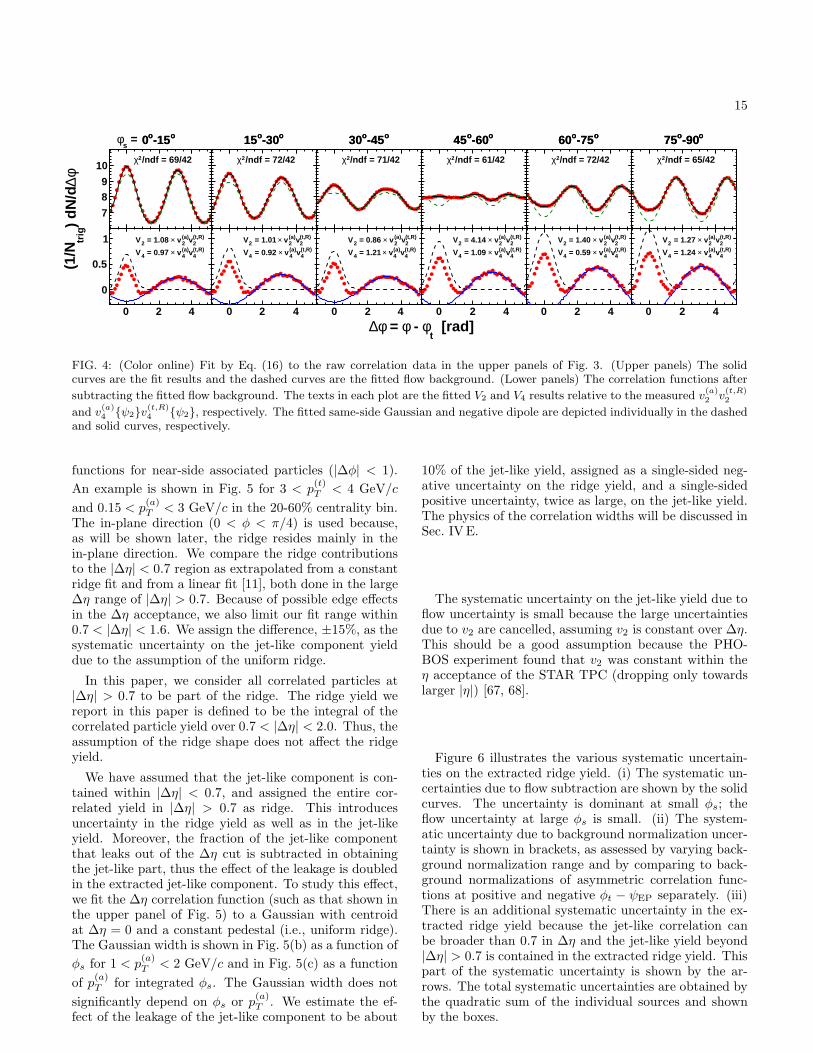
15
o-15o0
7
89
10/ndf = 69/422χ
o-15o0
0 2 4
0
0.5
1 (t,R)2v(a)
2 v× = 1.08 2V(t,R)4v(a)
4 v× = 0.97 4V
o-30o15
7
89
10/ndf = 72/422χ
o-30o15
0 2 4
0
0.5
1 (t,R)2v(a)
2 v× = 1.01 2V(t,R)4v(a)
4 v× = 0.92 4V
o-45o30
7
89
10/ndf = 71/422χ
o-45o30
0 2 4
0
0.5
1 (t,R)2v(a)
2 v× = 0.86 2V(t,R)4v(a)
4 v× = 1.21 4V
o-60o45
7
89
10/ndf = 61/422χ
o-60o45
0 2 4
0
0.5
1 (t,R)2v(a)
2 v× = 4.14 2V(t,R)4v(a)
4 v× = 1.09 4V
o-75o60
7
89
10/ndf = 72/422χ
o-75o60
0 2 4
0
0.5
1 (t,R)2v(a)
2 v× = 1.40 2V(t,R)4v(a)
4 v× = 0.59 4V
o-90o75
7
89
10/ndf = 65/422χ
o-90o75
0 2 4
0
0.5
1 (t,R)2v(a)
2 v× = 1.27 2V(t,R)4v(a)
4 v× = 1.24 4V
=s
φ
[rad]t
φ - φ = φ∆
φ∆)
dN/d
trig
(1/N
FIG. 4: (Color online) Fit by Eq. (16) to the raw correlation data in the upper panels of Fig. 3. (Upper panels) The solidcurves are the fit results and the dashed curves are the fitted flow background. (Lower panels) The correlation functions after
subtracting the fitted flow background. The texts in each plot are the fitted V2 and V4 results relative to the measured v(a)2 v
(t,R)2
and v(a)4 {ψ2}v(t,R)
4 {ψ2}, respectively. The fitted same-side Gaussian and negative dipole are depicted individually in the dashedand solid curves, respectively.
functions for near-side associated particles (|∆φ| < 1).
An example is shown in Fig. 5 for 3 < p(t)T < 4 GeV/c
and 0.15 < p(a)T < 3 GeV/c in the 20-60% centrality bin.
The in-plane direction (0 < φ < π/4) is used because,as will be shown later, the ridge resides mainly in thein-plane direction. We compare the ridge contributionsto the |∆η| < 0.7 region as extrapolated from a constantridge fit and from a linear fit [11], both done in the large∆η range of |∆η| > 0.7. Because of possible edge effectsin the ∆η acceptance, we also limit our fit range within0.7 < |∆η| < 1.6. We assign the difference, ±15%, as thesystematic uncertainty on the jet-like component yielddue to the assumption of the uniform ridge.
In this paper, we consider all correlated particles at|∆η| > 0.7 to be part of the ridge. The ridge yield wereport in this paper is defined to be the integral of thecorrelated particle yield over 0.7 < |∆η| < 2.0. Thus, theassumption of the ridge shape does not affect the ridgeyield.
We have assumed that the jet-like component is con-tained within |∆η| < 0.7, and assigned the entire cor-related yield in |∆η| > 0.7 as ridge. This introducesuncertainty in the ridge yield as well as in the jet-likeyield. Moreover, the fraction of the jet-like componentthat leaks out of the ∆η cut is subtracted in obtainingthe jet-like part, thus the effect of the leakage is doubledin the extracted jet-like component. To study this effect,we fit the ∆η correlation function (such as that shown inthe upper panel of Fig. 5) to a Gaussian with centroidat ∆η = 0 and a constant pedestal (i.e., uniform ridge).The Gaussian width is shown in Fig. 5(b) as a function of
φs for 1 < p(a)T < 2 GeV/c and in Fig. 5(c) as a function
of p(a)T for integrated φs. The Gaussian width does not
significantly depend on φs or p(a)T . We estimate the ef-
fect of the leakage of the jet-like component to be about
10% of the jet-like yield, assigned as a single-sided neg-ative uncertainty on the ridge yield, and a single-sidedpositive uncertainty, twice as large, on the jet-like yield.The physics of the correlation widths will be discussed inSec. IVE.
The systematic uncertainty on the jet-like yield due toflow uncertainty is small because the large uncertaintiesdue to v2 are cancelled, assuming v2 is constant over ∆η.This should be a good assumption because the PHO-BOS experiment found that v2 was constant within theη acceptance of the STAR TPC (dropping only towardslarger |η|) [67, 68].
Figure 6 illustrates the various systematic uncertain-ties on the extracted ridge yield. (i) The systematic un-certainties due to flow subtraction are shown by the solidcurves. The uncertainty is dominant at small φs; theflow uncertainty at large φs is small. (ii) The system-atic uncertainty due to background normalization uncer-tainty is shown in brackets, as assessed by varying back-ground normalization range and by comparing to back-ground normalizations of asymmetric correlation func-tions at positive and negative φt − ψEP separately. (iii)There is an additional systematic uncertainty in the ex-tracted ridge yield because the jet-like correlation canbe broader than 0.7 in ∆η and the jet-like yield beyond|∆η| > 0.7 is contained in the extracted ridge yield. Thispart of the systematic uncertainty is shown by the ar-rows. The total systematic uncertainties are obtained bythe quadratic sum of the individual sources and shownby the boxes.
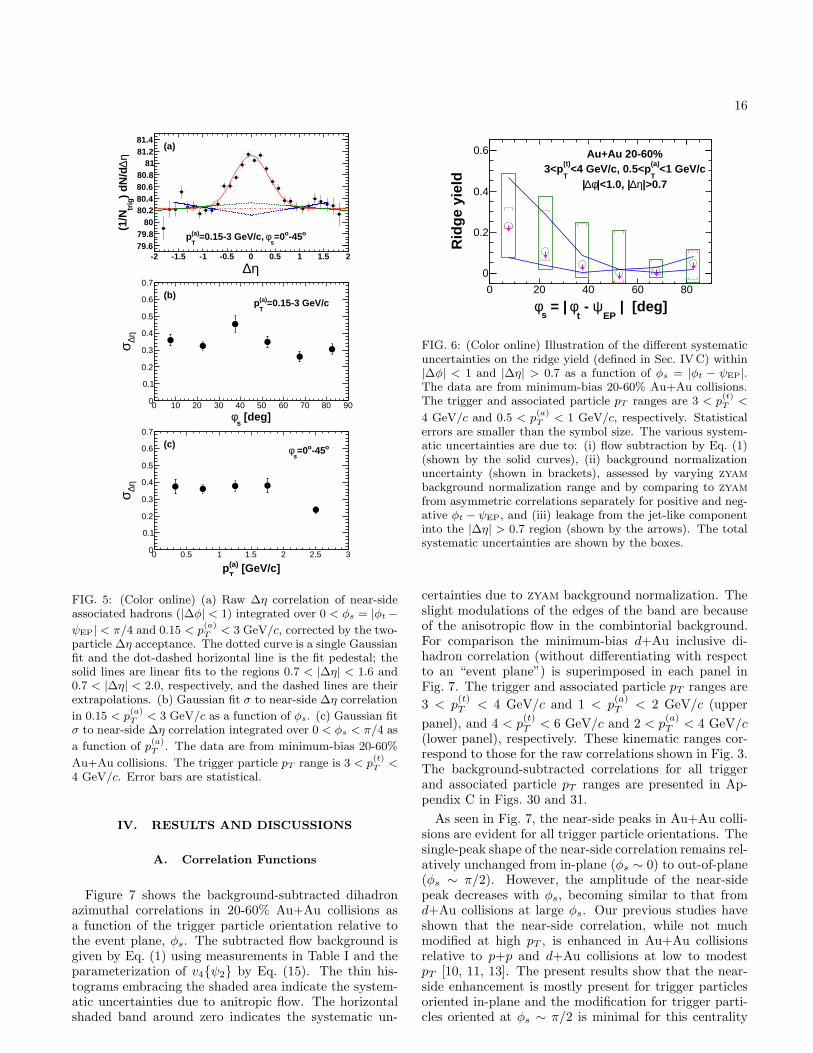
16
-2 -1.5 -1 -0.5 0 0.5 1 1.5 279.679.8
8080.280.480.680.8
8181.281.4
(a)
o-45o=0s
φ=0.15-3 GeV/c, (a)
Tp
η∆
η∆
) dN
/dtr
ig(1
/N
0 10 20 30 40 50 60 70 80 900
0.1
0.2
0.3
0.4
0.5
0.6
0.7
(b)=0.15-3 GeV/c(a)
Tp
[deg]s
φ
η∆σ
0 0.5 1 1.5 2 2.5 30
0.1
0.2
0.3
0.4
0.5
0.6
0.7
(c) o-45o=0s
φ
[GeV/c](a)T
p
η∆σ
FIG. 5: (Color online) (a) Raw ∆η correlation of near-sideassociated hadrons (|∆φ| < 1) integrated over 0 < φs = |φt −ψEP| < π/4 and 0.15 < p
(a)T < 3 GeV/c, corrected by the two-
particle ∆η acceptance. The dotted curve is a single Gaussianfit and the dot-dashed horizontal line is the fit pedestal; thesolid lines are linear fits to the regions 0.7 < |∆η| < 1.6 and0.7 < |∆η| < 2.0, respectively, and the dashed lines are theirextrapolations. (b) Gaussian fit σ to near-side ∆η correlation
in 0.15 < p(a)T
< 3 GeV/c as a function of φs. (c) Gaussian fitσ to near-side ∆η correlation integrated over 0 < φs < π/4 as
a function of p(a)T . The data are from minimum-bias 20-60%
Au+Au collisions. The trigger particle pT range is 3 < p(t)T<
4 GeV/c. Error bars are statistical.
IV. RESULTS AND DISCUSSIONS
A. Correlation Functions
Figure 7 shows the background-subtracted dihadronazimuthal correlations in 20-60% Au+Au collisions asa function of the trigger particle orientation relative tothe event plane, φs. The subtracted flow background isgiven by Eq. (1) using measurements in Table I and theparameterization of v4{ψ2} by Eq. (15). The thin his-tograms embracing the shaded area indicate the system-atic uncertainties due to anitropic flow. The horizontalshaded band around zero indicates the systematic un-
0 20 40 60 80
0
0.2
0.4
0.6 Au+Au 20-60%<1 GeV/c(a)
T<4 GeV/c, 0.5<p(t)
T3<p
|>0.7η∆|<1.0, |φ∆|
Rid
ge y
ield
| [deg]EP
ψ - t
φ = | s
φ
FIG. 6: (Color online) Illustration of the different systematicuncertainties on the ridge yield (defined in Sec. IVC) within|∆φ| < 1 and |∆η| > 0.7 as a function of φs = |φt − ψEP|.The data are from minimum-bias 20-60% Au+Au collisions.The trigger and associated particle pT ranges are 3 < p
(t)T<
4 GeV/c and 0.5 < p(a)T
< 1 GeV/c, respectively. Statisticalerrors are smaller than the symbol size. The various system-atic uncertainties are due to: (i) flow subtraction by Eq. (1)(shown by the solid curves), (ii) background normalizationuncertainty (shown in brackets), assessed by varying zyam
background normalization range and by comparing to zyam
from asymmetric correlations separately for positive and neg-ative φt − ψEP, and (iii) leakage from the jet-like componentinto the |∆η| > 0.7 region (shown by the arrows). The totalsystematic uncertainties are shown by the boxes.
certainties due to zyam background normalization. Theslight modulations of the edges of the band are becauseof the anisotropic flow in the combintorial background.For comparison the minimum-bias d+Au inclusive di-hadron correlation (without differentiating with respectto an “event plane”) is superimposed in each panel inFig. 7. The trigger and associated particle pT ranges are
3 < p(t)T < 4 GeV/c and 1 < p
(a)T < 2 GeV/c (upper
panel), and 4 < p(t)T < 6 GeV/c and 2 < p
(a)T < 4 GeV/c
(lower panel), respectively. These kinematic ranges cor-respond to those for the raw correlations shown in Fig. 3.The background-subtracted correlations for all triggerand associated particle pT ranges are presented in Ap-pendix C in Figs. 30 and 31.
As seen in Fig. 7, the near-side peaks in Au+Au colli-sions are evident for all trigger particle orientations. Thesingle-peak shape of the near-side correlation remains rel-atively unchanged from in-plane (φs ∼ 0) to out-of-plane(φs ∼ π/2). However, the amplitude of the near-sidepeak decreases with φs, becoming similar to that fromd+Au collisions at large φs. Our previous studies haveshown that the near-side correlation, while not muchmodified at high pT , is enhanced in Au+Au collisionsrelative to p+p and d+Au collisions at low to modestpT [10, 11, 13]. The present results show that the near-side enhancement is mostly present for trigger particlesoriented in-plane and the modification for trigger parti-cles oriented at φs ∼ π/2 is minimal for this centrality
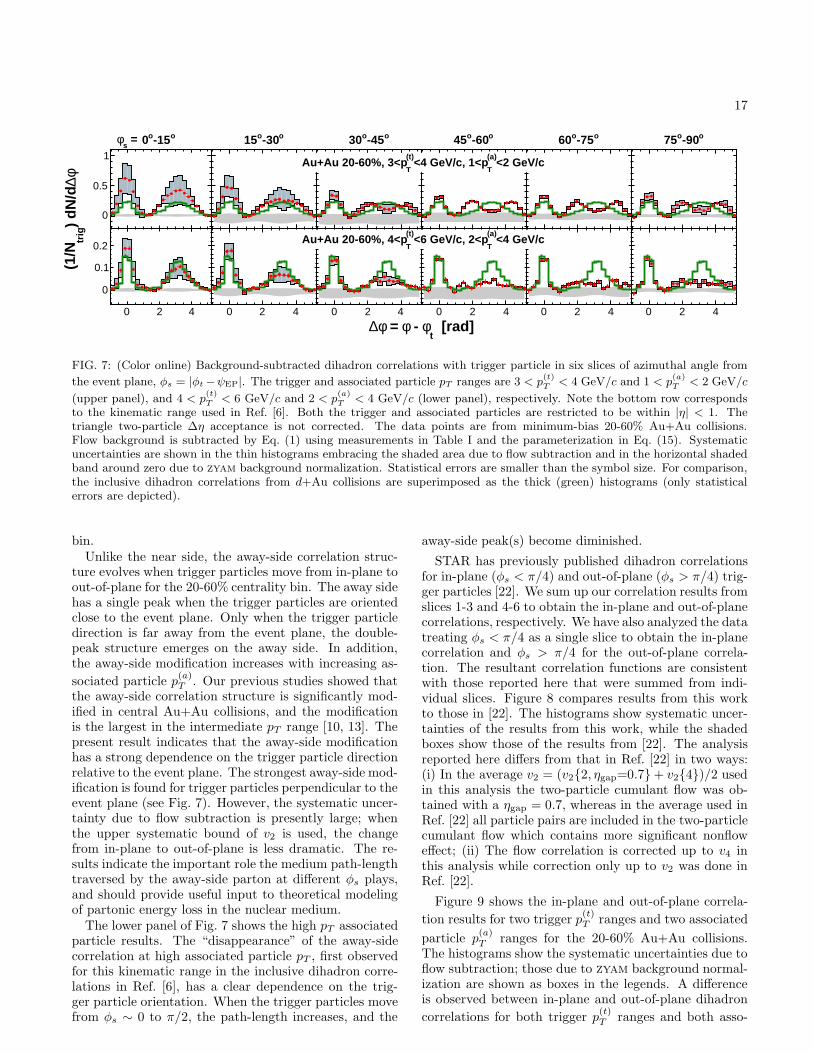
17
o-15o0
0
0.5
1
o-30o15
0
0.5
1
o-45o30
0
0.5
1
o-60o45
0
0.5
1
o-75o60
0
0.5
1
o-90o75
0
0.5
1
0 2 4
0
0.1
0.2
0 2 4
0
0.1
0.2
0 2 4
0
0.1
0.2
0 2 4
0
0.1
0.2
0 2 4
0
0.1
0.2
0 2 4
0
0.1
0.2
=s
φ
[rad]t
φ - φ = φ∆
φ∆)
dN/d
trig
(1/N
<2 GeV/c(a)
T<4 GeV/c, 1<p
(t)
TAu+Au 20-60%, 3<p
<4 GeV/c(a)
T<6 GeV/c, 2<p
(t)
TAu+Au 20-60%, 4<p
FIG. 7: (Color online) Background-subtracted dihadron correlations with trigger particle in six slices of azimuthal angle from
the event plane, φs = |φt−ψEP|. The trigger and associated particle pT ranges are 3 < p(t)T< 4 GeV/c and 1 < p
(a)T
< 2 GeV/c
(upper panel), and 4 < p(t)T < 6 GeV/c and 2 < p
(a)T < 4 GeV/c (lower panel), respectively. Note the bottom row corresponds
to the kinematic range used in Ref. [6]. Both the trigger and associated particles are restricted to be within |η| < 1. Thetriangle two-particle ∆η acceptance is not corrected. The data points are from minimum-bias 20-60% Au+Au collisions.Flow background is subtracted by Eq. (1) using measurements in Table I and the parameterization in Eq. (15). Systematicuncertainties are shown in the thin histograms embracing the shaded area due to flow subtraction and in the horizontal shadedband around zero due to zyam background normalization. Statistical errors are smaller than the symbol size. For comparison,the inclusive dihadron correlations from d+Au collisions are superimposed as the thick (green) histograms (only statisticalerrors are depicted).
bin.Unlike the near side, the away-side correlation struc-
ture evolves when trigger particles move from in-plane toout-of-plane for the 20-60% centrality bin. The away sidehas a single peak when the trigger particles are orientedclose to the event plane. Only when the trigger particledirection is far away from the event plane, the double-peak structure emerges on the away side. In addition,the away-side modification increases with increasing as-
sociated particle p(a)T . Our previous studies showed that
the away-side correlation structure is significantly mod-ified in central Au+Au collisions, and the modificationis the largest in the intermediate pT range [10, 13]. Thepresent result indicates that the away-side modificationhas a strong dependence on the trigger particle directionrelative to the event plane. The strongest away-side mod-ification is found for trigger particles perpendicular to theevent plane (see Fig. 7). However, the systematic uncer-tainty due to flow subtraction is presently large; whenthe upper systematic bound of v2 is used, the changefrom in-plane to out-of-plane is less dramatic. The re-sults indicate the important role the medium path-lengthtraversed by the away-side parton at different φs plays,and should provide useful input to theoretical modelingof partonic energy loss in the nuclear medium.The lower panel of Fig. 7 shows the high pT associated
particle results. The “disappearance” of the away-sidecorrelation at high associated particle pT , first observedfor this kinematic range in the inclusive dihadron corre-lations in Ref. [6], has a clear dependence on the trig-ger particle orientation. When the trigger particles movefrom φs ∼ 0 to π/2, the path-length increases, and the
away-side peak(s) become diminished.
STAR has previously published dihadron correlationsfor in-plane (φs < π/4) and out-of-plane (φs > π/4) trig-ger particles [22]. We sum up our correlation results fromslices 1-3 and 4-6 to obtain the in-plane and out-of-planecorrelations, respectively. We have also analyzed the datatreating φs < π/4 as a single slice to obtain the in-planecorrelation and φs > π/4 for the out-of-plane correla-tion. The resultant correlation functions are consistentwith those reported here that were summed from indi-vidual slices. Figure 8 compares results from this workto those in [22]. The histograms show systematic uncer-tainties of the results from this work, while the shadedboxes show those of the results from [22]. The analysisreported here differs from that in Ref. [22] in two ways:(i) In the average v2 = (v2{2, ηgap=0.7}+ v2{4})/2 usedin this analysis the two-particle cumulant flow was ob-tained with a ηgap = 0.7, whereas in the average used inRef. [22] all particle pairs are included in the two-particlecumulant flow which contains more significant nonfloweffect; (ii) The flow correlation is corrected up to v4 inthis analysis while correction only up to v2 was done inRef. [22].
Figure 9 shows the in-plane and out-of-plane correla-
tion results for two trigger p(t)T ranges and two associated
particle p(a)T ranges for the 20-60% Au+Au collisions.
The histograms show the systematic uncertainties due toflow subtraction; those due to zyam background normal-ization are shown as boxes in the legends. A differenceis observed between in-plane and out-of-plane dihadron
correlations for both trigger p(t)T ranges and both asso-
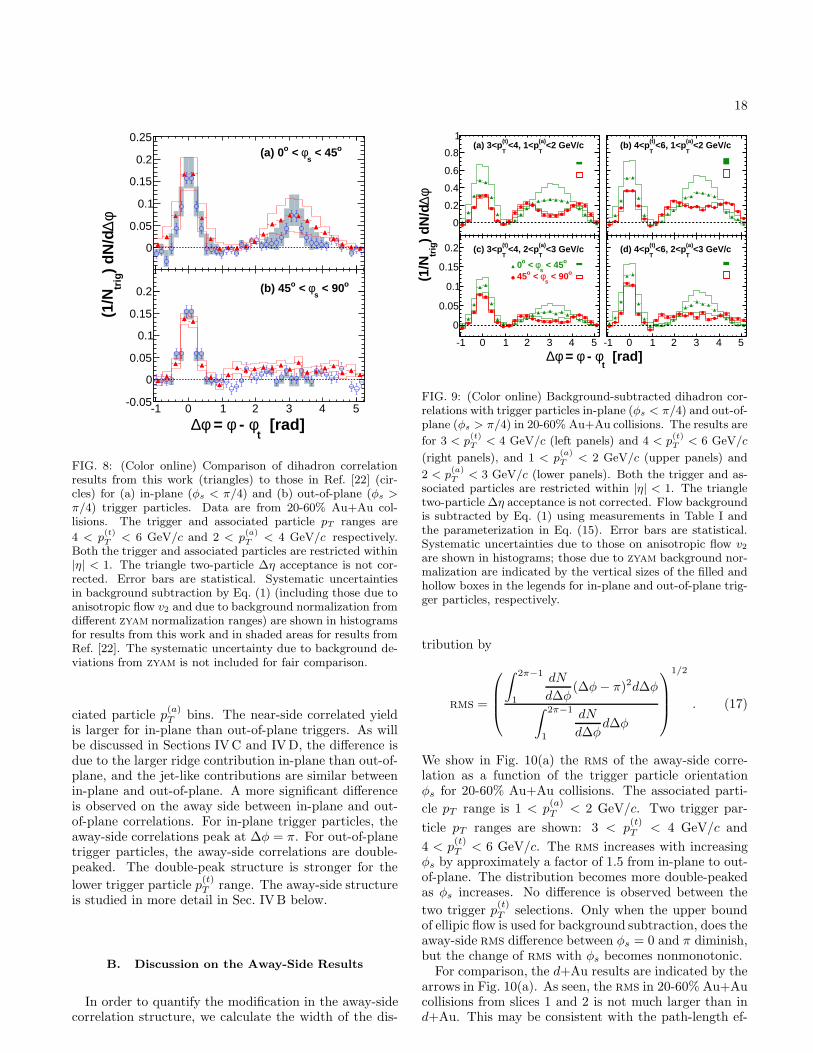
18
-1 0 1 2 3 4 5
0
0.05
0.1
0.15
0.2
0.25o < 45
sφ < o(a) 0
-1 0 1 2 3 4 5-0.05
0
0.05
0.1
0.15
0.2o < 90
sφ < o(b) 45
[rad]t
φ - φ = φ∆
φ∆)
dN/d
trig
(1/N
FIG. 8: (Color online) Comparison of dihadron correlationresults from this work (triangles) to those in Ref. [22] (cir-cles) for (a) in-plane (φs < π/4) and (b) out-of-plane (φs >π/4) trigger particles. Data are from 20-60% Au+Au col-lisions. The trigger and associated particle pT ranges are
4 < p(t)T
< 6 GeV/c and 2 < p(a)T
< 4 GeV/c respectively.Both the trigger and associated particles are restricted within|η| < 1. The triangle two-particle ∆η acceptance is not cor-rected. Error bars are statistical. Systematic uncertaintiesin background subtraction by Eq. (1) (including those due toanisotropic flow v2 and due to background normalization fromdifferent zyam normalization ranges) are shown in histogramsfor results from this work and in shaded areas for results fromRef. [22]. The systematic uncertainty due to background de-viations from zyam is not included for fair comparison.
ciated particle p(a)T bins. The near-side correlated yield
is larger for in-plane than out-of-plane triggers. As willbe discussed in Sections IVC and IVD, the difference isdue to the larger ridge contribution in-plane than out-of-plane, and the jet-like contributions are similar betweenin-plane and out-of-plane. A more significant differenceis observed on the away side between in-plane and out-of-plane correlations. For in-plane trigger particles, theaway-side correlations peak at ∆φ = π. For out-of-planetrigger particles, the away-side correlations are double-peaked. The double-peak structure is stronger for the
lower trigger particle p(t)T range. The away-side structure
is studied in more detail in Sec. IVB below.
B. Discussion on the Away-Side Results
In order to quantify the modification in the away-sidecorrelation structure, we calculate the width of the dis-
-1 0 1 2 3 4 5
0
0.2
0.4
0.6
0.8
1<2 GeV/c(a)
T<4, 1<p(t)
T(a) 3<p
-1 0 1 2 3 4 5
0
0.05
0.1
0.15
0.2 <3 GeV/c(a)
T<4, 2<p(t)
T(c) 3<p
o < 45s
φ < o0o < 90
sφ < o45
-1 0 1 2 3 4 5
<2 GeV/c(a)
T<6, 1<p(t)
T(b) 4<p
-1 0 1 2 3 4 5
<3 GeV/c(a)
T<6, 2<p(t)
T(d) 4<p
φ∆)
dN/d
trig
(1/N
[rad]t
φ - φ = φ∆
FIG. 9: (Color online) Background-subtracted dihadron cor-relations with trigger particles in-plane (φs < π/4) and out-of-plane (φs > π/4) in 20-60% Au+Au collisions. The results are
for 3 < p(t)T< 4 GeV/c (left panels) and 4 < p
(t)T< 6 GeV/c
(right panels), and 1 < p(a)T < 2 GeV/c (upper panels) and
2 < p(a)T
< 3 GeV/c (lower panels). Both the trigger and as-sociated particles are restricted within |η| < 1. The triangletwo-particle ∆η acceptance is not corrected. Flow backgroundis subtracted by Eq. (1) using measurements in Table I andthe parameterization in Eq. (15). Error bars are statistical.Systematic uncertainties due to those on anisotropic flow v2are shown in histograms; those due to zyam background nor-malization are indicated by the vertical sizes of the filled andhollow boxes in the legends for in-plane and out-of-plane trig-ger particles, respectively.
tribution by
rms =
∫ 2π−1
1
dN
d∆φ(∆φ− π)2d∆φ
∫ 2π−1
1
dN
d∆φd∆φ
1/2
. (17)
We show in Fig. 10(a) the rms of the away-side corre-lation as a function of the trigger particle orientationφs for 20-60% Au+Au collisions. The associated parti-
cle pT range is 1 < p(a)T < 2 GeV/c. Two trigger par-
ticle pT ranges are shown: 3 < p(t)T < 4 GeV/c and
4 < p(t)T < 6 GeV/c. The rms increases with increasing
φs by approximately a factor of 1.5 from in-plane to out-of-plane. The distribution becomes more double-peakedas φs increases. No difference is observed between the
two trigger p(t)T selections. Only when the upper bound
of ellipic flow is used for background subtraction, does theaway-side rms difference between φs = 0 and π diminish,but the change of rms with φs becomes nonmonotonic.For comparison, the d+Au results are indicated by the
arrows in Fig. 10(a). As seen, the rms in 20-60% Au+Aucollisions from slices 1 and 2 is not much larger than ind+Au. This may be consistent with the path-length ef-
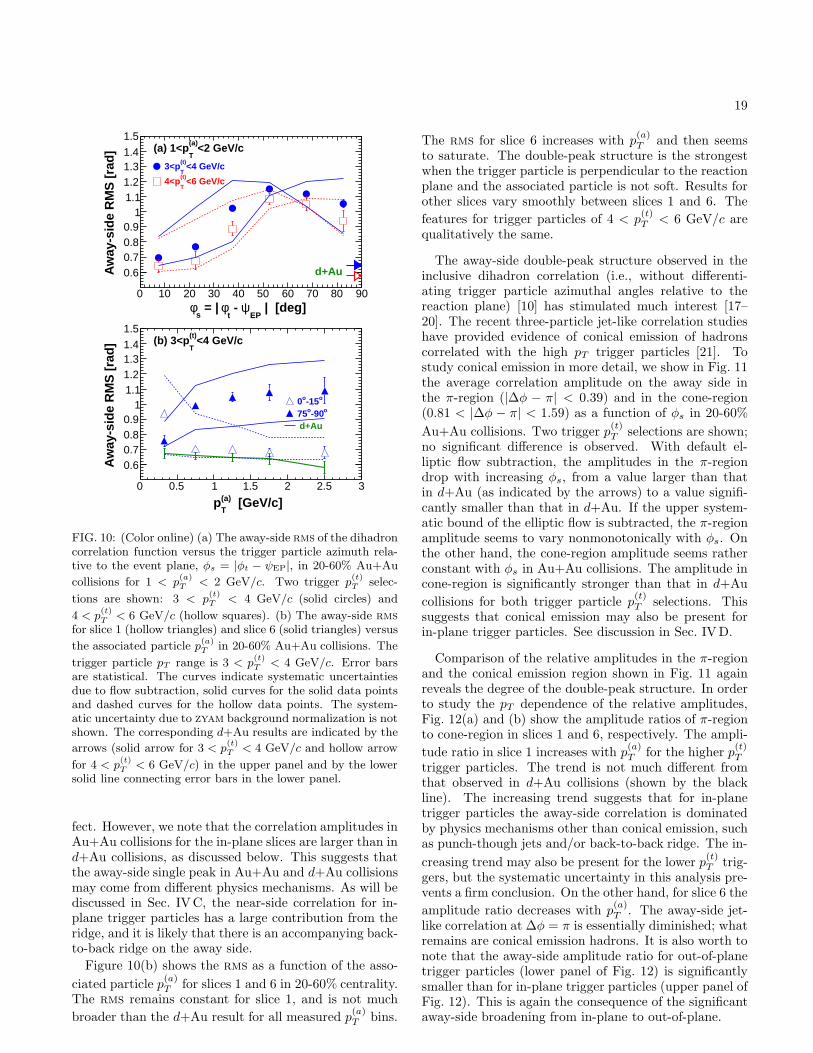
19
0 10 20 30 40 50 60 70 80 90
0.60.70.80.9
11.11.21.31.4
1.5
<4 GeV/c(t)
T3<p
<6 GeV/c(t)
T4<p
d+Au
<2 GeV/c(a)
T(a) 1<p
| [deg]EP
ψ - t
φ = | s
φ
Aw
ay-s
ide
RM
S [r
ad]
0 0.5 1 1.5 2 2.5 3
0.60.70.80.9
11.11.21.31.4
1.5
o-15o0o-90o75
d+Au
<4 GeV/c(t)
T(b) 3<p
[GeV/c](a)T
p
Aw
ay-s
ide
RM
S [r
ad]
FIG. 10: (Color online) (a) The away-side rms of the dihadroncorrelation function versus the trigger particle azimuth rela-tive to the event plane, φs = |φt − ψEP|, in 20-60% Au+Au
collisions for 1 < p(a)T
< 2 GeV/c. Two trigger p(t)T
selec-
tions are shown: 3 < p(t)T < 4 GeV/c (solid circles) and
4 < p(t)T< 6 GeV/c (hollow squares). (b) The away-side rms
for slice 1 (hollow triangles) and slice 6 (solid triangles) versus
the associated particle p(a)T in 20-60% Au+Au collisions. The
trigger particle pT range is 3 < p(t)T
< 4 GeV/c. Error barsare statistical. The curves indicate systematic uncertaintiesdue to flow subtraction, solid curves for the solid data pointsand dashed curves for the hollow data points. The system-atic uncertainty due to zyam background normalization is notshown. The corresponding d+Au results are indicated by the
arrows (solid arrow for 3 < p(t)T < 4 GeV/c and hollow arrow
for 4 < p(t)T< 6 GeV/c) in the upper panel and by the lower
solid line connecting error bars in the lower panel.
fect. However, we note that the correlation amplitudes inAu+Au collisions for the in-plane slices are larger than ind+Au collisions, as discussed below. This suggests thatthe away-side single peak in Au+Au and d+Au collisionsmay come from different physics mechanisms. As will bediscussed in Sec. IVC, the near-side correlation for in-plane trigger particles has a large contribution from theridge, and it is likely that there is an accompanying back-to-back ridge on the away side.
Figure 10(b) shows the rms as a function of the asso-
ciated particle p(a)T for slices 1 and 6 in 20-60% centrality.
The rms remains constant for slice 1, and is not much
broader than the d+Au result for all measured p(a)T bins.
The rms for slice 6 increases with p(a)T and then seems
to saturate. The double-peak structure is the strongestwhen the trigger particle is perpendicular to the reactionplane and the associated particle is not soft. Results forother slices vary smoothly between slices 1 and 6. The
features for trigger particles of 4 < p(t)T < 6 GeV/c are
qualitatively the same.
The away-side double-peak structure observed in theinclusive dihadron correlation (i.e., without differenti-ating trigger particle azimuthal angles relative to thereaction plane) [10] has stimulated much interest [17–20]. The recent three-particle jet-like correlation studieshave provided evidence of conical emission of hadronscorrelated with the high pT trigger particles [21]. Tostudy conical emission in more detail, we show in Fig. 11the average correlation amplitude on the away side inthe π-region (|∆φ − π| < 0.39) and in the cone-region(0.81 < |∆φ − π| < 1.59) as a function of φs in 20-60%
Au+Au collisions. Two trigger p(t)T selections are shown;
no significant difference is observed. With default el-liptic flow subtraction, the amplitudes in the π-regiondrop with increasing φs, from a value larger than thatin d+Au (as indicated by the arrows) to a value signifi-cantly smaller than that in d+Au. If the upper system-atic bound of the elliptic flow is subtracted, the π-regionamplitude seems to vary nonmonotonically with φs. Onthe other hand, the cone-region amplitude seems ratherconstant with φs in Au+Au collisions. The amplitude incone-region is significantly stronger than that in d+Au
collisions for both trigger particle p(t)T selections. This
suggests that conical emission may also be present forin-plane trigger particles. See discussion in Sec. IVD.
Comparison of the relative amplitudes in the π-regionand the conical emission region shown in Fig. 11 againreveals the degree of the double-peak structure. In orderto study the pT dependence of the relative amplitudes,Fig. 12(a) and (b) show the amplitude ratios of π-regionto cone-region in slices 1 and 6, respectively. The ampli-
tude ratio in slice 1 increases with p(a)T for the higher p
(t)T
trigger particles. The trend is not much different fromthat observed in d+Au collisions (shown by the blackline). The increasing trend suggests that for in-planetrigger particles the away-side correlation is dominatedby physics mechanisms other than conical emission, suchas punch-though jets and/or back-to-back ridge. The in-
creasing trend may also be present for the lower p(t)T trig-
gers, but the systematic uncertainty in this analysis pre-vents a firm conclusion. On the other hand, for slice 6 the
amplitude ratio decreases with p(a)T . The away-side jet-
like correlation at ∆φ = π is essentially diminished; whatremains are conical emission hadrons. It is also worth tonote that the away-side amplitude ratio for out-of-planetrigger particles (lower panel of Fig. 12) is significantlysmaller than for in-plane trigger particles (upper panel ofFig. 12). This is again the consequence of the significantaway-side broadening from in-plane to out-of-plane.
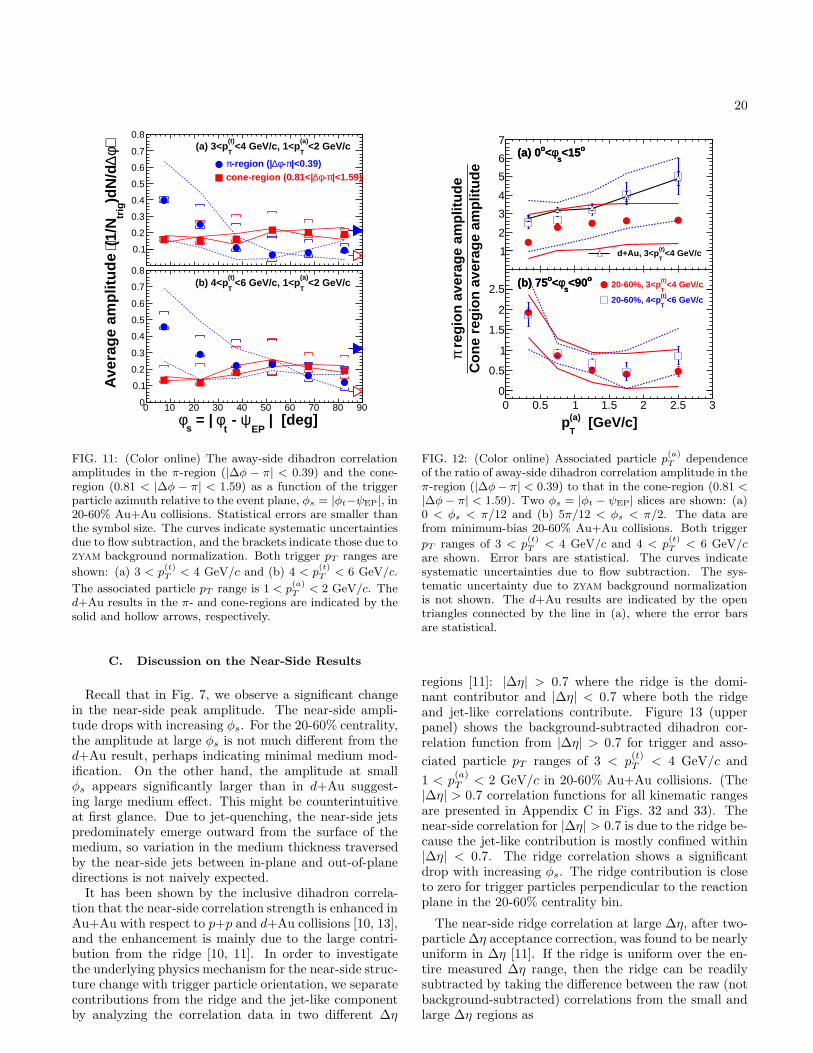
20
0 10 20 30 40 50 60 70 80 90
0.1
0.2
0.3
0.4
0.5
0.6
0.7
0.8<2 GeV/c
(a)
T<4 GeV/c, 1<p
(t)
T(a) 3<p
|<0.39)π-φ∆-region (|π|<1.59)π-φ∆cone-region (0.81<|
0 10 20 30 40 50 60 70 80 900
0.1
0.2
0.3
0.4
0.5
0.6
0.7
0.8<2 GeV/c
(a)
T<6 GeV/c, 1<p
(t)
T(b) 4<p
⟩φ∆)d
N/d
trig
(1/N
⟨A
vera
ge a
mpl
itude
| [deg]EP
ψ - t
φ = | s
φ
FIG. 11: (Color online) The away-side dihadron correlationamplitudes in the π-region (|∆φ − π| < 0.39) and the cone-region (0.81 < |∆φ − π| < 1.59) as a function of the triggerparticle azimuth relative to the event plane, φs = |φt−ψEP|, in20-60% Au+Au collisions. Statistical errors are smaller thanthe symbol size. The curves indicate systematic uncertaintiesdue to flow subtraction, and the brackets indicate those due tozyam background normalization. Both trigger pT ranges are
shown: (a) 3 < p(t)T < 4 GeV/c and (b) 4 < p
(t)T < 6 GeV/c.
The associated particle pT range is 1 < p(a)T
< 2 GeV/c. Thed+Au results in the π- and cone-regions are indicated by thesolid and hollow arrows, respectively.
C. Discussion on the Near-Side Results
Recall that in Fig. 7, we observe a significant changein the near-side peak amplitude. The near-side ampli-tude drops with increasing φs. For the 20-60% centrality,the amplitude at large φs is not much different from thed+Au result, perhaps indicating minimal medium mod-ification. On the other hand, the amplitude at smallφs appears significantly larger than in d+Au suggest-ing large medium effect. This might be counterintuitiveat first glance. Due to jet-quenching, the near-side jetspredominately emerge outward from the surface of themedium, so variation in the medium thickness traversedby the near-side jets between in-plane and out-of-planedirections is not naively expected.It has been shown by the inclusive dihadron correla-
tion that the near-side correlation strength is enhanced inAu+Au with respect to p+p and d+Au collisions [10, 13],and the enhancement is mainly due to the large contri-bution from the ridge [10, 11]. In order to investigatethe underlying physics mechanism for the near-side struc-ture change with trigger particle orientation, we separatecontributions from the ridge and the jet-like componentby analyzing the correlation data in two different ∆η
Con
e re
gion
ave
rage
am
plitu
de r
egio
n av
erag
e am
plitu
deπ
[GeV/c](a)
Tp
0 0.5 1 1.5 2 2.5 3
1
2
3
4
5
6
7
<4 GeV/c(t)
Td+Au, 3<p
o<15s
φ<o(a) 0 o<15s
φ<o(a) 0
0 0.5 1 1.5 2 2.5 30
0.5
1
1.5
2
2.5 <4 GeV/c(t)
T20-60%, 3<p
o<90s
φ<o(b) 75<6 GeV/c(t)
T20-60%, 4<p
o<90s
φ<o(b) 75
FIG. 12: (Color online) Associated particle p(a)T
dependenceof the ratio of away-side dihadron correlation amplitude in theπ-region (|∆φ− π| < 0.39) to that in the cone-region (0.81 <|∆φ− π| < 1.59). Two φs = |φt − ψEP| slices are shown: (a)0 < φs < π/12 and (b) 5π/12 < φs < π/2. The data arefrom minimum-bias 20-60% Au+Au collisions. Both trigger
pT ranges of 3 < p(t)T
< 4 GeV/c and 4 < p(t)T
< 6 GeV/care shown. Error bars are statistical. The curves indicatesystematic uncertainties due to flow subtraction. The sys-tematic uncertainty due to zyam background normalizationis not shown. The d+Au results are indicated by the opentriangles connected by the line in (a), where the error barsare statistical.
regions [11]: |∆η| > 0.7 where the ridge is the domi-nant contributor and |∆η| < 0.7 where both the ridgeand jet-like correlations contribute. Figure 13 (upperpanel) shows the background-subtracted dihadron cor-relation function from |∆η| > 0.7 for trigger and asso-
ciated particle pT ranges of 3 < p(t)T < 4 GeV/c and
1 < p(a)T < 2 GeV/c in 20-60% Au+Au collisions. (The
|∆η| > 0.7 correlation functions for all kinematic rangesare presented in Appendix C in Figs. 32 and 33). Thenear-side correlation for |∆η| > 0.7 is due to the ridge be-cause the jet-like contribution is mostly confined within|∆η| < 0.7. The ridge correlation shows a significantdrop with increasing φs. The ridge contribution is closeto zero for trigger particles perpendicular to the reactionplane in the 20-60% centrality bin.
The near-side ridge correlation at large ∆η, after two-particle ∆η acceptance correction, was found to be nearlyuniform in ∆η [11]. If the ridge is uniform over the en-tire measured ∆η range, then the ridge can be readilysubtracted by taking the difference between the raw (notbackground-subtracted) correlations from the small andlarge ∆η regions as
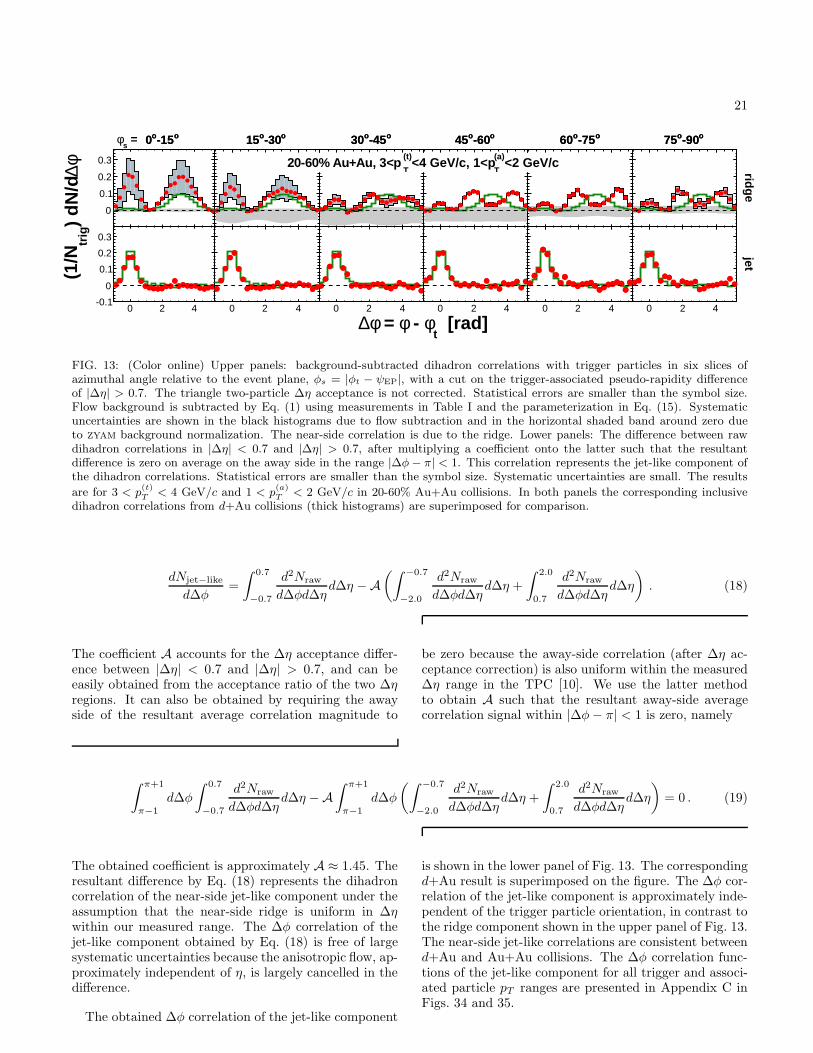
21
o-15o0
ridge
0
0.1
0.2
0.3
o-15o0
jet
0 2 4-0.1
0
0.1
0.2
0.3
o-30o15
0
0.1
0.2
0.3
o-30o15
0 2 4-0.1
0
0.1
0.2
0.3
o-45o30
0
0.1
0.2
0.3
o-45o30
0 2 4-0.1
0
0.1
0.2
0.3
o-60o45
0
0.1
0.2
0.3
o-60o45
0 2 4-0.1
0
0.1
0.2
0.3
o-75o60
0
0.1
0.2
0.3
o-75o60
0 2 4-0.1
0
0.1
0.2
0.3
o-90o75
0
0.1
0.2
0.3
o-90o75
0 2 4-0.1
0
0.1
0.2
0.3
=s
φ
[rad]t
φ - φ = φ∆
φ∆)
dN/d
trig
(1/N
<2 GeV/c(a)
T<4 GeV/c, 1<p
(t)
T20-60% Au+Au, 3<p
FIG. 13: (Color online) Upper panels: background-subtracted dihadron correlations with trigger particles in six slices ofazimuthal angle relative to the event plane, φs = |φt − ψEP|, with a cut on the trigger-associated pseudo-rapidity differenceof |∆η| > 0.7. The triangle two-particle ∆η acceptance is not corrected. Statistical errors are smaller than the symbol size.Flow background is subtracted by Eq. (1) using measurements in Table I and the parameterization in Eq. (15). Systematicuncertainties are shown in the black histograms due to flow subtraction and in the horizontal shaded band around zero dueto zyam background normalization. The near-side correlation is due to the ridge. Lower panels: The difference between rawdihadron correlations in |∆η| < 0.7 and |∆η| > 0.7, after multiplying a coefficient onto the latter such that the resultantdifference is zero on average on the away side in the range |∆φ− π| < 1. This correlation represents the jet-like component ofthe dihadron correlations. Statistical errors are smaller than the symbol size. Systematic uncertainties are small. The results
are for 3 < p(t)T< 4 GeV/c and 1 < p
(a)T
< 2 GeV/c in 20-60% Au+Au collisions. In both panels the corresponding inclusivedihadron correlations from d+Au collisions (thick histograms) are superimposed for comparison.
dNjet−like
d∆φ=
∫ 0.7
−0.7
d2Nraw
d∆φd∆ηd∆η −A
(∫ −0.7
−2.0
d2Nraw
d∆φd∆ηd∆η +
∫ 2.0
0.7
d2Nraw
d∆φd∆ηd∆η
)
. (18)
The coefficient A accounts for the ∆η acceptance differ-ence between |∆η| < 0.7 and |∆η| > 0.7, and can beeasily obtained from the acceptance ratio of the two ∆ηregions. It can also be obtained by requiring the awayside of the resultant average correlation magnitude to
be zero because the away-side correlation (after ∆η ac-ceptance correction) is also uniform within the measured∆η range in the TPC [10]. We use the latter methodto obtain A such that the resultant away-side averagecorrelation signal within |∆φ− π| < 1 is zero, namely
∫ π+1
π−1
d∆φ
∫ 0.7
−0.7
d2Nraw
d∆φd∆ηd∆η −A
∫ π+1
π−1
d∆φ
(∫ −0.7
−2.0
d2Nraw
d∆φd∆ηd∆η +
∫ 2.0
0.7
d2Nraw
d∆φd∆ηd∆η
)
= 0 . (19)
The obtained coefficient is approximately A ≈ 1.45. Theresultant difference by Eq. (18) represents the dihadroncorrelation of the near-side jet-like component under theassumption that the near-side ridge is uniform in ∆ηwithin our measured range. The ∆φ correlation of thejet-like component obtained by Eq. (18) is free of largesystematic uncertainties because the anisotropic flow, ap-proximately independent of η, is largely cancelled in thedifference.
The obtained ∆φ correlation of the jet-like component
is shown in the lower panel of Fig. 13. The correspondingd+Au result is superimposed on the figure. The ∆φ cor-relation of the jet-like component is approximately inde-pendent of the trigger particle orientation, in contrast tothe ridge component shown in the upper panel of Fig. 13.The near-side jet-like correlations are consistent betweend+Au and Au+Au collisions. The ∆φ correlation func-tions of the jet-like component for all trigger and associ-ated particle pT ranges are presented in Appendix C inFigs. 34 and 35.
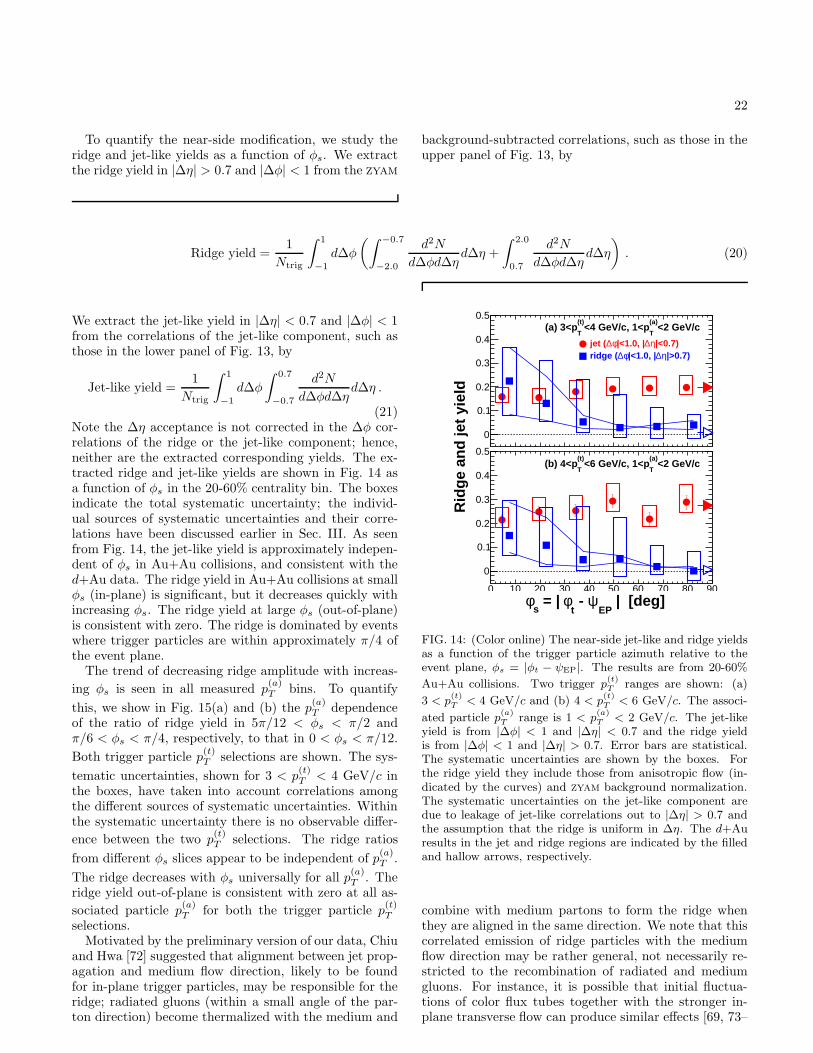
22
To quantify the near-side modification, we study theridge and jet-like yields as a function of φs. We extractthe ridge yield in |∆η| > 0.7 and |∆φ| < 1 from the zyam
background-subtracted correlations, such as those in theupper panel of Fig. 13, by
Ridge yield =1
Ntrig
∫ 1
−1
d∆φ
(∫ −0.7
−2.0
d2N
d∆φd∆ηd∆η +
∫ 2.0
0.7
d2N
d∆φd∆ηd∆η
)
. (20)
We extract the jet-like yield in |∆η| < 0.7 and |∆φ| < 1from the correlations of the jet-like component, such asthose in the lower panel of Fig. 13, by
Jet-like yield =1
Ntrig
∫ 1
−1
d∆φ
∫ 0.7
−0.7
d2N
d∆φd∆ηd∆η .
(21)Note the ∆η acceptance is not corrected in the ∆φ cor-relations of the ridge or the jet-like component; hence,neither are the extracted corresponding yields. The ex-tracted ridge and jet-like yields are shown in Fig. 14 asa function of φs in the 20-60% centrality bin. The boxesindicate the total systematic uncertainty; the individ-ual sources of systematic uncertainties and their corre-lations have been discussed earlier in Sec. III. As seenfrom Fig. 14, the jet-like yield is approximately indepen-dent of φs in Au+Au collisions, and consistent with thed+Au data. The ridge yield in Au+Au collisions at smallφs (in-plane) is significant, but it decreases quickly withincreasing φs. The ridge yield at large φs (out-of-plane)is consistent with zero. The ridge is dominated by eventswhere trigger particles are within approximately π/4 ofthe event plane.The trend of decreasing ridge amplitude with increas-
ing φs is seen in all measured p(a)T bins. To quantify
this, we show in Fig. 15(a) and (b) the p(a)T dependence
of the ratio of ridge yield in 5π/12 < φs < π/2 andπ/6 < φs < π/4, respectively, to that in 0 < φs < π/12.
Both trigger particle p(t)T selections are shown. The sys-
tematic uncertainties, shown for 3 < p(t)T < 4 GeV/c in
the boxes, have taken into account correlations amongthe different sources of systematic uncertainties. Withinthe systematic uncertainty there is no observable differ-
ence between the two p(t)T selections. The ridge ratios
from different φs slices appear to be independent of p(a)T .
The ridge decreases with φs universally for all p(a)T . The
ridge yield out-of-plane is consistent with zero at all as-
sociated particle p(a)T for both the trigger particle p
(t)T
selections.Motivated by the preliminary version of our data, Chiu
and Hwa [72] suggested that alignment between jet prop-agation and medium flow direction, likely to be foundfor in-plane trigger particles, may be responsible for theridge; radiated gluons (within a small angle of the par-ton direction) become thermalized with the medium and
0 10 20 30 40 50 60 70 80 90
0
0.1
0.2
0.3
0.4
0.5
|<0.7)η∆|<1.0, |φ∆jet (|>0.7)η∆|<1.0, |φ∆ridge (
<2 GeV/c(a)
T<4 GeV/c, 1<p
(t)
T(a) 3<p
0 10 20 30 40 50 60 70 80 90
0
0.1
0.2
0.3
0.4
0.5<2 GeV/c
(a)
T<6 GeV/c, 1<p
(t)
T(b) 4<p
Rid
ge a
nd je
t yie
ld
| [deg]EP
ψ - t
φ = | s
φ
FIG. 14: (Color online) The near-side jet-like and ridge yieldsas a function of the trigger particle azimuth relative to theevent plane, φs = |φt − ψEP|. The results are from 20-60%
Au+Au collisions. Two trigger p(t)T ranges are shown: (a)
3 < p(t)T< 4 GeV/c and (b) 4 < p
(t)T< 6 GeV/c. The associ-
ated particle p(a)T range is 1 < p
(a)T < 2 GeV/c. The jet-like
yield is from |∆φ| < 1 and |∆η| < 0.7 and the ridge yieldis from |∆φ| < 1 and |∆η| > 0.7. Error bars are statistical.The systematic uncertainties are shown by the boxes. Forthe ridge yield they include those from anisotropic flow (in-dicated by the curves) and zyam background normalization.The systematic uncertainties on the jet-like component aredue to leakage of jet-like correlations out to |∆η| > 0.7 andthe assumption that the ridge is uniform in ∆η. The d+Auresults in the jet and ridge regions are indicated by the filledand hallow arrows, respectively.
combine with medium partons to form the ridge whenthey are aligned in the same direction. We note that thiscorrelated emission of ridge particles with the mediumflow direction may be rather general, not necessarily re-stricted to the recombination of radiated and mediumgluons. For instance, it is possible that initial fluctua-tions of color flux tubes together with the stronger in-plane transverse flow can produce similar effects [69, 73–
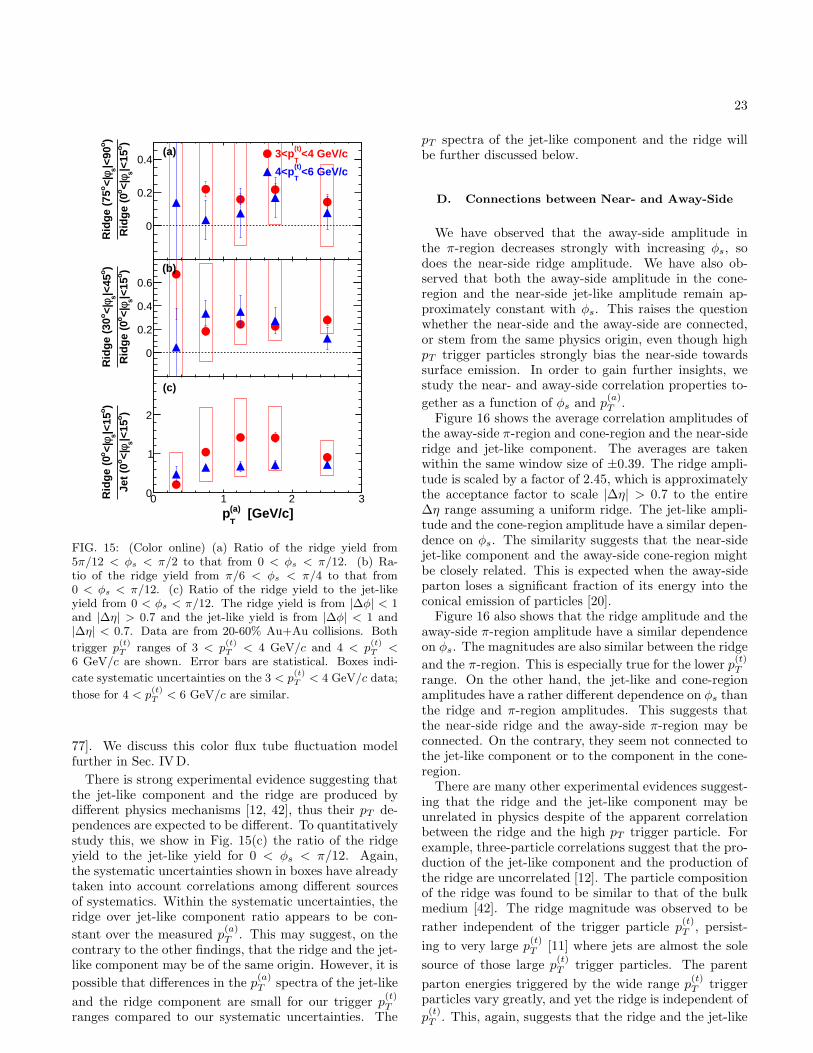
23
0 1 2 3
0
0.2
0.4 <4 GeV/c(t)
T3<p
<6 GeV/c(t)
T4<p
(a)
)o
|<15
sφ<|
oR
idge
(0
)o
|<90
sφ<|
oR
idge
(75
0 1 2 3
0
0.2
0.4
0.6(b))
o|<
15sφ
<|o
Rid
ge (
0
)o
|<45
sφ<|
oR
idge
(30
0 1 2 30
1
2
(c)
)o
|<15
sφ<|
oJe
t (0
)o
|<15
sφ<|
oR
idge
(0
[GeV/c](a)
Tp
FIG. 15: (Color online) (a) Ratio of the ridge yield from5π/12 < φs < π/2 to that from 0 < φs < π/12. (b) Ra-tio of the ridge yield from π/6 < φs < π/4 to that from0 < φs < π/12. (c) Ratio of the ridge yield to the jet-likeyield from 0 < φs < π/12. The ridge yield is from |∆φ| < 1and |∆η| > 0.7 and the jet-like yield is from |∆φ| < 1 and|∆η| < 0.7. Data are from 20-60% Au+Au collisions. Both
trigger p(t)T ranges of 3 < p
(t)T < 4 GeV/c and 4 < p
(t)T <
6 GeV/c are shown. Error bars are statistical. Boxes indi-
cate systematic uncertainties on the 3 < p(t)T < 4 GeV/c data;
those for 4 < p(t)T< 6 GeV/c are similar.
77]. We discuss this color flux tube fluctuation modelfurther in Sec. IVD.
There is strong experimental evidence suggesting thatthe jet-like component and the ridge are produced bydifferent physics mechanisms [12, 42], thus their pT de-pendences are expected to be different. To quantitativelystudy this, we show in Fig. 15(c) the ratio of the ridgeyield to the jet-like yield for 0 < φs < π/12. Again,the systematic uncertainties shown in boxes have alreadytaken into account correlations among different sourcesof systematics. Within the systematic uncertainties, theridge over jet-like component ratio appears to be con-
stant over the measured p(a)T . This may suggest, on the
contrary to the other findings, that the ridge and the jet-like component may be of the same origin. However, it is
possible that differences in the p(a)T spectra of the jet-like
and the ridge component are small for our trigger p(t)T
ranges compared to our systematic uncertainties. The
pT spectra of the jet-like component and the ridge willbe further discussed below.
D. Connections between Near- and Away-Side
We have observed that the away-side amplitude inthe π-region decreases strongly with increasing φs, sodoes the near-side ridge amplitude. We have also ob-served that both the away-side amplitude in the cone-region and the near-side jet-like amplitude remain ap-proximately constant with φs. This raises the questionwhether the near-side and the away-side are connected,or stem from the same physics origin, even though highpT trigger particles strongly bias the near-side towardssurface emission. In order to gain further insights, westudy the near- and away-side correlation properties to-
gether as a function of φs and p(a)T .
Figure 16 shows the average correlation amplitudes ofthe away-side π-region and cone-region and the near-sideridge and jet-like component. The averages are takenwithin the same window size of ±0.39. The ridge ampli-tude is scaled by a factor of 2.45, which is approximatelythe acceptance factor to scale |∆η| > 0.7 to the entire∆η range assuming a uniform ridge. The jet-like ampli-tude and the cone-region amplitude have a similar depen-dence on φs. The similarity suggests that the near-sidejet-like component and the away-side cone-region mightbe closely related. This is expected when the away-sideparton loses a significant fraction of its energy into theconical emission of particles [20].Figure 16 also shows that the ridge amplitude and the
away-side π-region amplitude have a similar dependenceon φs. The magnitudes are also similar between the ridge
and the π-region. This is especially true for the lower p(t)T
range. On the other hand, the jet-like and cone-regionamplitudes have a rather different dependence on φs thanthe ridge and π-region amplitudes. This suggests thatthe near-side ridge and the away-side π-region may beconnected. On the contrary, they seem not connected tothe jet-like component or to the component in the cone-region.There are many other experimental evidences suggest-
ing that the ridge and the jet-like component may beunrelated in physics despite of the apparent correlationbetween the ridge and the high pT trigger particle. Forexample, three-particle correlations suggest that the pro-duction of the jet-like component and the production ofthe ridge are uncorrelated [12]. The particle compositionof the ridge was found to be similar to that of the bulkmedium [42]. The ridge magnitude was observed to be
rather independent of the trigger particle p(t)T , persist-
ing to very large p(t)T [11] where jets are almost the sole
source of those large p(t)T trigger particles. The parent
parton energies triggered by the wide range p(t)T trigger
particles vary greatly, and yet the ridge is independent of
p(t)T . This, again, suggests that the ridge and the jet-like
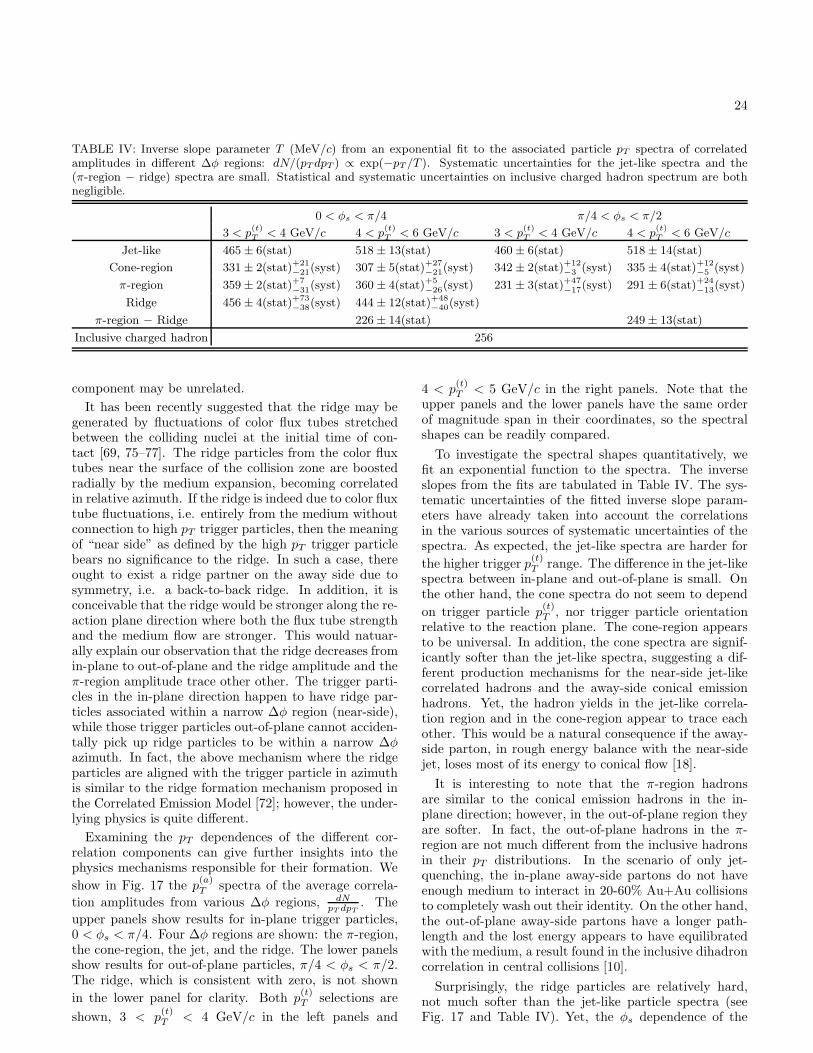
24
TABLE IV: Inverse slope parameter T (MeV/c) from an exponential fit to the associated particle pT spectra of correlatedamplitudes in different ∆φ regions: dN/(pTdpT ) ∝ exp(−pT /T ). Systematic uncertainties for the jet-like spectra and the(π-region − ridge) spectra are small. Statistical and systematic uncertainties on inclusive charged hadron spectrum are bothnegligible.
0 < φs < π/4 π/4 < φs < π/2
3 < p(t)T< 4 GeV/c 4 < p
(t)T< 6 GeV/c 3 < p
(t)T< 4 GeV/c 4 < p
(t)T< 6 GeV/c
Jet-like 465± 6(stat) 518± 13(stat) 460± 6(stat) 518± 14(stat)
Cone-region 331± 2(stat)+21−21(syst) 307± 5(stat)+27
−21(syst) 342± 2(stat)+12−3 (syst) 335± 4(stat)+12
−5 (syst)
π-region 359± 2(stat)+7−31(syst) 360± 4(stat)+5
−26(syst) 231± 3(stat)+47−17(syst) 291± 6(stat)+24
−13(syst)
Ridge 456± 4(stat)+73−38(syst) 444± 12(stat)+48
−40(syst)
π-region − Ridge 226± 14(stat) 249± 13(stat)
Inclusive charged hadron 256
component may be unrelated.
It has been recently suggested that the ridge may begenerated by fluctuations of color flux tubes stretchedbetween the colliding nuclei at the initial time of con-tact [69, 75–77]. The ridge particles from the color fluxtubes near the surface of the collision zone are boostedradially by the medium expansion, becoming correlatedin relative azimuth. If the ridge is indeed due to color fluxtube fluctuations, i.e. entirely from the medium withoutconnection to high pT trigger particles, then the meaningof “near side” as defined by the high pT trigger particlebears no significance to the ridge. In such a case, thereought to exist a ridge partner on the away side due tosymmetry, i.e. a back-to-back ridge. In addition, it isconceivable that the ridge would be stronger along the re-action plane direction where both the flux tube strengthand the medium flow are stronger. This would natuar-ally explain our observation that the ridge decreases fromin-plane to out-of-plane and the ridge amplitude and theπ-region amplitude trace other other. The trigger parti-cles in the in-plane direction happen to have ridge par-ticles associated within a narrow ∆φ region (near-side),while those trigger particles out-of-plane cannot acciden-tally pick up ridge particles to be within a narrow ∆φazimuth. In fact, the above mechanism where the ridgeparticles are aligned with the trigger particle in azimuthis similar to the ridge formation mechanism proposed inthe Correlated Emission Model [72]; however, the under-lying physics is quite different.
Examining the pT dependences of the different cor-relation components can give further insights into thephysics mechanisms responsible for their formation. We
show in Fig. 17 the p(a)T spectra of the average correla-
tion amplitudes from various ∆φ regions, dNpT dpT
. The
upper panels show results for in-plane trigger particles,0 < φs < π/4. Four ∆φ regions are shown: the π-region,the cone-region, the jet, and the ridge. The lower panelsshow results for out-of-plane particles, π/4 < φs < π/2.The ridge, which is consistent with zero, is not shown
in the lower panel for clarity. Both p(t)T selections are
shown, 3 < p(t)T < 4 GeV/c in the left panels and
4 < p(t)T < 5 GeV/c in the right panels. Note that the
upper panels and the lower panels have the same orderof magnitude span in their coordinates, so the spectralshapes can be readily compared.
To investigate the spectral shapes quantitatively, wefit an exponential function to the spectra. The inverseslopes from the fits are tabulated in Table IV. The sys-tematic uncertainties of the fitted inverse slope param-eters have already taken into account the correlationsin the various sources of systematic uncertainties of thespectra. As expected, the jet-like spectra are harder for
the higher trigger p(t)T range. The difference in the jet-like
spectra between in-plane and out-of-plane is small. Onthe other hand, the cone spectra do not seem to depend
on trigger particle p(t)T , nor trigger particle orientation
relative to the reaction plane. The cone-region appearsto be universal. In addition, the cone spectra are signif-icantly softer than the jet-like spectra, suggesting a dif-ferent production mechanisms for the near-side jet-likecorrelated hadrons and the away-side conical emissionhadrons. Yet, the hadron yields in the jet-like correla-tion region and in the cone-region appear to trace eachother. This would be a natural consequence if the away-side parton, in rough energy balance with the near-sidejet, loses most of its energy to conical flow [18].
It is interesting to note that the π-region hadronsare similar to the conical emission hadrons in the in-plane direction; however, in the out-of-plane region theyare softer. In fact, the out-of-plane hadrons in the π-region are not much different from the inclusive hadronsin their pT distributions. In the scenario of only jet-quenching, the in-plane away-side partons do not haveenough medium to interact in 20-60% Au+Au collisionsto completely wash out their identity. On the other hand,the out-of-plane away-side partons have a longer path-length and the lost energy appears to have equilibratedwith the medium, a result found in the inclusive dihadroncorrelation in central collisions [10].
Surprisingly, the ridge particles are relatively hard,not much softer than the jet-like particle spectra (seeFig. 17 and Table IV). Yet, the φs dependence of the
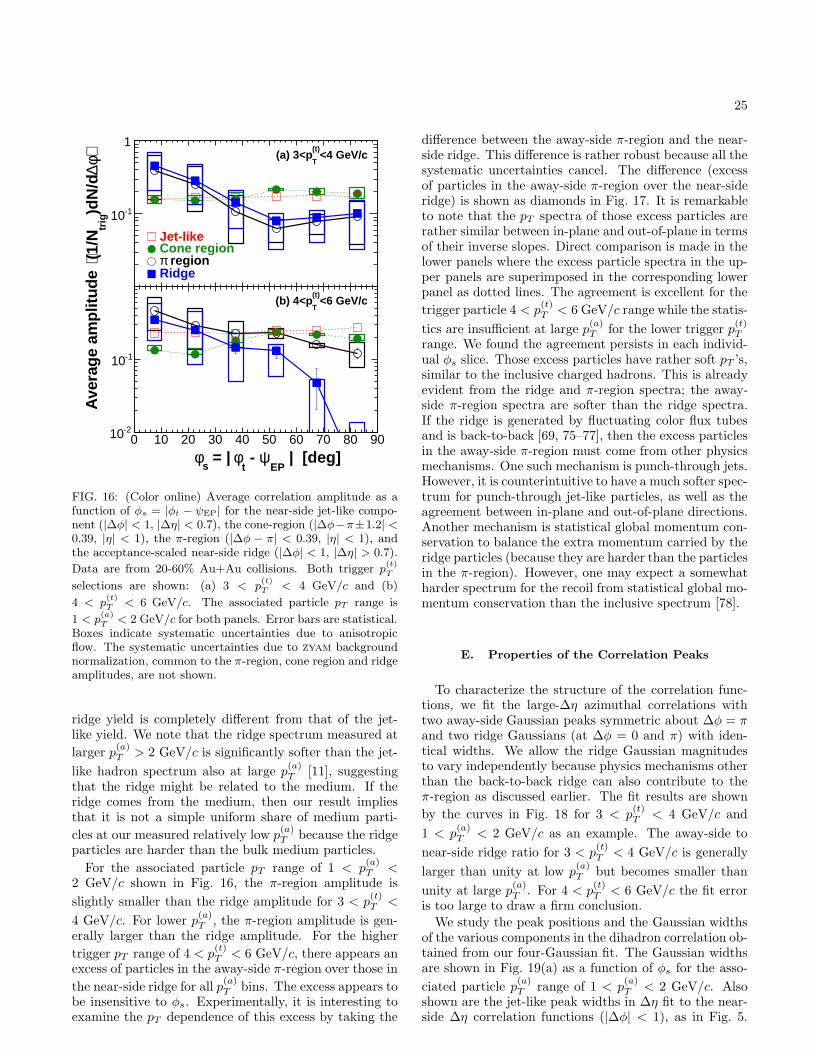
25
0 10 20 30 40 50 60 70 80 90
-110
1<4 GeV/c
(t)
T(a) 3<p
Jet-likeCone region
regionπRidge
0 10 20 30 40 50 60 70 80 90-210
-110
<6 GeV/c(t)
T(b) 4<p
| [deg]EP
ψ - t
φ = | s
φ
⟩φ∆)d
N/d
trig
(1/N
⟨A
vera
ge a
mpl
itude
FIG. 16: (Color online) Average correlation amplitude as afunction of φs = |φt − ψEP| for the near-side jet-like compo-nent (|∆φ| < 1, |∆η| < 0.7), the cone-region (|∆φ−π±1.2| <0.39, |η| < 1), the π-region (|∆φ − π| < 0.39, |η| < 1), andthe acceptance-scaled near-side ridge (|∆φ| < 1, |∆η| > 0.7).
Data are from 20-60% Au+Au collisions. Both trigger p(t)T
selections are shown: (a) 3 < p(t)T < 4 GeV/c and (b)
4 < p(t)T
< 6 GeV/c. The associated particle pT range is
1 < p(a)T
< 2 GeV/c for both panels. Error bars are statistical.Boxes indicate systematic uncertainties due to anisotropicflow. The systematic uncertainties due to zyam backgroundnormalization, common to the π-region, cone region and ridgeamplitudes, are not shown.
ridge yield is completely different from that of the jet-like yield. We note that the ridge spectrum measured at
larger p(a)T > 2 GeV/c is significantly softer than the jet-
like hadron spectrum also at large p(a)T [11], suggesting
that the ridge might be related to the medium. If theridge comes from the medium, then our result impliesthat it is not a simple uniform share of medium parti-
cles at our measured relatively low p(a)T because the ridge
particles are harder than the bulk medium particles.
For the associated particle pT range of 1 < p(a)T <
2 GeV/c shown in Fig. 16, the π-region amplitude is
slightly smaller than the ridge amplitude for 3 < p(t)T <
4 GeV/c. For lower p(a)T , the π-region amplitude is gen-
erally larger than the ridge amplitude. For the higher
trigger pT range of 4 < p(t)T < 6 GeV/c, there appears an
excess of particles in the away-side π-region over those in
the near-side ridge for all p(a)T bins. The excess appears to
be insensitive to φs. Experimentally, it is interesting toexamine the pT dependence of this excess by taking the
difference between the away-side π-region and the near-side ridge. This difference is rather robust because all thesystematic uncertainties cancel. The difference (excessof particles in the away-side π-region over the near-sideridge) is shown as diamonds in Fig. 17. It is remarkableto note that the pT spectra of those excess particles arerather similar between in-plane and out-of-plane in termsof their inverse slopes. Direct comparison is made in thelower panels where the excess particle spectra in the up-per panels are superimposed in the corresponding lowerpanel as dotted lines. The agreement is excellent for the
trigger particle 4 < p(t)T < 6 GeV/c range while the statis-
tics are insufficient at large p(a)T for the lower trigger p
(t)T
range. We found the agreement persists in each individ-ual φs slice. Those excess particles have rather soft pT ’s,similar to the inclusive charged hadrons. This is alreadyevident from the ridge and π-region spectra; the away-side π-region spectra are softer than the ridge spectra.If the ridge is generated by fluctuating color flux tubesand is back-to-back [69, 75–77], then the excess particlesin the away-side π-region must come from other physicsmechanisms. One such mechanism is punch-through jets.However, it is counterintuitive to have a much softer spec-trum for punch-through jet-like particles, as well as theagreement between in-plane and out-of-plane directions.Another mechanism is statistical global momentum con-servation to balance the extra momentum carried by theridge particles (because they are harder than the particlesin the π-region). However, one may expect a somewhatharder spectrum for the recoil from statistical global mo-mentum conservation than the inclusive spectrum [78].
E. Properties of the Correlation Peaks
To characterize the structure of the correlation func-tions, we fit the large-∆η azimuthal correlations withtwo away-side Gaussian peaks symmetric about ∆φ = πand two ridge Gaussians (at ∆φ = 0 and π) with iden-tical widths. We allow the ridge Gaussian magnitudesto vary independently because physics mechanisms otherthan the back-to-back ridge can also contribute to theπ-region as discussed earlier. The fit results are shown
by the curves in Fig. 18 for 3 < p(t)T < 4 GeV/c and
1 < p(a)T < 2 GeV/c as an example. The away-side to
near-side ridge ratio for 3 < p(t)T < 4 GeV/c is generally
larger than unity at low p(a)T but becomes smaller than
unity at large p(a)T . For 4 < p
(t)T < 6 GeV/c the fit error
is too large to draw a firm conclusion.
We study the peak positions and the Gaussian widthsof the various components in the dihadron correlation ob-tained from our four-Gaussian fit. The Gaussian widthsare shown in Fig. 19(a) as a function of φs for the asso-
ciated particle p(a)T range of 1 < p
(a)T < 2 GeV/c. Also
shown are the jet-like peak widths in ∆η fit to the near-side ∆η correlation functions (|∆φ| < 1), as in Fig. 5.
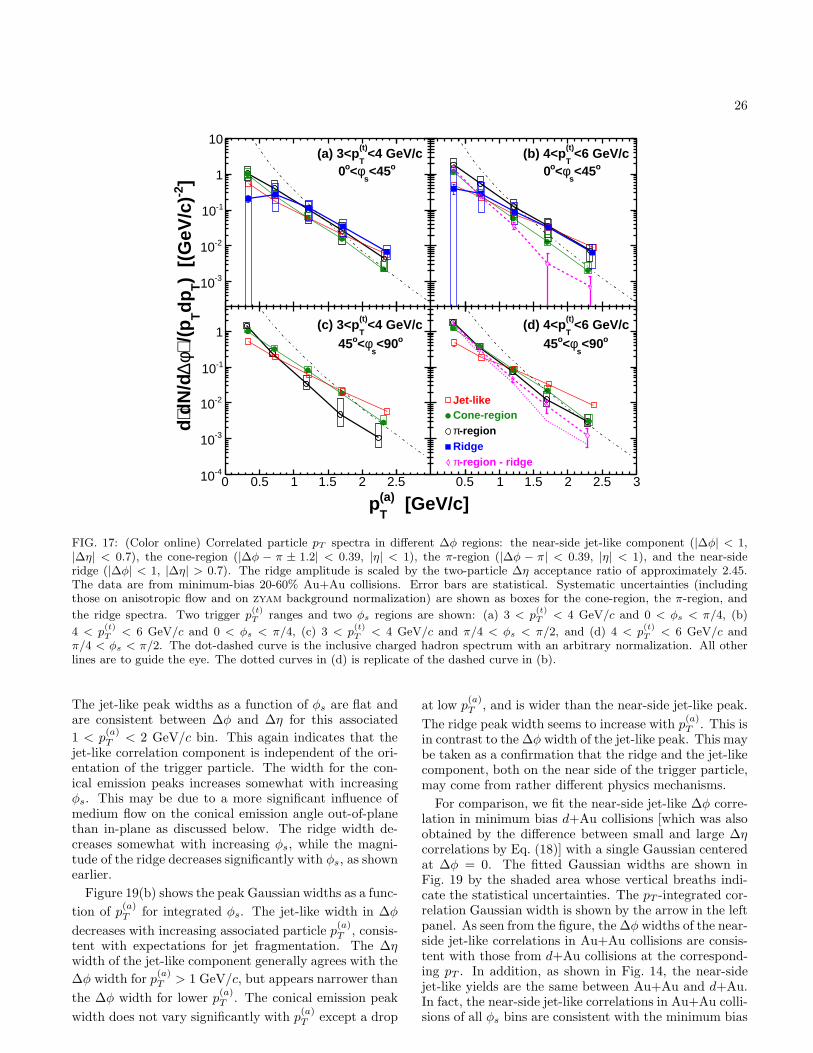
26
0 0.5 1 1.5 2 2.5
-310
-210
-110
1
10<4 GeV/c(t)
T(a) 3<p
o<45s
φ<o0
0 0.5 1 1.5 2 2.5-410
-310
-210
-110
1<4 GeV/c(t)
T(c) 3<p
o<90s
φ<o45
0.5 1 1.5 2 2.5 3
-3
-2
-1
1
10<6 GeV/c(t)
T(b) 4<p
o<45s
φ<o0
0.5 1 1.5 2 2.5 3-4
-3
-2
-1
1<6 GeV/c(t)
T(d) 4<p
o<90s
φ<o45
Jet-likeCone-region
-regionπRidge
-region - ridgeπ
[GeV/c](a)T
p
]-2
) [(
GeV
/c)
Tdp
T /(
p⟩φ∆
dN/d
⟨d
FIG. 17: (Color online) Correlated particle pT spectra in different ∆φ regions: the near-side jet-like component (|∆φ| < 1,|∆η| < 0.7), the cone-region (|∆φ − π ± 1.2| < 0.39, |η| < 1), the π-region (|∆φ − π| < 0.39, |η| < 1), and the near-sideridge (|∆φ| < 1, |∆η| > 0.7). The ridge amplitude is scaled by the two-particle ∆η acceptance ratio of approximately 2.45.The data are from minimum-bias 20-60% Au+Au collisions. Error bars are statistical. Systematic uncertainties (includingthose on anisotropic flow and on zyam background normalization) are shown as boxes for the cone-region, the π-region, and
the ridge spectra. Two trigger p(t)T ranges and two φs regions are shown: (a) 3 < p
(t)T < 4 GeV/c and 0 < φs < π/4, (b)
4 < p(t)T
< 6 GeV/c and 0 < φs < π/4, (c) 3 < p(t)T
< 4 GeV/c and π/4 < φs < π/2, and (d) 4 < p(t)T
< 6 GeV/c andπ/4 < φs < π/2. The dot-dashed curve is the inclusive charged hadron spectrum with an arbitrary normalization. All otherlines are to guide the eye. The dotted curves in (d) is replicate of the dashed curve in (b).
The jet-like peak widths as a function of φs are flat andare consistent between ∆φ and ∆η for this associated
1 < p(a)T < 2 GeV/c bin. This again indicates that the
jet-like correlation component is independent of the ori-entation of the trigger particle. The width for the con-ical emission peaks increases somewhat with increasingφs. This may be due to a more significant influence ofmedium flow on the conical emission angle out-of-planethan in-plane as discussed below. The ridge width de-creases somewhat with increasing φs, while the magni-tude of the ridge decreases significantly with φs, as shownearlier.
Figure 19(b) shows the peak Gaussian widths as a func-
tion of p(a)T for integrated φs. The jet-like width in ∆φ
decreases with increasing associated particle p(a)T , consis-
tent with expectations for jet fragmentation. The ∆ηwidth of the jet-like component generally agrees with the
∆φ width for p(a)T > 1 GeV/c, but appears narrower than
the ∆φ width for lower p(a)T . The conical emission peak
width does not vary significantly with p(a)T except a drop
at low p(a)T , and is wider than the near-side jet-like peak.
The ridge peak width seems to increase with p(a)T . This is
in contrast to the ∆φ width of the jet-like peak. This maybe taken as a confirmation that the ridge and the jet-likecomponent, both on the near side of the trigger particle,may come from rather different physics mechanisms.
For comparison, we fit the near-side jet-like ∆φ corre-lation in minimum bias d+Au collisions [which was alsoobtained by the difference between small and large ∆ηcorrelations by Eq. (18)] with a single Gaussian centeredat ∆φ = 0. The fitted Gaussian widths are shown inFig. 19 by the shaded area whose vertical breaths indi-cate the statistical uncertainties. The pT -integrated cor-relation Gaussian width is shown by the arrow in the leftpanel. As seen from the figure, the ∆φ widths of the near-side jet-like correlations in Au+Au collisions are consis-tent with those from d+Au collisions at the correspond-ing pT . In addition, as shown in Fig. 14, the near-sidejet-like yields are the same between Au+Au and d+Au.In fact, the near-side jet-like correlations in Au+Au colli-sions of all φs bins are consistent with the minimum bias
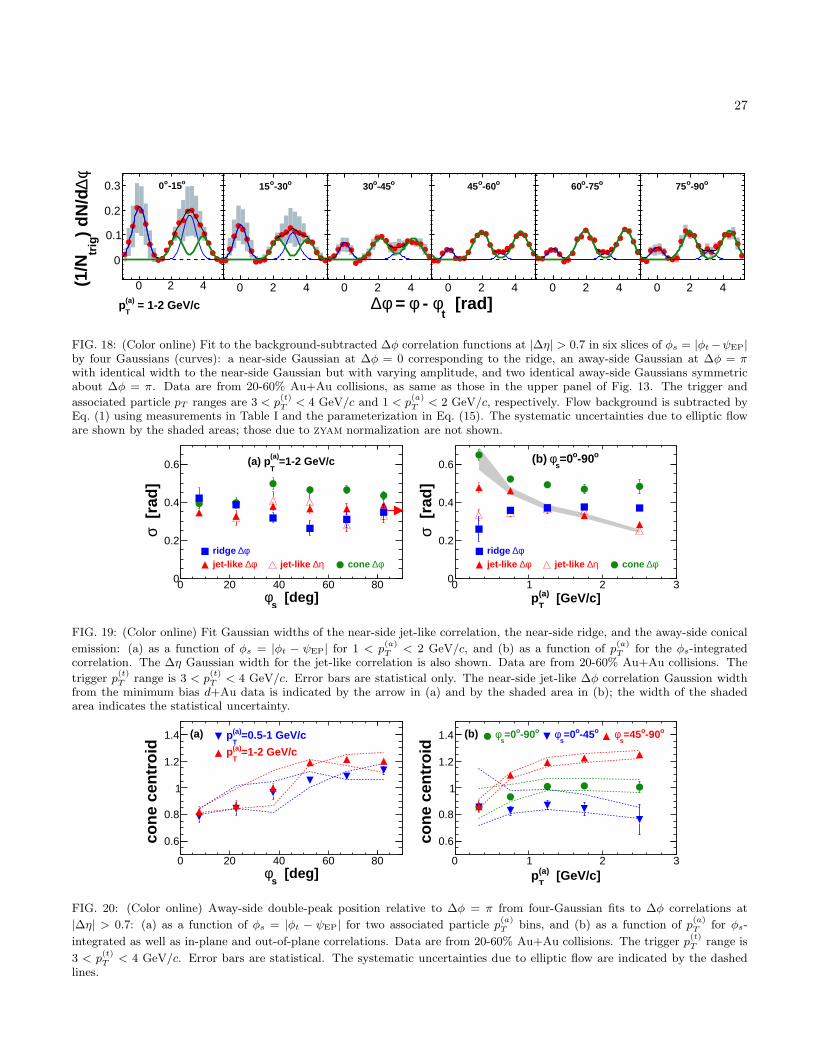
27
0 2 4
0
0.1
0.2
0.3 o-15o0
0 2 4
0
0.1
0.2
0.3 o-30o15
0 2 4
0
0.1
0.2
0.3 o-45o30
0 2 4
0
0.1
0.2
0.3 o-60o45
0 2 4
0
0.1
0.2
0.3 o-75o60
0 2 4
0
0.1
0.2
0.3 o-90o75
= 1-2 GeV/c(a)
Tp [rad]
tφ - φ = φ∆
φ∆)
dN/d
trig
(1/N
FIG. 18: (Color online) Fit to the background-subtracted ∆φ correlation functions at |∆η| > 0.7 in six slices of φs = |φt−ψEP|by four Gaussians (curves): a near-side Gaussian at ∆φ = 0 corresponding to the ridge, an away-side Gaussian at ∆φ = πwith identical width to the near-side Gaussian but with varying amplitude, and two identical away-side Gaussians symmetricabout ∆φ = π. Data are from 20-60% Au+Au collisions, as same as those in the upper panel of Fig. 13. The trigger and
associated particle pT ranges are 3 < p(t)T< 4 GeV/c and 1 < p
(a)T
< 2 GeV/c, respectively. Flow background is subtracted byEq. (1) using measurements in Table I and the parameterization in Eq. (15). The systematic uncertainties due to elliptic floware shown by the shaded areas; those due to zyam normalization are not shown.
0 20 40 60 800
0.2
0.4
0.6
η∆jet-like φ∆jet-like φ∆cone φ∆ridge
=1-2 GeV/c(a)
T(a) p
[ra
d]σ
[deg]s
φ0 1 2 30
0.2
0.4
0.6
η∆jet-like φ∆jet-like φ∆ridge
φ∆cone
o-90o=0s
φ(b)
[ra
d]σ
[GeV/c](a)T
p
FIG. 19: (Color online) Fit Gaussian widths of the near-side jet-like correlation, the near-side ridge, and the away-side conical
emission: (a) as a function of φs = |φt − ψEP| for 1 < p(a)T
< 2 GeV/c, and (b) as a function of p(a)T
for the φs-integratedcorrelation. The ∆η Gaussian width for the jet-like correlation is also shown. Data are from 20-60% Au+Au collisions. The
trigger p(t)T range is 3 < p
(t)T < 4 GeV/c. Error bars are statistical only. The near-side jet-like ∆φ correlation Gaussion width
from the minimum bias d+Au data is indicated by the arrow in (a) and by the shaded area in (b); the width of the shadedarea indicates the statistical uncertainty.
0 20 40 60 80
0.6
0.8
1
1.2
1.4 =0.5-1 GeV/c(a)
Tp
=1-2 GeV/c(a)
Tp
(a)
cone
cen
troi
d
[deg]s
φ0 1 2 3
0.6
0.8
1
1.2
1.4 o-90o=0s
φ o-45o=0s
φ o-90o=45s
φ(b)
cone
cen
troi
d
[GeV/c](a)T
p
FIG. 20: (Color online) Away-side double-peak position relative to ∆φ = π from four-Gaussian fits to ∆φ correlations at
|∆η| > 0.7: (a) as a function of φs = |φt − ψEP| for two associated particle p(a)T bins, and (b) as a function of p
(a)T for φs-
integrated as well as in-plane and out-of-plane correlations. Data are from 20-60% Au+Au collisions. The trigger p(t)T
range is
3 < p(t)T
< 4 GeV/c. Error bars are statistical. The systematic uncertainties due to elliptic flow are indicated by the dashedlines.
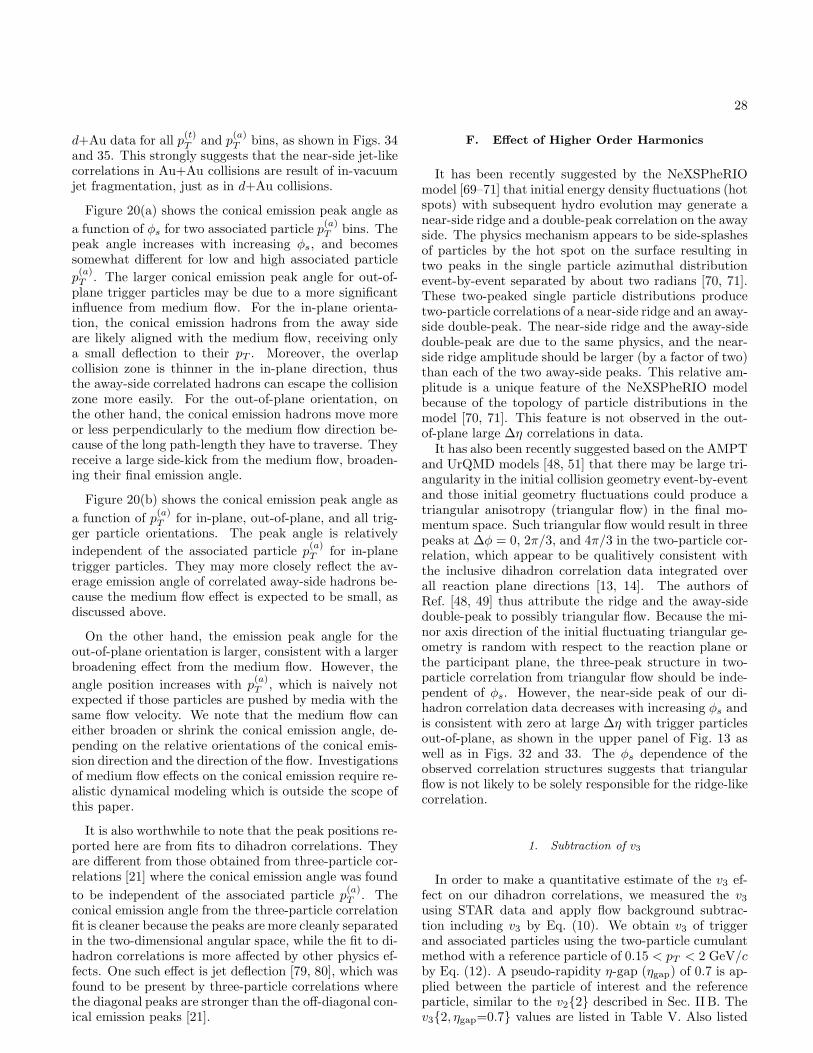
28
d+Au data for all p(t)T and p
(a)T bins, as shown in Figs. 34
and 35. This strongly suggests that the near-side jet-likecorrelations in Au+Au collisions are result of in-vacuumjet fragmentation, just as in d+Au collisions.
Figure 20(a) shows the conical emission peak angle as
a function of φs for two associated particle p(a)T bins. The
peak angle increases with increasing φs, and becomessomewhat different for low and high associated particle
p(a)T . The larger conical emission peak angle for out-of-
plane trigger particles may be due to a more significantinfluence from medium flow. For the in-plane orienta-tion, the conical emission hadrons from the away sideare likely aligned with the medium flow, receiving onlya small deflection to their pT . Moreover, the overlapcollision zone is thinner in the in-plane direction, thusthe away-side correlated hadrons can escape the collisionzone more easily. For the out-of-plane orientation, onthe other hand, the conical emission hadrons move moreor less perpendicularly to the medium flow direction be-cause of the long path-length they have to traverse. Theyreceive a large side-kick from the medium flow, broaden-ing their final emission angle.
Figure 20(b) shows the conical emission peak angle as
a function of p(a)T for in-plane, out-of-plane, and all trig-
ger particle orientations. The peak angle is relatively
independent of the associated particle p(a)T for in-plane
trigger particles. They may more closely reflect the av-erage emission angle of correlated away-side hadrons be-cause the medium flow effect is expected to be small, asdiscussed above.
On the other hand, the emission peak angle for theout-of-plane orientation is larger, consistent with a largerbroadening effect from the medium flow. However, the
angle position increases with p(a)T , which is naively not
expected if those particles are pushed by media with thesame flow velocity. We note that the medium flow caneither broaden or shrink the conical emission angle, de-pending on the relative orientations of the conical emis-sion direction and the direction of the flow. Investigationsof medium flow effects on the conical emission require re-alistic dynamical modeling which is outside the scope ofthis paper.
It is also worthwhile to note that the peak positions re-ported here are from fits to dihadron correlations. Theyare different from those obtained from three-particle cor-relations [21] where the conical emission angle was found
to be independent of the associated particle p(a)T . The
conical emission angle from the three-particle correlationfit is cleaner because the peaks are more cleanly separatedin the two-dimensional angular space, while the fit to di-hadron correlations is more affected by other physics ef-fects. One such effect is jet deflection [79, 80], which wasfound to be present by three-particle correlations wherethe diagonal peaks are stronger than the off-diagonal con-ical emission peaks [21].
F. Effect of Higher Order Harmonics
It has been recently suggested by the NeXSPheRIOmodel [69–71] that initial energy density fluctuations (hotspots) with subsequent hydro evolution may generate anear-side ridge and a double-peak correlation on the awayside. The physics mechanism appears to be side-splashesof particles by the hot spot on the surface resulting intwo peaks in the single particle azimuthal distributionevent-by-event separated by about two radians [70, 71].These two-peaked single particle distributions producetwo-particle correlations of a near-side ridge and an away-side double-peak. The near-side ridge and the away-sidedouble-peak are due to the same physics, and the near-side ridge amplitude should be larger (by a factor of two)than each of the two away-side peaks. This relative am-plitude is a unique feature of the NeXSPheRIO modelbecause of the topology of particle distributions in themodel [70, 71]. This feature is not observed in the out-of-plane large ∆η correlations in data.It has also been recently suggested based on the AMPT
and UrQMD models [48, 51] that there may be large tri-angularity in the initial collision geometry event-by-eventand those initial geometry fluctuations could produce atriangular anisotropy (triangular flow) in the final mo-mentum space. Such triangular flow would result in threepeaks at ∆φ = 0, 2π/3, and 4π/3 in the two-particle cor-relation, which appear to be qualitively consistent withthe inclusive dihadron correlation data integrated overall reaction plane directions [13, 14]. The authors ofRef. [48, 49] thus attribute the ridge and the away-sidedouble-peak to possibly triangular flow. Because the mi-nor axis direction of the initial fluctuating triangular ge-ometry is random with respect to the reaction plane orthe participant plane, the three-peak structure in two-particle correlation from triangular flow should be inde-pendent of φs. However, the near-side peak of our di-hadron correlation data decreases with increasing φs andis consistent with zero at large ∆η with trigger particlesout-of-plane, as shown in the upper panel of Fig. 13 aswell as in Figs. 32 and 33. The φs dependence of theobserved correlation structures suggests that triangularflow is not likely to be solely responsible for the ridge-likecorrelation.
1. Subtraction of v3
In order to make a quantitative estimate of the v3 ef-fect on our dihadron correlations, we measured the v3using STAR data and apply flow background subtrac-tion including v3 by Eq. (10). We obtain v3 of triggerand associated particles using the two-particle cumulantmethod with a reference particle of 0.15 < pT < 2 GeV/cby Eq. (12). A pseudo-rapidity η-gap (ηgap) of 0.7 is ap-plied between the particle of interest and the referenceparticle, similar to the v2{2} described in Sec. II B. Thev3{2, ηgap=0.7} values are listed in Table V. Also listed
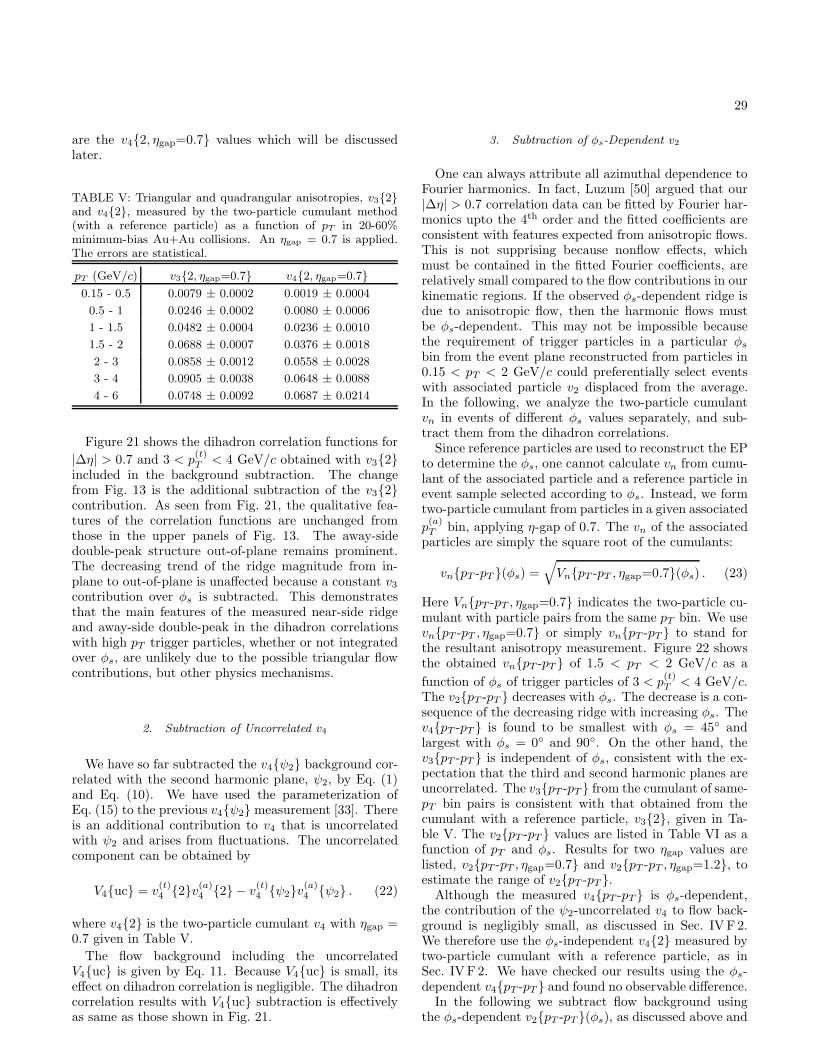
29
are the v4{2, ηgap=0.7} values which will be discussedlater.
TABLE V: Triangular and quadrangular anisotropies, v3{2}and v4{2}, measured by the two-particle cumulant method(with a reference particle) as a function of pT in 20-60%minimum-bias Au+Au collisions. An ηgap = 0.7 is applied.The errors are statistical.
pT (GeV/c) v3{2, ηgap=0.7} v4{2, ηgap=0.7}0.15 - 0.5 0.0079 ± 0.0002 0.0019 ± 0.0004
0.5 - 1 0.0246 ± 0.0002 0.0080 ± 0.0006
1 - 1.5 0.0482 ± 0.0004 0.0236 ± 0.0010
1.5 - 2 0.0688 ± 0.0007 0.0376 ± 0.0018
2 - 3 0.0858 ± 0.0012 0.0558 ± 0.0028
3 - 4 0.0905 ± 0.0038 0.0648 ± 0.0088
4 - 6 0.0748 ± 0.0092 0.0687 ± 0.0214
Figure 21 shows the dihadron correlation functions for
|∆η| > 0.7 and 3 < p(t)T < 4 GeV/c obtained with v3{2}
included in the background subtraction. The changefrom Fig. 13 is the additional subtraction of the v3{2}contribution. As seen from Fig. 21, the qualitative fea-tures of the correlation functions are unchanged fromthose in the upper panels of Fig. 13. The away-sidedouble-peak structure out-of-plane remains prominent.The decreasing trend of the ridge magnitude from in-plane to out-of-plane is unaffected because a constant v3contribution over φs is subtracted. This demonstratesthat the main features of the measured near-side ridgeand away-side double-peak in the dihadron correlationswith high pT trigger particles, whether or not integratedover φs, are unlikely due to the possible triangular flowcontributions, but other physics mechanisms.
2. Subtraction of Uncorrelated v4
We have so far subtracted the v4{ψ2} background cor-related with the second harmonic plane, ψ2, by Eq. (1)and Eq. (10). We have used the parameterization ofEq. (15) to the previous v4{ψ2} measurement [33]. Thereis an additional contribution to v4 that is uncorrelatedwith ψ2 and arises from fluctuations. The uncorrelatedcomponent can be obtained by
V4{uc} = v(t)4 {2}v(a)4 {2} − v
(t)4 {ψ2}v(a)4 {ψ2} . (22)
where v4{2} is the two-particle cumulant v4 with ηgap =0.7 given in Table V.
The flow background including the uncorrelatedV4{uc} is given by Eq. 11. Because V4{uc} is small, itseffect on dihadron correlation is negligible. The dihadroncorrelation results with V4{uc} subtraction is effectivelyas same as those shown in Fig. 21.
3. Subtraction of φs-Dependent v2
One can always attribute all azimuthal dependence toFourier harmonics. In fact, Luzum [50] argued that our|∆η| > 0.7 correlation data can be fitted by Fourier har-monics upto the 4th order and the fitted coefficients areconsistent with features expected from anisotropic flows.This is not supprising because nonflow effects, whichmust be contained in the fitted Fourier coefficients, arerelatively small compared to the flow contributions in ourkinematic regions. If the observed φs-dependent ridge isdue to anisotropic flow, then the harmonic flows mustbe φs-dependent. This may not be impossible becausethe requirement of trigger particles in a particular φsbin from the event plane reconstructed from particles in0.15 < pT < 2 GeV/c could preferentially select eventswith associated particle v2 displaced from the average.In the following, we analyze the two-particle cumulantvn in events of different φs values separately, and sub-tract them from the dihadron correlations.Since reference particles are used to reconstruct the EP
to determine the φs, one cannot calculate vn from cumu-lant of the associated particle and a reference particle inevent sample selected according to φs. Instead, we formtwo-particle cumulant from particles in a given associated
p(a)T bin, applying η-gap of 0.7. The vn of the associated
particles are simply the square root of the cumulants:
vn{pT -pT }(φs) =√
Vn{pT -pT , ηgap=0.7}(φs) . (23)
Here Vn{pT -pT , ηgap=0.7} indicates the two-particle cu-mulant with particle pairs from the same pT bin. We usevn{pT -pT , ηgap=0.7} or simply vn{pT -pT } to stand forthe resultant anisotropy measurement. Figure 22 showsthe obtained vn{pT -pT } of 1.5 < pT < 2 GeV/c as a
function of φs of trigger particles of 3 < p(t)T < 4 GeV/c.
The v2{pT -pT } decreases with φs. The decrease is a con-sequence of the decreasing ridge with increasing φs. Thev4{pT -pT } is found to be smallest with φs = 45◦ andlargest with φs = 0◦ and 90◦. On the other hand, thev3{pT -pT } is independent of φs, consistent with the ex-pectation that the third and second harmonic planes areuncorrelated. The v3{pT -pT } from the cumulant of same-pT bin pairs is consistent with that obtained from thecumulant with a reference particle, v3{2}, given in Ta-ble V. The v2{pT -pT } values are listed in Table VI as afunction of pT and φs. Results for two ηgap values arelisted, v2{pT -pT , ηgap=0.7} and v2{pT -pT , ηgap=1.2}, toestimate the range of v2{pT -pT }.Although the measured v4{pT -pT } is φs-dependent,
the contribution of the ψ2-uncorrelated v4 to flow back-ground is negligibly small, as discussed in Sec. IVF 2.We therefore use the φs-independent v4{2} measured bytwo-particle cumulant with a reference particle, as inSec. IVF 2. We have checked our results using the φs-dependent v4{pT -pT } and found no observable difference.In the following we subtract flow background using
the φs-dependent v2{pT -pT }(φs), as discussed above and
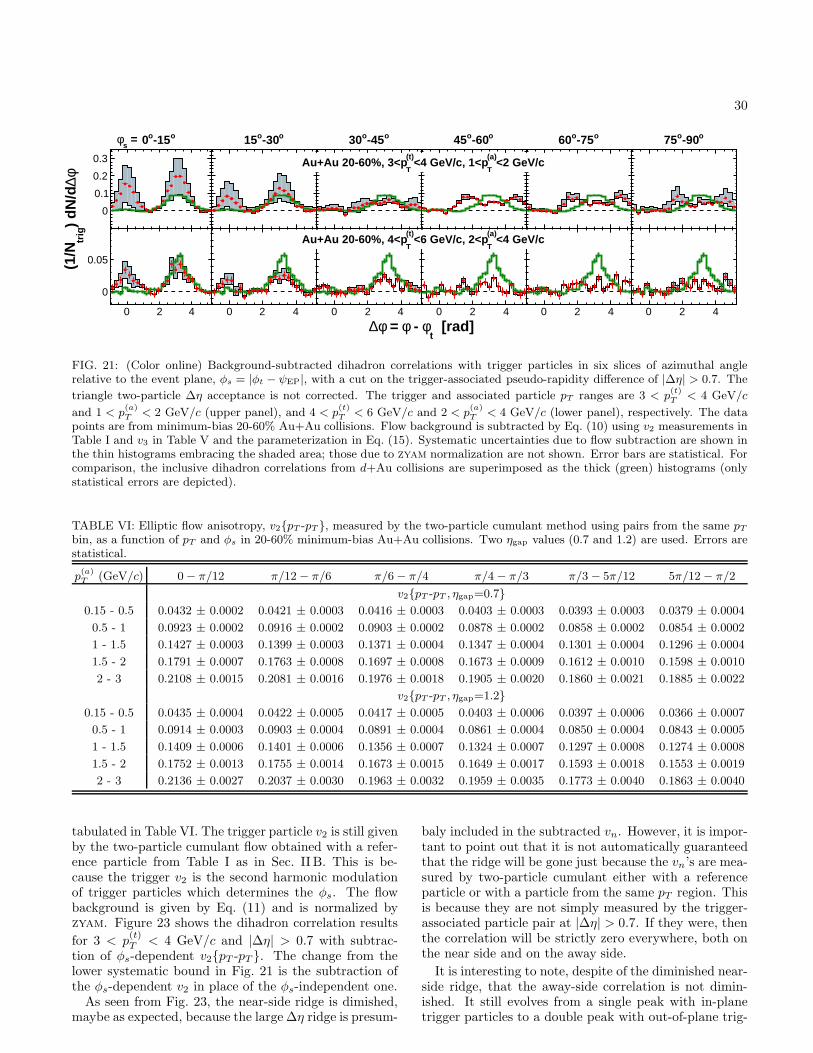
30
o-15o0
0
0.1
0.2
0.3
o-30o15
0
0.1
0.2
0.3
o-45o30
0
0.1
0.2
0.3
o-60o45
0
0.1
0.2
0.3
o-75o60
0
0.1
0.2
0.3
o-90o75
0
0.1
0.2
0.3
0 2 4
0
0.05
0 2 4
0
0.05
0 2 4
0
0.05
0 2 4
0
0.05
0 2 4
0
0.05
0 2 4
0
0.05
=s
φ
[rad]t
φ - φ = φ∆
φ∆)
dN/d
trig
(1/N
<2 GeV/c(a)
T<4 GeV/c, 1<p
(t)
TAu+Au 20-60%, 3<p
<4 GeV/c(a)
T<6 GeV/c, 2<p
(t)
TAu+Au 20-60%, 4<p
FIG. 21: (Color online) Background-subtracted dihadron correlations with trigger particles in six slices of azimuthal anglerelative to the event plane, φs = |φt − ψEP|, with a cut on the trigger-associated pseudo-rapidity difference of |∆η| > 0.7. The
triangle two-particle ∆η acceptance is not corrected. The trigger and associated particle pT ranges are 3 < p(t)T
< 4 GeV/c
and 1 < p(a)T < 2 GeV/c (upper panel), and 4 < p
(t)T < 6 GeV/c and 2 < p
(a)T < 4 GeV/c (lower panel), respectively. The data
points are from minimum-bias 20-60% Au+Au collisions. Flow background is subtracted by Eq. (10) using v2 measurements inTable I and v3 in Table V and the parameterization in Eq. (15). Systematic uncertainties due to flow subtraction are shown inthe thin histograms embracing the shaded area; those due to zyam normalization are not shown. Error bars are statistical. Forcomparison, the inclusive dihadron correlations from d+Au collisions are superimposed as the thick (green) histograms (onlystatistical errors are depicted).
TABLE VI: Elliptic flow anisotropy, v2{pT -pT }, measured by the two-particle cumulant method using pairs from the same pTbin, as a function of pT and φs in 20-60% minimum-bias Au+Au collisions. Two ηgap values (0.7 and 1.2) are used. Errors arestatistical.
p(a)T (GeV/c) 0− π/12 π/12− π/6 π/6− π/4 π/4− π/3 π/3− 5π/12 5π/12− π/2
v2{pT -pT , ηgap=0.7}0.15 - 0.5 0.0432 ± 0.0002 0.0421 ± 0.0003 0.0416 ± 0.0003 0.0403 ± 0.0003 0.0393 ± 0.0003 0.0379 ± 0.0004
0.5 - 1 0.0923 ± 0.0002 0.0916 ± 0.0002 0.0903 ± 0.0002 0.0878 ± 0.0002 0.0858 ± 0.0002 0.0854 ± 0.0002
1 - 1.5 0.1427 ± 0.0003 0.1399 ± 0.0003 0.1371 ± 0.0004 0.1347 ± 0.0004 0.1301 ± 0.0004 0.1296 ± 0.0004
1.5 - 2 0.1791 ± 0.0007 0.1763 ± 0.0008 0.1697 ± 0.0008 0.1673 ± 0.0009 0.1612 ± 0.0010 0.1598 ± 0.0010
2 - 3 0.2108 ± 0.0015 0.2081 ± 0.0016 0.1976 ± 0.0018 0.1905 ± 0.0020 0.1860 ± 0.0021 0.1885 ± 0.0022
v2{pT -pT , ηgap=1.2}0.15 - 0.5 0.0435 ± 0.0004 0.0422 ± 0.0005 0.0417 ± 0.0005 0.0403 ± 0.0006 0.0397 ± 0.0006 0.0366 ± 0.0007
0.5 - 1 0.0914 ± 0.0003 0.0903 ± 0.0004 0.0891 ± 0.0004 0.0861 ± 0.0004 0.0850 ± 0.0004 0.0843 ± 0.0005
1 - 1.5 0.1409 ± 0.0006 0.1401 ± 0.0006 0.1356 ± 0.0007 0.1324 ± 0.0007 0.1297 ± 0.0008 0.1274 ± 0.0008
1.5 - 2 0.1752 ± 0.0013 0.1755 ± 0.0014 0.1673 ± 0.0015 0.1649 ± 0.0017 0.1593 ± 0.0018 0.1553 ± 0.0019
2 - 3 0.2136 ± 0.0027 0.2037 ± 0.0030 0.1963 ± 0.0032 0.1959 ± 0.0035 0.1773 ± 0.0040 0.1863 ± 0.0040
tabulated in Table VI. The trigger particle v2 is still givenby the two-particle cumulant flow obtained with a refer-ence particle from Table I as in Sec. II B. This is be-cause the trigger v2 is the second harmonic modulationof trigger particles which determines the φs. The flowbackground is given by Eq. (11) and is normalized byzyam. Figure 23 shows the dihadron correlation results
for 3 < p(t)T < 4 GeV/c and |∆η| > 0.7 with subtrac-
tion of φs-dependent v2{pT -pT }. The change from thelower systematic bound in Fig. 21 is the subtraction ofthe φs-dependent v2 in place of the φs-independent one.As seen from Fig. 23, the near-side ridge is dimished,
maybe as expected, because the large ∆η ridge is presum-
baly included in the subtracted vn. However, it is impor-tant to point out that it is not automatically guaranteedthat the ridge will be gone just because the vn’s are mea-sured by two-particle cumulant either with a referenceparticle or with a particle from the same pT region. Thisis because they are not simply measured by the trigger-associated particle pair at |∆η| > 0.7. If they were, thenthe correlation will be strictly zero everywhere, both onthe near side and on the away side.
It is interesting to note, despite of the diminished near-side ridge, that the away-side correlation is not dimin-ished. It still evolves from a single peak with in-planetrigger particles to a double peak with out-of-plane trig-
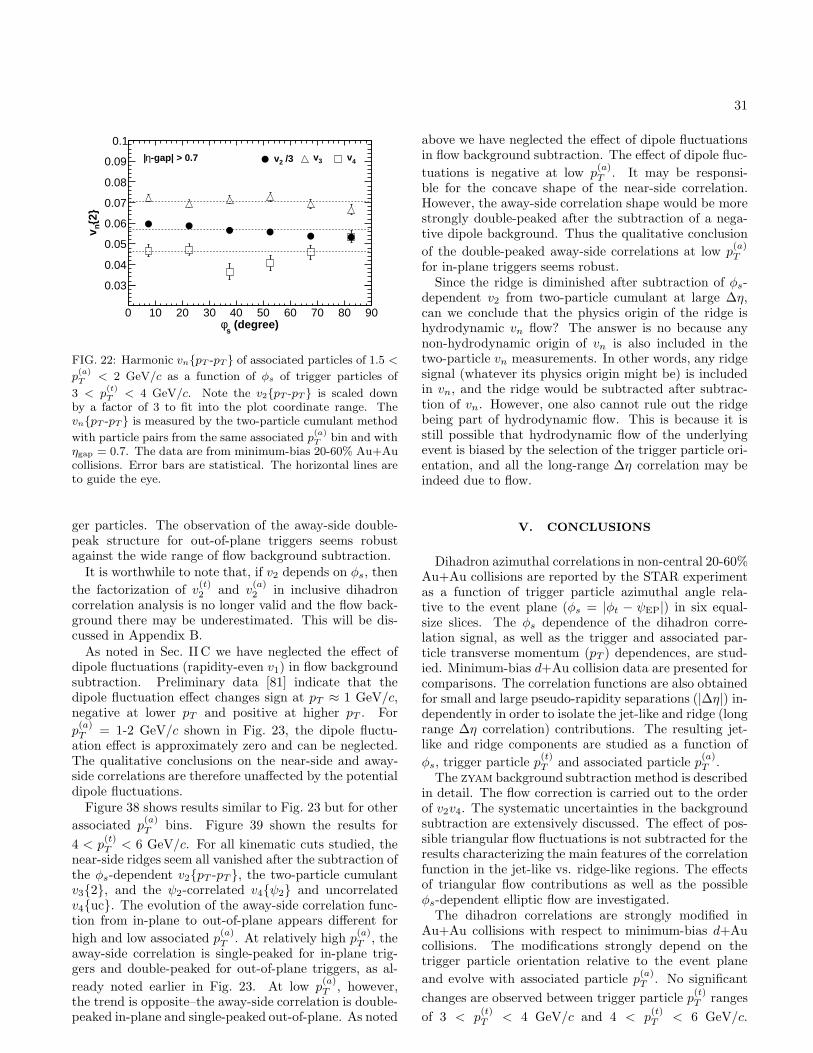
31
0 10 20 30 40 50 60 70 80 90
0.03
0.04
0.05
0.06
0.07
0.08
0.09
0.1-gap| > 0.7η|
(degree)s
φ
{2}
nv
/32v 3v 4v
FIG. 22: Harmonic vn{pT -pT } of associated particles of 1.5 <
p(a)T
< 2 GeV/c as a function of φs of trigger particles of
3 < p(t)T
< 4 GeV/c. Note the v2{pT -pT } is scaled downby a factor of 3 to fit into the plot coordinate range. Thevn{pT -pT } is measured by the two-particle cumulant method
with particle pairs from the same associated p(a)T bin and with
ηgap = 0.7. The data are from minimum-bias 20-60% Au+Aucollisions. Error bars are statistical. The horizontal lines areto guide the eye.
ger particles. The observation of the away-side double-peak structure for out-of-plane triggers seems robustagainst the wide range of flow background subtraction.It is worthwhile to note that, if v2 depends on φs, then
the factorization of v(t)2 and v
(a)2 in inclusive dihadron
correlation analysis is no longer valid and the flow back-ground there may be underestimated. This will be dis-cussed in Appendix B.As noted in Sec. II C we have neglected the effect of
dipole fluctuations (rapidity-even v1) in flow backgroundsubtraction. Preliminary data [81] indicate that thedipole fluctuation effect changes sign at pT ≈ 1 GeV/c,negative at lower pT and positive at higher pT . For
p(a)T = 1-2 GeV/c shown in Fig. 23, the dipole fluctu-
ation effect is approximately zero and can be neglected.The qualitative conclusions on the near-side and away-side correlations are therefore unaffected by the potentialdipole fluctuations.Figure 38 shows results similar to Fig. 23 but for other
associated p(a)T bins. Figure 39 shown the results for
4 < p(t)T < 6 GeV/c. For all kinematic cuts studied, the
near-side ridges seem all vanished after the subtraction ofthe φs-dependent v2{pT -pT }, the two-particle cumulantv3{2}, and the ψ2-correlated v4{ψ2} and uncorrelatedv4{uc}. The evolution of the away-side correlation func-tion from in-plane to out-of-plane appears different for
high and low associated p(a)T . At relatively high p
(a)T , the
away-side correlation is single-peaked for in-plane trig-gers and double-peaked for out-of-plane triggers, as al-
ready noted earlier in Fig. 23. At low p(a)T , however,
the trend is opposite–the away-side correlation is double-peaked in-plane and single-peaked out-of-plane. As noted
above we have neglected the effect of dipole fluctuationsin flow background subtraction. The effect of dipole fluc-
tuations is negative at low p(a)T . It may be responsi-
ble for the concave shape of the near-side correlation.However, the away-side correlation shape would be morestrongly double-peaked after the subtraction of a nega-tive dipole background. Thus the qualitative conclusion
of the double-peaked away-side correlations at low p(a)T
for in-plane triggers seems robust.Since the ridge is diminished after subtraction of φs-
dependent v2 from two-particle cumulant at large ∆η,can we conclude that the physics origin of the ridge ishydrodynamic vn flow? The answer is no because anynon-hydrodynamic origin of vn is also included in thetwo-particle vn measurements. In other words, any ridgesignal (whatever its physics origin might be) is includedin vn, and the ridge would be subtracted after subtrac-tion of vn. However, one also cannot rule out the ridgebeing part of hydrodynamic flow. This is because it isstill possible that hydrodynamic flow of the underlyingevent is biased by the selection of the trigger particle ori-entation, and all the long-range ∆η correlation may beindeed due to flow.
V. CONCLUSIONS
Dihadron azimuthal correlations in non-central 20-60%Au+Au collisions are reported by the STAR experimentas a function of trigger particle azimuthal angle rela-tive to the event plane (φs = |φt − ψEP|) in six equal-size slices. The φs dependence of the dihadron corre-lation signal, as well as the trigger and associated par-ticle transverse momentum (pT ) dependences, are stud-ied. Minimum-bias d+Au collision data are presented forcomparisons. The correlation functions are also obtainedfor small and large pseudo-rapidity separations (|∆η|) in-dependently in order to isolate the jet-like and ridge (longrange ∆η correlation) contributions. The resulting jet-like and ridge components are studied as a function of
φs, trigger particle p(t)T and associated particle p
(a)T .
The zyam background subtraction method is describedin detail. The flow correction is carried out to the orderof v2v4. The systematic uncertainties in the backgroundsubtraction are extensively discussed. The effect of pos-sible triangular flow fluctuations is not subtracted for theresults characterizing the main features of the correlationfunction in the jet-like vs. ridge-like regions. The effectsof triangular flow contributions as well as the possibleφs-dependent elliptic flow are investigated.The dihadron correlations are strongly modified in
Au+Au collisions with respect to minimum-bias d+Aucollisions. The modifications strongly depend on thetrigger particle orientation relative to the event plane
and evolve with associated particle p(a)T . No significant
changes are observed between trigger particle p(t)T ranges
of 3 < p(t)T < 4 GeV/c and 4 < p
(t)T < 6 GeV/c.
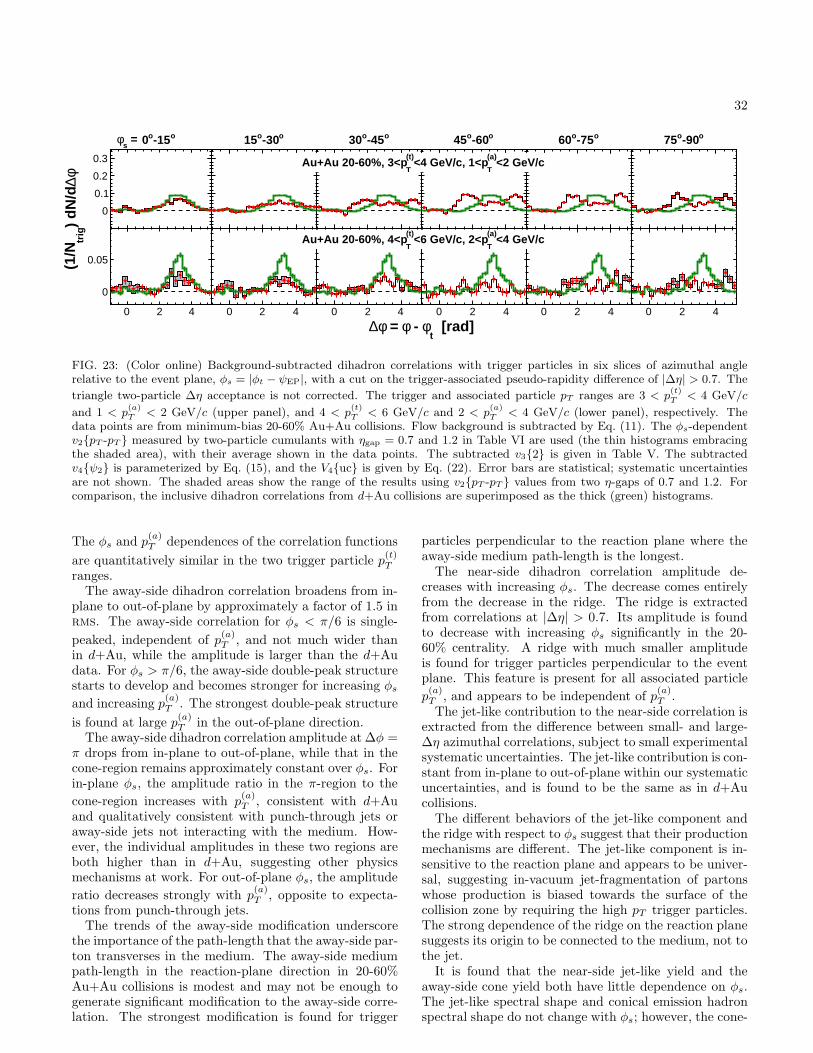
32
o-15o0
0
0.1
0.2
0.3
o-30o15
0
0.1
0.2
0.3
o-45o30
0
0.1
0.2
0.3
o-60o45
0
0.1
0.2
0.3
o-75o60
0
0.1
0.2
0.3
o-90o75
0
0.1
0.2
0.3
0 2 4
0
0.05
0 2 4
0
0.05
0 2 4
0
0.05
0 2 4
0
0.05
0 2 4
0
0.05
0 2 4
0
0.05
=s
φ
[rad]t
φ - φ = φ∆
φ∆)
dN/d
trig
(1/N
<2 GeV/c(a)
T<4 GeV/c, 1<p
(t)
TAu+Au 20-60%, 3<p
<4 GeV/c(a)
T<6 GeV/c, 2<p
(t)
TAu+Au 20-60%, 4<p
FIG. 23: (Color online) Background-subtracted dihadron correlations with trigger particles in six slices of azimuthal anglerelative to the event plane, φs = |φt − ψEP|, with a cut on the trigger-associated pseudo-rapidity difference of |∆η| > 0.7. The
triangle two-particle ∆η acceptance is not corrected. The trigger and associated particle pT ranges are 3 < p(t)T
< 4 GeV/c
and 1 < p(a)T < 2 GeV/c (upper panel), and 4 < p
(t)T < 6 GeV/c and 2 < p
(a)T < 4 GeV/c (lower panel), respectively. The
data points are from minimum-bias 20-60% Au+Au collisions. Flow background is subtracted by Eq. (11). The φs-dependentv2{pT -pT } measured by two-particle cumulants with ηgap = 0.7 and 1.2 in Table VI are used (the thin histograms embracingthe shaded area), with their average shown in the data points. The subtracted v3{2} is given in Table V. The subtractedv4{ψ2} is parameterized by Eq. (15), and the V4{uc} is given by Eq. (22). Error bars are statistical; systematic uncertaintiesare not shown. The shaded areas show the range of the results using v2{pT -pT } values from two η-gaps of 0.7 and 1.2. Forcomparison, the inclusive dihadron correlations from d+Au collisions are superimposed as the thick (green) histograms.
The φs and p(a)T dependences of the correlation functions
are quantitatively similar in the two trigger particle p(t)T
ranges.The away-side dihadron correlation broadens from in-
plane to out-of-plane by approximately a factor of 1.5 inrms. The away-side correlation for φs < π/6 is single-
peaked, independent of p(a)T , and not much wider than
in d+Au, while the amplitude is larger than the d+Audata. For φs > π/6, the away-side double-peak structurestarts to develop and becomes stronger for increasing φsand increasing p
(a)T . The strongest double-peak structure
is found at large p(a)T in the out-of-plane direction.
The away-side dihadron correlation amplitude at ∆φ =π drops from in-plane to out-of-plane, while that in thecone-region remains approximately constant over φs. Forin-plane φs, the amplitude ratio in the π-region to the
cone-region increases with p(a)T , consistent with d+Au
and qualitatively consistent with punch-through jets oraway-side jets not interacting with the medium. How-ever, the individual amplitudes in these two regions areboth higher than in d+Au, suggesting other physicsmechanisms at work. For out-of-plane φs, the amplitude
ratio decreases strongly with p(a)T , opposite to expecta-
tions from punch-through jets.The trends of the away-side modification underscore
the importance of the path-length that the away-side par-ton transverses in the medium. The away-side mediumpath-length in the reaction-plane direction in 20-60%Au+Au collisions is modest and may not be enough togenerate significant modification to the away-side corre-lation. The strongest modification is found for trigger
particles perpendicular to the reaction plane where theaway-side medium path-length is the longest.The near-side dihadron correlation amplitude de-
creases with increasing φs. The decrease comes entirelyfrom the decrease in the ridge. The ridge is extractedfrom correlations at |∆η| > 0.7. Its amplitude is foundto decrease with increasing φs significantly in the 20-60% centrality. A ridge with much smaller amplitudeis found for trigger particles perpendicular to the eventplane. This feature is present for all associated particle
p(a)T , and appears to be independent of p
(a)T .
The jet-like contribution to the near-side correlation isextracted from the difference between small- and large-∆η azimuthal correlations, subject to small experimentalsystematic uncertainties. The jet-like contribution is con-stant from in-plane to out-of-plane within our systematicuncertainties, and is found to be the same as in d+Aucollisions.The different behaviors of the jet-like component and
the ridge with respect to φs suggest that their productionmechanisms are different. The jet-like component is in-sensitive to the reaction plane and appears to be univer-sal, suggesting in-vacuum jet-fragmentation of partonswhose production is biased towards the surface of thecollision zone by requiring the high pT trigger particles.The strong dependence of the ridge on the reaction planesuggests its origin to be connected to the medium, not tothe jet.It is found that the near-side jet-like yield and the
away-side cone yield both have little dependence on φs.The jet-like spectral shape and conical emission hadronspectral shape do not change with φs; however, the cone-
33
region spectra are softer than the jet-like spectra. The
jet-like spectrum for 4 < p(t)T < 6 GeV/c is somewhat
harder than that for 3 < p(t)T < 4 GeV/c, while the
cone spectra remain the same between the two trigger
p(t)T ranges. These results suggest that the away-side
conical emission hadrons are related to the away jet part-ner, in approximate energy balance with the near-side jet,but their production mechanism is different from that ofjet fragments. The near-side jet-like correlated hadronsare likely produced from in-vacuum fragmentation, whilecorrelated hadrons in the away-side cone-region likelyemerge from conical flow, which is related to mediumproperties.
On the other hand, the near-side ridge and the away-side π-region appear to trace each other as a function of
φs, and also approximately as a function of p(a)T , suggest-
ing the possibility of a back-to-back ridge. This wouldbe consistent with the recent suggestion that the ridgemay be generated by fluctuations in the initial color fluxtubes focused by transverse radial flow. Such a picturewould also explain the decreasing ridge from in-plane toout-of-plane because both the color flux tubes and theradial flow are the strongest along the in-plane direction.However, it remains unclear why the ridge particles are
much harder than inclusive hadrons in our measured p(a)T
region.The dihadron correlation structure is fit with a four-
Gaussian model representing a back-to-back ridge and anaway-side conical emission. The fitted conical emissionangle increases from in-plane to out-of-plane. The largerconical emission angle out-of-plane may be due to the ef-fect of medium flow. For in-plane trigger particles, theaway-side conical emission angle is approximately con-
stant over the associated particle p(a)T . For out-of-plane
trigger particles, the away-side conical emission angle in-
creases with p(a)T . The larger emission angle at large p
(a)T
seems counterintuitive as a result of broadening by themedium flow. More studies are needed to further ourunderstanding of the away-side correlation structure.
The dihadron correlations are also studied with sub-traction of triangular anisotropy measured by the two-particle cumulant method with a η-gap (ηgap) of 0.7.The triangular anisotropy with larger ηgap is significantlysmaller. The qualitative feature of the correlation data isunchanged. The ridge, with a reduced magnitude, is stillpresent for in-plane trigger particles. It decreases fromin-plane to out-of-plane.Finally we consider the effect of a vn that is dependent
on the trigger-particle φs. We analyzed the two-particlecumulants vn{pT -pT } in events with different trigger par-ticle φs separately. The second harmonic v2{pT -pT } isfound to decrease with increasing φs. This is synony-mous to the decreasing ridge magnitude with φs. Thefourth harmonic v4{pT -pT } is found to also depend onφs, but its effect on dihadron correlation is negligible.The third harmonic v3{pT -pT } is found to be indepen-dent of φs. The dihadron correlations are studied rela-
tive to the event plane with the subtraction of the two-particle cumulants, v3{2, ηgap=0.7}, v4{2, ηgap=0.7} andthe φs-dependent v2{pT -pT , ηgap=0.7}(φs). With thisexploratory subtraction of the vn values, the ridge isfound to be eliminated. However, this result does notenlighten the origin of the ridge because the measuredvn have likely already included the ridge; whether theridge is due to flow or nonflow is undetermined. Onthe other hand, the away-side double-peak structure forout-of-plane triggers remains robust even with the sub-traction of φs-dependent vn{pT -pT , ηgap=0.7}. This in-dicates medium effect to the away-side jet propagationand the effect depends on the pathlength the away-sidejet traverses.To summarize our main findings, high pT triggered jets
are biased towards surface emission, and the jet fragmen-tation is hardly modified by the medium. Away side part-ner jets interact maximally with the medium in the di-rection perpendicular to the reaction plane. These inter-actions result in a conical emission of correlated hadronsand the strong double-peak correlation structure on theaway side. The near-side jet-like component and theconical emission hadrons appear to have a fixed rela-tive energy balance. The near-side jet-like componentis accompanied by the ridge in the reaction-plane direc-tion. The ridge magnitude drops rapidly with increas-ing φs and largely disappears out-of-plane in mid-central20-60% Au+Au collisions. The away-side π-region am-plitude appears to trace the near-side ridge amplitude,suggesting a back-to-back ridge. The large hadron yieldin the π-region with in-plane trigger particles results ina single correlation peak on the away side, even thoughthe cone hadron yield is as appreciable as for other trig-ger particle orientations. The most natural explanationfor our results seems to be the combination of a near-side in-vacuum jet-fragmentation, a back-to-back ridgein the reaction plane, and an away-side conical emissioninduced by jet-medium interactions.
Appendix A: Effect of Possible Biases in
Event-Plane Reconstruction
In our analysis, the event plane is reconstructed byparticles excluding those within |∆η| < 0.5 of the trig-ger particle. Question remains how much is the effect ofpossible biases to the reconstructed event plane by par-ticles correlated to the trigger, especially on the awayside. One way to estimate this possible effect is to ana-lyze dihadron correlations relative to the event plane re-constructed from particles without exluding those within|∆η| < 0.5 of the trigger, thereby maximizing the biasesfrom jet-correlations. These results (subtracted by v2,v4(ψ2), and v3 backgrounds with resolutions correspond-ing to the new EP) are shown in the upper panels ofFig. 24. The differences between these results and ourdefault results in Fig. 21 are shown in the lower panels ofFig. 24. By including in EP those particles close to the
34
trigger in η, the correlated yield at ∆φ = 0 for in-planetriggers is smaller, and for out-of-plane triggers, larger.The correlated yield at ∆φ = 0 is not larger for in-planetriggers as one would naively expect from a more alignedEP is because the associated pT bin is always excludedfrom EP reconstruction. We have verified, if the associ-ated pT bin is included in EP, that the associated yieldat ∆φ = 0 for in-plane triggers is significantly enhancedas expected.As seen from Fig. 24, introducing a stronger bias in
EP reconstruction causes a relatively small change in thecorrelation signals. This suggests that possible EP biasesin our default results in Fig. 21 may be also relativelysmall.
Appendix B: Implications of Possible φs-Dependent
v2 on Inclusive Dihadron Correlations
If v2 depends on φs, then there is an important im-plication to the inclusive dihadron correlation (i.e., with-out cutting on φs). For inclusive dihadron correlation, a
flow background 〈v(t)2 {2}〉 · 〈v(a)2 {2}〉 has been used so
far for 〈v(t)2 {2} · v(a)2 {2}〉. (Note, for clarity, we haveomitted the 〈...〉 notation throughout the paper excepthere.) This is correct because fluctuations are already in-cluded in the two-particle cumulant flow measurement of〈v2{2}〉. However, if v2 depends on trigger particle orien-
tation φs, then the equality 〈v(t)2 {2}(φs) · v(a)2 {2}(φs)〉 =〈v(t)2 {2}(φs)〉 · 〈v(a)2 {2}(φs)〉 is no longer valid. The leftside is always larger than the right side. This meansthat the inclusive dihadron flow background is underesti-
mated by 〈v(t)2 {2}〉·〈v(a)2 {2}〉. In fact, because v(t)2 {2}(φs)
is positive for φs ∼ 0 and negative for φs ∼ π/2, thetrue background magnitude for inclusive dihadron corre-lation is even larger than that for the φs = 0 dihadroncorrelation, which has the largest background magni-
tude of all φs bins. Namely 〈v(t)2 {2}(φs) · v(a)2 {2}(φs)〉 >〈v(t)2 {2}〉 · v(a)2 {2}(φs = 0).Fig. 25 illustrates the effect. The upper panel shows
the raw dihadron correlation for 3 < p(t)T < 4 GeV/c and
1 < p(a)T < 1.5 GeV/c together with two flow background
curves both zyam-normalized. The blue histogram isfrom a traditional inclusive dihadron correlation anal-ysis with the v2 modulation calculated from 〈v(t)2 {2}〉 ·〈v(a)2 {2}〉. The red histogram is that calculated from
the φs-dependent v2{2}(φs) by 〈v(t)2 {2}(φs) ·v(a)2 {2}(φs)〉
which is the correct flow background provided v2(φs)is the real flow. (The v3 and v4 contributions are in-cluded in both flow background histograms). As seenfrom Fig. 25, the traditional flow background is underes-timated. The lower panel of Fig. 25 shows the dihadroncorrelation signals after subtraction of the traditionalbackground in the histogram and by the correct flowbackground in the data points, respectively. The signalfrom the traditional average flow background subtractionis less double-peaked. This means, if the ridge is entirelydue to flow that must be φs-dependent, then all the inclu-sive dihadron correlation analyses have under-subtractedthe flow background, resulting in a more peaked away-side correlation signal.
Appendix C: Dihadron Correlation Functions
This appendix presents dihadron correlation functions.Figures 26, 27, 28, and 29 show the raw correlationfunctions. Figures 30, 31, 32, and 33 show the v2, v4and zyam background-subtracted correlation functions.Figures 34 and 35 show the near-side jet-like correla-tion functions. Figures 36, 37, 38, and 39 show thev2, v3, v4 and zyam background-subtracted correlationfunctions. The data for the correlation functions andall other figures in the paper are published on-line athttp://www.star.bnl.gov/central/publications/.
Acknowledgments
We thank the RHIC Operations Group and RCF atBNL, the NERSC Center at LBNL and the Open Sci-ence Grid consortium for providing resources and sup-port. This work was supported in part by the Officesof NP and HEP within the U.S. DOE Office of Sci-ence, the U.S. NSF, the Sloan Foundation, the DFG clus-ter of excellence ‘Origin and Structure of the Universe’of Germany, CNRS/IN2P3, STFC and EPSRC of theUnited Kingdom, FAPESP CNPq of Brazil, Ministry ofEd. and Sci. of the Russian Federation, NNSFC, CAS,MoST, and MoE of China, GA and MSMT of the CzechRepublic, FOM and NWO of the Netherlands, DAE,DST, and CSIR of India, Polish Ministry of Sci. andHigher Ed., Korea Research Foundation, Ministry of Sci.,Ed. and Sports of the Rep. Of Croatia, Russian Ministryof Sci. and Tech, and RosAtom of Russia.
[1] I. Arsene et al. (BRAHMS Collaboration),Nucl. Phys. A757, 1 (2005).
[2] B. B. Back et al. (PHOBOS Collaboration),Nucl. Phys. A757, 28 (2005).
[3] J. Adams et al. (STAR Collaboration),
Nucl. Phys. A757, 102 (2005).[4] K. Adcox et al. (PHENIX Collaboration),
Nucl. Phys. A757, 184 (2005).[5] H. Zhang et al., Phys. Rev. Lett. 98, 212301 (2007).[6] C. Adler et al. (STAR Collaboration),
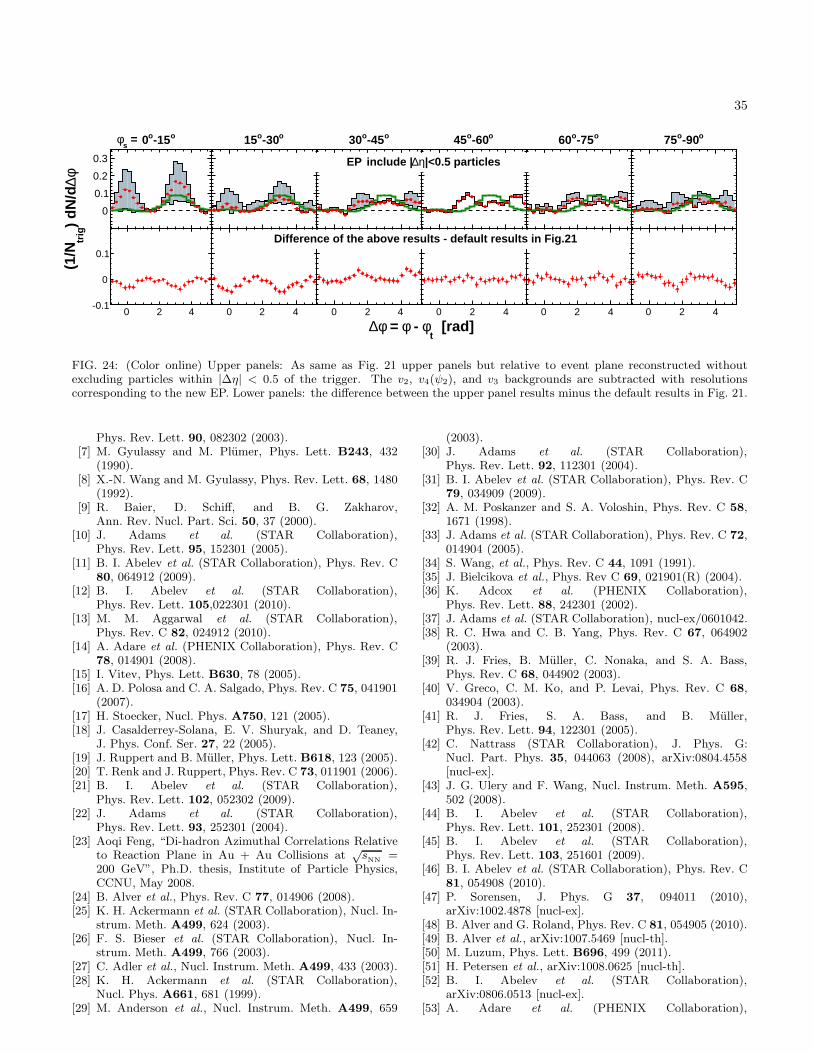
35
o-15o0
0
0.1
0.2
0.3
o-30o15
0
0.1
0.2
0.3
o-45o30
0
0.1
0.2
0.3
o-60o45
0
0.1
0.2
0.3
o-75o60
0
0.1
0.2
0.3
o-90o75
0
0.1
0.2
0.3
0 2 4-0.1
0
0.1
0 2 4-0.1
0
0.1
0 2 4-0.1
0
0.1
0 2 4-0.1
0
0.1
0 2 4-0.1
0
0.1
0 2 4-0.1
0
0.1
=s
φ
[rad]t
φ - φ = φ∆
φ∆)
dN/d
trig
(1/N
|<0.5 particlesη∆ include | EP
Difference of the above results - default results in Fig.21
FIG. 24: (Color online) Upper panels: As same as Fig. 21 upper panels but relative to event plane reconstructed withoutexcluding particles within |∆η| < 0.5 of the trigger. The v2, v4(ψ2), and v3 backgrounds are subtracted with resolutionscorresponding to the new EP. Lower panels: the difference between the upper panel results minus the default results in Fig. 21.
Phys. Rev. Lett. 90, 082302 (2003).[7] M. Gyulassy and M. Plumer, Phys. Lett. B243, 432
(1990).[8] X.-N. Wang and M. Gyulassy, Phys. Rev. Lett. 68, 1480
(1992).[9] R. Baier, D. Schiff, and B. G. Zakharov,
Ann. Rev. Nucl. Part. Sci. 50, 37 (2000).[10] J. Adams et al. (STAR Collaboration),
Phys. Rev. Lett. 95, 152301 (2005).[11] B. I. Abelev et al. (STAR Collaboration), Phys. Rev. C
80, 064912 (2009).[12] B. I. Abelev et al. (STAR Collaboration),
Phys. Rev. Lett. 105,022301 (2010).[13] M. M. Aggarwal et al. (STAR Collaboration),
Phys. Rev. C 82, 024912 (2010).[14] A. Adare et al. (PHENIX Collaboration), Phys. Rev. C
78, 014901 (2008).[15] I. Vitev, Phys. Lett. B630, 78 (2005).[16] A. D. Polosa and C. A. Salgado, Phys. Rev. C 75, 041901
(2007).[17] H. Stoecker, Nucl. Phys. A750, 121 (2005).[18] J. Casalderrey-Solana, E. V. Shuryak, and D. Teaney,
J. Phys. Conf. Ser. 27, 22 (2005).[19] J. Ruppert and B. Muller, Phys. Lett. B618, 123 (2005).[20] T. Renk and J. Ruppert, Phys. Rev. C 73, 011901 (2006).[21] B. I. Abelev et al. (STAR Collaboration),
Phys. Rev. Lett. 102, 052302 (2009).[22] J. Adams et al. (STAR Collaboration),
Phys. Rev. Lett. 93, 252301 (2004).[23] Aoqi Feng, “Di-hadron Azimuthal Correlations Relative
to Reaction Plane in Au + Au Collisions at√sNN
=200 GeV”, Ph.D. thesis, Institute of Particle Physics,CCNU, May 2008.
[24] B. Alver et al., Phys. Rev. C 77, 014906 (2008).[25] K. H. Ackermann et al. (STAR Collaboration), Nucl. In-
strum. Meth. A499, 624 (2003).[26] F. S. Bieser et al. (STAR Collaboration), Nucl. In-
strum. Meth. A499, 766 (2003).[27] C. Adler et al., Nucl. Instrum. Meth. A499, 433 (2003).[28] K. H. Ackermann et al. (STAR Collaboration),
Nucl. Phys. A661, 681 (1999).[29] M. Anderson et al., Nucl. Instrum. Meth. A499, 659
(2003).[30] J. Adams et al. (STAR Collaboration),
Phys. Rev. Lett. 92, 112301 (2004).[31] B. I. Abelev et al. (STAR Collaboration), Phys. Rev. C
79, 034909 (2009).[32] A. M. Poskanzer and S. A. Voloshin, Phys. Rev. C 58,
1671 (1998).[33] J. Adams et al. (STAR Collaboration), Phys. Rev. C 72,
014904 (2005).[34] S. Wang, et al., Phys. Rev. C 44, 1091 (1991).[35] J. Bielcikova et al., Phys. Rev C 69, 021901(R) (2004).[36] K. Adcox et al. (PHENIX Collaboration),
Phys. Rev. Lett. 88, 242301 (2002).[37] J. Adams et al. (STAR Collaboration), nucl-ex/0601042.[38] R. C. Hwa and C. B. Yang, Phys. Rev. C 67, 064902
(2003).[39] R. J. Fries, B. Muller, C. Nonaka, and S. A. Bass,
Phys. Rev. C 68, 044902 (2003).[40] V. Greco, C. M. Ko, and P. Levai, Phys. Rev. C 68,
034904 (2003).[41] R. J. Fries, S. A. Bass, and B. Muller,
Phys. Rev. Lett. 94, 122301 (2005).[42] C. Nattrass (STAR Collaboration), J. Phys. G:
Nucl. Part. Phys. 35, 044063 (2008), arXiv:0804.4558[nucl-ex].
[43] J. G. Ulery and F. Wang, Nucl. Instrum. Meth. A595,502 (2008).
[44] B. I. Abelev et al. (STAR Collaboration),Phys. Rev. Lett. 101, 252301 (2008).
[45] B. I. Abelev et al. (STAR Collaboration),Phys. Rev. Lett. 103, 251601 (2009).
[46] B. I. Abelev et al. (STAR Collaboration), Phys. Rev. C81, 054908 (2010).
[47] P. Sorensen, J. Phys. G 37, 094011 (2010),arXiv:1002.4878 [nucl-ex].
[48] B. Alver and G. Roland, Phys. Rev. C 81, 054905 (2010).[49] B. Alver et al., arXiv:1007.5469 [nucl-th].[50] M. Luzum, Phys. Lett. B696, 499 (2011).[51] H. Petersen et al., arXiv:1008.0625 [nucl-th].[52] B. I. Abelev et al. (STAR Collaboration),
arXiv:0806.0513 [nucl-ex].[53] A. Adare et al. (PHENIX Collaboration),
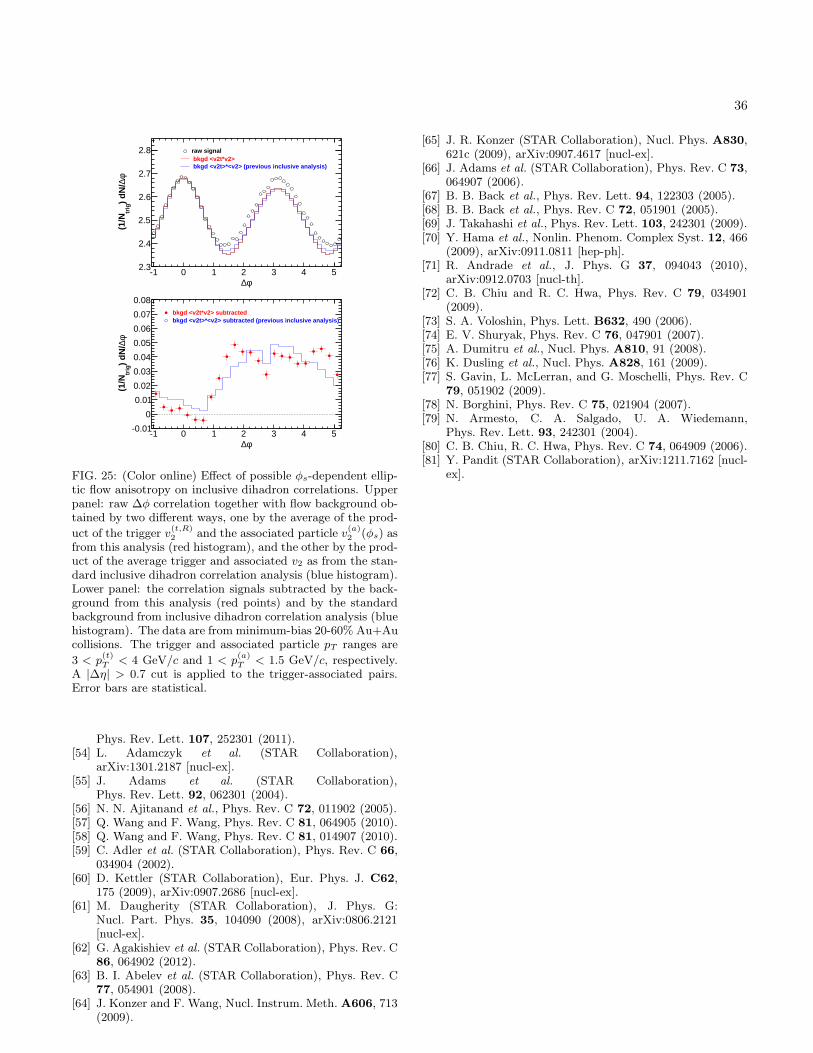
36
-1 0 1 2 3 4 52.3
2.4
2.5
2.6
2.7
2.8 raw signalbkgd <v2t*v2>bkgd <v2t>*<v2> (previous inclusive analysis)
φ∆)
dN/
trig
(1/N
φ∆
-1 0 1 2 3 4 5-0.01
0
0.01
0.02
0.03
0.04
0.05
0.06
0.07
0.08bkgd <v2t*v2> subtractedbkgd <v2t>*<v2> subtracted (previous inclusive analysis)
φ∆)
dN/
trig
(1/N
φ∆
FIG. 25: (Color online) Effect of possible φs-dependent ellip-tic flow anisotropy on inclusive dihadron correlations. Upperpanel: raw ∆φ correlation together with flow background ob-tained by two different ways, one by the average of the prod-
uct of the trigger v(t,R)2 and the associated particle v
(a)2 (φs) as
from this analysis (red histogram), and the other by the prod-uct of the average trigger and associated v2 as from the stan-dard inclusive dihadron correlation analysis (blue histogram).Lower panel: the correlation signals subtracted by the back-ground from this analysis (red points) and by the standardbackground from inclusive dihadron correlation analysis (bluehistogram). The data are from minimum-bias 20-60% Au+Aucollisions. The trigger and associated particle pT ranges are
3 < p(t)T < 4 GeV/c and 1 < p
(a)T < 1.5 GeV/c, respectively.
A |∆η| > 0.7 cut is applied to the trigger-associated pairs.Error bars are statistical.
Phys. Rev. Lett. 107, 252301 (2011).[54] L. Adamczyk et al. (STAR Collaboration),
arXiv:1301.2187 [nucl-ex].[55] J. Adams et al. (STAR Collaboration),
Phys. Rev. Lett. 92, 062301 (2004).[56] N. N. Ajitanand et al., Phys. Rev. C 72, 011902 (2005).[57] Q. Wang and F. Wang, Phys. Rev. C 81, 064905 (2010).[58] Q. Wang and F. Wang, Phys. Rev. C 81, 014907 (2010).[59] C. Adler et al. (STAR Collaboration), Phys. Rev. C 66,
034904 (2002).[60] D. Kettler (STAR Collaboration), Eur. Phys. J. C62,
175 (2009), arXiv:0907.2686 [nucl-ex].[61] M. Daugherity (STAR Collaboration), J. Phys. G:
Nucl. Part. Phys. 35, 104090 (2008), arXiv:0806.2121[nucl-ex].
[62] G. Agakishiev et al. (STAR Collaboration), Phys. Rev. C86, 064902 (2012).
[63] B. I. Abelev et al. (STAR Collaboration), Phys. Rev. C77, 054901 (2008).
[64] J. Konzer and F. Wang, Nucl. Instrum. Meth. A606, 713(2009).
[65] J. R. Konzer (STAR Collaboration), Nucl. Phys. A830,621c (2009), arXiv:0907.4617 [nucl-ex].
[66] J. Adams et al. (STAR Collaboration), Phys. Rev. C 73,064907 (2006).
[67] B. B. Back et al., Phys. Rev. Lett. 94, 122303 (2005).[68] B. B. Back et al., Phys. Rev. C 72, 051901 (2005).[69] J. Takahashi et al., Phys. Rev. Lett. 103, 242301 (2009).[70] Y. Hama et al., Nonlin. Phenom. Complex Syst. 12, 466
(2009), arXiv:0911.0811 [hep-ph].[71] R. Andrade et al., J. Phys. G 37, 094043 (2010),
arXiv:0912.0703 [nucl-th].[72] C. B. Chiu and R. C. Hwa, Phys. Rev. C 79, 034901
(2009).[73] S. A. Voloshin, Phys. Lett. B632, 490 (2006).[74] E. V. Shuryak, Phys. Rev. C 76, 047901 (2007).[75] A. Dumitru et al., Nucl. Phys. A810, 91 (2008).[76] K. Dusling et al., Nucl. Phys. A828, 161 (2009).[77] S. Gavin, L. McLerran, and G. Moschelli, Phys. Rev. C
79, 051902 (2009).[78] N. Borghini, Phys. Rev. C 75, 021904 (2007).[79] N. Armesto, C. A. Salgado, U. A. Wiedemann,
Phys. Rev. Lett. 93, 242301 (2004).[80] C. B. Chiu, R. C. Hwa, Phys. Rev. C 74, 064909 (2006).[81] Y. Pandit (STAR Collaboration), arXiv:1211.7162 [nucl-
ex].
37
o-15o0
0.15-0.5
44
46
48
50
o-30o15
44
46
48
50
o-45o30
44
46
48
50
o-60o45
44
46
48
50
o-75o60
44
46
48
50
o-90o75
44
46
48
50
0.5-1
20
22
24
26
20
22
24
26
20
22
24
26
20
22
24
26
20
22
24
26
20
22
24
26
1-1.5
5
6
7
5
6
7
5
6
7
5
6
7
5
6
7
5
6
7
1.5-2
1.5
2
1.5
2
1.5
2
1.5
2
1.5
2
1.5
2
2-3
0 2 4
0.6
0.8
1
0 2 4
0.6
0.8
1
0 2 4
0.6
0.8
1
0 2 4
0.6
0.8
1
0 2 4
0.6
0.8
1
0 2 4
0.6
0.8
1
=s
φ (a)
Tp
GeV
/c
[rad]t
φ - φ = φ∆
φ∆)
dN/d
trig
(1/N
<4 GeV/c(t)
TAu+Au 20-60%, 3<p
FIG. 26: (Color online) Raw dihadron ∆φ correlations with trigger particles in six slices of azimuthal angle relative to the event
plane, φs = |φt−ψEP|. The data are from minimum-bias 20-60% Au+Au collisions. The trigger pT range is 3 < p(t)T< 4 GeV/c.
Five associated particle p(a)T bins are shown. Both the trigger and associated particles are restricted within |η| < 1. The triangle
two-particle ∆η acceptance is not corrected. Statistical errors are smaller than the symbol size. The curves are flow modulatedzyam background including v2 and v4{ψ2} by Eq. (1). The used v2 values are given in Table I from four-particle v2{4} andtwo-particle v2{2, ηgap=0.7} (dashed curves) and the average v2 from the two methods (solid curve). The v4{ψ2} is taken tofrom the parameterization in Eq. (15).
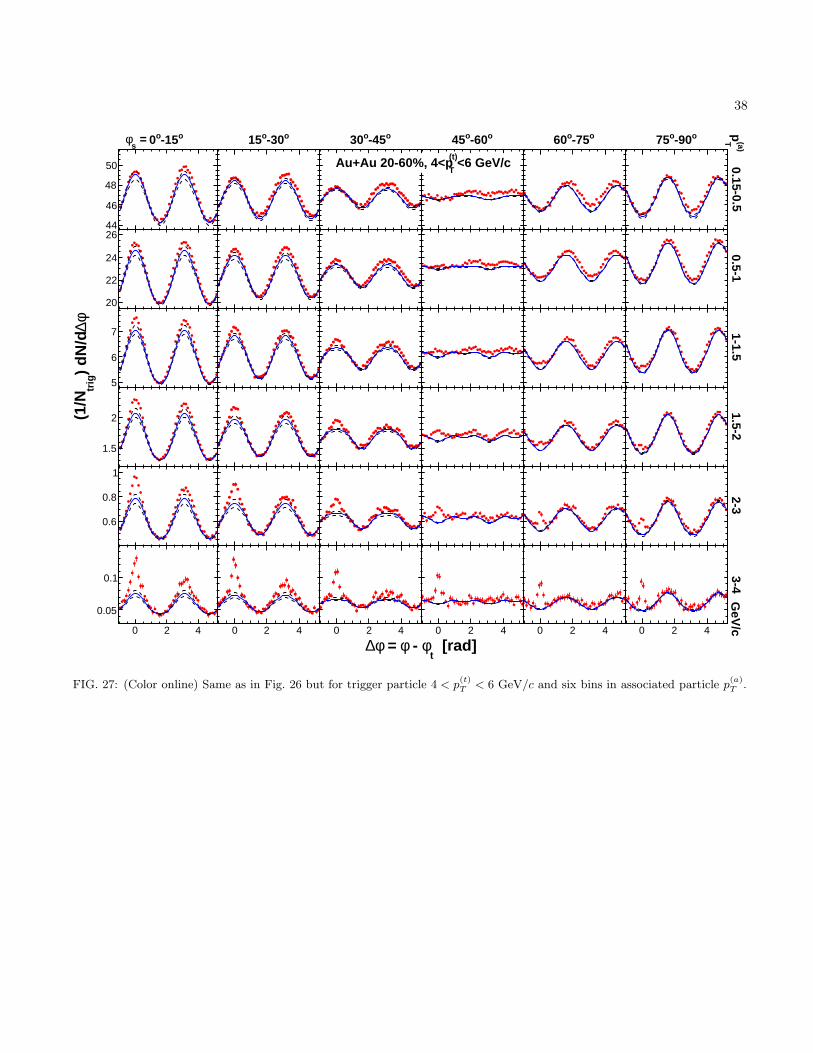
38
o-15o0
0.15-0.5
44
46
48
50
o-30o15
44
46
48
50
o-45o30
44
46
48
50
o-60o45
44
46
48
50
o-75o60
44
46
48
50
o-90o75
44
46
48
50
0.5-1
20
22
24
26
20
22
24
26
20
22
24
26
20
22
24
26
20
22
24
26
20
22
24
26
1-1.5
5
6
7
5
6
7
5
6
7
5
6
7
5
6
7
5
6
7
1.5-2
0 2 4
1.5
2
0 2 4
1.5
2
0 2 4
1.5
2
0 2 4
1.5
2
0 2 4
1.5
2
0 2 4
1.5
2
2-3
0.6
0.8
1
0.6
0.8
1
0.6
0.8
1
0.6
0.8
1
0.6
0.8
1
0.6
0.8
1
3-4
0 2 4
0.05
0.1
0 2 4
0.05
0.1
0 2 4
0.05
0.1
0 2 4
0.05
0.1
0 2 4
0.05
0.1
0 2 4
0.05
0.1
=s
φ (a)
Tp
GeV
/c
[rad]t
φ - φ = φ∆
φ∆)
dN/d
trig
(1/N
<6 GeV/c(t)
TAu+Au 20-60%, 4<p
FIG. 27: (Color online) Same as in Fig. 26 but for trigger particle 4 < p(t)T < 6 GeV/c and six bins in associated particle p
(a)T .
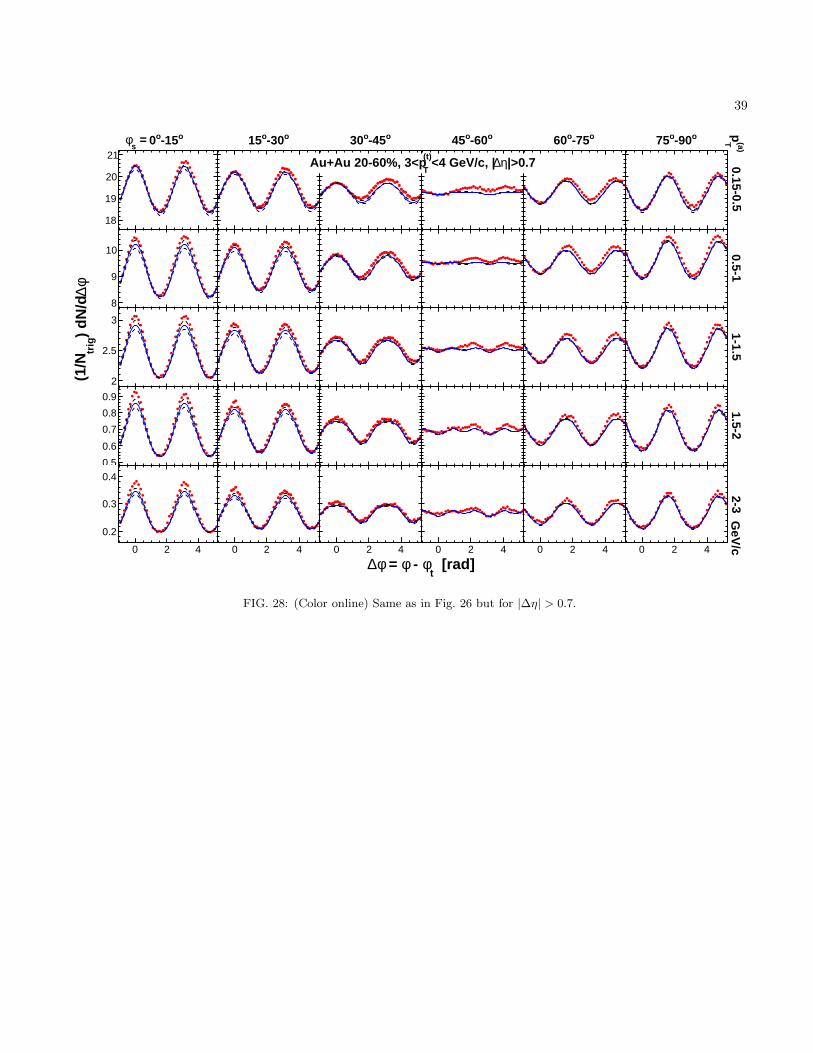
39
o-15o0
0.15-0.5
18
19
20
21
o-30o15
18
19
20
21
o-45o30
18
19
20
21
o-60o45
18
19
20
21
o-75o60
18
19
20
21
o-90o75
18
19
20
21
0.5-1
8
9
10
8
9
10
8
9
10
8
9
10
8
9
10
8
9
10
1-1.5
2
2.5
3
2
2.5
3
2
2.5
3
2
2.5
3
2
2.5
3
2
2.5
3
1.5-2
0.5
0.6
0.7
0.8
0.9
0.5
0.6
0.7
0.8
0.9
0.5
0.6
0.7
0.8
0.9
0.5
0.6
0.7
0.8
0.9
0.5
0.6
0.7
0.8
0.9
0.5
0.6
0.7
0.8
0.9
2-3
0 2 4
0.2
0.3
0.4
0 2 4
0.2
0.3
0.4
0 2 4
0.2
0.3
0.4
0 2 4
0.2
0.3
0.4
0 2 4
0.2
0.3
0.4
0 2 4
0.2
0.3
0.4
=s
φ (a)
Tp
GeV
/c
[rad]t
φ - φ = φ∆
φ∆)
dN/d
trig
(1/N
|>0.7η∆<4 GeV/c, |(t)
TAu+Au 20-60%, 3<p
FIG. 28: (Color online) Same as in Fig. 26 but for |∆η| > 0.7.
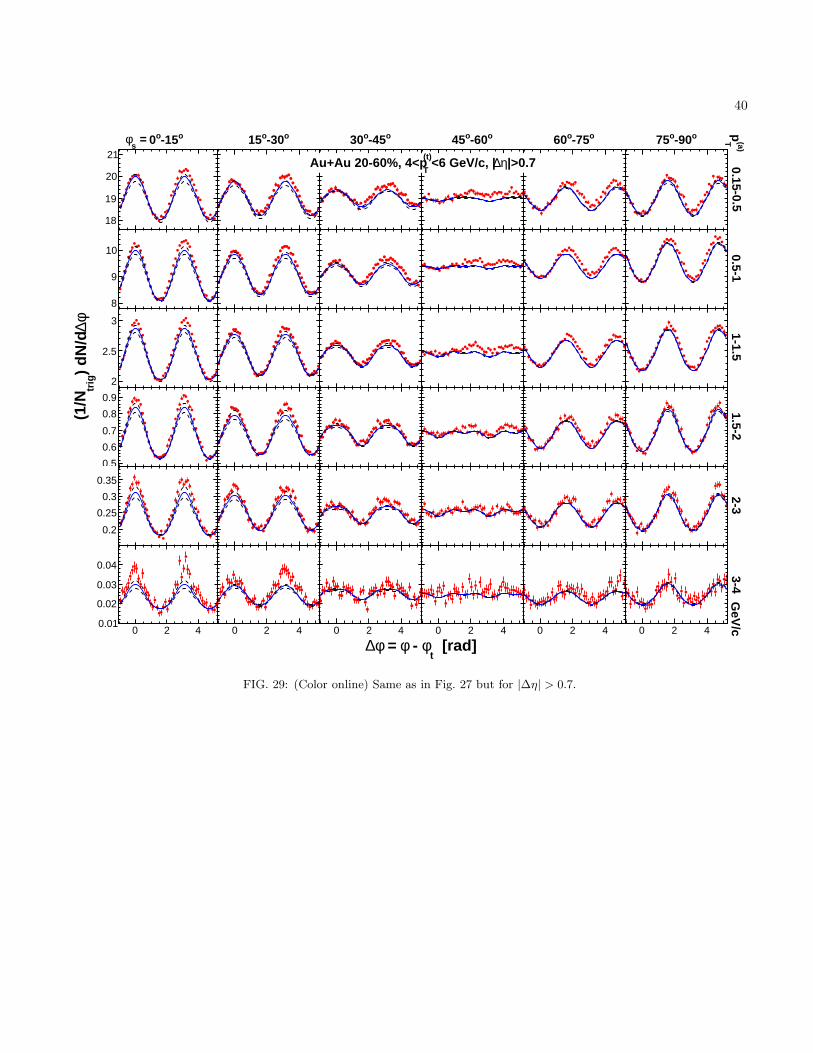
40
o-15o0
0.15-0.5
18
19
20
21
o-30o15
18
19
20
21
o-45o30
18
19
20
21
o-60o45
18
19
20
21
o-75o60
18
19
20
21
o-90o75
18
19
20
21
0.5-1
8
9
10
8
9
10
8
9
10
8
9
10
8
9
10
8
9
10
1-1.5
2
2.5
3
2
2.5
3
2
2.5
3
2
2.5
3
2
2.5
3
2
2.5
3
1.5-2
0 2 40.5
0.6
0.7
0.8
0.9
0 2 40.5
0.6
0.7
0.8
0.9
0 2 40.5
0.6
0.7
0.8
0.9
0 2 40.5
0.6
0.7
0.8
0.9
0 2 40.5
0.6
0.7
0.8
0.9
0 2 40.5
0.6
0.7
0.8
0.9
2-3
0.2
0.25
0.3
0.35
0.2
0.25
0.3
0.35
0.2
0.25
0.3
0.35
0.2
0.25
0.3
0.35
0.2
0.25
0.3
0.35
0.2
0.25
0.3
0.35
3-4
0 2 40.01
0.02
0.03
0.04
0 2 40.01
0.02
0.03
0.04
0 2 40.01
0.02
0.03
0.04
0 2 40.01
0.02
0.03
0.04
0 2 40.01
0.02
0.03
0.04
0 2 40.01
0.02
0.03
0.04
=s
φ (a)
Tp
GeV
/c
[rad]t
φ - φ = φ∆
φ∆)
dN/d
trig
(1/N
|>0.7η∆<6 GeV/c, |(t)
TAu+Au 20-60%, 4<p
FIG. 29: (Color online) Same as in Fig. 27 but for |∆η| > 0.7.
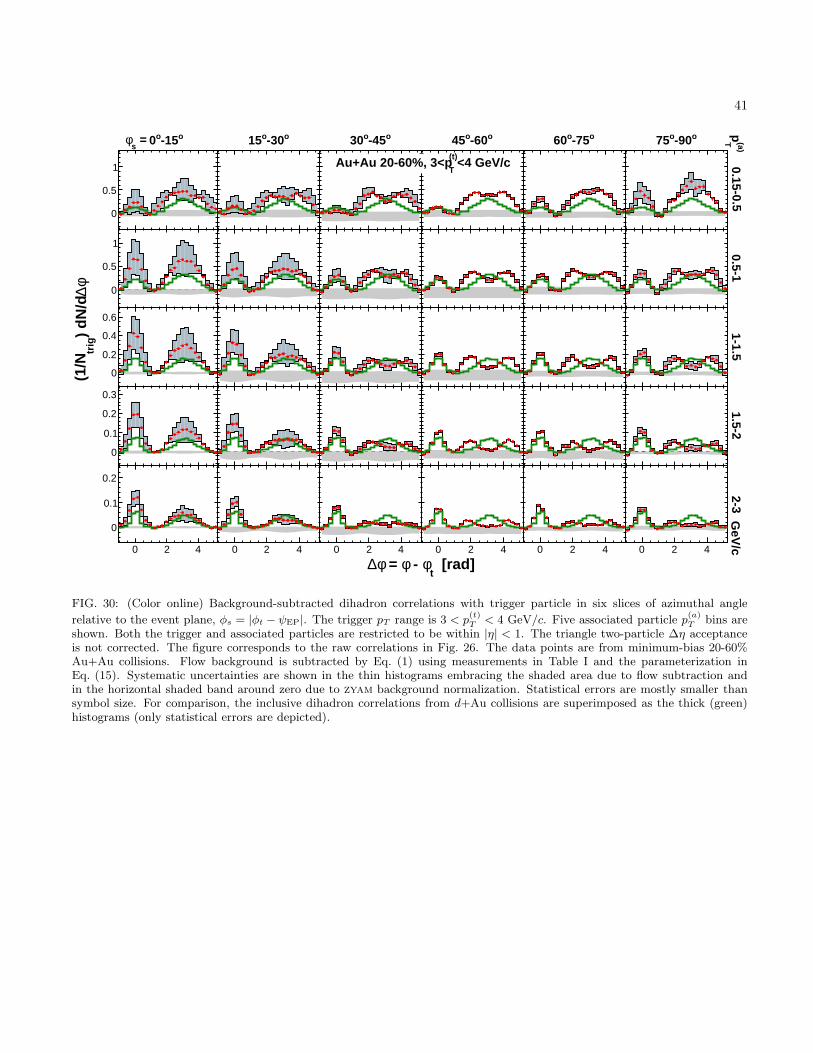
41
o-15o0
0.15-0.5
0
0.5
1
o-30o15
0
0.5
1
o-45o30
0
0.5
1
o-60o45
0
0.5
1
o-75o60
0
0.5
1
o-90o75
0
0.5
1
0.5-1
0
0.5
1
0
0.5
1
0
0.5
1
0
0.5
1
0
0.5
1
0
0.5
1
1-1.5
0
0.2
0.4
0.6
0
0.2
0.4
0.6
0
0.2
0.4
0.6
0
0.2
0.4
0.6
0
0.2
0.4
0.6
0
0.2
0.4
0.6
1.5-2
0
0.1
0.2
0.3
0
0.1
0.2
0.3
0
0.1
0.2
0.3
0
0.1
0.2
0.3
0
0.1
0.2
0.3
0
0.1
0.2
0.3
2-3
0 2 4
0
0.1
0.2
0 2 4
0
0.1
0.2
0 2 4
0
0.1
0.2
0 2 4
0
0.1
0.2
0 2 4
0
0.1
0.2
0 2 4
0
0.1
0.2
=s
φ (a)
Tp
GeV
/c
[rad]t
φ - φ = φ∆
φ∆)
dN/d
trig
(1/N
<4 GeV/c(t)
TAu+Au 20-60%, 3<p
FIG. 30: (Color online) Background-subtracted dihadron correlations with trigger particle in six slices of azimuthal angle
relative to the event plane, φs = |φt − ψEP|. The trigger pT range is 3 < p(t)T< 4 GeV/c. Five associated particle p
(a)T
bins areshown. Both the trigger and associated particles are restricted to be within |η| < 1. The triangle two-particle ∆η acceptanceis not corrected. The figure corresponds to the raw correlations in Fig. 26. The data points are from minimum-bias 20-60%Au+Au collisions. Flow background is subtracted by Eq. (1) using measurements in Table I and the parameterization inEq. (15). Systematic uncertainties are shown in the thin histograms embracing the shaded area due to flow subtraction andin the horizontal shaded band around zero due to zyam background normalization. Statistical errors are mostly smaller thansymbol size. For comparison, the inclusive dihadron correlations from d+Au collisions are superimposed as the thick (green)histograms (only statistical errors are depicted).
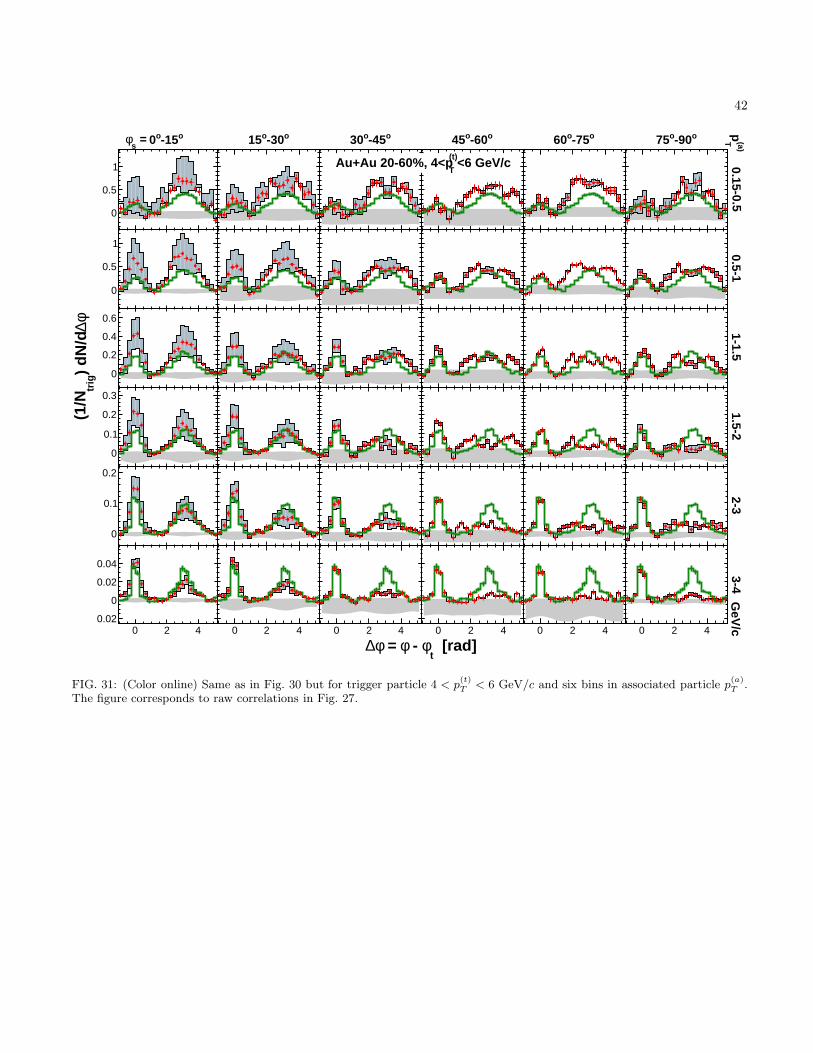
42
o-15o0
0.15-0.5
0
0.5
1
o-30o15
0
0.5
1
o-45o30
0
0.5
1
o-60o45
0
0.5
1
o-75o60
0
0.5
1
o-90o75
0
0.5
1
0.5-1
0
0.5
1
0
0.5
1
0
0.5
1
0
0.5
1
0
0.5
1
0
0.5
1
1-1.5
0
0.2
0.4
0.6
0
0.2
0.4
0.6
0
0.2
0.4
0.6
0
0.2
0.4
0.6
0
0.2
0.4
0.6
0
0.2
0.4
0.6
1.5-2
0 2 4
0
0.1
0.2
0.3
0 2 4
0
0.1
0.2
0.3
0 2 4
0
0.1
0.2
0.3
0 2 4
0
0.1
0.2
0.3
0 2 4
0
0.1
0.2
0.3
0 2 4
0
0.1
0.2
0.3
2-3
0
0.1
0.2
0
0.1
0.2
0
0.1
0.2
0
0.1
0.2
0
0.1
0.2
0
0.1
0.2
3-4
0 2 4-0.02
0
0.02
0.04
0 2 4-0.02
0
0.02
0.04
0 2 4-0.02
0
0.02
0.04
0 2 4-0.02
0
0.02
0.04
0 2 4-0.02
0
0.02
0.04
0 2 4-0.02
0
0.02
0.04
=s
φ (a)
Tp
GeV
/c
[rad]t
φ - φ = φ∆
φ∆)
dN/d
trig
(1/N
<6 GeV/c(t)
TAu+Au 20-60%, 4<p
FIG. 31: (Color online) Same as in Fig. 30 but for trigger particle 4 < p(t)T < 6 GeV/c and six bins in associated particle p
(a)T .
The figure corresponds to raw correlations in Fig. 27.
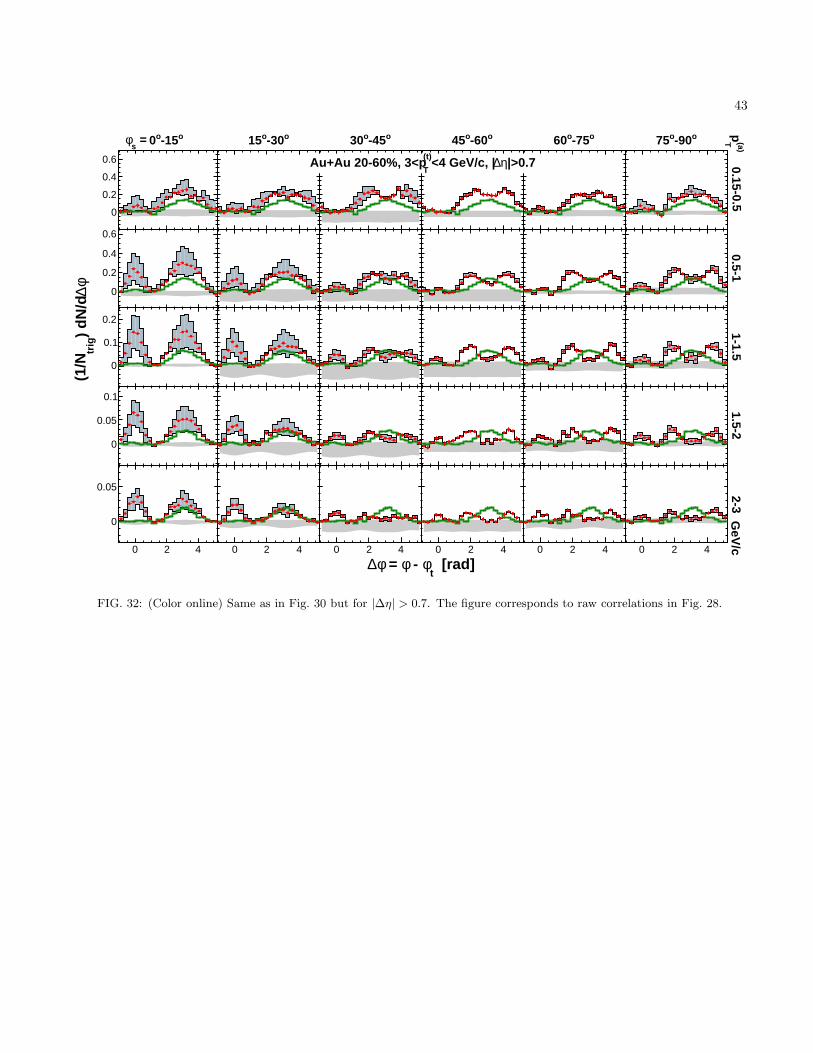
43
o-15o0
0.15-0.5
0
0.2
0.4
0.6
o-30o15
0
0.2
0.4
0.6
o-45o30
0
0.2
0.4
0.6
o-60o45
0
0.2
0.4
0.6
o-75o60
0
0.2
0.4
0.6
o-90o75
0
0.2
0.4
0.6
0.5-1
0
0.2
0.4
0.6
0
0.2
0.4
0.6
0
0.2
0.4
0.6
0
0.2
0.4
0.6
0
0.2
0.4
0.6
0
0.2
0.4
0.6
1-1.5
0
0.1
0.2
0
0.1
0.2
0
0.1
0.2
0
0.1
0.2
0
0.1
0.2
0
0.1
0.2
1.5-2
0
0.05
0.1
0
0.05
0.1
0
0.05
0.1
0
0.05
0.1
0
0.05
0.1
0
0.05
0.1
2-3
0 2 4
0
0.05
0 2 4
0
0.05
0 2 4
0
0.05
0 2 4
0
0.05
0 2 4
0
0.05
0 2 4
0
0.05
=s
φ (a)
Tp
GeV
/c
[rad]t
φ - φ = φ∆
φ∆)
dN/d
trig
(1/N
|>0.7η∆<4 GeV/c, |(t)
TAu+Au 20-60%, 3<p
FIG. 32: (Color online) Same as in Fig. 30 but for |∆η| > 0.7. The figure corresponds to raw correlations in Fig. 28.
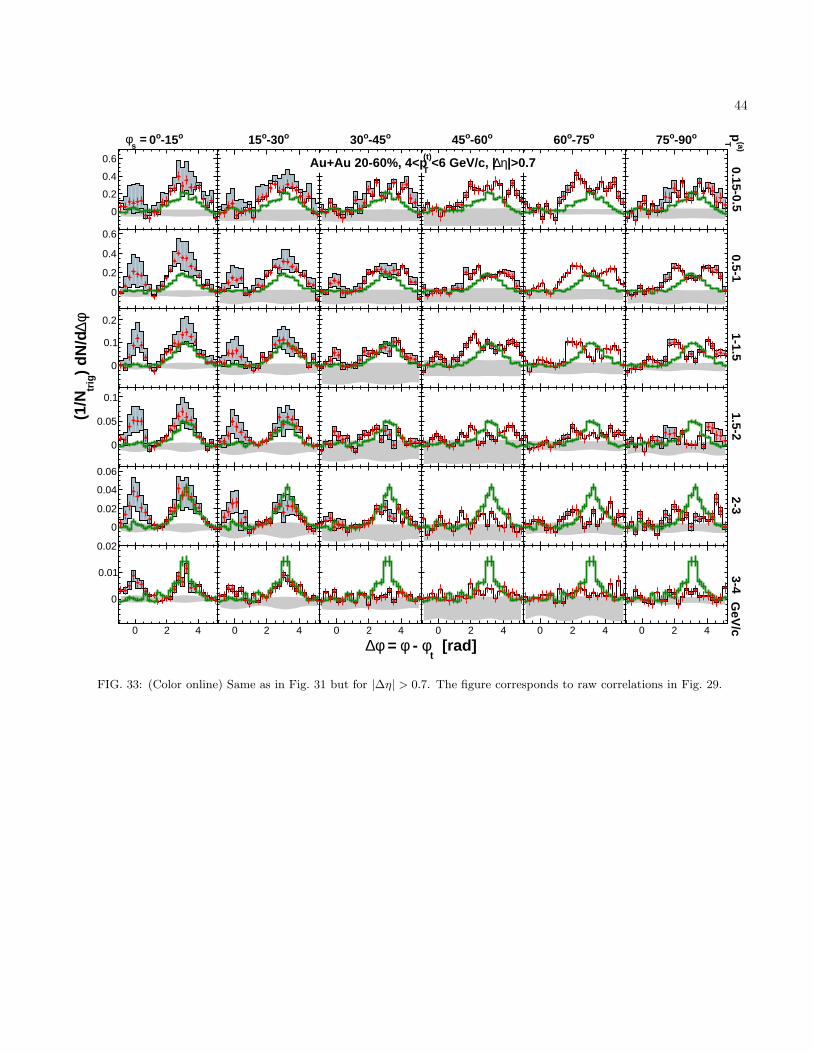
44
o-15o0
0.15-0.5
0
0.2
0.4
0.6
o-30o15
0
0.2
0.4
0.6
o-45o30
0
0.2
0.4
0.6
o-60o45
0
0.2
0.4
0.6
o-75o60
0
0.2
0.4
0.6
o-90o75
0
0.2
0.4
0.6
0.5-1
0
0.2
0.4
0.6
0
0.2
0.4
0.6
0
0.2
0.4
0.6
0
0.2
0.4
0.6
0
0.2
0.4
0.6
0
0.2
0.4
0.6
1-1.5
0
0.1
0.2
0
0.1
0.2
0
0.1
0.2
0
0.1
0.2
0
0.1
0.2
0
0.1
0.2
1.5-2
0 2 4
0
0.05
0.1
0 2 4
0
0.05
0.1
0 2 4
0
0.05
0.1
0 2 4
0
0.05
0.1
0 2 4
0
0.05
0.1
0 2 4
0
0.05
0.1
2-3
-0.02
0
0.02
0.04
0.06
-0.02
0
0.02
0.04
0.06
-0.02
0
0.02
0.04
0.06
-0.02
0
0.02
0.04
0.06
-0.02
0
0.02
0.04
0.06
-0.02
0
0.02
0.04
0.06
3-4
0 2 4
0
0.01
0.02
0 2 4
0
0.01
0.02
0 2 4
0
0.01
0.02
0 2 4
0
0.01
0.02
0 2 4
0
0.01
0.02
0 2 4
0
0.01
0.02
=s
φ (a)
Tp
GeV
/c
[rad]t
φ - φ = φ∆
φ∆)
dN/d
trig
(1/N
|>0.7η∆<6 GeV/c, |(t)
TAu+Au 20-60%, 4<p
FIG. 33: (Color online) Same as in Fig. 31 but for |∆η| > 0.7. The figure corresponds to raw correlations in Fig. 29.
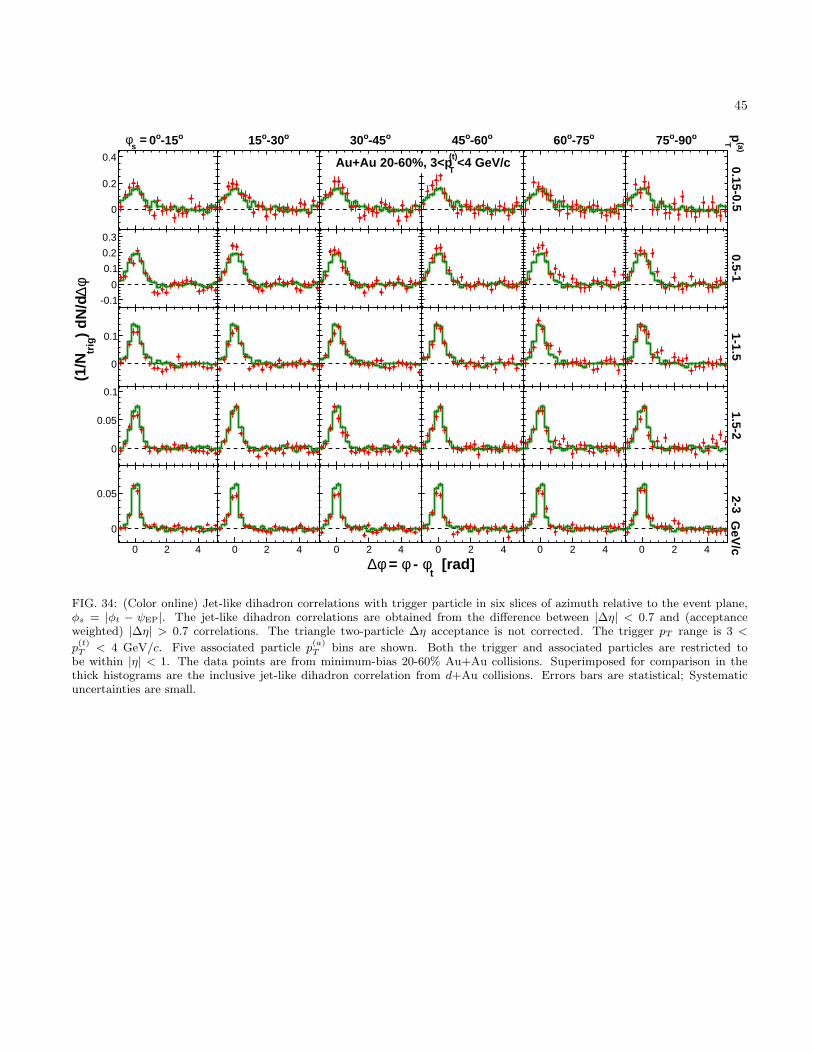
45
o-15o0
0.15-0.5
0
0.2
0.4
o-30o15
0
0.2
0.4
o-45o30
0
0.2
0.4
o-60o45
0
0.2
0.4
o-75o60
0
0.2
0.4
o-90o75
0
0.2
0.4
0.5-1
-0.1
0
0.1
0.2
0.3
-0.1
0
0.1
0.2
0.3
-0.1
0
0.1
0.2
0.3
-0.1
0
0.1
0.2
0.3
-0.1
0
0.1
0.2
0.3
-0.1
0
0.1
0.2
0.3
1-1.5
0
0.1
0
0.1
0
0.1
0
0.1
0
0.1
0
0.1
1.5-2
0
0.05
0.1
0
0.05
0.1
0
0.05
0.1
0
0.05
0.1
0
0.05
0.1
0
0.05
0.1
2-3
0 2 4
0
0.05
0 2 4
0
0.05
0 2 4
0
0.05
0 2 4
0
0.05
0 2 4
0
0.05
0 2 4
0
0.05
=s
φ (a)
Tp
GeV
/c
[rad]t
φ - φ = φ∆
φ∆)
dN/d
trig
(1/N
<4 GeV/c(t)
TAu+Au 20-60%, 3<p
FIG. 34: (Color online) Jet-like dihadron correlations with trigger particle in six slices of azimuth relative to the event plane,φs = |φt − ψEP|. The jet-like dihadron correlations are obtained from the difference between |∆η| < 0.7 and (acceptanceweighted) |∆η| > 0.7 correlations. The triangle two-particle ∆η acceptance is not corrected. The trigger pT range is 3 <
p(t)T < 4 GeV/c. Five associated particle p
(a)T bins are shown. Both the trigger and associated particles are restricted to
be within |η| < 1. The data points are from minimum-bias 20-60% Au+Au collisions. Superimposed for comparison in thethick histograms are the inclusive jet-like dihadron correlation from d+Au collisions. Errors bars are statistical; Systematicuncertainties are small.
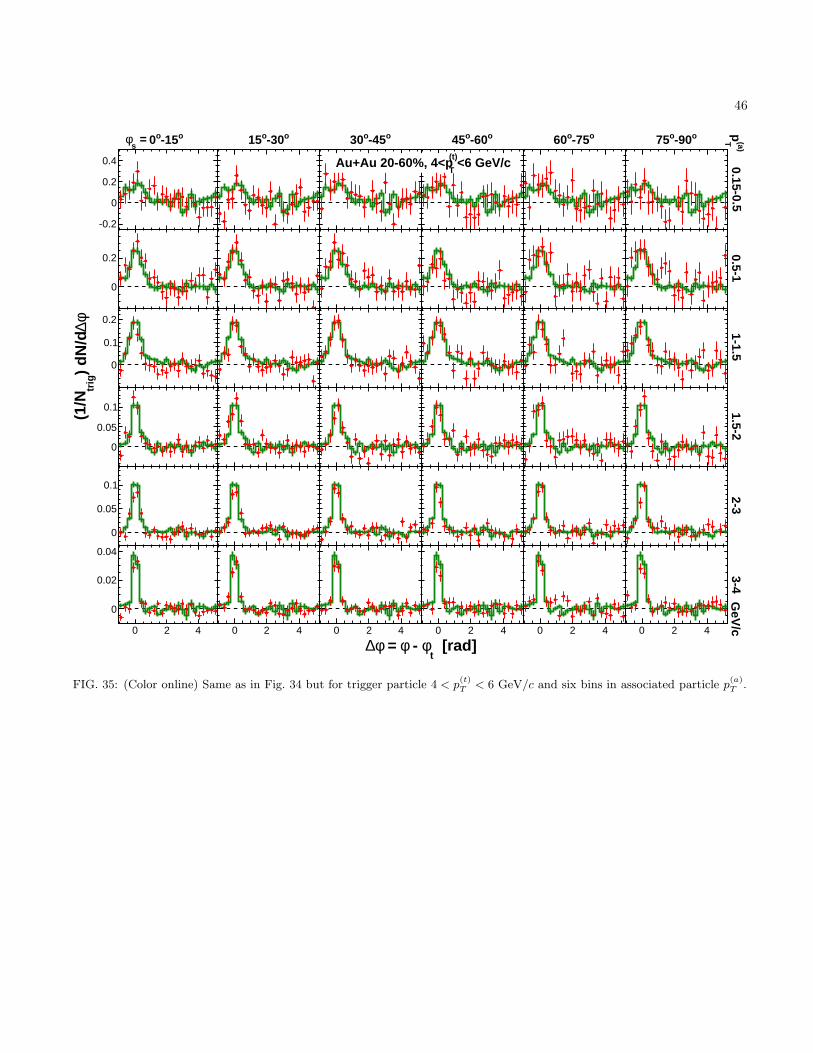
46
o-15o0
0.15-0.5
-0.2
0
0.2
0.4
o-30o15
-0.2
0
0.2
0.4
o-45o30
-0.2
0
0.2
0.4
o-60o45
-0.2
0
0.2
0.4
o-75o60
-0.2
0
0.2
0.4
o-90o75
-0.2
0
0.2
0.4
0.5-1
0
0.2
0
0.2
0
0.2
0
0.2
0
0.2
0
0.2
1-1.5
0
0.1
0.2
0
0.1
0.2
0
0.1
0.2
0
0.1
0.2
0
0.1
0.2
0
0.1
0.2
1.5-2
0 2 4
0
0.05
0.1
0 2 4
0
0.05
0.1
0 2 4
0
0.05
0.1
0 2 4
0
0.05
0.1
0 2 4
0
0.05
0.1
0 2 4
0
0.05
0.1
2-3
0
0.05
0.1
0
0.05
0.1
0
0.05
0.1
0
0.05
0.1
0
0.05
0.1
0
0.05
0.1
3-4
0 2 4
0
0.02
0.04
0 2 4
0
0.02
0.04
0 2 4
0
0.02
0.04
0 2 4
0
0.02
0.04
0 2 4
0
0.02
0.04
0 2 4
0
0.02
0.04
=s
φ (a)
Tp
GeV
/c
[rad]t
φ - φ = φ∆
φ∆)
dN/d
trig
(1/N
<6 GeV/c(t)
TAu+Au 20-60%, 4<p
FIG. 35: (Color online) Same as in Fig. 34 but for trigger particle 4 < p(t)T < 6 GeV/c and six bins in associated particle p
(a)T .
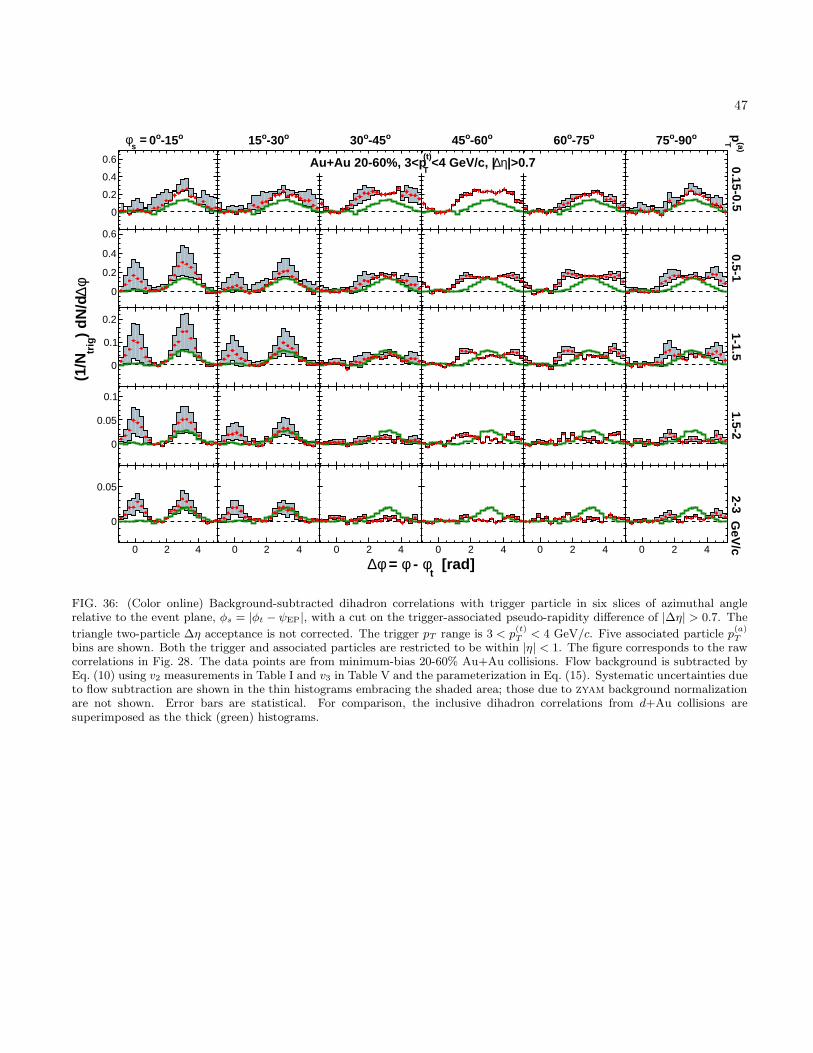
47
o-15o0
0.15-0.5
0
0.2
0.4
0.6
o-30o15
0
0.2
0.4
0.6
o-45o30
0
0.2
0.4
0.6
o-60o45
0
0.2
0.4
0.6
o-75o60
0
0.2
0.4
0.6
o-90o75
0
0.2
0.4
0.6
0.5-1
0
0.2
0.4
0.6
0
0.2
0.4
0.6
0
0.2
0.4
0.6
0
0.2
0.4
0.6
0
0.2
0.4
0.6
0
0.2
0.4
0.6
1-1.5
0
0.1
0.2
0
0.1
0.2
0
0.1
0.2
0
0.1
0.2
0
0.1
0.2
0
0.1
0.2
1.5-2
0
0.05
0.1
0
0.05
0.1
0
0.05
0.1
0
0.05
0.1
0
0.05
0.1
0
0.05
0.1
2-3
0 2 4
0
0.05
0 2 4
0
0.05
0 2 4
0
0.05
0 2 4
0
0.05
0 2 4
0
0.05
0 2 4
0
0.05
=s
φ (a)
Tp
GeV
/c
[rad]t
φ - φ = φ∆
φ∆)
dN/d
trig
(1/N
|>0.7η∆<4 GeV/c, |(t)
TAu+Au 20-60%, 3<p
FIG. 36: (Color online) Background-subtracted dihadron correlations with trigger particle in six slices of azimuthal anglerelative to the event plane, φs = |φt − ψEP|, with a cut on the trigger-associated pseudo-rapidity difference of |∆η| > 0.7. The
triangle two-particle ∆η acceptance is not corrected. The trigger pT range is 3 < p(t)T < 4 GeV/c. Five associated particle p
(a)T
bins are shown. Both the trigger and associated particles are restricted to be within |η| < 1. The figure corresponds to the rawcorrelations in Fig. 28. The data points are from minimum-bias 20-60% Au+Au collisions. Flow background is subtracted byEq. (10) using v2 measurements in Table I and v3 in Table V and the parameterization in Eq. (15). Systematic uncertainties dueto flow subtraction are shown in the thin histograms embracing the shaded area; those due to zyam background normalizationare not shown. Error bars are statistical. For comparison, the inclusive dihadron correlations from d+Au collisions aresuperimposed as the thick (green) histograms.
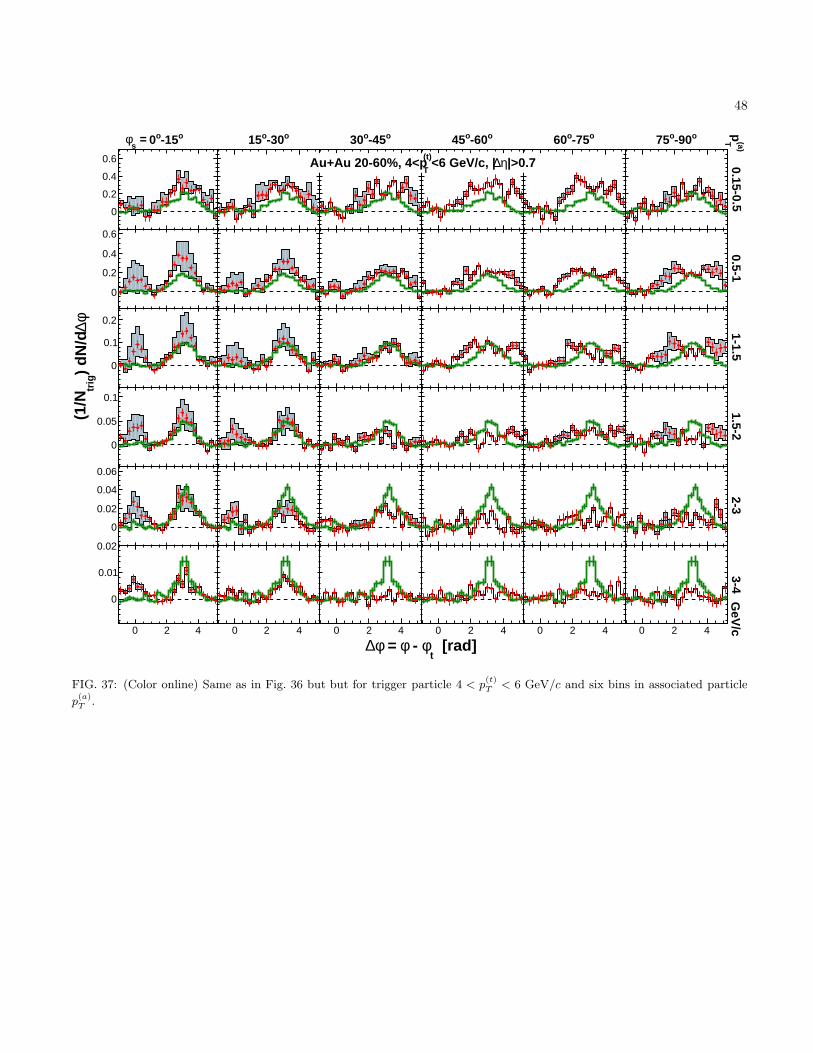
48
o-15o0
0.15-0.5
0
0.2
0.4
0.6
o-30o15
0
0.2
0.4
0.6
o-45o30
0
0.2
0.4
0.6
o-60o45
0
0.2
0.4
0.6
o-75o60
0
0.2
0.4
0.6
o-90o75
0
0.2
0.4
0.6
0.5-1
0
0.2
0.4
0.6
0
0.2
0.4
0.6
0
0.2
0.4
0.6
0
0.2
0.4
0.6
0
0.2
0.4
0.6
0
0.2
0.4
0.6
1-1.5
0
0.1
0.2
0
0.1
0.2
0
0.1
0.2
0
0.1
0.2
0
0.1
0.2
0
0.1
0.2
1.5-2
0 2 4
0
0.05
0.1
0 2 4
0
0.05
0.1
0 2 4
0
0.05
0.1
0 2 4
0
0.05
0.1
0 2 4
0
0.05
0.1
0 2 4
0
0.05
0.1
2-3
-0.02
0
0.02
0.04
0.06
-0.02
0
0.02
0.04
0.06
-0.02
0
0.02
0.04
0.06
-0.02
0
0.02
0.04
0.06
-0.02
0
0.02
0.04
0.06
-0.02
0
0.02
0.04
0.06
3-4
0 2 4
0
0.01
0.02
0 2 4
0
0.01
0.02
0 2 4
0
0.01
0.02
0 2 4
0
0.01
0.02
0 2 4
0
0.01
0.02
0 2 4
0
0.01
0.02
=s
φ (a)
Tp
GeV
/c
[rad]t
φ - φ = φ∆
φ∆)
dN/d
trig
(1/N
|>0.7η∆<6 GeV/c, |(t)
TAu+Au 20-60%, 4<p
FIG. 37: (Color online) Same as in Fig. 36 but but for trigger particle 4 < p(t)T < 6 GeV/c and six bins in associated particle
p(a)T
.
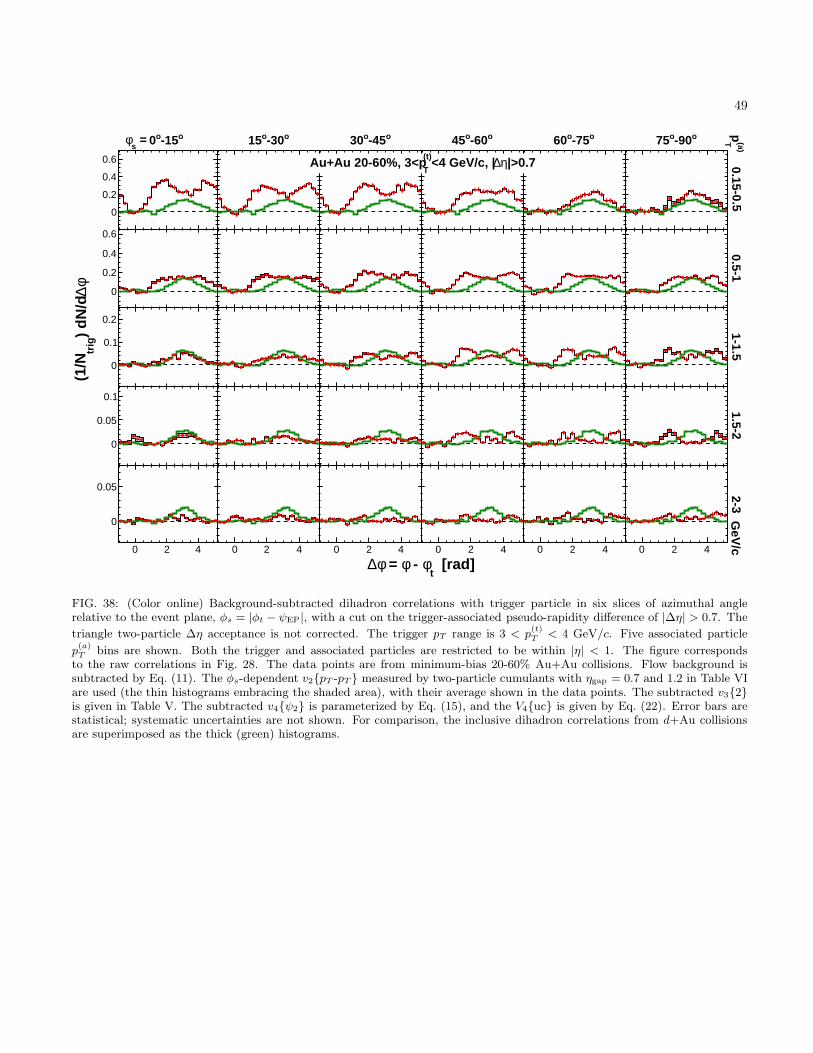
49
o-15o0
0.15-0.5
0
0.2
0.4
0.6
o-30o15
0
0.2
0.4
0.6
o-45o30
0
0.2
0.4
0.6
o-60o45
0
0.2
0.4
0.6
o-75o60
0
0.2
0.4
0.6
o-90o75
0
0.2
0.4
0.6
0.5-1
0
0.2
0.4
0.6
0
0.2
0.4
0.6
0
0.2
0.4
0.6
0
0.2
0.4
0.6
0
0.2
0.4
0.6
0
0.2
0.4
0.6
1-1.5
0
0.1
0.2
0
0.1
0.2
0
0.1
0.2
0
0.1
0.2
0
0.1
0.2
0
0.1
0.2
1.5-2
0
0.05
0.1
0
0.05
0.1
0
0.05
0.1
0
0.05
0.1
0
0.05
0.1
0
0.05
0.1
2-3
0 2 4
0
0.05
0 2 4
0
0.05
0 2 4
0
0.05
0 2 4
0
0.05
0 2 4
0
0.05
0 2 4
0
0.05
=s
φ (a)
Tp
GeV
/c
[rad]t
φ - φ = φ∆
φ∆)
dN/d
trig
(1/N
|>0.7η∆<4 GeV/c, |(t)
TAu+Au 20-60%, 3<p
FIG. 38: (Color online) Background-subtracted dihadron correlations with trigger particle in six slices of azimuthal anglerelative to the event plane, φs = |φt − ψEP|, with a cut on the trigger-associated pseudo-rapidity difference of |∆η| > 0.7. The
triangle two-particle ∆η acceptance is not corrected. The trigger pT range is 3 < p(t)T < 4 GeV/c. Five associated particle
p(a)T
bins are shown. Both the trigger and associated particles are restricted to be within |η| < 1. The figure correspondsto the raw correlations in Fig. 28. The data points are from minimum-bias 20-60% Au+Au collisions. Flow background issubtracted by Eq. (11). The φs-dependent v2{pT -pT } measured by two-particle cumulants with ηgap = 0.7 and 1.2 in Table VIare used (the thin histograms embracing the shaded area), with their average shown in the data points. The subtracted v3{2}is given in Table V. The subtracted v4{ψ2} is parameterized by Eq. (15), and the V4{uc} is given by Eq. (22). Error bars arestatistical; systematic uncertainties are not shown. For comparison, the inclusive dihadron correlations from d+Au collisionsare superimposed as the thick (green) histograms.

50
o-15o0
0.15-0.5
0
0.2
0.4
0.6
o-30o15
0
0.2
0.4
0.6
o-45o30
0
0.2
0.4
0.6
o-60o45
0
0.2
0.4
0.6
o-75o60
0
0.2
0.4
0.6
o-90o75
0
0.2
0.4
0.6
0.5-1
0
0.2
0.4
0.6
0
0.2
0.4
0.6
0
0.2
0.4
0.6
0
0.2
0.4
0.6
0
0.2
0.4
0.6
0
0.2
0.4
0.6
1-1.5
0
0.1
0.2
0
0.1
0.2
0
0.1
0.2
0
0.1
0.2
0
0.1
0.2
0
0.1
0.2
1.5-2
0
0.05
0.1
0
0.05
0.1
0
0.05
0.1
0
0.05
0.1
0
0.05
0.1
0
0.05
0.1
2-3
0 2 4-0.02
0
0.02
0.04
0.06
0 2 4-0.02
0
0.02
0.04
0.06
0 2 4-0.02
0
0.02
0.04
0.06
0 2 4-0.02
0
0.02
0.04
0.06
0 2 4-0.02
0
0.02
0.04
0.06
0 2 4-0.02
0
0.02
0.04
0.06
=s
φ (a)
Tp
GeV
/c
[rad]t
φ - φ = φ∆
φ∆)
dN/d
trig
(1/N
|>0.7η∆<6 GeV/c, |(t)
TAu+Au 20-60%, 4<p
FIG. 39: (Color online) Same as in Fig. 38 but but for trigger particle 4 < p(t)T < 6 GeV/c.