THE FIRST FERMI -LAT CATALOG OF SOURCES ABOVE 10 GeV
34
The Astrophysical Journal Supplement Series, 209:34 (34pp), 2013 December doi:10.1088/0067-0049/209/2/34 C 2013. The American Astronomical Society. All rights reserved. Printed in the U.S.A. THE FIRST FERMI-LAT CATALOG OFSOURCES ABOVE 10 GeV M. Ackermann 1 , M. Ajello 2 , A. Allafort 3 , W. B. Atwood 4 , L. Baldini 5 , J. Ballet 6 , G. Barbiellini 7 ,8 , D. Bastieri 9 ,10 , K. Bechtol 3 , A. Belfiore 4 ,11,12 , R. Bellazzini 13 , E. Bernieri 14 ,15 , E. Bissaldi 16 , E. D. Bloom 3 , E. Bonamente 17 ,18 , T. J. Brandt 19 , J. Bregeon 13 , M. Brigida 20 ,21 , P. Bruel 22 , R. Buehler 1 , T. H. Burnett 23 , S. Buson 9 ,10 , G. A. Caliandro 3 , R. A. Cameron 3 , R. Campana 24 , P. A. Caraveo 12 , J. M. Casandjian 6 , E. Cavazzuti 25 , C. Cecchi 17 ,18 , E. Charles 3 , R. C. G. Chaves 6 , A. Chekhtman 26 ,73 , C. C. Cheung 27 , J. Chiang 3 , G. Chiaro 10 , S. Ciprini 25 ,28 , R. Claus 3 , J. Cohen-Tanugi 29 , L. R. Cominsky 30 , J. Conrad 31 ,32,33,74 , S. Cutini 25 ,28 , F. D’Ammando 34 , A. de Angelis 35 , F. de Palma 20 ,21 , C. D. Dermer 27 , R. Desiante 7 , S. W. Digel 3 , L. Di Venere 20 , P. S. Drell 3 , A. Drlica-Wagner 36 , C. Favuzzi 20 ,21 , S. J. Fegan 22 , E. C. Ferrara 19 , W. B. Focke 3 , P. Fortin 37 , A. Franckowiak 3 , S. Funk 3 , P. Fusco 20 ,21 , F. Gargano 21 , D. Gasparrini 25 ,28 , N. Gehrels 19 , S. Germani 17 ,18 , N. Giglietto 20 ,21 , P. Giommi 25 , F. Giordano 20 ,21 , M. Giroletti 34 , G. Godfrey 3 , G. A. Gomez-Vargas 38 ,39 ,40 , I. A. Grenier 6 , S. Guiriec 19 ,75 , D. Hadasch 41 , Y. Hanabata 42 , A. K. Harding 19 , M. Hayashida 42 , E. Hays 19 , J. Hewitt 19 , A. B. Hill 3 ,43,76 , D. Horan 22 , R. E. Hughes 44 , T. Jogler 3 , G. J ´ ohannesson 45 , A. S. Johnson 3 , T. J. Johnson 46 ,73 , W. N. Johnson 27 , T. Kamae 3 , J. Kataoka 47 , T. Kawano 48 , J. Kn ¨ odlseder 49 ,50 , M. Kuss 13 , J. Lande 3 , S. Larsson 31 ,32,51 , L. Latronico 52 , M. Lemoine-Goumard 53 ,77 , F. Longo 7 ,8 , F. Loparco 20 ,21 , B. Lott 53 , M. N. Lovellette 27 , P. Lubrano 17 ,18 , E. Massaro 54 , M. Mayer 1 , M. N. Mazziotta 21 , J. E. McEnery 19 ,55 , J. Mehault 53 , P. F. Michelson 3 , T. Mizuno 56 , A. A. Moiseev 55 ,57 , M. E. Monzani 3 , A. Morselli 38 , I. V. Moskalenko 3 , S. Murgia 58 , R. Nemmen 19 , E. Nuss 29 , T. Ohsugi 56 , A. Okumura 3 ,59 , M. Orienti 34 , J. F. Ormes 60 , D. Paneque 3 ,61 , J. S. Perkins 19 , M. Pesce-Rollins 13 , F. Piron 29 , G. Pivato 10 , T. A. Porter 3 , S. Rain ` o 20 ,21 , M. Razzano 13 ,78 , A. Reimer 3 ,41 , O. Reimer 3 ,41 , T. Reposeur 53 , S. Ritz 4 , R. W. Romani 3 , M. Roth 23 , P. M. Saz Parkinson 4 ,62 , A. Schulz 1 , C. Sgr ` o 13 , E. J. Siskind 63 , D. A. Smith 53 , G. Spandre 13 , P. Spinelli 20 ,21 , Lukasz Stawarz 64 ,65 , A. W. Strong 66 , D. J. Suson 67 , H. Takahashi 48 , J. G. Thayer 3 , J. B. Thayer 3 , D. J. Thompson 19 , L. Tibaldo 3 , M. Tinivella 13 , D. F. Torres 68 ,69 , G. Tosti 17 ,18 , E. Troja 19 ,55 , Y. Uchiyama 70 , T. L. Usher 3 , J. Vandenbroucke 3 , V. Vasileiou 29 , G. Vianello 3 ,71 , V. Vitale 38 ,72 , M. Werner 41 , B. L. Winer 44 , K. S. Wood 27 , and M. Wood 3 1 Deutsches Elektronen Synchrotron DESY, D-15738 Zeuthen, Germany 2 Space Sciences Laboratory, 7 Gauss Way, University of California, Berkeley, CA 94720-7450, USA 3 W. W. Hansen Experimental Physics Laboratory, Kavli Institute for Particle Astrophysics and Cosmology, Department of Physics and SLAC National Accelerator Laboratory, Stanford University, Stanford, CA 94305, USA; [email protected] 4 Santa Cruz Institute for Particle Physics, Department of Physics and Department of Astronomy and Astrophysics, University of California at Santa Cruz, Santa Cruz, CA 95064, USA 5 Universit` a di Pisa and Istituto Nazionale di Fisica Nucleare, Sezione di Pisa, I-56127 Pisa, Italy 6 Laboratoire AIM, CEA-IRFU/CNRS/Universit´ e Paris Diderot, Service d’Astrophysique, CEA Saclay, F-91191 Gif sur Yvette, France 7 Istituto Nazionale di Fisica Nucleare, Sezione di Trieste, I-34127 Trieste, Italy 8 Dipartimento di Fisica, Universit` a di Trieste, I-34127 Trieste, Italy 9 Istituto Nazionale di Fisica Nucleare, Sezione di Padova, I-35131 Padova, Italy 10 Dipartimento di Fisica e Astronomia “G. Galilei,” Universit` a di Padova, I-35131 Padova, Italy 11 Universit` a degli Studi di Pavia, I-27100 Pavia, Italy 12 INAF-Istituto di Astrofisica Spaziale e Fisica Cosmica, I-20133 Milano, Italy 13 Istituto Nazionale di Fisica Nucleare, Sezione di Pisa, I-56127 Pisa, Italy 14 Istituto Nazionale di Fisica Nucleare, Laboratori Nazionali di Frascati, via E. Fermi 40, I-00044 Frascati (Roma), Italy 15 Dipartimento di Fisica, Universit` a di Roma Tre, via della Vasca Navale 84, I-00146 Roma, Italy 16 Istituto Nazionale di Fisica Nucleare, Sezione di Trieste, and Universit` a di Trieste, I-34127 Trieste, Italy 17 Istituto Nazionale di Fisica Nucleare, Sezione di Perugia, I-06123 Perugia, Italy 18 Dipartimento di Fisica, Universit` a degli Studi di Perugia, I-06123 Perugia, Italy 19 NASA Goddard Space Flight Center, Greenbelt, MD 20771, USA 20 Dipartimento di Fisica “M. Merlin” dell’Universit` a e del Politecnico di Bari, I-70126 Bari, Italy 21 Istituto Nazionale di Fisica Nucleare, Sezione di Bari, I-70126 Bari, Italy 22 Laboratoire Leprince-Ringuet, ´ Ecole polytechnique, CNRS/IN2P3, I-91128, Palaiseau, France 23 Department of Physics, University of Washington, Seattle, WA 98195-1560, USA 24 INAF-IASF Bologna, I-40129 Bologna, Italy 25 Agenzia Spaziale Italiana (ASI) Science Data Center, I-00044 Frascati (Roma), Italy 26 Center for Earth Observing and Space Research, College of Science, George Mason University, Fairfax, VA 22030, USA 27 Space Science Division, Naval Research Laboratory, Washington, DC 20375-5352, USA 28 Istituto Nazionale di Astrofisica - Osservatorio Astronomico di Roma, I-00040 Monte Porzio Catone (Roma), Italy 29 Laboratoire Univers et Particules de Montpellier, Universit´ e Montpellier 2, CNRS/IN2P3, F-34095 Montpellier, France 30 Department of Physics and Astronomy, Sonoma State University, Rohnert Park, CA 94928-3609, USA 31 Department of Physics, Stockholm University, AlbaNova, SE-106 91 Stockholm, Sweden 32 The Oskar Klein Centre for Cosmoparticle Physics, AlbaNova, SE-106 91 Stockholm, Sweden 33 The Royal Swedish Academy of Sciences, Box 50005, SE-104 05 Stockholm, Sweden 34 INAF Istituto di Radioastronomia, I-40129 Bologna, Italy 35 Dipartimento di Fisica, Universit` a di Udine and Istituto Nazionale di Fisica Nucleare, Sezione di Trieste, Gruppo Collegato di Udine, I-33100 Udine, Italy 36 Fermilab, Batavia, IL 60510, USA 37 Harvard-Smithsonian Center for Astrophysics, Cambridge, MA 02138, USA; [email protected] 38 Istituto Nazionale di Fisica Nucleare, Sezione di Roma “Tor Vergata,” I-00133 Roma, Italy 39 Departamento de F´ ısica Te´ orica, Universidad Aut´ onoma de Madrid, Cantoblanco, E-28049 Madrid, Spain 40 Instituto de F´ ısica Te´ orica IFT-UAM/CSIC, Universidad Aut´ onoma de Madrid, Cantoblanco, E-28049 Madrid, Spain 41 Institut f ¨ ur Astro- und Teilchenphysik and Institut f¨ ur Theoretische Physik, Leopold-Franzens-Universit¨ at Innsbruck, A-6020 Innsbruck, Austria 1
Transcript of THE FIRST FERMI -LAT CATALOG OF SOURCES ABOVE 10 GeV

The Astrophysical Journal Supplement Series, 209:34 (34pp), 2013 December doi:10.1088/0067-0049/209/2/34C© 2013. The American Astronomical Society. All rights reserved. Printed in the U.S.A.
THE FIRST FERMI-LAT CATALOG OF SOURCES ABOVE 10 GeV
M. Ackermann1, M. Ajello2, A. Allafort3, W. B. Atwood4, L. Baldini5, J. Ballet6, G. Barbiellini7,8, D. Bastieri9,10,K. Bechtol3, A. Belfiore4,11,12, R. Bellazzini13, E. Bernieri14,15, E. Bissaldi16, E. D. Bloom3, E. Bonamente17,18,
T. J. Brandt19, J. Bregeon13, M. Brigida20,21, P. Bruel22, R. Buehler1, T. H. Burnett23, S. Buson9,10, G. A. Caliandro3,R. A. Cameron3, R. Campana24, P. A. Caraveo12, J. M. Casandjian6, E. Cavazzuti25, C. Cecchi17,18, E. Charles3,
R. C. G. Chaves6, A. Chekhtman26,73, C. C. Cheung27, J. Chiang3, G. Chiaro10, S. Ciprini25,28, R. Claus3,J. Cohen-Tanugi29, L. R. Cominsky30, J. Conrad31,32,33,74, S. Cutini25,28, F. D’Ammando34, A. de Angelis35,
F. de Palma20,21, C. D. Dermer27, R. Desiante7, S. W. Digel3, L. Di Venere20, P. S. Drell3, A. Drlica-Wagner36,C. Favuzzi20,21, S. J. Fegan22, E. C. Ferrara19, W. B. Focke3, P. Fortin37, A. Franckowiak3, S. Funk3, P. Fusco20,21,
F. Gargano21, D. Gasparrini25,28, N. Gehrels19, S. Germani17,18, N. Giglietto20,21, P. Giommi25, F. Giordano20,21,M. Giroletti34, G. Godfrey3, G. A. Gomez-Vargas38,39,40, I. A. Grenier6, S. Guiriec19,75, D. Hadasch41, Y. Hanabata42,
A. K. Harding19, M. Hayashida42, E. Hays19, J. Hewitt19, A. B. Hill3,43,76, D. Horan22, R. E. Hughes44, T. Jogler3,G. Johannesson45, A. S. Johnson3, T. J. Johnson46,73, W. N. Johnson27, T. Kamae3, J. Kataoka47, T. Kawano48,
J. Knodlseder49,50, M. Kuss13, J. Lande3, S. Larsson31,32,51, L. Latronico52, M. Lemoine-Goumard53,77, F. Longo7,8,F. Loparco20,21, B. Lott53, M. N. Lovellette27, P. Lubrano17,18, E. Massaro54, M. Mayer1, M. N. Mazziotta21,
J. E. McEnery19,55, J. Mehault53, P. F. Michelson3, T. Mizuno56, A. A. Moiseev55,57, M. E. Monzani3, A. Morselli38,I. V. Moskalenko3, S. Murgia58, R. Nemmen19, E. Nuss29, T. Ohsugi56, A. Okumura3,59, M. Orienti34, J. F. Ormes60,
D. Paneque3,61, J. S. Perkins19, M. Pesce-Rollins13, F. Piron29, G. Pivato10, T. A. Porter3, S. Raino20,21, M. Razzano13,78,A. Reimer3,41, O. Reimer3,41, T. Reposeur53, S. Ritz4, R. W. Romani3, M. Roth23, P. M. Saz Parkinson4,62, A. Schulz1,
C. Sgro13, E. J. Siskind63, D. A. Smith53, G. Spandre13, P. Spinelli20,21, Łukasz Stawarz64,65, A. W. Strong66,D. J. Suson67, H. Takahashi48, J. G. Thayer3, J. B. Thayer3, D. J. Thompson19, L. Tibaldo3, M. Tinivella13,
D. F. Torres68,69, G. Tosti17,18, E. Troja19,55, Y. Uchiyama70, T. L. Usher3, J. Vandenbroucke3, V. Vasileiou29,G. Vianello3,71, V. Vitale38,72, M. Werner41, B. L. Winer44, K. S. Wood27, and M. Wood3
1 Deutsches Elektronen Synchrotron DESY, D-15738 Zeuthen, Germany2 Space Sciences Laboratory, 7 Gauss Way, University of California, Berkeley, CA 94720-7450, USA
3 W. W. Hansen Experimental Physics Laboratory, Kavli Institute for Particle Astrophysics and Cosmology, Department of Physics and SLACNational Accelerator Laboratory, Stanford University, Stanford, CA 94305, USA; [email protected]
4 Santa Cruz Institute for Particle Physics, Department of Physics and Department of Astronomy and Astrophysics,University of California at Santa Cruz, Santa Cruz, CA 95064, USA
5 Universita di Pisa and Istituto Nazionale di Fisica Nucleare, Sezione di Pisa, I-56127 Pisa, Italy6 Laboratoire AIM, CEA-IRFU/CNRS/Universite Paris Diderot, Service d’Astrophysique, CEA Saclay, F-91191 Gif sur Yvette, France
7 Istituto Nazionale di Fisica Nucleare, Sezione di Trieste, I-34127 Trieste, Italy8 Dipartimento di Fisica, Universita di Trieste, I-34127 Trieste, Italy
9 Istituto Nazionale di Fisica Nucleare, Sezione di Padova, I-35131 Padova, Italy10 Dipartimento di Fisica e Astronomia “G. Galilei,” Universita di Padova, I-35131 Padova, Italy
11 Universita degli Studi di Pavia, I-27100 Pavia, Italy12 INAF-Istituto di Astrofisica Spaziale e Fisica Cosmica, I-20133 Milano, Italy
13 Istituto Nazionale di Fisica Nucleare, Sezione di Pisa, I-56127 Pisa, Italy14 Istituto Nazionale di Fisica Nucleare, Laboratori Nazionali di Frascati, via E. Fermi 40, I-00044 Frascati (Roma), Italy
15 Dipartimento di Fisica, Universita di Roma Tre, via della Vasca Navale 84, I-00146 Roma, Italy16 Istituto Nazionale di Fisica Nucleare, Sezione di Trieste, and Universita di Trieste, I-34127 Trieste, Italy
17 Istituto Nazionale di Fisica Nucleare, Sezione di Perugia, I-06123 Perugia, Italy18 Dipartimento di Fisica, Universita degli Studi di Perugia, I-06123 Perugia, Italy
19 NASA Goddard Space Flight Center, Greenbelt, MD 20771, USA20 Dipartimento di Fisica “M. Merlin” dell’Universita e del Politecnico di Bari, I-70126 Bari, Italy
21 Istituto Nazionale di Fisica Nucleare, Sezione di Bari, I-70126 Bari, Italy22 Laboratoire Leprince-Ringuet, Ecole polytechnique, CNRS/IN2P3, I-91128, Palaiseau, France
23 Department of Physics, University of Washington, Seattle, WA 98195-1560, USA24 INAF-IASF Bologna, I-40129 Bologna, Italy
25 Agenzia Spaziale Italiana (ASI) Science Data Center, I-00044 Frascati (Roma), Italy26 Center for Earth Observing and Space Research, College of Science, George Mason University, Fairfax, VA 22030, USA
27 Space Science Division, Naval Research Laboratory, Washington, DC 20375-5352, USA28 Istituto Nazionale di Astrofisica - Osservatorio Astronomico di Roma, I-00040 Monte Porzio Catone (Roma), Italy
29 Laboratoire Univers et Particules de Montpellier, Universite Montpellier 2, CNRS/IN2P3, F-34095 Montpellier, France30 Department of Physics and Astronomy, Sonoma State University, Rohnert Park, CA 94928-3609, USA
31 Department of Physics, Stockholm University, AlbaNova, SE-106 91 Stockholm, Sweden32 The Oskar Klein Centre for Cosmoparticle Physics, AlbaNova, SE-106 91 Stockholm, Sweden
33 The Royal Swedish Academy of Sciences, Box 50005, SE-104 05 Stockholm, Sweden34 INAF Istituto di Radioastronomia, I-40129 Bologna, Italy
35 Dipartimento di Fisica, Universita di Udine and Istituto Nazionale di Fisica Nucleare, Sezione di Trieste, Gruppo Collegato di Udine, I-33100 Udine, Italy36 Fermilab, Batavia, IL 60510, USA
37 Harvard-Smithsonian Center for Astrophysics, Cambridge, MA 02138, USA; [email protected] Istituto Nazionale di Fisica Nucleare, Sezione di Roma “Tor Vergata,” I-00133 Roma, Italy
39 Departamento de Fısica Teorica, Universidad Autonoma de Madrid, Cantoblanco, E-28049 Madrid, Spain40 Instituto de Fısica Teorica IFT-UAM/CSIC, Universidad Autonoma de Madrid, Cantoblanco, E-28049 Madrid, Spain
41 Institut fur Astro- und Teilchenphysik and Institut fur Theoretische Physik, Leopold-Franzens-Universitat Innsbruck, A-6020 Innsbruck, Austria
1

The Astrophysical Journal Supplement Series, 209:34 (34pp), 2013 December Ackermann et al.
42 Institute for Cosmic-Ray Research, University of Tokyo, 5-1-5 Kashiwanoha, Kashiwa, Chiba 277-8582, Japan43 School of Physics and Astronomy, University of Southampton, Highfield, Southampton SO17 1BJ, UK
44 Department of Physics, Center for Cosmology and Astro-Particle Physics, The Ohio State University, Columbus, OH 43210, USA45 Science Institute, University of Iceland, IS-107 Reykjavik, Iceland
46 National Research Council Research Associate, National Academy of Sciences, Washington, DC 20001, USA47 Research Institute for Science and Engineering, Waseda University, 3-4-1, Okubo, Shinjuku, Tokyo 169-8555, Japan
48 Department of Physical Sciences, Hiroshima University, Higashi-Hiroshima, Hiroshima 739-8526, Japan49 CNRS, IRAP, F-31028 Toulouse cedex 4, France
50 GAHEC, Universite de Toulouse, UPS-OMP, IRAP, F-31028 Toulouse, France51 Department of Astronomy, Stockholm University, SE-106 91 Stockholm, Sweden
52 Istituto Nazionale di Fisica Nucleare, Sezione di Torino, I-10125 Torino, Italy53 Centre d’Etudes Nucleaires de Bordeaux Gradignan, IN2P3/CNRS, Universite Bordeaux 1, BP120, F-33175 Gradignan Cedex, France
54 Physics Department, Universita di Roma “La Sapienza,” I-00185 Roma, Italy55 Department of Physics and Department of Astronomy, University of Maryland, College Park, MD 20742, USA
56 Hiroshima Astrophysical Science Center, Hiroshima University, Higashi-Hiroshima, Hiroshima 739-8526, Japan57 Center for Research and Exploration in Space Science and Technology (CRESST) and NASA Goddard Space Flight Center, Greenbelt, MD 20771, USA
58 Center for Cosmology, Physics and Astronomy Department, University of California, Irvine, CA 92697-2575, USA59 Solar-Terrestrial Environment Laboratory, Nagoya University, Nagoya 464-8601, Japan60 Department of Physics and Astronomy, University of Denver, Denver, CO 80208, USA
61 Max-Planck-Institut fur Physik, D-80805 Munchen, Germany; [email protected] Department of Physics, The University of Hong Kong, Pokfulam Road, Hong Kong, China
63 NYCB Real-Time Computing Inc., Lattingtown, NY 11560-1025, USA64 Institute of Space and Astronautical Science, JAXA, 3-1-1 Yoshinodai, Chuo-ku, Sagamihara, Kanagawa 252-5210, Japan
65 Astronomical Observatory, Jagiellonian University, 30-244 Krakow, Poland66 Max-Planck Institut fur extraterrestrische Physik, D-85748 Garching, Germany
67 Department of Chemistry and Physics, Purdue University Calumet, Hammond, IN 46323-2094, USA68 Institut de Ciencies de l’Espai (IEEE-CSIC), Campus UAB, E-08193 Barcelona, Spain69 Institucio Catalana de Recerca i Estudis Avancats (ICREA), E-08010 Barcelona, Spain
70 3-34-1 Nishi-Ikebukuro, Toshima-ku, Tokyo 171-8501, Japan71 Consorzio Interuniversitario per la Fisica Spaziale (CIFS), I-10133 Torino, Italy72 Dipartimento di Fisica, Universita di Roma “Tor Vergata,” I-00133 Roma, ItalyReceived 2013 June 27; accepted 2013 October 14; published 2013 November 14
ABSTRACT
We present a catalog of γ -ray sources at energies above 10 GeV based on data from the Large Area Telescope (LAT)accumulated during the first 3 yr of the Fermi Gamma-ray Space Telescope mission. The first Fermi-LAT catalog of>10 GeV sources (1FHL) has 514 sources. For each source we present location, spectrum, a measure of variability,and associations with cataloged sources at other wavelengths. We found that 449 (87%) could be associated withknown sources, of which 393 (76% of the 1FHL sources) are active galactic nuclei. Of the 27 sources associatedwith known pulsars, we find 20 (12) to have significant pulsations in the range >10 GeV (>25 GeV). In this workwe also report that, at energies above 10 GeV, unresolved sources account for 27% ± 8% of the isotropic γ -raybackground, while the unresolved Galactic population contributes only at the few percent level to the Galacticdiffuse background. We also highlight the subset of the 1FHL sources that are best candidates for detection atenergies above 50–100 GeV with current and future ground-based γ -ray observatories.
Key words: catalogs – gamma rays: general
Online-only material: color figures, machine-readable tables, extended figure, supplemental data (FITS) file
1. INTRODUCTION
The primary catalog of γ -ray sources detected by the FermiLarge Area Telescope (LAT), the second LAT source catalog(hereafter 2FGL; Nolan et al. 2012), presents sources detectedat energies above 100 MeV in the first 2 yr of science operations.Motivations for studying the γ -ray sky at even higher energies inLAT data are numerous, including finding the hardest-spectrumsources and characterizing them separately from their generallymuch brighter emission at lower energies. Here we present acatalog of sources detected above 10 GeV in the LAT data.
73 Currently at Naval Research Laboratory, Washington, DC 20375, USA.74 Royal Swedish Academy of Sciences Research Fellow, funded by a grantfrom the K. A. Wallenberg Foundation.75 NASA Postdoctoral Program Fellow, USA.76 Funded by a Marie Curie IOF, FP7/2007-2013 - Grant agreement no.275861.77 Funded by contract ERC-StG-259391 from the European Community.78 Funded by contract FIRB-2012-RBFR12PM1F from the Italian Ministry ofEducation, University and Research (MIUR).
This work is not the first systematic study of γ -ray sourcesin the GeV range. Lamb & Macomb (1997) presented a catalogof 57 sources detected above 1 GeV in 4.5 yr of data fromthe Energetic Gamma-Ray Experiment Telescope (EGRET) onthe Compton Gamma Ray Observatory. Relative to the thirdEGRET catalog of sources detected above 100 MeV (hereafter3EG; Hartman et al. 1999) the localization regions are smallerand the fraction of sources for which no counterpart at otherwavelengths could be confidently assigned is also smaller (53%versus 63% of the 271 3EG sources). Individual sources couldnot be detected at higher energies with EGRET but Thompsonet al. (2005) studied the distribution of the 1506 EGRETγ -rays above 10 GeV and found 187 to be within 1◦ of a 3EGsource. Neronov & Semikoz (2010) searched for sources atenergies above 100 GeV in ∼2 yr of LAT data for Galacticlatitudes |b| < 10◦, reporting 19 sources. Neronov et al. (2011)reported strong correlations between >100 GeV LAT γ -raysand cataloged γ -ray sources.
The current LAT data allow a much deeper exploration ofthe sky above 10 GeV than has been possible before, with an
2

The Astrophysical Journal Supplement Series, 209:34 (34pp), 2013 December Ackermann et al.
energy range that approaches the >100 GeV (hereafter VHE)domain studied by imaging atmospheric Cherenkov telescopes(IACTs). Broadband studies of γ -ray sources provide insightsinto the acceleration and radiation mechanisms operating at thehighest energies. The relatively small fields of view and limitedduty cycles of IACTs, and the low fluxes of VHE sources, makestarget selection very important for source searches with IACTs.According to the TeVCat catalog79 version 3.400, 105 sourceshave been detected at VHE,80 which is approximately 20 timesfewer than in the 2FGL catalog. A catalog of >10 GeV FermiLAT detections may increase the efficiency of these searcheswith current generation of IACTs, namely H.E.S.S., MAGICand VERITAS.
In our catalog of LAT sources above 10 GeV we report thelocations, spectra, and variability properties of the 514 sourcessignificantly detected in this range during the first 3 yr of theFermi mission. Many of these sources are already included inthe 2FGL catalog, although in that catalog their characterizationis dominated by the much larger numbers of γ rays detectedin the energy range 100 MeV–10 GeV. Consequently, thecharacteristics of the sources at the highest Fermi LAT energiesmight be overlooked. In addition, several of the sources reportedhere were not listed in the 2FGL, possibly due to the 33% lessexposure. We also develop a set of criteria to select the sourcesthat are the best candidates for detection at VHE with the currentgeneration of IACTs.
In Section 2 we describe the capabilities of the Fermi LATto perform astronomy at energies above 10 GeV. Section 3 de-scribes the overall Fermi sky above 10 GeV, the analysis proce-dures, the sources detected and the corresponding associationsto known objects. In Section 4 we report on the overall charac-teristics of these sources, with special focus on active galacticnuclei (AGNs), which constitute the majority of the catalog.Section 5 presents the criteria for selecting sources that may bedetectable with the current generation of IACTs operating above100 GeV. In Section 6 we report on the properties of the sourcepopulations above 10 GeV, and in Section 7 we summarize andconclude this work.
2. INSTRUMENT AND BACKGROUND
The Fermi LAT is a γ -ray telescope operating from 20 MeVto >300 GeV. The instrument is a 4 × 4 array of identicaltowers, each one consisting of a tracker (where the photonshave a high probability of converting to pairs, which aretracked to allow reconstruction of the γ -ray direction) anda segmented calorimeter (where the electromagnetic showerproduces scintillation light, from which the γ -ray energy canbe estimated). The tracker is covered with an anti-coincidencedetector to reject the charged-particle background. Furtherdetails on the LAT, its performance, and calibration are givenby Atwood et al. (2009) and Ackermann et al. (2012b). In thefollowing subsections we report on the event classification, thecorresponding instrument response functions, the data selection,the exposure, and the resulting point-source sensitivity. Thesensitivity is derived using the approach presented by Abdo et al.(2010e) for the first Fermi LAT source catalog, which is basedon a standard likelihood function formalism. The likelihoodcombines the data with a model of the sky that includes localizedγ -ray sources and diffuse backgrounds and accounts for theinstrument response functions and the exposure.
79 http://tevcat.uchicago.edu/80 Including recently announced VHE detections the number is 143.
2.1. LAT Event Class Selection
The γ -ray event selection used for this study benefited fromthe experience acquired by the Fermi LAT collaboration dur-ing the first years of operation, which led to the development ofthe Pass 7 event classifications (Ackermann et al. 2012b). TheP7CLEAN event class was used in constructing this catalog asit provides a substantial reduction in residual cosmic-ray back-ground (cosmic rays misclassified as γ -rays) above 10 GeV rel-ative to the P7SOURCE event class used for 2FGL. The isotropicbackground, which comprises both the diffuse γ -ray and resid-ual cosmic-ray backgrounds, is a factor of approximately fiveless than for the P7SOURCE event class, which was used for the2FGL catalog analysis, for which the larger effective area atlower energies was the overriding consideration. The decreasein the isotropic background is dominated by the large reductionin residual charged cosmic rays in the P7CLEAN class, approx-imately a factor of four at 10 GeV and more than an order ofmagnitude at 100 GeV, as reported in Ackermann et al. (2012b).For the analyses we used the corresponding P7CLEAN_V6 in-strument response functions. The systematic uncertainty in theeffective area above 10 GeV is estimated to be 10% (Ackermannet al. 2012b).81
2.2. Performance of the LAT
The Fermi LAT has a field of view of ∼2.4 sr, and is mostsensitive (in E2dN/dE) for photon energies of about 3 GeV.Above this energy, up to ∼300 GeV, the on-axis effective areafor P7CLEAN_V6 is at least 0.7 m2. It rolls off to ∼0.65 m2 by500 GeV. At γ -ray energies below 10 GeV, the point-spreadfunction (PSF) is dominated by multiple Coulomb scatteringin the tracker (which varies inversely with the electron energy).Above 10 GeV the geometry of the tracker itself is the dominantfactor, and so the PSF is not as strongly energy dependent as atlower energies. The 68% containment radius of the PSF (Frontand Back averaged) is ∼0.◦3 at 10 GeV, narrowing to ∼0.◦2above 100 GeV. The energy resolution ranges from 8% (68%containment) at 10 GeV to approximately 15% at 500 GeV dueto the lack of containment of the electromagnetic shower insidethe calorimeter. This does not appreciably affect the sensitivity,because the angular resolution and effective area depend onlyweakly on energy in this range.
2.3. Data Selection and the Sky above 10 GeV
In this work we analyze γ rays with energies in the range10–500 GeV. To limit the contamination from γ rays producedby cosmic-ray interactions in the upper atmosphere, γ rays withzenith angles greater than 105◦ were excluded. To further reducethe residual γ rays from the upper atmosphere only data for timeperiods when the spacecraft rocking angle was less than 52◦were considered. Time intervals with larger rocking angles aretypically no more than tens of minutes long, occurring duringorbits when the spacecraft was executing pointed observationsinstead of the standard sky-scanning survey mode. The longestcontiguous time interval with rocking angle greater than 52◦during the 3 yr considered here (Section 2.4) was 5 hr, during apointed observation near the orbital pole.
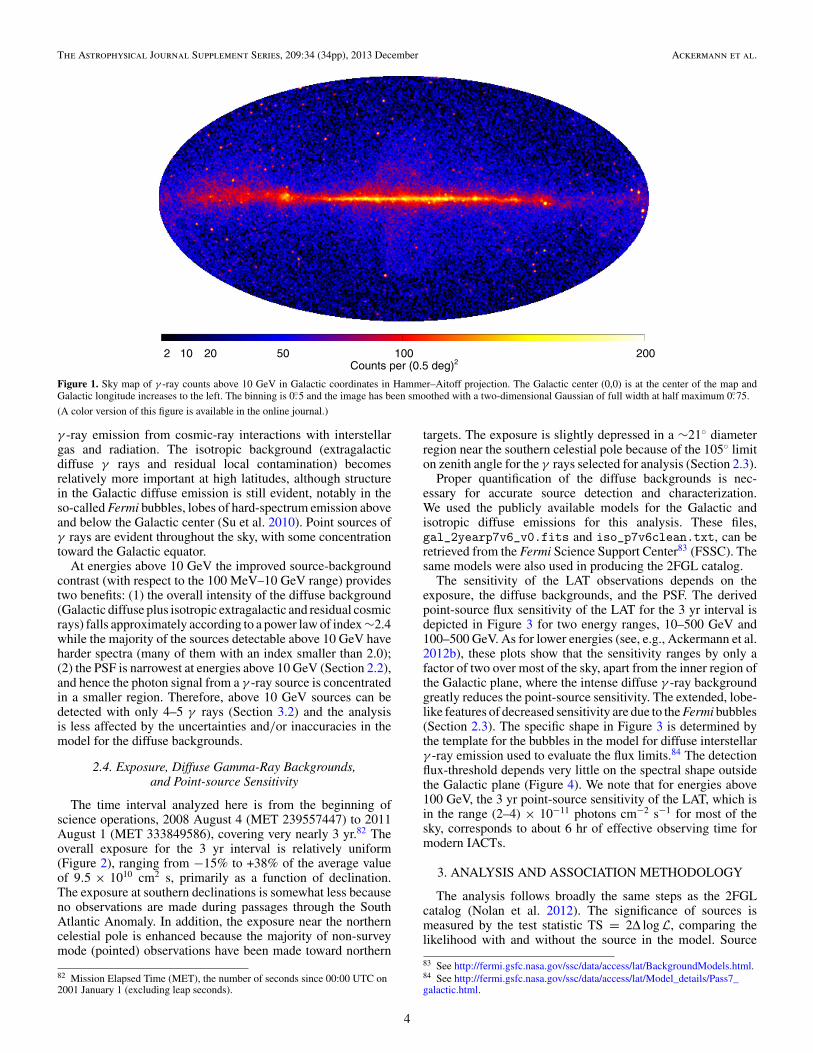
Figure 1 shows the distribution of γ rays above 10 GeV. Sincethe exposure is quite uniform (Section 2.4), this distributionreflects the spatial variations in the brightness of the sky. Thebright band along the Galactic equator is primarily due to diffuse
81 See also http://fermi.gsfc.nasa.gov/ssc/data/analysis/LAT_caveats.html.
3
The Astrophysical Journal Supplement Series, 209:34 (34pp), 2013 December Ackermann et al.
2 10 20 50 100 200Counts per (0.5 deg)2
Figure 1. Sky map of γ -ray counts above 10 GeV in Galactic coordinates in Hammer–Aitoff projection. The Galactic center (0,0) is at the center of the map andGalactic longitude increases to the left. The binning is 0.◦5 and the image has been smoothed with a two-dimensional Gaussian of full width at half maximum 0.◦75.
(A color version of this figure is available in the online journal.)
γ -ray emission from cosmic-ray interactions with interstellargas and radiation. The isotropic background (extragalacticdiffuse γ rays and residual local contamination) becomesrelatively more important at high latitudes, although structurein the Galactic diffuse emission is still evident, notably in theso-called Fermi bubbles, lobes of hard-spectrum emission aboveand below the Galactic center (Su et al. 2010). Point sources ofγ rays are evident throughout the sky, with some concentrationtoward the Galactic equator.
At energies above 10 GeV the improved source-backgroundcontrast (with respect to the 100 MeV–10 GeV range) providestwo benefits: (1) the overall intensity of the diffuse background(Galactic diffuse plus isotropic extragalactic and residual cosmicrays) falls approximately according to a power law of index ∼2.4while the majority of the sources detectable above 10 GeV haveharder spectra (many of them with an index smaller than 2.0);(2) the PSF is narrowest at energies above 10 GeV (Section 2.2),and hence the photon signal from a γ -ray source is concentratedin a smaller region. Therefore, above 10 GeV sources can bedetected with only 4–5 γ rays (Section 3.2) and the analysisis less affected by the uncertainties and/or inaccuracies in themodel for the diffuse backgrounds.
2.4. Exposure, Diffuse Gamma-Ray Backgrounds,and Point-source Sensitivity
The time interval analyzed here is from the beginning ofscience operations, 2008 August 4 (MET 239557447) to 2011August 1 (MET 333849586), covering very nearly 3 yr.82 Theoverall exposure for the 3 yr interval is relatively uniform(Figure 2), ranging from −15% to +38% of the average valueof 9.5 × 1010 cm2 s, primarily as a function of declination.The exposure at southern declinations is somewhat less becauseno observations are made during passages through the SouthAtlantic Anomaly. In addition, the exposure near the northerncelestial pole is enhanced because the majority of non-surveymode (pointed) observations have been made toward northern
82 Mission Elapsed Time (MET), the number of seconds since 00:00 UTC on2001 January 1 (excluding leap seconds).
targets. The exposure is slightly depressed in a ∼21◦ diameterregion near the southern celestial pole because of the 105◦ limiton zenith angle for the γ rays selected for analysis (Section 2.3).
Proper quantification of the diffuse backgrounds is nec-essary for accurate source detection and characterization.We used the publicly available models for the Galactic andisotropic diffuse emissions for this analysis. These files,gal_2yearp7v6_v0.fits and iso_p7v6clean.txt, can beretrieved from the Fermi Science Support Center83 (FSSC). Thesame models were also used in producing the 2FGL catalog.
The sensitivity of the LAT observations depends on theexposure, the diffuse backgrounds, and the PSF. The derivedpoint-source flux sensitivity of the LAT for the 3 yr interval isdepicted in Figure 3 for two energy ranges, 10–500 GeV and100–500 GeV. As for lower energies (see, e.g., Ackermann et al.2012b), these plots show that the sensitivity ranges by only afactor of two over most of the sky, apart from the inner region ofthe Galactic plane, where the intense diffuse γ -ray backgroundgreatly reduces the point-source sensitivity. The extended, lobe-like features of decreased sensitivity are due to the Fermi bubbles(Section 2.3). The specific shape in Figure 3 is determined bythe template for the bubbles in the model for diffuse interstellarγ -ray emission used to evaluate the flux limits.84 The detectionflux-threshold depends very little on the spectral shape outsidethe Galactic plane (Figure 4). We note that for energies above100 GeV, the 3 yr point-source sensitivity of the LAT, which isin the range (2–4) × 10−11 photons cm−2 s−1 for most of thesky, corresponds to about 6 hr of effective observing time formodern IACTs.
3. ANALYSIS AND ASSOCIATION METHODOLOGY
The analysis follows broadly the same steps as the 2FGLcatalog (Nolan et al. 2012). The significance of sources ismeasured by the test statistic TS = 2Δ logL, comparing thelikelihood with and without the source in the model. Source
83 See http://fermi.gsfc.nasa.gov/ssc/data/access/lat/BackgroundModels.html.84 See http://fermi.gsfc.nasa.gov/ssc/data/access/lat/Model_details/Pass7_galactic.html.
4

The Astrophysical Journal Supplement Series, 209:34 (34pp), 2013 December Ackermann et al.
0.8 0.9 1.0 1.1 1.2 1.3Exposure (1011 cm2 s)
Figure 2. Overall exposure at 10 GeV for the 3 yr time period considered here, in Galactic coordinates in Hammer–Aitoff projection. The same cuts on rocking angleand zenith angle as described in Section 2.3 have been applied. The overall average is 9.5 × 1010 cm2 s.
(A color version of this figure is available in the online journal.)
0
4
8
12
16
20
24
28
32
36
40
0
1
2
3
4
5
6
7
8
9
10
Figure 3. Minimum detectable photon flux (in 10−11 photons cm−2 s−1) for a γ -ray point source (with spectral index of 2.5) after 3 yr for 10–500 GeV (left) and for100–500 GeV (right). The images are in Hammer–Aitoff projection in Galactic coordinates. The images are available as FITS files in the electronic edition and fromthe FSSC.
(A color version and supplemental data for this figure are available in the online journal.)
detection and characterization began with the assembly of a listof “seeds” (Section 3.1), candidate sources that were selected forinput to the likelihood analysis chain. The seeds were suppliedto the standard maximum likelihood analysis that was used tojointly optimize the spectral parameters of the candidate sourcesand to judge their overall significances (Section 3.2). The searchfor source variability differs from the 2FGL analysis owingto the limited statistics of the data (Section 3.3). In the finalstep of the analysis we searched for candidate counterparts ofthese 1FHL sources with sources in previous LAT catalogs andsources in known γ -ray-emitting classes at other wavelengths(Section 3.4).
3.1. Seed Selection and Localization
The list of seeds and their locations were obtained in thesame way as for the 2FGL catalog analysis, i.e., through aniterative three-step process: (1) identification of potential γ -raypoint sources, the “seeds”; (2) optimization of the model of theγ -ray sky describing both the diffuse emission and the potentialsources; and (3) the creation of a residual TS map. This iterativeprocess was performed using the pointlike (Kerr 2010) analysispipeline. We briefly summarize the steps below.
The starting model was the collection of sources in the2FGL catalog, to which we added the new seeds obtainedwith the source-search algorithms mr_filter (Starck & Pierre1998), PGWave (Damiani et al. 1997; Ciprini et al. 2007) andthe minimal spanning tree (Campana et al. 2008). Each of thealgorithms was applied to γ rays in the 10–500 GeV range in the3 yr data set, and all seeds found with at least one of these wereconsidered. The initial model was refined by an iterative processin which new seeds were identified in residual TS maps thatcovered the full sky, and seeds that were no longer significant inthe model were removed. The source-search algorithms were notused for the successive iterations. As for the TS maps in 2FGL,the value of TS at any given position was evaluated as the sumof test statistics for separate energy bands, TSi , spanning theoverall energy range.
In each iteration, the locations of the potential sources wereoptimized during the third step, the creation of the residual TSmap. In this step, the log likelihood was maximized with respectto position of each seed, keeping the rest of the model (diffuseemission and other seeds) unchanged.
The uncertainty in the localization of a seed was determinedby evaluating the variation of the likelihood function with
5
The Astrophysical Journal Supplement Series, 209:34 (34pp), 2013 December Ackermann et al.
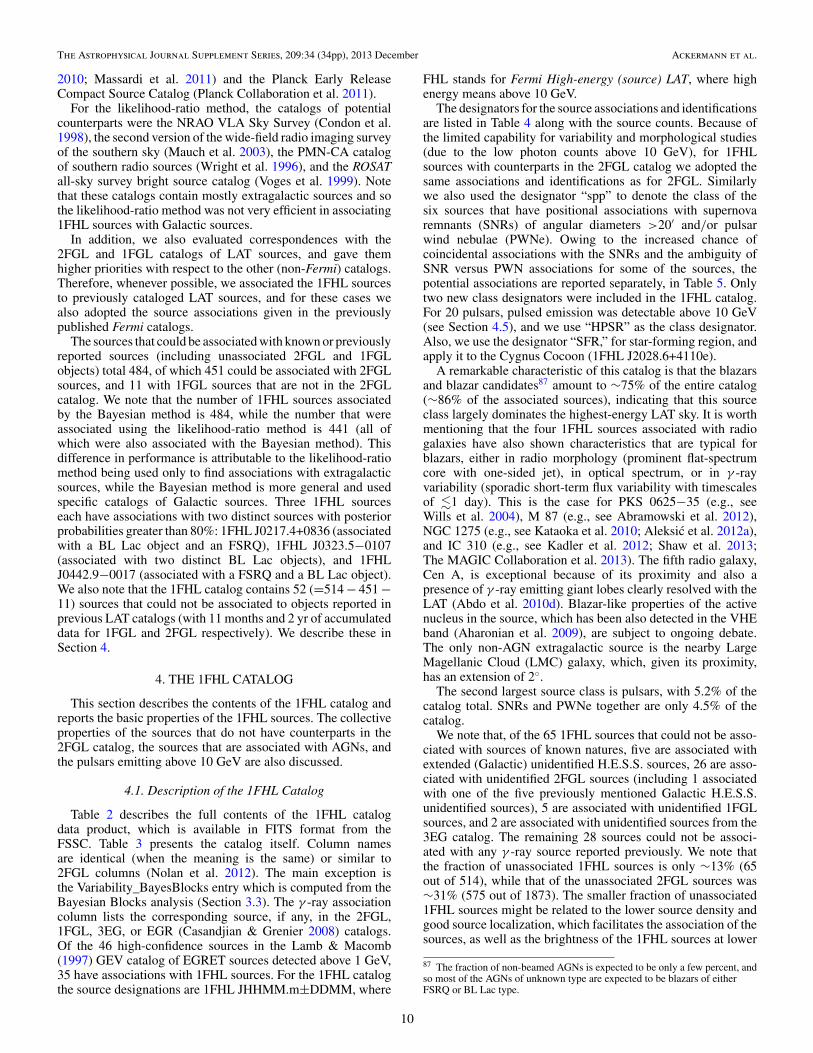
Table 1Extended Sources Modeled in the 1FHL Analysis
1FHL Name Extended Source Spatial Form Extent Reference
· · · SMC 2D Gaussian 0.◦9 Abdo et al. (2010c)J0526.6−6825e LMC 2D Gaussiana 1.2, 0.2 Abdo et al. (2010m)· · · S 147 Map · · · Katsuta et al. (2012)J0617.2+2234e IC 443 2D Gaussian 0.26 Abdo et al. (2010l)J0822.6−4250e Puppis A Disk 0.37 Lande et al. (2012)J0833.1−4511e Vela X Disk 0.88 Abdo et al. (2010i)J0852.7−4631e Vela Junior Disk 1.12 Tanaka et al. (2011)· · · Centaurus A (lobes) Map · · · Abdo et al. (2010d)J1514.0−5915e MSH 15−52 Disk 0.25 Abdo et al. (2010b)J1615.3−5146e HESS J1614−518 Disk 0.42 Lande et al. (2012)J1616.2−5054e HESS J1616−508 Disk 0.32 Lande et al. (2012)J1633.0−4746e HESS J1632−478 Disk 0.35 Lande et al. (2012)J1713.5−3951e RX J1713.7−3946 Map · · · Abdo et al. (2011c)J1801.3−2326e W28 Disk 0.39 Abdo et al. (2010h)J1805.6−2136e W30 Disk 0.37 Ajello et al. (2012a)J1824.5−1351e HESS J1825−137 2D Gaussian 0.56 Grondin et al. (2011)J1836.5−0655e HESS J1837−069 Disk 0.33 Lande et al. (2012)J1855.9+0121e W44 Ringb (0.22, 0.14), (0.30, 0.19) Abdo et al. (2010k)J1923.2+1408e W51C Diskb (0.40, 0.25) Abdo et al. (2009e)J2021.0+4031e γ -Cygni Disk 0.63 Lande et al. (2012)J2028.6+4110e Cygnus Cocoon 2D Gaussian 2.0 Ackermann et al. (2011a)· · · Cygnus Loop Ring 0.7, 1.6 Katagiri et al. (2011)
Notes. List of all sources that have been modeled as extended sources. The Extent column indicates the radius for Disk sources,the dispersion for Gaussian sources, and the inner and outer radii for Ring sources. All spectra were modeled as power laws (asfor point sources). Four were not detected above 10 GeV and do not have an 1FHL entry.a Combination of two 2D Gaussian spatial templates.b The shape is elliptical; each pair of parameters (a, b) represents the semi-major (a) and semi-minor (b) axes.
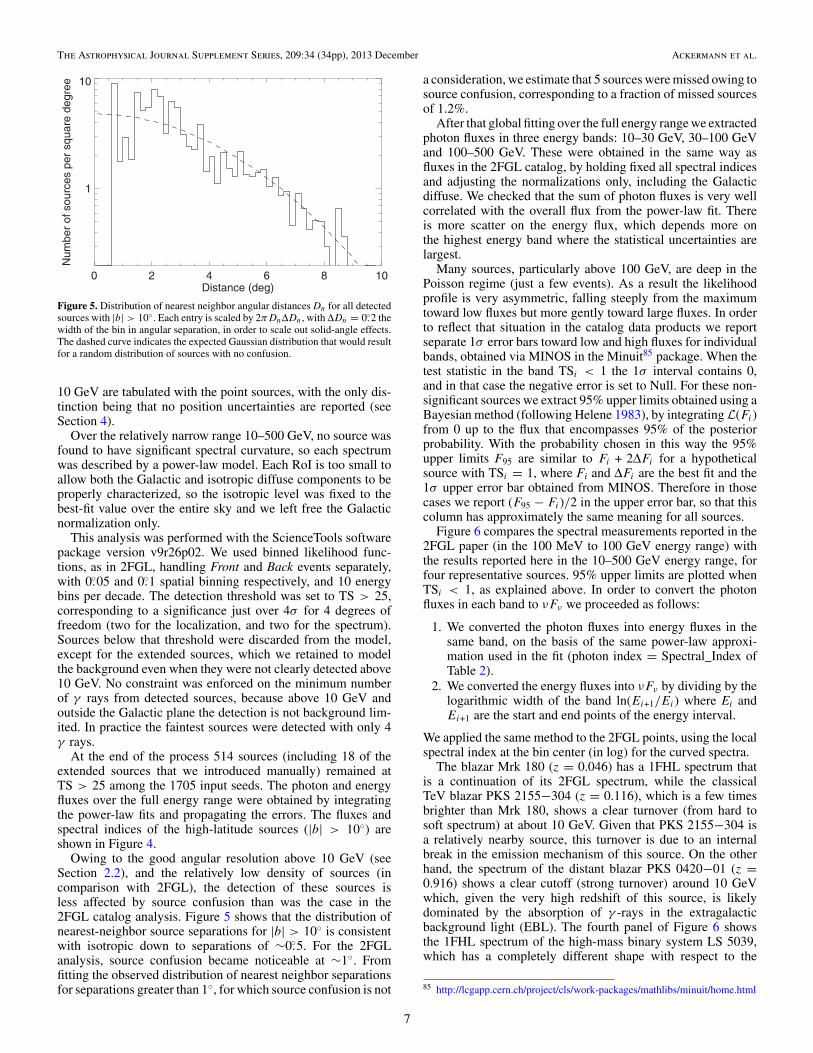
Figure 4. Photon fluxes of all detected sources outside the Galactic plane(|b| > 10◦) vs. their photon spectral indices. The theoretical detection thresholdfor the average background is overlaid as the full line. As a result of the lowintensity of the diffuse background and nearly constant PSF width over theentire range the detectability depends only very weakly on the spectral index.
respect to the best-fit position. To define the 95% sourcelocation uncertainty region we fit an ellipse to the likelihoodsurface about the maximum, with offset 2Δ logL = −5.99.The eccentricities of the source-location regions are moderate,averaging 0.47, corresponding to a semi-minor-to-semi-majoraxis ratio of 0.89. The ellipses have no preferred orientation onthe sky. The average solid angle of the 95% confidence regionscorrespond to an effective position uncertainty of 0.◦09: the rangeis 0.◦01–0.◦22.
For 1FHL we have not applied corrections for systematic un-certainties for the source location region sizes. As we show inSection 3.4, for the 416 sources with firmly established associ-
ations and no spatial extension in LAT or IACT measurements,19 (4.5%) of the associations lie outside their calculated 95%source location regions. This is consistent with the nominal ex-pectation, especially in consideration of the potential for slightbias from the role of angular offsets in assigning associations.For the 2FGL catalog analysis the systematics on source loca-tions were somewhat larger, and a scale factor of 1.1 was applied.For 2FGL the formal source location regions of the brightestpulsars were quite small and 0.◦005 was added in quadratureto account for potential residual misalignment of the LAT andspacecraft. For the 1FHL catalog, this factor would have, atmost, a minor contribution to all source location region sizes sowe have not included it.
3.2. Spectral Analysis of the Candidate Sources
Starting from the list of seeds (Section 3.1), we divided the skyinto a number of regions of interest (RoI) covering all sourceseeds; 561 RoIs were used for 1FHL. Each RoI extends 2◦beyond the seeds that are to be optimized within it in order tocover the entire PSF as well as allow the background diffuseemission to be well fit. Because the spatial resolution is goodabove 10 GeV, there is little cross-talk between sources orbetween RoIs, so global convergence was relatively easy toachieve.
We explicitly model the known spatially extended sourcesas extended, using the spatial extension from energies below10 GeV, as reported in previous works. In addition to the 12extended sources included in the 2FGL analysis, we also in-cluded 10 that have been detected as extended sources since then.Table 1 lists the source names, spatial template descriptions, andreferences for the dedicated analyses of these sources. The 18of these sources that are detected significantly (TS > 25) above
6
The Astrophysical Journal Supplement Series, 209:34 (34pp), 2013 December Ackermann et al.
0 2 4 6 8 10Distance (deg)
1
10N
umbe
r of
sou
rces
per
squ
are
degr
ee
Figure 5. Distribution of nearest neighbor angular distances Dn for all detectedsources with |b| > 10◦. Each entry is scaled by 2πDnΔDn, with ΔDn = 0.◦2 thewidth of the bin in angular separation, in order to scale out solid-angle effects.The dashed curve indicates the expected Gaussian distribution that would resultfor a random distribution of sources with no confusion.
10 GeV are tabulated with the point sources, with the only dis-tinction being that no position uncertainties are reported (seeSection 4).
Over the relatively narrow range 10–500 GeV, no source wasfound to have significant spectral curvature, so each spectrumwas described by a power-law model. Each RoI is too small toallow both the Galactic and isotropic diffuse components to beproperly characterized, so the isotropic level was fixed to thebest-fit value over the entire sky and we left free the Galacticnormalization only.
This analysis was performed with the ScienceTools softwarepackage version v9r26p02. We used binned likelihood func-tions, as in 2FGL, handling Front and Back events separately,with 0.◦05 and 0.◦1 spatial binning respectively, and 10 energybins per decade. The detection threshold was set to TS > 25,corresponding to a significance just over 4σ for 4 degrees offreedom (two for the localization, and two for the spectrum).Sources below that threshold were discarded from the model,except for the extended sources, which we retained to modelthe background even when they were not clearly detected above10 GeV. No constraint was enforced on the minimum numberof γ rays from detected sources, because above 10 GeV andoutside the Galactic plane the detection is not background lim-ited. In practice the faintest sources were detected with only 4γ rays.
At the end of the process 514 sources (including 18 of theextended sources that we introduced manually) remained atTS > 25 among the 1705 input seeds. The photon and energyfluxes over the full energy range were obtained by integratingthe power-law fits and propagating the errors. The fluxes andspectral indices of the high-latitude sources (|b| > 10◦) areshown in Figure 4.
Owing to the good angular resolution above 10 GeV (seeSection 2.2), and the relatively low density of sources (incomparison with 2FGL), the detection of these sources isless affected by source confusion than was the case in the2FGL catalog analysis. Figure 5 shows that the distribution ofnearest-neighbor source separations for |b| > 10◦ is consistentwith isotropic down to separations of ∼0.◦5. For the 2FGLanalysis, source confusion became noticeable at ∼1◦. Fromfitting the observed distribution of nearest neighbor separationsfor separations greater than 1◦, for which source confusion is not
a consideration, we estimate that 5 sources were missed owing tosource confusion, corresponding to a fraction of missed sourcesof 1.2%.
After that global fitting over the full energy range we extractedphoton fluxes in three energy bands: 10–30 GeV, 30–100 GeVand 100–500 GeV. These were obtained in the same way asfluxes in the 2FGL catalog, by holding fixed all spectral indicesand adjusting the normalizations only, including the Galacticdiffuse. We checked that the sum of photon fluxes is very wellcorrelated with the overall flux from the power-law fit. Thereis more scatter on the energy flux, which depends more onthe highest energy band where the statistical uncertainties arelargest.
Many sources, particularly above 100 GeV, are deep in thePoisson regime (just a few events). As a result the likelihoodprofile is very asymmetric, falling steeply from the maximumtoward low fluxes but more gently toward large fluxes. In orderto reflect that situation in the catalog data products we reportseparate 1σ error bars toward low and high fluxes for individualbands, obtained via MINOS in the Minuit85 package. When thetest statistic in the band TSi < 1 the 1σ interval contains 0,and in that case the negative error is set to Null. For these non-significant sources we extract 95% upper limits obtained using aBayesian method (following Helene 1983), by integrating L(Fi)from 0 up to the flux that encompasses 95% of the posteriorprobability. With the probability chosen in this way the 95%upper limits F95 are similar to Fi + 2ΔFi for a hypotheticalsource with TSi = 1, where Fi and ΔFi are the best fit and the1σ upper error bar obtained from MINOS. Therefore in thosecases we report (F95 − Fi)/2 in the upper error bar, so that thiscolumn has approximately the same meaning for all sources.
Figure 6 compares the spectral measurements reported in the2FGL paper (in the 100 MeV to 100 GeV energy range) withthe results reported here in the 10–500 GeV energy range, forfour representative sources. 95% upper limits are plotted whenTSi < 1, as explained above. In order to convert the photonfluxes in each band to νFν we proceeded as follows:
1. We converted the photon fluxes into energy fluxes in thesame band, on the basis of the same power-law approxi-mation used in the fit (photon index = Spectral_Index ofTable 2).
2. We converted the energy fluxes into νFν by dividing by thelogarithmic width of the band ln(Ei+1/Ei) where Ei andEi+1 are the start and end points of the energy interval.
We applied the same method to the 2FGL points, using the localspectral index at the bin center (in log) for the curved spectra.
The blazar Mrk 180 (z = 0.046) has a 1FHL spectrum thatis a continuation of its 2FGL spectrum, while the classicalTeV blazar PKS 2155−304 (z = 0.116), which is a few timesbrighter than Mrk 180, shows a clear turnover (from hard tosoft spectrum) at about 10 GeV. Given that PKS 2155−304 isa relatively nearby source, this turnover is due to an internalbreak in the emission mechanism of this source. On the otherhand, the spectrum of the distant blazar PKS 0420−01 (z =0.916) shows a clear cutoff (strong turnover) around 10 GeVwhich, given the very high redshift of this source, is likelydominated by the absorption of γ -rays in the extragalacticbackground light (EBL). The fourth panel of Figure 6 showsthe 1FHL spectrum of the high-mass binary system LS 5039,which has a completely different shape with respect to the
85 http://lcgapp.cern.ch/project/cls/work-packages/mathlibs/minuit/home.html
7

The Astrophysical Journal Supplement Series, 209:34 (34pp), 2013 December Ackermann et al.
]-1 s
-2 [e
rg c
mνFν
-1210
-1110
1FHL J1136.4+7009(Mrk 180 z=0.046)
-1310
-1210
-1110
1FHL J0423.3-0121(PKS 0420-01 z=0.916)
Energy [MeV]210 310 410 510
]-1 s
-2 [e
rg c
mνFν
-1110
-1010 1FHL J2158.8-3013(PKS 2155-304 z=0.116)
Energy [MeV]210 310 410 510
-1210
-1110
-10101FHL J1826.2-1450(LS 5039)
Figure 6. Spectral energy distribution of four representative 1FHL sources with different spectral shapes above 10 GeV: the blazars Mrk 180 (z = 0.046), PKS2155−304 (z = 0.116), and PKS 0420−01 (z = 0.916), and the high-mass binary system LS 5039. The black circles and light-gray bands depict the results reportedin the 2FGL catalog, while the blue squares and the dark-gray bands depict the spectral results reported in this work. The panels are labeled with the 1FHL names andthe names of the corresponding associated sources (in parentheses). See text for further details.
(A color version of this figure is available in the online journal.)
2FGL spectrum, hence indicating the presence of a new spectralcomponent (see Hadasch et al. 2012). Such deviations fromthe simple spectral extrapolation from lower energies indicatethe increasing dominance of other physical processes occurringat the source, or in the environment crossed by the γ rays,and hence they are very relevant for the proper understandingof these sources. This is one of the important motivations forproducing the 1FHL catalog.
3.3. Quantification of Variability withthe Bayesian Block Algorithm
The Bayesian Block algorithm for detecting and characteriz-ing variability in time series data (Scargle 1998; Scargle et al.2013) is particularly well-suited for analyzing low count data, animportant consideration for the 1FHL catalog, for which morethan half of the sources have fewer than 20 associated counts.The algorithm partitions the time series data into piecewise con-stant segments (blocks), each characterized by a rate (or flux)and duration. The locations of the transitions between blocks are
determined by optimizing a fitness function for the partitions.The algorithm for finding the optimal partitioning is describedby Jackson et al. (2005). For the analysis of the 1FHL data, thefitness function used is the logarithm of the maximum likelihoodfor each individual block under the constant local rate hypothe-sis, as described by Scargle et al. (2013). Using the simulationresults presented in that paper, an acceptable fraction of falsepositives for detecting variability can be easily specified. In theanalysis presented here, a false positive threshold of 1% wasused for all sources. This method also takes into account theeffective exposure associated to each event, thus correcting forthe exposure variations due to the motion of the field of view ofthe LAT.
For each source, we used an RoI of 0.◦5 radius centered onthe best-fit coordinates to extract the events. For sources withneighboring 1FHL sources closer than 1◦, we set the radius of theRoI to the greater value of (angular separation/2) or 0.◦25. Onlyfive pairs of sources had their RoIs fixed at 0.◦25, all of whichare located in the Galactic plane. In addition to the BayesianBlock analysis, for each source we also performed an aperture
8

The Astrophysical Journal Supplement Series, 209:34 (34pp), 2013 December Ackermann et al.
Table 2LAT 1FHL FITS Format: LAT_Point_Source_Catalog Extension
Column Format Unit Description
Source_Name 18A · · · · · ·RAJ2000 E deg Right ascensionDEJ2000 E deg DeclinationGLON E deg Galactic longitudeGLAT E deg Galactic latitudeConf_95_SemiMajor E deg Long radius of error ellipse at 95% confidence levelConf_95_SemiMinor E deg Short radius of error ellipse at 95% confidence levelConf_95_PosAng E deg Position angle of the 95% long axis from celestial north,
positive toward increasing RA (eastward)Signif_Avg E · · · Source significance in σ units (derived from TS)Pivot_Energy E GeV Energy at which error on differential flux is minimalFlux_Density E cm−2 GeV−1 s−1 Differential flux at Pivot_EnergyUnc_Flux_Density E cm−2 GeV−1 s−1 1σ error on differential flux at Pivot_EnergySpectral_Index E · · · Best fit photon number power-law indexUnc_Spectral_Index E · · · 1σ error on Spectral_IndexFlux E cm−2 s−1 Integral photon flux from 10 to 500 GeVUnc_Flux E cm−2 s−1 1σ error on integral photon flux from 10 to 500 GeVEnergy_Flux E erg cm−2 s−1 Energy flux from 10 to 500 GeV obtained by spectral fittingUnc_Energy_Flux E erg cm−2 s−1 1σ error on energy flux from 10 to 500 GeVFlux10_30 GeV E cm−2 s−1 Integral flux from 10 to 30 GeVUnc_Flux10_30 GeV 2E cm−2 s−1 1σ errors on integral flux from 10 to 30 GeVa
Sqrt_TS10_30 GeV E · · · Square root of the Test Statistic between 10 and 30 GeVFlux30_100 GeV E cm−2 s−1 Integral flux from 30 to 100 GeVUnc_Flux30_100 GeV 2E cm−2 s−1 1σ errors on integral flux from 30 to 100 GeVa
Sqrt_TS30_100 GeV E · · · Square root of the Test Statistic between 10 and 30 GeVFlux100_500 GeV E cm−2 s−1 Integral flux from 100 to 500 GeVUnc_Flux100_500 GeV 2E cm−2 s−1 1σ errors on integral flux from 100 to 500 GeVa
Sqrt_TS100_500 GeV E · · · Square root of the Test Statistic between 100 and 500 GeVVariability_BayesBlocks I · · · Number of Bayesian Blocksb found (1 for non-variable)Extended_Source_Name 18A · · · Cross-reference to the Extended Sources extension for extended sources, if anyASSOC_GAM 18A · · · Name of corresponding source in gamma-ray catalog, if anyTEVCAT_FLAG 2A · · · P if positional association with non-extended source in TeVCat
· · · E if associated with an extended source in TeVCat, N if no TeV association· · · C if the source survives the TeV candidate selection criteria specified in Section 5.
ASSOC_TEV 21A · · · Name of TeV association, if anyCLASS1 4A · · · Class designation for most likely association; see Table 4CLASS2 4A · · · Class designation for alternate association, if anyASSOC1 26A · · · Name of identified or most likely associated sourceASSOC2 26A · · · Name of alternate association, if any
Notes.a Separate 1σ errors are computed from the likelihood profile toward lower and larger fluxes. The lower error is set equal to Null if the 1σ
interval contains 0.b The probability threshold for the Bayesian Blocks analysis is given by the VARPROBA keyword.
(Supplemental data for this table are available in the online journal.)
photometry analysis using 50 equal time bins spanning the 3 yrinterval. We did not do any background subtraction in eitheranalysis. Results of the Bayesian Block analysis are presentedin Section 4.2.
3.4. Associations
The 1FHL sources were associated with (known) sources atother wavelengths using similar procedures as for the 2FGLand 2LAC (Ackermann et al. 2011b) catalogs. As for thesecatalogs, we keep the distinction between an association and anidentification, the latter being more conservative. Promotingan association to an identification requires that correlatedvariability or source extension be found with observations atother wavelengths.
The associations were derived with two different procedures:the Bayesian and the likelihood-ratio association methods (de
Ruiter et al. 1977; Sutherland & Saunders 1992). The Bayesianmethod and its implementation for associating LAT sourceswith potential counterparts at other wavelengths is described inan appendix of the 1FGL paper (Abdo et al. 2010e), and somerefinements are reported in the 2FGL paper. The likelihood-ratiomethod and its implementation are described in the 2LAC paper.In the application of these two methods, potential counterpartswere retained as associations if they were found to have aposteriori probabilities of at least 80%.
For the Bayesian method, we used the 13th edition of theVeron catalog (Veron-Cetty & Veron 2010), version 20 ofBZCAT (Massaro et al. 2009), the 2010 December 5 versionof the VLBA Calibrator Source List,86 and version 3.400 of theTeVCat catalog. We also added new counterpart catalogs: theAustralia Telescope 20-GHz Survey (AT20G) (Murphy et al.
86 http://astrogeo.org/vcs/
9
The Astrophysical Journal Supplement Series, 209:34 (34pp), 2013 December Ackermann et al.
2010; Massardi et al. 2011) and the Planck Early ReleaseCompact Source Catalog (Planck Collaboration et al. 2011).
For the likelihood-ratio method, the catalogs of potentialcounterparts were the NRAO VLA Sky Survey (Condon et al.1998), the second version of the wide-field radio imaging surveyof the southern sky (Mauch et al. 2003), the PMN-CA catalogof southern radio sources (Wright et al. 1996), and the ROSATall-sky survey bright source catalog (Voges et al. 1999). Notethat these catalogs contain mostly extragalactic sources and sothe likelihood-ratio method was not very efficient in associating1FHL sources with Galactic sources.
In addition, we also evaluated correspondences with the2FGL and 1FGL catalogs of LAT sources, and gave themhigher priorities with respect to the other (non-Fermi) catalogs.Therefore, whenever possible, we associated the 1FHL sourcesto previously cataloged LAT sources, and for these cases wealso adopted the source associations given in the previouslypublished Fermi catalogs.
The sources that could be associated with known or previouslyreported sources (including unassociated 2FGL and 1FGLobjects) total 484, of which 451 could be associated with 2FGLsources, and 11 with 1FGL sources that are not in the 2FGLcatalog. We note that the number of 1FHL sources associatedby the Bayesian method is 484, while the number that wereassociated using the likelihood-ratio method is 441 (all ofwhich were also associated with the Bayesian method). Thisdifference in performance is attributable to the likelihood-ratiomethod being used only to find associations with extragalacticsources, while the Bayesian method is more general and usedspecific catalogs of Galactic sources. Three 1FHL sourceseach have associations with two distinct sources with posteriorprobabilities greater than 80%: 1FHL J0217.4+0836 (associatedwith a BL Lac object and an FSRQ), 1FHL J0323.5−0107(associated with two distinct BL Lac objects), and 1FHLJ0442.9−0017 (associated with a FSRQ and a BL Lac object).We also note that the 1FHL catalog contains 52 (=514 − 451 −11) sources that could not be associated to objects reported inprevious LAT catalogs (with 11 months and 2 yr of accumulateddata for 1FGL and 2FGL respectively). We describe these inSection 4.
4. THE 1FHL CATALOG
This section describes the contents of the 1FHL catalog andreports the basic properties of the 1FHL sources. The collectiveproperties of the sources that do not have counterparts in the2FGL catalog, the sources that are associated with AGNs, andthe pulsars emitting above 10 GeV are also discussed.
4.1. Description of the 1FHL Catalog
Table 2 describes the full contents of the 1FHL catalogdata product, which is available in FITS format from theFSSC. Table 3 presents the catalog itself. Column namesare identical (when the meaning is the same) or similar to2FGL columns (Nolan et al. 2012). The main exception isthe Variability_BayesBlocks entry which is computed from theBayesian Blocks analysis (Section 3.3). The γ -ray associationcolumn lists the corresponding source, if any, in the 2FGL,1FGL, 3EG, or EGR (Casandjian & Grenier 2008) catalogs.Of the 46 high-confidence sources in the Lamb & Macomb(1997) GEV catalog of EGRET sources detected above 1 GeV,35 have associations with 1FHL sources. For the 1FHL catalogthe source designations are 1FHL JHHMM.m±DDMM, where
FHL stands for Fermi High-energy (source) LAT, where highenergy means above 10 GeV.
The designators for the source associations and identificationsare listed in Table 4 along with the source counts. Because ofthe limited capability for variability and morphological studies(due to the low photon counts above 10 GeV), for 1FHLsources with counterparts in the 2FGL catalog we adopted thesame associations and identifications as for 2FGL. Similarlywe also used the designator “spp” to denote the class of thesix sources that have positional associations with supernovaremnants (SNRs) of angular diameters >20′ and/or pulsarwind nebulae (PWNe). Owing to the increased chance ofcoincidental associations with the SNRs and the ambiguity ofSNR versus PWN associations for some of the sources, thepotential associations are reported separately, in Table 5. Onlytwo new class designators were included in the 1FHL catalog.For 20 pulsars, pulsed emission was detectable above 10 GeV(see Section 4.5), and we use “HPSR” as the class designator.Also, we use the designator “SFR,” for star-forming region, andapply it to the Cygnus Cocoon (1FHL J2028.6+4110e).
A remarkable characteristic of this catalog is that the blazarsand blazar candidates87 amount to ∼75% of the entire catalog(∼86% of the associated sources), indicating that this sourceclass largely dominates the highest-energy LAT sky. It is worthmentioning that the four 1FHL sources associated with radiogalaxies have also shown characteristics that are typical forblazars, either in radio morphology (prominent flat-spectrumcore with one-sided jet), in optical spectrum, or in γ -rayvariability (sporadic short-term flux variability with timescalesof �1 day). This is the case for PKS 0625−35 (e.g., seeWills et al. 2004), M 87 (e.g., see Abramowski et al. 2012),NGC 1275 (e.g., see Kataoka et al. 2010; Aleksic et al. 2012a),and IC 310 (e.g., see Kadler et al. 2012; Shaw et al. 2013;The MAGIC Collaboration et al. 2013). The fifth radio galaxy,Cen A, is exceptional because of its proximity and also apresence of γ -ray emitting giant lobes clearly resolved with theLAT (Abdo et al. 2010d). Blazar-like properties of the activenucleus in the source, which has been also detected in the VHEband (Aharonian et al. 2009), are subject to ongoing debate.The only non-AGN extragalactic source is the nearby LargeMagellanic Cloud (LMC) galaxy, which, given its proximity,has an extension of 2◦.
The second largest source class is pulsars, with 5.2% of thecatalog total. SNRs and PWNe together are only 4.5% of thecatalog.
We note that, of the 65 1FHL sources that could not be asso-ciated with sources of known natures, five are associated withextended (Galactic) unidentified H.E.S.S. sources, 26 are asso-ciated with unidentified 2FGL sources (including 1 associatedwith one of the five previously mentioned Galactic H.E.S.S.unidentified sources), 5 are associated with unidentified 1FGLsources, and 2 are associated with unidentified sources from the3EG catalog. The remaining 28 sources could not be associ-ated with any γ -ray source reported previously. We note thatthe fraction of unassociated 1FHL sources is only ∼13% (65out of 514), while that of the unassociated 2FGL sources was∼31% (575 out of 1873). The smaller fraction of unassociated1FHL sources might be related to the lower source density andgood source localization, which facilitates the association of thesources, as well as the brightness of the 1FHL sources at lower
87 The fraction of non-beamed AGNs is expected to be only a few percent, andso most of the AGNs of unknown type are expected to be blazars of eitherFSRQ or BL Lac type.
10
Th
eA
strophysical
Journ
alSu
pplemen
tSeries,209:34
(34pp),2013D
ecember
Ackerm
ann
etal.
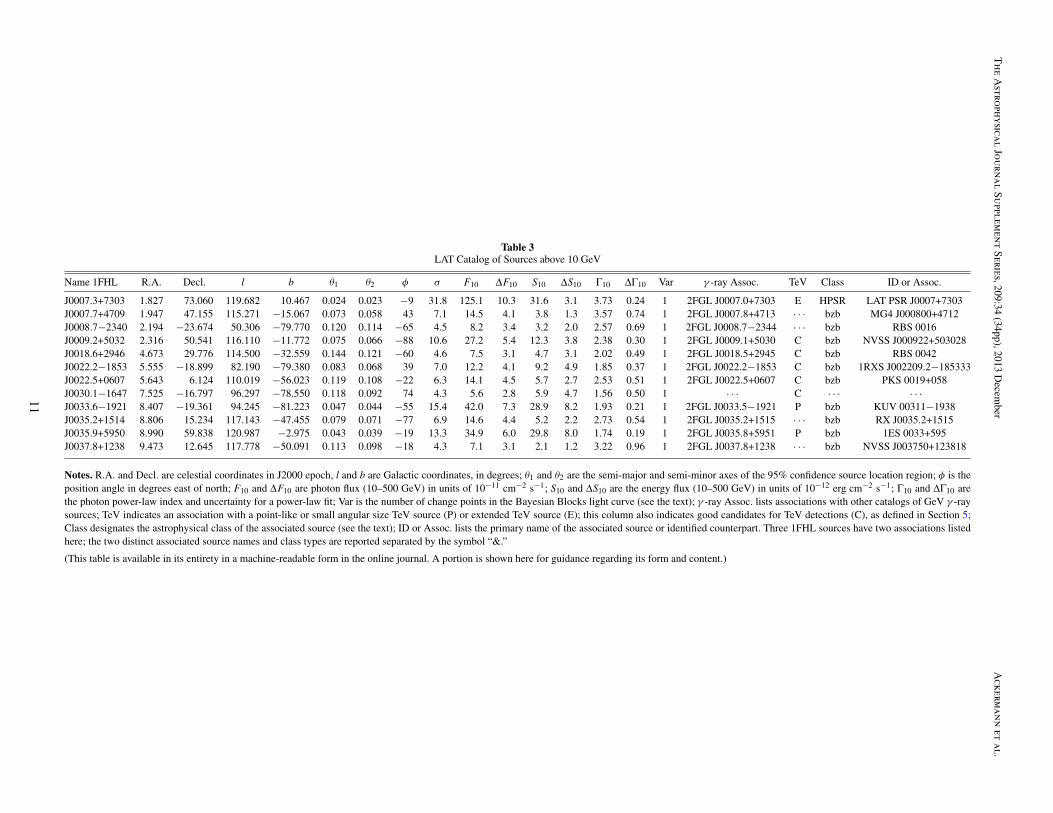
Table 3LAT Catalog of Sources above 10 GeV
Name 1FHL R.A. Decl. l b θ1 θ2 φ σ F10 ΔF10 S10 ΔS10 Γ10 ΔΓ10 Var γ -ray Assoc. TeV Class ID or Assoc.
J0007.3+7303 1.827 73.060 119.682 10.467 0.024 0.023 −9 31.8 125.1 10.3 31.6 3.1 3.73 0.24 1 2FGL J0007.0+7303 E HPSR LAT PSR J0007+7303J0007.7+4709 1.947 47.155 115.271 −15.067 0.073 0.058 43 7.1 14.5 4.1 3.8 1.3 3.57 0.74 1 2FGL J0007.8+4713 · · · bzb MG4 J000800+4712J0008.7−2340 2.194 −23.674 50.306 −79.770 0.120 0.114 −65 4.5 8.2 3.4 3.2 2.0 2.57 0.69 1 2FGL J0008.7−2344 · · · bzb RBS 0016J0009.2+5032 2.316 50.541 116.110 −11.772 0.075 0.066 −88 10.6 27.2 5.4 12.3 3.8 2.38 0.30 1 2FGL J0009.1+5030 C bzb NVSS J000922+503028J0018.6+2946 4.673 29.776 114.500 −32.559 0.144 0.121 −60 4.6 7.5 3.1 4.7 3.1 2.02 0.49 1 2FGL J0018.5+2945 C bzb RBS 0042J0022.2−1853 5.555 −18.899 82.190 −79.380 0.083 0.068 39 7.0 12.2 4.1 9.2 4.9 1.85 0.37 1 2FGL J0022.2−1853 C bzb 1RXS J002209.2−185333J0022.5+0607 5.643 6.124 110.019 −56.023 0.119 0.108 −22 6.3 14.1 4.5 5.7 2.7 2.53 0.51 1 2FGL J0022.5+0607 C bzb PKS 0019+058J0030.1−1647 7.525 −16.797 96.297 −78.550 0.118 0.092 74 4.3 5.6 2.8 5.9 4.7 1.56 0.50 1 · · · C · · · · · ·J0033.6−1921 8.407 −19.361 94.245 −81.223 0.047 0.044 −55 15.4 42.0 7.3 28.9 8.2 1.93 0.21 1 2FGL J0033.5−1921 P bzb KUV 00311−1938J0035.2+1514 8.806 15.234 117.143 −47.455 0.079 0.071 −77 6.9 14.6 4.4 5.2 2.2 2.73 0.54 1 2FGL J0035.2+1515 · · · bzb RX J0035.2+1515J0035.9+5950 8.990 59.838 120.987 −2.975 0.043 0.039 −19 13.3 34.9 6.0 29.8 8.0 1.74 0.19 1 2FGL J0035.8+5951 P bzb 1ES 0033+595J0037.8+1238 9.473 12.645 117.778 −50.091 0.113 0.098 −18 4.3 7.1 3.1 2.1 1.2 3.22 0.96 1 2FGL J0037.8+1238 · · · bzb NVSS J003750+123818
Notes. R.A. and Decl. are celestial coordinates in J2000 epoch, l and b are Galactic coordinates, in degrees; θ1 and θ2 are the semi-major and semi-minor axes of the 95% confidence source location region; φ is theposition angle in degrees east of north; F10 and ΔF10 are photon flux (10–500 GeV) in units of 10−11 cm−2 s−1; S10 and ΔS10 are the energy flux (10–500 GeV) in units of 10−12 erg cm−2 s−1; Γ10 and ΔΓ10 arethe photon power-law index and uncertainty for a power-law fit; Var is the number of change points in the Bayesian Blocks light curve (see the text); γ -ray Assoc. lists associations with other catalogs of GeV γ -raysources; TeV indicates an association with a point-like or small angular size TeV source (P) or extended TeV source (E); this column also indicates good candidates for TeV detections (C), as defined in Section 5;Class designates the astrophysical class of the associated source (see the text); ID or Assoc. lists the primary name of the associated source or identified counterpart. Three 1FHL sources have two associations listedhere; the two distinct associated source names and class types are reported separated by the symbol “&.”
(This table is available in its entirety in a machine-readable form in the online journal. A portion is shown here for guidance regarding its form and content.)
11

The Astrophysical Journal Supplement Series, 209:34 (34pp), 2013 December Ackermann et al.
Table 4LAT 1FHL Sources by Class
Class Description Identified Associated Total Fraction ofDesignator Number Designator Number Number Full Catalog (%)
Blazar of the BL Lac type BZB 7 bzb 252 259 50.4Blazar of the FSRQ type BZQ 13 bzqa 58 71 13.8Active galaxy of uncertain type AGU 1 agu 57 58 11.3Pulsar, identified by pulsations above 10 GeV HPSR 20 · · · · · · 20 3.9Pulsar, identified by pulsations in LAT (excluding HPSR) PSR 6 · · · · · · 6 1.2Pulsar, no pulsations seen in LAT yet · · · · · · psr 1 1 0.2Supernova remnant SNR 6 snr 5 11 2.1Pulsar wind nebula PWN 3 pwn 3 6 1.2Unclear whether SNR or PWN · · · · · · spp 6 6 1.2Radio galaxy RDG 1 rdg 4 5 1.0High-mass binary HMB 3 hmb 0 3 0.6Normal galaxy GAL 1 gal 0 1 0.2Star forming region SFR 1 sfr 0 1 0.2LBV star LVB 0 lvb 1 1 0.2Unassociated source · · · · · · · · · 65 65 12.6
Notes. For the three 1FHL sources with two associations (see Section 3.4 and Table 3), we consider only the first associated source (which isthe one with the highest probability of association).a 1FHL J1312.8+4827, classified here as bzq, may in fact be a narrow-line Seyfert 1 galaxy (Sokolovksy et al. 2013).
Table 5Potential Associations for Sources Near SNRs
1FHL Name 2FGL Name SNR Name PWN Name TeV Name Common Name
J1111.5−6038 J1112.1−6040 G291.0−00.1 G291.0−0.1 · · · · · ·J1552.6−5610 J1552.8−5609 G326.3−01.8 · · · · · · Kes 25J1640.5−4634 J1640.5−4633 G338.3−00.0 G338.3−0.0 HESS J1640−465 · · ·J1717.9−3725 J1718.1−3725 G350.1−00.3 · · · · · · · · ·J1745.6−2900 J1745.6−2858 G000.0+00.0 G359.98−0.05 · · · Sgr A EastJ1834.6−0703 J1834.7−0705c G024.7+00.6 · · · · · · · · ·
Angular separation (sigma)0 0.5 1 1.5 2 2.5 3 3.5 4
Nu
mb
er o
f so
urc
es
0
10
20
30
40
50
60
70
Figure 7. Distribution of the angular separation between the 1FHL sources andthe objects with which they are associated. Only point sources were includedin this distribution. The angular separation is normalized with the quantityr95/
√−2 ln 0.05, where r95 is the location uncertainty at the 95% confidencelevel. The blue curve is the expected distribution of real associations. See textfor details.
(A color version of this figure is available in the online journal.)
frequencies (particularly optical and X-ray) in comparison tothat of the 2FGL sources.
Figure 7 shows the distribution of angular separations be-tween the associated 1FHL sources and their counterparts. Thetotal number of sources shown in this distribution is 416. Of
the 449 1FHL sources with associations, we removed the 161FHL extended sources (see Table 1),88 the 6 sources classifiedas “spp” (see Table 5), and 11 1FHL sources that are position-ally coincident with extended TeV sources (all of which areγ -ray pulsars: 5 PSR and 6 HPSR). These 33 sources were re-moved because the emission centroid in one energy range doesnot necessarily coincide with the centroid (or location for pointsources) in the other energy range. The angular separation foreach source was normalized with the quantity r95/
√−2 ln 0.05,where r95 = √
θ1θ2 is the geometric mean of θ1 and θ2, thesemi-major and semi-minor radii of the location ellipse at 95%confidence level. The expected distribution of the angular dif-ference with respect to the real associations, when the distancesare normalized as described above, is described by a Rayleighfunction with σ = 1. This function is also depicted in Figure 7.The agreement between this model curve and the observed dis-tribution is quantified by a χ2/NDF = 27/19 (p-value = 0.10),implying a successful association of the 1FHL sources.
The locations on the sky of the sources in the above-mentioned classes are depicted in Figure 8. To a good ap-proximation, the Galactic sources are located essentially in theGalactic plane (apart from some pulsars), while the blazars aredistributed roughly uniformly outside the Galactic plane. Thesource statistics are relatively low, which precludes strong state-ments on the source distributions. However, when consideringthe blazars, which constitute the majority of 1FHL sources, an
88 Two of the 18 1FHL extended sources are unassociated, and so are notincluded in the initial sample of 449 sources.
12
The Astrophysical Journal Supplement Series, 209:34 (34pp), 2013 December Ackermann et al.
BL Lac FSRQ AGN of unknown type
PSR SNR PWN
Other Galactic object Other (non-beamed) Extragalactic object No association
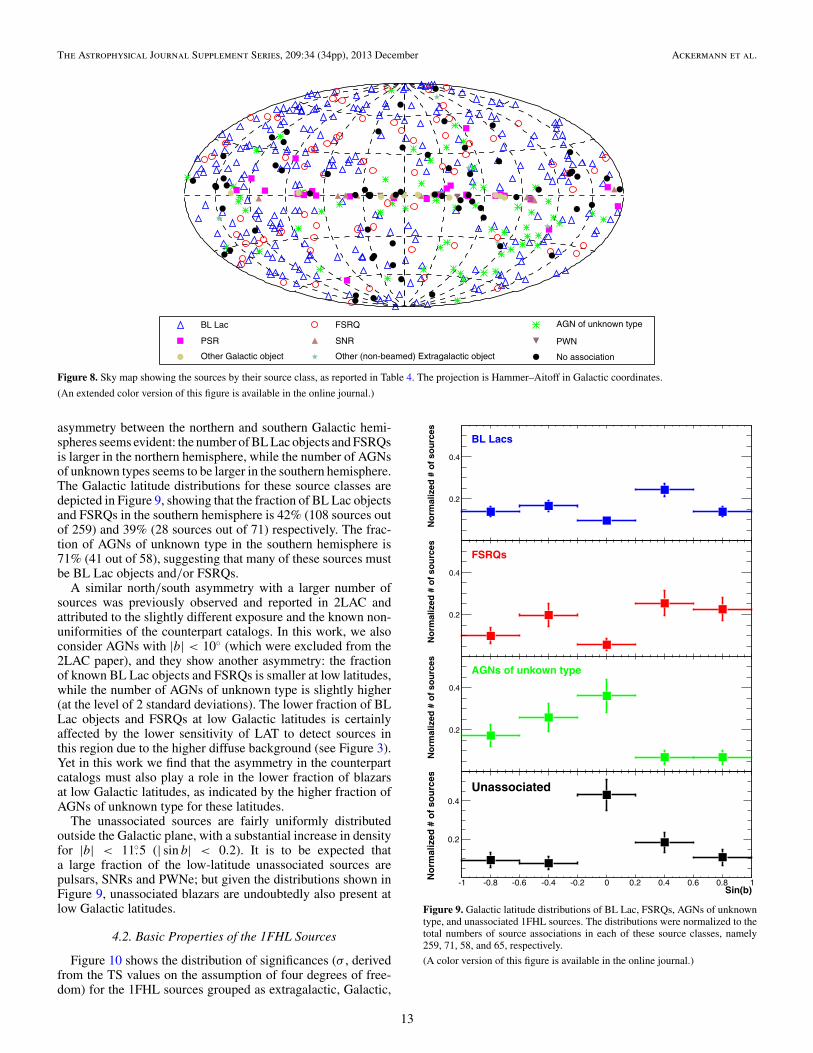
Figure 8. Sky map showing the sources by their source class, as reported in Table 4. The projection is Hammer–Aitoff in Galactic coordinates.
(An extended color version of this figure is available in the online journal.)
asymmetry between the northern and southern Galactic hemi-spheres seems evident: the number of BL Lac objects and FSRQsis larger in the northern hemisphere, while the number of AGNsof unknown types seems to be larger in the southern hemisphere.The Galactic latitude distributions for these source classes aredepicted in Figure 9, showing that the fraction of BL Lac objectsand FSRQs in the southern hemisphere is 42% (108 sources outof 259) and 39% (28 sources out of 71) respectively. The frac-tion of AGNs of unknown type in the southern hemisphere is71% (41 out of 58), suggesting that many of these sources mustbe BL Lac objects and/or FSRQs.
A similar north/south asymmetry with a larger number ofsources was previously observed and reported in 2LAC andattributed to the slightly different exposure and the known non-uniformities of the counterpart catalogs. In this work, we alsoconsider AGNs with |b| < 10◦ (which were excluded from the2LAC paper), and they show another asymmetry: the fractionof known BL Lac objects and FSRQs is smaller at low latitudes,while the number of AGNs of unknown type is slightly higher(at the level of 2 standard deviations). The lower fraction of BLLac objects and FSRQs at low Galactic latitudes is certainlyaffected by the lower sensitivity of LAT to detect sources inthis region due to the higher diffuse background (see Figure 3).Yet in this work we find that the asymmetry in the counterpartcatalogs must also play a role in the lower fraction of blazarsat low Galactic latitudes, as indicated by the higher fraction ofAGNs of unknown type for these latitudes.
The unassociated sources are fairly uniformly distributedoutside the Galactic plane, with a substantial increase in densityfor |b| < 11.◦5 (| sin b| < 0.2). It is to be expected thata large fraction of the low-latitude unassociated sources arepulsars, SNRs and PWNe; but given the distributions shown inFigure 9, unassociated blazars are undoubtedly also present atlow Galactic latitudes.
4.2. Basic Properties of the 1FHL Sources
Figure 10 shows the distribution of significances (σ , derivedfrom the TS values on the assumption of four degrees of free-dom) for the 1FHL sources grouped as extragalactic, Galactic,
No
rmal
ized
# o
f so
urc
e s
0.2
0.4
BL LacsN
orm
aliz
ed #
of
sou
rces
0.2
0.4
FSRQs
No
rmal
ized
# o
f so
urc
es
0.2
0.4
AGNs of unkown type
Sin(b)-1 -0.8 -0.6 -0.4 -0.2 0 0.2 0.4 0.6 0.8 1
No
rmal
ized
# o
f so
urc
es
0.2
0.4
Unassociated
Figure 9. Galactic latitude distributions of BL Lac, FSRQs, AGNs of unknowntype, and unassociated 1FHL sources. The distributions were normalized to thetotal numbers of source associations in each of these source classes, namely259, 71, 58, and 65, respectively.
(A color version of this figure is available in the online journal.)
13
The Astrophysical Journal Supplement Series, 209:34 (34pp), 2013 December Ackermann et al.
Figure 10. Distribution of the significances of the 1FHL sources. The threehistograms report the significances for three groups of sources: extragalactic,Galactic, and unassociated sources.
(A color version of this figure is available in the online journal.)
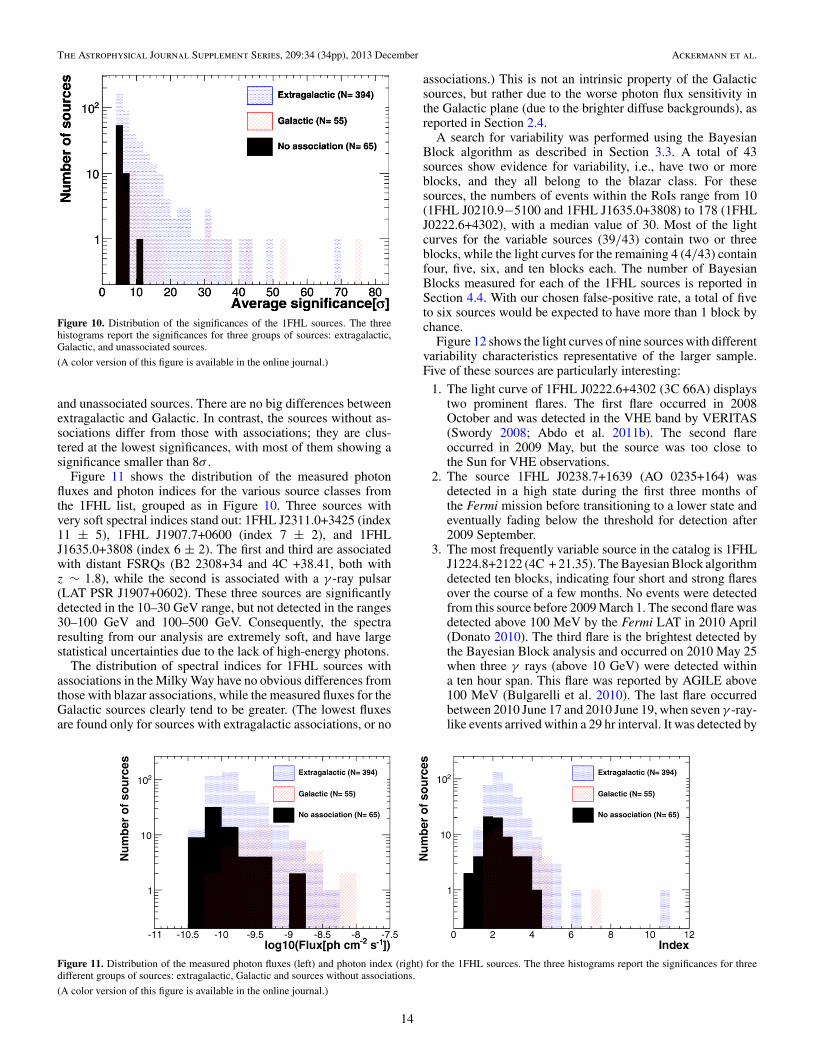
and unassociated sources. There are no big differences betweenextragalactic and Galactic. In contrast, the sources without as-sociations differ from those with associations; they are clus-tered at the lowest significances, with most of them showing asignificance smaller than 8σ .
Figure 11 shows the distribution of the measured photonfluxes and photon indices for the various source classes fromthe 1FHL list, grouped as in Figure 10. Three sources withvery soft spectral indices stand out: 1FHL J2311.0+3425 (index11 ± 5), 1FHL J1907.7+0600 (index 7 ± 2), and 1FHLJ1635.0+3808 (index 6 ± 2). The first and third are associatedwith distant FSRQs (B2 2308+34 and 4C +38.41, both withz ∼ 1.8), while the second is associated with a γ -ray pulsar(LAT PSR J1907+0602). These three sources are significantlydetected in the 10–30 GeV range, but not detected in the ranges30–100 GeV and 100–500 GeV. Consequently, the spectraresulting from our analysis are extremely soft, and have largestatistical uncertainties due to the lack of high-energy photons.
The distribution of spectral indices for 1FHL sources withassociations in the Milky Way have no obvious differences fromthose with blazar associations, while the measured fluxes for theGalactic sources clearly tend to be greater. (The lowest fluxesare found only for sources with extragalactic associations, or no
associations.) This is not an intrinsic property of the Galacticsources, but rather due to the worse photon flux sensitivity inthe Galactic plane (due to the brighter diffuse backgrounds), asreported in Section 2.4.
A search for variability was performed using the BayesianBlock algorithm as described in Section 3.3. A total of 43sources show evidence for variability, i.e., have two or moreblocks, and they all belong to the blazar class. For thesesources, the numbers of events within the RoIs range from 10(1FHL J0210.9−5100 and 1FHL J1635.0+3808) to 178 (1FHLJ0222.6+4302), with a median value of 30. Most of the lightcurves for the variable sources (39/43) contain two or threeblocks, while the light curves for the remaining 4 (4/43) containfour, five, six, and ten blocks each. The number of BayesianBlocks measured for each of the 1FHL sources is reported inSection 4.4. With our chosen false-positive rate, a total of fiveto six sources would be expected to have more than 1 block bychance.
Figure 12 shows the light curves of nine sources with differentvariability characteristics representative of the larger sample.Five of these sources are particularly interesting:
1. The light curve of 1FHL J0222.6+4302 (3C 66A) displaystwo prominent flares. The first flare occurred in 2008October and was detected in the VHE band by VERITAS(Swordy 2008; Abdo et al. 2011b). The second flareoccurred in 2009 May, but the source was too close tothe Sun for VHE observations.
2. The source 1FHL J0238.7+1639 (AO 0235+164) wasdetected in a high state during the first three months ofthe Fermi mission before transitioning to a lower state andeventually fading below the threshold for detection after2009 September.
3. The most frequently variable source in the catalog is 1FHLJ1224.8+2122 (4C + 21.35). The Bayesian Block algorithmdetected ten blocks, indicating four short and strong flaresover the course of a few months. No events were detectedfrom this source before 2009 March 1. The second flare wasdetected above 100 MeV by the Fermi LAT in 2010 April(Donato 2010). The third flare is the brightest detected bythe Bayesian Block analysis and occurred on 2010 May 25when three γ rays (above 10 GeV) were detected withina ten hour span. This flare was reported by AGILE above100 MeV (Bulgarelli et al. 2010). The last flare occurredbetween 2010 June 17 and 2010 June 19, when seven γ -ray-like events arrived within a 29 hr interval. It was detected by
Figure 11. Distribution of the measured photon fluxes (left) and photon index (right) for the 1FHL sources. The three histograms report the significances for threedifferent groups of sources: extragalactic, Galactic and sources without associations.
(A color version of this figure is available in the online journal.)
14

The Astrophysical Journal Supplement Series, 209:34 (34pp), 2013 December Ackermann et al.
0
4
8
12
16F
lux
[10−
9 ph
cm−
2 s−1 ]
1FHL J0222.6+4302(3C 66A)
0
2
4
1FHL J0238.7+1639(AO 0235+164)
0
0.5
1
1.5
1FHL J0316.1+0904(GB6 J0316+0904)
0
2
4
6
8
Flu
x [1
0−9 p
h cm
−2 s−
1 ]
1FHL J0538.8−4405(PKS 0537−441)
0
1
2
3
4
1FHL J0721.8+7120(S5 0716+71)
0
20
40
60
80
100
1201FHL J1224.8+2122(4C +21.35)
54700 55000 55300 556000
2
4
6
Flu
x [1
0−9 p
h cm
−2 s−
1 ]
MJD
1FHL J1555.7+1111(PG 1553+113)
54700 55000 55300 556000
20
40
60
80
MJD
1FHL J2253.9+1608(3C 454.3)
54700 55000 55300 556000
2
4
6
8
10
MJD
1FHL J1104.4+3812(Mrk 421)
Figure 12. Light curves for a subset of the variable sources. The histograms correspond to the aperture photometry analysis, and the solid lines correspond to theBayesian Block analysis using a 1% false positive threshold. The panels are labeled with the 1FHL names and the names of the corresponding associated sources (inparentheses). The dashed line in the panel for Mrk 421 corresponds to a 5% false positive threshold (see text for details).
(A color version of this figure is available in the online journal.)
AGILE (Striani et al. 2010b) and Fermi LAT (Iafrate et al.2010) above 100 MeV. The high activity from this flare wasalso observed at VHE on 2010 June 17 by MAGIC (Mariotti2010; Aleksic et al. 2011). MAGIC detected significantvariability with a flux-doubling time of only 10 minutes.
4. The source 1FHL J2253.9+1608 (3C 454.3) is among thebrightest detected above 10 GeV. A higher-flux state startingin 2010 November and lasting 3 months was detected inboth the Bayesian Block and aperture photometry analyses.A short and bright flare occurred during this period startingon 2010 November 19 and lasting only two days. Thisshort/bright flare above 10 GeV is very similar to thoseobserved from 4C + 21.35, indicating that the FSRQ3C 454.3 might also have been detected at VHE had itbeen observed during this period. However, detection of3C 454.3 would have been more difficult due to its strongspectral break at GeV energies, even during large flares (see
Ackermann et al. 2010; Abdo et al. 2011a) and the greaterredshift (z = 0.859) of this source. The flare above 10 GeVwas also detected above 100 MeV by Fermi LAT (Sanchez& Escande 2010) and AGILE (Striani et al. 2010a).
5. One of the brightest sources in the 1FHL catalog is the high-frequency-peaked blazar 1FHL J1104.4+3812 (Mrk 421).Despite having 383 events within the RoI, the source isnot detected as variable by the Bayesian Block analysisabove 10 GeV (see Figure 12). The aperture photometryindicates a period of higher activity centered around late2009 to early 2010. A dedicated analysis with a falsepositive threshold of 5% confirms this higher flux state,which matches well the period of enhanced VHE activityobserved by MAGIC and VERITAS in 2009 November,and 2010 January, February and March (Galante 2011; Sunet al. 2012). However, our variability analysis above 10 GeVfails to detect the extremely bright, day-long VHE flare
15

The Astrophysical Journal Supplement Series, 209:34 (34pp), 2013 December Ackermann et al.
Table 61FHL Extended Sources Without 2FGL Counterparts
1FHL Name R.A. Decl. σ Extended Source ASSOC_TEV CLASS1 2FGL Name R.A. (2FGL) Decl. (2FGL) σ Ang. Sep.(deg) (deg) (deg) (deg) (2FGL) (deg)
J2021.0+4031e 305.270 40.520 15.7 gamma Cygni VER J2019+407 snr J2021.5+4026 305.392 40.441 129.7 0.12J0852.7−4631e 133.200 −46.520 11.1 Vela Junior RX J0852.0−4622 snr J0851.7−4635 132.941 −46.592 5.5 0.19J1633.0−4746e 248.250 −47.770 10.9 HESS J1632−478 HESS J1632−478 pwn J1632.4−4753c 248.114 −47.891 8.8 0.15J1615.3−5146e 243.830 −51.780 10.8 HESS J1614−518 HESS J1614−518 J1615.2−5138 243.801 −51.635 14.7 0.15J1713.5−3951e 258.390 −39.850 8.3 RX J1713.7−3946 RX J1713.7−3946 SNR J1712.4−3941 258.111 −39.687 5.1 0.27J1616.2−5054e 244.060 −50.910 7.8 HESS J1616−508 HESS J1616−508 pwn J1615.0−5051 243.758 −50.852 15.2 0.20J1836.5−0655e 279.140 −6.920 7.6 HESS J1837−069 HESS J1837−069 J1837.3−0700c 279.347 −7.011 8.2 0.22J0822.6−4250e 125.660 −42.840 6.9 Puppis A snr J0823.0−4246 125.766 −42.770 10.2 0.10J1634.7−4705 248.690 −47.089 4.2 HESS J1634−472 J1635.4−4717c 248.850 −47.297 7.7 0.24
Notes. The entries are sorted in reverse order of detection significance reported in the main 1FHL catalog Table 3. Each of the sources is associated with an extended (Galactic)VHE source. All were classified as point sources in the 2FGL catalog, while 8 (out of 9) were recently found to have a significance extension at MeV/GeV energies, as we notedin Table 1. For these 8 sources, the table reports the Extended_Source_Name used in Table 1.
detected by VERITAS on 2010 February 17, when Mrk 421increased its flux by about a factor of 20 with respect to itstypical value (Ong 2010).
The results from the Bayesian Block analysis cannot be di-rectly compared with the likelihood analysis performed to derivemonthly light curves for the 2FGL catalog. Despite the differ-ences in the methods and the time intervals (2 yr versus 3 yr),we highlight some comparisons. Of the 43 variable sources de-tected above 10 GeV, only 2 sources do not have counterparts in2FGL (1FHL J0318.8+2134 and 1FHL J1532.6−1317). Bothsources show higher fluxes in the third year, i.e., after the timeinterval of the 2FGL analysis. Of the remaining 41 sources,only 5 did not show evidence for variability in 2FGL (1FHLJ0203.6+3042, 1FHL J0316.1+0904, 1FHL J0809.8+5217,1FHL J1603.7−4903, and 1FHL J1748.5+7006). Therefore, itappears that the population of sources variable above 10 GeVis also variable in the 2FGL energy band (100 MeV–100 GeV).Although the most frequently variable source above 10 GeV(1FHL J1224.8+2122) has the second largest TSvar (13030) in2FGL, the number of Bayesian Blocks and TSvar are not stronglycorrelated. For example, several sources with two or three blockshave much larger TSvar values than sources with four, five, orsix blocks.
4.3. 1FHL Sources Not in the 2FGL Catalog
The 1FHL catalog Table 3 contains 63 sources not associatedwith 2FGL sources.89 Among these sources, spatial extensionat MeV/GeV/TeV energies has been recently reported for nine.For eight of these, extension had previously been resolved bythe LAT (see Table 1). The nine sources are listed in Table 6.In the 2FGL catalog, each of these sources is modeled as apoint source, and as a result our association pipeline failed tolink these 1FHL sources with the 2FGL counterparts despiteangular separations of less than 0.◦3 (typically less than 0.◦2).For this reason, we split the list of 63 non-2FGL sources intotwo groups: non-2FGL_a, the 9 sources reported in Table 6;and non-2FGL_b, the remaining 54 (point-like) sources without2FGL counterparts.
Figure 13 shows the distribution of the detection significancesfor all of the 1FHL sources, grouped in several classes: allsources, sources with 2FGL counterparts, and the two groupsof non-2FGL sources described in the text, non-2FGL_a andnon-2FGL_b. The distribution peaks at the threshold of ∼4σ
89 Out of the 63 sources, 11 are associated with 1FGL sources that did notreach a TS value of 25 in the 2FGL analysis, which used 2 yr of LAT data.
Figure 13. Distribution of the significances of the 1FHL sources. The fourhistograms report the significances for all 1FHL sources (All); 1FHL sourceswhose locations match 2FGL sources (2FGL); 1FHL extended sources thatdo not match 2FGL sources, but are less than 0.◦3 from 2FGL sources (non-2FGL_a); 1FHL point sources which do not match 2FGL sources (non-2FGL_b).
(A color version of this figure is available in the online journal.)
(TS = 25), and extends to about 40σ with three sources havingformal significances greater than 50σ . This plot shows that theγ -ray sources that were not reported in the 2FGL catalog clusterat the significance threshold.
Figure 14 reports the distributions of flux and index for the1FHL sources that are not in 2FGL, grouped as in Figure 13. Thegroup non-2FGL_b has the lowest fluxes and smallest indices.In particular, this group hosts the four sources with the smallestindices (�1): 1FHL J1314.9−4241 (associated with the blazarMS 13121−4221), 1FHL J1856.9+0252 (associated with thepresumed PWN HESS J1857+026), and 1FHL J2159.1−3344and 1FHL J0432.2+5555 (not associated with any knownsources). All these sources are very weak and have hard spectrain the >10 GeV energy range.
Figure 15 shows the distribution on the sky of the 63 1FHLsources without 2FGL counterparts. Apart from the 9 extendedsources from Table 6 (4 SNRs, 2 PWNe, and 3 sources withoutassociations), most sources are located outside the Galacticplane: 9 blazars, 8 blazar candidates, and a large fraction ofthe 36 unassociated sources.
We conclude that most of the new γ -ray sources reported inthe 1FHL catalog (not reported previously in the 2FGL catalog)
16

The Astrophysical Journal Supplement Series, 209:34 (34pp), 2013 December Ackermann et al.
Figure 14. Distribution of the measured photon fluxes (left) and photon index (right) for the 1FHL sources. The four histograms report the significances for all 1FHLsources (All); 1FHL sources whose locations match any in the 2FGL catalog (2FGL); 1FHL extended sources which do not match any in the 2FGL, but are less than0.◦3 from 2FGL sources (non-2FGL_a); 1FHL point sources that do not have corresponding 2FGL sources (non-2FGL_b).
(A color version of this figure is available in the online journal.)
SNR snr pwn SFR
bzb agu No associationFigure 15. Sky map showing the locations of the 1FHL sources that do not have counterparts in the 2FGL catalog (groups non-2FGL_a and non-2FGL_b). The sourcesare depicted with the source classes described in Table 4. The projection is Hammer–Aitoff in Galactic coordinates.
(A color version of this figure is available in the online journal.)
are likely to be blazars with weak, hard-spectrum emission thatmight have been more active in the third year. As reported inSection 3.3, only two non-2FGL sources (1FHL J0318.8+2134and 1FHL J1532.6−1317) have significantly greater averagefluxes in the third year of LAT observations than they did duringthe first 2 yr (the time interval for the 2FGL catalog). The limitedcounting statistics above 10 GeV, however, make variability hardto confirm.
4.4. The 1FHL AGNs
The 1FHL catalog is strongly dominated by AGNs, with 39390
sources associated with AGNs. Among them, blazar and blazarcandidates91 represent 86% of the sources that have associations.In this section we report on the overall γ -ray properties of theseAGNs.
90 The only non-AGN extragalactic source is the LMC.91 Most of the “agu” sources are expected to be blazars.
As for the 2FGL catalog, most of the extragalactic 1FHLsources are non-thermal-dominated or jet-dominated sources;that is, the broad-band emission is produced by high-energy par-ticles accelerated in the magnetized jet of material ejected fromthe central engine. Non-thermal AGNs are classified by the fre-quency of the peak of the synchrotron emission, which is relatedto the maximum energy of the accelerated electrons. Here weused the convention proposed by Abdo et al. (2010a) and clas-sify the AGNs as low-synchrotron-peaked (LSP), intermediate-synchrotron-peaked (ISP), and high-synchrotron-peaked (HSP)if the peak of the synchrotron emission νsynpeak is located be-low 1014 Hz, in the range 1014–1015 Hz, or above 1015 Hz,respectively. This is commonly designated as the spectral en-ergy distribution (SED) classification, and it is complemen-tary to the broadly used optical classification, which uses thepresence/absence of emission lines to classify sources as FSRQor BL Lac-type.
Table 7 reports the optical and SED classifications, as wellas the redshifts (if available) and the measured variability for
17

The Astrophysical Journal Supplement Series, 209:34 (34pp), 2013 December Ackermann et al.
Table 7Characteristics of the 1FHL Sources With AGN Associations
1FHL Name R.A. Decl. Assoc. Optical Class. SED Class. Redshift Variability_BayesBlocks
J0007.7+4709 1.947 47.155 MG4 J000800+4712 BL Lac LSP 0.28 & 2.1 1J0008.7−2340 2.194 −23.674 RBS 0016 BL Lac · · · 0.147 1J0009.2+5032 2.316 50.541 NVSS J000922+503028 BL Lac · · · · · · 1J0018.6+2946 4.673 29.776 RBS 0042 BL Lac HSP · · · 1J0022.2−1853 5.555 −18.899 1RXS J002209.2−185333 BL Lac HSP · · · 1J0022.5+0607 5.643 6.124 PKS 0019+058 BL Lac LSP · · · 1J0033.6−1921 8.407 −19.361 KUV 00311−1938 BL Lac HSP 0.610 1J0035.2+1514 8.806 15.234 RX J0035.2+1515 BL Lac HSP · · · 1J0035.9+5950 8.990 59.838 1ES 0033+595 BL Lac HSP · · · 1J0037.8+1238 9.473 12.645 NVSS J003750+123818 BL Lac HSP 0.089 1J0040.3+4049 10.096 40.827 1ES 0037+405 BL Lac HSP · · · 1J0043.7+3425 10.936 34.429 GB6 J0043+3426 FSRQ · · · 0.966 1
Notes. This table is also available as a FITS file from the FSSC. R.A. and Decl. are celestial coordinates in J2000 epoch, Assoc. is the name of the associated (or identified)source counterpart, Optical Class. is the optical classification of the AGN, SED class is the SED classification (whenever available), and Variability_BayesBlocksis the number of Bayesian Blocks (see Section 3.3). Four of the sources have two distinct redshifts reported in the literature and their redshifts are listed hereseparated by the symbol “&.” Three sources have redshifts in the literature that violate the spectroscopic lower limits reported in Shaw et al. (2013); these are listedas “z1 & LowLimit_z2.” Three 1FHL sources have double associations; the two distinct associated source names and characteristics are reported separated by thesymbol “&.”
(This table is available in its entirety in a machine-readable form in the online journal. A portion is shown here for guidance regarding its form and content.)
Table 8Summary of SED Classifications and Available Redshifts for 1FHL Sources With AGN Associations
SED Classification Number of Sources Number with Measured Redshift (fraction)
HSP 162 76 (47%)ISP 61 28 (46%)LSP 99 75 (76%)Not Classified 71 29 (41%)
Total 393 208 (53%)
all of the 1FHL AGN sources. The variability is quantifiedas described in Section 3.3, with the most variable sourceshaving the highest number of blocks, and the sources withno significant variability having only one block. The opticaland SED classifications, and redshifts, were obtained primarilyfrom the 2LAC paper (Ackermann et al. 2011b), with theinformation for the non-2FGL AGNs being obtained fromthe BZCAT (Massaro et al. 2009). Moreover, we also usedthe recent work by Shaw et al. (2013) to obtain the opticalclassification and redshift information for some sources. Wenoted that seven AGNs with 1FHL associations have redshiftsreported by Ackermann et al. (2011b) that are in conflictwith the information reported by Shaw et al. (2013). Forfour sources (1FHL J0007.7+4709, 1FHL J0508.1+6737, 1FHLJ1312.2−2158, and 1FHL J2116.2+3339) the newly reportedredshifts by Shaw et al. (2013) do not match those of Ackermannet al. (2011b). For three others (1FHL J0909.3+2312, 1FHLJ2016.3−0907, and 1FHL J2323.8+4210), the values given byAckermann et al. (2011b) violate lower limits reported by Shawet al. (2013). We report both values (or value and lower limit)in Table 7 as “z1 & z2” (“z1 & LowLimit_z2”), where the firstentry is retrieved from Ackermann et al. (2011b) and the secondone (value or lower limit) from Shaw et al. (2013).
Table 8 summarizes the number of 1FHL AGN sourcesbelonging to the various SED classifications with and withoutredshift determinations. Among all blazars, the dominant SEDclass is HSP, which makes up ∼41% of the 1FHL AGNs.This is not a surprising result because HSPs typically havea hard spectrum (power-law index �2) and hence they areexpected to be the AGN source class that emit the highest-energy
photons. Table 8 also shows that the 1FHL catalog has 208(∼53%) sources associated with AGNs of known redshifts,92
from which the fractions of sources with measured redshifts are47%, 46% and 41% for HSP, ISP, and sources without SEDclassification, respectively, and 76% for the LSP class. Thefraction of LSPs with available redshifts is larger because 58of the 99 LSPs are actually FSRQs which, by definition, havemeasured redshifts, while no ISP or HSP are FSRQs and theFSRQ optical classification overlaps exclusively with the LSPSED classification.
Figure 16 shows the distribution of the measured power-lawindices of the 1FHL blazars in the energy ranges 100 MeVto 100 GeV (extracted from the 2FGL catalog table) and10–500 GeV (from Table 3). The figure does not show the nine1FHL sources that are associated with the five radio galaxiesand the other four non-blazar AGNs. Note that the numberof entries in the distributions from the left panel is less thanthat in the distributions in the right panel. This is because the1FHL catalog contains 17 AGN associations (9 BL Lac objectsand 8 blazar candidates) that do not exist in the 2FGL catalog(Section 4.3). The figure shows a clear spectral softening foreach source class when the minimum energy is increased from100 MeV to 10 GeV. This is due both to intrinsic softening ofthe spectra of many sources93 and to γ -ray attenuation in the
92 This number does not include the seven sources with conflicting redshiftinformation reported above.93 The intrinsic softening can occur because of internal γ –γ absorption,which is energy dependent, or because of a steep decrease with energy of thenumber of high-energy particles (presumedly electrons/positrons) that areresponsible for the high-energy γ rays.
18
The Astrophysical Journal Supplement Series, 209:34 (34pp), 2013 December Ackermann et al.
Figure 16. Distribution of measured photon index for selected groups of 1FHL AGN sources above 100 MeV (left: extracted from the 2FGL catalog) and above10 GeV (right: extracted from Table 3). The three histograms show the distributions for three different groups of AGN associations: BL Lac objects, FSRQs, and AGUor blazar candidates. See text for further details.
(A color version of this figure is available in the online journal.)
Figure 17. Distribution of redshifts for selected groups of 1FHL AGN sources. The left panel shows the normalized redshift distributions for BL Lac objects (bluedotted-filled, 123 sources) and FSRQs (red horizontal-line-filled, 71 sources). The right panel shows the normalized distributions for BL Lac objects classified as HSP(blue dotted-filled, 73 sources), ISP (green vertical-line-filled, 27 sources), LSP (red horizontal-line-filled, 16 sources) and sources without SED classification (blackwavy-line-filled, 7 sources).
(A color version of this figure is available in the online journal.)
optical/UV EBL for distant (z > 0.5) sources. We also notethat in both panels the photon indices of the FSRQs cluster atthe largest index values, while BL Lac objects have the smallestindex values. So even when the spectra are characterized usingphotons above 10 GeV, we find that about 30% of the BL Lacobjects (77 out of 259) have indices harder than 2. The indexdistribution of the blazar candidates (“agu” sources) is similarto that of BL Lac objects, which suggests that a large fractionof these blazar candidates are actually BL Lac objects.
Figure 17 shows the redshift distribution for the BL Lacobjects and FSRQs from the 1FHL catalog. For simplicity, wedid not include in this plot the redshift distribution of the fiveradio galaxies, which cluster at low redshifts. Neither did weinclude the redshift distribution for the nine blazar candidates(“agu”), which span z = 0–1. We note that most of the BL Lacobjects have redshifts less than 0.5, while most of the FSRQshave redshifts greater than 0.5. The lack of BL Lac objectsat high redshift could be due to the different characteristicsof BL Lac objects relative to FSRQs, which are known tohave a stronger intrinsic γ -ray brightness (Abdo et al. 2010a).However, we also note that the observed redshift distributionof BL Lac objects has an important bias due to the difficultyof measuring their redshifts. About half the BL Lac objectsassociated with 1FHL sources do not have known redshifts,while all of the FSRQ associations have measured redshifts.
The right-hand panel in Figure 17 shows the redshift distribu-tion for BL Lac objects split into the various SED classifications,
namely HSP, ISP, and LSP. The figure also depicts the redshiftdistribution for the seven sources without SED classifications.The figure shows clearly that the distribution of HSPs (thosewith the highest synchrotron peak frequency) peaks at the low-est redshifts. We note that the above-mentioned trends, as wellas the overall shape of the redshift distributions for BL Lacobjects and FSRQs and for the different subclasses of BL Lacobjects, are very similar to those shown in Figure 12 of the2LAC paper (Ackermann et al. 2011b), hence indicating thatselecting sources emitting above 10 GeV does not introduceany bias/distortion in the redshift properties of the sample ofblazars detected by Fermi LAT.
Figure 18 shows a scatter plot of the photon index (E >100 MeV and E > 10 GeV) versus the redshift for the variousblazar subclasses: FSRQs, HSP-BL Lac objects, ISP-BL Lacobjects, LSP-BL Lac objects and BL Lac objects without SEDclassification. There is no redshift evolution in the spectral shapecharacterized with photon energies above 100 MeV, which is inagreement with the results reported in Figure 19 of the 2LACpaper.94 However, the photon index computed with energiesabove 10 GeV has a redshift dependence: sources get softerwith increasing redshift. This trend is not apparent in the BLLac sample, which clusters at relatively low redshifts (mostlybelow 0.5); but it is noticeable in the sample of FSRQs, which
94 The data used to produced the left panel from Figure 18 are the same asused in the 2LAC, differing only in the selection of the blazar sample: only 1941FHL blazars (FSRQs+BL Lac objects) are being used here.
19

The Astrophysical Journal Supplement Series, 209:34 (34pp), 2013 December Ackermann et al.
redshift0 0.5 1 1.5 2 2.5
Ph
oto
n In
dex
0.5
1
1.5
2
2.5
E > 100 MeV
redshift0 0.5 1 1.5 2 2.5
Ph
oto
n In
dex
0
1
2
3
4
5
6
7
8
9
E > 10 GeV
Figure 18. Power-law index from the observed source spectra vs. redshift for the 1FHL sources with available redshifts. The left panel shows the power-law indexdescribing the spectral shape above 100 MeV (extracted from the 2FGL catalog) and the right panel shows the power-law index describing the spectral shape above10 GeV (this work). In both panels, red indicates FSRQs (71 sources), dark-blue for HSP-BL Lac objects (73), light-blue for ISP-BL Lac objects (27), green forLSP-BL Lac objects (16), and black for BL Lac objects with unclassified SEDs (7).
extends up to redshift 2.5. A potential reason for this evolutionof the >10 GeV spectral shape (but not for the >100 MeVspectral shape) is the attenuation of the γ rays on optical/UVphotons of the EBL, which is energy dependent and affectsphotons only above a few tens of GeV. A cosmological evolutionof the FSRQ sample that introduces an intrinsic softening ofthe spectra may also play a role. However, for consistencywith the experimental observations reported in Figure 18, sucha cosmological evolution of FSRQs should affect only theemission above 10 GeV.
The last column of Table 7 quantifies the variability of the1FHL sources, determined as described in Section 3.3. Amongthe 43 1FHL AGN sources identified as variable we find 22LSPs (22% of the 99 1FHL LSP associations), 7 ISPs (13% ofthe 61 1FHL ISP associations), 6 HSPs (4% of the 162 1FHLHSP sources), and 8 sources with no SED classifications (11%of the 71 1FHL sources with unclassified SEDs). One of theoutstanding characteristics is that most of the 1FHL sourcesidentified as variable belong to the blazar subclass LSP, notto the subclass HSP, which is the dominant blazar subclass,and which has a larger number of high-energy photons. Westress that the three classic VHE blazars most variable abovea few hundred GeV, namely Mrk 421, Mrk 501 and PKS2155−304, are not found to be variable in the 1FHL catalog.This is surprising, given that these three also have the largestnumbers of detected photons above 10 GeV: 432, 247, and132, respectively (as evaluated from the likelihood analysis).Moreover, the fraction of 1FHL LSPs identified as variable(∼22%) is substantially higher than the fraction of 1FHL HSPsidentified as variable (∼4%). This trend was already observedin the 2FGL blazars at energies above 100 MeV, and reportedin the 2LAC paper (e.g., see Figures 26 and 27 of that work).Therefore, we can confirm that, across the entire energy rangeof the LAT, the LSPs are more variable than the HSPs. Theseexperimental observations show that the variability in the fallingsegment of the high-energy (inverse Compton) SED bump isgreater than that in the rising segment of the SED bump.
4.5. Pulsars above 10 GeV
Pulsars are the second-largest class of associated sources inthe 1FHL catalog. The detection with IACTs of pulsations from
the Crab, first at >25 GeV (Aliu et al. 2008), and more recently atVHE (VERITAS Collaboration et al. 2011; Aleksic et al. 2012b)makes the study of high-energy (>10 GeV) emission fromγ -ray pulsars with the LAT especially timely. A similar studyconducted on EGRET data above 10 GeV revealed 37 eventscoincident with five γ -ray pulsars (Thompson et al. 2005).
The second Fermi LAT catalog of γ -ray pulsars (Abdo et al.2013; hereafter referred to as 2PC), includes results for 117γ -ray pulsars detected in 3 yr of LAT data. In this section wefocus on pulsar emission above 10 GeV.
Pulsars are naturally associated with SNRs and PWNs, both ofwhich also can be bright VHE emitters. In addition to knowinghow many pulsars are associated with 1FHL sources, we wouldalso like to determine which of these pulsars can be identifiedwith the 1FHL sources, by showing pulsations above 10 GeV(HPSR).
The pulsation analysis described here relies on the 2PCpulsar timing models.95 In addition to studying 1FHL sourcesassociated with pulsars, the analysis was extended to include anumber of 2PC pulsars that are candidate HPSRs, despite havingno associated 1FHL source. Out of the 27 pulsars associated with1FHL sources (listed in Table 9), two (PSRs J1536−4948 andJ2339−0533) are not included in 2PC and are therefore left outof this analysis.
In order to test for high-energy pulsations we used a likelihoodratio test, comparing the distribution in pulsar phase of the high-energy events with the low-energy pulse profile. We consideredthe standard H-test (de Jager et al. 1989) but found it to beless sensitive. This is not too surprising, given that the H-testinvolves no assumptions about the pulse profile96 while thelikelihood ratio test benefits from the available information onthe low-energy pulse profile, even if this may not necessarilybe exactly the same as the high-energy profile. We used high-energy (>10 GeV) photons within an RoI of 0.◦6 radius forfront-converting (Front) events and 1.◦2 for back-converting(Back) events, roughly corresponding to the 95% containmentangles of the reconstructed incoming photon direction for
95 Available at http://fermi.gsfc.nasa.gov/ssc/data/access/lat/ephems/.96 Its usage is generally recommended in cases such as the standard LATsearches for γ -ray pulsars, for which there is no a priori knowledge about theshape of the γ -ray light curve.
20

The Astrophysical Journal Supplement Series, 209:34 (34pp), 2013 December Ackermann et al.
Table 91FHL Sources Associated with Fermi-LAT Pulsars
1FHL PSR P l b n10 P10 n25 P25 Ref.(ms) (deg) (deg)
J0007.3+7303 J0007+7303# 316 119.7 +10.5 179 <2 × 10⁻⁹ 20 1.7 × 10⁻³ (1, 2, 3)J0205.7+6448 J0205+6449 65.7 130.7 +3.1 38 >0.05 12 >0.05 (4)
J0534.5+2201 J0534+2200†# 33.6 184.6 −5.8 674 6.3 × 10⁻⁸ 191 2.4 × 10⁻² Crab (5, 6, 7)J0614.0–3325 J0614–3329 3.15 240.5 −21.8 26 <2 × 10⁻⁹ 3 2.0 × 10⁻² (8)J0633.9+1746 J0633+1746# 237 195.1 +4.3 260 <2 × 10⁻⁹ 11 1.4 × 10⁻⁵ Geminga (9)
J0835.3–4510 J0835–4510†# 89.4 263.6 −2.8 1005 <2 × 10⁻⁹ 56 <2 × 10⁻⁹ Vela (10, 11)J1022.6–5745 J1023–5746 112 284.2 −0.4 152 >0.05 46 >0.05 (12)J1028.4–5819 J1028–5819# 91.4 285.1 −0.5 164 <2 × 10⁻⁹ 41 4.0 × 10⁻² (13)J1048.4–5832 J1048–5832 124 287.4 +0.6 85 9.7 × 10⁻⁶ 22 2.1 × 10⁻² (14)J1112.5–6105 J1112–6103 65.0 291.2 −0.5 112 >0.05 28 >0.05J1231.2–1414 J1231–1411 3.68 295.5 +48.4 15 5.3 × 10⁻⁷ 4 >0.05 (8)J1413.4–6205 J1413–6205 110 312.4 −0.7 278 4.4 × 10⁻³ 64 1.5 × 10⁻² (12)J1418.6–6059 J1418–6058 111 313.3 +0.1 324 >0.05 72 >0.05 (2)J1420.1–6047 J1420–6048 68.2 313.5 +0.2 278 >0.05 65 >0.05 (15)J1514.3–4945 J1514–4946 3.58 325.2 +6.8 24 1.7 × 10⁻⁴ 3 >0.05 (16)J1536.4–4951 J1536–4948 3.08 328.2 +4.8 · · · · · · · · · · · · Not in 2PCJ1620.7–4928 J1620–4927 172 333.9 +0.4 297 9.4 × 10⁻³ 77 >0.05 (17)J1709.7–4429 J1709–4429# 103 343.1 −2.7 272 <2 × 10⁻⁹ 25 >0.05 (18)J1809.8–2329 J1809–2332 147 7.4 −2.0 119 <2 × 10⁻⁹ 18 4.3 × 10⁻² (2)J1836.4+5925 J1836+5925 173 88.9 +25.0 36 1.0 × 10⁻⁴ 2 1.0 × 10−2∗ (2, 19)J1907.7+0600 J1907+0602# 107 40.2 −0.9 158 2.3 × 10⁻⁴ 36 >0.05 (2, 20, 21)J1953.3+3251 J1952+3252 39.5 68.8 +2.8 48 1.2 × 10⁻⁵ 7 >0.05 (18)J1958.6+2845 J1958+2846 290 65.9 −0.4 64 1.0 × 10⁻² 11 >0.05 (2)J2021.0+3651 J2021+3651# 104 75.2 +0.1 107 <2 × 10⁻⁹ 20 7.6 × 10⁻³ (21, 22, 23)J2032.1+4125 J2032+4127# 143 80.2 +1.0 210 5.6 × 10⁻⁸ 54 >0.05 (2, 24)J2229.0+6114 J2229+6114# 51.6 106.7 +3.0 86 <2 × 10⁻⁹ 14 6.1 × 10⁻³ (14, 25)J2339.8–0530 J2339–0533 2.88 81.1 −62.4 · · · · · · · · · · · · Not in 2PC
Notes. 1FHL source; associated pulsar (in bold if seen at >25 GeV); a † (#) implies a LAT-detected (TeV-detected) PWN; P is the pulsar period,in milliseconds; Galactic longitude (l) and latitude (b) in degrees; n10 (n25) is the number of >10 (25) GeV photons (within a 95% containmentradius) and P10 (P25) the corresponding tail probability. We quote only p-values <0.05 and >2 × 10⁻⁹ (∼6σ ). (*) For PSR J1836+5925, thetwo >25 GeV events result in a p-value = 5.52 × 10⁻² according to the asymptotic approximation, but Monte Carlo simulations show that thetrue p-value is 1.0 × 10⁻², so the pulsations can be considered significant.References. (1) Abdo et al. 2008; (2) Abdo et al. 2009b; (3) Aliu et al. 2013; (4) Abdo et al. 2009c; (5) Abdo et al. 2010g; (6) Aliu et al.2008; (7) VERITAS Collaboration et al. 2011; (8) Ransom et al. 2011; (9) Abdo et al. 2010j; (10) Abdo et al. 2009h; (11) Abdo et al. 2010q;(12) Saz Parkinson et al. 2010; (13) Abdo et al. 2009g; (14) Abdo et al. 2009d; (15) Weltevrede et al. 2010; (16) Kerr et al. 2012; (17) Pletschet al. 2012a; (18) Abdo et al. 2010r; (19) Abdo et al. 2010f; (20) Abdo et al. (2010n); (21) Abdo et al. 2009i; (22) Halpern et al. 2008;(23) Abdo et al. 2009f; (24) Camilo et al. 2009; (25) Acciari et al. 2009.
normal incidence above 10 GeV. For the low-energy profile,we assumed the probability distribution function (PDF), withphase φ, obtained in the 2PC using the weighted LAT photonsabove 100 MeV (where the weight of each photon correspondsto the probability that it comes from the pulsar; see 2PC fordetails):
PDFLE (φ) = d +n∑
i=1
ci · fi(φ), (1)
a combination of n skewed Gaussian and Lorentzian distribu-tions fi. The overall normalization of the PDF is defined suchthat d +
∑ni=1 ci = 1, where d represents the unpulsed (or
“DC”) component of the pulsar. For the high-energy PDF, weconsidered the family of distributions given by:
PDFHE (φ) = (1 − x) + x · PDFLE (φ) − d
1 − d(2)
with 0 � x � 1. We maximized a likelihood function derivedfrom PDFHE with respect to x, to give L(x), and compared itto the null hypothesis, for x = 0, that there is no pulsation,i.e., PDFHE (φ) = 1. By construction, the likelihood under thenull hypothesis is L (0) = 1, so the test statistic, defined asTS = −2 ln(L(0)/L(x)), can be simplified to TS = 2 lnL(x).
We converted the measured value of TS into a tail probability(or p-value, P) by assuming (by virtue of Wilks’ theorem) thatthe TS follows a χ2 distribution with 1 degree of freedom.Since we are only testing for a positive correlation (one-sidedtest) between the low and high energy pulse profiles (whereas anegative correlation is equally likely in the null hypothesis), wedivide the (two-sided) p-values by 2. We set a threshold of P =0.05 to claim evidence for pulsations, with P10 representing thep-value obtained using >10 GeV events and P25 correspondingto the p-value obtained using >25 GeV events. Given that weare using an asymptotic approximation to convert between themeasured TS values and the corresponding p-values, we reportonly p-values greater than 2.0×10⁻⁹ (∼6σ ); rather than provideunreliable numbers in the tails of the distribution, we prefer toquote the rest only as upper limits.
We validated the procedure with Monte Carlo simulations.Given a high-energy profile with a certain number of events,n, we generated random sets of n phases uniformly distributedbetween 0 and 1. We then performed exactly the same test onthese fake data sets and measured the rate of false positives. Werepeated the simulations for every pulse profile and verified thatthe asymptotic distribution is valid in all cases with more than2 events.
21
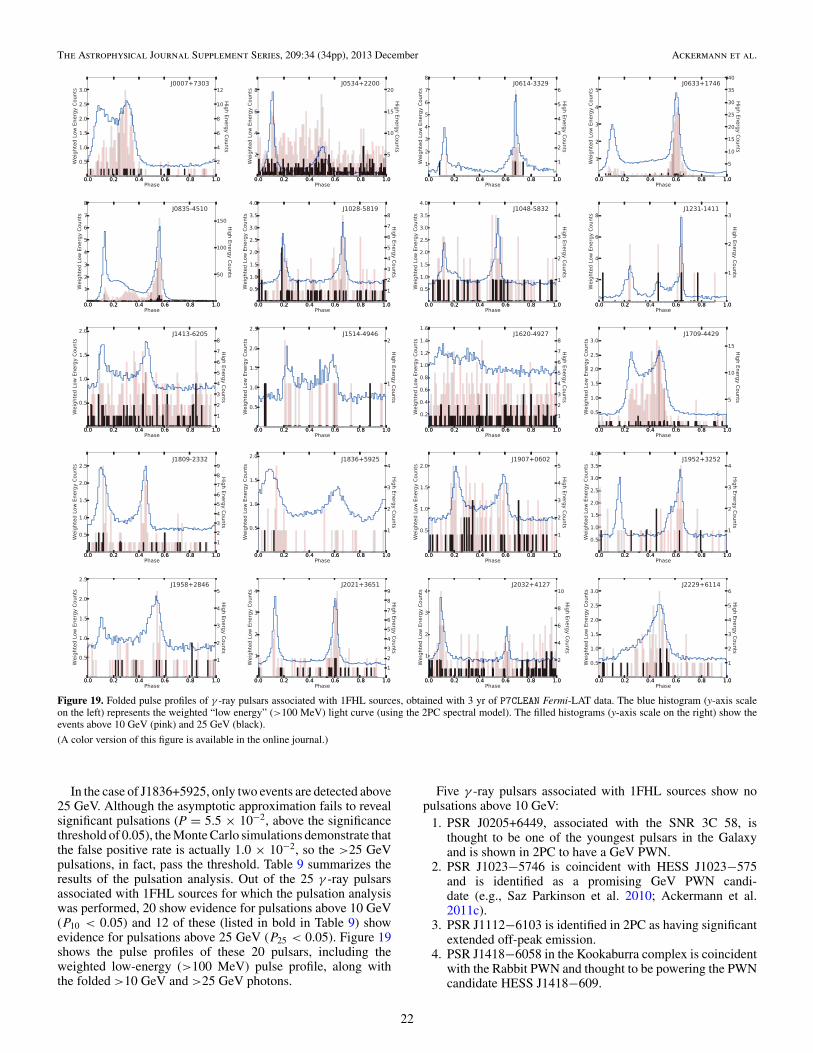
The Astrophysical Journal Supplement Series, 209:34 (34pp), 2013 December Ackermann et al.
Figure 19. Folded pulse profiles of γ -ray pulsars associated with 1FHL sources, obtained with 3 yr of P7CLEAN Fermi-LAT data. The blue histogram (y-axis scaleon the left) represents the weighted “low energy” (>100 MeV) light curve (using the 2PC spectral model). The filled histograms (y-axis scale on the right) show theevents above 10 GeV (pink) and 25 GeV (black).
(A color version of this figure is available in the online journal.)
In the case of J1836+5925, only two events are detected above25 GeV. Although the asymptotic approximation fails to revealsignificant pulsations (P = 5.5 × 10⁻², above the significancethreshold of 0.05), the Monte Carlo simulations demonstrate thatthe false positive rate is actually 1.0 × 10⁻², so the >25 GeVpulsations, in fact, pass the threshold. Table 9 summarizes theresults of the pulsation analysis. Out of the 25 γ -ray pulsarsassociated with 1FHL sources for which the pulsation analysiswas performed, 20 show evidence for pulsations above 10 GeV(P10 < 0.05) and 12 of these (listed in bold in Table 9) showevidence for pulsations above 25 GeV (P25 < 0.05). Figure 19shows the pulse profiles of these 20 pulsars, including theweighted low-energy (>100 MeV) pulse profile, along withthe folded >10 GeV and >25 GeV photons.
Five γ -ray pulsars associated with 1FHL sources show nopulsations above 10 GeV:
1. PSR J0205+6449, associated with the SNR 3C 58, isthought to be one of the youngest pulsars in the Galaxyand is shown in 2PC to have a GeV PWN.
2. PSR J1023−5746 is coincident with HESS J1023−575and is identified as a promising GeV PWN candi-date (e.g., Saz Parkinson et al. 2010; Ackermann et al.2011c).
3. PSR J1112−6103 is identified in 2PC as having significantextended off-peak emission.
4. PSR J1418−6058 in the Kookaburra complex is coincidentwith the Rabbit PWN and thought to be powering the PWNcandidate HESS J1418−609.
22

The Astrophysical Journal Supplement Series, 209:34 (34pp), 2013 December Ackermann et al.
Figure 20. Folded pulse profiles of γ -ray pulsars with no corresponding 1FHL sources, obtained with 3 yr of P7CLEAN Fermi-LAT data. The blue histogram (y-axisscale on the left) represents the weighted “low energy” (>100 MeV) light curve (using the 2PC spectral model). The filled histograms (y-axis scale on the right) showthe events above 10 GeV (pink) and 25 GeV (black).
(A color version of this figure is available in the online journal.)
Table 10Fermi-LAT γ -Ray Pulsars with Hints of >10 GeV Emission but No 1FHL Association
PSR P l b n10 P10 n25 P25 Ref.(ms) (deg) (deg)
J0218+4232 2.32 139.5 −17.5 79 >0.05 23 >0.05 (1)J0633+0632 297 205.1 −0.9 24 1.3 × 10⁻² 5 >0.05 (2)J1509–5850 88.9 320.0 −0.6 187 >0.05 52 >0.05 (3)J1747−2958 98.8 359.3 −0.8 272 3.8 × 10⁻² 64 >0.05J1803–2149# 106 8.1 +0.2 270 1.4 × 10⁻² 76 >0.05 (4)J1826–1256 110 18.6 −0.4 304 >0.05 80 >0.05 (2)J1838–0537 146 26.5 +0.2 321 >0.05 96 >0.05 (5)J1954+2836 92.7 65.2 +0.4 66 4.8 × 10⁻⁶ 12 6.5 × 10⁻³ (6, 7, 8)J2017+0603 2.90 48.6 −16.0 16 1.4 × 10⁻² 2 >0.05 (9)J2021+4026 265 78.2 +2.1 289 >0.05 77 >0.05 (2)J2043+1711 2.38 61.9 −15.3 0 >0.05 0 >0.05 (10)J2111+4606 158 88.3 −1.5 33 3.4 × 10⁻³ 11 >0.05 (4)J2238+5903 163 106.6 +0.5 51 4.0 × 10⁻² 14 >0.05 (2)J2302+4442 5.20 103.4 −14.0 19 5.1 × 10⁻⁴ 2 >0.05 (9)
Notes. PSR is the name of γ -ray pulsar (in bold when detected above 25 GeV). A † next to the name means a GeVPWN is detected by the LAT, while a # means a TeV (>100 GeV) PWN is detected by ground-based instruments (seehttp://tevcat.uchicago.edu); P is the pulsar period, in milliseconds; The Galactic longitude (l) and latitude (b), are givenin degrees. n10 (n25) is the number of photons (within the 95% containment radius of the PSF) above 10 (25) GeV andP10 (P25) gives the corresponding tail probabilities, against a null hypothesis of no pulsations. We quote only p-values<0.05 and >2 × 10⁻⁹ (∼6σ ).References. (1) Abdo et al. 2009a; (2) Abdo et al. 2009b; (3) Weltevrede et al. 2010; (4) Pletsch et al. 2012a; (5) Pletschet al. 2012b; (6) Saz Parkinson et al. 2010; (7) Abdo et al. 2009f; (8) Aleksic et al. 2010; (9) Cognard et al. 2011;(10) Guillemot et al. 2012.
5. PSR J1420−6048, also in the Kookaburra complex, is inthe vicinity of HESS J1420−607 and is a promising LATPWN candidate (Acero et al. 2013).
In short, the >10 GeV emission from these five 1FHL sources ismore likely to be from PWNs than from the pulsars themselves.
Because a pulsation search is more sensitive than a simplesource detection search, we extended the analysis to includepulsars from 2PC whose spectra show possible emissionabove 10 GeV, even if they have no associated 1FHL source.There are 14 additional pulsars in 2PC with at least one spectralbin above 10 GeV detected with TS � 4, a ∼2σ detection.97
The results of the pulsation analysis for these pulsars are
97 See Abdo et al. (2013) for further details, including plots, regarding thespectral analysis of these and other LAT pulsars.
listed in Table 10. Eight out of the 14 pulsars selected in thisway show evidence for pulsations above 10 GeV, and one ofthem (J1954+2836) shows evidence for pulsations even above25 GeV. The pulse profiles of these eight pulsars are shown inFigure 20.
The effect of the spectral cutoff in pulsars is manifested by thedramatic drop in photon statistics from 10 GeV to 25 GeV (cf.Columns 6 and 8 of Table 9 and Columns 5 and 7 of Table 10). Achange in pulse profile at higher energies (>10 GeV), comparedto low energies (>100 MeV), is also apparent, with the widthsof the peaks typically narrowing and the height of the first peakdecreasing in significance. These features of the high-energyprofiles have been reported for the brightest γ -ray pulsars likeVela, the Crab, and Geminga (Abdo et al. 2009h, 2010g, 2010j),but we show here that they are present in other pulsars too,
23

The Astrophysical Journal Supplement Series, 209:34 (34pp), 2013 December Ackermann et al.
Table 11Fermi-LAT γ -Ray Pulsars Detected above 25 GeV
PSR Emax Edetectedmax Φγmax Notes
J0007+7303# 28 788 0.64
J0534+2200†# 26 784 0.33 CrabJ0614–3329 63 63.6 0.68J0633+1746# 33 52.7 0.05 Geminga
J0835–4510†# 37 752 0.28 VelaJ1028–5819 27 386 0.49J1048–5832 35 201 0.28J1413–6205 29 331 0.28J1809–2332 26 159 0.07J1836+5925 26 97.9 0.05J1954+2836 62 95.7 0.57J2021+3651# 26 113 0.64J2229+6114# 31 169 0.17
Notes. PSR is the name of γ -ray pulsar; a † implies a GeV PWN is detectedby the LAT, while a # implies an associated TeV PWN, detected by ground-based instruments above 100 GeV (see http://tevcat.uchicago.edu); Emax is themaximum energy (in GeV) above which P <0.05 is still obtained while Edetected
maxis the highest-energy event detected (in GeV) and Φγmax is the correspondingpulsar phase of this event.
including MSPs, like J0614−3329. In the case of the Crab, theLAT pulse profile shown in Figure 19 is heavily contaminatedby the emission from the PWN. An analysis beyond the scopeof this paper would be required to disentangle the two spectralcomponents and provide a more sensitive analysis of the Crabpulsar in the >10 GeV energy range. In the case of Vela,another feature that is apparent in the high-energy profile (seeFigure 19) is an energy-dependent shift of the position of thethird (“middle”) peak, which moves toward the second peakwith increasing energy, as reported by Abdo et al. (2009h). Thischange in profile at higher energies highlights a shortcomingof the analysis described here. The choice of the low-energy(>100 MeV) pulse profile as a template for the pulsation searchin the high-energy events was based in part on the assumptionthat the difference between the two profiles would be relativelymodest.
Beyond 25 GeV, the drop in statistics for γ -ray pulsarsbecomes even more dramatic. Nevertheless, a number of pulsarsin this study still have evidence of pulsations above 25 GeV. Byscanning in energy (in steps of 1 GeV) we determined, for eachpulsar, the energy beyond which the tail probability increasesabove 5%. Given the very small statistics, we relied on MonteCarlo simulations to obtain the p-values and correspondingenergy thresholds. For the same reason, we caution againstconsidering these as significant detections. Table 11 summarizesthe results of this scan.
The presence of a PWN will complicate studies of pulsationsat the highest energies. The high-energy γ -ray emission fromPWNs can be particularly significant relative to the pulsarsthey are associated with, especially for some young, energeticpulsars (e.g., the Crab). An associated PWN can thus representa significant background, limiting the sensitivity of a pulsationsearch. In the case of the Crab, the PWN is particularly bright,both at GeV and TeV energies. Thus, although the Crab pulsarhas been detected (in fact, is the only pulsar detected) byIACTs above 100 GeV, the LAT results, shown in Table 9,are not as significant as those for a number of other >25 GeVγ -ray pulsars. Indeed, with the current analysis, we are unableto detect pulsations beyond 26 GeV for the Crab. In Tables 9
and 10 we flag those with a LAT-detected GeV PWN or a TeV(>100 GeV) PWN detected by IACTs. The maximum energyand phase columns of Table 11 suggest that we may be detectingevents from a number of PWNs. For example, in the case ofJ0007+7303, the highest-energy event is 788 GeV, arriving atphase 0.64, far from the pulsar peaks, suggesting that a PWNorigin is more likely than a PSR origin. VERITAS recentlyreported the detection of such a PWN above 100 GeV (Aliuet al. 2013).
The 28 HPSRs discussed in this section include members ofevery class of pulsar detected so far by the LAT and include the5 brightest EGRET-detected pulsars98: 5 young (non-recycled)radio-loud γ -ray pulsars, 13 young (non-recycled) radio-quietγ -ray pulsars, and 5 γ -ray MSPs. It is not obvious how toselect the best candidates for the detection of pulsations at VHEwith IACTs, since any such selection must depend on manyassumptions, and spectral extrapolations from 10 GeV upwardare notoriously unreliable. Improving the analysis for pulsationsto address the shortcomings discussed above is left for futurepublications. A dedicated treatment of the separate PWN andPSR spectral components would likely improve the sensitivity ofour search for pulsations, especially for those pulsars affectedby a high level of PWN emission. Finally, a different choiceof templates with which to compare the high-energy pulseprofile (e.g., the >1 GeV pulse profile), taking into account theevolution with energy of the pulse profile should also improvethe sensitivity of the pulsation search. The sensitivity will, inany case, improve as the LAT data continue to accumulate.
5. GOOD CANDIDATES FOR VHE DETECTION
Astrophysical interest in γ rays extends beyond the energyrange that is easily accessible to a space-based instrumentlike the Fermi LAT, which is limited by the size and massof a satellite. Ground-based γ -ray telescopes that use Earth’satmosphere as a detector have enormous collecting areas andcan operate successfully at energies where the LAT simply runsout of photons. Present and future VHE telescopes include bothparticle detector arrays (e.g., Tibet AS, ARGO-YBJ, HAWC andLHASSO) and IACTs, which are presently the most sensitiveVHE instruments. The survey capability of the Fermi LAT athigh energies provides a valuable complement to these IACTs,which are pointed instruments. It is worth noting that the2FGL catalog of sources detected above 100 MeV has 1873entries while the number of sources detected above 100 GeVand reported in TeVCat (version 3.400) is only 143 (includingannounced but not published VHE detections). Therefore, theLAT catalogs, and particularly this one above 10 GeV, offercandidate VHE targets. The 10 GeV minimum energy usedfor the 1FHL catalog analysis is a good compromise betweenhaving an adequate number of photons measured by LAT andbeing close to the energy range where IACTs operate. In thissection we describe the best VHE candidates among the full setof the 1FHL catalog sources.
The most advanced IACTs are currently H.E.S.S. andVERITAS (arrays of four ∼12 m telescopes; Hinton 2004;Weekes et al. 2002), and MAGIC (two telescopes of ∼17 mdiameter; Lorenz 2004). H.E.S.S. and VERITAS have energythresholds99 of ∼100 GeV (and typically measure γ -ray
98 PSR J1057−5226 (B1055−52) is the only EGRET pulsar not detectedabove 10 GeV.99 The energy threshold is conventionally defined as the peak in thedifferential energy trigger rate for a “Crab nebula-like” spectrum.
24

The Astrophysical Journal Supplement Series, 209:34 (34pp), 2013 December Ackermann et al.
BL Lac FSRQ AGN of unknown type
PSR SNR PWN
Other Galactic object Other (non-beamed) Extragalactic object No association
Figure 21. Sky map showing the 1FHL sources that have been detected at VHE by IACTs. The markers represent the source classes reported in Table 4. The projectionis Hammer–Aitoff in Galactic coordinates.
(A color version of this figure is available in the online journal.)
spectra above 140 GeV) while MAGIC has an energy thresholdof 60 GeV (and typically measures γ -ray spectra above 80 GeV).H.E.S.S added a 28 m diameter telescope to the existing arrayin Summer 2011. The resulting H.E.S.S II array has been op-erational since 2012 September and should allow the systemto reduce the energy threshold below 50 GeV. The plannedCherenkov Telescope Array (CTA) will be even more power-ful in terms of sensitivity and operational γ -ray energy range(Bernlohr et al. 2013). The currently operating IACTs have ef-fective fields of view of less than 4◦ degrees and so usuallyoperate in a targeted observation mode. The photon fluxes inthe VHE range are very low and hence relatively long observ-ing times (�5–10 hr) are typically required to make detections.Because IACTs can operate only on clear, essentially moonlessnights,100 the duty cycles are typically only about 10%–12%,which corresponds to �1000 hr observing time annually. TheGalactic plane is the only extended region that has beensystematically scanned with the latest generation of IACTs.
The number of 1FHL sources that have associations withknown VHE emitters is 84, which is about 2/3 of all the knownVHE emitters. IACTs are responsible for the discovery of 81,while the other three were first detected in the VHE range byMILAGRO, a water Cherenkov detector (Atkins et al. 2004).These sources are depicted in Figure 21. We note that in the2FGL catalog, coincidentally, 84 sources were associated withVHE emitters (not accounting for the association of 2FGLJ2229.0+6114 with two VHE sources). In addition, 14 2FGLsources have been reported to be VHE emitters since thepublication of the 2FGL catalog (see TeVCat). Therefore, ofthe 1873 sources in the 2FGL catalog, 98 now are associatedwith VHE sources, while of the 514 sources in the 1FHL, 84
100 MAGIC can operate during nights with moderate moonlight with a reducedPMT HV, and VERITAS can operate even during bright moon by using anoptical filter in front of the PMT camera. Such operation increases the energythreshold and reduces the sensitivity of the observations.
have VHE counterparts. The VHE sources in common total80. The 1FHL sources with VHE associations that are notin the 2FGL catalog are the blazars PKS 0548−322 and MS13121−4221, the cocoon of freshly accelerated cosmic rays inthe Cygnus X star-forming region (Ackermann et al. 2011a),and the unidentified source HESS J1857+026 (presumed to bea PWN; Klepser 2011). On the other hand, most of the 2FGLsources with VHE associations that are not in the 1FHL catalogare GeV pulsars that were associated with spatially extended,Galactic TeV sources. Only three point-like TeV sources withassociations in the 2FGL catalog do not also have associationsin the 1FHL catalog: the blazar 1ES 0414+009, and the starburstgalaxies NGC 253 and M82. Each of these required very longexposures for VHE detection: ∼70 hr with H.E.S.S. to detectthe blazar and ∼130 hr each with H.E.S.S. and VERITAS todetect the starburst galaxies.
This comparison shows that by limiting the energy range to>10 GeV, the 1FHL sources do not miss many VHE sources.Naturally, among the 1FHL sources, some are more feasiblydetectable at VHE. In the subsections below we describe thecriteria that we used to select the most promising VHE sourcecandidates among the 1FHL sources, and report the results.
5.1. Criteria for Selection of TeV candidates
Figure 22 shows the distribution of fluxes above 10 GeV (F10)and above 50 GeV (F50) for the 1FHL sources. The quantities F10are directly provided by the likelihood analysis (Table 3), whilethe values of F50 are calculated from the power-law spectra. Thefigure shows that the known TeV sources cluster at the highestfluxes, this correlation being clearer for F50. Such a relation isquite natural since the energy 50 GeV is close to the analysisenergy threshold of the current generation of IACTs. Therefore,F50 is a very good indicator of the VHE flux.
Two additional quantities can also be used to select goodcandidates for VHE detection. These are the spectral index
25
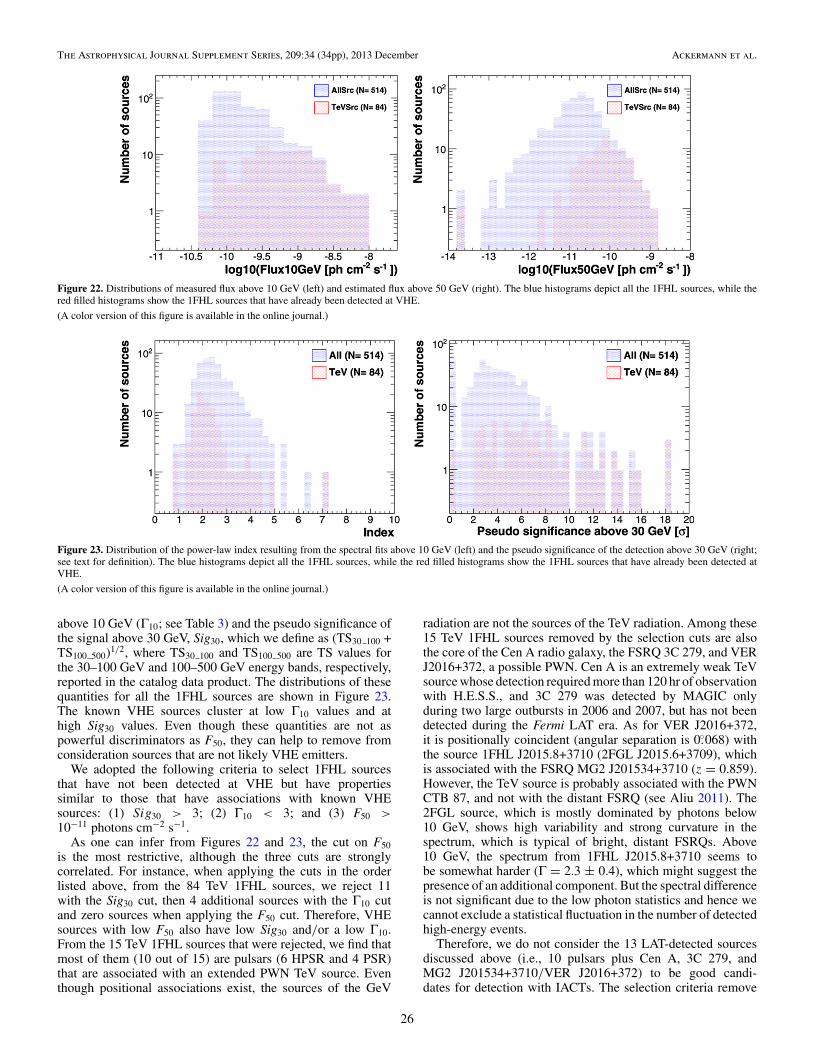
The Astrophysical Journal Supplement Series, 209:34 (34pp), 2013 December Ackermann et al.
Figure 22. Distributions of measured flux above 10 GeV (left) and estimated flux above 50 GeV (right). The blue histograms depict all the 1FHL sources, while thered filled histograms show the 1FHL sources that have already been detected at VHE.
(A color version of this figure is available in the online journal.)
Figure 23. Distribution of the power-law index resulting from the spectral fits above 10 GeV (left) and the pseudo significance of the detection above 30 GeV (right;see text for definition). The blue histograms depict all the 1FHL sources, while the red filled histograms show the 1FHL sources that have already been detected atVHE.
(A color version of this figure is available in the online journal.)
above 10 GeV (Γ10; see Table 3) and the pseudo significance ofthe signal above 30 GeV, Sig30, which we define as (TS30 100 +TS100 500)1/2, where TS30 100 and TS100 500 are TS values forthe 30–100 GeV and 100–500 GeV energy bands, respectively,reported in the catalog data product. The distributions of thesequantities for all the 1FHL sources are shown in Figure 23.The known VHE sources cluster at low Γ10 values and athigh Sig30 values. Even though these quantities are not aspowerful discriminators as F50, they can help to remove fromconsideration sources that are not likely VHE emitters.
We adopted the following criteria to select 1FHL sourcesthat have not been detected at VHE but have propertiessimilar to those that have associations with known VHEsources: (1) Sig30 > 3; (2) Γ10 < 3; and (3) F50 >10−11 photons cm−2 s−1.
As one can infer from Figures 22 and 23, the cut on F50is the most restrictive, although the three cuts are stronglycorrelated. For instance, when applying the cuts in the orderlisted above, from the 84 TeV 1FHL sources, we reject 11with the Sig30 cut, then 4 additional sources with the Γ10 cutand zero sources when applying the F50 cut. Therefore, VHEsources with low F50 also have low Sig30 and/or a low Γ10.From the 15 TeV 1FHL sources that were rejected, we find thatmost of them (10 out of 15) are pulsars (6 HPSR and 4 PSR)that are associated with an extended PWN TeV source. Eventhough positional associations exist, the sources of the GeV
radiation are not the sources of the TeV radiation. Among these15 TeV 1FHL sources removed by the selection cuts are alsothe core of the Cen A radio galaxy, the FSRQ 3C 279, and VERJ2016+372, a possible PWN. Cen A is an extremely weak TeVsource whose detection required more than 120 hr of observationwith H.E.S.S., and 3C 279 was detected by MAGIC onlyduring two large outbursts in 2006 and 2007, but has not beendetected during the Fermi LAT era. As for VER J2016+372,it is positionally coincident (angular separation is 0.◦068) withthe source 1FHL J2015.8+3710 (2FGL J2015.6+3709), whichis associated with the FSRQ MG2 J201534+3710 (z = 0.859).However, the TeV source is probably associated with the PWNCTB 87, and not with the distant FSRQ (see Aliu 2011). The2FGL source, which is mostly dominated by photons below10 GeV, shows high variability and strong curvature in thespectrum, which is typical of bright, distant FSRQs. Above10 GeV, the spectrum from 1FHL J2015.8+3710 seems tobe somewhat harder (Γ = 2.3 ± 0.4), which might suggest thepresence of an additional component. But the spectral differenceis not significant due to the low photon statistics and hence wecannot exclude a statistical fluctuation in the number of detectedhigh-energy events.
Therefore, we do not consider the 13 LAT-detected sourcesdiscussed above (i.e., 10 pulsars plus Cen A, 3C 279, andMG2 J201534+3710/VER J2016+372) to be good candi-dates for detection with IACTs. The selection criteria remove
26
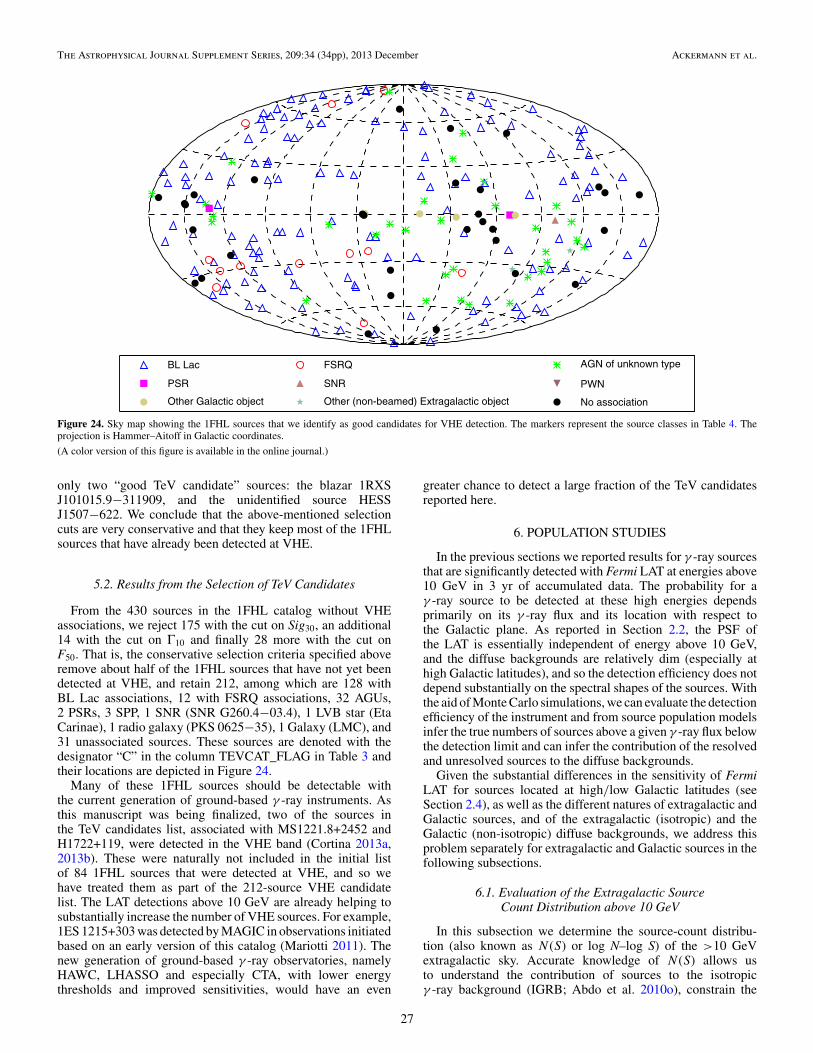
The Astrophysical Journal Supplement Series, 209:34 (34pp), 2013 December Ackermann et al.
BL Lac FSRQ AGN of unknown type
PSR SNR PWN
Other Galactic object Other (non-beamed) Extragalactic object No association
Figure 24. Sky map showing the 1FHL sources that we identify as good candidates for VHE detection. The markers represent the source classes in Table 4. Theprojection is Hammer–Aitoff in Galactic coordinates.
(A color version of this figure is available in the online journal.)
only two “good TeV candidate” sources: the blazar 1RXSJ101015.9−311909, and the unidentified source HESSJ1507−622. We conclude that the above-mentioned selectioncuts are very conservative and that they keep most of the 1FHLsources that have already been detected at VHE.
5.2. Results from the Selection of TeV Candidates
From the 430 sources in the 1FHL catalog without VHEassociations, we reject 175 with the cut on Sig30, an additional14 with the cut on Γ10 and finally 28 more with the cut onF50. That is, the conservative selection criteria specified aboveremove about half of the 1FHL sources that have not yet beendetected at VHE, and retain 212, among which are 128 withBL Lac associations, 12 with FSRQ associations, 32 AGUs,2 PSRs, 3 SPP, 1 SNR (SNR G260.4−03.4), 1 LVB star (EtaCarinae), 1 radio galaxy (PKS 0625−35), 1 Galaxy (LMC), and31 unassociated sources. These sources are denoted with thedesignator “C” in the column TEVCAT_FLAG in Table 3 andtheir locations are depicted in Figure 24.
Many of these 1FHL sources should be detectable withthe current generation of ground-based γ -ray instruments. Asthis manuscript was being finalized, two of the sources inthe TeV candidates list, associated with MS1221.8+2452 andH1722+119, were detected in the VHE band (Cortina 2013a,2013b). These were naturally not included in the initial listof 84 1FHL sources that were detected at VHE, and so wehave treated them as part of the 212-source VHE candidatelist. The LAT detections above 10 GeV are already helping tosubstantially increase the number of VHE sources. For example,1ES 1215+303 was detected by MAGIC in observations initiatedbased on an early version of this catalog (Mariotti 2011). Thenew generation of ground-based γ -ray observatories, namelyHAWC, LHASSO and especially CTA, with lower energythresholds and improved sensitivities, would have an even
greater chance to detect a large fraction of the TeV candidatesreported here.
6. POPULATION STUDIES
In the previous sections we reported results for γ -ray sourcesthat are significantly detected with Fermi LAT at energies above10 GeV in 3 yr of accumulated data. The probability for aγ -ray source to be detected at these high energies dependsprimarily on its γ -ray flux and its location with respect tothe Galactic plane. As reported in Section 2.2, the PSF ofthe LAT is essentially independent of energy above 10 GeV,and the diffuse backgrounds are relatively dim (especially athigh Galactic latitudes), and so the detection efficiency does notdepend substantially on the spectral shapes of the sources. Withthe aid of Monte Carlo simulations, we can evaluate the detectionefficiency of the instrument and from source population modelsinfer the true numbers of sources above a given γ -ray flux belowthe detection limit and can infer the contribution of the resolvedand unresolved sources to the diffuse backgrounds.
Given the substantial differences in the sensitivity of FermiLAT for sources located at high/low Galactic latitudes (seeSection 2.4), as well as the different natures of extragalactic andGalactic sources, and of the extragalactic (isotropic) and theGalactic (non-isotropic) diffuse backgrounds, we address thisproblem separately for extragalactic and Galactic sources in thefollowing subsections.
6.1. Evaluation of the Extragalactic SourceCount Distribution above 10 GeV
In this subsection we determine the source-count distribu-tion (also known as N (S) or log N–log S) of the >10 GeVextragalactic sky. Accurate knowledge of N (S) allows usto understand the contribution of sources to the isotropicγ -ray background (IGRB; Abdo et al. 2010o), constrain the
27
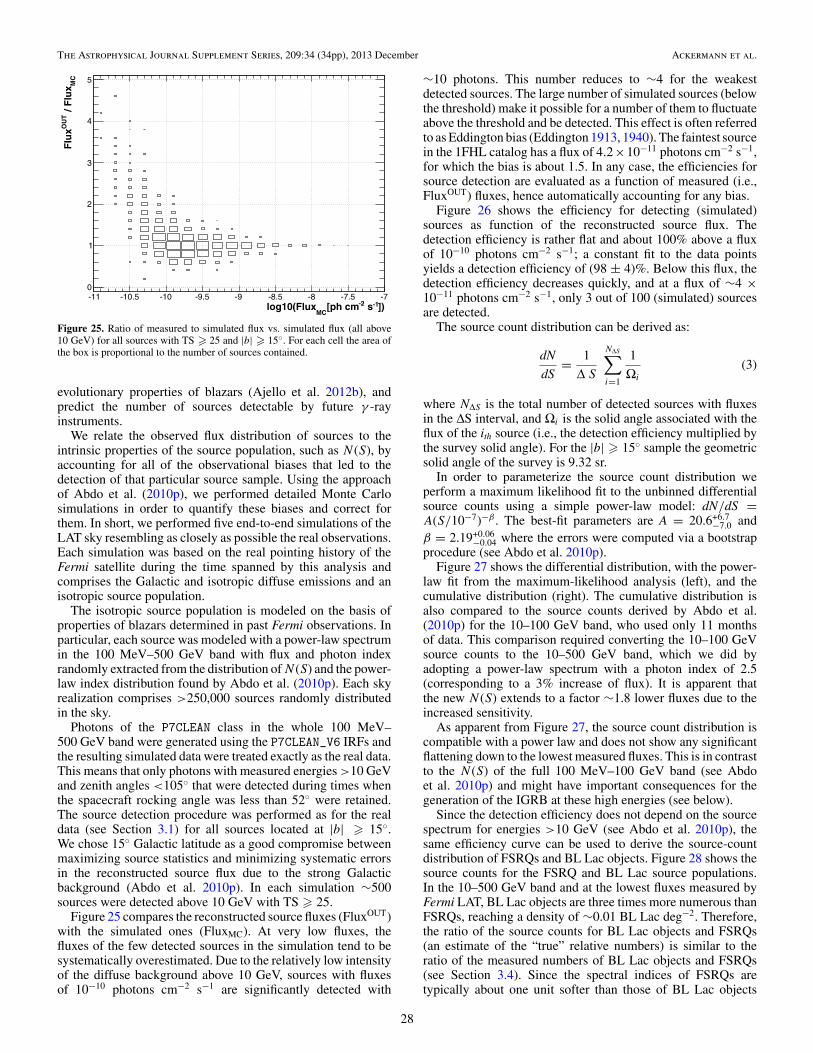
The Astrophysical Journal Supplement Series, 209:34 (34pp), 2013 December Ackermann et al.
])-1 s-2[ph cmMC
log10(Flux-11 -10.5 -10 -9.5 -9 -8.5 -8 -7.5 -7
MC
/ F
lux
OU
TF
lux
0
1
2
3
4
5
Figure 25. Ratio of measured to simulated flux vs. simulated flux (all above10 GeV) for all sources with TS � 25 and |b| � 15◦. For each cell the area ofthe box is proportional to the number of sources contained.
evolutionary properties of blazars (Ajello et al. 2012b), andpredict the number of sources detectable by future γ -rayinstruments.
We relate the observed flux distribution of sources to theintrinsic properties of the source population, such as N (S), byaccounting for all of the observational biases that led to thedetection of that particular source sample. Using the approachof Abdo et al. (2010p), we performed detailed Monte Carlosimulations in order to quantify these biases and correct forthem. In short, we performed five end-to-end simulations of theLAT sky resembling as closely as possible the real observations.Each simulation was based on the real pointing history of theFermi satellite during the time spanned by this analysis andcomprises the Galactic and isotropic diffuse emissions and anisotropic source population.
The isotropic source population is modeled on the basis ofproperties of blazars determined in past Fermi observations. Inparticular, each source was modeled with a power-law spectrumin the 100 MeV–500 GeV band with flux and photon indexrandomly extracted from the distribution of N (S) and the power-law index distribution found by Abdo et al. (2010p). Each skyrealization comprises >250,000 sources randomly distributedin the sky.
Photons of the P7CLEAN class in the whole 100 MeV–500 GeV band were generated using the P7CLEAN_V6 IRFs andthe resulting simulated data were treated exactly as the real data.This means that only photons with measured energies >10 GeVand zenith angles <105◦ that were detected during times whenthe spacecraft rocking angle was less than 52◦ were retained.The source detection procedure was performed as for the realdata (see Section 3.1) for all sources located at |b| � 15◦.We chose 15◦ Galactic latitude as a good compromise betweenmaximizing source statistics and minimizing systematic errorsin the reconstructed source flux due to the strong Galacticbackground (Abdo et al. 2010p). In each simulation ∼500sources were detected above 10 GeV with TS � 25.
Figure 25 compares the reconstructed source fluxes (FluxOUT)with the simulated ones (FluxMC). At very low fluxes, thefluxes of the few detected sources in the simulation tend to besystematically overestimated. Due to the relatively low intensityof the diffuse background above 10 GeV, sources with fluxesof 10−10 photons cm−2 s−1 are significantly detected with
∼10 photons. This number reduces to ∼4 for the weakestdetected sources. The large number of simulated sources (belowthe threshold) make it possible for a number of them to fluctuateabove the threshold and be detected. This effect is often referredto as Eddington bias (Eddington 1913, 1940). The faintest sourcein the 1FHL catalog has a flux of 4.2×10⁻¹¹ photons cm−2 s−1,for which the bias is about 1.5. In any case, the efficiencies forsource detection are evaluated as a function of measured (i.e.,FluxOUT) fluxes, hence automatically accounting for any bias.
Figure 26 shows the efficiency for detecting (simulated)sources as function of the reconstructed source flux. Thedetection efficiency is rather flat and about 100% above a fluxof 10−10 photons cm−2 s−1; a constant fit to the data pointsyields a detection efficiency of (98 ± 4)%. Below this flux, thedetection efficiency decreases quickly, and at a flux of ∼4 ×10⁻¹¹ photons cm−2 s−1, only 3 out of 100 (simulated) sourcesare detected.
The source count distribution can be derived as:
dN
dS= 1
Δ S
NΔS∑i=1
1
Ωi
(3)
where NΔS is the total number of detected sources with fluxesin the ΔS interval, and Ωi is the solid angle associated with theflux of the ith source (i.e., the detection efficiency multiplied bythe survey solid angle). For the |b| � 15◦ sample the geometricsolid angle of the survey is 9.32 sr.
In order to parameterize the source count distribution weperform a maximum likelihood fit to the unbinned differentialsource counts using a simple power-law model: dN/dS =A(S/10−7)−β . The best-fit parameters are A = 20.6+6.7
−7.0 andβ = 2.19+0.06
−0.04 where the errors were computed via a bootstrapprocedure (see Abdo et al. 2010p).
Figure 27 shows the differential distribution, with the power-law fit from the maximum-likelihood analysis (left), and thecumulative distribution (right). The cumulative distribution isalso compared to the source counts derived by Abdo et al.(2010p) for the 10–100 GeV band, who used only 11 monthsof data. This comparison required converting the 10–100 GeVsource counts to the 10–500 GeV band, which we did byadopting a power-law spectrum with a photon index of 2.5(corresponding to a 3% increase of flux). It is apparent thatthe new N (S) extends to a factor ∼1.8 lower fluxes due to theincreased sensitivity.
As apparent from Figure 27, the source count distribution iscompatible with a power law and does not show any significantflattening down to the lowest measured fluxes. This is in contrastto the N (S) of the full 100 MeV–100 GeV band (see Abdoet al. 2010p) and might have important consequences for thegeneration of the IGRB at these high energies (see below).
Since the detection efficiency does not depend on the sourcespectrum for energies >10 GeV (see Abdo et al. 2010p), thesame efficiency curve can be used to derive the source-countdistribution of FSRQs and BL Lac objects. Figure 28 shows thesource counts for the FSRQ and BL Lac source populations.In the 10–500 GeV band and at the lowest fluxes measured byFermi LAT, BL Lac objects are three times more numerous thanFSRQs, reaching a density of ∼0.01 BL Lac deg−2. Therefore,the ratio of the source counts for BL Lac objects and FSRQs(an estimate of the “true” relative numbers) is similar to theratio of the measured numbers of BL Lac objects and FSRQs(see Section 3.4). Since the spectral indices of FSRQs aretypically about one unit softer than those of BL Lac objects
28

The Astrophysical Journal Supplement Series, 209:34 (34pp), 2013 December Ackermann et al.
]-1 s-2 [ph cm10-500 GeVS-1110 -1010 -910 -810D
etec
tio
n E
ffic
ien
cy (
|b|>
15 a
nd
TS
>25)
-110
1
Figure 26. Detection efficiency as a function of measured flux for |b| � 15◦ and TS � 25. The error bars represent uncertainties from the counting statistic of ourMonte Carlo simulations. The line above the flux 10−10 photons cm−2 s−1 results from a fit with a constant yielding 0.98 ± 0.04, while below this flux the curvesmoothly connects the data points to guide the eye.
]-1 s-2 [ph cm10-500 GeVS-1010 -910
]-2
s d
eg2
dN
/dS
[cm
410
510
610
710
810
910
]-1 s-2 [ph cm10-500 GeVS-1010 -910
]-2
N(>
S)
[deg
-510
-410
-310
-210
Abdo et al. 2010, ApJ 720, 435
This work
Figure 27. Left panel: differential N (S) (data points) and best-fit power-law model (gray line). Right panel: cumulative N (S) compared to the 10–100 GeV N (S)derived in Abdo et al. (2010p) using 11 months of data (converted to the 10–500 GeV band).
(A color version of this figure is available in the online journal.)
]-1 s-2 [ph cm10-500 GeVS-1110 -1010 -910 -810
]-2
s d
eg2
dN
/dS
[cm
410
510
610
710
810
910
BL Lacs
FSRQs
]-1 s-2 [ph cm10-500 GeVS-1110 -1010 -910 -810
]-2
N(>
F)
[deg
-510
-410
-310
-210BL Lacs
FSRQs
Figure 28. Differential N (S) (left panel) and cumulative N (S) (right panel) for BL Lac objects and FSRQs.
(A color version of this figure is available in the online journal.)
(see Figure 16), this result confirms that, above 10 GeV, thedetection efficiency is not significantly affected by the differentspectral shapes of the sources, as indicated above. Moreover,we also note that the N (S) of BL Lac objects does not flatten at
the lowest measured fluxes while that of FSRQs seems to flattenbelow ∼10−10 photons cm−2 s−1.
From the source flux distribution we can determine how muchof the intensity of the IGRB above 10 GeV is due to 1FHL
29

The Astrophysical Journal Supplement Series, 209:34 (34pp), 2013 December Ackermann et al.
sources. The comparison between the N (S) derived here andthe IGRB measurement reported by Abdo et al. (2010o) is notstraightforward. Indeed, the two works rely on sources detectedon different timescales and above different thresholds. Sourcesused by Abdo et al. (2010o) were detected with TS � 25 in the0.2–100 GeV band using nine months of data while those usedhere are detected with TS � 25 in the 10–500 GeV band using3 yr of data.
The most straightforward comparison is between the totalsky intensities, by which we mean the intensity of the IGRBplus the detected sources. From fitting band-by-band intensitiesof the IGRB reported in Table 1 of Abdo et al. (2010o)with a power-law function above 10 GeV, and integrating thefitted function in the energy range 10–500 GeV, one can findthat the intensity of the IGRB in the 10–500 GeV band is(1.5±0.3)×10−8 photons cm−2 s−1 sr−1. The resolved sourcesaccount for a further (0.8 ± 0.1) × 10−8 photons cm−2 s−1 sr−1,and the total isotropic intensity in the 10–500 GeV band is(2.3 ± 0.3) × 10−8 photons cm−2 s−1 sr−1.
The diffuse flux produced by an unresolved source populationcan be obtained as:
Sdiffuse =∫ Smax
Smin
dSdN
dSS
(1 − Ω(S)
Ωmax
)(4)
where Ωmax is the geometrical sky area and the Ω(S)/Ωmaxterm (which is the detection efficiency reported in Figure 26)takes into account the dependency of the LAT source detectionefficiency on the source flux.
Setting Ω(S)/Ωmax = 0 allows us to evaluate the total diffuseflux including resolved sources. Integrating the N (S) to theminimum observed flux of 4.2 × 10⁻¹¹ photons cm−2 s−1 weobtain Stotal = (10.6 ± 1.0) × 10−9 photons cm−2 s−1 sr−1,where the error was computed through a bootstrap procedure,following Abdo et al. (2010p). This shows that 1FHL sourcesaccount for about half of the total (IGRB plus sources) skyintensity in the energy band 10–500 GeV.
Most of the comparisons presented in the literature refer tothe diffuse emission arising from unresolved sources. UsingEquation (4), the flux from the unresolved sources can becomputed to be 3.9+0.8
−0.6 × 10⁻⁹ photons cm−2 s−1 sr−1, wherethe uncertainty is primarily due the statistical and systematicuncertainties of the detection efficiency, and the contributionfrom the statistical uncertainty of the bootstrap procedure isminor (Abdo et al. 2010p).
As a consistency check, one can compare the resolvedsource flux determined in different ways. The true flux ofsources detected in this work, which can be obtained byaveraging the fluxes of all the |b| � 15◦ detected sources,amounts to (8.2 ± 0.1) × 10−9 photons cm−2 s−1 sr−1, andis compatible with the number derived from Abdo et al.(2010o) that was reported above. Additionally, one can alsoderive the source flux by subtracting from the total diffuse flux((10.6 ± 1.0) × 10−9 photons cm−2 s−1 sr−1) the unresolvedsource flux (3.9±0.8×10⁻⁹ photons cm−2 s−1 sr−1), obtaining(6.7 ± 1.3) × 10−9 photons cm−2 s−1 sr−1, which is comparableto the above-mentioned estimates.
In conclusion, unresolved 1FHL sources with S � 4 ×10⁻¹¹ photons cm−2 s−1 sr−1 account for 3.9+0.8
−0.6 × 10⁻⁹ pho-tons cm−2 s−1 sr−1, which is 27 ± 8% of the IGRB emissionabove 10 GeV reported in Abdo et al. (2010o). We note thatthis contribution to the IGRB is substantially larger than the 9%lower limit reported by Abdo et al. (2010p) and is, in large part,due to the increased sensitivity (this N (S) samples a factor ∼2
weaker fluxes), and also to a better treatment of the resolvedsource flux. It is reasonable to expect that 1FHL sources pro-duce an even larger fraction of the diffuse emission than foundin the earlier work since Equation (4) has been integrated onlyto the lowest flux observed, and the N (S) does not yet show anystrong flattening.
6.2. Galactic Sources
Here we analyze the population of Galactic sources toestimate the contribution of unresolved sources to the Galactic“diffuse” emission, following the method of Strong (2007).We adopt a plausible reference model for the space densityand luminosity function of Galactic sources and investigate thesensitivity of the results to the assumptions of the model.
The luminosity function at Galactocentric distance R anddistance from Galactic plane z is the space density of sourcesper unit luminosity ρ(Lγ ,R, z). After Strong (2007) we assumethat the luminosity function depends on luminosity as Lγ
−α forLγ,min < Lγ < Lγ,max and is zero outside these limits. Thetotal space density of sources is ρ(R, z) = ∫
ρ(Lγ ,R, z) dLγ ,which we normalize to the value ρ� at (R, z) = (R�, 0). For asource of luminosity Lγ at distance d the flux is Sγ = Lγ /4πd2.The differential source counts are defined as N (Sγ ) sources perunit flux over the area of sky considered. At lower Sγ , both theluminosity function and the spatial boundaries influence N (Sγ ).In practice the sources are binned in log(Sγ ) so that plotteddistributions are proportional to Sγ N (Sγ ).
For Sγ large enough that the spatial boundaries of the distri-bution have no influence on the detectability, the well-knownrelations N (Sγ ) ∝ S
−5/2γ , S−2
γ hold for three-dimensional andtwo-dimensional spatial source distributions, respectively, inde-pendent of the shape of the luminosity function.101 These ap-ply to low luminosity/high space density (quasi-isotropic) andhigh luminosity/low space density (Galactic plane) populationsrespectively.
As in Strong (2007) we use standard Monte Carlo techniquesto sample ρ(Lγ ,R, z) throughout the Galaxy. using oversam-pling to reduce statistical fluctuations if necessary. In these sim-ulations we did not vary the source spectra because we did notconsider spectral information in source detection, only the flux>10 GeV. We use the sources generated from such simulationsto form simulated catalogs extending below the 1FHL flux limitand compare the flux distributions with the observations.
Our reference model for the luminosity function has ρ� =3 kpc−3, and Lγ
−1.5 dependence on luminosity in the range1034–1037 photons s−1 above 10 GeV. The luminosity law isdiscussed in Strong (2007); the exact form is not critical and willnot be further addressed here. The distribution in Galactocentricdistance is based on the model of Lorimer et al. (2006) forthe distribution of pulsars, taken as representative of Galacticsources. We adopt an exponential scale height of 500 pc; thesource count distribution N (Sγ ) depends only weakly on the
101 Standard proof for uniform space density: for number n(< R) withindistance R with luminosity L, S ∝ L/R2, N (S) = dn/dS =dn/dR × dR/dS = S−3/2dn/dR; three-dimensional volume:n ∝ R3, dn/dR ∝ R2 ∝ S−1 → N (S) ∝ S−5/2; two-dimensional disk:n ∝ R2, dn/dR ∝ R ∝ S−1/2 → N (S) ∝ S−2. Integrating over a luminosityfunction ρ(L) does not affect the dependence on S; hence the shape isindependent of ρ(L). This is valid when boundaries do not influence N (S). Atlower Sγ , both the luminosity function and the spatial boundaries influenceN (Sγ ). For a boundary at Rmax, there will be a cutoff in N (S) belowS = Lmin/4πR2
max, where Lmin is the minimum luminosity contributing toρ(L).
30
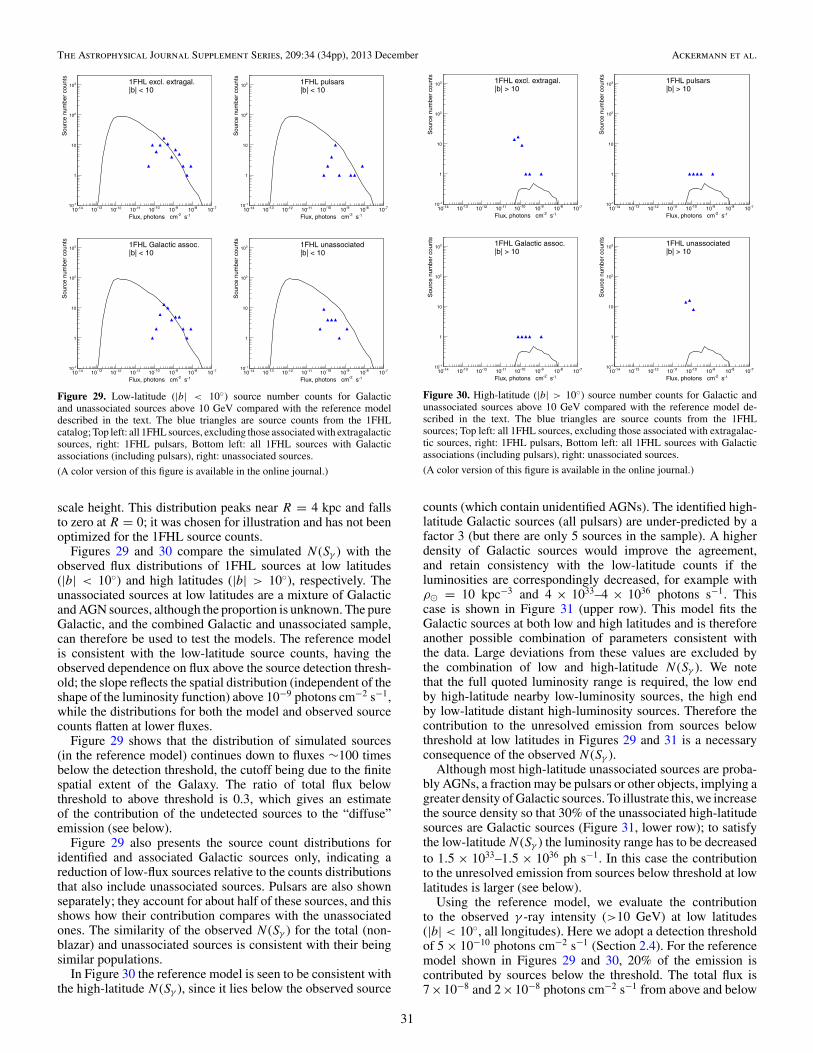
The Astrophysical Journal Supplement Series, 209:34 (34pp), 2013 December Ackermann et al.
-1 s-2Flux, photons cm
1FHL excl. extragal.|b| < 10
-1410 -1310 -1210 -1110 -1010 -910 -810 -710
Sou
rce
num
ber
coun
ts
-110
1
10
210
310
-1 s-2Flux, photons cm
-1410
1FHL pulsars|b| < 10
-1310 -1210 -1110 -1010 -910 -810 -710
Sou
rce
num
ber
coun
ts
-110
1
10
210
310
-1 s-2Flux, photons cm
-1410
1FHL Galactic assoc.|b| < 10
-1310 -1210 -1110 -1010 -910 -810 -710
Sou
rce
num
ber
coun
ts
-110
1
10
210
310
-1 s-2Flux, photons cm
-1410
1FHL unassociated|b| < 10
-1310 -1210 -1110 -1010 -910 -810 -710
Sou
rce
num
ber
coun
ts
-110
1
10
210
310
Figure 29. Low-latitude (|b| < 10◦) source number counts for Galacticand unassociated sources above 10 GeV compared with the reference modeldescribed in the text. The blue triangles are source counts from the 1FHLcatalog; Top left: all 1FHL sources, excluding those associated with extragalacticsources, right: 1FHL pulsars, Bottom left: all 1FHL sources with Galacticassociations (including pulsars), right: unassociated sources.
(A color version of this figure is available in the online journal.)
scale height. This distribution peaks near R = 4 kpc and fallsto zero at R = 0; it was chosen for illustration and has not beenoptimized for the 1FHL source counts.
Figures 29 and 30 compare the simulated N (Sγ ) with theobserved flux distributions of 1FHL sources at low latitudes(|b| < 10◦) and high latitudes (|b| > 10◦), respectively. Theunassociated sources at low latitudes are a mixture of Galacticand AGN sources, although the proportion is unknown. The pureGalactic, and the combined Galactic and unassociated sample,can therefore be used to test the models. The reference modelis consistent with the low-latitude source counts, having theobserved dependence on flux above the source detection thresh-old; the slope reflects the spatial distribution (independent of theshape of the luminosity function) above 10−9 photons cm−2 s−1,while the distributions for both the model and observed sourcecounts flatten at lower fluxes.
Figure 29 shows that the distribution of simulated sources(in the reference model) continues down to fluxes ∼100 timesbelow the detection threshold, the cutoff being due to the finitespatial extent of the Galaxy. The ratio of total flux belowthreshold to above threshold is 0.3, which gives an estimateof the contribution of the undetected sources to the “diffuse”emission (see below).
Figure 29 also presents the source count distributions foridentified and associated Galactic sources only, indicating areduction of low-flux sources relative to the counts distributionsthat also include unassociated sources. Pulsars are also shownseparately; they account for about half of these sources, and thisshows how their contribution compares with the unassociatedones. The similarity of the observed N (Sγ ) for the total (non-blazar) and unassociated sources is consistent with their beingsimilar populations.
In Figure 30 the reference model is seen to be consistent withthe high-latitude N (Sγ ), since it lies below the observed source
-1 s-2Flux, photons cm
-1410
1FHL excl. extragal.|b| > 10
-1310 -1210 -1110 -1010 -910 -810 -710
Sou
rce
num
ber
coun
ts
-110
1
10
210
310
-1 s-2Flux, photons cm
-1410
1FHL pulsars|b| > 10
-1310 -1210 -1110 -1010 -910 -810 -710
Sou
rce
num
ber
coun
ts
-110
1
10
210
310
-1 s-2Flux, photons cm
-1410
1FHL Galactic assoc.|b| > 10
-1310 -1210 -1110 -1010 -910 -810 -710
Sou
rce
num
ber
coun
ts
-110
1
10
210
310
-1 s-2Flux, photons cm
-1410
1FHL unassociated|b| > 10
-1310 -1210 -1110 -1010 -910 -810 -710
Sou
rce
num
ber
coun
ts
-110
1
10
210
310
Figure 30. High-latitude (|b| > 10◦) source number counts for Galactic andunassociated sources above 10 GeV compared with the reference model de-scribed in the text. The blue triangles are source counts from the 1FHLsources; Top left: all 1FHL sources, excluding those associated with extragalac-tic sources, right: 1FHL pulsars, Bottom left: all 1FHL sources with Galacticassociations (including pulsars), right: unassociated sources.
(A color version of this figure is available in the online journal.)
counts (which contain unidentified AGNs). The identified high-latitude Galactic sources (all pulsars) are under-predicted by afactor 3 (but there are only 5 sources in the sample). A higherdensity of Galactic sources would improve the agreement,and retain consistency with the low-latitude counts if theluminosities are correspondingly decreased, for example withρ� = 10 kpc−3 and 4 × 1033–4 × 1036 photons s−1. Thiscase is shown in Figure 31 (upper row). This model fits theGalactic sources at both low and high latitudes and is thereforeanother possible combination of parameters consistent withthe data. Large deviations from these values are excluded bythe combination of low and high-latitude N (Sγ ). We notethat the full quoted luminosity range is required, the low endby high-latitude nearby low-luminosity sources, the high endby low-latitude distant high-luminosity sources. Therefore thecontribution to the unresolved emission from sources belowthreshold at low latitudes in Figures 29 and 31 is a necessaryconsequence of the observed N (Sγ ).
Although most high-latitude unassociated sources are proba-bly AGNs, a fraction may be pulsars or other objects, implying agreater density of Galactic sources. To illustrate this, we increasethe source density so that 30% of the unassociated high-latitudesources are Galactic sources (Figure 31, lower row); to satisfythe low-latitude N (Sγ ) the luminosity range has to be decreasedto 1.5 × 1033–1.5 × 1036 ph s−1. In this case the contributionto the unresolved emission from sources below threshold at lowlatitudes is larger (see below).
Using the reference model, we evaluate the contributionto the observed γ -ray intensity (>10 GeV) at low latitudes(|b| < 10◦, all longitudes). Here we adopt a detection thresholdof 5 × 10⁻¹⁰ photons cm−2 s−1 (Section 2.4). For the referencemodel shown in Figures 29 and 30, 20% of the emission iscontributed by sources below the threshold. The total flux is7×10−8 and 2×10⁻⁸ photons cm−2 s−1 from above and below
31

The Astrophysical Journal Supplement Series, 209:34 (34pp), 2013 December Ackermann et al.
-1 s-2Flux, photons cm
-1410
1FHL excl. extragal.|b| < 10, alt. model 1
-1310 -1210 -1110 -1010 -910 -810 -710
Sou
rce
num
ber
coun
ts
-110
1
10
210
310
-1 s-2Flux, photons cm
-1410
1FHL pulsars|b| > 10, alt. model 1
-1310 -1210 -1110 -1010 -910 -810 -710
Sou
rce
num
ber
coun
ts
-110
1
10
210
310
-1 s-2Flux, photons cm
-1410
1FHL excl. extragal.|b| < 10, alt. model 2
-1310 -1210 -1110 -1010 -910 -810 -710
Sou
rce
num
ber
coun
ts
-110
1
10
210
310
-1 s-2Flux, photons cm
-1410
1FHL excl. extragal.|b| > 10, alt. model 2
-1310 -1210 -1110 -1010 -910 -810 -710
Sou
rce
num
ber
coun
ts
-110
1
10
210
310
Figure 31. Source number counts for sources above 10 GeV at low and high latitudes, compared with modified models for the luminosity function. For the upper rowthe local source density has been increased to ρ� = 10 kpc−3, and γ -ray luminosity range decreased to 4 × 1033–4 × 1036 photons s−1 above 10 GeV (labeled asalternative model 1). For the lower row ρ� = 30 kpc−3 and the luminosity range is 1.5 × 1033–1.5 × 1036 photons s−1, for the same γ -ray luminosity law Lγ
−1.5
and spatial distribution as the reference model (labeled as alternative model 2). The blue triangles are derived from the 1FHL data; Upper left: |b| < 10◦, all 1FHLsources, excluding those associated with extragalactic sources, right: |b| > 10◦, 1FHL pulsars, Lower left: |b| < 10◦, all 1FHL sources, excluding those associatedwith extragalactic sources, right: |b| > 10◦, all 1FHL sources, excluding those associated with extragalactic sources.
(A color version of this figure is available in the online journal.)
this threshold, respectively. The total “diffuse” flux observed byFermi-LAT from this region is ∼8 × 10⁻⁷ photons cm−2 s−1
(Ackermann et al. 2012a). Hence about 2.5% of the Galactic“diffuse” emission is from undetected sources. For the “higherdensity” model shown in Figure 31 (upper row), 30% ofthe emission is contributed by sources below the threshold,increasing to ∼4% the fraction of “diffuse” emission fromundetected sources. For the “maximum density” model shownin Figure 31 (lower row), 50% of the emission is contributed bysources below the threshold, and the contribution of unresolvedsources to the overall Galactic “diffuse” emission is ∼8%. Theseresults are similar to previous estimates at lower energies (Strong2007), but this is the first time a value for >10 GeV has beenderived.
A similar approach to using source counts to constrain thepulsar contribution to the inner Galaxy emission has been givenby Hooper et al. (2013), concluding that pulsars cannot accountfor the GeV excess. A study of the MSP contribution to the
Galactic emission, for energies above 100 MeV, has been givenby Gregoire & Knodlseder (2011, 2013); the contribution is atthe few percent level.
Finally we consider the global picture. The total luminosityof the source population >10 GeV based on the reference modelis 2.6 × 1038 photons s−1 or about 4 × 1036 erg s−1 comparedto the total luminosity of the Galaxy from interstellar emissionin this range: 3 × 1039 photons s−1 or 5 × 1037 erg s−1 (Stronget al. 2010). Point sources, resolved or not, therefore contributeat the several percent level to the total luminosity of the Galaxy,with a correspondingly larger contribution for the higher-densitymodels.
7. DISCUSSION AND CONCLUSIONS
The first Fermi LAT catalog of sources above 10 GeVis a catalog of the highest-energy LAT sources. With itsfocus on high-energy data, the 1FHL explores how the γ -ray
32

The Astrophysical Journal Supplement Series, 209:34 (34pp), 2013 December Ackermann et al.
universe evolves between the 2FGL catalog (which is dominatedby emission between 100 MeV and 10 GeV) and the VHEsources detected with ground-based γ -ray instruments (whichare dominated by emission from 100 GeV and up).
The 1FHL catalog contains 514 sources. Because of the steep-ness of the source count distribution N (S), and the relativelylow intensity of diffuse backgrounds (Galactic, extragalacticisotropic, and residual cosmic rays) at >10 GeV, which makesource detection (TS > 25) possible with only a few γ -rays, alarge number of the >10 GeV sources are detected close to thethreshold, and the median number of γ rays per source is 13.This very low photon count limits the possibilities for detailedspectral and variability analyses. We have provided only power-law spectral fits, and applied the Bayesian Block (Scargle 1998)algorithm to study variability without pre-defined temporal bins.Our analysis treated 22 sources as spatially extended, becausethey have been resolved in previous LAT analyses, typically atlower energies. For these sources, we adopted their extents asmeasured in the previous works.
We studied potential associations between 1FHL sourcesand counterparts at other wavelengths. Approximately 75%have likely associations with AGNs. Galactic sources (pulsars,PWNs, SNRs, high-mass binaries, and star-forming regions)collectively represent 10% of the sources. The fraction ofunassociated sources is only 13%. Among the 27 associationswith known pulsars, we find 20 with significant pulsations above10 GeV, and 12 with pulsations above 25 GeV, suggesting thatthe Crab pulsar will not remain the only pulsar to be detectedby current and future IACTs.
We detected variability for 43 1FHL sources, all belonging tothe blazar class. We found that the most variable of these belongto the SED class LSP, which in some cases have very bright(�10×) and very short (∼1 day) flaring episodes. This resultis remarkable because HSP sources (rather than LSP) typicallyhave the largest numbers of detected γ -rays above 10 GeV.The implication is that the falling segment of the high-energy(presumably inverse-Compton) bump is more variable than therising segment. This result is consistent with the trend reportedat lower energies (>100 MeV) by Ackermann et al. (2011b).
Based on the 84 associations between 1FHL sources andknown VHE sources, we developed criteria to select othersources that are likely to be detectable with ground-based γ -rayinstruments. Of the 1FHL sources not already detected in theVHE range, we flagged 212 as good candidates based on theiraverage properties for the 3 yr time range of the analysis.
Using the source counts for blazars we estimate that 27% ±8% of the IGRB for energies >10 GeV can be attributed toblazars. This contribution to the IGRB in the range >10 GeVis well above the lower limit of Abdo et al. (2010p); themeasurement was enabled by the greater sensitivity here; the3 yr N (S) samples a factor ∼2 weaker fluxes than the 11-monthN (S). Since the N (S) does not show any flattening at the lowestmeasured fluxes, the contribution from blazars may be evenlarger. Fermi might survey the sky for 10 yr or more, potentiallyproviding a further improvement in the >10 GeV sensitivity ofthe same magnitude (a factor ∼2) as that provided in this workwith respect to the 11 months of survey data analyzed by Abdoet al. (2010p). Fermi LAT ultimately could be able to directlyresolve >40% of the IGRB intensity above 10 GeV.
The source count distributions for sources in the MilkyWay (i.e., those with associations with Galactic source classes)and more generally for sources without extragalactic associa-tions, can be well modeled with a power-law luminosity func-
tion for sources with characteristic luminosities in the range1034–1037 ph s−1 above 10 GeV and a distribution in Galac-tocentric distance based on the pulsar distribution of Lorimeret al. (2006) and a scale height of 500 pc. From the models, weestimate that ∼5% of the luminosity of the Milky Way above10 GeV can be attributed to unresolved γ -ray point sources.
The Fermi LAT Collaboration acknowledges generous ongo-ing support from a number of agencies and institutes that havesupported both the development and the operation of the LAT aswell as scientific data analysis. These include the National Aero-nautics and Space Administration and the Department of Energyin the United States; the Commissariat a l’Energie Atomique andthe Centre National de la Recherche Scientifique/Institut Na-tional de Physique Nucleaire et de Physique des Particules inFrance; the Agenzia Spaziale Italiana and the Istituto Nazionaledi Fisica Nucleare in Italy; the Ministry of Education, Culture,Sports, Science, and Technology (MEXT), High Energy Accel-erator Research Organization (KEK), and Japan Aerospace Ex-ploration Agency (JAXA) in Japan; and the K. A. WallenbergFoundation, the Swedish Research Council, and the SwedishNational Space Board in Sweden.
Additional support for science analysis during the operationsphase is gratefully acknowledged from the Istituto Nazionale diAstrofisica in Italy and the Centre National d’Etudes Spatialesin France.
M. Ajello acknowledges support from NASA grantNNH09ZDA001N for the study of the origin of the IsotropicGamma-ray Background. D. Paneque acknowledges sup-port from NASA grant NNX10AP21G for the study of thehighest-energy LAT sources.
Facility: Fermi (LAT)
REFERENCES
Abdo, A. A., Ackermann, M., Agudo, I., et al. 2010a, ApJ, 716, 30Abdo, A. A., Ackermann, M., Ajello, M., et al. 2009a, Sci, 325, 848Abdo, A. A., Ackermann, M., Ajello, M., et al. 2009b, Sci, 325, 840Abdo, A. A., Ackermann, M., Ajello, M., et al. 2009c, ApJL, 699, L102Abdo, A. A., Ackermann, M., Ajello, M., et al. 2009d, ApJ, 706, 1331Abdo, A. A., Ackermann, M., Ajello, M., et al. 2009e, ApJL, 706, L1Abdo, A. A., Ackermann, M., Ajello, M., et al. 2009f, ApJ, 700, 1059Abdo, A. A., Ackermann, M., Ajello, M., et al. 2010b, ApJ, 714, 927Abdo, A. A., Ackermann, M., Ajello, M., et al. 2010c, A&A, 523, A46Abdo, A. A., Ackermann, M., Ajello, M., et al. 2010d, Sci, 328, 725Abdo, A. A., Ackermann, M., Ajello, M., et al. 2010e, ApJS, 188, 405Abdo, A. A., Ackermann, M., Ajello, M., et al. 2010f, ApJ, 712, 1209Abdo, A. A., Ackermann, M., Ajello, M., et al. 2010g, ApJ, 708, 1254Abdo, A. A., Ackermann, M., Ajello, M., et al. 2010h, ApJ, 718, 348Abdo, A. A., Ackermann, M., Ajello, M., et al. 2010i, ApJ, 713, 146Abdo, A. A., Ackermann, M., Ajello, M., et al. 2010j, ApJ, 720, 272Abdo, A. A., Ackermann, M., Ajello, M., et al. 2010k, Sci, 327, 1103Abdo, A. A., Ackermann, M., Ajello, M., et al. 2010l, ApJ, 712, 459Abdo, A. A., Ackermann, M., Ajello, M., et al. 2010m, A&A, 512, A7Abdo, A. A., Ackermann, M., Ajello, M., et al. 2010n, ApJ, 711, 64Abdo, A. A., Ackermann, M., Ajello, M., et al. 2010o, PRL, 104, 101101Abdo, A. A., Ackermann, M., Ajello, M., et al. 2010p, ApJ, 720, 435Abdo, A. A., Ackermann, M., Ajello, M., et al. 2010q, ApJ, 713, 154Abdo, A. A., Ackermann, M., Ajello, M., et al. 2011a, ApJL, 733, L26Abdo, A. A., Ackermann, M., Ajello, M., et al. 2011b, ApJ, 726, 43Abdo, A. A., Ackermann, M., Ajello, M., et al. 2011c, ApJ, 734, 28Abdo, A. A., Ackermann, M., Atwood, W. B., et al. 2008, Sci, 322, 1218Abdo, A. A., Ackermann, M., Atwood, W. B., et al. 2009g, ApJL, 695, L72Abdo, A. A., Ackermann, M., Atwood, W. B., et al. 2009h, ApJ, 696, 1084Abdo, A. A., Ajello, M., Allafort, A., et al. 2013, ApJS, 208, 17Abdo, A. A., Ajello, M., Antolini, E., et al. 2010r, ApJ, 720, 26Abdo, A. A., Allen, B. T., Aune, T., et al. 2009i, ApJL, 700, L127Abramowski, A., Acero, F., Aharonian, F., et al. 2012, ApJ, 746, 151
33

The Astrophysical Journal Supplement Series, 209:34 (34pp), 2013 December Ackermann et al.
Acciari, V. A., Aliu, E., Arlen, T., et al. 2009, ApJL, 703, L6Acero, F., Ackermann, M., Ajello, M., et al. 2013, ApJ, 773, 77Ackermann, M., Ajello, M., Allafort, A., et al. 2011a, Sci, 334, 1103Ackermann, M., Ajello, M., Allafort, A., et al. 2011b, ApJ, 743, 171Ackermann, M., Ajello, M., Atwood, W. B., et al. 2012a, ApJ, 750, 3Ackermann, M., Ajello, M., Albert, A., et al. 2012b, ApJS, 203, 4Ackermann, M., Ajello, M., Baldini, L., et al. 2010, ApJ, 721, 1383Ackermann, M., Ajello, M., Baldini, L., et al. 2011c, ApJ, 726, 35Aharonian, F., Akhperjanian, A. G., Anton, G., et al. 2009, ApJL, 695, L40Ajello, M., Allafort, A., Baldini, L., et al. 2012a, ApJ, 744, 80Ajello, M., Shaw, M. S., Romani, R. W., et al. 2012b, ApJ, 751, 108Aleksic, J., Alvarez, E. A., Antonelli, L. A., et al. 2012a, A&A, 539, L2Aleksic, J., Alvarez, E. A., Antonelli, L. A., et al. 2012b, A&A, 540, A69Aleksic, J., Antonelli, L. A., Antoranz, P., et al. 2010, ApJ, 725, 1629Aleksic, J., Antonelli, L. A., Antoranz, P., et al. 2011, ApJL, 730, L8Aliu, E. 2011, in ICRC, 7, 227Aliu, E., Anderhub, H., Antonelli, L. A., et al. 2008, Sci, 322, 1221Aliu, E., Archambault, S., Arlen, T., et al. 2013, ApJ, 764, 38Atkins, R., Benbow, W., Berley, D., et al. 2004, ApJ, 608, 680Atwood, W. B., Abdo, A. A., Ackermann, M., et al. 2009, ApJ, 697, 1071Bernlohr, K., Barnacka, A., Becherini, Y., et al. 2013, APh, 43, 171Bulgarelli, A., Gianotti, F., Trifoglio, M., et al. 2010, ATel, 2641, 1Camilo, F., Ray, P. S., Ransom, S. M., et al. 2009, ApJ, 705, 1Campana, R., Massaro, E., Gasparrini, D., Cutini, S., & Tramacere, A.
2008, MNRAS, 383, 1166Casandjian, J.-M., & Grenier, I. A. 2008, A&A, 489, 849Ciprini, S., Tosti, G., Marcucci, F., et al. 2007, in AIP Conf. Ser. 921, The First
GLAST Symposium, ed. S. Ritz, P. Michelson, & C. A. Meegan (Melville,NY: AIP), 546
Cognard, I., Guillemot, L., Johnson, T. J., et al. 2011, ApJ, 732, 47Condon, J. J., Cotton, W. D., Greisen, E. W., et al. 1998, AJ, 115, 1693Cortina, J. 2013a, ATel, 5080, 1Cortina, J. 2013b, ATel, 5038, 1Damiani, F., Maggio, A., Micela, G., & Sciortino, S. 1997, ApJ, 483, 350de Jager, O. C., Raubenheimer, B. C., & Swanepoel, J. W. H. 1989, A&A,
221, 180de Ruiter, H. R., Arp, H. C., & Willis, A. G. 1977, A&AS, 28, 211Donato, D. 2010, ATel, 2584, 1Eddington, A. S. 1913, MNRAS, 73, 359Eddington, A. S., Sir 1940, MNRAS, 100, 354Galante, N. 2011, in ICRC, 8, 62Gregoire, T., & Knodlseder, J. 2011, in AIP Conf. Proc. 1357, Radio Pulsars:
an Astrophysical Key to Unlock the Secrets of the Universe, ed. M. Burgay,N. D’Amico, P. Esposito, A. Pellizzoni, & A. Possenti (Melville, NY: AIP),197
Gregoire, T., & Knodlseder, J. 2013, A&A, 554, A62Grondin, M.-H., Funk, S., Lemoine-Goumard, M., et al. 2011, ApJ, 738, 42Guillemot, L., Freire, P. C. C., Cognard, I., et al. 2012, MNRAS, 422, 1294Hadasch, D., Torres, D. F., Tanaka, T., et al. 2012, ApJ, 749, 54Halpern, J. P., Camilo, F., Giuliani, A., et al. 2008, ApJL, 688, L33Hartman, R. C., Bertsch, D. L., Bloom, S. D., et al. 1999, ApJS, 123, 79Helene, O. 1983, NIMPR, 212, 319Hinton, J. A. 2004, NewAR, 48, 331Hooper, D., Cholis, I., Linden, T., Siegal-Gaskins, J., & Slatyer, T. 2013, PhRvD,
88, 083009
Iafrate, G., Longo, F., & D’Ammando, F. 2010, ATel, 2687, 1Jackson, B., Scargle, J. D., Barnes, D., et al. 2005, ISPL, 12, 105Kadler, M., Eisenacher, D., Ros, E., et al. 2012, A&A, 538, L1Katagiri, H., Tibaldo, L., Ballet, J., et al. 2011, ApJ, 741, 44Kataoka, J., Stawarz, Ł., Cheung, C. C., et al. 2010, ApJ, 715, 554Katsuta, J., Uchiyama, Y., Tanaka, T., et al. 2012, ApJ, 752, 135Kerr, M. 2010, PhD thesis, Univ. WashingtonKerr, M., Camilo, F., Johnson, T. J., et al. 2012, ApJL, 748, L2Klepser, S. 2011, in ICRC, 7, 172Lamb, R. C., & Macomb, D. J. 1997, ApJ, 488, 872Lande, J., Ackermann, M., Allafort, A., et al. 2012, ApJ, 756, 5Lorenz, E. 2004, NewAR, 48, 339Lorimer, D. R., Faulkner, A. J., Lyne, A. G., et al. 2006, MNRAS, 372, 777Mariotti, M. 2010, ATel, 2684, 1Mariotti, M. 2011, ATel, 3100, 1Massardi, M., Ekers, R. D., Murphy, T., et al. 2011, MNRAS, 412, 318Massaro, E., Giommi, P., Leto, C., et al. 2009, A&A, 495, 691Mauch, T., Murphy, T., Buttery, H. J., et al. 2003, MNRAS, 342, 1117Murphy, T., Sadler, E. M., Ekers, R. D., et al. 2010, MNRAS, 402, 2403Neronov, A., & Semikoz, D. V. 2010, arXiv:1011.0210Neronov, A., Semikoz, D., & Vovk, I. 2011, A&A, 529, A59Nolan, P. L., Abdo, A. A., Ackermann, M., et al. 2012, ApJS, 199, 31Ong, R. A. 2010, ATel, 2443, 1Planck Collaboration, Ade, P. A. R., Aghanim, N., et al. 2011, A&A, 536, A7Pletsch, H. J., Guillemot, L., Allen, B., et al. 2012a, ApJ, 744, 105Pletsch, H. J., Guillemot, L., Allen, B., et al. 2012b, ApJL, 755, L20Ransom, S. M., Ray, P. S., Camilo, F., et al. 2011, ApJL, 727, L16Sanchez, D., & Escande, L. 2010, ATel, 3041, 1Saz Parkinson, P. M., Dormody, M., Ziegler, M., et al. 2010, ApJ, 725, 571Scargle, J. D. 1998, ApJ, 504, 405Scargle, J. D., Norris, J. P., Jackson, B., & Chiang, J. 2013, ApJ, 764, 167Shaw, M. S., Romani, R. W., Cotter, G., et al. 2013, ApJ, 764, 135Sokolovksy, K. V., Schinzel, F. K., Tanaka, Y. T., et al. 2013, A&A, submittedStarck, J.-L., & Pierre, M. 1998, A&AS, 128, 397Striani, E., Vercellone, S., Lucarelli, F., et al. 2010a, ATel, 3043, 1Striani, E., Verrecchia, F., Donnarumma, I., et al. 2010b, ATel, 2686, 1Strong, A. W. 2007, Ap&SS, 309, 35Strong, A. W., Porter, T. A., Digel, S. W., et al. 2010, ApJL, 722, L58Su, M., Slatyer, T. R., & Finkbeiner, D. P. 2010, ApJ, 724, 1044Sun, S., Paneque, D., Steinke, B., Galante, N., & Fortson, L. 2012, in 5th
International Symposium on High-Energy Gamma-Ray AstronomySutherland, W., & Saunders, W. 1992, MNRAS, 259, 413Swordy, S. 2008, ATel, 1753, 1Tanaka, T., Allafort, A., Ballet, J., et al. 2011, ApJL, 740, L51The MAGIC Collaboration, Aleksic, J., Antonelli, L. A., et al. 2013,
arXiv:1305.5147Thompson, D. J., Bertsch, D. L., & O’Neal, R. H., Jr. 2005, ApJS, 157, 324VERITAS Collaboration, Aliu, E., Arlen, T., et al. 2011, Sci, 334, 69Veron-Cetty, M.-P., & Veron, P. 2010, A&A, 518, A10Voges, W., Aschenbach, B., Boller, T., et al. 1999, A&A, 349, 389Weekes, T. C., Badran, H., Biller, S. D., et al. 2002, APh, 17, 221Weltevrede, P., Abdo, A. A., Ackermann, M., et al. 2010, ApJ, 708, 1426Wills, K. A., Morganti, R., Tadhunter, C. N., Robinson, T. G., & Villar-Martin,
M. 2004, MNRAS, 347, 771Wright, A. E., Griffith, M. R., Hunt, A. J., et al. 1996, ApJS, 103, 145
34