NEW RISKS, OLD WELFARE Japanese university students, work-related anxieties and sources of support
Upload
khangminh22Category
view
0download
0
University of Tennessee, Knoxville University of Tennessee, Knoxville
TRACE: Tennessee Research and Creative TRACE: Tennessee Research and Creative
Exchange Exchange
Masters Theses Graduate School
8-2014
Protein-related Knowledge, Perceptions, Sources of Information, Protein-related Knowledge, Perceptions, Sources of Information,
and Behaviors Among College-Age Males and Behaviors Among College-Age Males
Amy Leigh Sparks University of Tennessee - Knoxville, [email protected]
Follow this and additional works at: https://trace.tennessee.edu/utk_gradthes
Recommended Citation Recommended Citation Sparks, Amy Leigh, "Protein-related Knowledge, Perceptions, Sources of Information, and Behaviors Among College-Age Males. " Master's Thesis, University of Tennessee, 2014. https://trace.tennessee.edu/utk_gradthes/2879
This Thesis is brought to you for free and open access by the Graduate School at TRACE: Tennessee Research and Creative Exchange. It has been accepted for inclusion in Masters Theses by an authorized administrator of TRACE: Tennessee Research and Creative Exchange. For more information, please contact [email protected].
To the Graduate Council:
I am submitting herewith a thesis written by Amy Leigh Sparks entitled "Protein-related
Knowledge, Perceptions, Sources of Information, and Behaviors Among College-Age Males." I
have examined the final electronic copy of this thesis for form and content and recommend that
it be accepted in partial fulfillment of the requirements for the degree of Master of Science, with
a major in Nutrition.
Sarah E. Colby, Major Professor
We have read this thesis and recommend its acceptance:
Katie Kavanagh, Melissa Hansen-Petrik
Accepted for the Council:
Carolyn R. Hodges
Vice Provost and Dean of the Graduate School
(Original signatures are on file with official student records.)
Protein-related Knowledge, Perceptions, Sources of Information, and Behaviors Among College-Age Males
A Thesis Presented for the Master of Science
Degree The University of Tennessee, Knoxville
Amy Leigh Sparks August 2014
ii
ACKNOWLEDGEMENTS
I would like to thank Dr. Sarah Colby for the tremendous amount of time, support, and
help she has given me over the course of this project. I would also like to thank my
committee members, Dr. Katie Kavanagh, and Dr. Melissa Hansen-Petrik for the
guidance, and all of my participants for making this project possible.
iii
ABSTRACT
The objective of this study was to describe thoughts, knowledge, and dietary
practices with regard to protein, and how these factors related to current
recommendations among college-age males. A convenience sample of non-athlete
college-age males (n=47), ages 18-24 years, completed 7 day dietary records (analyzed
using NDSR), accelerometer assessments, anthropometric assessments (height, weight,
waist circumference, and Bod Pod), and a brief semi-structured interview on protein
knowledge and behaviors.
Participants were grouped according to protein intake with 15% consuming less
than 0.8 grams of protein per kilogram of body weight per day (g/kg/d), 70% consuming
0.8-1.99 g/kg/d, and 15% consuming ≥2 g/kg/d. Overall, 98% fell within the acceptable
macronutrient distribution range of protein. Food sources of protein included chicken
and a variety of other meats. Participants were involved in an average of 122.57 ± 116.31
minutes of physical activity per week. Primary sources of information about protein
included the internet, specifically body building websites, and, word of mouth. Twenty-
five percent of the sample thought they needed “at least one gram of protein per pound”
of body weight. The other 75% of the population did not mention a specific amount of
protein they thought they should be consuming.
Based on data from this research study, non-athlete college-age males were
largely misinformed on protein needs and received their information from unreliable
sources including word of mouth and the internet. Contradictions were found between
two primary recommendations for protein intake (acceptable macronutrient distribution
range versus the Recommended Dietary Allowance). For some of the participants,
iv
whether they were found to be consuming appropriate amounts of protein differed by
which recommendation system was used in analysis. These conflicting recommendations
could result in confusion between professionals and individuals in interpreting protein
needs and adequacy.
v
TABLE OF CONTENTS
CHAPTER I Literature Review ............................................................................... 1
Protein recommendations ............................................................................ 2
Physical activity and the body’s need for protein ....................................... 3
Established adverse effects of excessive protein intake .............................. 3
College-aged male athletes’ knowledge and beliefs about nutrition ........... 4
Protein supplements and prevalence of use ................................................. 6
Research gaps and purpose of current study ............................................... 7
CHAPTER II Manuscript ........................................................................................ 9
Abstract ..................................................................................................... 10
Introduction .............................................................................................. 11
Methods .................................................................................................... 12
Recruitment .................................................................................. 12
1st session ...................................................................................... 13
2nd session ..................................................................................... 14
3rd session ...................................................................................... 14
NDSR and physical activity analysis ........................................... 14
Interview analysis .......................................................................... 15
Results ...................................................................................................... 15
Discussion .................................................................................................. 19
Other dietary components .............................................................. 19
Sources of information ................................................................. 19
Activity level ................................................................................. 19
vi
Body composition .......................................................................... 21
Conclusions and recommendations ........................................................... 22
CHAPTER III Extended Methods ......................................................................... 24
LIST OF REFERENCES ...................................................................................... 33
APPENDICES ...................................................................................................... 39
Appendix A: Project benefits .................................................................... 40
Appendix B: Anthropometrics sheet ......................................................... 41
Appendix C: Food record instructions ...................................................... 42
Appendix D: Diet record sheet .................................................................. 43
Appendix E: Interview questions and prompts ......................................... 44
Appendix F: Sample training interview 1 ................................................. 45
Appendix G: Sample training interview 2 ................................................. 46
Appendix H: Code book ............................................................................ 47
Appendix I: Sample emails ....................................................................... 52
Appendix J: Portion guide handout ........................................................... 53
VITA ...................................................................................................................... 54
vii
LIST OF TABLES
Table 1. Describing college males by protein consumption group among factors associated with anthropometrics, dietary consumption and physical activity…………………………………………………..……………………………..16
Table 2. Thoughts, perceptions, and sources of information by protein consumption (g/kg/d) group (n=47)………...………………………………………………………………………...18

1
CHAPTER I LITERATURE REVIEW
2
Protein recommendations
Almost 60% of body protein is located in the skeletal muscles [1]. The liver,
which synthesizes plasma proteins and pancreatic digestive enzymes also contains protein
[1, 2]. Due to all of the organs and mechanisms that are affected by protein intake, it is
crucial for life. However, amounts of protein over the recommendation may not be safe
due to the potential for adverse long-term effects [3].
The recommended dietary allowance (RDA) for protein intake for adult men and
women is 0.8 g/kg per day [4]. The recommendations for physically-active individuals
are slightly higher, at 1.2-1.7 g/kg per day, with all recommended intakes below 2 g/kg
per day [4]. The acceptable macronutrient distribution range (AMDR) recommends 10-
35% of one’s calories to come from protein. More research is needed in order to better
define the upper range. Based on the American College of Sports Medicine, strength
training and endurance athlete protein recommendations range from 1.2 to 1.7 g/kg of
body weight per day [5]. Although these recommendations are higher than 0.8g/kg, they
can almost always be met through diet alone, without the use of a protein supplement [5].
The typical 19-30 year old American adult consumes an average of 1.0-1.5 g/kg/d, which
is above the recommended amount of 0.8 g/kg/d, but within the bounds of the AMDR [6].
Protein intakes two times the recommendation are unlikely to cause any adverse
effects [4]. However, very high intakes of protein, three to four times the
recommendation (2.4-3.2 g/kg/d) are likely to be associated with possible health risks
relating to kidney function [3]. Protein seems to be well tolerated when consumption
levels are as high as 35% of dietary energy [7]. Recommendations for tolerable amounts
3
of protein and amino acids suggest caution should be used when consuming levels
significantly higher than the levels which are found in normal foods [7].
Physical activity and the body’s need for protein
Physical activity increases the body’s need for protein [1]. Activity influences the
amino acids interchange and affects how available amino acids are for protein production
[4]. The body requires access to protein during states of high/vigorous physical activity
in order to repair and build tissue along with replenishing glycogen stores [5].
The liver and kidneys are the main sites of protein metabolism in the body [1].
When excess amounts of protein are consumed, the amino acids that are not needed for
the synthesis of protein and other nitrogenous compounds are unable to be stored or
excreted in in the form of amino acids. Therefore, excess amino acids are oxidized for
use as an energy source or converted to fat for storage. This occurs during amino acid
degradation, when most of the carbon skeleton is metabolized to pyruvate, acetyl-CoA or
one of the intermediates of the TCA cycle [1]. The rate of protein degradation is
dependent upon the level of physical activity for the muscle [1, 8]. Protein breakdown
and a decrease in the rate of synthesis also accompany physical activity or exercise[1].
Established adverse effects of excessive protein intake
There are numerous negative effects associated with high protein intake [9]. This
may be especially a concern with physically-active college-age males who may be more
likely to be consuming excessively high levels of protein on a regular basis. Various
research studies have found that high protein diets (those over 2 g/kg/d) can cause
changes in renal function [3, 9]. The main consequence associated with high protein
intake is effects on the kidneys, which could lead to end stage renal disease [10].
4
However much of this evidence is derived from populations who are generally already at
risk for kidney disease, for example, individuals with obesity, hypertension, dyslipidemia
or uncontrolled diabetes [9]. Therefore, additional research is necessary in order to
determine if high protein intake has an effect on healthy kidney function and to what
degree this occurs [3].
Although high protein intake has sometimes been shown to have adverse effects
on the kidneys, it has been found to negatively affect other health factors as well
including increasing the occurrence of calcium stones [11] and causing gastrointestinal
discomfort and muscle cramps [12].
College-aged male athletes’ knowledge and beliefs about nutrition
Many people do not have any understanding of the concepts associated with
protein intake or the amount of protein intake necessary for daily living [13]. This may
cause individuals to think they need to consume more than they need [14]. However,
previous research in the United States has found that unless individuals are rarely eating
protein, they are easily consuming minimum protein recommendations and do not need
extra protein from dietary sources or supplements [5].
Research has found college male athletes think they need more than twice the
RDA of 0.8g/kg and often over 2g/kg [14]. College-aged males, in general, have
inadequate knowledge pertaining to general nutrition and macronutrients including
protein and do not know how much protein they should consume per day [14].
Furthermore, due to the widely accepted assumption that high protein consumption leads
to increased muscle mass [14], college males may have accepted incorrect information
about protein and nutrition.
5
College athletes have been found to have more knowledge of nutrition than non-
athletes, however the level of this knowledge is less among males than females [15]. One
particular study by Froiland and colleagues focused on the nutritional knowledge of
college athletes [16]. This study’s methods included a survey for 115 college male
athletes about using nutritional supplements and where they obtained their information.
The survey included questions asking the participant to define “supplement”, and to
report supplement use and type, source of information and reasons for use [16].
Participants in this study were varsity athletes. They were encouraged to choose the
source where they obtained their information regarding supplements [16]. The top
answers were family members (32.4%), fellow athletes (31.9%), their personal strength
coach (28%), athletic trainer (30.0%), Registered Dietitian (28.5%), friend (28.5%), and
coach (28.0%). Fewer than 10% of the participants listed television or the Internet as a
source of information for supplements [16]. Within the results of the study by Froiland
and colleagues it is evident that athletes heavily rely on athletic services for nutrition
information. This raises concern for college-age males who are not varsity athletes
because the non-athletes are less likely to be seeking information from a Registered
Dietitian due to having less access than an athlete. Thus, college and professional
athletes may have more access to reliable nutrition information than physically active
college males who are non-collegiate athletes. Furthermore, physically-active college-
age males who do not play a sport are unlikely to be as educated about nutrition as
college athletes [17].
6
Protein supplementation and prevalence of use
There are over 30,000 protein supplements commercially available in the United
States [18]. Over three million people in the United States are either currently using or
have used a protein supplement [18]. Younger people are more likely to consume protein
supplements than older people [19].
Jacobson and colleagues reported that 79% of males reported using some sort of
protein supplement during college athletics [19]. Perkin and colleagues used a 15-
question survey, which was given to 1000 college students who were mostly (80%)
undergraduates, to explore if students are using protein supplements and what types are
being used [20]. Protein powder and/or amino acids were found to be among the top
used supplements among the college males. Researchers also found that (among students
that used supplements) students used an average of 2.7 different supplements [20].
Morrison and colleagues looked at a convenience sample of regular exercisers at a
commercial gym. The participants were given anonymous questionnaires asking if they
use supplements and if so what type [13]. A total of 84.7% took supplements. Of the
participants who reported using protein supplements, 42.3% consumed protein shakes or
protein bars at least five times per week [13]. In addition, most of these supplements were
protein and in the form of shakes because they were perceived by the participants to be
most effective in producing muscle mass [18]. It has also been shown that many
supplement consumers receive their information regarding protein from unqualified
sources like family and friends rather than from nutrition professionals [21].
With the large number of physically-active individuals consuming protein over
the RDA, and the potential risk of chronic kidney disease and other health issues, there is
7
a concern for potential harm and a need to further explore knowledge, practices, and
extent of potential for adverse effects [11]. Determining where physically-active college-
age males get their information regarding protein needs/products containing protein, and
determining their current protein intakes, may identify intervention points for reducing
the risk of undesired health effects.
Research gaps and purpose of the current study
Although there is some information about protein intake behavior, knowledge,
perceptions, and sources of information, there is very little information on college-age
males who do not play a varsity level sport [17]. At this time it is unclear whether
excessive protein intake causes serious health consequences and future research is needed
to elucidate the physiological effects [9]. The first research step necessary is to determine
current knowledge, beliefs and behaviors among college-age, non-athlete males. It
appears that college males’ protein consumption through dietary intake and supplements
is likely above that which is recommended by the RDA, but within AMDR
recommendations [1]. It is also probable that college students lack knowledge relating to
protein [18]. However, there are several gaps in the current literature relating to protein
consumption in college-age, non-athlete males. One gap is that previous research only
focused on the intake of protein supplements and not the overall protein consumption.
Another gap in the literature is that studies have only used athletes as participants. A
final gap is the lack of current research literature. In the past ten years there have not
been any research studies that looked at protein intake among college-age males.
The purpose of this research was to determine protein intake behavior (including
supplements and food sources), protein nutrition knowledge, perceptions about protein,

8
and sources of protein information among college-age males who were not athletes. This
study specifically sought to determine how much protein non-athlete college males
consumed on a daily basis (and from what sources) and where they got their information
on protein needs and products containing protein.

9
CHAPTER II Manuscript
10
Abstract
The objective of this study was to describe thoughts, knowledge, and dietary
practices with regard to protein, and how these factors related to current
recommendations among college-age males. A convenience sample of non-athlete
college-age males (n=47), ages 18-24 years, completed 7 day dietary records (analyzed
using NDSR), accelerometer assessments, anthropometric assessments (height, weight,
waist circumference, and Bod Pod), and a brief semi-structured interview on protein
knowledge and behaviors.
Participants were grouped according to protein intake with 15% consuming less
than 0.8 grams of protein per kilogram of body weight per day (g/kg/d), 70% consuming
0.8-1.99 g/kg/d, and 15% consuming ≥2 g/kg/d. Overall, 98% fell within the acceptable
macronutrient distribution range of 10-35% of calories coming from protein. Food
sources of protein included chicken and a variety of other meats. Participants were
involved in an average of 122.57 ± 116.31 minutes of physical activity per week.
Primary sources of information about protein included the internet, specifically body
building websites, and, word of mouth. Twenty-five percent of the sample thought they
needed “at least one gram of protein per pound” of body weight. The other 75% of the
population did not mention a specific amount of protein they thought they should be
consuming.
Based on data from this research study, non-athlete college-age males were
largely misinformed on protein needs and received their information from unreliable
sources including word of mouth and the internet. Contradictions were found between
two primary recommendations for protein intake (acceptable macronutrient distribution
11
range versus the Recommended Dietary Allowance). For some of the participants,
whether they were found to be consuming appropriate amounts of protein differed by
which recommendation system was used in analysis. These conflicting recommendations
could result in confusion between professionals and individuals in interpreting protein
needs and adequacy.
Introduction
The Recommended Dietary Allowance (RDA) for protein intake for adult men
and women is 0.8 g/kg per day [22]. The recommendations for physically-active
individuals are slightly higher than the general public. Protein recommendations for
strength training and endurance athletes range from 1.2 to 1.7 g/kg of body weight per
day with all recommendations ranging below 2 g/kg per day. The Acceptable
Macronutrient Distribution Range (AMDR) recommends 10-35% of one’s calories to
come from protein. These recommendations can almost always be met through diet
alone, without the use of protein supplements. The typical 19-30 year old American adult
consumes an average of 1.0-1.5 g/kg/day, which exceeds the RDA [6].
Although protein needs can almost always be met through dietary intake alone,
many individuals consume protein supplements [20]. There are over 30,000 protein
supplements commercially available in the United States [18]. Over three million people
in the United States are either currently using or have used a protein supplement [18] and
younger people are more likely to consume protein supplements than older people [19].
When protein supplements are used, individuals are likely to consume amounts in excess
of the RDA [20]. With intakes three to four times the RDA (2.4-3.2 g/kg/day), potential
adverse effects may occur including chronic kidney disease [9].
12
Research has found that many collegiate male athletes think that they need more
than 2g/kg/day of protein [14]. Collegiate athletes have been found to have more
knowledge of nutrition than non-athletes, however the level of this knowledge is less
among males than females [15]. In addition, many people in general do not know how
much protein they should consume per day [14]. Furthermore, due to the widely-
accepted belief that high protein consumption leads to increased muscle mass [16], many
people may have misconceptions about protein and recommended levels of protein intake
[16].
Although there is some information about protein intake behavior, knowledge,
perceptions, and sources of information [16], this information with college-age males
who do not play a varsity level sport is currently unknown and the research in this field
was conducted more than ten years ago. Another gap in the literature is that previous
research only focused on the intake of protein supplements and not the overall protein
consumption. It is important to determine protein intake behaviors among college-age
males because the dietary patterns and behaviors developed in young adulthood often
continue into adulthood [23]. The purpose of this research was to determine protein
intake behavior (including supplements and food sources), protein nutrition knowledge,
perceptions about protein, and sources of protein information among college-age males
who are not athletes.
Methods Recruitment and Eligibility
A convenience sample of males ages 18 to 24, not involved in a varsity level
sport, was recruited from the University of Tennessee Recreation Center, University of
13
Tennessee Library and by word-of-mouth. Researchers sitting at a table near the entrance
of the Recreation Center or standing near the entrance of the library distributed
information about the study to all male individuals as they passed by and asked if they
were interested in participating. If they were interested, eligibility requirements were
assessed. Researchers recruited for approximately one hour on four different occasions.
Approximately 80 males were approached and asked to participate, with five not
interested and 69 meeting eligibility requirements (appropriate age and not a varsity
athlete) and signing up. After agreeing to participate, participants scheduled an
appointment for an initial session. The University of Tennessee’s Institutional Review
Board approved all procedures.
First Session
In the initial session the participants had their heights, weights, and waist
circumference measured by trained researchers using a stadiometer, scales, and a tape
measure, respectively. The researcher then trained the participant on keeping a seven day
food record, including visual portion size estimation material, and wearing an Actigraph
wGT3x accelerometer for seven days. The participants were instructed to wear the
accelerometers around their waists, under or over a shirt, at all times except when
swimming or showering. Before leaving the first session, participants scheduled their
second session for no less than seven days later. On the fourth day, the researcher sent an
email or text message to the participant to remind him about the accelerometer and seven
day record usage. Another email was sent on day seven as a reminder to remove the
accelerometer and discontinue seven day records and with instructions on preparations
for subsequent body composition measurements.
14
Second Session
At the second session, participants returned their accelerometers, seven-day food
and physical activity records and researchers measured their body fat percentage using
the COSMED BOD POD. After the body composition measurements were complete,
participants participated in in-depth interviews about their protein knowledge,
perceptions, and sources of information. The interviewer used questions and prompts
from a developed interview script to guide the interview. These questions asked about
sources of protein and where participants obtained information relating to protein. The
interview was audio recorded on a research computer.
Third Session
As incentive for participation, participants were offered a third session to receive
an analysis of their dietary intake and physical activity behaviors, and to discuss general
nutrition information. Approximately 35 participants elected to participate in the third
session. No data used in analysis were collected during the third session.
NDSR and Physical Activity Analysis
Seven day dietary intake data were collected and analyzed using Nutrition Data
System for Research software version developed by the Nutrition Coordinating Center
(NCC), University of Minnesota, Minneapolis, MN. Accelerometer data were analyzed
using Actilife data analysis software (the Actigraph program) [24]. Total minutes in
sedentary, light, moderate, vigorous, and very vigorous activity, along with minutes of
activity in Freedson bouts, were recorded. One Freedson bout was defined as
15
participating in at least ten minutes of activity at the moderate or vigorous level and not
in the light category.
Interview Analysis
Interviews were transcribed using Inqscribe digital media transcription software.
A priori coding was used based on initial reoccurring themes presented in the interviews.
The researcher who conducted the interviews created the initial codes. Ten researchers
were trained in coding techniques and an inter rater reliability was assessed at greater
than 80%. When differences occurred in coding, the coded transcripts were compared for
differences, new themes were identified and corresponding new codes were created.
Then the transcripts were recoded.
Results
There were 69 males who met eligibility requirements and 50 who completed the
entire study. The other 19 did not elect to participate at the time of the study. Three
subjects were removed from the data analysis due to missing food records and one was
removed due to missing percent body fat. Table 1 describes results by group. The
groups were created by divided up by participants by those consuming under 0.8 g/kg/d,
those consuming within 0.8 and 1.99 g/kg/d and those consuming at or over 2 g/kg/d and
are referred to as low protein intake, moderate protein intake, and high protein intake
groups, respectively. Table 1 describes dietary intake, physical activity and body
composition among the groups.
16
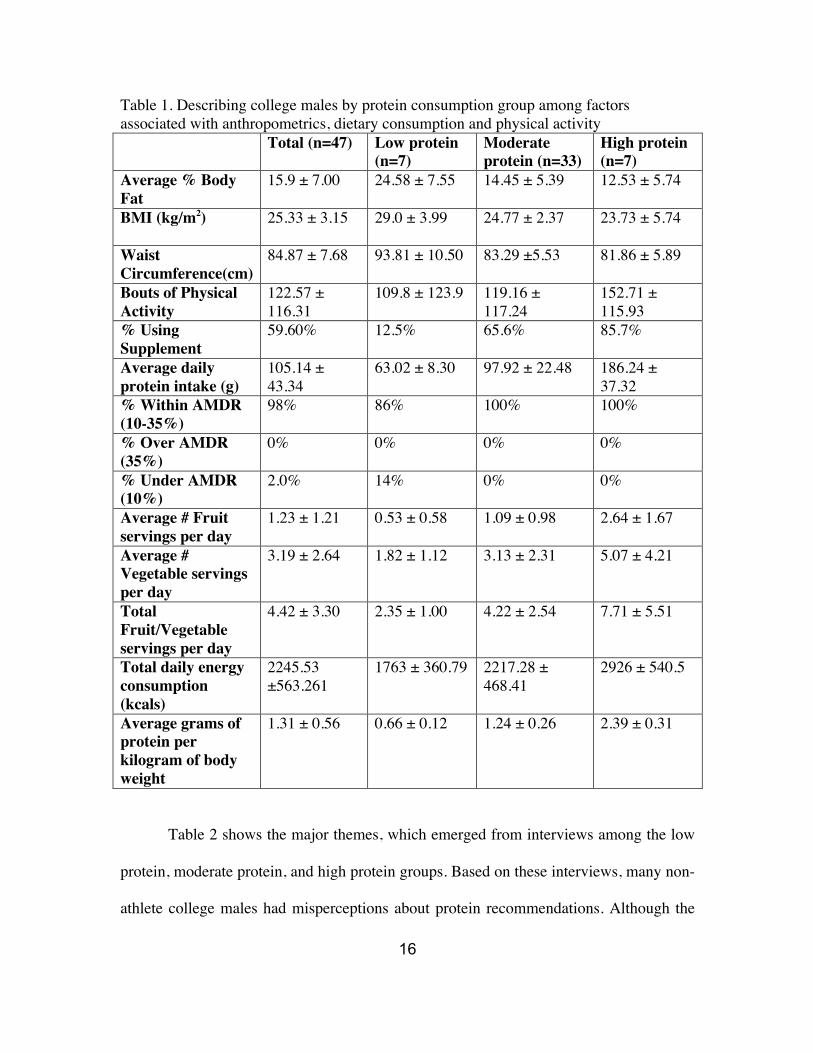
Table 1. Describing college males by protein consumption group among factors associated with anthropometrics, dietary consumption and physical activity
Total (n=47) Low protein (n=7)
Moderate protein (n=33)
High protein (n=7)
Average % Body Fat
15.9 ± 7.00 24.58 ± 7.55 14.45 ± 5.39 12.53 ± 5.74
BMI (kg/m2) 25.33 ± 3.15 29.0 ± 3.99 24.77 ± 2.37 23.73 ± 5.74
Waist Circumference(cm)
84.87 ± 7.68 93.81 ± 10.50 83.29 ±5.53 81.86 ± 5.89
Bouts of Physical Activity
122.57 ± 116.31
109.8 ± 123.9 119.16 ± 117.24
152.71 ± 115.93
% Using Supplement
59.60% 12.5% 65.6% 85.7%
Average daily protein intake (g)
105.14 ± 43.34
63.02 ± 8.30 97.92 ± 22.48 186.24 ± 37.32
% Within AMDR (10-35%)
98% 86% 100% 100%
% Over AMDR (35%)
0% 0% 0% 0%
% Under AMDR (10%)
2.0% 14% 0% 0%
Average # Fruit servings per day
1.23 ± 1.21 0.53 ± 0.58 1.09 ± 0.98 2.64 ± 1.67
Average # Vegetable servings per day
3.19 ± 2.64 1.82 ± 1.12 3.13 ± 2.31 5.07 ± 4.21
Total Fruit/Vegetable servings per day
4.42 ± 3.30 2.35 ± 1.00 4.22 ± 2.54 7.71 ± 5.51
Total daily energy consumption (kcals)
2245.53 ±563.261
1763 ± 360.79 2217.28 ± 468.41
2926 ± 540.5
Average grams of protein per kilogram of body weight
1.31 ± 0.56 0.66 ± 0.12 1.24 ± 0.26 2.39 ± 0.31
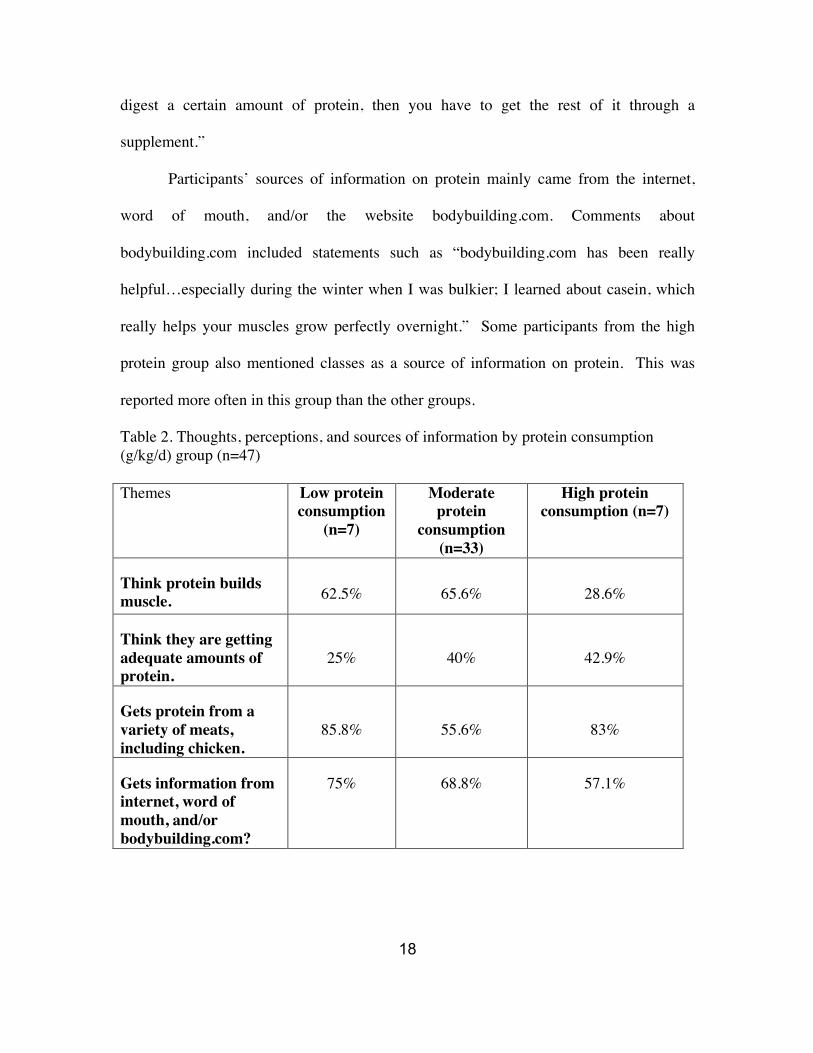
Table 2 shows the major themes, which emerged from interviews among the low
protein, moderate protein, and high protein groups. Based on these interviews, many non-
athlete college males had misperceptions about protein recommendations. Although the
17
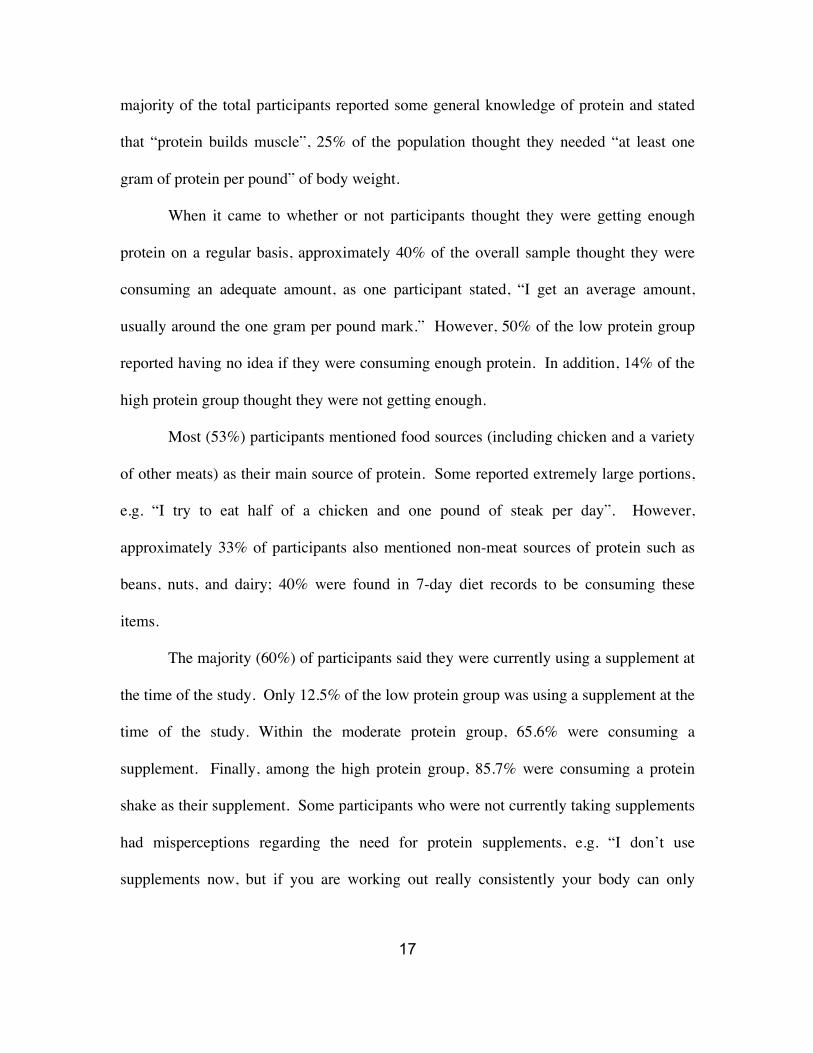
majority of the total participants reported some general knowledge of protein and stated
that “protein builds muscle”, 25% of the population thought they needed “at least one
gram of protein per pound” of body weight.
When it came to whether or not participants thought they were getting enough
protein on a regular basis, approximately 40% of the overall sample thought they were
consuming an adequate amount, as one participant stated, “I get an average amount,
usually around the one gram per pound mark.” However, 50% of the low protein group
reported having no idea if they were consuming enough protein. In addition, 14% of the
high protein group thought they were not getting enough.
Most (53%) participants mentioned food sources (including chicken and a variety
of other meats) as their main source of protein. Some reported extremely large portions,
e.g. “I try to eat half of a chicken and one pound of steak per day”. However,
approximately 33% of participants also mentioned non-meat sources of protein such as
beans, nuts, and dairy; 40% were found in 7-day diet records to be consuming these
items.
The majority (60%) of participants said they were currently using a supplement at
the time of the study. Only 12.5% of the low protein group was using a supplement at the
time of the study. Within the moderate protein group, 65.6% were consuming a
supplement. Finally, among the high protein group, 85.7% were consuming a protein
shake as their supplement. Some participants who were not currently taking supplements
had misperceptions regarding the need for protein supplements, e.g. “I don’t use
supplements now, but if you are working out really consistently your body can only
18
digest a certain amount of protein, then you have to get the rest of it through a
supplement.”
Participants’ sources of information on protein mainly came from the internet,
word of mouth, and/or the website bodybuilding.com. Comments about
bodybuilding.com included statements such as “bodybuilding.com has been really
helpful…especially during the winter when I was bulkier; I learned about casein, which
really helps your muscles grow perfectly overnight.” Some participants from the high
protein group also mentioned classes as a source of information on protein. This was
reported more often in this group than the other groups.
Table 2. Thoughts, perceptions, and sources of information by protein consumption (g/kg/d) group (n=47)
Themes Low protein consumption
(n=7)
Moderate protein
consumption (n=33)
High protein consumption (n=7)
Think protein builds muscle. 62.5% 65.6% 28.6%
Think they are getting adequate amounts of protein.
25% 40% 42.9%
Gets protein from a variety of meats, including chicken.
85.8% 55.6% 83%
Gets information from internet, word of mouth, and/or bodybuilding.com?
75% 68.8% 57.1%
19
Discussion
The average intake of protein for the general United States population is 1.0-1.5
gram/kg/day [6]. Within the present study, 98% of non-athlete college-age males
reported protein intakes that fell within the AMDR for protein intake, although 14.9%
consumed in excess of 2 g/kg/day and another 14.9% fell under the RDA of 0.8 g/kg/d.
Due to inconclusive data it is unclear whether protein intake over 2 g/kg/d causes harm to
the body over time. However, the participants consuming over 2 gram/kg/day are
exceeding this RDA and should be made aware of these recommendations and potential
associated risks.
Other Dietary Components
Researchers have previously found fruit and vegetable average intakes among
college students to be between 2.4-3.4 cups of fruits and vegetables per day [25-27].
However, overall fruit and vegetable consumption among participants of this research
study was higher with a mean of 4.43± 3.29. With an average intake of 2.35 ± 1.00, the
low protein group had average fruit and vegetable intakes closer to those found in
previous research. Participants in the high protein group had a daily mean intake of 7.71
± 5.51 fruit and vegetable servings. Included in the last group were four individuals with
total fruit and vegetable intakes of 10.68, 10.73, 13.20, and 18.80 servings/day. These
values were double checked by two researchers and verified for accuracy.
Sources of information
Many participants were seeking information from potentially unreliable sources.
Similar to the study by Bianco and colleagues, which looked at a convenience sample of
males in a commercial gym, no one mentioned obtaining protein- related information
20
from a dietitian, and only 19 percent obtained information from “classes” [18]. The
remaining participants received information relating to protein from potentially unreliable
sources such as word of mouth and internet sources. The website “bodybuilding.com”
was identified most often as the internet source used and was cited as the source of
information on protein requirements, such as “your body needs one gram of protein per
pound of body weight each day.” This is very different from the Froiland study, which
looked at college athletes and found athletes’ sources of nutrition information to come
from more reliable sources including dietitians and classes [16]. This is most likely due
to athletes having these resources more easily accessible than non-collegiate athletes.
Non-athlete college males were chosen for this study since it is known that many college
athletes have direct access to a team dietitian and likely have more knowledge relating to
nutrition and it was unknown where non-athlete college males were receiving protein
information [16].
Activity level
According to the Physical Activity Guidelines for Americans, adults should do
150 minutes of aerobic activity each week at the moderate or vigorous level or 75
minutes at the vigorous level [28]. It is also recommended that this activity take place for
a time span of at least 10 consecutive minutes at the moderate or vigorous level. Ten
consecutive minutes is considered one bout of activity. Participant activity was based on
the amount of time in bouts in order to reach the 10 consecutive minute point. According
to the American College Health Association, only 19.5% of college students meet
recommendations of 150 minutes of moderate activity per week [29]. A total of 29.8%
of participants within this study met or exceeded the recommended amount. The actual
21
percentage meeting or exceeding the recommendations may have been slightly higher
due to accelerometers having to be removed for swimming as reported by three
participants, who swam at least four days during the week. Although this percentage was
higher than previously-reported averages, it was still very low. Low physical activity
among college-age students is of concern because college is a critical time period in
which behavior developed is often carried into later adulthood [30].
Body Composition
Research has found the percent of body fat among college students including
males and females to average 24.8% [31]. However, research looking only at body fat
percentages of college males showed an average percent body fat of 16.3% [32]. With
the average percent body fat of participants in this study being 15.9%, most fell into the
moderate level of body fat, which ranges from 13 to 20% [24]. Compared to previous
findings, the mean body fat percentage in this sample is slightly lower than average.
Participants consuming less than 0.8 g/kg/d had an average percent body fat of 24.58 ±
7.55. Participants consuming 0.8- 1.99 g/kg/d had an average percent body fat of 14.45 ±
5.39 and participants consuming over 2 g/kg/d had an average percent body fat of 12.53 ±
5.74.
Interpreting body composition among college students using BMI has limitations
due to potentially increased muscle mass. The average BMI among participants in this
study was 25.33 ± 3.15 (kg/m2), which, if used as the sole indicator of body composition,
would indicate that the participants were on average overweight. However, the BOD
POD results show that the average body fat percentage of participants averaged 15.9 ±
7.00 placing them in the moderately lean category.
22
Conclusions and Recommendations
Strengths and Limitations
Strengths of the study design included the use of the BOD POD and
accelerometer as objective measures to describe the participants. The use of seven day
food records and analysis with NDSR provided accurate and complete protein intake
data, from foods and supplements, and therefore were also a strength in the design of this
research.
Limitations of this study included self-reported dietary intake records. This could
have caused inaccurate analysis of results among types and portions of foods consumed.
The small sample size reduced the ability to conduct statistical analysis. Also,
accelerometers had to be removed for swimming, which may have made a few of the
participants’ activity totals inaccurate.
Conclusion/Future Research
In conclusion, most college-age males in this sample consumed within the AMDR
for protein, but 15% fell below the RDA and 15% exceeded 2g/kg of body weight.
Questions remain whether or not protein intake > 2 g/kg/d in this otherwise non-athlete
college male population would result in adverse health effects. Researchers in this study
were surprised to find the AMDR and RDAs for this population in conflict. With the
AMDR and RDA recommendations not the same, there is a question on how much
protein males should be consuming and how much protein professionals should be
recommending. With the incorrect information many in this population had (e.g. needing
one gram per pound of body weight) and the under- and potential over-consumption of

23
protein observed, it is important to make sure correct nutrition information/resources are
readily accessible and provided to non-athlete college males.

24
CHAPTER III Extended Methods
25
Procedure
Physically active college males were recruited from the entrance of the Tennessee
Recreational Center for Students (TRECS) and University Library as participants for the
study. All participants were between the ages of 18 and 24, male, and not a member of
any varsity/college sport team. There were 50 participants recruited. Recruiting occurred
during a two-week time frame between the hours of 3 pm and 6 pm Monday through
Friday. These days and times were chosen due to the high volume of individuals who
attend the TRECS and UT Library during these hours. If interested in participating, and
they met the eligibility requirements, participants were informed of the entire research
process they would be involved in and signed a consent form. Participants then set up a
convenient time to meet with the researcher.
At the first meeting participants completed a demographics survey, and general
nutrition knowledge survey. Also, the researcher obtained height, weight, and waist
circumference from the participant using a stadiometer, scales, and a tape measure
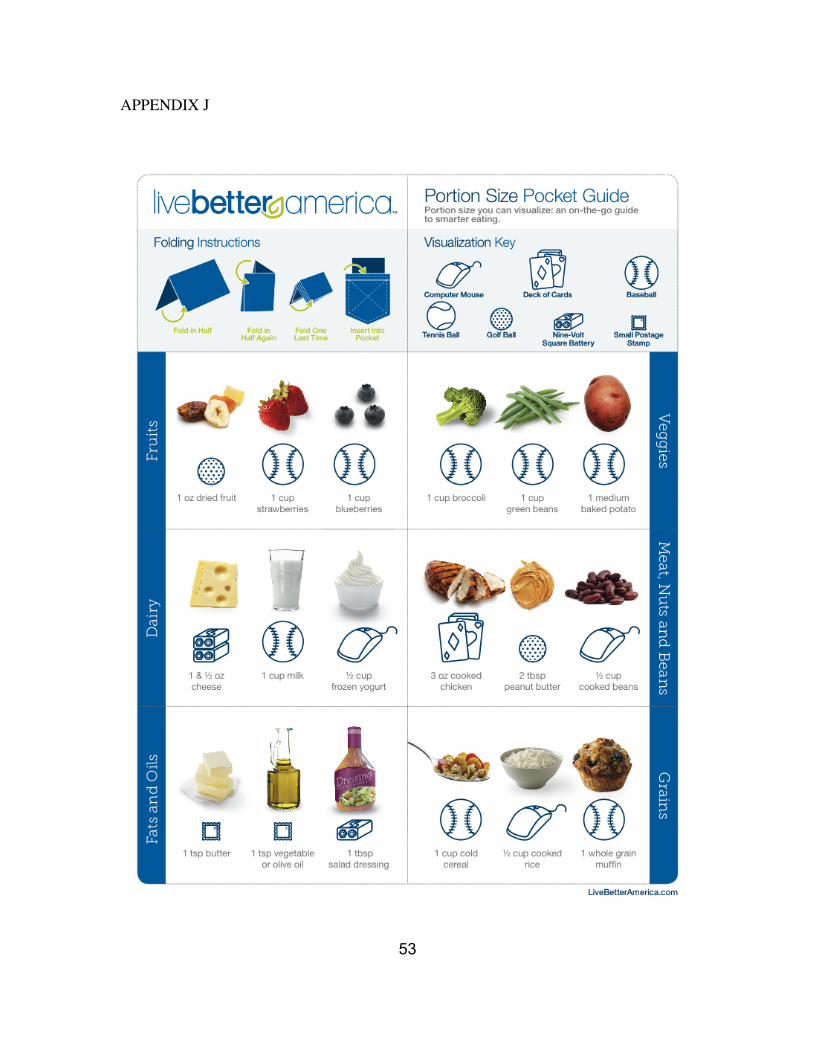
(Appendix B). Finally, the researcher trained the participant on using a seven-day food
record (Appendix C), and accelerometer.
Specific instructions were given to participants concerning the seven-day records.
These instructions included making sure participants note the amounts of foods, brands if
necessary, and quantity. This was especially important if participants used supplements.
The researcher also informed participants of the difference between protein enhanced
food products, such as protein bars or protein enriched cereals, and protein product
supplements such as whey or creatine powders (Appendix J).
26
Researchers were previously trained to obtain these anthropometrics. Weight
assessments followed the following standardized procedures: 1) Scale were zeroed and
on a hard, flat surface, not on carpet; 3) Participants were asked to remove excess
clothing, shoes, and socks prior to being weighed; 4) Participants were asked to step up
onto scale fully; 5) Participants were asked to stand completely still with arms at sides
and eyes looking straight ahead; 6) weight was recorded to the nearest 0.1 kg on the data
collection sheet; and 7) Measurement procedures were repeated and if there was > 0.2 kg
difference between measurements, they were repeated until two measurements were
within 0.2 kg.
Height assessments followed standardized procedures. First, participants
removed shoes. The participants were asked to step completely under the slide of the
stadiometer, making sure that the participant was centered with the stadiometer and
standing as straight as possible with feet together and heels, buttock, shoulder blades, and
back of head completely touching the wall (or as much as possible). Next, the participants
looked straight ahead and the Frankfurt Plane was verified. Participants took and held a
deep breath. With the height slide resting lightly on top of the participant’s head and the
participant resuming normal breathing, the height was recorded to the nearest 0.1 cm by
reading the height value at eye level. This measurement was repeated for accuracy. If
measurement varied more than 0.2 cm from the first measurement, it was repeated a third
time.
Waist circumference was measured using the following procedures. Participants
adjusted shorts or pants to a level just below the top of the hip bones and the tape
measure was placed around the waist at the level of the iliac crests making sure that the
27
tape was in a horizontal plane and not twisted. Participants were asked to exhale and the
tape was gently tightened without compressing the skin. Measurements were recorded to
the nearest 0.1 cm. This measurement was also repeated for accuracy. If the
measurement varied more than 0.5 cm from the first measurement, it was repeated a third
time.
Before the participant left the first session, a second session was scheduled. This
meeting was required to be at least one week later in order for the participant to have time
to wear the accelerometer, and obtain a seven-day diet and physical activity record.
During this session participants returned their seven-day records and accelerometer,
participated in the interview questions, and were measured by the BOD POD. Then, the
researcher conducted an interview, questioning the participant about protein, protein
supplements, and sources of information regarding protein (Appendix E).
In addition, participants had their body composition measured by the BOD POD
in the Kinesiology Department under the supervision of Dr. Dixie Thompson. After they
finished, the researcher and participant scheduled one final meeting. The final meeting
was the incentive for participants because they received a report of the analysis of their
food and activity record along with BOD POD data and diet recommendations.
Accelerometers
Accelerometers are a tool used to record the acceleration of the body through
space. They provide researchers an objective assessment of frequency, duration, and
intensity. The output gives the number of minutes spent in each of the intensity
categories. These categories include, sedentary activity, light physical activity, moderate
physical activity, vigorous physical activity, and moderate to vigorous physical activity.
28
There are samples recorded per second to make up the frequency. This number is
multiplied by the interval of time over which acceleration samples are summed [33]. For
this research project, a ten second interval was used. The product equals the activity
count. At least three good weekdays and one good weekend day are needed in order to be
compliant. A good day consists of less than three flags of greater than or equal to a 60-
minute string of no activity between waking hours. Participants were instructed to wear
the accelerometer on a band around the waist for seven days. The bands and
accelerometers were removed when showering or in water [33].
The accelerometers were set up using the Actigraph wGT3x software.
Accelerometers were plugged in to the computer with this software using a USB cord.
After opening the software, the researcher was able to see when the accelerometer is fully
charged. Then, the researcher initialized the accelerometer to start running one hour after
the participant’s first session time and stop running seven days later at the same time.
After this was set, the accelerometer was removed from the USB cord and was able to be
worn.
BOD POD
The BOD POD is a fiberglass unit with two chambers. The volume of the test
chamber is determined by the pressure changes between the two chambers by moving a
diaphragm mounted on the common wall between the chambers [34]. The participant’s
body volume was equal to the volume of the test chamber before subject entry less the
test chamber volume with the participant inside. To avoid errors, it was recommended
that testing be prior to exercise, that the participant be dry, and that the participant wear
29
tight fitting clothing [34]. The BOD POD estimated measures of percent fat, body
volume, and body density [34].
Participants were instructed not to eat or exercise in the two hours before the test
and to wear minimal, tight-fitting clothing for the actual test (this typically included
wearing compression shorts - spandex/athletic type of shorts and no shirt). At the
beginning of the session, after making sure an individual was properly dressed and had
removed any jewelry, the instructor asked the participant to put on a swim cap. This test
typically lasted about 30 seconds. The BOD POD was then opened and the researcher
informed the participant that a second test will occur next in order to confirm accuracy of
the first test. The second test lasted about 30 seconds as well. After assuring the results
from the two tests were accurate, the participant exited the BOD POD and redressed.
Qualitative Research
Qualitative research tends to focus around a small number of respondents and
number of settings [35]. This data often comes from interviews [36]. The results and data
from qualitative studies are often difficult to analyze. Methods used in qualitative
research include in-depth interviewing [35]. I plan to use interviewing as my
methodology in receiving information about protein from participants. In-depth
interviews are a qualitative approach to provide more detail about the understanding and
experiences a person has concerning a topic [37]. Interviews provide a way for new
theories to be developed through the understanding which is gained during the interview
process [37].
30
Sample Size
The sample size is determined by the point of saturation [38]. This research study
included a sample size of 50 participants. This size was determined by several different
sources. The research from Pope et al stated that a sample size must be feasible for a
single interviewer to undertake [35]. Also, Green et al recommended using a sample size
representative of the population that is targeted. This study interviewed a sample size of
15 from four different populations, interviewing a total of 60 participants [38]. However,
this was a larger study. In addition, an average of twenty people is recommended to be
interviewed if addressing a fairly specific research topic [38]. Depth and duration are
two factors which must be considered with feasibility as well [37].
Convenience sampling was also used. This enabled researchers to find potential
participants in a generalized location for similar interests [39]. The sample for the study
was obtained from the TRECS and library on University of Tennessee’s campus. In
order to prevent bias when asking potential participants, every male entering or leaving
the facilities will be asked if interested in participating.
Interviews
The interviews were held in a University of Tennessee public location chosen by
the participant in order to make him feel most comfortable [19]. The participant had the
options of the TRECS or Jesse Harris Building. The questions asked in the interview
were open-ended. This allowed the participant to feel comfortable responding freely and
with as much information as he wished [35]. After the initial question, these questions
focused on information the participants seems to leave out [39]. A list of initial questions
and probing questions (Appendix E) were used. Probing questions are an active listening
31
method for encouraging elaboration [39]. This helped the participant fully express how
he felt regarding the question or topic. Interviewing is a highly beneficial tool used in
qualitative research. Limitations include there only being access to what the participants
are expressing, not what they actually do [38]. However, this was at least partially
improved through the seven-day physical activity record, seven-day diet record, and
accelerometer data recorded by the participant.
Analysis
Data and analysis is a vital part of the qualitative research process. After
obtaining information from the interviews, the researcher must accurately transcribe the
data. The analytical process of qualitative research often begins during data collection
[35]. When collecting data through interviews, the researcher often begins to analyze the
information being expressed by the participant. The use of computer assisted qualitative
data analysis software packages has become prevalent [35]. These software packages aid
in the analysis of unstructured textual data. There are several options when it comes to
choosing which software to use. After obtaining data, I transcribed from the interviews
through Inqscribe. This occurred with teams of two. One person did the initial
transcription, and a second person verified for accuracy. Next, I generated a priori code
list and initiated a reflexivity journal. Then I made sure to be familiarized with the data
and expanded the initial codes. I used inter/intra rater reliability training where I created
two sample documents, and showed researchers how the coding worked. The researchers
independently coded the documents and made sure there was 80 percent accuracy
between the two. The coding information was based on themes. Interpretation included
describing theme frequencies and relationships between different themes.
32
In addition, I completed quantitative data frequencies. These outcomes included
data from the anthropometrics, BOD POD, protein intake, and accelerometer data.
Changes Between Proposed Methods and Actual Methods
There were a few changes in methods that occurred over the process of the study.
First, initially participants were to answer two IPAQ questions that would determine the
group in which they would be included. The two groups would include highly physically
active and moderately physically active college males and there would be thirty
participants per group. However, it was decided to include college males with all levels
of physical activity to get a more diverse population sample. Since this was decided, the
sample size was decreased from a sample size of 30 participants from each group to a
total of 50 participants. Next, I had planned to use ATLAS for the coding of this research
project data. However, I ended up coding without a computer analysis program. Finally,
I had planned to use analysis with T-tests to compare the outcomes between the two
groups, but I ended up using frequency reports only due to the small sample size.

33
LIST OF REFERENCES
34
1. Poortmans, J.R., et al., Protein turnover, amino acid requirements and
recommendations for athletes and active populations. Braz J Med Biol Res, 2012.
45(10): p. 875-90.
2. Guillet, C., Y. Boirie, and S. Walrand, An integrative approach to in-vivo protein
synthesis measurement: from whole tissue to specific proteins. Curr Opin Clin
Nutr Metab Care, 2004. 7(5): p. 531-8.
3. Lentine, K. and E.M. Wrone, New insights into protein intake and progression of
renal disease. Curr Opin Nephrol Hypertens, 2004. 13(3): p. 333-6.
4. Protein and amino acid requirements in human nutrition. World Health Organ
Tech Rep Ser, 2007(935): p. 1-265, back cover.
5. Rodriguez, N.R., N.M. Di Marco, and S. Langley, American College of Sports
Medicine position stand. Nutrition and athletic performance. Med Sci Sports
Exerc, 2009. 41(3): p. 709-31.
6. Fulgoni, V.L., 3rd, Current protein intake in America: analysis of the National
Health and Nutrition Examination Survey, 2003-2004. Am J Clin Nutr, 2008.
87(5): p. 1554S-1557S.
7. Watford, M. and G. Wu, Protein. Adv Nutr, 2011. 2(1): p. 62-3.
8. Goldberg, A.L., C. Jablecki, and J.B. Li, Trophic functions of the neuron. 3.
Mechanisms of neurotrophic interactions. Effects of use and disuse on amino acid
transport and protein turnover in muscle. Ann N Y Acad Sci, 1974. 228(0): p.
190-201.
9. Martin, W.F., L.E. Armstrong, and N.R. Rodriguez, Dietary protein intake and
renal function. Nutr Metab (Lond), 2005. 2: p. 25.
35
10. CDC. Protect your kidneys: Control diabetes and blood pressure. 2012 [cited
2013 February 18]; Available from:
http://www.cdc.gov/Features/WorldKidneyDay/.
11. Parks, J.H. and F.L. Coe, Evidence for durable kidney stone prevention over
several decades. BJU Int, 2009. 103(9): p. 1238-46.
12. Calfee, R. and P. Fadale, Popular ergogenic drugs and supplements in young
athletes. Pediatrics, 2006. 117(3): p. e577-89.
13. Morrison, L.J., F. Gizis, and B. Shorter, Prevalent use of dietary supplements
among people who exercise at a commercial gym. Int J Sport Nutr Exerc Metab,
2004. 14(4): p. 481-92.
14. Fox, E.A., et al., Perceived protein needs and measured protein intake in
collegiate male athletes: an observational study. J Int Soc Sports Nutr, 2011. 8: p.
9.
15. Heaney, S., et al., Nutrition knowledge in athletes: a systematic review. Int J Sport
Nutr Exerc Metab, 2011. 21(3): p. 248-61.
16. Froiland, K., et al., Nutritional supplement use among college athletes and their
sources of information. Int J Sport Nutr Exerc Metab, 2004. 14(1): p. 104-20.
17. Torres-McGehee, T.M., et al., Sports nutrition knowledge among collegiate
athletes, coaches, athletic trainers, and strength and conditioning specialists. J
Athl Train, 2012. 47(2): p. 205-11.
18. Bianco, A., et al., Protein supplementation in strength and conditioning adepts:
knowledge, dietary behavior and practice in Palermo, Italy. J Int Soc Sports Nutr,
2011. 8(1): p. 25.
36
19. Jacobson, B.H., C. Sobonya, and J. Ransone, Nutrition practices and knowledge
of college varsity athletes: a follow-up. J Strength Cond Res, 2001. 15(1): p. 63-8.
20. Perkin, J.E., et al., Prevalence of nonvitamin, nonmineral supplement usage
among university students. J Am Diet Assoc, 2002. 102(3): p. 412-4.
21. Lyle, B.J., et al., Supplement users differ from nonusers in demographic, lifestyle,
dietary and health characteristics. J Nutr, 1998. 128(12): p. 2355-62.
22. Otten, J., Hellwig J., Meyers, L., Dietary Reference Intakes: The Essential Guide
to Nutrient Requirements. 2006.
23. Park, M.J., et al., The health status of young adults in the United States. J Adolesc
Health, 2006. 39(3): p. 305-17.
24. Utah, U.o. Body Composition Information. 2008 [cited 2014; Available from:
http://www.health.utah.edu/peak/services/health_fitness_testing/body_compositio
n_information.html.
25. Small, M., et al., Changes in eating and physical activity behaviors across seven
semesters of college: living on or off campus matters. Health Educ Behav, 2013.
40(4): p. 435-41.
26. Strong, K.A., et al., Weight gain prevention: identifying theory-based targets for
health behavior change in young adults. J Am Diet Assoc, 2008. 108(10): p.
1708-1715.
27. Greene, G.W., et al., Identifying clusters of college students at elevated health risk
based on eating and exercise behaviors and psychosocial determinants of body
weight. J Am Diet Assoc, 2011. 111(3): p. 394-400.
37
28. Physical Activity Guidelines for Americans. 2008 [cited 2014; Available from:
http://www.health.gov/paguidelines/guidelines/chapter1.aspx.
29. American College Health Association: National College Health Assessment,
2012.
30. Downs, A., et al., Accelerometer-Measured Versus Self-reported Physical Activity
in College Students: Implications for Research and Practice. J Am Coll Health,
2013.
31. Carpenter, C.L., et al., Body fat and body-mass index among a multiethnic sample
of college-age men and women. J Obes, 2013. 2013: p. 790654.
32. Gropper, S.S., et al., Changes in body weight, composition, and shape: a 4-year
study of college students. Appl Physiol Nutr Metab, 2012. 37(6): p. 1118-23.
33. Chaix, B., et al., GPS tracking in neighborhood and health studies: A step
forward for environmental exposure assessment, a step backward for causal
inference? Health Place, 2013. 21C: p. 46-51.
34. Fields, D.A., P.B. Higgins, and G.R. Hunter, Assessment of body composition by
air-displacement plethysmography: influence of body temperature and moisture.
Dyn Med, 2004. 3(1): p. 3.
35. Qualitative Research in Health Care. third ed. 2006: Blackwell Publishing
Limited. 156.
36. Patton, M.Q., Qualitative Research & Evaluation Methods. 3rd Edition ed. 2002:
Sage Publications Ltd. . 598.
37. Liamputtong, P.E., Douglas, Qualitative Research Methods. 2nd ed. 2005: Oxford
University Press. 410.
38
38. Green, J.T., Nicki, Qualitative Methods for Health Research. 2004: SAGE
Publications Ltd. 262.
39. The Sage Handbook of Qualitative Methods in Health Research. 2010: SAGE
Publications Ltd.

39
APPENDICES
40
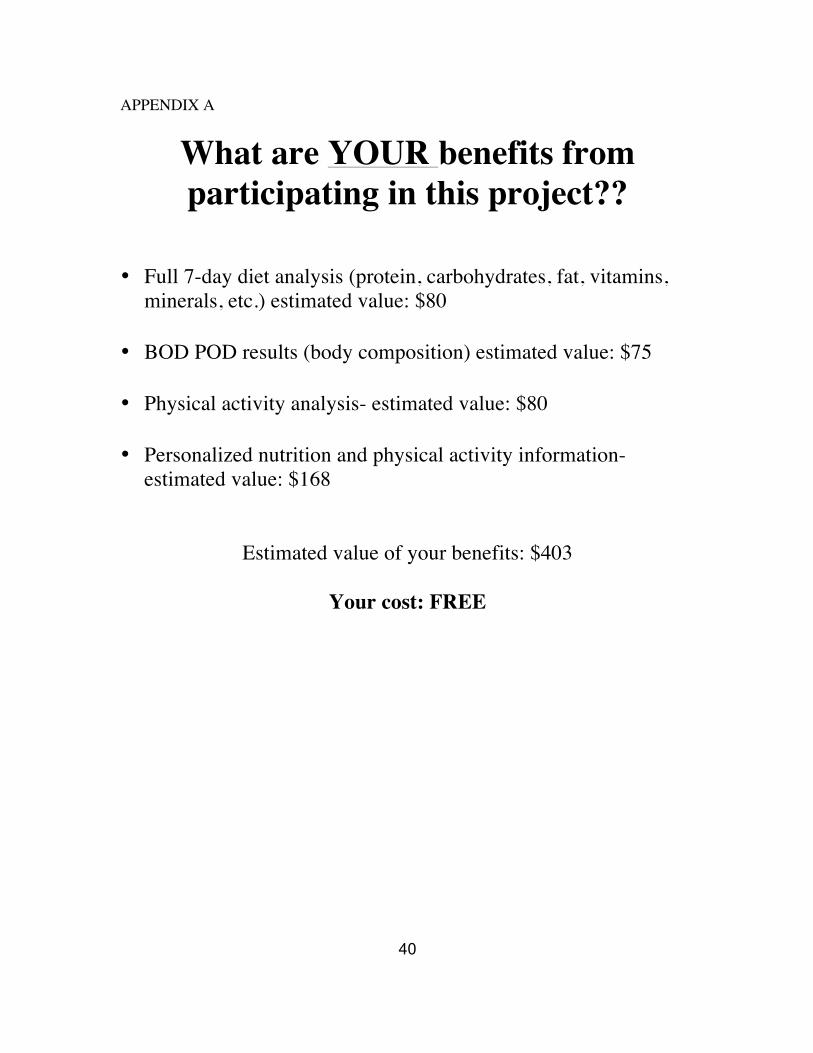
APPENDIX A
What are YOUR benefits from participating in this project??
• Full 7-day diet analysis (protein, carbohydrates, fat, vitamins,minerals, etc.) estimated value: $80
• BOD POD results (body composition) estimated value: $75
• Physical activity analysis- estimated value: $80
• Personalized nutrition and physical activity information- estimated value: $168
Estimated value of your benefits: $403
Your cost: FREE
41
APPENDIX B Anthropometric Sheet
ID Number Height Weight Waist
42
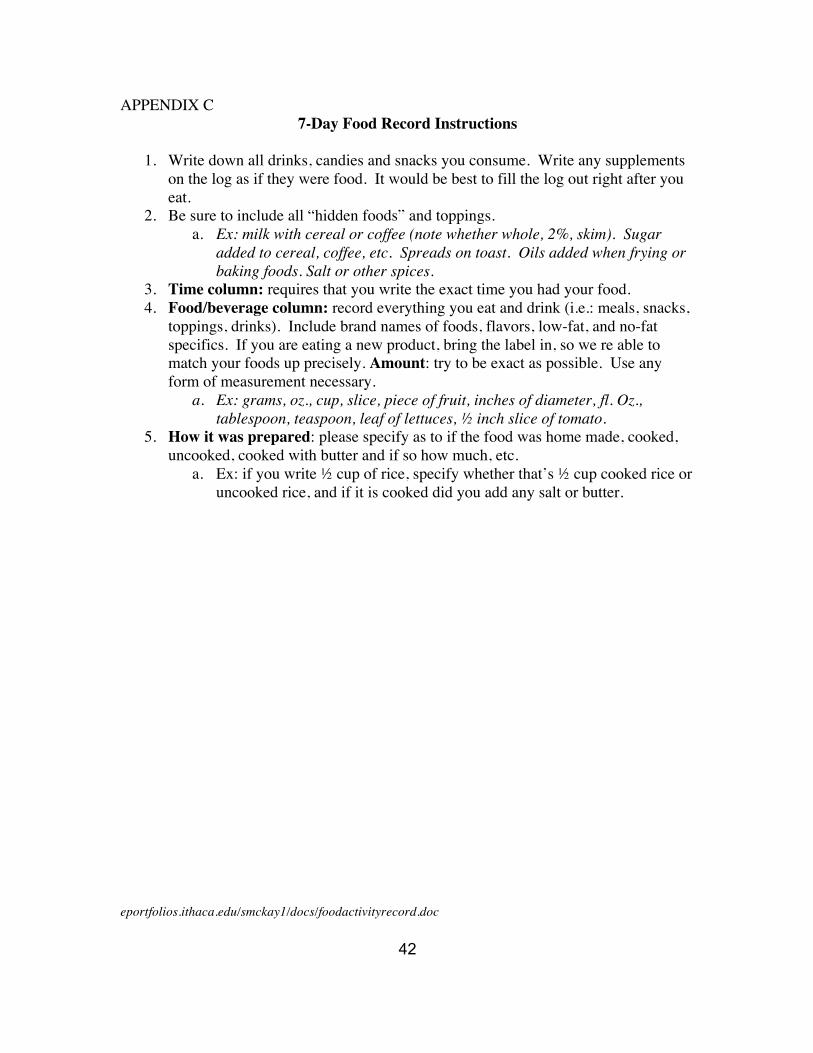
APPENDIX C 7-Day Food Record Instructions
1. Write down all drinks, candies and snacks you consume. Write any supplementson the log as if they were food. It would be best to fill the log out right after youeat.
2. Be sure to include all “hidden foods” and toppings.a. Ex: milk with cereal or coffee (note whether whole, 2%, skim). Sugar
added to cereal, coffee, etc. Spreads on toast. Oils added when frying orbaking foods. Salt or other spices.
3. Time column: requires that you write the exact time you had your food.4. Food/beverage column: record everything you eat and drink (i.e.: meals, snacks,
toppings, drinks). Include brand names of foods, flavors, low-fat, and no-fatspecifics. If you are eating a new product, bring the label in, so we re able tomatch your foods up precisely. Amount: try to be exact as possible. Use anyform of measurement necessary.
a. Ex: grams, oz., cup, slice, piece of fruit, inches of diameter, fl. Oz.,tablespoon, teaspoon, leaf of lettuces, ½ inch slice of tomato.
5. How it was prepared: please specify as to if the food was home made, cooked,uncooked, cooked with butter and if so how much, etc.
a. Ex: if you write ½ cup of rice, specify whether that’s ½ cup cooked rice oruncooked rice, and if it is cooked did you add any salt or butter.
eportfolios.ithaca.edu/smckay1/docs/foodactivityrecord.doc
43
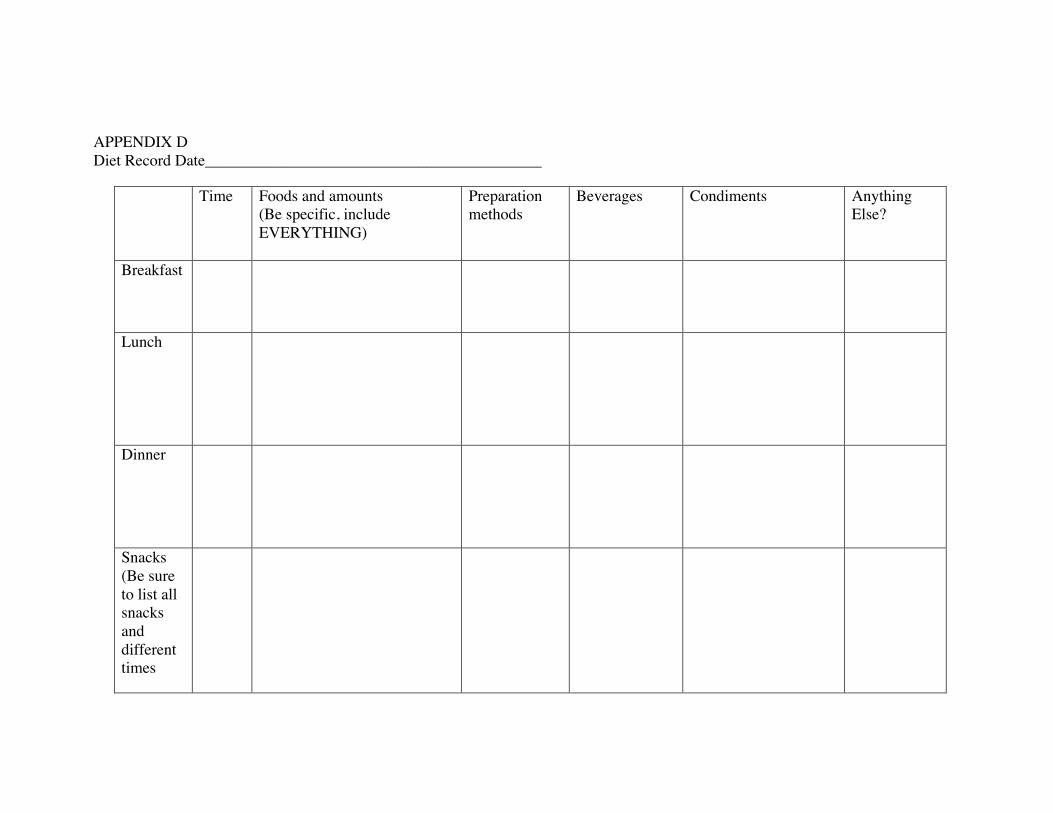
APPENDIX D Diet Record Date__________________________________________
Time Foods and amounts (Be specific, include EVERYTHING)
Preparation methods
Beverages Condiments Anything Else?
Breakfast
Lunch
Dinner
Snacks (Be sure to list all snacks and different times
44
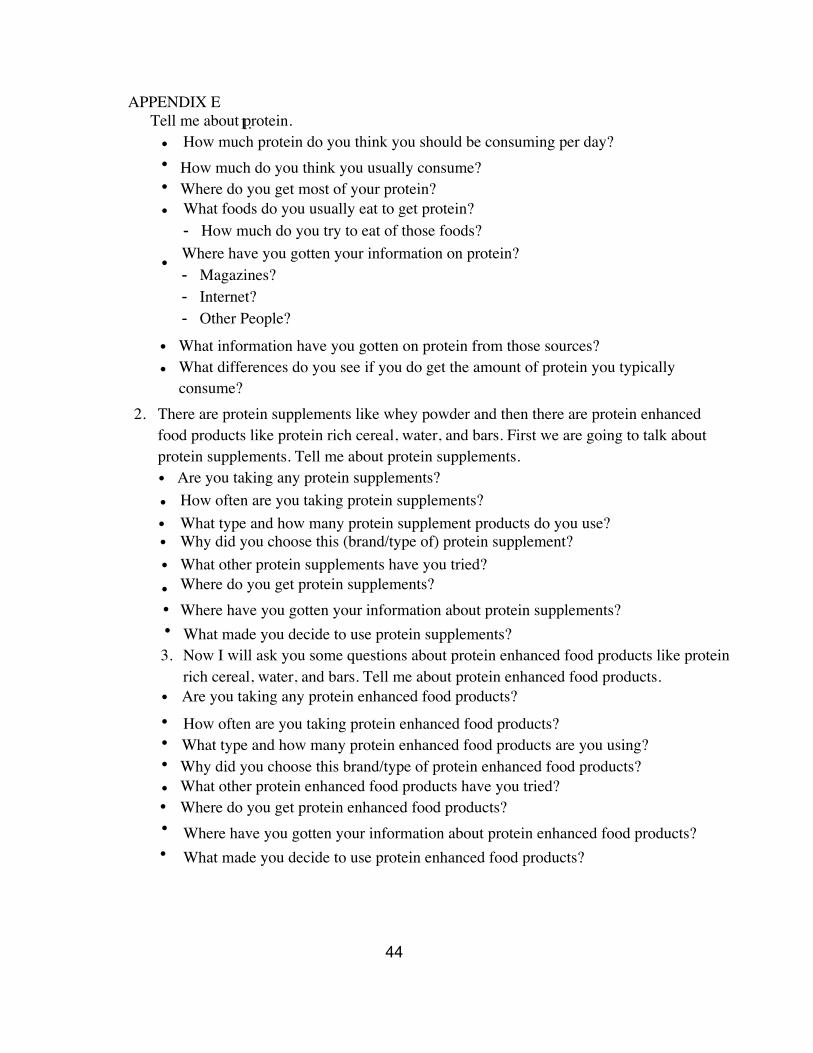
APPENDIX E 1.Tell me about protein.
• How much protein do you think you should be consuming per day?• How much do you think you usually consume?• Where do you get most of your protein?• What foods do you usually eat to get protein?
- How much do you try to eat of those foods?
•Where have you gotten your information on protein?- Magazines?- Internet?- Other People?
• What information have you gotten on protein from those sources?• What differences do you see if you do get the amount of protein you typically
consume?2. There are protein supplements like whey powder and then there are protein enhanced
food products like protein rich cereal, water, and bars. First we are going to talk aboutprotein supplements. Tell me about protein supplements.• Are you taking any protein supplements?• How often are you taking protein supplements?• What type and how many protein supplement products do you use?• Why did you choose this (brand/type of) protein supplement?• What other protein supplements have you tried?• Where do you get protein supplements?• Where have you gotten your information about protein supplements?• What made you decide to use protein supplements?3. Now I will ask you some questions about protein enhanced food products like protein
rich cereal, water, and bars. Tell me about protein enhanced food products.• Are you taking any protein enhanced food products?• How often are you taking protein enhanced food products?• What type and how many protein enhanced food products are you using?• Why did you choose this brand/type of protein enhanced food products?• What other protein enhanced food products have you tried?• Where do you get protein enhanced food products?• Where have you gotten your information about protein enhanced food products?• What made you decide to use protein enhanced food products?
45
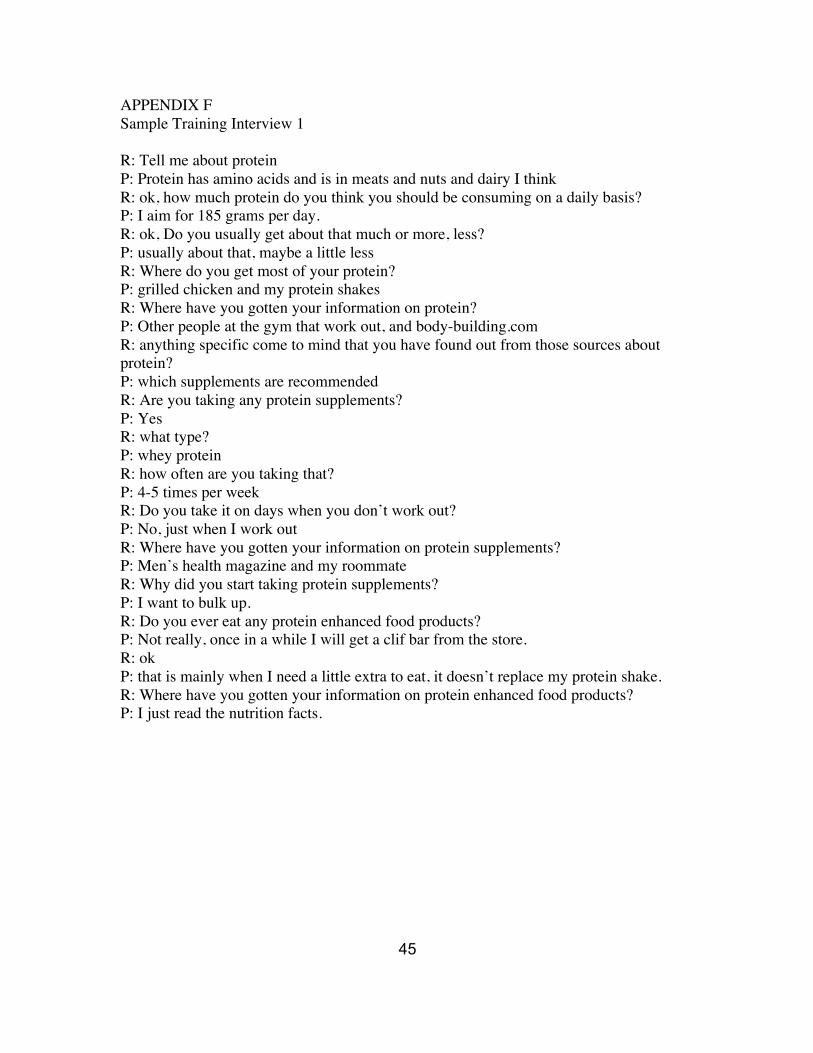
APPENDIX F Sample Training Interview 1
R: Tell me about protein P: Protein has amino acids and is in meats and nuts and dairy I think R: ok, how much protein do you think you should be consuming on a daily basis? P: I aim for 185 grams per day. R: ok, Do you usually get about that much or more, less? P: usually about that, maybe a little less R: Where do you get most of your protein? P: grilled chicken and my protein shakes R: Where have you gotten your information on protein? P: Other people at the gym that work out, and body-building.com R: anything specific come to mind that you have found out from those sources about protein? P: which supplements are recommended R: Are you taking any protein supplements? P: Yes R: what type? P: whey protein R: how often are you taking that? P: 4-5 times per week R: Do you take it on days when you don’t work out? P: No, just when I work out R: Where have you gotten your information on protein supplements? P: Men’s health magazine and my roommate R: Why did you start taking protein supplements? P: I want to bulk up. R: Do you ever eat any protein enhanced food products? P: Not really, once in a while I will get a clif bar from the store. R: ok P: that is mainly when I need a little extra to eat, it doesn’t replace my protein shake. R: Where have you gotten your information on protein enhanced food products? P: I just read the nutrition facts.
46
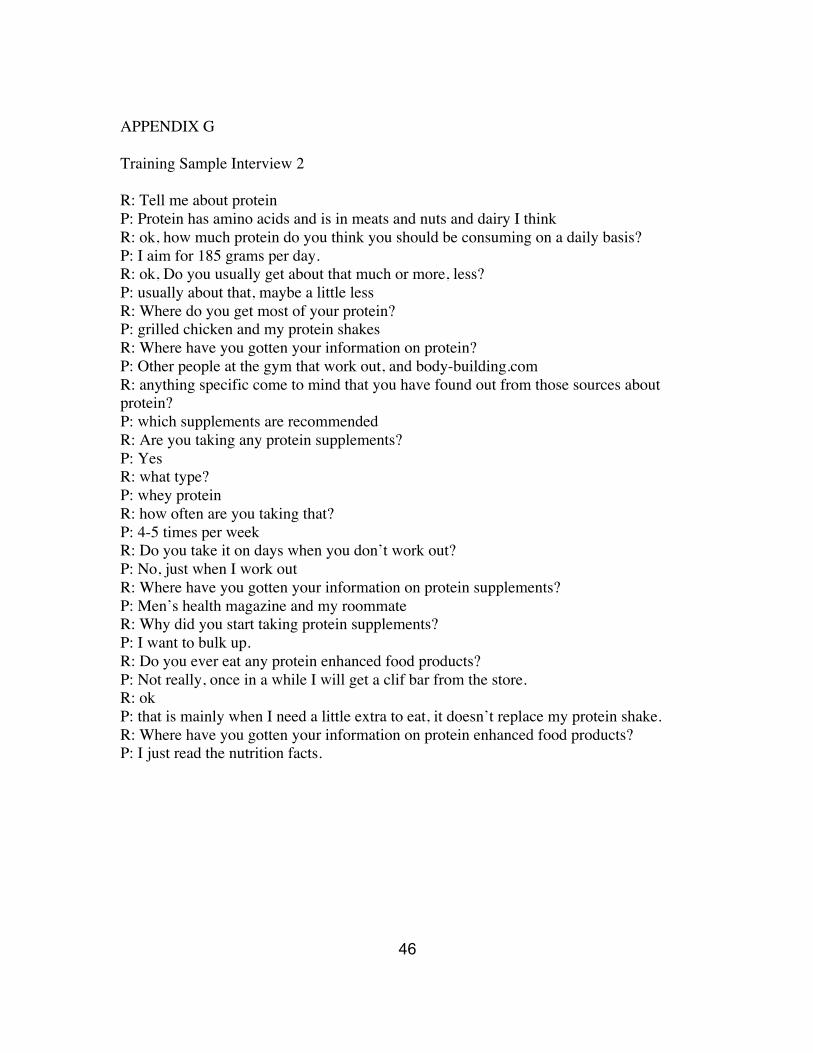
APPENDIX G
Training Sample Interview 2
R: Tell me about protein P: Protein has amino acids and is in meats and nuts and dairy I think R: ok, how much protein do you think you should be consuming on a daily basis? P: I aim for 185 grams per day. R: ok, Do you usually get about that much or more, less? P: usually about that, maybe a little less R: Where do you get most of your protein? P: grilled chicken and my protein shakes R: Where have you gotten your information on protein? P: Other people at the gym that work out, and body-building.com R: anything specific come to mind that you have found out from those sources about protein? P: which supplements are recommended R: Are you taking any protein supplements? P: Yes R: what type? P: whey protein R: how often are you taking that? P: 4-5 times per week R: Do you take it on days when you don’t work out? P: No, just when I work out R: Where have you gotten your information on protein supplements? P: Men’s health magazine and my roommate R: Why did you start taking protein supplements? P: I want to bulk up. R: Do you ever eat any protein enhanced food products? P: Not really, once in a while I will get a clif bar from the store. R: ok P: that is mainly when I need a little extra to eat, it doesn’t replace my protein shake. R: Where have you gotten your information on protein enhanced food products? P: I just read the nutrition facts.
47
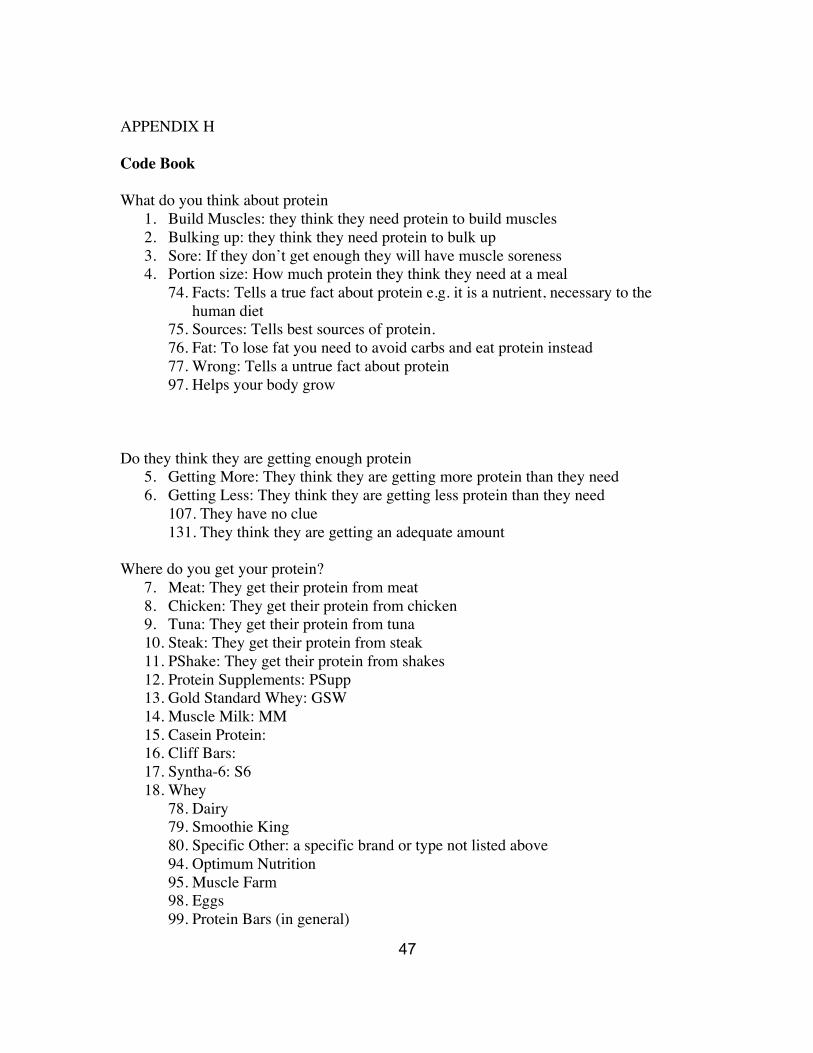
APPENDIX H
Code Book
What do you think about protein 1. Build Muscles: they think they need protein to build muscles2. Bulking up: they think they need protein to bulk up3. Sore: If they don’t get enough they will have muscle soreness4. Portion size: How much protein they think they need at a meal
74. Facts: Tells a true fact about protein e.g. it is a nutrient, necessary to thehuman diet
75. Sources: Tells best sources of protein.76. Fat: To lose fat you need to avoid carbs and eat protein instead77. Wrong: Tells a untrue fact about protein97. Helps your body grow
Do they think they are getting enough protein 5. Getting More: They think they are getting more protein than they need6. Getting Less: They think they are getting less protein than they need
107. They have no clue131. They think they are getting an adequate amount
Where do you get your protein? 7. Meat: They get their protein from meat8. Chicken: They get their protein from chicken9. Tuna: They get their protein from tuna10. Steak: They get their protein from steak11. PShake: They get their protein from shakes12. Protein Supplements: PSupp13. Gold Standard Whey: GSW14. Muscle Milk: MM15. Casein Protein:16. Cliff Bars:17. Syntha-6: S618. Whey
78. Dairy79. Smoothie King80. Specific Other: a specific brand or type not listed above94. Optimum Nutrition95. Muscle Farm98. Eggs99. Protein Bars (in general)
48
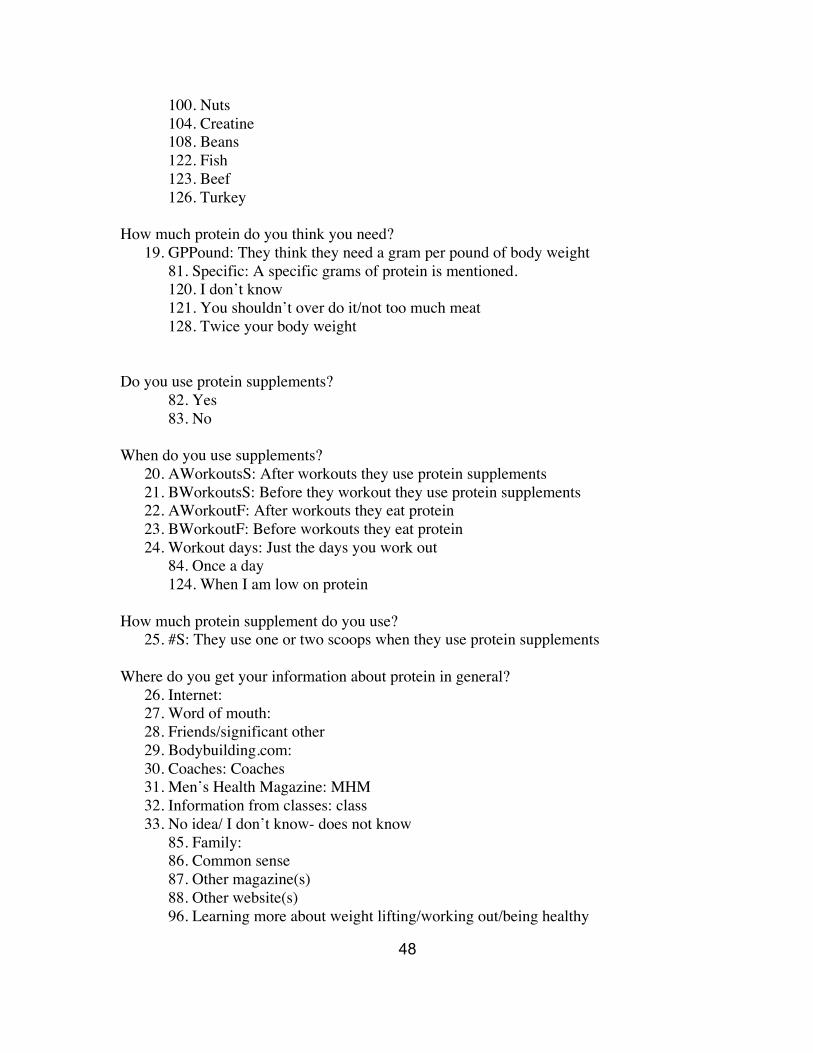
100. Nuts 104. Creatine 108. Beans 122. Fish 123. Beef 126. Turkey
How much protein do you think you need? 19. GPPound: They think they need a gram per pound of body weight
81. Specific: A specific grams of protein is mentioned.120. I don’t know 121. You shouldn’t over do it/not too much meat 128. Twice your body weight
Do you use protein supplements? 82. Yes83. No
When do you use supplements? 20. AWorkoutsS: After workouts they use protein supplements21. BWorkoutsS: Before they workout they use protein supplements22. AWorkoutF: After workouts they eat protein23. BWorkoutF: Before workouts they eat protein24. Workout days: Just the days you work out
84. Once a day124. When I am low on protein
How much protein supplement do you use? 25. #S: They use one or two scoops when they use protein supplements
Where do you get your information about protein in general? 26. Internet:27. Word of mouth:28. Friends/significant other29. Bodybuilding.com:30. Coaches: Coaches31. Men’s Health Magazine: MHM32. Information from classes: class33. No idea/ I don’t know- does not know
85. Family:86. Common sense87. Other magazine(s)88. Other website(s)96. Learning more about weight lifting/working out/being healthy
49
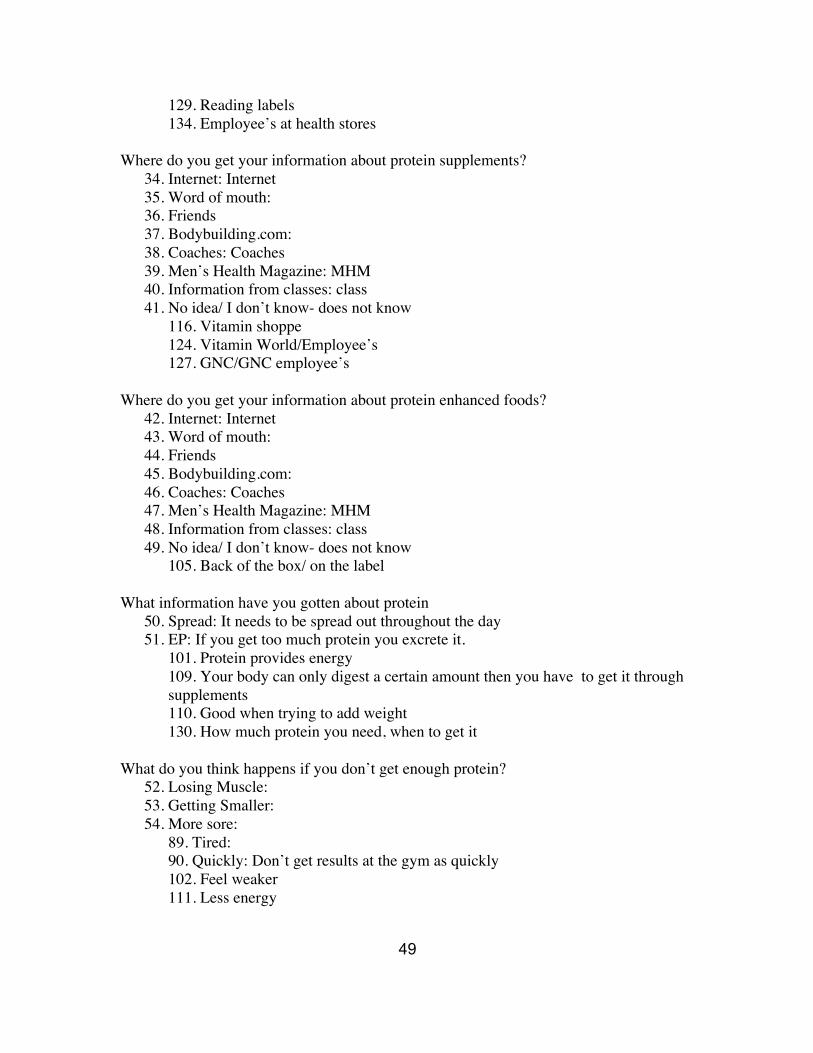
129. Reading labels 134. Employee’s at health stores
Where do you get your information about protein supplements? 34. Internet: Internet35. Word of mouth:36. Friends37. Bodybuilding.com:38. Coaches: Coaches39. Men’s Health Magazine: MHM40. Information from classes: class41. No idea/ I don’t know- does not know
116. Vitamin shoppe124. Vitamin World/Employee’s127. GNC/GNC employee’s
Where do you get your information about protein enhanced foods? 42. Internet: Internet43. Word of mouth:44. Friends45. Bodybuilding.com:46. Coaches: Coaches47. Men’s Health Magazine: MHM48. Information from classes: class49. No idea/ I don’t know- does not know
105. Back of the box/ on the label
What information have you gotten about protein 50. Spread: It needs to be spread out throughout the day51. EP: If you get too much protein you excrete it.
101. Protein provides energy109. Your body can only digest a certain amount then you have to get it throughsupplements110. Good when trying to add weight130. How much protein you need, when to get it
What do you think happens if you don’t get enough protein? 52. Losing Muscle:53. Getting Smaller:54. More sore:
89. Tired:90. Quickly: Don’t get results at the gym as quickly102. Feel weaker 111. Less energy
50
What do you think happens when you don’t consistently take your protein? 55. Losing Muscle:56. Getting Smaller:57. More sore:58. Not filling: They don’t feel full
Are you taking protein supplements? 112. Yes
113. No
Where do you buy your protein supplements? 59. Amazon:60. Walmart:61. GNC:62. Bodybuilding.com:
94. Kroger
Why did you start using protein supplements or why do you use protein supplements? 63. Coaches advice64. To bulk up/add weight65. Friends did it
91. Curb hunger92. To burn fat93. Unhealthy diet: As transitioned to college life, started having a less healthy
lifestyle- as a part of trying to get healthy started using protein supplements.103. To help rebuild 114. Stronger: To get stronger 125. To relieve the pain after working out
Why did you stop using protein? 115. Stopped playing sports/exercising consistently/didn’t need to be as heavy of a weight.
How do you choose which protein supplements to use? 66. Taste: taste67. Read information : Read68. No information, just buy product: No info
Have you taken protein before? 69. Not taking protein now, but took protein in past: Past Protein70. Not taking protein regularly
Are you taking/eating protein enhanced food products? 132. Yes 133. No
51
Why do you use protein enhanced foods? 71. Meal Replacement: Replacement72. Not enough food/low energy intake: low intake
117. To get protein and not have to eat a shake
When using protein enhanced foods, do you also use a shake on those days too? 118. No, just alternate
Is there anything you would like to add about protein? 106. Protein is awesome 119. I love protein
73. Other
52
APPENDIX I
Sample Emails
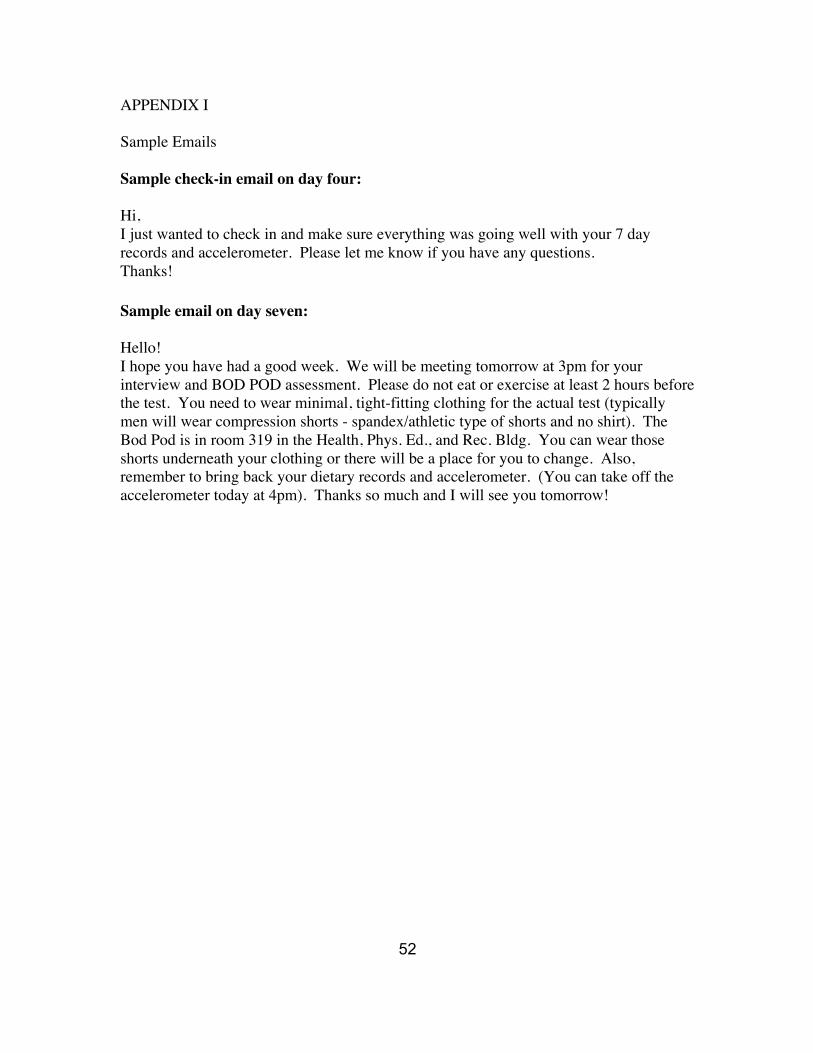
Sample check-in email on day four:
Hi, I just wanted to check in and make sure everything was going well with your 7 day records and accelerometer. Please let me know if you have any questions. Thanks!
Sample email on day seven:
Hello! I hope you have had a good week. We will be meeting tomorrow at 3pm for your interview and BOD POD assessment. Please do not eat or exercise at least 2 hours before the test. You need to wear minimal, tight-fitting clothing for the actual test (typically men will wear compression shorts - spandex/athletic type of shorts and no shirt). The Bod Pod is in room 319 in the Health, Phys. Ed., and Rec. Bldg. You can wear those shorts underneath your clothing or there will be a place for you to change. Also, remember to bring back your dietary records and accelerometer. (You can take off the accelerometer today at 4pm). Thanks so much and I will see you tomorrow!
53
APPENDIX J
54
VITA
Amy Sparks graduated from Appalachian State University in Boone, North
Carolina with a Bachelor of Science in Nutrition in August 2012. She began her Master’s
of Science in Nutrition with a concentration in public health from The University of
Tennessee in Knoxville in August 2012. She will finish her dietetic internship and
Master’s degree in August 2014 and hopes to start a job as a Registered Dietitian.
Copyright © 2022 FDOKUMEN