Protein-protein recognition: Method of finding complementary surfaces of interacting proteins
14
J. theor. Biol. (1984) 111, t7-30 Protein-Protein Recognition: Method for Finding Complementary Surfaces of Interacting Proteins PIOTR ZIELENKIEWICZ AND ANDRZEJ RABCZENKO Institute of Biochemistry and Biophysics, Polish Academy of Sciences Rakowiecka 36, 02-532 Warsaw, Poland (Received 1 August 1983, and in revised form 16 January 1984) A new method is described for searching for complementary surfaces of protein molecules from known coordinates of their non-hydrogen atoms. Each atom is assigned an arbitrary feature which is specific of its interac- tions with other atoms. The plots representing surfaces are generated. For each pair of surfaces a number of coincidences is calculated which increases as the number of contacts is increased between these atom pairs whose contribution to the energy of interaction is considered to be essential. The results obtained for the well-known autoassociation of insulin show the applicability of the method for the prediction of possible reaction modes between macromolecules. Introduction Extensive X-ray investigations have led to the identification of tertiary structures of numerous globular proteins in their crystal forms. Organization of coiled polypeptide chains into oligomers of specific structure has been much less frequently identified. Protein-protein recognition involves matching of pairs of surfaces endowed with specific properties which provide for so many attractive interactions that any competitive combination is ruled out as a possibility and that stability of the resulting aggregate is secured. It is then topology of the two surfaces that is essential and also the nature of interacting atom groups that counts. Several methods on analysis of protein-protein interactions have already been described. Some of the methods make use of known properties of the system (Levinthal et al., 1975; Salemme, 1976) and thus restrict the problem to study of interactions for a given protein-protein orientation. There are methods for describing the shapes of protein surfaces (Feldman et al., 1978; Greer & Bush, 1978; Morgan, Miller & McAldon, 1979) or subunit interfaces 17 0022-5193/84/210017+ 14 $03.00/0 © 1984 Academic Press Inc. (London) Ltd.
-
Upload
independent -
Category
Documents
-
view
2 -
download
0
Transcript of Protein-protein recognition: Method of finding complementary surfaces of interacting proteins

J. theor. Biol. (1984) 111, t7-30
Protein-Protein Recognition: Method for Finding Complementary Surfaces of
Interacting Proteins
PIOTR ZIELENKIEWICZ AND ANDRZEJ RABCZENKO
Institute of Biochemistry and Biophysics, Polish Academy of Sciences Rakowiecka 36, 02-532 Warsaw, Poland
(Received 1 August 1983, and in revised form 16 January 1984)
A new method is described for searching for complementary surfaces of protein molecules from known coordinates of their non-hydrogen atoms. Each atom is assigned an arbitrary feature which is specific of its interac- tions with other atoms.
The plots representing surfaces are generated. For each pair of surfaces a number of coincidences is calculated which increases as the number of contacts is increased between these atom pairs whose contribution to the energy of interaction is considered to be essential. The results obtained for the well-known autoassociation of insulin show the applicability of the method for the prediction of possible reaction modes between macromolecules.
Introduction
Extensive X-ray investigations have led to the identification of tertiary structures of numerous globular proteins in their crystal forms. Organization of coiled polypeptide chains into oligomers of specific structure has been much less frequently identified.
Protein-protein recognition involves matching of pairs of surfaces endowed with specific properties which provide for so many attractive interactions that any competitive combination is ruled out as a possibility and that stability o f the resulting aggregate is secured. It is then topology of the two surfaces that is essential and also the nature of interacting atom groups that counts.
Several methods on analysis of prote in-prote in interactions have already been described. Some of the methods make use of known properties of the system (Levinthal et al., 1975; Salemme, 1976) and thus restrict the problem to study of interactions for a given prote in-prote in orientation. There are methods for describing the shapes of protein surfaces (Feldman et al., 1978; Greer & Bush, 1978; Morgan, Miller & McAldon, 1979) or subunit interfaces
17
0022-5193/84/210017+ 14 $03.00/0 © 1984 Academic Press Inc. (London) Ltd.

18 P. Z I E L E N K I E W I C Z A N D A . R A B C Z E N K O
(Milner-White, 1982) in three dimensions. Although these methods were also used for given orientations only, a lot of data on oligomer structure can be extracted from the results. Interactive computer graphics method was used for the prediction of quarternary protein structure as well (Wistow et aL, 1981). The only automatic procedure for generating possible modes of protein-protein association was proposed by Wodak & Janin, 1978, who used a model in which each residue is replaced by one interaction centre. Possible modes of interaction between bovine pancreatic trypsin inhibitor and active site of trypsin were generated systematically with evaluation of non-bonded interactions and buried surface area. Different simp!ifying assumptions made in the methods mentioned above result from the com- plexity of protein-protein systems and large numbers of data to be processed.
Our purpose was to find an efficient computational method leading to the prediction of possible interaction modes from well-known atomic coor- dinates of subunits. In order to make searching over different protein orientations possible we decided to reduce the number of degrees of freedom namely by (i) assuming that the properties of interacting surfaces are of the prime importance for recognition and (ii) neglecting conformational changes and solvent effect. As a result of the above assumptions a lot of information of secondary importance is neglected restricting the problem of protein-protein recognition to searching for topologically complementary surfaces. The present paper sets out to describe a method for finding such surfaces by resolving three-dimensional surface topology into two- dimensional planar projections. The nature of interacting atoms is taken into consideration as an important factor in protein-protein recognition.
The method was tested on the well-known autoassociation of insulin.
Method
A S S U M P T I O N S
(i) Each atom may be assigned an arbitrary feature which is specific of its interactions with other atoms. The assignment of features may be likened to, e,g. colouring the van der Waals spheres, which symbolize the atoms, to suitable colours. Projection of the interacting surface onto a plane then constitutes a colourful mosaic; production of two closely similar colour compositions in the projections of two surfaces will represent the com- plementarity of interactions of the surface atoms.
(ii) The Cartesian coordinates of non-hydrogen atoms in the oligomer subunits are well known (taken from crystal structure studies).

C O M P L E M E N T A R I T Y O F P R O T E I N S U R F A C E S 19
(iii) Formation of the oligomer gives rise to no distortion in the tertiary structures of oligomer-forming subunits; in particular, the positions of the interacting surface atoms remain almost unchanged, at least so as to fail to affect the recognition event.
D E S C R I P T I O N O F M E T H O D
Two protein molecules A and B are taken into consideration, with coordinates of their non-hydrogen atoms well known. The molecule A is placed in the (°x, °3,, °z) Cartesian system of coordinates; (txk, lyk, lZk) are the coordinates of a kth atom in the molecule in the (Ix, ty, tz) system obtained by rotating the (°x, Oy, Oz) system through Euler angles la, 113 ' iT. Plane (Ix, ty) is scaled by a network of squares d × d in size. The network begins at a point (lxp, typ) (these are the coordinates of the square numbered 1-1 ), such that: txp < Ix k and Zyp < ty k for all /6
A layer of atoms d~ in thickness is projected normally onto the (Ix, ~y) plane so that the van der Waals sphere of an atom containing the coordinates of the centre of a network square causes the square to be attributed the feature characteristic of this atom (Fig. I). Elements of matrix tA then represent the network squares so that 1,4 U is an alphanumeric representation of the feature attributed to the i-j square. The initial size of the IA matrix chosen arbitrarily so that the matrix comprise the entire area of projection is then minimized for any l so as to reject all external empty rows and columns.
To each set of Euler angles corresponds a representation of the molecule A surface in the form of a matrix ~A.
Molecule B is treated in a strictly similar way while the direction of the Z-axis is being changed, to get a set of representations mB of the surfaces of this molecule.
A pair of surfaces is then sought which yields the maximum number of contacts tying up molecule A with molecule B. For this purpose, calculations were made of what was called the number of coincidences (NOC) for each pair of representations ~A, roB. Namely, pairs of consistent features to be assigned to atoms were defined and the initial point mxp, myp for the matrix "B was chosen in subsequent network nodes so as to find a maximum number of coincident elements of matrices ZA and mB which was termed the number of coincidences for a given pair of surface representations.
The number of coincidences thus defined increases as the number of contacts is increased between atom pairs whose contribution to the energy of interaction between molecules A and B is considered to be essential in terms of the properties of the interacting atoms.

iN
• m
m
mm
mm
nm
l
il
il
ll
i
nu
n
nu
n
• •
• m
mm
mm
m
mm
m
um
n
u
nn
n
u
mm
nn
m
nm
n
mn
m
mm
m
mm
m
mm
•
un
nn
nn
un
m
mu
nm
nn
mm
nm
m
un
nu
un
nu
un
u
nn
n
• u
nu
n
• n
n
u
tJ
c~
[olo
lolo
lOlO
lOlO
lOlO
lOlb
lolo
lolo
lOlO
lOlO
lO
EOlO
lOlO
lOlO
OlO
lOlO
lO10
1OlO
lOlO
o o
o o
o [o
lolo
lolo
lolo
lolo
lo[o
lOlo
lolo
lolo
o o
o o
[O
lOlO
lOlo
lOlo
lo
o01o
1+1+
111o
lolo
lolo
lo o
Io
lOlO
lOlO
lolo
lolo
l÷]O
l+l+
lnlO
lolo
lOlo
loJo
IO
lOlo
lolo
lo1+
1+
+ ,+
+le
lli,
lJlz
lOlo
lolo
lo"
o o
o o
o o
÷ +
+]+l
+l+l
+l+l
z]O
lOlO
lOlo
lo
Iolo
lolo
lol÷
l+l+
o +
]+l+
lol+
lilo
lolo
lolo
lo
rolo
tolo
|olt
l+ll
l÷]O
l÷l+
l+l+
l+l÷
lolO
lolo
lo
iolo
tOIo
lolJ
|llzJ
ll+J+
lOlO
l+t+
l+U
lOlO
lOtO
lO
IolO
lolll
llJltl
Il+l
+lO
l+t+
ltlll+
l+lo
lolo
bo
lotO
lOlO
lOtO
lllJl
il+t+
I÷l+
ltl+{
+l+l
olol
o iO
lOlO
tOlO
lolll
lllltl
+l+l
÷tol
+l+l
+lol
olol
o Io
lolo
lolo
lOIo
0 ~
t+l+
l+l+
loH
I+
lolo
lolo
lo
Iolo
lolo
lol+
lolz
l+l÷
l+l+
l+l+
l+J+
lolo
lolo
lo
IOlo
lolo
lol+
l÷l+
l÷l+
l+l+
l+lH
+l+
lOlo
lolo
lo
lOlO
lOlO
lOlo
÷1+
~+]÷
1+1+
1+1+
1+1+
1+1o
lolo
10
Io~
olo
lolo
lolO
l+l~
l+l+
llll
lll+
lol+
lolo
lolo
IO
lolo
lolo
foI0
10 0
+V
+l+
lnlz
l+lO
iOlo
lolo
lo
IOlO
lOlO
lOlO
Olo
[o]+
l+lO
tnl+
lOlO
lOlO
lolO
lo
IolO
lolo
lolo
lOIO
lO]O
lOlO
ltlzl
OlO
lOlO
o o
o
Iolo
lolo
lolo
lolO
lO o
Ol+
liJo
lolo
lolo
lolo
lo
Iolo
lOlO
lolo
lolo
)olO
lOlO
lolo
lolo
lolO
lolo
lo
IolO
lolO
lolo
o O
lOlO
lOlO
lOlO
lOlO
lOl;I
olol
o io
lolo
lolo
lolO
IOlm
lOlO
lOlo
lOlO
lOlo
lulo
loto
iO
lO|O
lOIO
lOlO
lO 0
0 0
0 o
OlO
lOlO
lOlO
lOIC
io
lolo
lolo
lolo
lolo
lOlo
loto
lolo
lo o
lolo
lolO
~
olo
lolo
lolo
lolo
lolo
lo o
o o
olo
o o
o o
FIG
. 1.
S
chem
atic
dia
gram
sho
win
g th
e id
ea o
f th
e al
ph
anu
mer
ic r
epre
sent
atio
ns o
f su
rfac
es.
The
lay
er o
f at
oms
is p
roje
cted
ont
o a
plan
e sc
aled
by
a ne
twor
k. T
he t
hick
ness
of
the
laye
r is
the
dis
tanc
e be
twee
n th
e ce
ntre
of
the
oute
rmos
t at
om a
nd t
he p
lane
. A
m
osai
c o
f fe
atur
es a
ssig
ned
to a
tom
s is
obt
aine
d as
a r
esul
t of
pro
ject
ion
(on
the
righ
t).
Suc
h m
osai
c is
the
n de
scri
bed
as a
mat
rix
cont
aini
ng a
lfan
umer
ic c
hara
cter
s re
pres
enti
ng t
he f
eatu
res.

C O M P L E M E N T A R I T Y O F P R O T E I N S U R F A C E S
T H E M O D E L S Y S T E M
21
The method was applied to the well-known autoassociation of insulin (Blundell et al., 1972; Dodson et al., 1979), The coordinates of non- hydrogen atoms were received from the Brookhaven Protein Data Bank (Bernstein et al., 1977).
Version I. Atoms were divided into the hydrophilic and hydrophobic categories. All oxygen and nitrogen atoms, carboxylic and carbonyl carbon atoms, C~ carbon atoms in the imidazole rings of histidines and carbon atoms of the guanidine groups in arginines were considered to be hydro- philic. All other non-hydrogen atoms were considered to be hydrophobic. Contact of the atoms endowed with identical features was regarded as a coincidence.
Version II. Additional features were introduced to signify carbonyl oxygen atoms and amine nitrogen atoms in the main chain, capable of forming hydrogen bonds. Contact between the carbonyl and the amine group was considered to be a coincidence.
Two characteristic surfaces were found for insulin monomer: one surface forming a dimer (of monomer contacts), and another surface forming a hexamer (of dimer contacts). Transformations were established of non- hydrogen atom coordinates such that the two surfaces could be projected onto an ( X - Y ) plane.
For the dimer-forming surface, the projected atom layer was adopted to be 0.5 nm (d~) thick; the projection surface was scaled with a network of 0-07 ×0.07 nm squares. The network was described by a matrix °D, initial size 100 × 100.
For the hexamer-forming surface, the projected atom layer was said to be 0-5 nm (d~) thick and the projection surface was again divided into squares 0-07 >(0.07 nm in size. The network was described by a matrix OH, initial size 100 × 100.
The non-empty elements of matrices °D and °H were alphanumeric representations of the features assigned to the atoms whose van der Waals spheres (with the radii obtained from Hobza & Zahradnik, 1980) were projected onto the network squares corresponding to these elements in a manner described under the Method.
A set of matrices PB was generated, corresponding to insulin monomer surfaces formed by rotating the coordinate axes through Euler angles varied at 30 ° intervals. The layer of projected atoms was 0.5 nm thick (dz); the network squares were d x d = 0-07 x0.07 nm in size.
The numbers of coincidences of each matrix PB with matrices °D and °H were evaluated.

22 P. ZIELENKIEWICZ AND A. RABCZENKO
The calculations were performed on CDC CYBER 73 computer. The average time required to produce one NOC value was approximately 2 sec.
R e s u l t s
T H E D I M E R - F O R M I N G S U R F A C E
For Version I of feature assignment the numbers of coincidences of matrices PB with matrix °D were calculated with the molecule B coordinate system rotated through angles varied at 30 ° intervals (Table l(a)).
T A B L E 1
Numbers of coincidences for the dimer-forming surfacet
T A B L E l(a)
OL
fl - 1 5 0 ° - 1 2 0 o - 9 0 ° - 6 0 ° - 3 0 ° 0 ° 30 ° 60 ° 90 ° 120 ° 150 ° 180 °
30 ° 11 11 14 13 9 9 12 6 13 8 8 8 60 ° 9 11 10 15 9 9 9 9 6 7 9 10 90 ° II 18 13 12 I1 9 11 8 11 10 10 13
120 ° 9 8 7 7 11 I0 12 9 18 10 11 11 150 ° 12 8 10 I0 12 9 10 17 12 10 13 13 180 ° 9 7 11 II 9 44 13 13 16 18 18 11 210 ° I1 10 10 17 11 I1 15 13 15 17 11 21 240 ° 18 8 12 12 11 9 6 6 I0 10 12 9 270 ° 10 11 8 8 I1 21 II 18 16 13 9 9 300 ° 8 18 9 I1 9 9 10 9 12 12 9 6 330 ° I I 10 16 II 18 13 9 11 12 12 8 II 360 ° I1 14 9 12 12 14 l0 10 13 9 9 16
t The n u m b e r s of co inc idences rep resen ted in the t ab le o b t a i n e d for different y angles c h a n g i n g wi th in the s a m e /3.
are the m a x i m a l n u m b e r s f rom these range a n d at the s a m e in terval as a,
A distinct absolute maximum, NOC = 44 (while other NOC values vary from 7 to 18), was found to occur at Euler angles of (0 °, 180 °, 0°).
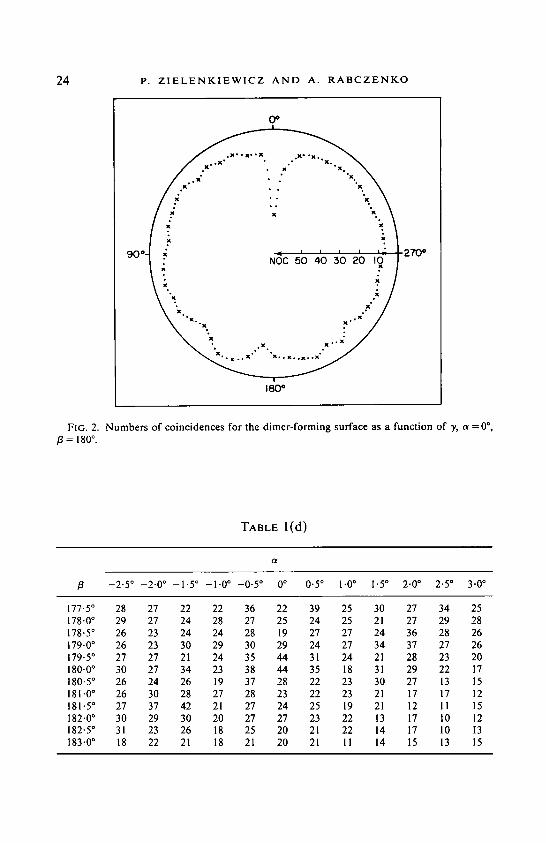
To locate the maximum more precisely, NOC values were calculated within the range of angles (0 °, 180 °, 0°)±15 ° varied at 3 ° and then within the range of angles (0 °, 180 °, 0 °) ±3 ° varied at 0.5 ° intervals.
Results (Tables l(b) and 1 (c); Fig. 2) confirmed that the global maximum (NOC = 44) occured at angles of (0 °, 180 °, 0°).

C O M P L E M E N T A R I T Y O F P R O T E I N S U R F A C E S
T A B L E l(b)
23
O/
/3 - 1 2 ° - 9 ° - 6 ° - 3 ° 0 ° 30 6 ° 9* 12 ° 15" 18 ° 21"
168 ° 15 8 I1 13 22 24 18 20 10 11 10 16 17t* 12 13 12 13 23 21 20 II 11 14 14 12 174 ° 12 13 16 24 21 23 14 11 10 11 10 16 177 ° t4 17 20 25 21 20 14 12 17 13 15 12 180 ° 14 13 17 25 44 17 12 14 11 12 14 13 183 ° 15 19 19 25 20 14 17 18 13 13 t l 11 186" 12 11 11 20 11 15 15 18 t7 11 11 I2 189 ° 11 15 13 16 12 12 t8 18 12 14 15 12 192 ° 12 14 13 19 12 12 18 21 18 20 16 12 195" 13 11 27 13 13 12 18 18 19 18 18 9 198 ° 11 10 14 15 15 12 14 18 19 19 18 18 201 ° 8 8 9 I1 9 10 15 13 18 18 19 18
The ratio of NOC to the number of matrix PB elements representing nonempty network squares was found to be one of the greatest at angles of (0 °, 180 °, 0°). Evidently, the high NOC-values are here due to specific surface properties and not due to a great number of projected atoms.
In Version II of feature assignment, NOC was evaluated within a range of angles (0 °, 180 °, 0°)+ 15 ° changed at 3 ° intervals (Table l(d)). Addi- tionally, Table l(e) lists the NOC values obtained for the range (0 °, 180 ° 0 °) + 3 ° when an identical feature was assigned to all the atoms. As can be
T A B L E I (C)
ot
/3 -2 -5 ° -2"0 ° -1"5" -10 -0"5 ° 0 ° 0"5 ° 1" 1'5 ° 2* 2"5 ° 3 °
177'5 ° 28 27 26 31 36 27 39 25 30 27 34 25 17800 ° 30 27 32 29 26 27 32 27 21 27 30 28 178.5 ° 28 23 36 25 28 20 31 33 24 36 28 26 179.0" 26 23 30 29 30 29 24 26 34 27 27 26 179-5 ° 27 27 21 24 35 44 32 24 23 29 30 20 180"0" 30 27 34 24 38 44 35 23 33 32 22 17 180-5" 29 24 26 23 37 29 23 24 30 27 17 16 181"0 ° 26 30 28 24 28 24 24 24 21 17 17 12 181-5" 27 37 42 28 27 24 27 t9 21 12 I2 16 t82"0 ° 30 29 30 22 27 27 23 21 19 17 10 12 182-5 ° 31 25 27 20 26 20 21 22 14 20 11 14 183-0" 21 26 21 19 21 21 22 22 14 t5 14 16
24 P. Z I E L E N K I E W I C Z A N D A. R A B C Z E N K O
O* L
9 o f x ........
180*
270*
FIG. 2. Numbers of coincidences for the dimer-forming surface as a function of y, ~ = 0 °, /3 = 180 o.
TABLE l(d)
/3 - 2 , 5 o - 2 , 0 o - 1 . 5 ° - 1 . 0 o - 0 - 5 ° 0 o 0 . 5 ° 1 . 0 o 1 . 5 ° 2 . 0 ° 2 . 5 ° 3 . 0 °
177.5 ° 28 27 22 22 36 22 39 25 30 27 34 25 178-0 ° 29 27 24 28 27 25 24 25 21 27 29 28 178.5 ° 26 23 24 24 28 19 27 27 24 36 28 26 179.0 ° 26 23 30 29 30 29 24 27 34 37 27 26 179.5 ° 27 27 21 24 35 44 31 24 21 28 23 20 180.0 ° 30 27 34 23 38 44 35 18 31 29 22 17 180.5 ° 26 24 26 19 37 28 22 23 30 27 13 15 181.0 ° 26 30 28 27 28 23 22 23 21 17 17 12 181.5 ° 27 37 42 21 27 24 25 19 21 12 11 15 182.0 ° 30 29 30 20 27 27 23 22 13 17 10 12 182-5 ° 31 23 26 18 25 20 21 22 14 17 10 I3 183.0 ° 18 22 21 18 21 20 21 II 14 15 13 15

C O M P L E M E N T A R I T Y O F P R O T E I N S U R F A C E S
TABLE 1 (e)
25
og
fl - 1 2 ° - 9 ° - 6 ° - 3 ° 0 ° 3 ° 6 ° 9 ° 12 ° . 15 ° 18 ° 21"
168 ° t5 15 15 15 23 26 18 21 21 13 15 16 171 ° 17 16 16 17 26 23 22 15 15 15 21 13 174 ° 19 16 17 24 21 28 20 17 15 17 15 15 177 ° 16 20 23 32 38 28 25 19 18 15 16 15 180 ° 15 16 24 29 56 25 20 15 15 15 15 16 183 ° 16 19 25 24 26 21 22 19 15 14 16 16 186 ° 15 17 16 22 16 20 19 21 19 15 15 17 189" 16 18 15 20 18 15 19 21 18 17 18 14 192 ° 18 21 15 19 13 15 18 22 19 20 17 15 195 ° 16 14 33 13 16 18 20 22 22 18 20 10 198" 18 20 15 15 14 12 16 18 22 22 19 18 201 ° 13 12 14 21 12 12 17 13 18 18 22 18
seen from Tables 1 (d), (e) in both cases the maximum NOC values (NOC = 44, NOC = 56 respectively) occured at Euler angles of (0 °, 180 °, 0°).
The above results show that variation o f the number of features assigned to the atoms has affected only the ratio of the maximum NOC values obtained with other representation pairs, but has not affected the position of the NOC maximum value.
THE H E X A M E R - F O R M I N G SURFACE
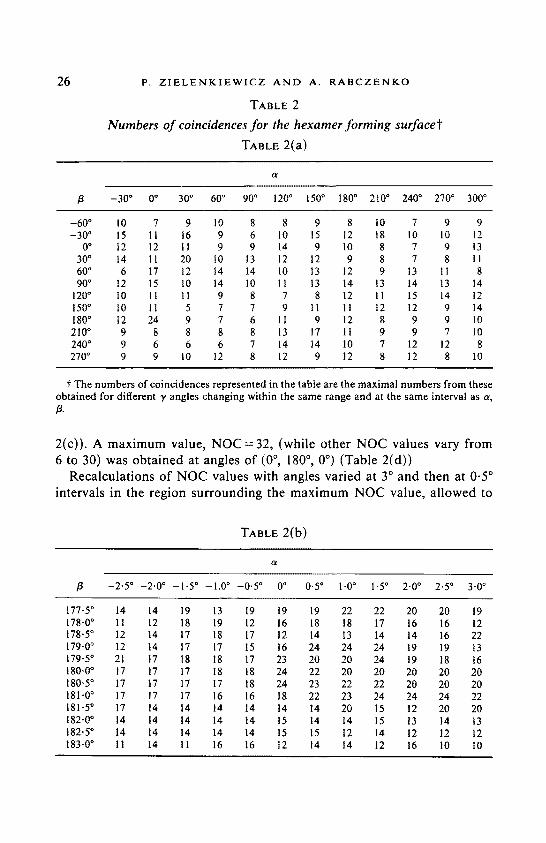
For Version I of feature assignment, NOC values were calculated for matrices PB and °H at angles of rotation of the molecule B coordinate system varied at 30 ° intervals. The maximum value, NOC = 24, (while other NOC values vary from 6 to 20) was obtained at the angles of (0 °, 180 °, 0 °) (Table 2(a)).
NOC values were next calcuated at Euler angles varied at 0-5 ° intervals in the region of the maximum NOC value. The maximum NOC, NOC = 24, was found to occur at numerous angle combinations (Table 2(b)). The effect of degeneration of the maximum, as well as the low maximum NOC value, are associated with the small number of projected atoms for the matrix under consideration.
Additionally, a new value for the thickness of the projected atom layer, d~=0.7 nm, was taken and new representations were obtained of the hexamer-forming surface °H' and of the monomer surfaces PB'.
For Version I of feature assignment, NOC values were calculated for matrices °H', and PB' and with Euler angles varied at 30 ° intervals (Table
26 P. Z I E L E N K I E W I C Z A N D A. R A B C Z E N K O
TABLE 2
Numbers of coincidences for the hexamer forming surfacet
TABLE 2(a)
Ot
/3 - 3 0 ° O* 30 ° 60 ° 90 ° 120 ° 150 ° 180 ° 210 ° 240 ° 270 ° 300 °
- 6 0 ° 10 7 9 10 8 8 9 8 t0 7 9 9 -30* 15 11 16 9 6 10 15 12 18 10 I0 I2
0 ° 12 12 11 9 9 14 9 10 8 7 9 13 30 ° 14 I1 20 10 13 12 12 9 8 7 8 11 60 ° 6 17 12 14 14 10 t3 12 9 13 11 8 90 ° 12 15 I0 14 10 11 13 14 13 14 13 14
120 ° I0 1t 11 9 8 7 8 12 11 15 14 12 150" 10 I1 5 7 7 9 11 I1 12 12 9 14 180 ° I2 24 9 7 6 I1 9 12 8 9 9 I0 210" 9 8 8 8 8 13 17 11 9 9 7 I0 240 ° 9 6 6 6 7 14 14 10 7 12 12 8 270 ° 9 9 10 12 8 12 9 12 8 12 8 10
t The numbers of coincidences represented in the table are the maximal numbers from these obtained for different , / ang les changing within the same range and at the same interval as a,
/3.
2(c)). A maximum value, NOC = 32, (while other NOC values vary from 6 to 30) was obtained at angles of (0 °, 180 °, 0 °) (Table 2(d))
Recalculations of NOC values with angles varied at 3 ° and then at 0.5 ° intervals in the region surrounding the maximum NOC value, allowed to
TABLE 2(b)
ot
/3 -2 -5 ° -2"0 ° - 1 ' 5 ° -1 .0" - 0 ' 5 ° 0 ° 0'5 ° 1"0 ° 1"5 ° 2.0* 2.5 ° 3.0 °
177'5 ° 14 14 19 13 19 19 19 22 22 20 20 19 178'0 ° 11 12 18 19 12 16 18 18 17 16 16 12 178-5 ° 12 14 17 18 17 12 14 13 14 14 16 22 179"0 ° 12 14 17 17 15 16 24 24 24 19 19 13 179-5 ° 21 17 18 18 17 23 20 20 24 19 18 t6 180-0" 17 17 17 18 18 24 22 20 20 20 20 20 180-5 ° 17 17 17 17 18 24 23 22 22 20 20 20 181-0 ° 17 17 17 16 16 18 22 23 24 24 24 22 181-5" 17 14 14 14 I4 14 14 20 15 12 20 20 182-0" 14 14 14 14 t4 15 14 14 15 13 14 13 t82"5 ° 14 14 14 14 14 15 15 12 14 12 12 12 183-0" I1 14 11 16 16 12 14 14 12 16 10 I0

C O M P L E M E N T A R I T Y O F P R O T E I N S U R F A C E S
T A B L E 2(C)
27
/3 -150" - 1 2 0 ° -90* - 6 0 ° - 3 0 ° 0" 30 ° 60 ° 90* "120 ° 150 ° 180"
30 ° 10 6 I0 10 II 25 20 16 23 14 11 12 60 ° 15 6 8 7 20 30 18 14 19 14 13 19 90 ° II 12 16 14 14 II I1 I0 18 12 16 9
120 ° 14 15 16 16 19 20 15 7 11 6 12 15 150 ° 14 16 13 20 21 13 8 7 9 12 12 15 180 ° 12 I0 8 17 13 32 12 9 9 12 15 14 210 ° 22 9 9 15 16 13 t8 14 10 15 12 14 240 ° 8 8 11 7 10 10 9 9 10 13 13 13 270 ° 9 10 11 7 9 9 7 9 9 11 9 7 300 ° 6 7 9 9 12 11 I1 6 9 11 7 11 330 ° 13 9 14 13 15 22 18 12 8 13 14 I4 360* 13 7 9 13 16 15 15 11 9 14 18 14
locate the global maximum value, NOC = 52, to occur at angles of (0 °, 180 °, 1.5 °) (Table 2(e)).
OTHER SURFACES
When representations other than °H and °D were taken for the first of the interacting surfaces, no distinct maximum was found to occur and the evaluated NOC maxima were rather low (Table 3).
T A B L E 2(d)
ot
/3 - 12 ° - 9 ° - 6 ° - 3 " 0 ° 3 ° 6 ° 9 ° 12 ° 15 ° 18 ° 21 °
168 ° 17 21 13 15 13 14 12 13 16 14 20 17 171 ° 15 13 16 13 13 19 11 13 12 19 15 18 174 ° 19 16 21 23 15 20 20 16 13 13 13 16 177 ° 19 19 29 25 21 21 22 18 28 15 22 25 180 ° 22 16 26 28 32 26 26 27 18 17 12 21 183 ° 17 23 19 16 17 18 18 21 23 16 21 12 186 ° 15 19 20 32 14 19 15 15 14 14 12 13 189 ° 15 15 11 14 13 17 15 25 12 t2 17 10 192 ° I4 16 14 13 17 14 14 14 10 12 12 11 195 ° 12 11 19 18 26 17 13 15 18 13 14 14 198" 20 17 27 22 20 14 18 13 13 8 13 10 201 ° 18 12 13 13 12 13 13 14 21 13 15 17

28 P. Z I E L E N K I E W I C Z A N D A. R A B C Z E N K O
TABLE 2(e)
ot
fl -2-5 ° -2-0 ° -1.5 ° -1-0 ° -0"5 ° 0 ° 0-5 ° 1"0 ° 1"5 ° 2"0 ° 2"5 ° 3"0 °
177.5 ° 30 34 34 34 32 23 24 17 19 13 15 12 178.0 ° 26 28 32 34 32 24 24 25 25 24 17 21 178.5 ° 34 32 37 38 30 27 26 28 25 23 20 22 179.0 ° 31 31 32 28 34 36 26 28 26 28 22 22 179-5 ° 30 32 32 28 37 36 26 26 26 26 22 25 180-0 ° 29 31 25 28 26 44 25 27 30 28 26 26 180.5 ° 27 31 26 26 26 25 36 36 27 36 47 36 181-0 ° 27 30 31 27 21 26 25 26 35 26 26 33 181.5 ° 33 25 24 25 22 32 30 30 35 23 25 18 182.0 ° 21 31 23 25 24 52 30 18 16 18 20 23 182-5 ° 14 34 26 26 26 21 24 27 27 18 16 24 183.0 ° 23 32 34 42 27 25 21 27 27 27 24 26
Discussion
It h a s b e e n d e m o n s t r a t e d tha t , w i t h t h e first o f t h e i n t e r a c t i n g s u r f a c e s
a s s u m e d to f o r m a d i m e r , t he n u m b e r o f c o i n c i d e n c e s a t t a i n s a d i s t i n c t
m a x i m u m at E u l e r a n g l e s o f (0 °, 180 °, 0°). T h i s i n d i c a t e s t h a t t h e m a x i m u m
n u m b e r o f i n t e r a c t i o n s b e t w e e n the m o n o m e r s is a c h i e v e d w h e n t h e y are
a s s o c i a t e d so as to e x h i b i t t h e ax i s o f t w o - f o l d s y m m e t r y . A s i m i l a r r e s u l t
w a s o b t a i n e d w h e n t h e s u r f a c e w a s a s s u m e d to f o r m a h e x a m e r , viz. , t h e
E u l e r a n g l e s a t w h i c h N O C a t t a i n e d m a x i m u m w e r e o n l y s l i g h t l y d e v i a n t
f r o m t h o s e d e s c r i b i n g t h e d i a d s y m m e t r y . T h u s , t h e d i m e r - a n d t h e h e x a m e r -
f o r m i n g s u r f a c e s r e p r e s e n t t he s e l f - c o m p l e m e n t a r y s u r f a c e s o f c h a r a c t e r i s t i c
s y m m e t r y .
O t h e r c h o i c e s o f t h e first f r o m t h e i n t e r a c t i n g s u r f a c e s h a v e l ed to l ow
m a x i m u m N O C v a l u e s a n d n o c o m p l e m e n t a r i t y . T h e f o r m a t i o n o f i n s u l i n
TABLE 3
Numbers of coincidences for other surfaces
Euler angles used to obtain the representation of the first of
interacting surfaces Maximal number of
coincidences
Euler angles of which the maximum was
attained
120°,240°,0° 16 30°,270°,120° 22 0 °, 0 °, 0 ° 23 300°,150°,120° 19
150 °, 60 °, 180 ° 330 ° , 30 ° , 240 ° 270 °, 180 °, 150 ° 300 °, 180 °, 150 °

C O M P L E M E N T A R I T Y O F P R O T E I N S U R F A C E S 29
hexamer is thus possible only on account of the existence of two unique monomer surfaces ensuring, by way of self-complementarity, a large number of interactions.
The results obtained are consistent with the insulin crystal form as described by Blundell et al., 1972 who found both the monomer and the dimer to exhibit the diad symmetry. Self-association of insulin, as well as of other proteins (Morgan et al., 1979), is thus accounted for by the occurrence of self-complementary surfaces with a character is t ic symmetry.
The quality of the results is obviously a function of thickness of the projected atom layer, cell size and grid search used. The thickness of atom layer determines the number of atoms projected onto a plane. As the projection loses the three-dimensional structure the layer should be carefully chosen to minimize the occurence of non-surface atoms in the projection. There is, of course, a simple method to avoid this problem namely by projecting the atoms in order of increasing z coordinate--but this will lengthen computation time. The cell size and grid search used determine the resolution of the method and thus the probability of obtaining valuable results.
The number of features assigned to atoms is also of importance but as can be seen from Table l(e) even simple overlapping criterion produces the high peak for angles of (0 °, 180 °, 0°). The schematic division into hydrophilic and hydrophobic categories, although simplified, seems to be good enough to produce valuable results as introducing additional features does not influence the results significantly (Table l(d)).
The choice of the parameters mentioned above should be determined by the knowledge of the system studied. Generally, the usage of data already available reduces computational effort needed to obtain valuable results. For example, as can be seen from Tables l(a), l(b), the 30 ° interval is too big for systematical search which was not our purpose here. Thus the high peak for angles of (0 °, 180 °, 0 °) results from the proper choice of the initial coordinate set.
Conclusions
The results obtained show the applicability of the method presented in this paper for the prediction of possible interaction modes between macromolecules. It has been demonstrated that existence of complementary surfaces results in high NOC values, whereas the "noise" values are rela- tively small.
Although the presented method is very simple and a lot of information is lost, enough data is secured to avoid oversimplification. The results

3 0 P. Z I E L E N K 1 E W I C Z A N D A. R A B C Z E N K O
obtained by this method should be treated as an introductory step for more detailed analysis involving the shapes of subunit interfaces in three dimensions. Such analysis, although impossible for all orientations, can be done easily (Greer & Bush, 1978; Milner-White, 1982) for surface pairs chosen by our method. The possibility of conformational changes for these surface pairs should be also examined.
The presented method allows to find surfaces endowed with the feature of complementarity, which appear to be essential in the process of mutual recognition. Diversification of interaction types makes it possible to identify "hot atom" groups, preferred interaction types, etc., according to the case considered.
The fact that even large systems can be treated by the presented method, makes the method a useful tool for describing possible interaction modes between macromolecules.
REFERENCES
BERNSTEIN, F. C., KOETZLE, T. K., WILLIAMS, G. J. B., MEYER, E. F. BRICE, M. D., ROGERS, J. R., KENNARD, O., S1MANOUCHI. T. & MITSUO, T. (1977). J. Mol. Biol. 112, 535-542.
BLUNDELL, Z., DODSON, O., HODGKIN, D. & MERCOLA, D. (1972). Adv. Protein Chem. 26, 279-402.
DODSON, E. J., DODSON, G. O., HODGKIN, D. C. & REYNOLDS, D. C. (1979). Can. J. Biochem. 57, 469-479.
FELDMAN, R. J., BING, D. H., FURIE, B. L. & FURIE, B. (1978). Proc. nat. Acad. Sci. U.S.A. 75, 5409-5412.
GREER, J. & BUSH, B. L. (1978). Proc. nat. Acad. Sci. U.S.A. 75, 303-307. HOBZA, B. & ZAHRADNIK, R. (1980). Weak Intermolecular Interactions in Chemistry and
Biology. Prague: Academia. LEVINTHAL, C., WODAK, S. J., KAHN, P. & DADIVANI^~,I A. (1975). Proc~ nat. Acad. Sci.
U S.A. 72, 1330-1334. MILNER-WHITE, E. J. (1982). Biochem. J. 205, 353-359. MORGAN, R. S., MILLER, S. L. & McALDON, J. M. (1979). J. tool. Biol. 127, 31-39. SALEMME, F. R. (1979). J. tool. Biol. 102, 563-568. W1STOW, G., SLINGSBY, C., BLUNDELL, T., DRIESSEN, H., DE JONG, W. & BLOEMENDAL,
H. (1981). FEBS Letters 133, 9-16. WODAK, S. J. & JANIN, J. (1978)~ J. tool. Biol. 124, 323-342.