
Nonlinear dynamics and the two-slit delayed experiment, J.S. Nicolis, G. Nicolis, C. Nicolis
Upload
independentCategory
view
1download
0
Protein Dynamics in Individual Human Cells: Experimentand TheoryAriel Aharon Cohen1., Tomer Kalisky2., Avi Mayo1., Naama Geva-Zatorsky1, Tamar Danon1, Irina
Issaeva1, Ronen Benjamine Kopito3, Natalie Perzov1, Ron Milo4, Alex Sigal5, Uri Alon1*
1 Department of Molecular Cell Biology, Weizmann Institute of Science, Rehovot, Israel, 2 Department of Bioengineering, Stanford University and Howard Hughes Medical
Institute, Stanford, California, United States of America, 3 Department of Materials and Interfaces, Weizmann Institute of Science, Rehovot, Israel, 4 Department of Systems
Biology, Harvard Medical School, Boston, Massachusetts, United States of America, 5 Division of Biology, California Institute of Technology, Pasadena, California, United
States of America
Abstract
A current challenge in biology is to understand the dynamics of protein circuits in living human cells. Can one define andtest equations for the dynamics and variability of a protein over time? Here, we address this experimentally andtheoretically, by means of accurate time-resolved measurements of endogenously tagged proteins in individual humancells. As a model system, we choose three stable proteins displaying cell-cycle–dependant dynamics. We find that proteinaccumulation with time per cell is quadratic for proteins with long mRNA life times and approximately linear for a proteinwith short mRNA lifetime. Both behaviors correspond to a classical model of transcription and translation. A stochasticmodel, in which genes slowly switch between ON and OFF states, captures measured cell–cell variability. The data suggests,in accordance with the model, that switching to the gene ON state is exponentially distributed and that the cell–celldistribution of protein levels can be approximated by a Gamma distribution throughout the cell cycle. These results suggestthat relatively simple models may describe protein dynamics in individual human cells.
Citation: Cohen AA, Kalisky T, Mayo A, Geva-Zatorsky N, Danon T, et al. (2009) Protein Dynamics in Individual Human Cells: Experiment and Theory. PLoS ONE 4(4):e4901. doi:10.1371/journal.pone.0004901
Editor: Mark Isalan, Center for Genomic Regulation, Spain
Received December 15, 2008; Accepted January 20, 2009; Published April 17, 2009
Copyright: � 2009 Cohen et al. This is an open-access article distributed under the terms of the Creative Commons Attribution License, which permitsunrestricted use, distribution, and reproduction in any medium, provided the original author and source are credited.
Funding: The authors received funding from the Kahn Family Foundation and the Israel Science Foundation. The funders had no role in study design, datacollection and analysis, decision to publish, or preparation of the manuscript.
Competing Interests: The authors have declared that no competing interests exist.
* E-mail: [email protected]
. These authors contributed equally to this work.
Introduction
A goal of systems biology is to understand the dynamics of
protein levels, as proteins are produced and degraded. One aims
for a mathematical description of these processes that captures the
essentials and that can be understood intuitively.
Most current models of protein dynamics have been established
and tested in micro-organisms. Proteins in bacterial cells, for
example, are well described by production-degradation equations.
These show that protein mass increases exponentially over time in
growing cells, and that protein concentration approaches steady-
state with exponential decays [1–5]. Such models have been shown
to be useful for describing the measured dynamics of protein circuits
with several interactions, such as feed-forward loop network motifs
[6] and auto-regulatory loops [4,7–9]. Similarly, experiment and
theory has established an understanding of cell-cell variability of
protein levels in bacterial and yeast cells [10–15]. Protein
distributions in micro-organisms have been measured at steady-
state and are well described by Gamma distributions [16,17].
Much less is known about the cell-cell variability of protein
dynamics in human cells [18]. Differences in expression levels
between individual cells of a clonal population were previously
observed [19–22] and related to stochastic processes. More
recently, Raj et al. [23] have followed mRNA and protein to
show bursts of mRNA production. Sigal et al. [24] measured
variability and memory in nuclear proteins, finding that the time it
takes for cells expressing a protein above or below the population
mean to ‘relax’ towards the average is longer than one cell
generation. More work is needed to understand the basic
dynamics and differences of human protein levels and its variation
across the cell cycle in individual cells.
To address this, we experimentally followed the dynamics of
selected human proteins in human cancer cells and test simple
models to describe these dynamics. The experiments were made
possible by recent advances in obtaining dynamics of endoge-
nously expressed proteins in individual human cells at very high
resolution and accuracy [25]. This is based on a library of cell
clones, each expressing a different fluorescently tagged protein
expressed from its natural chromosomal location and under its
native regulation. From this library, we chose three proteins that
accumulate throughout the cell cycle, but are degraded every time
that the cell divides. These proteins show little memory of previous
cell cycles, and thus are a good starting point for testing models
based on current cell properties. In the present study, we
calibrated this assay to provide units of protein concentration.
We find that the proteins are found to follow either an
approximately linear or a quadratic dependence on time. They
also differ in their onset time of production and in their variability
across the cell cycle. We find that these features can be understood
in terms of a single unified model. Approximately linear
accumulation results from short mRNA half-life, and quadratic
accumulation from long mRNA half-life, as suggested by
PLoS ONE | www.plosone.org 1 April 2009 | Volume 4 | Issue 4 | e4901

transcription inhibition experiments. Cell-cell variability of all
three proteins is consistent with a stochastic model with slow gene
ON- and OFF-transitions suggested by Raser and O’shea [14].
The measured cell-cell distribution of onset time of protein
accumulation supports such slow transitions. We further show
experimentally and theoretically that the protein distribution is
well approximated by a Gamma distribution (described in detail at
the results section) at all time points, even though dynamics are not
in steady-state. Finally, we show that memory of protein levels of
previous cell-cycles is lost due to the early degradation and
variability in onset times of protein production. In summary, the
present study presents a basis for future understanding of more
complex protein circuits in human cells.
Results
Dynamics of PRC1, ANLN, and YB1 in individual cellsWe used an approach for dynamic proteomics to measure the
protein levels of PRC1 (protein regulator of cytokinesis 1,
NM_003981), ANLN (anillin, NM_018685) and YB1 (Y-box
binding protein-1, NM_004559) in individual living human cancer
cells over several cell cycles. Cell clones were used in which these
genes are tagged at their endogenous chromosomal locus with
yellow fluorescent protein (EYFP) as an internal exon. The
proteins are expressed as full length proteins tagged with
fluorescent YFP (Figure S1). In each of the clones only one allele
is tagged. The clonal cell lines in which PRC1, ANLN and YB1
are tagged originate from the same parental cell (H1299 non small
cell lung cancer cell line).
The cells were followed using time-lapse fluorescence microscopy
in incubated conditions controlled for temperature, humidity and
CO2. This resulted in time-lapse movies over days of growth,
showing about 10–20 cells per frame at a 20 minute temporal
resolution. Movies were analyzed using automated image analysis
software [26]. Cell segmentation was achieved by means of a second,
red fluorescent labeling in these cells (see methods) that allowed
automated detection of the boundaries of the cell and of its nucleus.
The three proteins showed cell-cycle dependent dynamics
(Figure 1A for PRC1 and YB1 and Figure S7 and Figure S8 for
ANLN). The qualitative temporal and spatial dynamics observed
for all three tagged proteins agree with previous studies of the
native proteins [27–30] and are summarized below. PRC1
functions to organize microtubules during cell division. Newly
made PRC1 accumulates in the nucleus. Then, at mitosis it
localizes to the spindle poles and then, during cytokinesis, it
localizes to the cell midbody. Following cell division, the protein
concentrated at this spot is shuttled to one or both daughter cells
(for example, see Movies S1, S2, S3). Finally, the protein is
degraded in the first hours following cell division [27] (Figure 1B
and Figure S2A and S2C).
The second protein studied here, YB1, is a transcription and
translational regulator related to cell cycle events and other processes
[31]. It also shows cell-cycle dependent dynamics [32]. YB1
accumulates in the nucleus, and has a relatively constant level in
the cytoplasm (Figure S2B and S2D, Movies S4, S5, S6). Like PRC1,
it is degraded in the first hours following cell division (Figure 1C).
The third protein ANLN, is an actin bundling protein crucial for
abscission at the final stage of the cytokinesis and is involved in
coordinating the contractile activity of myosin [29,30]. It too is
degraded after cell division but accumulation over the cell cycle
occurs both in the nucleus and in the cytoplasm (Figure S7A, S8A
and S8B, Movies S7, S8, S9). For the sake of clarity we will focus from
here on on two proteins PRC1 and YB1. Data for ANLN, whose
behavior is similar to PRC1, appear in Figure S7 and Figure S8.
The degradation of these proteins in the early phase of the cell
cycle is useful for the present study because it minimizes the effects
of proteins carried over from previous generations. In practice, for
PRC1 there was no correlation across cell cycles (R = 0.0760.09
where R is the average Pearson correlation coefficient of
accumulated protein levels at equal time points at two consecutive
cell cycles of individual cells ), while YB1 showed weak correlation
between daughter and mother cells (R = 0.3860.18). See also
Figure S3A and S3B for correlations across cell cycles of total
protein levels and Text S1, part 1, for correlations of other
parameters across the cell cycle.
Calibration of fluorescence units in terms of protein levelsWe calibrated the YFP fluorescence from the movies in terms of
number of tagged protein concentrations and total number per
cell. Calibration of concentrations was achieved using fluorescence
correlation spectroscopy inside the cell’s cytoplasm [33] (detailed
in Methods). To estimate total protein in a cell, we used a nominal
cell volume of 46103 mm3 (estimated based on the measured area
of a cell ranging between 300–1500 m2 and an estimated height
ranging between 2–8 m). We find that PRC1 reaches estimated
maximal levels of about 250,000 molecules per cell on average,
and YB1 reaches levels of 500,000 molecules per cell. Quantita-
tively similar calibration results were also obtained by comparing
fluorescence of cells to that of purified GFP (see Methods). The
calibration factor (proteins per fluorescence units) was within a
factor of two for the different tagged proteins in this study.
Average protein accumulation increases with timelinearly for YB1 and quadratically for PRC1
Image analysis of the time-lapse movies allowed accurate
quantitation of the total protein level in each cell, defined as the
total YFP fluorescence within the cell boundaries. Cells were
synchronized in silico, by noting the time of each division event
[24,26]. Thus, cells could be aligned according to the time that has
elapsed since the last cell division (Figure 1B and 1C). Relative
error of the average fluorescence measurements between day-day
repeats is about 10%.
We first consider the average protein accumulation over the cell
population, and then, in the next sections, the variability between
cells. Protein accumulation was considered for each cell as the
increase of fluorescence above the basal fluorescence at the end of
the degradation event that occurs after division (see methods). The
protein accumulation onset was defined for each cell as the time at
which protein levels reached their minimum level. Each cell was
then synchronized to the protein accumulation onset time and
initial fluorescence levels were subtracted.
We find that the mean protein level increases over the cell cycle.
PRC1 showed a quadratic increase with time, P~a:t2, to good
accuracy (R2 = 0.99, relative error = 2%) (Figure 2A). In contrast,
YB1 showed an approximately linear increase with time, P~b:t,to good accuracy (R2 = 0.99, relative error = 1%) (Figure 2B and
Figure S5).
Model suggests that linear accumulation results fromunstable mRNA and quadratic accumulation from stablemRNA
To understand the different accumulation profiles, we used a
classical model of transcription and translation [34,35] (Figure 2C).
Here mRNA, r, is produced at rate kr and degraded at rate ar, so
thatdr
dt~kr{ar
:r. Protein is produced from the mRNA at rate
kp:r and degraded at rate ap, so that
dp
dt~kp
:r{ap:p. This model
Protein Dynamics in Human Cell
PLoS ONE | www.plosone.org 2 April 2009 | Volume 4 | Issue 4 | e4901

makes several predictions. First, the only way to fit the non-
saturating curves of both PRC1 and YB1 is to assume that protein
degradation is negligible (ap%1). In other words, protein life-time
exceeds the cell cycle, ,20 h in the present experiment. Second,
the model predicts that the quadratic accumulation of PRC1
corresponds to very long life-time of its mRNA, so that ar is
negligible. In this case r~kr:t, and protein increases quadratically
with time p~ 12:kr:kp:t2.
In contrast to this quadratic accumulation, the approximately
linear accumulation of YB1 is predicted to mainly result from a
high degradation rate of its mRNA. In this case the mRNA
concentration reaches a steady-state concentration, and as a result
protein level increases linearly with time, p~kr:kp
ar
:t.
Experiments indicate that PRC1 mRNA is stable and YB1mRNA is short-lived, and that both proteins are stable
To test the model predictions, we inhibited transcription by
adding a-amanitin, a commonly used transcription inhibitor [36].
This drug (at 100 mg/ml) completely shuts down the action of
RNA polymerase 2 in the cells, approximately 2 hours after
addition [37].
We found that after adding a-amanitin, PRC1 protein levels
began to accumulate linearly with time, as compared to the
quadratic accumulation without the drug (Figure 3A). In the case
of YB1, after a transient period of about 2 h after adding the drug,
protein levels stopped accumulating and remained at a constant
level (Figure 3B).
Fitting the differential equations describing mRNA and protein
levels to measured protein levels of YB1 following addition of a-
amanitin (detailed in Text S1 part 2) suggest an mRNA half life of
0.7760.2 hr21. Using this mRNA life-time in equations describing
behavior in un-perturbed cells, we find that mRNA levels reach 90%
of steady state in 3 hrs and 99% in 6 hrs. These results agree with the
model predictions, suggesting stable mRNA for PRC1, short-lived
mRNA for YB1. That both proteins are highly stable is evidenced by
the fact that their levels do not decrease following inhibitor addition.
In summary, this experiment supports the simple model predictions.
Experiments suggest that PRC1 (and ANLN) mRNAdegrades shortly after cell division
In–silico synchronization of trajectories of individual cells,
following addition of the transcription inhibitor a-amanitin, allows
Figure 1. Cell cycle–dependent behavior of PRC1 and YB1. (A) Each image is an overlay of the fluorescence of the tagged protein on thecorresponding phase-contrast image. One cell for each tagged protein is shown. Images are ordered according to the fraction of the time elapsedbetween two division events. The cells are automatically centered and neighboring cells are removed for clarity. The percentage of elapsed cell cycleis indicated at the bottom. Bar denotes 10 mm. Note the asymmetric partition of fluorescently tagged PRC1 between the two daughter cells followingcell division. (B,C) For each protein, PRC1 and YB1, tracks of 150 cells are plotted. Each line denotes the total cell fluorescence level as measuredduring the cell cycle of a single cell. Cells are in-silico synchronized to beginning of their cell cycle. Each cell has different cell cycle length (PRC1:m= 21.662 hr, YB1: 17.262 hr). Both proteins are degraded following cell division.doi:10.1371/journal.pone.0004901.g001
Protein Dynamics in Human Cell
PLoS ONE | www.plosone.org 3 April 2009 | Volume 4 | Issue 4 | e4901

Figure 2. Protein accumulation profile of PRC1 is quadratic and for YB1 is linear. (A) PRC1 total cell protein accumulation exhibits anapproximately quadratic profile while (B) YB1 accumulation profile is approximately linear. Each grey line denotes accumulation dynamics of anindividual cell. Protein accumulation onset time was defined for all cells as the time at which protein levels reached their minimum level. Black circlesdenote the mean total fluorescence. Red line is the fit calculated according to a simple model of transcription and translation as schematically shownin (C).doi:10.1371/journal.pone.0004901.g002
Figure 3. Transcription inhibitor reveals different mRNA stability for PRC1 and YB1. (A) Mean of total fluorescence of tagged PRC1 with(dashed line) and without (solid line) transcription inhibitor added at time 0 hrs. Following addition of transcription inhibitor protein levels continueto rise, though linearly instead of quadratically. This suggests that PRC1 is translated from stable mRNA. (B) Mean of total fluorescence of tagged YB1with (dashed line) and without (solid line) transcription inhibitor added at time 0 hrs. Following addition of transcription inhibitor protein levels ceaseto rise, suggesting YB1 is translated from unstable mRNA. Best fit of simple differential equations regarding mRNA and protein levels suggest that theinhibitor starts taking affect at time t~2:3+0:3 hrs and aR~0:77+0:2 hr{1 .doi:10.1371/journal.pone.0004901.g003
Protein Dynamics in Human Cell
PLoS ONE | www.plosone.org 4 April 2009 | Volume 4 | Issue 4 | e4901

studying effects of cell-cycle phase on the dynamics of the mRNA.
For each cell, we determined the time that elapsed between its
previous division and the time at which the drug was added. In the
case of PRC1 and ANLN, we found that cells, for which
transcription was blocked shortly after division, showed no protein
accumulation. In contrast, cells in which transcription was blocked
several hours after cell division showed significant accumulation of
protein that rose linearly with time (Figure 4A and 4B and Figure
S4 for PRC1 and Figure S8C for ANLN).
This indicates that mRNA is degraded after cell division. This
agrees with previous micro array experiments on synchronized
HeLa cell populations that show a sharp drop in PRC1 and ANLN
mRNA levels after cell division [38]. These findings support the use
of zero initial mRNA levels following cell division in the theoretical
models. In the case of YB1, no protein accumulation was observed
following addition of transcription inhibitor at any stage of the cell
cycle suggesting short mRNA half life.
Protein accumulation varies from cell to cellSo far we have discussed the average behavior of the cell
population observed in the movies. We now turn to analyze the
variability between different individual cells within the same clone.
We find that cells show a spread of trajectories around the mean
(Gray lines in Figure 2A and 2B). The individual-cell trajectories of
PRC1 are typically quadratic with time to a good approximation
(best fit of y~azb:tx to individual cell data is for x~1:8+0:2).
The individual-cell trajectories of YB1 have an approximately
linear dependence on time (best fit of y~azb:tx to individual cell
data is for x~1:35+0:2) (Figure S6). Thus, each cell follows the
mean behavior, but with somewhat different slope and (in the case
of PRC1), curvature.
We quantified this variation between cells using the noise
strength, defined by ratio of the variance to the mean. Thus, noise
strength, is NS = variance/mean. We note that a second common
measure, the coefficient of variation CV = std/mean was more
susceptible to noise in the present data. We find that the NS
increased over time for PRC1, and appeared to saturate with time
for YB1 (Figure 5A, circles). Thus, noise has different dynamics for
the two proteins.
We also found that different cells began to significantly
accumulate the proteins at different times after cell division. In
particular, there appeared to be a large cell-cell variation of such
‘onset times’ for PRC1 (Figure 5B). Some cells showed protein
accumulation after an hour and others after five or more hours.
We measured the distribution of the time at which protein levels
first begin to rise in each cell. We find that this distribution has an
exponential tail, with a decay time of 1.0260.36 hrs. For YB1, we
also find an exponential tail but with a shorter decay time
0.3760.09 hrs. This indicates that timing is less variable between
cells for YB1 (Figure 1C). For more details, see Text S1, part 7.
A model based on slow gene switching captures thevariability
To understand the present data on cell-cell variability, we
employed models for stochasticity in protein expression. The
observed exponential distribution of times for the onset of protein
accumulation is consistent with a slow process that turns
expression ON with a timescale of hours. This corresponds to a
picture, suggested in previous studies [11,14,20], and observed in
other studies [23,39], in which genes switch slowly from ON to
OFF states, and transcription occurs from the ON state alone
(Figure 5C). We find that such a stochastic model captures the
present data on noise strength (Figure 5A, solid lines), with
parameter sets shown in Figure 5D.
We also compared the data to a model with no gene switching.
This model is a straightforward stochastic version of the model of
Figure 2C where each rate is interpreted as a probability per unit
time. We found that such a model can only explain the extent of
the observed variability when one uses parameters that give very
low mRNA levels: only a few mRNA/cell leading to high
variability due to small-number fluctuations. Given our estimates
of several hundred thousand proteins per cell, this leads to a very
Figure 4. Transcription inhibitor reveals PRC1 mRNA degradesshortly after cell division. (A) Cells are classed into three groupsbased on the time of their division relative to the time of administrationof a-amanitin, a transcription inhibitor (time = 0 hrs). Top group –division before inhibitor addition, middle group – division duringinhibitor addition and bottom group – division after inhibitor addition.Right panel – 2 ml medium was exchanged with 2 ml fresh mediumcontaining 100 mg/ml a-amanitin (at t = 0 hrs), Left panel – 2 mlmedium was exchanged with 2 ml fresh medium (at t = 0 hrs. mockcontrol),. Each grey line denotes measurements of a single cell, blackline is a selected cell for eye guidance. (B) Cells dividing at later stages,relative to the time the transcription inhibitor was added, show reducedprotein production (Pearson correlation R = 20.73 p,0.01). Circles andsquares denote rates of protein production with and without atranscription inhibitor, respectively. Gray lines denote best linear fit toeach of the data sets.doi:10.1371/journal.pone.0004901.g004
Protein Dynamics in Human Cell
PLoS ONE | www.plosone.org 5 April 2009 | Volume 4 | Issue 4 | e4901

high translation rate in the model, in order to provide the observed
number of proteins/mRNA. Such a rate is at the limit of physical
limitations of the cell (maximal ribosomal packing along the
transcript, in Text S1 part 8).
In summary, the slow-switching model in which genes switch
from OFF to ON on the timescale of hours seems to generate the
large observed variability naturally, because of the long times
between opening and closing events, resulting in relatively rare
bursts of mRNA production [15,17,23,39,40]. Both models are
detailed in Text S1 parts 3 and 4
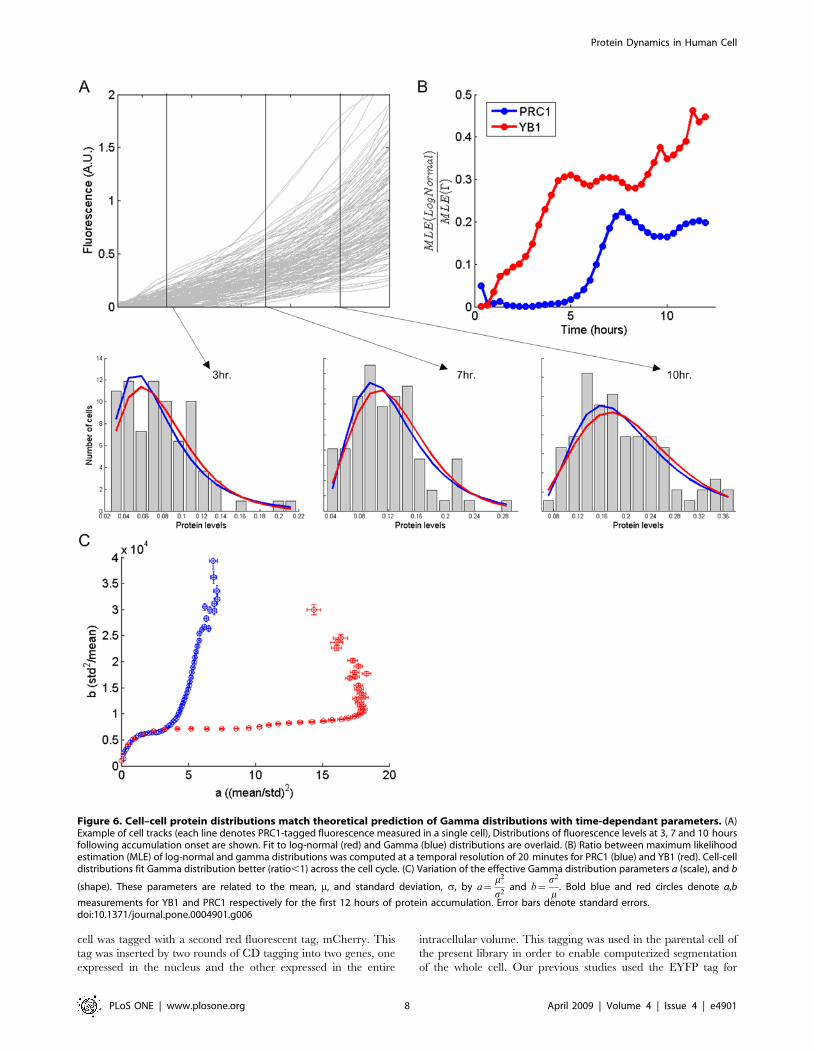
Cell–cell protein distributions match theoreticalprediction of Gamma distributions
Theoretical studies [10,17,40] have noted that the stochastic
model employed in our study should result in a cell-cell
distribution of protein levels that follows a Gamma distribution
(or, for very small protein numbers a related distribution known as
the negative binomial distribution [16]). Gamma distributions are
single-peaked distributions. They have a sharp peak and an
exponential tail at low average protein numbers, and have a bell-
shaped distribution at high average protein numbers. The formula
for the probability of having n proteins has two parameters, a and
b, and is:
G nð Þ~ na{1e{n=b
baC að Þ
where a = m2/s2 and b =s2/m (m and s denote mean and
standard deviation respectively). These theoretical results were
obtained for steady-state processes. Here, we extended this
theoretical analysis also to the case of dynamics that are not in
steady-state. The present system is out of steady state, because the
Figure 5. Variability of protein levels and accumulation onset times differs between PRC1 and YB1. (A) Noise strength (std2/mean) ofPRC1 rises linearly (blue circles) and of YB1 saturates (red circles). Both 2-step and 3-step stochastic models reproduce these profiles of noise strength(blue solid line for PRC1 and red solid line for YB1). (B) Time interval between end of degradation to beginning of accumulation for PRC1 in blue andYB1 in red. The time of accumulation has an exponential tail (decay rate of 0.6860.24 hr21 for PRC1 and of 1.8860.44 hr21 for YB1). (C) Schematic ofthree stage model, with slow transitions between open and closed DNA. (D) Parameter estimation based on the slow switching model. As explainedin the text, several parameters are estimated directly from the data, for PRC1; kon = 0.6860.24, ar = 0 and ap = 0. For YB1; kon = 1.8860.44,ar = 0.7760.2 and ap = 0. For the rest of the parameters, the model was fit to data (mean and noise strength) and kp and kr were determined for arange of koff. Red and blue circles denote YB1 and PRC1 respectively. Values of average mRNA levels over the cell cycle and koff are shown for severalparameters sets (filled circles).doi:10.1371/journal.pone.0004901.g005
Protein Dynamics in Human Cell
PLoS ONE | www.plosone.org 6 April 2009 | Volume 4 | Issue 4 | e4901

average protein level rises with time. We used a moment analysis
to determine the distribution at different time points (See Text S1
part 5). We found that after a short transient time, the predicted
cell-cell distributions at each time point are close to a Gamma
distribution, with parameters that vary over time.
We found that Gamma distributions describe the observed
experimental data well at all times. Gamma distributions seem to
describe the data better than other empirically suggested
distributions, such as Gaussian or log-normal distributions
(Figure 6A and 6B). The two parameters that define the Gamma
distribution (a and b), corresponding to the mean protein level and
the noise strength, vary over time (Figure 6C). We found that these
parameters vary in a different way for PRC1 and YB1, changing
in almost an orthogonal manner. These two parameters were
interpreted by Friedman et al [17,40] to represent burst size
(average number of protein molecules per burst) and burst
frequency (average frequency of expression bursts per cell cycle)
respectively.
Cellular mixing occurs at early stages of the cell cycle andis independent of protein accumulation patterns
Tracking changes of protein levels at the individual cell level
over time allows following the mixing of protein level ranking
between cells over time.. Cellular mixing occurs when a cell
lineage, given enough time, reaches the different states found in a
snapshot of a cell population. Mixing was measured using two
approaches (detailed by Sigal et al. [24] and in methods). The first
uses the auto-correlation function A(t) of the protein levels. The
second, an ergodic metric, ranked the cells according to tagged
protein fluorescence at the beginning of the movie, and followed
the fraction of the total ranks that each cell traversed as a function
of time (see Methods).
We measured mixing across the entire cell cycle and during the
shorter period of protein accumulation. While cells exhibit faster
mixing for PRC1 at the beginning of the cell cycle compared to
YB1 (Figure 7A), similar mixing was observed for both proteins in
the protein accumulation phase (Figure 7B), despite their different
accumulation rates (approximately constant for YB1 and linear for
PRC1). Loss of cellular memory of previous protein levels seems to
occur at early stages of the cell cycle due to degradation and
varying onset times of accumulation. Mixing occurs to a much
lesser extent in the accumulation phase of newly synthesized
proteins (Figure 7C and 7D).
Discussion
This study presented an experimental and theoretical analysis of
the detailed dynamics and variability of selected proteins in human
cells. This analysis was made possible by an experimental advance
that allows highly accurate, time-resolved measurement of proteins
expressed from their native chromosomal position, and under their
natural regulation, in individual cells. We chose proteins that are
degraded upon cell division and that accumulate throughout the
cell cycle, and which do not significantly carry memory of their
levels in the previous cell cycle.
We find either a linear accumulation with time or a quadratic
accumulation with time. Linear accumulation is found to
correspond to short mRNA life-time, and quadratic accumulation
to long mRNA life-time, in accord with simple transcription-
translation equations. The theoretical predictions were tested by
using a transcription inhibitor, which showed how quadratic
profiles turn to linear, and linear profiles turn to constant protein
levels, as predicted.
Note that linear and quadratic accumulation of total protein/
cell are quite different from the typical patterns found in bacteria,
in which total protein levels typically rise exponentially (or nearly
exponentially) across the cell cycle.
We also studied the cell-cell variability in the protein levels. A
model with slow transitions between ON and OFF gene states
captures the observed variability, including the exponential distribu-
tion of onset times and the Gamma-shaped cell-cell distribution of
protein levels. The extent of the noise seems to be too large to be
explained by stochastic models that lack slow ON-OFF transitions.
In addition to single-time point statistics, we also considered the
rate at which protein levels mix so that cells higher or lower than
average return to average. Except for a short period after cell
division, in which memory of previous levels is rapidly lost, the
protein levels seem to show a small extent of mixing, with
accumulation trajectories that are similarly shaped and roughly
parallel for different cells in the population. Thus, the proteins
display distinct cell-cell individuality over the cell cycle.
One may ask whether the different accumulation profile shapes
we observed for YB1 and PRC1 correspond to their biological
function. PRC1 is essential for the final stage of the cell cycle
[41,42], where it acts to control the spatiotemporal formation of the
midzone during cytokinesis. In contrast, YB1 is involved in
processes throughout the cell cycle [31], such as transcriptional
regulation, translational regulation, DNA repair, stress response and
cell proliferation. A quadratic accumulation as in PRC1 prepares
most of the protein in the last stage of the cell cycle. A linear
accumulation profile as in YB1 may be better suited for proteins that
need to serve the gradually growing cell content across the cell cycle.
This study raises the hope that relatively simple models might
accurately capture the behavior of protein dynamics. Future work
can explore whether such models can be used as building blocks to
understand more complex protein circuitry. It would be important
to further test this approach by measurements of additional
proteins. For this purpose, the present experimental approach may
be of use, especially in conjunction with a comprehensive library of
tagged human proteins [25], to characterize the mean and
individual cell behavior under diverse conditions.
Methods
YFP CD-tagging of endogenous proteinsPRC1 and YB1 were chosen from a library of tagged proteins in
the H1299 non-small cell lung carcinoma cell line. This library
was constructed as described in Sigal et al. [26]. Briefly, the
enhanced yellow fluorescent protein coding region (EYFP), flanked
with splice acceptor and donor sequences, was placed on a
retroviral vector (pBabeAE) and integrated into the genome.
Three vectors were used, one with EYFP in each reading frame.
EYFP is expressed when the virus integrates into an intron of an
expressed gene in the right frame and orientation, leading to
incorporation of YFP as a new exon in the spliced mRNA. This
method is known as Central-Dogma tagging (CD-tagging) [24–
26,43,44]. Cells positive for YFP fluorescence were sorted using
flow cytometry into 384-well plates and grown into cell clones.
Tagged protein identities were determined by 39-RACE (rapid
amplification of cDNA ends), using a nested polymerase chain
reaction (PCR) that amplified the section between EYFP and the
polyA tail of the mRNA of the host gene. PCR products were
sequenced directly and aligned to the genome.
Image analysis using a red tag in the parental cell lineThe present library has an additional feature which is crucial for
accurate image analysis, and which goes beyond [26] : the parental
Protein Dynamics in Human Cell
PLoS ONE | www.plosone.org 7 April 2009 | Volume 4 | Issue 4 | e4901
cell was tagged with a second red fluorescent tag, mCherry. This
tag was inserted by two rounds of CD tagging into two genes, one
expressed in the nucleus and the other expressed in the entire
intracellular volume. This tagging was used in the parental cell of
the present library in order to enable computerized segmentation
of the whole cell. Our previous studies used the EYFP tag for
Figure 6. Cell–cell protein distributions match theoretical prediction of Gamma distributions with time-dependant parameters. (A)Example of cell tracks (each line denotes PRC1-tagged fluorescence measured in a single cell), Distributions of fluorescence levels at 3, 7 and 10 hoursfollowing accumulation onset are shown. Fit to log-normal (red) and Gamma (blue) distributions are overlaid. (B) Ratio between maximum likelihoodestimation (MLE) of log-normal and gamma distributions was computed at a temporal resolution of 20 minutes for PRC1 (blue) and YB1 (red). Cell-celldistributions fit Gamma distribution better (ratio,1) across the cell cycle. (C) Variation of the effective Gamma distribution parameters a (scale), and b
(shape). These parameters are related to the mean, m, and standard deviation, s, by a~m2
s2and b~
s2
m. Bold blue and red circles denote a,b
measurements for YB1 and PRC1 respectively for the first 12 hours of protein accumulation. Error bars denote standard errors.doi:10.1371/journal.pone.0004901.g006
Protein Dynamics in Human Cell
PLoS ONE | www.plosone.org 8 April 2009 | Volume 4 | Issue 4 | e4901
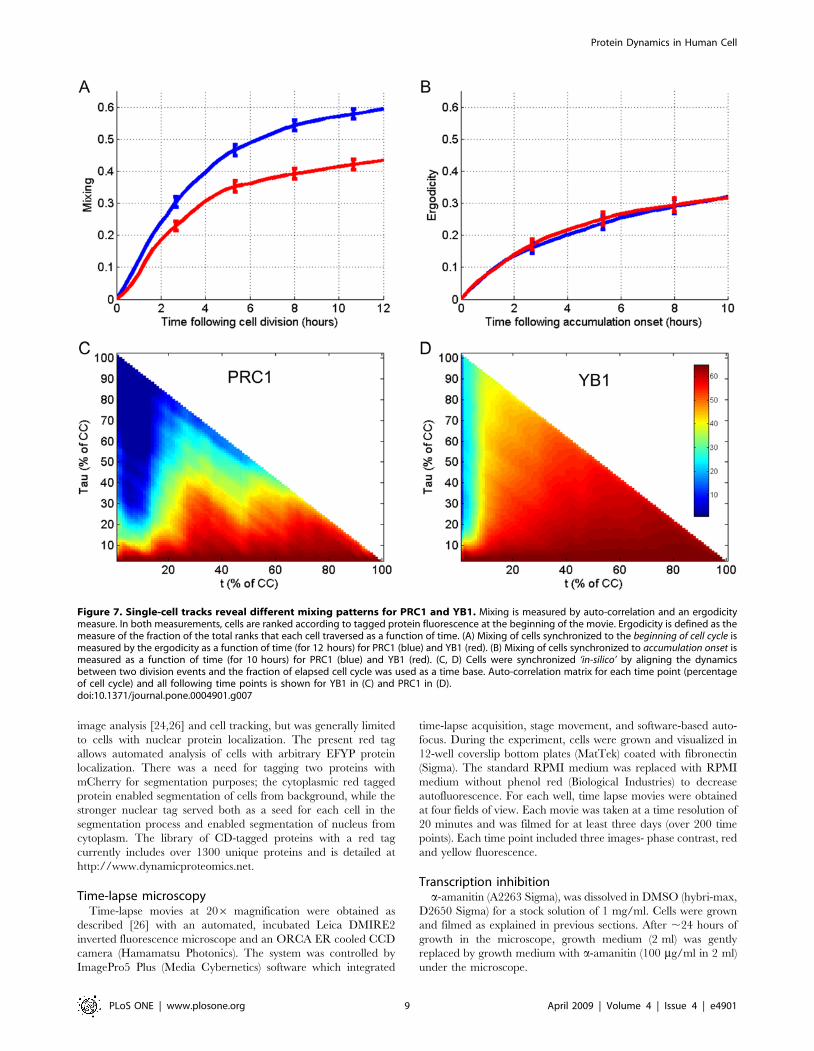
image analysis [24,26] and cell tracking, but was generally limited
to cells with nuclear protein localization. The present red tag
allows automated analysis of cells with arbitrary EFYP protein
localization. There was a need for tagging two proteins with
mCherry for segmentation purposes; the cytoplasmic red tagged
protein enabled segmentation of cells from background, while the
stronger nuclear tag served both as a seed for each cell in the
segmentation process and enabled segmentation of nucleus from
cytoplasm. The library of CD-tagged proteins with a red tag
currently includes over 1300 unique proteins and is detailed at
http://www.dynamicproteomics.net.
Time-lapse microscopyTime-lapse movies at 206 magnification were obtained as
described [26] with an automated, incubated Leica DMIRE2
inverted fluorescence microscope and an ORCA ER cooled CCD
camera (Hamamatsu Photonics). The system was controlled by
ImagePro5 Plus (Media Cybernetics) software which integrated
time-lapse acquisition, stage movement, and software-based auto-
focus. During the experiment, cells were grown and visualized in
12-well coverslip bottom plates (MatTek) coated with fibronectin
(Sigma). The standard RPMI medium was replaced with RPMI
medium without phenol red (Biological Industries) to decrease
autofluorescence. For each well, time lapse movies were obtained
at four fields of view. Each movie was taken at a time resolution of
20 minutes and was filmed for at least three days (over 200 time
points). Each time point included three images- phase contrast, red
and yellow fluorescence.
Transcription inhibitiona-amanitin (A2263 Sigma), was dissolved in DMSO (hybri-max,
D2650 Sigma) for a stock solution of 1 mg/ml. Cells were grown
and filmed as explained in previous sections. After ,24 hours of
growth in the microscope, growth medium (2 ml) was gently
replaced by growth medium with a-amanitin (100 mg/ml in 2 ml)
under the microscope.
Figure 7. Single-cell tracks reveal different mixing patterns for PRC1 and YB1. Mixing is measured by auto-correlation and an ergodicitymeasure. In both measurements, cells are ranked according to tagged protein fluorescence at the beginning of the movie. Ergodicity is defined as themeasure of the fraction of the total ranks that each cell traversed as a function of time. (A) Mixing of cells synchronized to the beginning of cell cycle ismeasured by the ergodicity as a function of time (for 12 hours) for PRC1 (blue) and YB1 (red). (B) Mixing of cells synchronized to accumulation onset ismeasured as a function of time (for 10 hours) for PRC1 (blue) and YB1 (red). (C, D) Cells were synchronized ‘in-silico’ by aligning the dynamicsbetween two division events and the fraction of elapsed cell cycle was used as a time base. Auto-correlation matrix for each time point (percentageof cell cycle) and all following time points is shown for YB1 in (C) and PRC1 in (D).doi:10.1371/journal.pone.0004901.g007
Protein Dynamics in Human Cell
PLoS ONE | www.plosone.org 9 April 2009 | Volume 4 | Issue 4 | e4901

Image analysis of time-lapse moviesCustom image analysis software performed cell tracking and
segmentation, and background and bleaching corrections (only
very low levels of bleaching ,3% occur in this experiment).
Segmentation was applied to images after flat-field correction and
background subtraction [26]. A seeded watershed segmentation
algorithm [45–47] was carried out on the red fluorescent images
using the strong fluorescence of the nuclei as seeds. Nuclei were
seperated from cytoplasm using the sharp difference of fluores-
cence between the nucleus and cytoplasm. Tracking of cells was
performed by analysing the movie from end to start and linking
each segmented cell to the cell in the previous image with the
closest centroid. Cell divisions were automatically detected by a
sharp twofold drop in total fluorescence between consecutive
images [26]. Tracking, bleaching and image corrections are
described in detail in [26]
Protein accumulation onset timesProtein accumulation onset was defined for each of the cells as
the time at which protein level reached its minimum level. To
compute the time delay between end of degradation to beginning
of accumulation, the minimum level of each cell was subtracted
from its profile. A threshold chosen to be 1 percent of the
maximum mean protein levels was computed. For each cell the
first and last time points in which the threshold was crossed were
denoted as the end of degradation and beginning of accumulation
phases, respectively. Results are robust to threshold levels between
0.03–3% of the maximum level.
Calibration of YFP fluorescence to protein moleculesCalibration between number of EYFP molecules and measured
fluorescence levels was carried out using Fluorescence Correlation
Spectroscopy (FCS) [48] for the protein YB1. The FCS specific
setup is detailed at Kopito et al. [33]. Cells were grown on standard
1-63-inch microscope slides and prior to measurement were
covered by glass coverslips and sealed immediately with paraffin
wax. Then laser illumination was calibrated to photon counts per
YFP in the YB1 sample.(about 400 photons per molecule within
illumination volume). Once calibrated, measurements were taken
from the cytoplasm of ,20 cells (cytoplasm concentrations are
relatively constant throughout the cell cycle). Mean photon count
in laser illumination volume (0.25 mm3) is 15,000 and equivalent
to about 37 protein molecules. Using mean cell volume to be
20620610 mm and cytoplasm to constitute 2/3 of the cell volume
and that protein amount in the cytoplasm is 1/5 of total protein
level at end of cell cycle (see Figure S2), sums up to ,500,000
molecules in cell at end of cell cycle. Mean total fluorescence at
end of cell cycle is ,400,000 thus leading to ,0.8 fluorescence
counts per molecule.
A second method for calibration used purified protein standards
in the following way: 5 mL of purified GFP solution containing
,1012 molecules of GFP were placed under a slide cover slip with
diameter of 13 mm. Images with linearly increasing exposure
times were taken in order to compute the gain of the mean pixel
level. Number of GFP molecules per pixel was computed (,7700)
and compared to the mean pixel fluorescence (,3000 fluorescence
A.U. per 1000 msec exposure), and summed up to ,0.4
fluorescence counts per molecule.
Estimation of of mRNA life time after cell divisionTime-lapse movies were acquired for several hours in 2 ml
RPMI medium. Then the medium was switched to 2 ml of
medium containing 100 nM of a-amanitin and time –lapse movie
acquisition was continued. Cells were manually chosen so that
only cells that were in the accumulation stage and did not divide
for 8 hours following drug adittion were used. To compare to
theory, mean of data was fit to two functions. The first describing
the mean behavior until the inhibitor becomes fully active (,2 hrs)
and the second from that stage allowing mRNA degradation rate
to be obtained (see Text S1, part 2).
Auto-correlation calculationThe auto-correlation function was computed with a robust
estimator A tð Þ~SSXi tð Þ:Xi tztð ÞTtTi
.SSXi tð Þ2TtTi, where av-
erages over time and over cells are denoted ,.t and ,.i
respectively. We measured the auto-correlation of the ranked total
fluorescence Ri(t), such that Xi tð Þ~Ri tð Þ{SRi tð ÞTi. This method
was less sensitive to outliers in the data than auto-correlation over
the total fluorescence [24,49].
Mixing (ergodic metric) calculationThe ergodic metric E tð Þ~Smax Ri 1ð Þ : Ri tð Þ½ �{min Ri 1ð Þ :½
Ri tð Þ�Ti
�N where the ranked total fluorescence at time t is denoted
Ri(t), average over cells is denoted ,.i and N is the number of cells
[24]. Thus this metric ranks the cells according to tagged protein
fluorescence at the beginning of the movie, and follows the fraction of
the total ranks that each cell traverses as a function of time.
Supporting Information
Figure S1 Immunoblots of YB1, PRC1, and ANLN with anti-
GFP. Estimated molecular weight of each protein without yellow
fluorescent tag is: YB1 ,36 kDa, PRC1 ,71 kDa and ANLN
,124 kDa. YFP ,27 kDa.
Found at: doi:10.1371/journal.pone.0004901.s001 (1.85 MB TIF)
Figure S2 Protein distribution within cellular compartments
during cell cycle. (A,B) Mean of total fluorescent levels in different
compartments of the cell (cyan - cytoplasm, magenta - nucleus and
black- whole cell) for PRC1 and YB1. (C,D) Mean of mean
fluorescent levels in different compartments of the cell (cyan -
cytoplasm, magenta - nucleus) for PRC1 and YB1. (E) Mean of
total fluorescent levels of 2 proteins tagged with mCherry in the
PRC1 and YB1 clones. The mCherry fluorescence and distribu-
tion is used for cell segmentation and tracking.
Found at: doi:10.1371/journal.pone.0004901.s002 (1.85 MB TIF)
Figure S3 Correlation across consecutive cell cycles. (A,B) cells
were tracked for two consecutive cell cycles. Shown is the
correlation matrix of each time point in first cell cycle and all
time points in the second cell cycle for PRC1 and YB1
respectively. Note that PRC1 doesn’t retain any memory across
cell cycles while YB1 shows relatively high correlation between
fluorescent levels of a mother cell and fluorescent levels in
daughter cell.
Found at: doi:10.1371/journal.pone.0004901.s003 (1.73 MB TIF)
Figure S4 Response of single cells expressing tagged PRC1 at
different stages of their cell cycle to transcription inhibitor reveal
mRNA degradation at beginning of cell cycle. (A) Cells were
divided into three groups based on the time of their division
relative to the time of administration of a-aminitin, a transcription
inhibitor (time = 0 hrs). Top group - division before drug addition,
middle group - division during drug addition and bottom group -
division after drug addition. Left panel - 2 ml medium was
exchanged with 2 ml fresh medium (at t = 0 hrs), right panel - 2 ml
medium was exchanged with 2 ml fresh medium containing
100 mg/ml a-aminitin (at t = 0 hrs). Each grey line denotes
measurements of a single cell, black line is a chosen cell for eye
Protein Dynamics in Human Cell
PLoS ONE | www.plosone.org 10 April 2009 | Volume 4 | Issue 4 | e4901

guidance. Note that as cell divide later in the experiment the slope
of protein levels decreases. (B) all trajectories of right panel
overlaid and color ordered based on time of cell division, early
divisions in blue and late divisions in red.
Found at: doi:10.1371/journal.pone.0004901.s004 (2.21 MB TIF)
Figure S5 Single cell trajectories display linear profiles in the
case of YB1 and quadratic profiles in the case of PRC1. Each
single cell trajectory denoting fluorescent levels measured over the
cell cycle was fit to a polynomial function of first and second
degree. Plotted are the pearson correlation coefficient values (R2)
of the experimental data and the fit for PRC1 (red) and YB1 (blue).
All trajectories of YB1 showed R2.0.9 already in the linear fit,
while PRC1 showed R2.0.9 for all cells only when using a
polynomial of 2nd degree.
Found at: doi:10.1371/journal.pone.0004901.s005 (0.71 MB TIF)
Figure S6 Coefficient of Variance (CV) of PRC1 and YB1. CV
of PRC1 (blue) and YB1 (red) of protein levls across cells
synchronized to the beginning of protein accumulation. Inset
denotes the CV of the first 4 hours.
Found at: doi:10.1371/journal.pone.0004901.s006 (1.35 MB TIF)
Figure S7 Cell cycle dependent behavior of ANLN. (A) Example
of one cell automatically tracked through the cell cycle. Each
image is an overlay of fluorescent tagged protein on phase contrast
image. Images are ordered according to the fraction of the time
elapsed between two division events. The cells are automatically
centered. The percentage of elapsed cell cycle is indicated at the
bottom, Bar, 10 mm. Note asymmetric division of fluorescently
tagged PRC1 between the two daughter cells following cell
division. (B,C) For each protein, PRC1 and YB1 tracks of 150 cells
are plotted. Each line denotes the total fluorescence level as
measured during the cell cycle of a single cell. Cells are
synchronized to beginning of cell cycle. Each cell has different
cell cycle length (PRC1: m= 21.662 hrs, YB1: 17.262 hrs). Both
proteins are degraded following cell division.
Found at: doi:10.1371/journal.pone.0004901.s007 (1.52 MB TIF)
Figure S8 Cell cycle dependent behavior of ANLN. (A) Mean of
total fluorescent levels in different compartments of the cell (cyan -
cytoplasm, magenta - nucleus and black- whole cell). (B) Mean of
mean fluorescent levels in different compartments of the cell (cyan
- cytoplasm, magenta - nucleus). (C) The same as Legend of figure
S5A just for ANLN.
Found at: doi:10.1371/journal.pone.0004901.s008 (0.10 MB TIF)
Text S1
Found at: doi:10.1371/journal.pone.0004901.s009 (0.61 MB
PDF)
Movie S1 Time-lapse movie of transmitted light images of the
clone with YFP CD-tagged PRC1. Movie duration is 46 hours.
(time-lapse: 1 frame per 20 minutes).
Found at: doi:10.1371/journal.pone.0004901.s010 (1.93 MB AVI)
Movie S2 Time-lapse movie of yellow fluorescence images of the
clone with YFP CD-tagged PRC1. Movie duration is 46 hours.
(time-lapse: 1 frame per 20 minutes).
Found at: doi:10.1371/journal.pone.0004901.s011 (2.82 MB AVI)
Movie S3 Time-lapse movie of yellow fluorescence images
overlaid on transmitted light images of the clone with YFP CD-
tagged PRC1. Movie duration is 46 hours. (time-lapse: 1 frame
per 20 minutes).
Found at: doi:10.1371/journal.pone.0004901.s012 (2.03 MB AVI)
Movie S4 Time-lapse movie of transmitted light images of the
clone with YFP CD-tagged YB1. Movie duration is 46 hours.
(time-lapse: 1 frame per 20 minutes).
Found at: doi:10.1371/journal.pone.0004901.s013 (2.25 MB AVI)
Movie S5 Time-lapse movie of yellow fluorescence images of the
clone with YFP CD-tagged YB1. Movie duration is 46 hours.
(time-lapse: 1 frame per 20 minutes).
Found at: doi:10.1371/journal.pone.0004901.s014 (3.61 MB
MPG)
Movie S6 Time-lapse movie of yellow fluorescence images
overlaid on transmitted light images of the clone with YFP CD-
tagged YB1. Movie duration is 46 hours. (time-lapse: 1 frame per
20 minutes).
Found at: doi:10.1371/journal.pone.0004901.s015 (2.39 MB AVI)
Movie S7 Time-lapse movie of transmitted light images of the
clone with YFP CD-tagged ANLN. Movie duration is 46 hours.
(time-lapse: 1 frame per 20 minutes).
Found at: doi:10.1371/journal.pone.0004901.s016 (1.60 MB AVI)
Movie S8 Time-lapse movie of yellow fluorescence images of the
clone with YFP CD-tagged ANLN. Movie duration is 46 hours.
(time-lapse: 1 frame per 20 minutes).
Found at: doi:10.1371/journal.pone.0004901.s017 (1.12 MB AVI)
Movie S9 Time-lapse movie of yellow fluorescence images
overlaid on transmitted light images of the clone with YFP CD-
tagged ANLN. Movie duration is 46 hours. (time-lapse: 1 frame
per 20 minutes).
Found at: doi:10.1371/journal.pone.0004901.s018 (1.76 MB AVI)
Acknowledgments
We thank the Kahn Family Foundation and the Israel Science Foundation
for support. We thank Michael Elbaum and his lab for discussions and
assistance with the calibration of fluorescence levels.
Author Contributions
Conceived and designed the experiments: AAC TK AEM AS UA.
Performed the experiments: AAC NGZ TD II NP. Analyzed the data:
AAC TK AEM. Contributed reagents/materials/analysis tools: RBK RM
AS. Wrote the paper: AAC TK AEM UA.
References
1. Price VE, Sterling WR, Tarantola VA, Hartley RW Jr, Rechcigl M Jr (1962)
The Kinetics of Catalase Synthesis and Destruction in Vivo. J Biol Chem 237:
3468–3475.
2. Hargrove J, Schmidt F (1989) The role of mRNA and protein stability in gene
expression. FASEB J 3: 2360–2370.
3. Monod J, Pappenheimer AM Jr, Cohen-Bazire G (1952) [The kinetics of the
biosynthesis of beta-galactosidase in Escherichia coli as a function of growth.].
Biochim Biophys Acta 9: 648–660.
4. Rosenfeld N, Elowitz MB, Alon U (2002) Negative autoregulation speeds the
response times of transcription networks. J Mol Biol 323: 785–793.
5. Rosenfeld N, Alon U (2003) Response delays and the structure of transcription
networks. J Mol Biol 329: 645–654.
6. Mangan S, Alon U (2003) Structure and function of the feed-forward loop
network motif. Proc Natl Acad Sci U S A 100: 11980–11985.
7. Becskei A, Serrano L (2000) Engineering stability in gene networks by
autoregulation. Nature 405: 590–593.
8. Alon U (2007) An Introduction to Systems Biology: Design Principles of
Biological Circuits: Chapman & Hall/CRC.
9. Alon U (2007) Network motifs: theory and experimental approaches. Nat Rev
Genet 8: 450–461.
10. Ozbudak EM, Thattai M, Kurtser I, Grossman AD, van Oudenaarden A (2002)
Regulation of noise in the expression of a single gene. Nat Genet 31: 69–73.
11. Blake WJ, M KA, Cantor CR, Collins JJ (2003) Noise in eukaryotic gene
expression. Nature 422: 633–637.
Protein Dynamics in Human Cell
PLoS ONE | www.plosone.org 11 April 2009 | Volume 4 | Issue 4 | e4901

12. Elowitz MB, Levine AJ, Siggia ED, Swain PS (2002) Stochastic gene expression
in a single cell. Science 297: 1183–1186.
13. Chabot JR, Pedraza JM, Luitel P, van Oudenaarden A (2007) Stochastic gene
expression out-of-steady-state in the cyanobacterial circadian clock. Nature 450:
1249–1252.
14. Raser JM, O’Shea EK (2004) Control of stochasticity in eukaryotic gene
expression. Science 304: 1811–1814.
15. Golding I, Paulsson J, Zawilski SM, Cox EC (2005) Real-time kinetics of gene
activity in individual bacteria. Cell 123: 1025–1036.
16. Paulsson J, Ehrenberg M (2000) Random signal fluctuations can reduce random
fluctuations in regulated components of chemical regulatory networks. Phys Rev
Lett 84: 5447–5450.
17. Friedman N, Cai L, Xie XS (2006) Linking stochastic dynamics to population
distribution: an analytical framework of gene expression. Phys Rev Lett 97:
168302.
18. Raser JM, O’Shea EK (2005) Noise in gene expression: origins, consequences,
and control. Science 309: 2010–2013.
19. Ko MS, Nakauchi H, Takahashi N (1990) The dose dependence of
glucocorticoid-inducible gene expression results from changes in the number
of transcriptionally active templates. 9: 2835–2842.
20. Ross IL, Browne CM, Hume DA (1994) Transcription of individual genes in
eukaryotic cells occurs randomly and infrequently. Immunol Cell Biol 72:
177–185.
21. Weinberger LS, Burnett JC, Toettcher JE, Arkin AP, Schaffer DV (2005)
Stochastic gene expression in a lentiviral positive-feedback loop: HIV-1 Tat
fluctuations drive phenotypic diversity. Cell 122: 169–182.
22. Walters MC, Fiering S, Eidemiller J, Magis W, Groudine M, et al. (1995)
Enhancers increase the probability but not the level of gene expression. Proc
Natl Acad Sci U S A 92: 7125–7129.
23. Raj A, Peskin CS, Tranchina D, Vargas DY, Tyagi S (2006) Stochastic mRNA
synthesis in mammalian cells. PLoS Biol 4: e309. doi:10.1371/journal.
pbio.0040309.
24. Sigal A, Milo R, Cohen A, Geva-Zatorsky N, Klein Y, et al. (2006) Variability
and memory of protein levels in human cells. Nature 444: 643–646.
25. Sigal A, Danon T, Cohen A, Milo R, Geva-Zatorsky N, et al. (2007) Generation
of a fluorescently labeled endogenous protein library in living human cells. Nat
Protoc 2: 1515–1527.
26. Sigal A, Milo R, Cohen A, Geva-Zatorsky N, Klein Y, et al. (2006) Dynamic
proteomics in individual human cells uncovers widespread cell-cycle dependence
of nuclear proteins. Nat Methods 3: 525–531.
27. Jiang W, Jimenez G, Wells NJ, Hope TJ, Wahl GM, et al. (1998) PRC1: a
human mitotic spindle-associated CDK substrate protein required for cytoki-
nesis. Mol Cell 2: 877–885.
28. Jurchott K, Bergmann S, Stein U, Walther W, Janz M, et al. (2003) YB-1 as a
cell cycle regulated transcription factor facilitating cyclin A and cyclin B1 gene
expression. J Biol Chem. M212966200. doi:10.1074/jbc.M212966200.
29. Field CM, Alberts BM (1995) Anillin, a contractile ring protein that cycles from
the nucleus to the cell cortex. J Cell Biol 131: 165–178.
30. Straight AF, Field CM, Mitchison TJ (2005) Anillin binds nonmuscle myosin II
and regulates the contractile ring. Mol Biol Cell 16: 193–201.31. Kohno K, Izumi H, Uchiumi T, Ashizuka M, Kuwano M (2003) The
pleiotropic functions of the Y-box-binding protein, YB-1. Bioessays 25: 691–698.
32. Jurchott K, Bergmann S, Stein U, Walther W, Janz M, et al. (2003) YB-1 as acell cycle-regulated transcription factor facilitating cyclin A and cyclin B1 gene
expression. J Biol Chem 278: 27988–27996.33. Kopito RB, Elbaum M (2007) Reversibility in nucleocytoplasmic transport. Proc
Natl Acad Sci U S A 104: 12743–12748.
34. Thattai M, van Oudenaarden A (2001) Intrinsic noise in gene regulatorynetworks. 98: 8614–8619.
35. McAdams HH, Arkin A (1997) Stochastic mechanisms in gene expression. ProcNatl Acad Sci U S A 94: 814–819.
36. Lindell TJ, Weinberg F, Morris PW, Roeder RG, Rutter WJ (1970) Specificinhibition of nuclear RNA polymerase II by alpha-amanitin. Science 170:
447–449.
37. Nguyen VT, Giannoni F, Dubois MF, Seo SJ, Vigneron M, et al. (1996) In vivodegradation of RNA polymerase II largest subunit triggered by alpha-amanitin.
Nucleic Acids Res 24: 2924–2929.38. Whitfield ML, Sherlock G, Saldanha AJ, Murray JI, Ball CA, et al. (2002)
Identification of genes periodically expressed in the human cell cycle and their
expression in tumors. Mol Biol Cell 13: 1977–2000.39. Chubb JR, Trcek T, Shenoy SM, Singer RH (2006) Transcriptional pulsing of a
developmental gene. Curr Biol 16: 1018–1025.40. Cai L, Friedman N, Xie XS (2006) Stochastic protein expression in individual
cells at the single molecule level. Nature 440: 358–362.41. Mollinari C, Kleman JP, Jiang W, Schoehn G, Hunter T, et al. (2002) PRC1 is a
microtubule binding and bundling protein essential to maintain the mitotic
spindle midzone. J Cell Biol 157: 1175–1186.42. Zhu C, Lau E, Schwarzenbacher R, Bossy-Wetzel E, Jiang W (2006)
Spatiotemporal control of spindle midzone formation by PRC1 in human cells.Proc Natl Acad Sci U S A 103: 6196–6201.
43. Jarvik JW, Adler SA, Telmer CA, Subramaniam V, Lopez AJ (1996) CD-
tagging: a new approach to gene and protein discovery and analysis.Biotechniques 20: 896–904.
44. Jarvik JW, Fisher GW, Shi C, Hennen L, Hauser C, et al. (2002) In vivofunctional proteomics: mammalian genome annotation using CD-tagging.
Biotechniques 33: 852–854, 856, 858–860 passim.45. Vincent L (1993) Morphological grayscale reconstruction in image analysis:
Applications and efficient algorithms. IEEE Trans Image Process 2: 176–201.
46. Vincent L, Soille P (1991) Watersheds in digital spaces: an efficient algorithmbased on immersion simulations. IEEE Trans Pattern Anal Mach Intell 13:
583–597.47. Beucher S (1992) The watershed transformation applied to image segmentation.
Scanning Microsc 6: 299–314.
48. Chen Y, Muller JD, So PT, Gratton E (1999) The photon counting histogram influorescence fluctuation spectroscopy. Biophys J 77: 553–567.
49. Rosenfeld NY, Young JW, Alon U, Swain PS, Elowitz MB (2005) Generegulation at the single cell level. 307: 1962–1965.
Protein Dynamics in Human Cell
PLoS ONE | www.plosone.org 12 April 2009 | Volume 4 | Issue 4 | e4901
Copyright © 2022 FDOKUMEN