Protecting a Pumping Pipeline System from Low Pressure ...
22
water Article Protecting a Pumping Pipeline System from Low Pressure Transients by Using Air Pockets: A Case Study Rafael Bernardo Carmona-Paredes , Oscar Pozos-Estrada *, Libia Georgina Carmona-Paredes, Alejandro Sánchez-Huerta, Eduardo Antonio Rodal-Canales and Germán Jorge Carmona-Paredes Instituto de Ingeniería, Department of Hydraulic Engineering, Universidad Nacional Autónoma de México, Cd. Universitaria, C.P. 04510 Mexico City, Mexico * Correspondence: [email protected]; Tel.: +52-55-5623-3600 Received: 10 July 2019; Accepted: 26 August 2019; Published: 28 August 2019 Abstract: This paper presents a case study of an existing water pipeline with five pumping stations each equipped with five pumps. In order to study the pipeline behavior prior to putting the system into operation, several transient simulations for different scenarios were developed. Results revealed that the most serious situation occurred when a simultaneous failure of the five pumps occur at each station caused by power cut, producing negative pressure waves because the system for control of hydraulic transients of the pipeline was insufficient to suppress downsurge pressures, due to the moment of inertia of all the pumps being erroneously considered during the design stage. The necessity to start supplying water to the population led to attempt an unconventional form of protecting the line against low pressures. The solution was to operate two of the five pumps per plant, and permit air to enter through combination air valves located along the pipeline. Air entrained formed pockets that remained stationary at the air valves locations, acting as air cushions that absorbed the energy of transient pressure waves. Computational simulations were conducted considering that two pumps are in operation at each plant and suddenly these fail simultaneously caused by power failure. The program was verified by comparing the calculated results with those registered during field pressure measurements. It was noticed that the surge modelling results are in good agreement with the measured data; furthermore, these show the air pockets in combination with existing devices for transient control protect the system adequately, avoiding potential damage to the pipeline. Keywords: air pocket; air valve; pumping pipeline; pump failure; fluid transients; devices for transient control 1. Introduction For several decades now, pumping pipeline systems have been used for transporting water and wastewater all over the world. During operation, pipelines are subjected to different maneuvers such as programmed shutdown or start-up of pumps, an unexpected loss of power on the pumps, as well as rapid closing or opening of valves. In consequence, the aforementioned situations can cause fluid transients, which can generate large pressure surges that may produce the failure of pumps and devices, and even system fatigue or pipe ruptures [1]. Therefore, it is of paramount importance to consider an effective surge control for pumping pipelines from the design stage. Pipeline projects are commonly divided in three stages: modeling, design, and construction [2]. During the hydraulic transient modeling, the surge problems are identified and alternatives are evaluated and recommended based on the achieved results. Likewise, at the design stage, there is a Water 2019, 11, 1786; doi:10.3390/w11091786 www.mdpi.com/journal/water
-
Upload
khangminh22 -
Category
Documents
-
view
2 -
download
0
Transcript of Protecting a Pumping Pipeline System from Low Pressure ...

water
Article
Protecting a Pumping Pipeline System from LowPressure Transients by Using Air Pockets:A Case Study
Rafael Bernardo Carmona-Paredes , Oscar Pozos-Estrada *, Libia Georgina Carmona-Paredes,Alejandro Sánchez-Huerta, Eduardo Antonio Rodal-Canales and Germán Jorge Carmona-Paredes
Instituto de Ingeniería, Department of Hydraulic Engineering, Universidad Nacional Autónoma de México,Cd. Universitaria, C.P. 04510 Mexico City, Mexico* Correspondence: [email protected]; Tel.: +52-55-5623-3600
Received: 10 July 2019; Accepted: 26 August 2019; Published: 28 August 2019�����������������
Abstract: This paper presents a case study of an existing water pipeline with five pumping stationseach equipped with five pumps. In order to study the pipeline behavior prior to putting the systeminto operation, several transient simulations for different scenarios were developed. Results revealedthat the most serious situation occurred when a simultaneous failure of the five pumps occur at eachstation caused by power cut, producing negative pressure waves because the system for controlof hydraulic transients of the pipeline was insufficient to suppress downsurge pressures, due tothe moment of inertia of all the pumps being erroneously considered during the design stage.The necessity to start supplying water to the population led to attempt an unconventional formof protecting the line against low pressures. The solution was to operate two of the five pumpsper plant, and permit air to enter through combination air valves located along the pipeline. Airentrained formed pockets that remained stationary at the air valves locations, acting as air cushionsthat absorbed the energy of transient pressure waves. Computational simulations were conductedconsidering that two pumps are in operation at each plant and suddenly these fail simultaneouslycaused by power failure. The program was verified by comparing the calculated results with thoseregistered during field pressure measurements. It was noticed that the surge modelling results are ingood agreement with the measured data; furthermore, these show the air pockets in combinationwith existing devices for transient control protect the system adequately, avoiding potential damageto the pipeline.
Keywords: air pocket; air valve; pumping pipeline; pump failure; fluid transients; devices fortransient control
1. Introduction
For several decades now, pumping pipeline systems have been used for transporting water andwastewater all over the world. During operation, pipelines are subjected to different maneuverssuch as programmed shutdown or start-up of pumps, an unexpected loss of power on the pumps,as well as rapid closing or opening of valves. In consequence, the aforementioned situations can causefluid transients, which can generate large pressure surges that may produce the failure of pumps anddevices, and even system fatigue or pipe ruptures [1]. Therefore, it is of paramount importance toconsider an effective surge control for pumping pipelines from the design stage.
Pipeline projects are commonly divided in three stages: modeling, design, and construction [2].During the hydraulic transient modeling, the surge problems are identified and alternatives areevaluated and recommended based on the achieved results. Likewise, at the design stage, there is a
Water 2019, 11, 1786; doi:10.3390/w11091786 www.mdpi.com/journal/water
Water 2019, 11, 1786 2 of 22
relevant aspect that has to be considered regarding the pipe wall thickness, which has to withstand thefull range of transient pressures that the pipeline is subjected during its entire lifetime. Finally, at theconstruction stage, problems may occur that have to be solved based on good engineering judgement.
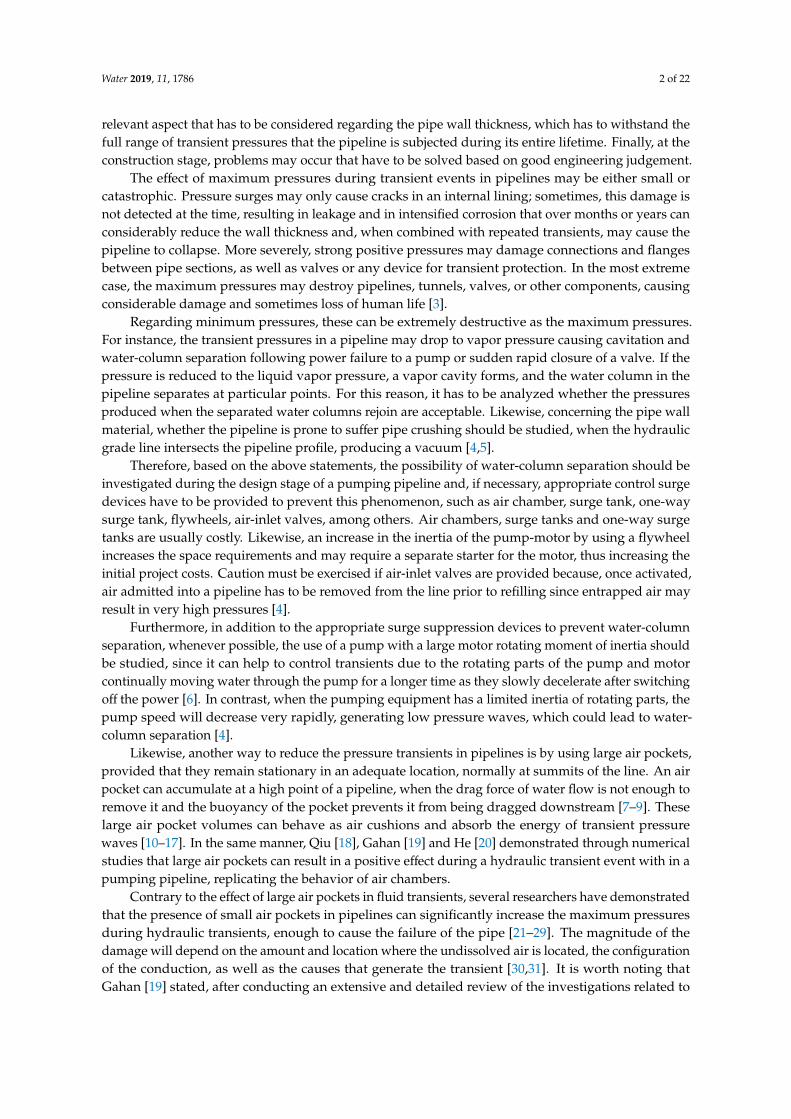
The effect of maximum pressures during transient events in pipelines may be either small orcatastrophic. Pressure surges may only cause cracks in an internal lining; sometimes, this damage isnot detected at the time, resulting in leakage and in intensified corrosion that over months or years canconsiderably reduce the wall thickness and, when combined with repeated transients, may cause thepipeline to collapse. More severely, strong positive pressures may damage connections and flangesbetween pipe sections, as well as valves or any device for transient protection. In the most extremecase, the maximum pressures may destroy pipelines, tunnels, valves, or other components, causingconsiderable damage and sometimes loss of human life [3].
Regarding minimum pressures, these can be extremely destructive as the maximum pressures.For instance, the transient pressures in a pipeline may drop to vapor pressure causing cavitation andwater-column separation following power failure to a pump or sudden rapid closure of a valve. If thepressure is reduced to the liquid vapor pressure, a vapor cavity forms, and the water column in thepipeline separates at particular points. For this reason, it has to be analyzed whether the pressuresproduced when the separated water columns rejoin are acceptable. Likewise, concerning the pipe wallmaterial, whether the pipeline is prone to suffer pipe crushing should be studied, when the hydraulicgrade line intersects the pipeline profile, producing a vacuum [4,5].
Therefore, based on the above statements, the possibility of water-column separation should beinvestigated during the design stage of a pumping pipeline and, if necessary, appropriate control surgedevices have to be provided to prevent this phenomenon, such as air chamber, surge tank, one-waysurge tank, flywheels, air-inlet valves, among others. Air chambers, surge tanks and one-way surgetanks are usually costly. Likewise, an increase in the inertia of the pump-motor by using a flywheelincreases the space requirements and may require a separate starter for the motor, thus increasing theinitial project costs. Caution must be exercised if air-inlet valves are provided because, once activated,air admitted into a pipeline has to be removed from the line prior to refilling since entrapped air mayresult in very high pressures [4].
Furthermore, in addition to the appropriate surge suppression devices to prevent water-columnseparation, whenever possible, the use of a pump with a large motor rotating moment of inertia shouldbe studied, since it can help to control transients due to the rotating parts of the pump and motorcontinually moving water through the pump for a longer time as they slowly decelerate after switchingoff the power [6]. In contrast, when the pumping equipment has a limited inertia of rotating parts, thepump speed will decrease very rapidly, generating low pressure waves, which could lead to water-column separation [4].
Likewise, another way to reduce the pressure transients in pipelines is by using large air pockets,provided that they remain stationary in an adequate location, normally at summits of the line. An airpocket can accumulate at a high point of a pipeline, when the drag force of water flow is not enough toremove it and the buoyancy of the pocket prevents it from being dragged downstream [7–9]. Theselarge air pocket volumes can behave as air cushions and absorb the energy of transient pressurewaves [10–17]. In the same manner, Qiu [18], Gahan [19] and He [20] demonstrated through numericalstudies that large air pockets can result in a positive effect during a hydraulic transient event with in apumping pipeline, replicating the behavior of air chambers.
Contrary to the effect of large air pockets in fluid transients, several researchers have demonstratedthat the presence of small air pockets in pipelines can significantly increase the maximum pressuresduring hydraulic transients, enough to cause the failure of the pipe [21–29]. The magnitude of thedamage will depend on the amount and location where the undissolved air is located, the configurationof the conduction, as well as the causes that generate the transient [30,31]. It is worth noting thatGahan [19] stated, after conducting an extensive and detailed review of the investigations related to
Water 2019, 11, 1786 3 of 22
hydraulic transients with entrained air, that the criterion that establishes whether an air pocket is largeor small will depend on its effect on transients.
This paper presents a case study of an existing pumping pipeline with five pumping plantseach equipped with five centrifugal pumps and a backup pump connected in parallel. In orderto study the pipeline behavior before put the system into operation, researchers of the Institute ofEngineering of the University of Mexico developed several transient simulations for different scenariosand flow conditions. They found that the devices for surge protection of the investigated pipelinewere insufficient to mitigate the adverse effects of transient events because the moment of inertia of allthe pumps was erroneously considered by others during the design stage. Furthermore, the surgemodeling results revealed that the most serious situation occurred when a simultaneous failure of thefive pumps occurs at each pumping plant due to electric power cut, which could lead to water-columnseparation at some pipeline segments of the system. The latter compromised the pipeline safety andreliability. Therefore, the five pumps of each plant were never put into operation until the system fortransient control was improved. The necessity to start providing water to the population led to attemptan unconventional and cost-effective form of protecting the line against low pressure transients. Thesolution was to operate two of the five units per plant, and allow air to enter through air/vacuumvalves located along the pipeline. The air entrained formed pockets that remained stationary at highpoints of the line; these pockets behaved as air cushions that absorbed the energy of transient pressurewaves. Computational simulations were conducted considering that two pumps are in operation ateach plant and suddenly these fail simultaneously caused by power failure. Furthermore, the surgemodelling results were compared with those registered during field pressure measurements.
2. The Pumping Pipeline System
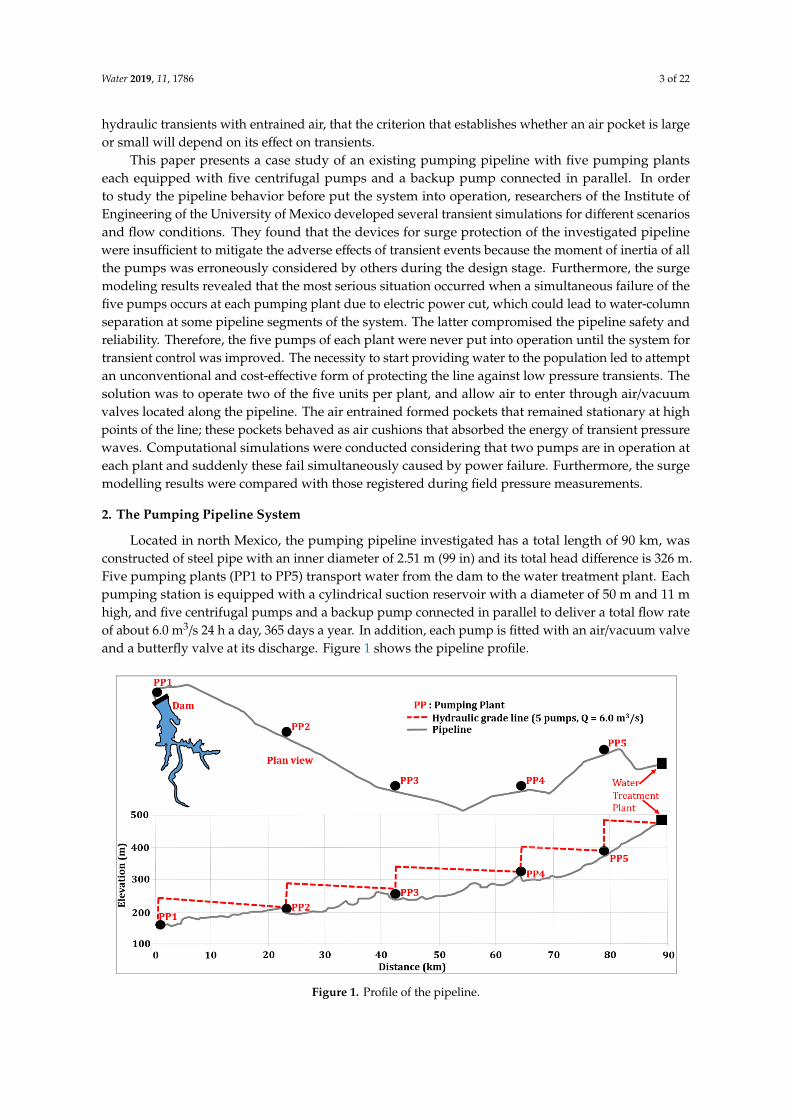
Located in north Mexico, the pumping pipeline investigated has a total length of 90 km, wasconstructed of steel pipe with an inner diameter of 2.51 m (99 in) and its total head difference is 326 m.Five pumping plants (PP1 to PP5) transport water from the dam to the water treatment plant. Eachpumping station is equipped with a cylindrical suction reservoir with a diameter of 50 m and 11 mhigh, and five centrifugal pumps and a backup pump connected in parallel to deliver a total flow rateof about 6.0 m3/s 24 h a day, 365 days a year. In addition, each pump is fitted with an air/vacuum valveand a butterfly valve at its discharge. Figure 1 shows the pipeline profile.
Water 2018, 10, x FOR PEER REVIEW 3 of 21
This paper presents a case study of an existing pumping pipeline with five pumping plants each equipped with five centrifugal pumps and a backup pump connected in parallel. In order to study the pipeline behavior before put the system into operation, researchers of the Institute of Engineering of the University of Mexico developed several transient simulations for different scenarios and flow conditions. They found that the devices for surge protection of the investigated pipeline were insufficient to mitigate the adverse effects of transient events because the moment of inertia of all the pumps was erroneously considered by others during the design stage. Furthermore, the surge modeling results revealed that the most serious situation occurred when a simultaneous failure of the five pumps occurs at each pumping plant due to electric power cut, which could lead to water-column separation at some pipeline segments of the system. The latter compromised the pipeline safety and reliability. Therefore, the five pumps of each plant were never put into operation until the system for transient control was improved. The necessity to start providing water to the population led to attempt an unconventional and cost-effective form of protecting the line against low pressure transients. The solution was to operate two of the five units per plant, and allow air to enter through air/vacuum valves located along the pipeline. The air entrained formed pockets that remained stationary at high points of the line; these pockets behaved as air cushions that absorbed the energy of transient pressure waves. Computational simulations were conducted considering that two pumps are in operation at each plant and suddenly these fail simultaneously caused by power failure. Furthermore, the surge modelling results were compared with those registered during field pressure measurements.
2. The Pumping Pipeline System
Located in north Mexico, the pumping pipeline investigated has a total length of 90 km, was constructed of steel pipe with an inner diameter of 2.51 m (99 in) and its total head difference is 326 m. Five pumping plants (PP1 to PP5) transport water from the dam to the water treatment plant. Each pumping station is equipped with a cylindrical suction reservoir with a diameter of 50 m and 11 m high, and five centrifugal pumps and a backup pump connected in parallel to deliver a total flow rate of about 6.0 m3/s 24 hours a day, 365 days a year. In addition, each pump is fitted with an air/vacuum valve and a butterfly valve at its discharge. Figure 1 shows the pipeline profile.
Figure 1. Profile of the pipeline.
The original system for control of hydraulic transients is comprised of eleven one-way surge tanks ranging from 17 m to 34 m in height and 4.5 m to 7.0 m in diameter, as well as three open surge
Figure 1. Profile of the pipeline.

Water 2019, 11, 1786 4 of 22
The original system for control of hydraulic transients is comprised of eleven one-way surgetanks ranging from 17 m to 34 m in height and 4.5 m to 7.0 m in diameter, as well as three open surgetanks ranging from 11 m to 20 m high and 4.1 m to 6.0 m in diameter. Table 1 summarizes the maincharacteristics of the five pipeline segments.
Table 1. Characteristics of the five pipeline segments.
Pumping Plant Length (m) Head (m) One-Way Surge Tank Open Surge Tank
PP1 23,200 80.12 3 1PP2 18,200 81.82 2 1PP3 23,000 79.32 2 —PP4 15,700 83.42 2 1PP5 9800 100.76 2 —
The Institute of Engineering of the University of Mexico (IE-UNAM) was commissioned by thepipeline owner with the main aim of supporting on the operations to start the pumping system.Likewise, it is important to highlight that the authors of this research were not involved in the designof the system under study. In order to analyze the pipeline behavior for multiple scenarios, researchersof the IE-UNAM performed a hydraulic transient analysis by using a numerical model based on themethod of characteristics. From the computations obtained, it was found that the most serious situationoccurred when a simultaneous failure of the five pumps occurs at each pumping plant due to electricpower cut. Likewise, it is important to highlight that, as a result of the numerical analyses, it wasfound that the system for control of fluid transients was insufficient because the pipeline designerincorrectly considered the moment of inertia of all the pumps, which significantly compromised thepipeline safety and reliability. According to the original design, the moment of inertia of the pumpsused for dimensioning the surge control devices was up to 4.5 times greater than that specified bythe manufacturer, as shown in Table 2. Therefore, additional devices for transient control will berequired to minimize the maximum head and to maximize the minimum head in the system to withinacceptable limits.
Table 2. Moment of inertia of the pumps.
Pumping PlantManufacturer Data Data Used in the
Original Design
Pump(Kg-m2)
Motor(Kg-m2)
Total(Kg-m2)
Total(Kg-m2)
PP1 13.19 101.25 114.44 460PP2 15.00 98.75 113.75 510PP3 15.00 98.75 113.75 510PP4 15.00 98.75 113.75 510PP5 22.00 103.75 125.75 510
The pump inertia is used to evaluate the necessary starting torque of the motor during a normalstart-up and for calculating its coast-down speed once the power is turned off to the motor. The latteris used for the hydraulic transient analysis to determine the severity of the transient pressures whenthe pump is switched off [6]. Large pumps have more inertia than small pumps, since they have morerotating mass. A pump with higher inertia can assist with controlling transients in order for the rotatingparts of the pump and motor continue moving water through the pump for a longer time as theyslowly decelerate following a power failure [32]. However, when pumping equipment has a limitedinertia of rotating parts, the pump speed will decrease very rapidly, generating negative pressurewaves, which could lead to water-column separation [4]. Therefore, an adequate surge protectionsystem should always be considered during the design stage of pumping pipelines.

Water 2019, 11, 1786 5 of 22
3. Numerical Model
The analysis of the effect of air pocket volumes introduced into the investigated pumping pipelinevia the air valves was developed based on the method of characteristics (MOC) [4,33]. Numerical modelsbased on the MOC are known to give accurate results and have demonstrated to be effective [34–36].They have been successfully applied in the study of pumping pipelines involving air pockets [23,27,37].
Combination air valves were installed at high points throughout the pipeline under study withthe aim of assisting in pipeline filling operation and protecting the system from low pressures that maybe caused by water-column separation, pipeline draining, pump failure, or a pipe rupture. Althoughcombination air valves expel the air from pipelines, during the hydraulic transient analysis, it isconsidered that air entrained through the valves is entrapped and not allowed to release when thepressure increases above the atmospheric pressure, since the air release through the small orifice isvery slowly. Likewise, it is taken into account that the entrapped air form pockets that remain at thevalve location and are not removed by the flowing water.
Furthermore, the general gas equation was used for analyzing the behavior of the air pockets inthe pipeline. This equation may be written as
p∗V = mRT, (1)
where V and m are the volume and mass of the air pocket, p* and T are the absolute pressure andtemperature of the air pocket, and R is the universal gas constant.
Since in this investigation the MOC is used to analyze the effect of air pockets on hydraulictransients, the positive and negative characteristic equations at the end of each time interval for sections(i, N + 1) and (i + 1, 1) are defined as follows:
QUi,N+1 = Cp − BaiHUi,N+1 , (2)
QUi+1,1 = Cn + Bai+1HUi+1,1 , (3)
whereCp = Qi,N+1 + BaiHi,N+1 −RiQi,N+1
∣∣∣Qi,N+1∣∣∣, (4)
Cn = Qi+1,1 − Bai+1Hi+1,1 −Ri+1Qi+1,1∣∣∣Qi+1,1
∣∣∣, (5)
Bai =gAi
ai, (6)
Bai+1 =gAi+1
ai+1, (7)
Ri =fi∆ti
2DiAi, (8)
Ri+1 =fi+1∆ti+1
2Di+1Ai+1, (9)
in which Qi,N+1 and QUi,N+1are the water flow discharges at the upstream end of the pocket at thebeginning and end of the time step, respectively; Qi+1,1 and QUi+1,1 are the water flow discharges at thedownstream end of the air pocket at the beginning and end of the time step, respectively. A is the totalcross section area of the pipe, g is the gravitational acceleration, a is the transient wave speed, f is theDarcy–Weisbach friction factor, D is the pipe diameter, and ∆t is the time step.
The finite difference scheme remains stable due to the fact that the Courant–Friedrich–Lewycondition is satisfied during all the surge modelling:
∆x ≥ a∆t, (10)
where ∆x is the pipe reach length.

Water 2019, 11, 1786 6 of 22
Moreover, if the head losses at the air valve and junction are neglected, then
HUi,n+1 = HUi+1,1 . (11)
The subscript U is used to denote the variables that are unknown at the end of the time step,whereas the variables without the subscript U are known quantities from the previous time step.Likewise, for the junctions (i, N + 1) and (i + 1, 1), the first subscript defines the conduit number, andthe second designates the section number. Figure 2 shows the notation for the air pocket.Water 2018, 10, x FOR PEER REVIEW 6 of 21
Figure 2. Notation for the air pocket.
During transient simulations, the airflow into the pipeline is isentropic and the mass of the air pocket in the pipeline at the beginning of the time step is designated by mi, then the mass of air at the end of time step 𝑚 , may be written as (Chaudhry [4]): 𝑚 , = 𝑚 + ∆𝑡, (12)
where is the time rate of mass inflow of air through the valve into the pipeline. In the same way, the compression and expansion of air pockets can be properly simulated by
considering the isothermal process. This phenomenon can be represented mathematically as: 𝑝∗𝑉 , = 𝑚 , 𝑅𝑇. (13)
The continuity equation for the air pocket can be presented as: 𝑉 , = 𝑉 + 𝑄 , + 𝑄 , − 𝑄 , + 𝑄 , , (14)
where 𝑉 and 𝑉 , are the air pocket volume at the beginning and end of the time step, respectively.
By substituting Equations (2) through (11) into Equation (14), 𝑉 , = 𝐶 + 𝐵 + 𝐵 𝐻 , , (15)
is obtained where 𝐶 = 𝑉 + (𝑄 , − 𝑄 , + 𝐶 − 𝐶 ). (16)
The numerical model calculates the total head 𝐻 , , which is related with the absolute pressure p* through the equation
p*= 𝛾(𝐻 , − 𝑧 , + 𝐻 ), (17)
where 𝑧 , is the height of the air valve above the datum, γ is the specific weight of water and 𝐻
is the atmospheric pressure head. Substituting 𝐻 , from Equation (17) into Equation (15), eliminating 𝑉 , from the
resulting equation and Equation (13), gives 𝑚 , 𝑅𝑇 = 𝑝∗ 𝐶 + 𝐵 + 𝐵 ∗ + 𝑧 , − 𝐻 . (18)
Elimination of 𝑚 , from Equations (12) and (18) yields 𝑚 + ∆𝑡𝑅𝑇 = 𝑝∗ 𝐶 + 𝐵 + 𝐵 ∗ + 𝑧 , − 𝐻 . (19)
Figure 2. Notation for the air pocket.
During transient simulations, the airflow into the pipeline is isentropic and the mass of the airpocket in the pipeline at the beginning of the time step is designated by mi, then the mass of air at theend of time step mUi,N+1 may be written as (Chaudhry [4]):
mUi,N+1 = mi +dmidt
∆t, (12)
where dmidt is the time rate of mass inflow of air through the valve into the pipeline.
In the same way, the compression and expansion of air pockets can be properly simulated byconsidering the isothermal process. This phenomenon can be represented mathematically as:
p∗VUi,N+1 = mUi,N+1RT. (13)
The continuity equation for the air pocket can be presented as:
VUi,N+1 = Vi +∆t2
[(QUi+1,1 + Qi+1,1
)−
(QUi,N+1 + Qi,N+1
)], (14)
where Vi and VUi,N+1 are the air pocket volume at the beginning and end of the time step, respectively.By substituting Equations (2) through (11) into Equation (14),
VUi,N+1 = Cair +∆t2
[(Bai + Bai+1
)HUi,N+1
], (15)
is obtained whereCair = Vi +
∆t2(Qi+1,1 −Qi,N+1 + Cn −Cp). (16)
The numerical model calculates the total head HUi,N+1 , which is related with the absolute pressurep* through the equation

Water 2019, 11, 1786 7 of 22
p∗ = γ(HUi,N+1 − zi,N+1 + HAtm
), (17)
where zi,N+1 is the height of the air valve above the datum, γ is the specific weight of water and HAtmis the atmospheric pressure head.
Substituting HUi,N+1 from Equation (17) into Equation (15), eliminating VUi,N+1 from the resultingequation and Equation (13), gives
mUi,N+1RT = p∗{
Cair +∆t2
[(Bai + Bai+1
)(p∗
γ+ zUi,N+1 −HAtm
)]}. (18)
Elimination of mUi,N+1 from Equations (12) and (18) yields(mi +
dmidt
)∆tRT = p∗
{Cair +
∆t2
[(Bai + Bai+1
)(p∗
γ+ zUi,N+1 −HAtm
)]}. (19)
In the above equation, p* and dmidt are the two unknowns. Whether the absolute pressure, p*,
within the pipeline is lower than 0.53pa (pa = atmospheric pressure), the air velocity through the valveis sonic, whereas if p* is larger than 0.53pa but lower than pa, the airflow through the valve is at subsonicvelocity. The equations for dmi
dt are (Streeter [38]):Subsonic air velocity through the valve (pa > p* > 0.53pa)
dmidt
= CdAv
√7paρa
(p∗
pa
)1.431− (p∗
pa
)0.286. (20)
Sonic air velocity through the valve (p* ≤ 0.53pa)
dmidt
= 0.686CdAvpa√
RTa, (21)
where Cd is the valve discharge coefficient, Av is the area of the valve opening at its throat; ρa is themass density of air at atmospheric pressure and absolute temperature Ta outside the pipeline.
In the same way, once Equations (20) or (21) is substituted into Equation (19) results a nonlinearequation in p*, which may be resolved by an iterative method, for instance, the Newton–Raphsonmethod. Likewise, the values of the unknown variables HUi,N+1 , VUi,N+1 , mUi,N+1 , QUi,N+1 , and QUi+1,1
may be evaluated from Equations (2) through (18).In addition, it is important to highlight that the numerical model has the capability of simulating
transient control devices (air chambers, surge tanks, one-way surge tanks, etc.) for typical pumpoperations, such as pump start-up, pump shut-down, unexpected loss of electric power on thepumps, etc.
4. Hydraulic Transient Simulations
4.1. Transient Flow Analysis for Five Pumps in Operation at Each Station
Several transient simulations for normal maneuvers and unplanned situations were conducted byusing the numerical model with the purpose of finding the worst-case scenario, when the five pumpingplants of the pipeline investigated operate with five pumps. Since various researchers state that themost serious situation in a pumping station occurred when all the pumping devices fail simultaneouslycaused by power failure [4,6,11], this situation was first simulated by considering the incorrect momentof inertia of the pumps used in the original design.
In the same way, the simultaneous failure of the five units at the five pumping stations wascomputed taking into account the moment of inertia provided by the pump manufacturer, which is
Water 2019, 11, 1786 8 of 22
the correct moment of inertia (see Table 2). From the calculations obtained, it was noticed that thedevices for transient control do not provide adequate surge protection against transient pressures, dueto the moment of inertia of all the pumps being incorrectly considered during the design stage, whichsignificantly compromised the pipeline safety and reliability. According to the original design, themoment of inertia of the pumps used for dimensioning the system for control of hydraulic transientswas up to 4.5 times greater than that specified by the manufacturer. Therefore, additional devices fortransient control will be necessary to avoid catastrophic damage to the pipeline.
In order to protect adequately the pumping system, a detailed hydraulic transient analysis wasperformed for the design and testing of additional surge suppression devices, assuming the suddenpower failure to the pumps, when the pipeline is working at its maximum capacity of 6 m3/s. Thedevices contemplated were air chambers, one-way surge tanks and open surge tanks. Furthermore,transient simulations were conducted by considering the various surge protection options, as wellas the correct moment of inertia of the pumps. The surge modeling results indicated that the mostefficient measure to minimize the upsurge pressures and to maximize the downsurge pressures inthe system to within acceptable limits is to install three air chambers at the discharge header of eachpumping station to complement the existing system for transient control.
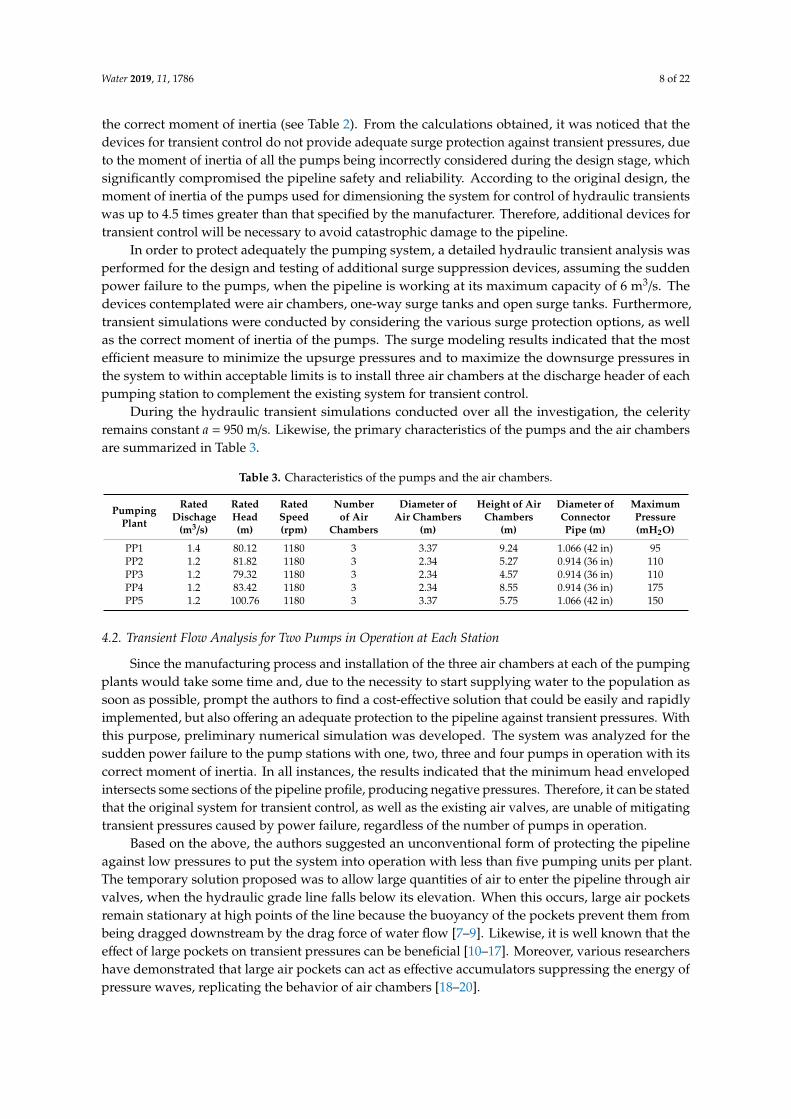
During the hydraulic transient simulations conducted over all the investigation, the celerityremains constant a = 950 m/s. Likewise, the primary characteristics of the pumps and the air chambersare summarized in Table 3.
Table 3. Characteristics of the pumps and the air chambers.
PumpingPlant
RatedDischage
(m3/s)
RatedHead(m)
RatedSpeed(rpm)
Numberof Air
Chambers
Diameter ofAir Chambers
(m)
Height of AirChambers
(m)
Diameter ofConnectorPipe (m)
MaximumPressure(mH2O)
PP1 1.4 80.12 1180 3 3.37 9.24 1.066 (42 in) 95PP2 1.2 81.82 1180 3 2.34 5.27 0.914 (36 in) 110PP3 1.2 79.32 1180 3 2.34 4.57 0.914 (36 in) 110PP4 1.2 83.42 1180 3 2.34 8.55 0.914 (36 in) 175PP5 1.2 100.76 1180 3 3.37 5.75 1.066 (42 in) 150
4.2. Transient Flow Analysis for Two Pumps in Operation at Each Station
Since the manufacturing process and installation of the three air chambers at each of the pumpingplants would take some time and, due to the necessity to start supplying water to the population assoon as possible, prompt the authors to find a cost-effective solution that could be easily and rapidlyimplemented, but also offering an adequate protection to the pipeline against transient pressures. Withthis purpose, preliminary numerical simulation was developed. The system was analyzed for thesudden power failure to the pump stations with one, two, three and four pumps in operation with itscorrect moment of inertia. In all instances, the results indicated that the minimum head envelopedintersects some sections of the pipeline profile, producing negative pressures. Therefore, it can be statedthat the original system for transient control, as well as the existing air valves, are unable of mitigatingtransient pressures caused by power failure, regardless of the number of pumps in operation.
Based on the above, the authors suggested an unconventional form of protecting the pipelineagainst low pressures to put the system into operation with less than five pumping units per plant.The temporary solution proposed was to allow large quantities of air to enter the pipeline through airvalves, when the hydraulic grade line falls below its elevation. When this occurs, large air pocketsremain stationary at high points of the line because the buoyancy of the pockets prevent them frombeing dragged downstream by the drag force of water flow [7–9]. Likewise, it is well known that theeffect of large pockets on transient pressures can be beneficial [10–17]. Moreover, various researchershave demonstrated that large air pockets can act as effective accumulators suppressing the energy ofpressure waves, replicating the behavior of air chambers [18–20].

Water 2019, 11, 1786 9 of 22
Subsequently, numerous hydraulic transient simulations caused by power failure to pumps wereconducted to select and size more appropriate air valves in order to enter the necessary volume ofair to the pipeline to ensure that large air pockets remain stationary in adequate locations. Resultsshow the best solution is to operate two of the five units per plant with the original control devicesand install additional air valves at strategic locations to prevent the occurrence of negative pressures.Likewise, it is important to highlight that it is not a common practice to admit large quantities of airinto pipelines of large dimensions to avoid negative pressures [4,11].
The existing and additional combination air valves located along the investigated pipeline areadvanced devices that combine the air release and vacuum break valves in a single body. These valveshave small precision orifices to exhaust air, whereas the pipeline is in service, and the large orificesdiameters equal the nominal size of the valves to diminish the resistance to the air intake and decreasingsignificantly the potential negative pressure within the pipeline during a draining operation, pipelinerupture, or pump failure. Likewise, the valve design guarantees the effective elimination of all air andthe cylindrical solid floats made of High-density polyethylene (HDPE) reduce the risk for dynamicclosure while eradicating the possibilities of water hammer on closure of the large orifice.
It is worth mentioning that, if not appropriately sized, air valves can worsen the transient responseof the system. For instance, Lee [39] stated that the efficacy of the air valves for transient protectionhinges not only on the pipeline system configuration, the physical properties of the pipeline and thefluids, but significantly also on the characteristics of the air valves, as well as on the distribution of airpocket volumes in the system concerned. The author also demonstrated that air valves with high inflowcharacteristics located at high points of a pipeline with entrapped air may decrease the magnitude ofthe extreme negative pressures. On the other hand, air valves with higher outflow characteristics tendto result in higher positive pressures. Therefore, the appropriate sizing of air valves is important foreffective, efficient, and safe air control. Conversely, the incorrect sizing of air valves may cause largepressure peaks immediately following the rapid expulsion of an air pocket [40–43].
Finally, it is important to emphasize that, once air is admitted into the pipeline, caution mustbe exercised for venting air during refilling the pipeline. The air should be released slowly from thepipeline because the entrapped air may result in very high pressures [4].
Table 4 summarized the location and dimensions of the existing and additional air valves installedthroughout the five pipeline segments, as well as the air pocket volumes obtained with Equation (15).
4.3. Field Measurements for the Simultaneous Failure of Two Pumps at Each Station
After the additional air valves were installed along the pumping pipeline, field pressuremeasurements were conducted at different locations throughout the system. At the start of eachfield test, two pumps were operated at each plant to supply a water discharge of approximately2.4 m3/s. Subsequently, the pumping plant operators were instructed to switch off the operating pumpssimultaneously. This maneuver was equivalent to a sudden loss of power to the pumping station. Thetransient pressures were registered at the downstream end of the discharge header of the five pumpingstations and at various locations of the air valves.
High-frequency pressure transducers were used during the pressure measurements in the pipeline.These transducers are capable of detecting pressures between −10.4 mH2O (−14.7 psi) vacuum and 351mH2O (500 psi) with an accuracy of ±0.5%. The data acquisition frequency was set at 10 Hz. Dataloggers registered the signals from the pressure transducers and achieved a digital conversion fordirect storage in the hard disk of a laptop computer for later analysis.
During the field measurements, the initial steady-state water discharge in the pumping pipelinewas measured by means of ultrasonic flowmeters with an accuracy of ± 0.5%. These devices wereinstalled on the discharge headers of the pumping stations.
The transient pressure data from the field tests were compared to the results achieved in thehydraulic transient analysis, with the main purpose of verifying the reliability of the computational

Water 2019, 11, 1786 10 of 22
program used during the present investigation. The comparison between the results from the fieldmeasurements and those obtained with the numerical model are reported within the next section.
Table 4. Location and dimensions of air valves and air pocket volumes, (*) denotes the new air valvesinstalled in the pipeline.
Chainage (m) Elevation (m) Diameter of Air Valve (in) Number of Air Valves Air Pocket Volumes (m3)
First pipeline segment (from PP1 to PP2)
2071 175.10 6 1 0.8704764 (*) 175.00 6 1 0.2404917 (*) 180.00 6 1 0.620
9780 187.60 6 1 0.33610,608 188.96 6 1 0.330
11,790 (*) 191.49 6 1 0.62612,626 191.16 4 2 0.18313,045 191.08 6 1 0.267
13,400 (*) 193.75 6 1 0.30813,600 (*) 196.75 4 1 1.044
18,706 206.87 6 2 0.59119,720 208.02 4 2 0.31120,760 210.03 4 1 0.47421,920 216.68 6 2 1.335
Second pipeline segment (from PP2 to PP3)
30,684 222.57 4 1 0.75633,300 (*) 237.87 4 2 0.624
33,564 243.62 6 1 0.20438,650 (*) 261.10 6 1 0.312
38,800 269.03 6 1 1.193
Third pipeline segment (from PP3 to PP4)
53,400 (*) 263.75 6 1 0.41453,770 267.19 4 2 0.476
54,215 (*) 273.86 6 1 0.52854,560 283.73 6 2 0.13855,560 292.38 6 1 0.189
63,317 (*) 305.77 6 1 0.25263,417 (*) 310.06 6 2 0.83063,627 (*) 315.52 6 1 0.642
63,737 318.80 6 1 10179
Fourth pipeline segment (from PP4 to PP5)
69,116 317.52 4 2 0.25272,016 319.05 6 1 0.41672,696 321.75 6 1 0.522
73,086 (*) 324.91 6 1 0.46473,476 329.71 4 2 0.758
73,826 (*) 335.79 6 1 0.51274,036 342.80 4 1 0.62174,236 346.98 6 2 0.59676,666 373.80 6 2 0.471
77,736 (*) 375.66 6 1 0.46877,926 379.38 6 2 0.904
Fifth pipeline segment (from PP5 to Water treatment plant)
80,579 (*) 399.06 6 1 0.52680,967 405.04 4 2 0.782
81,339 (*) 409.85 6 2 0.87281,727 413.96 6 1 0.774
82,107 (*) 417.54 6 1 0.76682,487 420.96 6 1 0.654
84,047 (*) 438.76 6 1 0.68784,447 443.54 6 1 0.57484,774 447.49 4 2 0.79285,024 449.53 6 2 0.870
86,800 (*) 463.17 6 1 0.51486,967 467.66 4 2 0.66887,314 475.66 6 2 1.30787,617 474.81 6 2 1.597

Water 2019, 11, 1786 11 of 22
5. Results and Discussion
For brevity, only the hydraulic transient results associated with the simultaneous failure of fiveand two pumps in the pumping stations due to electric power cut are presented.
5.1. Transient Pressures Caused by the Simultaneous Failure of Five Pumps at Each Station
Figures 3–7 show the maximum and minimum head envelopes obtained from the numericalmodel by considering the incorrect moment of inertia of the pumps used during the design stage, thecorrect moment of inertia provided by the pump manufacturer, as well as the correct moment of inertiaand the three additional air chambers installed at the discharge header of each pumping station.
The results achieved by taking into account the incorrect moment of inertia of the pumps used inthe original design show a suitable design of the pumping pipeline, as can be observed in Figures 3–7.In contrast, if the correct moment of inertia is considered, results revealed the occurrence of negativetransient pressures at the five pipeline segments, since the system for control of hydraulic transientsof the pipeline was insufficient to adequately suppress downsurge pressures, due to the moment ofinertia of all pumps being erroneously considered during the design stage. According to the originaldesign, the moment of inertia of the pumps used for dimensioning the surge suppression devices wasup to 4.5 times greater than that specified by the pump manufacturer.
The maximum and minimum head envelopes obtained regarding the moment of inertia providedby the pump manufacturer show a noticeable increase of the transient pressures along the system, incomparison with the surge modeling results achieved with the erroneous moment of inertia. It is clearlyobserved that the problem of negative pressures is generated by the great difference between the correctmoment of inertia and that used in the design, since the moment of inertia is one of the parameterswith the greatest impact on hydraulic transients caused by power failure to pumps. Consequently, thecalculated minimum pressures are much lower than those specified in the design.
When the correct moment of inertia is considered, it is observed that the pipeline will experiencenegative pressure waves which travel along the system, causing the pressure in the five pipelinesegments to fall rapidly, creating sub-atmospheric pressure over sections of the pipeline. Likewise,the minimum head envelopes reveal that the transient pressures at the first, third and fifth pipelinesegments may be reduced to the vapor pressure of the liquid, which could lead to cavitation andwater column separation following a loss of power to the pumps. This would take place between thechainages 13 + 600 to 13 + 840, 73 + 836 to 74 + 336, 80 + 918 to 82 + 838, 84 + 918 to 85 + 367, and 87 +
339 to 88 + 279, respectively. Furthermore, after re-pressurization of the pipeline by a flow reversal ora reflected transient pressure wave, any vapor cavities that have formed would collapse and couldcreate high-localized pressure spikes that may damage the pipeline. Therefore, it was of paramountimportance to improve the existing system for transient control by adding new devices to uplift theminimum head envelopes in the system to within acceptable limits.
The results show that the proposed control devices provide a safe and stable hydraulic conditionand protect the system against severe transient pressures. It can be observed in Figures 3–7 that, afterthe simultaneous failure of the five pumps at each station, the maximum and minimum heads alongthe pumping pipeline were considerably reduced by installing the three air chambers at the dischargeheader of each pumping station. In this case, the cushioning effect produced by the air chambersabsorbed the transient pressures waves considerably. Therefore, it can be stated that these deviceshave a beneficial effect over the entire the pumping pipeline system.

Water 2019, 11, 1786 12 of 22
Water 2018, 10, x FOR PEER REVIEW 11 of 21
system, in comparison with the surge modeling results achieved with the erroneous moment of inertia. It is clearly observed that the problem of negative pressures is generated by the great difference between the correct moment of inertia and that used in the design, since the moment of inertia is one of the parameters with the greatest impact on hydraulic transients caused by power failure to pumps. Consequently, the calculated minimum pressures are much lower than those specified in the design.
When the correct moment of inertia is considered, it is observed that the pipeline will experience negative pressure waves which travel along the system, causing the pressure in the five pipeline segments to fall rapidly, creating sub-atmospheric pressure over sections of the pipeline. Likewise, the minimum head envelopes reveal that the transient pressures at the first, third and fifth pipeline segments may be reduced to the vapor pressure of the liquid, which could lead to cavitation and water column separation following a loss of power to the pumps. This would take place between the chainages 13 + 600 to 13 + 840, 73 + 836 to 74 + 336, 80 + 918 to 82 + 838, 84 + 918 to 85 + 367, and 87 + 339 to 88 + 279, respectively. Furthermore, after re-pressurization of the pipeline by a flow reversal or a reflected transient pressure wave, any vapor cavities that have formed would collapse and could create high-localized pressure spikes that may damage the pipeline. Therefore, it was of paramount importance to improve the existing system for transient control by adding new devices to uplift the minimum head envelopes in the system to within acceptable limits.
The results show that the proposed control devices provide a safe and stable hydraulic condition and protect the system against severe transient pressures. It can be observed in Figures 3–7 that, after the simultaneous failure of the five pumps at each station, the maximum and minimum heads along the pumping pipeline were considerably reduced by installing the three air chambers at the discharge header of each pumping station. In this case, the cushioning effect produced by the air chambers absorbed the transient pressures waves considerably. Therefore, it can be stated that these devices have a beneficial effect over the entire the pumping pipeline system.
Figure 3. Maximum and minimum head envelopes for the first pipeline segment, considering the incorrect moment of inertia (original design), the correct moment of inertia (MOI), and the correct moment of inertia and the three additional air chambers, following the simultaneous power failure of the five pumps at Pumping Plant 1.
Figure 3. Maximum and minimum head envelopes for the first pipeline segment, considering theincorrect moment of inertia (original design), the correct moment of inertia (MOI), and the correctmoment of inertia and the three additional air chambers, following the simultaneous power failure ofthe five pumps at Pumping Plant 1.Water 2018, 10, x FOR PEER REVIEW 12 of 21
Figure 4. Maximum and minimum head envelopes for the second pipeline segment, considering the incorrect moment of inertia (original design), the correct moment of inertia (MOI), and the correct moment of inertia and the three additional air chambers, following the simultaneous power failure of the five pumps at Pumping Plant 2.
Figure 5. Maximum and minimum head envelopes for the third pipeline segment, considering the incorrect moment of inertia (original design), the correct moment of inertia (MOI), and the correct moment of inertia and the three additional air chambers, following the simultaneous power failure of the five pumps at Pumping Plant 3.
Figure 4. Maximum and minimum head envelopes for the second pipeline segment, considering theincorrect moment of inertia (original design), the correct moment of inertia (MOI), and the correctmoment of inertia and the three additional air chambers, following the simultaneous power failure ofthe five pumps at Pumping Plant 2.

Water 2019, 11, 1786 13 of 22
Water 2018, 10, x FOR PEER REVIEW 12 of 21
Figure 4. Maximum and minimum head envelopes for the second pipeline segment, considering the incorrect moment of inertia (original design), the correct moment of inertia (MOI), and the correct moment of inertia and the three additional air chambers, following the simultaneous power failure of the five pumps at Pumping Plant 2.
Figure 5. Maximum and minimum head envelopes for the third pipeline segment, considering the incorrect moment of inertia (original design), the correct moment of inertia (MOI), and the correct moment of inertia and the three additional air chambers, following the simultaneous power failure of the five pumps at Pumping Plant 3.
Figure 5. Maximum and minimum head envelopes for the third pipeline segment, considering theincorrect moment of inertia (original design), the correct moment of inertia (MOI), and the correctmoment of inertia and the three additional air chambers, following the simultaneous power failure ofthe five pumps at Pumping Plant 3.Water 2018, 10, x FOR PEER REVIEW 13 of 21
Figure 6. Maximum and minimum head envelopes for the fourth pipeline segment, considering the incorrect moment of inertia (original design), the correct moment of inertia (MOI), and the correct moment of inertia and the three additional air chambers, following the simultaneous power failure of the five pumps at Pumping Plant 4.
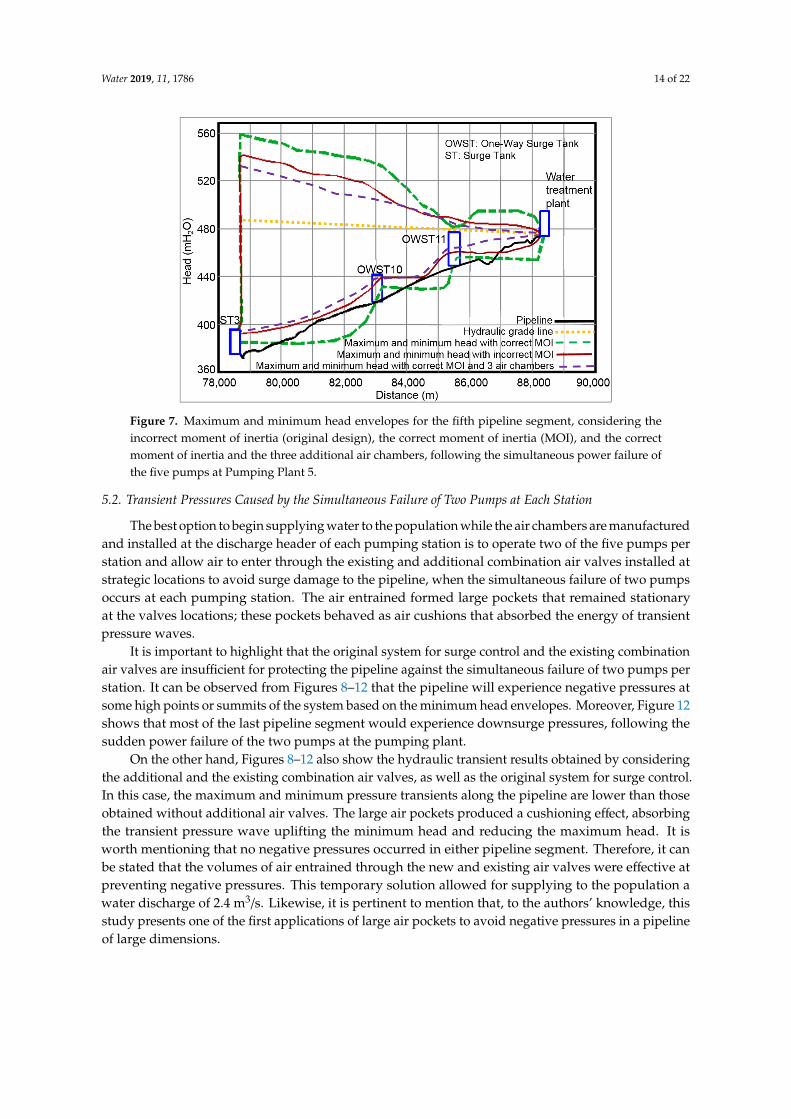
Figure 7. Maximum and minimum head envelopes for the fifth pipeline segment, considering the incorrect moment of inertia (original design), the correct moment of inertia (MOI), and the correct moment of inertia and the three additional air chambers, following the simultaneous power failure of the five pumps at Pumping Plant 5.
5.2. Transient Pressures Caused by the Simultaneous Failure of Two Pumps at Each Station
The best option to begin supplying water to the population while the air chambers are manufactured and installed at the discharge header of each pumping station is to operate two of the five pumps per station and allow air to enter through the existing and additional combination air valves installed at strategic locations to avoid surge damage to the pipeline, when the simultaneous failure of two pumps occurs at each pumping station. The air entrained formed large pockets that remained stationary at the valves locations; these pockets behaved as air cushions that absorbed the energy of transient pressure waves.
Figure 6. Maximum and minimum head envelopes for the fourth pipeline segment, considering theincorrect moment of inertia (original design), the correct moment of inertia (MOI), and the correctmoment of inertia and the three additional air chambers, following the simultaneous power failure ofthe five pumps at Pumping Plant 4.
Water 2019, 11, 1786 14 of 22
Water 2018, 10, x FOR PEER REVIEW 13 of 21
Figure 6. Maximum and minimum head envelopes for the fourth pipeline segment, considering the incorrect moment of inertia (original design), the correct moment of inertia (MOI), and the correct moment of inertia and the three additional air chambers, following the simultaneous power failure of the five pumps at Pumping Plant 4.
Figure 7. Maximum and minimum head envelopes for the fifth pipeline segment, considering the incorrect moment of inertia (original design), the correct moment of inertia (MOI), and the correct moment of inertia and the three additional air chambers, following the simultaneous power failure of the five pumps at Pumping Plant 5.
5.2. Transient Pressures Caused by the Simultaneous Failure of Two Pumps at Each Station
The best option to begin supplying water to the population while the air chambers are manufactured and installed at the discharge header of each pumping station is to operate two of the five pumps per station and allow air to enter through the existing and additional combination air valves installed at strategic locations to avoid surge damage to the pipeline, when the simultaneous failure of two pumps occurs at each pumping station. The air entrained formed large pockets that remained stationary at the valves locations; these pockets behaved as air cushions that absorbed the energy of transient pressure waves.
Figure 7. Maximum and minimum head envelopes for the fifth pipeline segment, considering theincorrect moment of inertia (original design), the correct moment of inertia (MOI), and the correctmoment of inertia and the three additional air chambers, following the simultaneous power failure ofthe five pumps at Pumping Plant 5.
5.2. Transient Pressures Caused by the Simultaneous Failure of Two Pumps at Each Station
The best option to begin supplying water to the population while the air chambers are manufacturedand installed at the discharge header of each pumping station is to operate two of the five pumps perstation and allow air to enter through the existing and additional combination air valves installed atstrategic locations to avoid surge damage to the pipeline, when the simultaneous failure of two pumpsoccurs at each pumping station. The air entrained formed large pockets that remained stationaryat the valves locations; these pockets behaved as air cushions that absorbed the energy of transientpressure waves.
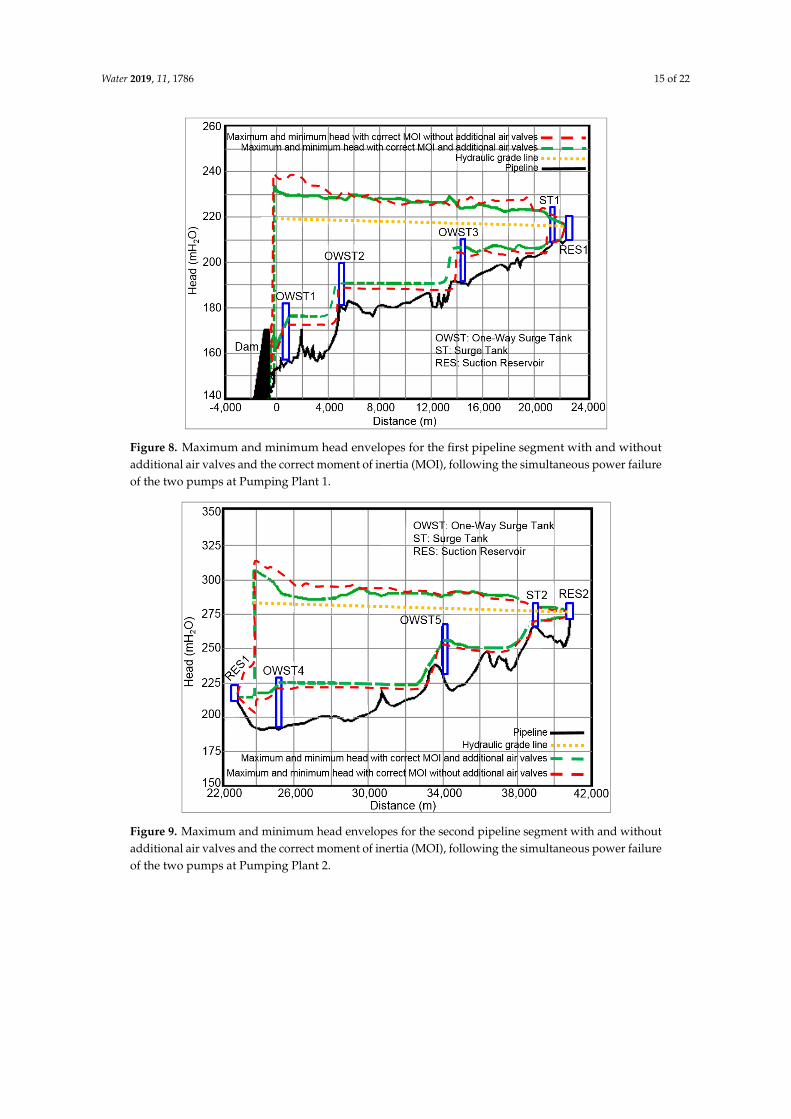
It is important to highlight that the original system for surge control and the existing combinationair valves are insufficient for protecting the pipeline against the simultaneous failure of two pumps perstation. It can be observed from Figures 8–12 that the pipeline will experience negative pressures atsome high points or summits of the system based on the minimum head envelopes. Moreover, Figure 12shows that most of the last pipeline segment would experience downsurge pressures, following thesudden power failure of the two pumps at the pumping plant.
On the other hand, Figures 8–12 also show the hydraulic transient results obtained by consideringthe additional and the existing combination air valves, as well as the original system for surge control.In this case, the maximum and minimum pressure transients along the pipeline are lower than thoseobtained without additional air valves. The large air pockets produced a cushioning effect, absorbingthe transient pressure wave uplifting the minimum head and reducing the maximum head. It isworth mentioning that no negative pressures occurred in either pipeline segment. Therefore, it canbe stated that the volumes of air entrained through the new and existing air valves were effective atpreventing negative pressures. This temporary solution allowed for supplying to the population awater discharge of 2.4 m3/s. Likewise, it is pertinent to mention that, to the authors’ knowledge, thisstudy presents one of the first applications of large air pockets to avoid negative pressures in a pipelineof large dimensions.
Water 2019, 11, 1786 15 of 22
Water 2018, 10, x FOR PEER REVIEW 14 of 21
It is important to highlight that the original system for surge control and the existing combination air valves are insufficient for protecting the pipeline against the simultaneous failure of two pumps per station. It can be observed from Figures 8–12 that the pipeline will experience negative pressures at some high points or summits of the system based on the minimum head envelopes. Moreover, Figure 12 shows that most of the last pipeline segment would experience downsurge pressures, following the sudden power failure of the two pumps at the pumping plant.
On the other hand, Figures 8–12 also show the hydraulic transient results obtained by considering the additional and the existing combination air valves, as well as the original system for surge control. In this case, the maximum and minimum pressure transients along the pipeline are lower than those obtained without additional air valves. The large air pockets produced a cushioning effect, absorbing the transient pressure wave uplifting the minimum head and reducing the maximum head. It is worth mentioning that no negative pressures occurred in either pipeline segment. Therefore, it can be stated that the volumes of air entrained through the new and existing air valves were effective at preventing negative pressures. This temporary solution allowed for supplying to the population a water discharge of 2.4 m3/s. Likewise, it is pertinent to mention that, to the authors’ knowledge, this study presents one of the first applications of large air pockets to avoid negative pressures in a pipeline of large dimensions.
Figure 8. Maximum and minimum head envelopes for the first pipeline segment with and without additional air valves and the correct moment of inertia (MOI), following the simultaneous power failure of the two pumps at Pumping Plant 1.
Figure 8. Maximum and minimum head envelopes for the first pipeline segment with and withoutadditional air valves and the correct moment of inertia (MOI), following the simultaneous power failureof the two pumps at Pumping Plant 1.Water 2018, 10, x FOR PEER REVIEW 15 of 21
Figure 9. Maximum and minimum head envelopes for the second pipeline segment with and without additional air valves and the correct moment of inertia (MOI), following the simultaneous power failure of the two pumps at Pumping Plant 2.
Figure 10. Maximum and minimum head envelopes for the third pipeline segment with and without additional air valves and the correct moment of inertia (MOI), following the simultaneous power failure of the two pumps at Pumping Plant 3.
Figure 9. Maximum and minimum head envelopes for the second pipeline segment with and withoutadditional air valves and the correct moment of inertia (MOI), following the simultaneous power failureof the two pumps at Pumping Plant 2.

Water 2019, 11, 1786 16 of 22
Water 2018, 10, x FOR PEER REVIEW 15 of 21
Figure 9. Maximum and minimum head envelopes for the second pipeline segment with and without additional air valves and the correct moment of inertia (MOI), following the simultaneous power failure of the two pumps at Pumping Plant 2.
Figure 10. Maximum and minimum head envelopes for the third pipeline segment with and without additional air valves and the correct moment of inertia (MOI), following the simultaneous power failure of the two pumps at Pumping Plant 3.
Figure 10. Maximum and minimum head envelopes for the third pipeline segment with and withoutadditional air valves and the correct moment of inertia (MOI), following the simultaneous power failureof the two pumps at Pumping Plant 3.Water 2018, 10, x FOR PEER REVIEW 16 of 21
Figure 11. Maximum and minimum head envelopes for the fourth pipeline segment with and without additional air valves and the correct moment of inertia (MOI), following the simultaneous power failure of the two pumps at Pumping Plant 4.
Figure 12. Maximum and minimum head envelopes for the fifth pipeline segment with and without additional air valves and the correct moment of inertia (MOI), following the simultaneous power failure of the two pumps at Pumping Plant 5.
5.3. Comparison of Field Measurements with Numerical Results after Simultaneous Failure of Two Pumps at Each Station
In order to compare the computed results obtained during the hydraulic transient simulations of the pumping pipeline system, field tests were performed after the additional combination air valves were installed. The field measurements consisted of recording transient pressures following the simultaneous failure of two pumps at each pumping station. The measurements were conducted at the downstream end of the discharge header of the five pumping stations and at various locations of the air valves.
Figures 13–17 show the pressure transient comparison of the simulated and field pressures. It can be observed that the pressure amplitudes calculated are slightly higher than the pressures recorded. Figures 13a–17a show that the maximum pressure transients occur at the discharge header.
Figure 11. Maximum and minimum head envelopes for the fourth pipeline segment with and withoutadditional air valves and the correct moment of inertia (MOI), following the simultaneous power failureof the two pumps at Pumping Plant 4.

Water 2019, 11, 1786 17 of 22
Water 2018, 10, x FOR PEER REVIEW 16 of 21
Figure 11. Maximum and minimum head envelopes for the fourth pipeline segment with and without additional air valves and the correct moment of inertia (MOI), following the simultaneous power failure of the two pumps at Pumping Plant 4.
Figure 12. Maximum and minimum head envelopes for the fifth pipeline segment with and without additional air valves and the correct moment of inertia (MOI), following the simultaneous power failure of the two pumps at Pumping Plant 5.
5.3. Comparison of Field Measurements with Numerical Results after Simultaneous Failure of Two Pumps at Each Station
In order to compare the computed results obtained during the hydraulic transient simulations of the pumping pipeline system, field tests were performed after the additional combination air valves were installed. The field measurements consisted of recording transient pressures following the simultaneous failure of two pumps at each pumping station. The measurements were conducted at the downstream end of the discharge header of the five pumping stations and at various locations of the air valves.
Figures 13–17 show the pressure transient comparison of the simulated and field pressures. It can be observed that the pressure amplitudes calculated are slightly higher than the pressures recorded. Figures 13a–17a show that the maximum pressure transients occur at the discharge header.
Figure 12. Maximum and minimum head envelopes for the fifth pipeline segment with and withoutadditional air valves and the correct moment of inertia (MOI), following the simultaneous power failureof the two pumps at Pumping Plant 5.
5.3. Comparison of Field Measurements with Numerical Results after Simultaneous Failure of Two Pumps atEach Station
In order to compare the computed results obtained during the hydraulic transient simulationsof the pumping pipeline system, field tests were performed after the additional combination airvalves were installed. The field measurements consisted of recording transient pressures following thesimultaneous failure of two pumps at each pumping station. The measurements were conducted atthe downstream end of the discharge header of the five pumping stations and at various locations ofthe air valves.
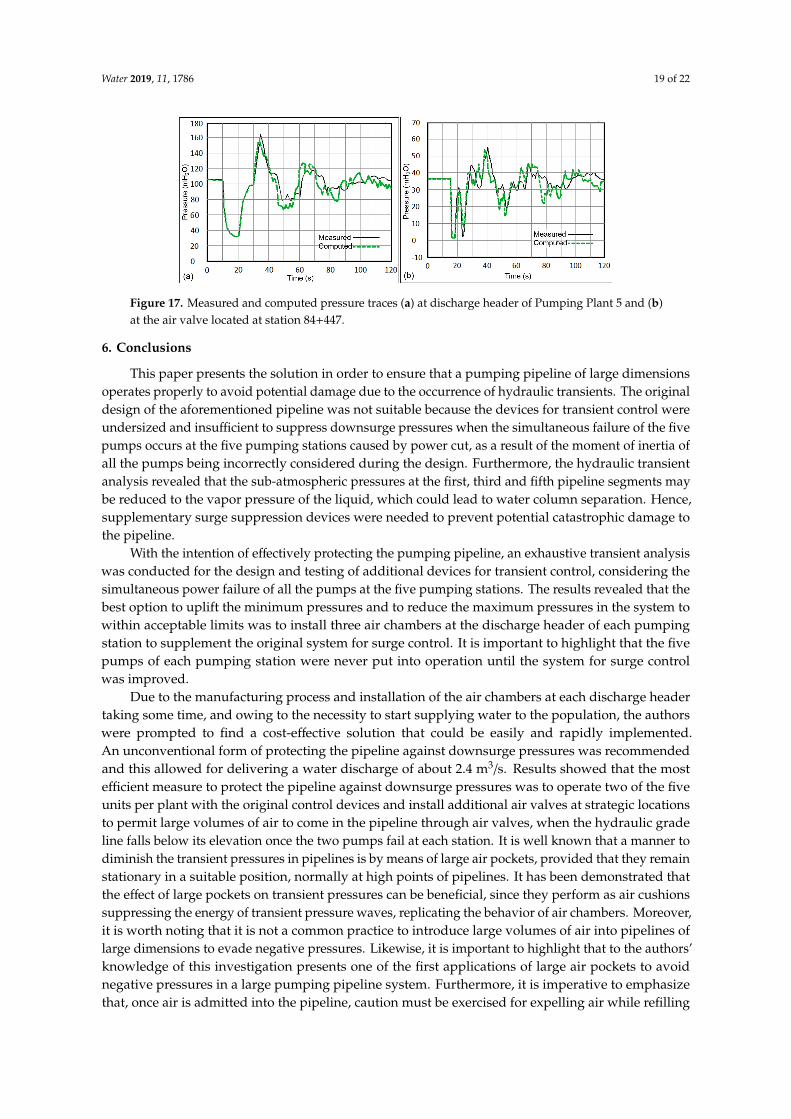
Figures 13–17 show the pressure transient comparison of the simulated and field pressures. It canbe observed that the pressure amplitudes calculated are slightly higher than the pressures recorded.Figures 13a, 14a, 15a, 16a and 17a show that the maximum pressure transients occur at the dischargeheader. Moreover, it can be seen from the modeled and the field pressures that, after simultaneousfailure of two pumps per plant, the pressure falls, and, depending on the location of the air valves, thepressure flow drops approximately 6 to 17 seconds later, allowing air to enter through the air valves,as can be observed in Figures 13b, 14b, 15b, 16b and 17b. The air pockets produced a cushioning effect,absorbing the transient pressure wave and uplifting the minimum head. Furthermore, following theloss of power to the pumps at each station, the pressure falls, but, after a few seconds, the pressurestarts increasing. It must be highlighted that, at the discharge headers and the locations of the airvalves, the vapor pressure, which is the cavitation head of water at 20 ◦C (−10.1 mH2O), was neverreached. The lowest simulated and measure pressure was zero (0 mH2O). Moreover, since pressuretransients showed the same pattern, only part of the results are presented.
Based on the aforementioned, it can be stated that the model results are generally in goodagreement with the field data. The slight differences in the minimum and maximum values are likelydue to uncertainties of the input parameters of the numerical model—for instance, wavespeed, pipeand fluid properties, initial and boundary conditions, etc. In the same way, the uncertainties in thepressures transducers, such as operating mode, environment, calibration frequency, among others, hadan influence on the results.

Water 2019, 11, 1786 18 of 22
Water 2018, 10, x FOR PEER REVIEW 17 of 21
Moreover, it can be seen from the modeled and the field pressures that, after simultaneous failure of two pumps per plant, the pressure falls, and, depending on the location of the air valves, the pressure flow drops approximately 6 to 17 seconds later, allowing air to enter through the air valves, as can be observed in Figures 13b–17b. The air pockets produced a cushioning effect, absorbing the transient pressure wave and uplifting the minimum head. Furthermore, following the loss of power to the pumps at each station, the pressure falls, but, after a few seconds, the pressure starts increasing. It must be highlighted that, at the discharge headers and the locations of the air valves, the vapor pressure, which is the cavitation head of water at 20 °C (–10.1 mH2O), was never reached. The lowest simulated and measure pressure was zero (0 mH2O). Moreover, since pressure transients showed the same pattern, only part of the results are presented.
Based on the aforementioned, it can be stated that the model results are generally in good agreement with the field data. The slight differences in the minimum and maximum values are likely due to uncertainties of the input parameters of the numerical model—for instance, wavespeed, pipe and fluid properties, initial and boundary conditions, etc. In the same way, the uncertainties in the pressures transducers, such as operating mode, environment, calibration frequency, among others, had an influence on the results.
Figure 13. Measured and computed pressure traces (a) at discharge header of Pumping Plant 1 and (b) at the air valve located at station 13 + 600.
Figure 14. Measured and computed pressure traces (a) at discharge header of Pumping Plant 2 and (b) at the air valve located at station 38 + 800.
Figure 13. Measured and computed pressure traces (a) at discharge header of Pumping Plant 1 and (b)at the air valve located at station 13 + 600.
Water 2018, 10, x FOR PEER REVIEW 17 of 21
Moreover, it can be seen from the modeled and the field pressures that, after simultaneous failure of two pumps per plant, the pressure falls, and, depending on the location of the air valves, the pressure flow drops approximately 6 to 17 seconds later, allowing air to enter through the air valves, as can be observed in Figures 13b–17b. The air pockets produced a cushioning effect, absorbing the transient pressure wave and uplifting the minimum head. Furthermore, following the loss of power to the pumps at each station, the pressure falls, but, after a few seconds, the pressure starts increasing. It must be highlighted that, at the discharge headers and the locations of the air valves, the vapor pressure, which is the cavitation head of water at 20 °C (–10.1 mH2O), was never reached. The lowest simulated and measure pressure was zero (0 mH2O). Moreover, since pressure transients showed the same pattern, only part of the results are presented.
Based on the aforementioned, it can be stated that the model results are generally in good agreement with the field data. The slight differences in the minimum and maximum values are likely due to uncertainties of the input parameters of the numerical model—for instance, wavespeed, pipe and fluid properties, initial and boundary conditions, etc. In the same way, the uncertainties in the pressures transducers, such as operating mode, environment, calibration frequency, among others, had an influence on the results.
Figure 13. Measured and computed pressure traces (a) at discharge header of Pumping Plant 1 and (b) at the air valve located at station 13 + 600.
Figure 14. Measured and computed pressure traces (a) at discharge header of Pumping Plant 2 and (b) at the air valve located at station 38 + 800.
Figure 14. Measured and computed pressure traces (a) at discharge header of Pumping Plant 2 and (b)at the air valve located at station 38 + 800.Water 2018, 10, x FOR PEER REVIEW 18 of 21
Figure 15. Measured and computed pressure traces (a) at discharge header of Pumping Plant 3 and (b) at the air valve located at station 54 + 560.
Figure 16. Measured and computed pressure traces (a) at discharge header of Pumping Plant 4 and (b) at the air valve located at station 73 + 476.
Figure 17. Measured and computed pressure traces (a) at discharge header of Pumping Plant 5 and (b) at the air valve located at station 84+447.
6. Conclusions
This paper presents the solution in order to ensure that a pumping pipeline of large dimensions operates properly to avoid potential damage due to the occurrence of hydraulic transients. The original design of the aforementioned pipeline was not suitable because the devices for transient control were undersized and insufficient to suppress downsurge pressures when the simultaneous failure of the five pumps occurs at the five pumping stations caused by power cut, as a result of the moment of inertia of all the pumps being incorrectly considered during the design. Furthermore, the hydraulic transient analysis revealed that the sub-atmospheric pressures at the first, third and fifth pipeline segments may be reduced to the vapor pressure of the liquid, which could lead to water column separation. Hence, supplementary surge suppression devices were needed to prevent potential catastrophic damage to the pipeline.
With the intention of effectively protecting the pumping pipeline, an exhaustive transient analysis was conducted for the design and testing of additional devices for transient control, considering the simultaneous power failure of all the pumps at the five pumping stations. The results
Figure 15. Measured and computed pressure traces (a) at discharge header of Pumping Plant 3 and (b)at the air valve located at station 54 + 560.
Water 2018, 10, x FOR PEER REVIEW 18 of 21
Figure 15. Measured and computed pressure traces (a) at discharge header of Pumping Plant 3 and (b) at the air valve located at station 54 + 560.
Figure 16. Measured and computed pressure traces (a) at discharge header of Pumping Plant 4 and (b) at the air valve located at station 73 + 476.
Figure 17. Measured and computed pressure traces (a) at discharge header of Pumping Plant 5 and (b) at the air valve located at station 84+447.
6. Conclusions
This paper presents the solution in order to ensure that a pumping pipeline of large dimensions operates properly to avoid potential damage due to the occurrence of hydraulic transients. The original design of the aforementioned pipeline was not suitable because the devices for transient control were undersized and insufficient to suppress downsurge pressures when the simultaneous failure of the five pumps occurs at the five pumping stations caused by power cut, as a result of the moment of inertia of all the pumps being incorrectly considered during the design. Furthermore, the hydraulic transient analysis revealed that the sub-atmospheric pressures at the first, third and fifth pipeline segments may be reduced to the vapor pressure of the liquid, which could lead to water column separation. Hence, supplementary surge suppression devices were needed to prevent potential catastrophic damage to the pipeline.
With the intention of effectively protecting the pumping pipeline, an exhaustive transient analysis was conducted for the design and testing of additional devices for transient control, considering the simultaneous power failure of all the pumps at the five pumping stations. The results
Figure 16. Measured and computed pressure traces (a) at discharge header of Pumping Plant 4 and (b)at the air valve located at station 73 + 476.
Water 2019, 11, 1786 19 of 22
Water 2018, 10, x FOR PEER REVIEW 18 of 21
Figure 15. Measured and computed pressure traces (a) at discharge header of Pumping Plant 3 and (b) at the air valve located at station 54 + 560.
Figure 16. Measured and computed pressure traces (a) at discharge header of Pumping Plant 4 and (b) at the air valve located at station 73 + 476.
Figure 17. Measured and computed pressure traces (a) at discharge header of Pumping Plant 5 and (b) at the air valve located at station 84+447.
6. Conclusions
This paper presents the solution in order to ensure that a pumping pipeline of large dimensions operates properly to avoid potential damage due to the occurrence of hydraulic transients. The original design of the aforementioned pipeline was not suitable because the devices for transient control were undersized and insufficient to suppress downsurge pressures when the simultaneous failure of the five pumps occurs at the five pumping stations caused by power cut, as a result of the moment of inertia of all the pumps being incorrectly considered during the design. Furthermore, the hydraulic transient analysis revealed that the sub-atmospheric pressures at the first, third and fifth pipeline segments may be reduced to the vapor pressure of the liquid, which could lead to water column separation. Hence, supplementary surge suppression devices were needed to prevent potential catastrophic damage to the pipeline.
With the intention of effectively protecting the pumping pipeline, an exhaustive transient analysis was conducted for the design and testing of additional devices for transient control, considering the simultaneous power failure of all the pumps at the five pumping stations. The results
Figure 17. Measured and computed pressure traces (a) at discharge header of Pumping Plant 5 and (b)at the air valve located at station 84+447.
6. Conclusions
This paper presents the solution in order to ensure that a pumping pipeline of large dimensionsoperates properly to avoid potential damage due to the occurrence of hydraulic transients. The originaldesign of the aforementioned pipeline was not suitable because the devices for transient control wereundersized and insufficient to suppress downsurge pressures when the simultaneous failure of the fivepumps occurs at the five pumping stations caused by power cut, as a result of the moment of inertia ofall the pumps being incorrectly considered during the design. Furthermore, the hydraulic transientanalysis revealed that the sub-atmospheric pressures at the first, third and fifth pipeline segments maybe reduced to the vapor pressure of the liquid, which could lead to water column separation. Hence,supplementary surge suppression devices were needed to prevent potential catastrophic damage tothe pipeline.
With the intention of effectively protecting the pumping pipeline, an exhaustive transient analysiswas conducted for the design and testing of additional devices for transient control, considering thesimultaneous power failure of all the pumps at the five pumping stations. The results revealed that thebest option to uplift the minimum pressures and to reduce the maximum pressures in the system towithin acceptable limits was to install three air chambers at the discharge header of each pumpingstation to supplement the original system for surge control. It is important to highlight that the fivepumps of each pumping station were never put into operation until the system for surge controlwas improved.
Due to the manufacturing process and installation of the air chambers at each discharge headertaking some time, and owing to the necessity to start supplying water to the population, the authorswere prompted to find a cost-effective solution that could be easily and rapidly implemented.An unconventional form of protecting the pipeline against downsurge pressures was recommendedand this allowed for delivering a water discharge of about 2.4 m3/s. Results showed that the mostefficient measure to protect the pipeline against downsurge pressures was to operate two of the fiveunits per plant with the original control devices and install additional air valves at strategic locationsto permit large volumes of air to come in the pipeline through air valves, when the hydraulic gradeline falls below its elevation once the two pumps fail at each station. It is well known that a manner todiminish the transient pressures in pipelines is by means of large air pockets, provided that they remainstationary in a suitable position, normally at high points of pipelines. It has been demonstrated thatthe effect of large pockets on transient pressures can be beneficial, since they perform as air cushionssuppressing the energy of transient pressure waves, replicating the behavior of air chambers. Moreover,it is worth noting that it is not a common practice to introduce large volumes of air into pipelines oflarge dimensions to evade negative pressures. Likewise, it is important to highlight that to the authors’knowledge of this investigation presents one of the first applications of large air pockets to avoidnegative pressures in a large pumping pipeline system. Furthermore, it is imperative to emphasizethat, once air is admitted into the pipeline, caution must be exercised for expelling air while refilling

Water 2019, 11, 1786 20 of 22
the pipeline. The air should be vented slowly from the pipeline, since the entrapped air pockets of acertain size may generate very high pressures.
Furthermore, once the selected air valves were installed, field measurements were performed.They consisted of recording transient pressures following the simultaneous failure of two pumpsat each pumping station. Subsequently, the surge modelling results were compared with the dataregistered during field pressure measurements. It was noticed that the simulated and measuredpressures are in good agreement. Therefore, it can be stated that the large air pockets in combinationwith an existing system for transient control adequately protect the pumping system, avoiding negativepressures and potential damage to the pipeline.
Author Contributions: Conceptualization, R.B.C.-P. and O.P.-E.; Methodology, R.B.C.-P., O.P.-E. and L.G.C.P.;Software, R.B.C.-P. and L.G.C.P.; Validation, L.G.C.P. and A.S.H, E.A.R.-C. and G.J.C.-P.; Formal Analysis, R.B.C.-P.,O.P.-E., L.G.C.P. and A.S.H; Investigation, R.B.C.-P., A.S.-H., E.A.R.-C. and G.J.C.-P.; Resources, R.B.C.-P. andA.S.-H.; Data Curation, R.B.C.-P., L.G.C.P. and A.S.H; Writing—Original Draft Preparation, O.P.-E. and R.B.C.-P.;Writing—Review and Editing, O.P.-E. and R.B.C.-P.; Supervision, R.B.C.-P.; Project Administration, R.B.C.-P.
Funding: This research received no external funding.
Conflicts of Interest: The authors declare no conflict of interest.
References
1. Boulos, P.F.; Karney, B.W.; Wood, D.J.; Lingireddy, S. Hydraulic Transient Guidelines for Protecting WaterDistribution Systems. J. Am. Water Work. Assoc. 2005, 97, 111–124. [CrossRef]
2. Huo, J.; Eckmann, D.H.; Morris, K.E. Surge Protections: Review, Analysis, and Engineering Design.In Proceedings of the American Water Works Association/ACE, Toronto, ON, Canada, 24–28 June 2007.
3. Karney, B.W.; McInnis, D. Transient Analysis of Water Distribution Systems. J. Am. Water Work. Assoc. 1990,82, 62–70. [CrossRef]
4. Chaudhry, M.H. Applied Hydraulic Transients, 3rd ed.; Springer: New York, NY, USA, 2014.5. Bergant, A.; Simpson, A.; Tijsseling, A. Water hammer with column separation: A historical review. J. Fluids
Struct. 2006, 22, 135–171. [CrossRef]6. Tullis, J.P. Hydraulics of Pipelines: Pumps, Valves, Cavitation, Transients; John Wiley & Sons: New York, NY,
USA, 1989.7. Walski, T.M.; Barnhart, T.S.; Driscoll, J.M.; Yencha, R.M. Hydraulics of corrosive gas pockets in force mains.
Water Environ. Res. 1994, 66, 772–778. [CrossRef]8. Lubbers, C.L.; Clemens, F.H.L.R. Air pockets in sewerage pressure mains. Water Sci. Technol. 2005, 52, 37–44.
[CrossRef] [PubMed]9. Pozos, O.; González, C.A.; Giesecke, J.; Marx, W.; Rodal, E.A. Air entrapped in gravity pipeline systems.
J. Hydraul. Res. 2010, 48, 338–347. [CrossRef]10. Stephenson, D. Effects of Air Valves and Pipework on Water Hammer Pressures. J. Transp. Eng. 1997, 123,
101–106. [CrossRef]11. Thorley, A.R.D. Fluid Transients in Pipeline Systems, 2nd ed.; George Ltd.: London, UK, 2004.12. Pozos, O. Investigation on the Effects of Entrained Air in Pipelines. Ph.D. Thesis, University of Stuttgart,
Stuttgart, Germany, 2007.13. Pozos, O.; Rodal, E.A.; Fairuzov, Y.V.; Sanchez, A. Effects of water–air mixtures on hydraulic transients.
Can. J. Civ. Eng. 2010, 37, 1189–1200. [CrossRef]14. Pozos-Estrada, O.; Fuentes-Mariles, O.A.; Pozos-Estrada, A. Gas pockets in a wastewater rising main: A case
study. Water Sci. Technol. 2012, 66, 2265–2274. [CrossRef]15. Pozos-Estrada, O.; Sánchez-Huerta, A.; Breña-Naranjo, J.A.; Pedrozo-Acuna, A. Failure Analysis of a Water
Supply Pumping Pipeline System. Water 2016, 8, 395. [CrossRef]16. Pozos-Estrada, O.; Fuentes, O.A.; Sánchez, A.; Rodal, E.A.; de Luna, F. Analysis on the effects of entrapped
air on hydraulic transients in pumping pipelines. Revista Internacional de Métodos Numéricos para Cálculo yDiseño en Ingeniería 2017, 33, 79–89. [CrossRef]
17. Pozos-Estrada, O. Investigation of the combined effect of air pockets and air bubbles on fluid transients.J. Hydroinform. 2018, 20, 376–392. [CrossRef]

Water 2019, 11, 1786 21 of 22
18. Qiu, D.Q. Transient Analysis and the Effect of Air Pockets in a Pipeline. Master’s Thesis, University ofLiverpool, Liverpool, UK, 1995.
19. Gahan, C.M. A Review of the Problem of Air Release/Collection in Water Pipelines with In-Depth Study ofthe Effects of Entrapped Air on Pressure Transients. Master’s Thesis, University of Liverpool, Liverpool,UK, 2004.
20. He, Y. Computational Routines for Description of Waterhammer in Pipelines. Master’s Thesis, University ofLiverpool, Liverpool, UK, 2004.
21. Jönsson, L. Maximum Transient Pressures in a Conduit with Check Valve and Air Entrainment. In Proceedingsof the International Conference on the Hydraulics of Pumping Stations, Manchester, UK, 17–19 September1985; pp. 55–76.
22. Jönsson, L. Anomalous Pressure Transients in Sewage Lines. In Proceedings of the International Conferenceon Unsteady Flow and Transients, Durham, UK, 29 September–1 October 1992; pp. 251–258.
23. Burrows, R.; Qiu, D.Q. Effect of Air Pockets on Pipeline Surge Pressure. Proc. Inst. Civ. Eng. Water Marit.Energy 1995, 112, 349–361. [CrossRef]
24. Fuertes, V.S.; Sebastián, J.I.; Iglesias, P.L.; Cabrera, E.; García-Serra, J. Llenado de tuberías con aire atrapado.Ingeniería del agua 1997, 4, 53–63. [CrossRef]
25. Izquierdo, J.; Fuertes, V.S.; Cabrera, E.; Iglesias, P.L.; Garcia-Serra, J. Pipeline Start-Up with Entrapped Air.J. Hydraul. Res. 1999, 37, 579–590. [CrossRef]
26. Qiu, D.Q.; Burrows, R. Prediction of Pressure Transients with Entrapped Air in a Pipeline. In Proceedings ofthe 7th International Conference on Pressure Surge and Fluid Transients in Pipelines and Open Channels,Harrogate, UK, 16–18 April 1996; pp. 251–263.
27. Burrows, R.A. Cautionary Note on the Operation of Pumping MainsWithout Appropriate Surge Control andthe Potentially Detrimental Impact of Small Air Pockets. In Proceedings of the IWA International Conference,Valencia, Spain, 22–25 April 2003.
28. Koelle, E. Critical volume of entrapped air in hydraulic circuits. In Proceedings of the 8th InternationalRound Table on Hydraulic Transients in Power Stations, Madeira, Portugal, 18–21 August 1987.
29. Nakamura, K.; Tomita, T. Water hammer caused by air in a pump started with the discharge valve closed.In Proceedings of the 3rd ASME/JSME Joint Fluids Engineering Conference, San Francisco, CA, USA,18–23 July 1999.
30. Martin, C.S. Entrapped air in pipelines. In Proceedings of the Second International Conference onPressure Surges, British Hydromechanics Research Association, The City University, London, UK, 22–24September 1976.
31. Martin, C.S. Two-phase gas-liquid experiences in fluid transients. In Proceedings of the 7th InternationalConference on Pressure Surge and Fluid Transients in Pipelines and Open Channels, Harrogate, UK, 16–18April 1996; pp. 65–81.
32. Walski, T.M.; Chase, D.V.; Savic, D.A.; Grayman, W.; Beckwith, S.; Koelle, E. Advanced Water DistributionModeling and Management, 1st ed.; Bently Institute Press: Exton, PA, USA, 2007.
33. Wylie, E.B.; Streeter, V.L.; Suo, L. Fluid Transients in Systems; Prentice Hall: Englewood Cliffs, NJ, USA, 1993.34. Ivetic, M.V. Forensic Transient Analyses of Two Pipeline Failures. Urban Water J. 2004, 1, 85–95. [CrossRef]35. Fernandes, C.; Karney, B. Modelling the advection equation under water hammer conditions. Urban Water J.
2004, 1, 97–112. [CrossRef]36. Almeida, A.B.; Ramos, H.M. Water supply operation: Diagnosis and reliability analysis in a Lisbon pumping
system. J. Water Supply Res. Technol. 2010, 59, 66–78. [CrossRef]37. Larsen, T.; Burrows, R. Measurements and Computations of Transients in Pumped Sewer Plastic Mains.
In Pipeline Systems; Springer: Dordrecht, The Netherlands, 1992.38. Streeter, V.L. Valve Stroking for Complex Piping Systems. J. Hydraul. Div. 1967, 93, 81–98.39. Lee, T.S. Air influence on hydraulic transients on fluid system with air valves. J. Fluids Eng. 1999, 121,
646–650. [CrossRef]40. Arregui, F.; Garcia, J.; Kruisbrink, A.; Cabrera, E.; Fuertes, V.S.; Palau, C.V.; Gascón, L. 2003 Air valves
dynamic behaviour. In Proceedings of the PEDS 2003–Pumps, Electromechanical Devices and SystemsApplied to Urban Water Management, Valencia, Spain, 22–25 April 2003.

Water 2019, 11, 1786 22 of 22
41. Kruinsbrick, A.C.H.; Arregui, F.; Carlos, M.; Bergant, A. Dynamic performance characterization of air valves.In Proceedings of the 9th International Conference on Pressure Surges, Chester, UK, 24–26 March 2004;pp. 33–48.
42. Carlos, M.; Arregui, F.G.; Cabrera, E.; Palau, V. Understanding air release through air valves. J. Hydraul. Eng.2011, 137, 461–469. [CrossRef]
43. Balacco, G.; Apollonio, C.; Piccinni, A.F. Experimental analysis of air valve behaviour during hydraulictransients. J. Appl. Water Eng. Res. 2015, 3, 3–11. [CrossRef]
© 2019 by the authors. Licensee MDPI, Basel, Switzerland. This article is an open accessarticle distributed under the terms and conditions of the Creative Commons Attribution(CC BY) license (http://creativecommons.org/licenses/by/4.0/).