Final DeWitt Pipeline Rehabilitation/Replacement Project ...
Upload
khangminh22Category
view
3download
0
Eastern Gas Pipeline
Basis of Preparation
Public
Year ended 31 December 2018

OVERVIEW
Public—31 December 2018 © Eastern Gas Pipeline iii
OVERVIEW
The Australian Energy Regulator (AER) issued a non-scheme pipeline financial reporting guideline (the Guideline) in December 2017
issued under Part 23 of the National Gas Rules. This guideline requires service providers of such pipelines to publish certain financial
information about those pipelines.
This guideline applies to the Eastern Gas Pipeline (EGP) covering the reporting period 1 January to 31 December 2018.
To apply the guideline we have adopted the following general interpretations:
All Jemena Group1 legal entities that have a controlling interest in EGP are ‘service providers’ and so all costs incurred, revenue earned
or assets owned by those entities that relate to the pipeline should be captured and consolidated in the financial reporting templates.
Similarly, because SGSPAA is the parent company of the Jemena Group acquisition costs and associated dates (mainly in the Recovered
Capital Method (RCM) template) are determined by reference to that entity for the purposes of complying with the guideline. This means
for instance that acquisition of the EGP occurred on 1 Aug 2007 when the Jemena Group acquired the pipeline from the Alinta Group.
EGP has amended some of the formulae in the templates where the resultant outcome was inconsistent with the intent of the Guideline.
These changes are explained in this basis of preparation (BoP) document.
Actual information includes information calculated directly from information contained in Jemena Group’s systems and other records
without material judgement required. Estimated information is anything other than actual information
To meet the requirements of the Guideline when compiling the RCM valuation (section 4.1) EGP undertook all reasonable steps to obtain
historical information where this was not already available to the Jemena Group. These steps are further explained in the RCM section
of this basis of preparation.
In accordance with the Transitional Arrangements set out in section 2.1 of the Guideline, EGP has not populated any previous reporting
period information in the reporting templates and only included data for the year ended 31 December 2018.
Jemena Group costs are direct or indirect in nature. Direct costs, such as maintenance, program management, engineering support are
directly allocated to specific assets within the Jemena Group. Jemena Group shared or indirect costs such as IT, finance, legal, people,
safety and environment are allocated to specific assets within the Jemena Group in accordance with the principles of the Jemena Group
Cost Allocation Methodology procedure. These principles are further explained in the Revenue and Expenses section (section 3) of this
basis of preparation.
The rest of this basis of preparation document explains how we have populated each of the templates required by the Guideline,
including by identifying where estimated data was used when actual data was not available.
As per the Jemena Group access user guide, Jemena Eastern Gas Pipeline (1) Pty Ltd and Jemena Eastern Gas Pipeline (2) Pty Ltd are
the service providers for EGP, being the licensed operators. The other service providers in the Jemena Group have appointed Jemena
Eastern Gas Pipeline (1) Pty Ltd and Jemena Eastern Gas Pipeline (2) Pty Ltd as the responsible service provider for the purposes of
publishing the financial information.
1 The Jemena Group includes SGSP (Australia) Assets Pty Ltd (SGSPAA) and its subsidiaries excluding Zinfra Pty Ltd and its
subsidiaries. Jemena Group costs may include charges from Zinfra Pty Ltd and its subsidiaries where they relate to the pipeline.

PIPELINE INFORMATION — 1
Public—31 December 2018 © Eastern Gas Pipeline 1
1. PIPELINE INFORMATION
Table Name
Base Information Population Approach
Source Methodology Assumptions Reference Item Actual /
Estimate
Table
1.1:
Pipeline
Details
No BoP
Reference
cells in the
template
Pipeline
details
Actual Pipeline Location and Length
The data is sourced either from the
original as-built survey data, or where
that is not available from the results of
intelligent pigging data.
Number of Customers
PypIT System (defined below) per
description below for the Table 5.1
Weighted Average Prices
Service Type
As per pipeline type on AEMC’s gas
scheme register
https://www.aemc.gov.au/energy-
system/gas/gas-scheme-register and
meets the definition of a transmission
pipeline under the National Gas Law.
Pipeline Location and Length
The pipeline lengths are calculated in the Geographic Information System
(GIS) by summing the geometric lengths of the pipeline and all its laterals.
Number of Customers
Determined from a revenue report run in PypIT outlining the breakdown of
revenue by service type and shipper. The report was run for the relevant
period to determine the number of shippers whom we have earnt revenue
from.
N/A
Table
1.2:
Pipeline
Services
Provided
No BoP
Reference
cells in the
template
Pipeline
services
provided
Actual PypIT (Is the billing/invoicing system
used by EGP which provides the
detailed breakdown of volumes and
revenue data by service type and
Based on current service offerings as described below.
Service description
A revenue transaction report that discloses revenue by service types, was
downloaded from PypIT for the reporting period. A Subject Matter Expert
mapped the revenue service types against the relevant ‘Service description’
1 — PIPELINE INFORMATION
2 Public—31 December 2018 © Eastern Gas Pipeline
Table Name
Base Information Population Approach
Source Methodology Assumptions Reference Item Actual /
Estimate
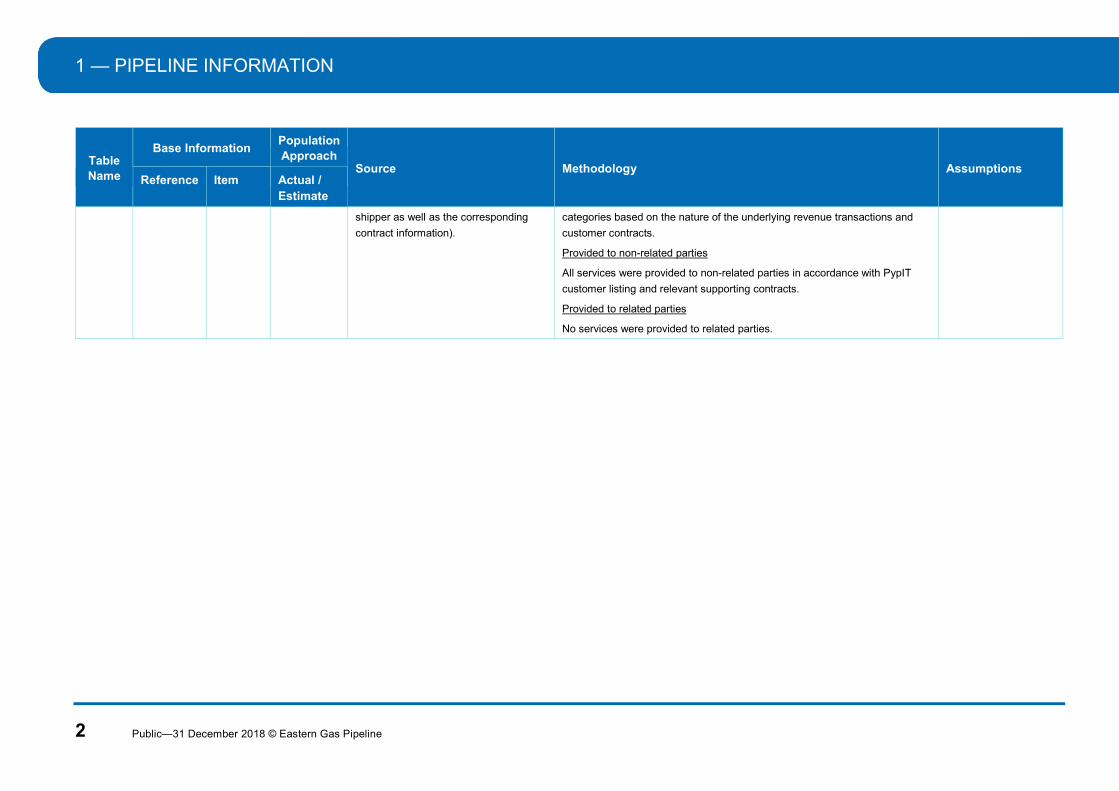
shipper as well as the corresponding
contract information).
categories based on the nature of the underlying revenue transactions and
customer contracts.
Provided to non-related parties
All services were provided to non-related parties in accordance with PypIT
customer listing and relevant supporting contracts.
Provided to related parties
No services were provided to related parties.
FINANCIAL PERFORMANCE MEASURES — 2
Public—31 December 2018 © Eastern Gas Pipeline 3
2. FINANCIAL PERFORMANCE MEASURES
Table Name
Base Information Population Approach
Source Methodology Assumptions Reference Item Actual /
Estimate
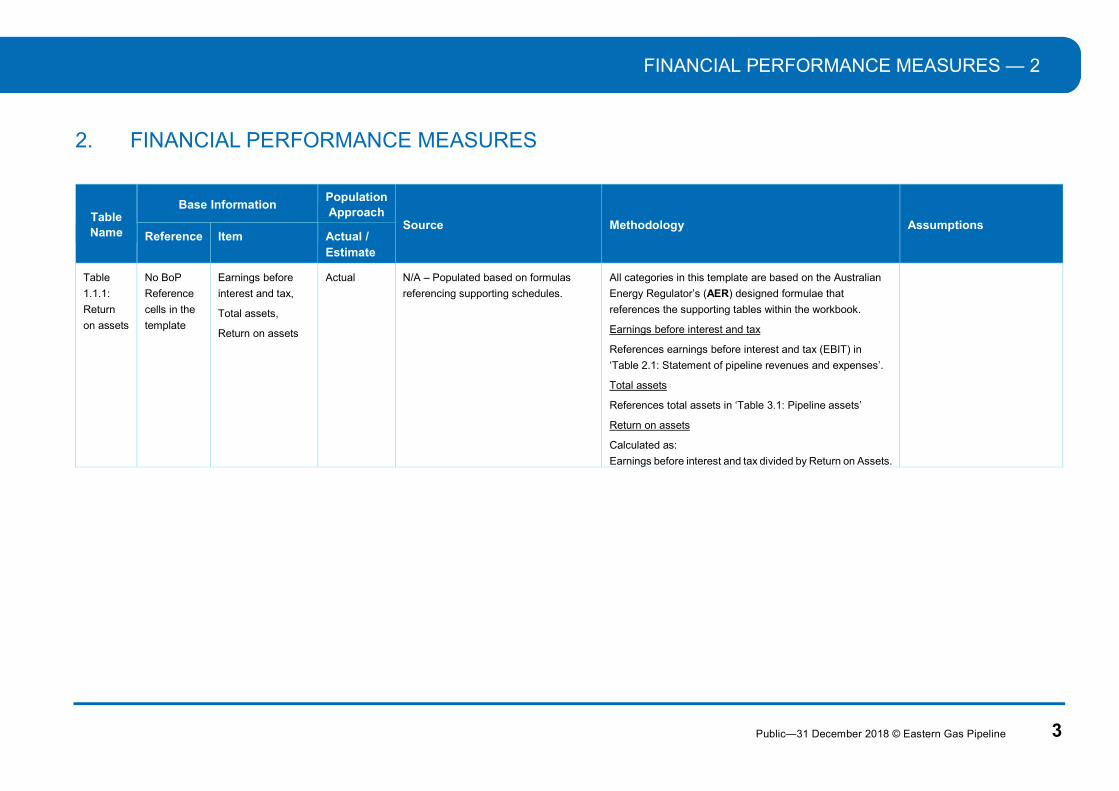
Table
1.1.1:
Return
on assets
No BoP
Reference
cells in the
template
Earnings before
interest and tax,
Total assets,
Return on assets
Actual N/A – Populated based on formulas
referencing supporting schedules.
All categories in this template are based on the Australian
Energy Regulator’s (AER) designed formulae that
references the supporting tables within the workbook.
Earnings before interest and tax
References earnings before interest and tax (EBIT) in
‘Table 2.1: Statement of pipeline revenues and expenses’.
Total assets
References total assets in ‘Table 3.1: Pipeline assets’
Return on assets
Calculated as:
Earnings before interest and tax divided by Return on Assets.
3 — REVENUES AND EXPENSES
4 Public—31 December 2018 © Eastern Gas Pipeline
3. REVENUES AND EXPENSES
Table Name
Base Information Population Approach
Source Methodology Assumptions
Reference Item Actual / Estimate
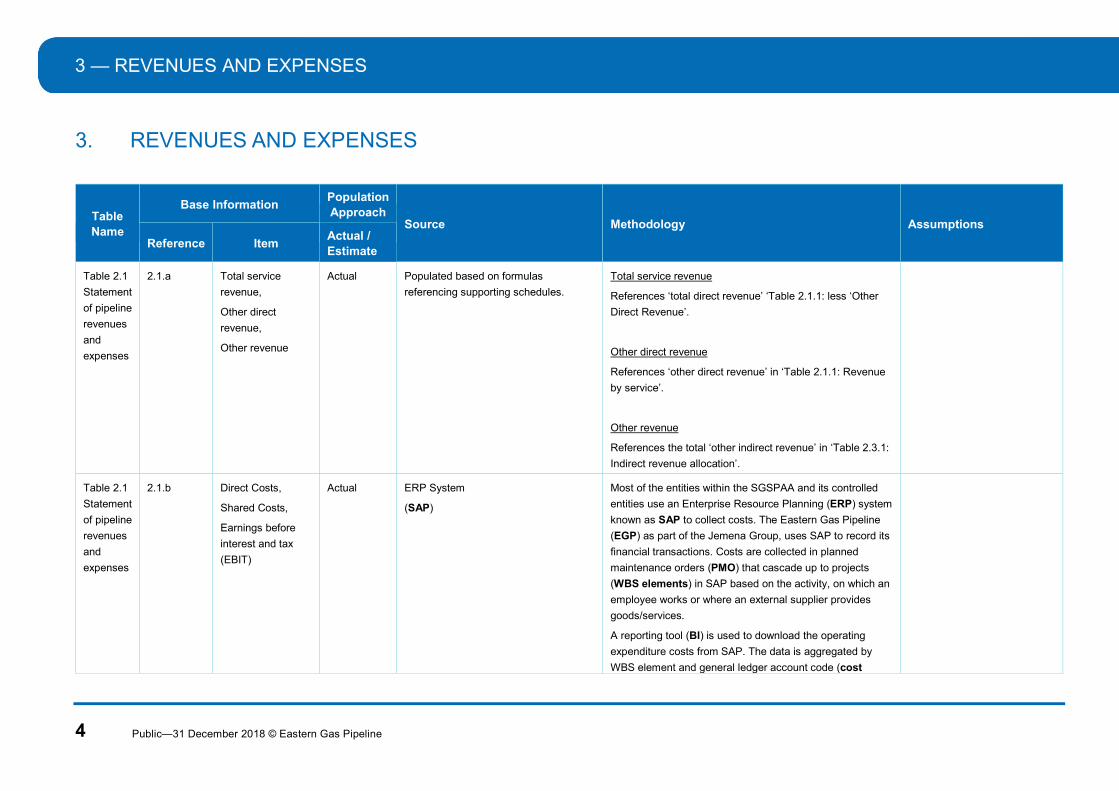
Table 2.1
Statement
of pipeline
revenues
and
expenses
2.1.a Total service
revenue,
Other direct
revenue,
Other revenue
Actual Populated based on formulas
referencing supporting schedules.
Total service revenue
References ‘total direct revenue’ ‘Table 2.1.1: less ‘Other
Direct Revenue’.
Other direct revenue
References ‘other direct revenue’ in ‘Table 2.1.1: Revenue
by service’.
Other revenue
References the total ‘other indirect revenue’ in ‘Table 2.3.1:
Indirect revenue allocation’.
Table 2.1
Statement
of pipeline
revenues
and
expenses
2.1.b Direct Costs,
Shared Costs,
Earnings before
interest and tax
(EBIT)
Actual ERP System
(SAP)
Most of the entities within the SGSPAA and its controlled
entities use an Enterprise Resource Planning (ERP) system
known as SAP to collect costs. The Eastern Gas Pipeline
(EGP) as part of the Jemena Group, uses SAP to record its
financial transactions. Costs are collected in planned
maintenance orders (PMO) that cascade up to projects
(WBS elements) in SAP based on the activity, on which an
employee works or where an external supplier provides
goods/services.
A reporting tool (BI) is used to download the operating
expenditure costs from SAP. The data is aggregated by
WBS element and general ledger account code (cost
REVENUES AND EXPENSES — 3
Public—31 December 2018 © Eastern Gas Pipeline 5
Table Name
Base Information Population Approach
Source Methodology Assumptions
Reference Item Actual / Estimate
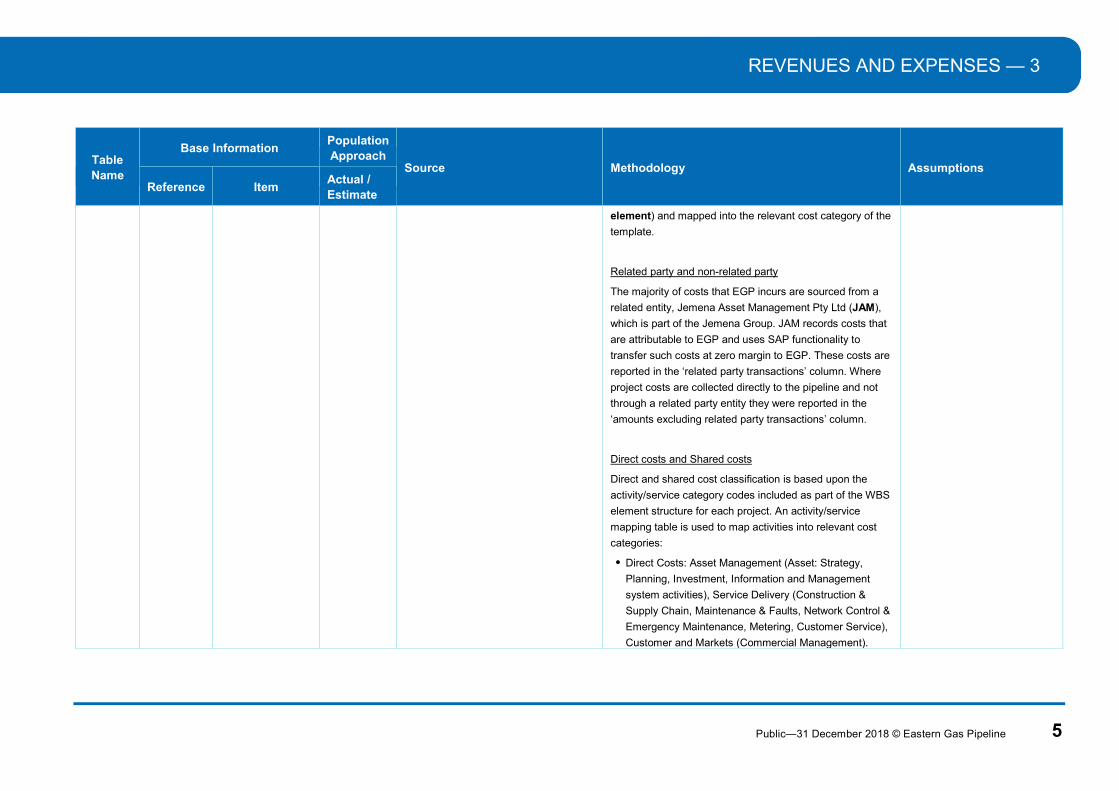
element) and mapped into the relevant cost category of the
template.
Related party and non-related party
The majority of costs that EGP incurs are sourced from a
related entity, Jemena Asset Management Pty Ltd (JAM),
which is part of the Jemena Group. JAM records costs that
are attributable to EGP and uses SAP functionality to
transfer such costs at zero margin to EGP. These costs are
reported in the ‘related party transactions’ column. Where
project costs are collected directly to the pipeline and not
through a related party entity they were reported in the
‘amounts excluding related party transactions’ column.
Direct costs and Shared costs
Direct and shared cost classification is based upon the
activity/service category codes included as part of the WBS
element structure for each project. An activity/service
mapping table is used to map activities into relevant cost
categories:
Direct Costs: Asset Management (Asset: Strategy,
Planning, Investment, Information and Management
system activities), Service Delivery (Construction &
Supply Chain, Maintenance & Faults, Network Control &
Emergency Maintenance, Metering, Customer Service),
Customer and Markets (Commercial Management).
3 — REVENUES AND EXPENSES
6 Public—31 December 2018 © Eastern Gas Pipeline
Table Name
Base Information Population Approach
Source Methodology Assumptions
Reference Item Actual / Estimate
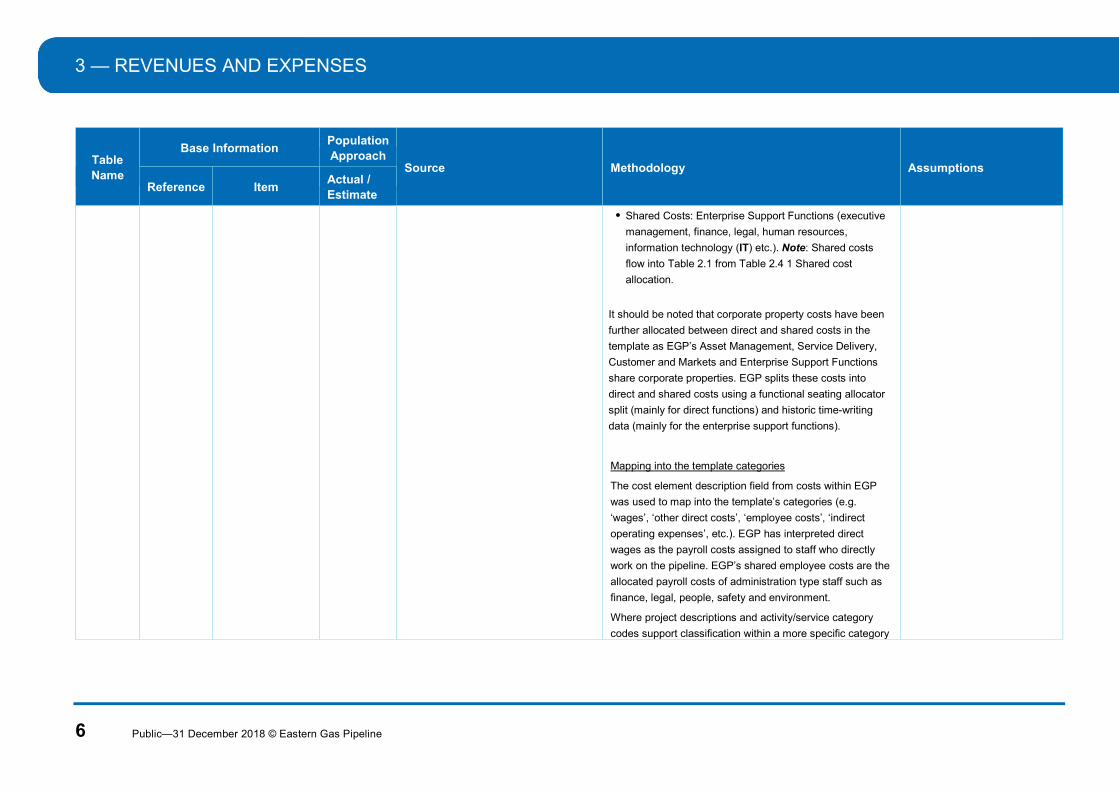
Shared Costs: Enterprise Support Functions (executive
management, finance, legal, human resources,
information technology (IT) etc.). Note: Shared costs
flow into Table 2.1 from Table 2.4 1 Shared cost
allocation.
It should be noted that corporate property costs have been
further allocated between direct and shared costs in the
template as EGP’s Asset Management, Service Delivery,
Customer and Markets and Enterprise Support Functions
share corporate properties. EGP splits these costs into
direct and shared costs using a functional seating allocator
split (mainly for direct functions) and historic time-writing
data (mainly for the enterprise support functions).
Mapping into the template categories
The cost element description field from costs within EGP
was used to map into the template’s categories (e.g.
‘wages’, ‘other direct costs’, ‘employee costs’, ‘indirect
operating expenses’, etc.). EGP has interpreted direct
wages as the payroll costs assigned to staff who directly
work on the pipeline. EGP’s shared employee costs are the
allocated payroll costs of administration type staff such as
finance, legal, people, safety and environment.
Where project descriptions and activity/service category
codes support classification within a more specific category

REVENUES AND EXPENSES — 3
Public—31 December 2018 © Eastern Gas Pipeline 7
Table Name
Base Information Population Approach
Source Methodology Assumptions
Reference Item Actual / Estimate
then the cost element based mapping was overridden2. The
following description categories were populated based on
project description/activity code mapping:
Information technology and communication costs
Rental and leasing costs
Repairs and maintenance
Licence and regulatory costs
Leasing and rental costs
Note: Insurance costs are included in the enterprise
supports costs which are shared across the Jemena
Group, therefore a $nil value has been reported for
Direct Insurance costs.
Earnings before Interest and tax (EBIT)
EBIT is calculated as:
Total revenue less Total costs
Table 2.1
Statement
of pipeline
revenues
and
expenses
2.1.c Depreciation,
Shared Asset
Depreciation
Actual SAP – Fixed Asset Movement Report
(FAMR) and Equipment Register
A detailed FAMR was downloaded from SAP.
Total depreciation was classified between direct
depreciation and shared asset depreciation based on the
mapping of the individual assets in the FAMR applied in
Table 3.3 Depreciation. EGP used the FAMR Asset
descriptions, category and equipment register descriptions
to map individual assets into specific categories.
2 Labour cost element mapping was not overridden based on project descriptions and activity/service category code mapping.
3 — REVENUES AND EXPENSES
8 Public—31 December 2018 © Eastern Gas Pipeline
Table Name
Base Information Population Approach
Source Methodology Assumptions
Reference Item Actual / Estimate
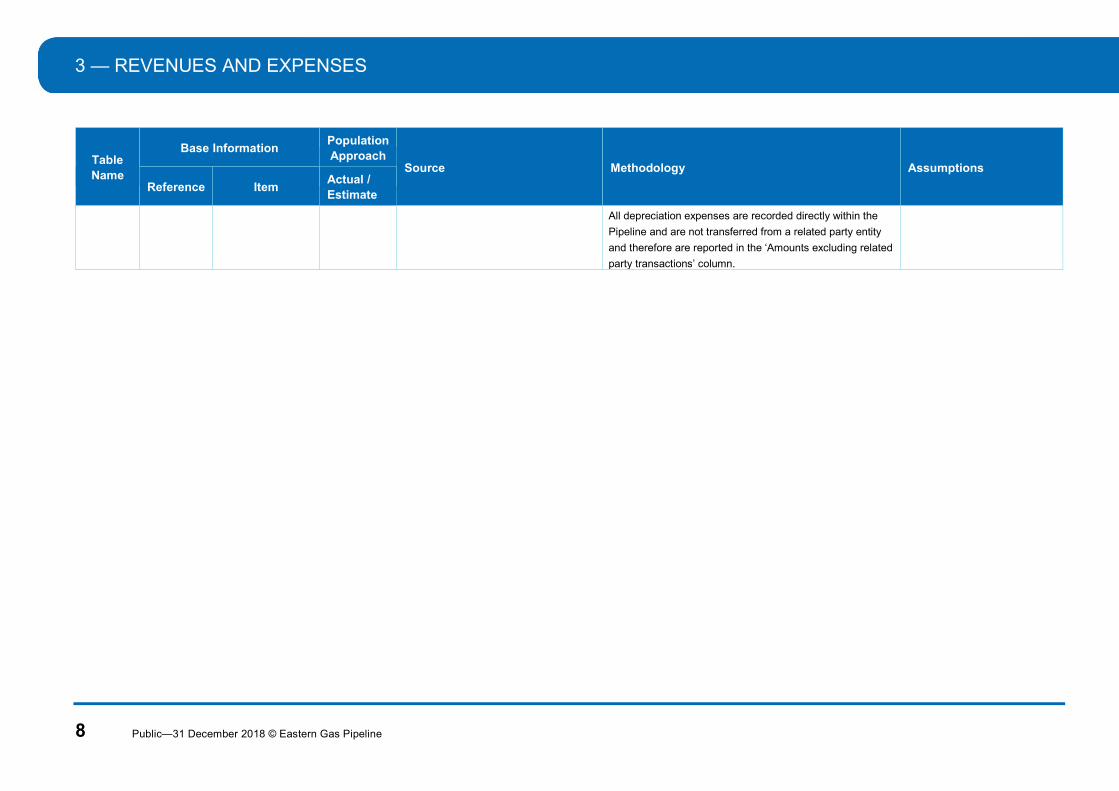
All depreciation expenses are recorded directly within the
Pipeline and are not transferred from a related party entity
and therefore are reported in the ‘Amounts excluding related
party transactions’ column.
REVENUE BY SERVICE — 4
Public—31 December 2018 © Eastern Gas Pipeline 9
4. REVENUE BY SERVICE
Table Name
Base Information Population Approach
Source Methodology Assumptions
Reference Item Actual / Estimate
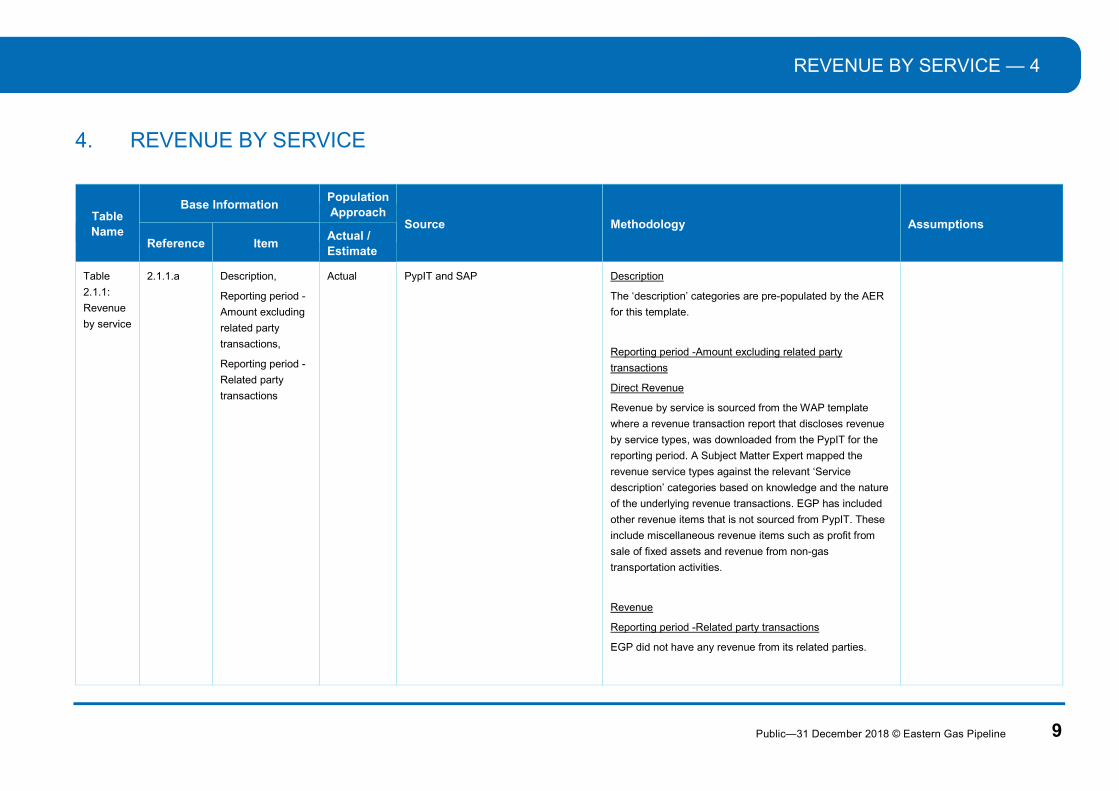
Table
2.1.1:
Revenue
by service
2.1.1.a
Description,
Reporting period -
Amount excluding
related party
transactions,
Reporting period -
Related party
transactions
Actual
PypIT and SAP
Description
The ‘description’ categories are pre-populated by the AER
for this template.
Reporting period -Amount excluding related party
transactions
Direct Revenue
Revenue by service is sourced from the WAP template
where a revenue transaction report that discloses revenue
by service types, was downloaded from the PypIT for the
reporting period. A Subject Matter Expert mapped the
revenue service types against the relevant ‘Service
description’ categories based on knowledge and the nature
of the underlying revenue transactions. EGP has included
other revenue items that is not sourced from PypIT. These
include miscellaneous revenue items such as profit from
sale of fixed assets and revenue from non-gas
transportation activities.
Revenue
Reporting period -Related party transactions
EGP did not have any revenue from its related parties.

4 — REVENUE BY SERVICE
10 Public—31 December 2018 © Eastern Gas Pipeline
Table Name
Base Information Population Approach
Source Methodology Assumptions
Reference Item Actual / Estimate
2.1.1.b
2.1.1.c
2.1.1.c
Customer Contributions
Revenue Profit from sale of fixed assets
Other Direct Revenue
Actual
Actual
Actual
SAP
SAP
SAP/PypIT
Customer Contributions Revenue
References ‘revenue contributions’ in ‘Table 2.2’
Profit from sale of fixed assets
EGP captures such amounts in its accounting systems and
was sourced from the EGP’s Trial Balance (TB).
Other Direct Revenue
Includes:
Items that are not pipeline service related and is
miscellaneous in nature. EGP collects such items
using costs elements and projects; and
That is exempt WAP services.
REVENUE – CONTRIBUTIONS — 5
Public—31 December 2018 © Eastern Gas Pipeline 11
5. REVENUE – CONTRIBUTIONS
Table Name
Base Information Population Approach
Source Methodology Assumptions
Reference Item Actual / Estimate
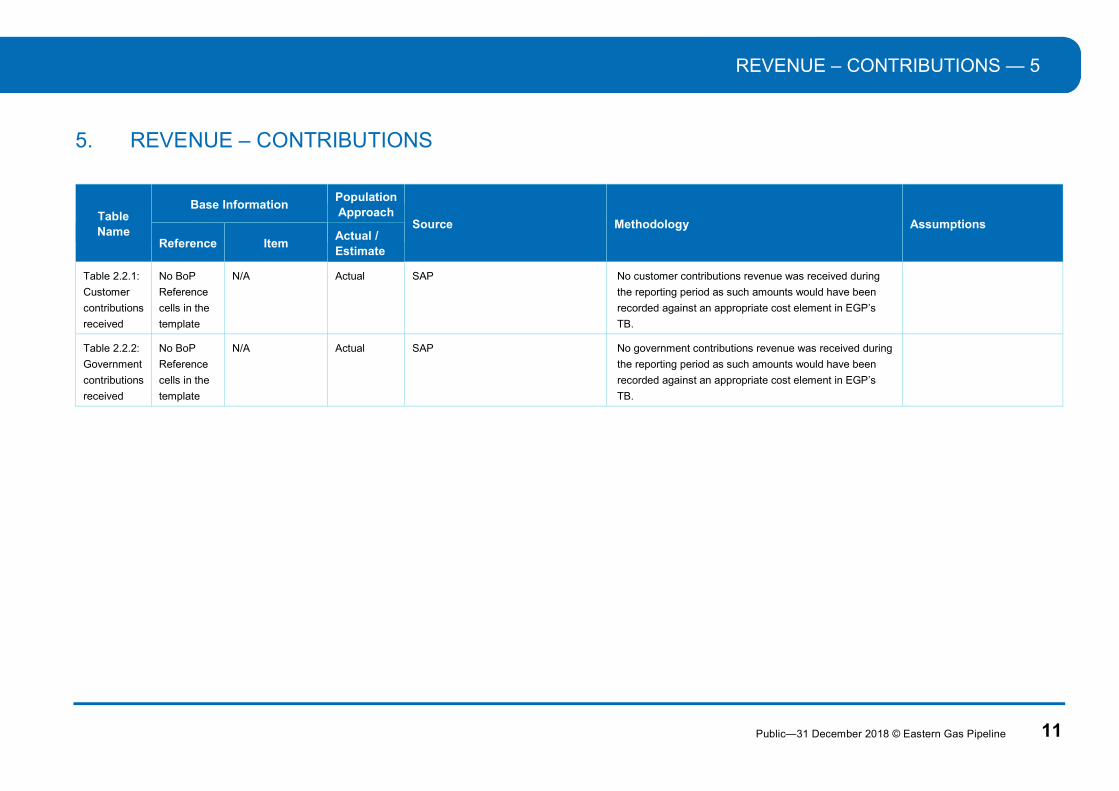
Table 2.2.1:
Customer
contributions
received
No BoP
Reference
cells in the
template
N/A Actual SAP No customer contributions revenue was received during
the reporting period as such amounts would have been
recorded against an appropriate cost element in EGP’s
TB.
Table 2.2.2:
Government
contributions
received
No BoP
Reference
cells in the
template
N/A Actual SAP No government contributions revenue was received during
the reporting period as such amounts would have been
recorded against an appropriate cost element in EGP’s
TB.
6 — INDIRECT REVENUE
12 Public—31 December 2018 © Eastern Gas Pipeline
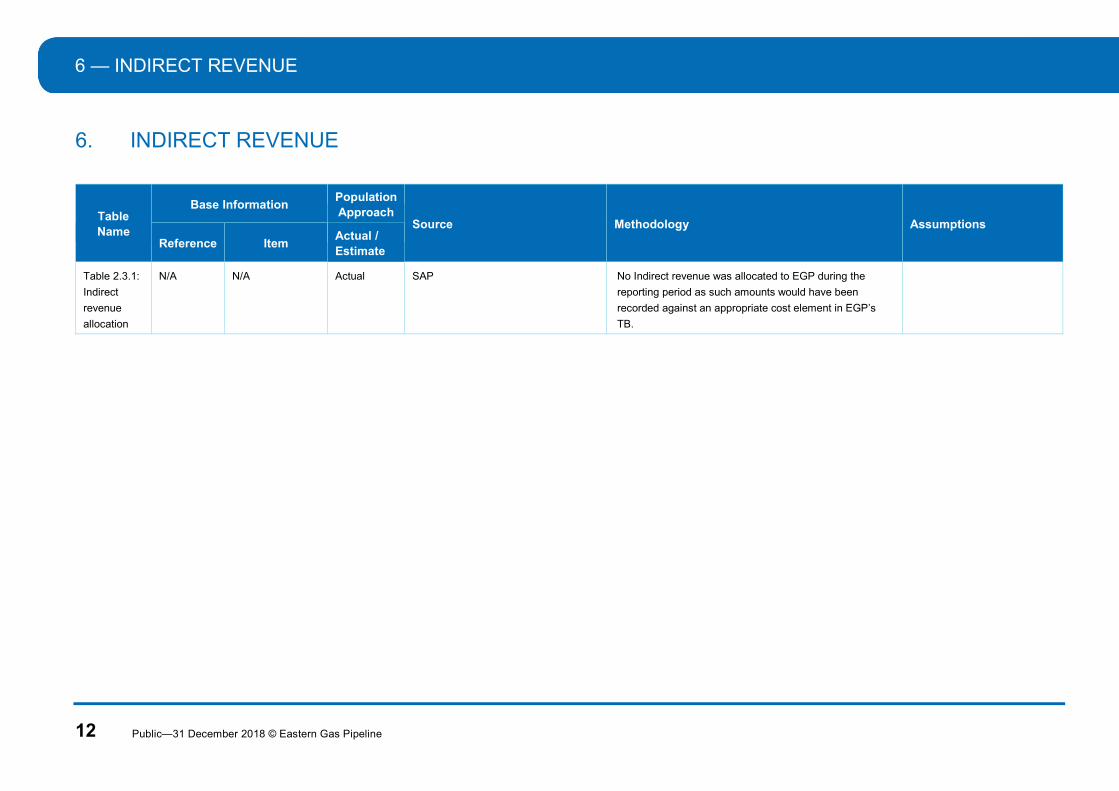
6. INDIRECT REVENUE
Table Name
Base Information Population Approach
Source Methodology Assumptions
Reference Item Actual / Estimate
Table 2.3.1:
Indirect
revenue
allocation
N/A N/A Actual SAP No Indirect revenue was allocated to EGP during the
reporting period as such amounts would have been
recorded against an appropriate cost element in EGP’s
TB.
SHARED COSTS — 7
Public—31 December 2018 © Eastern Gas Pipeline 13
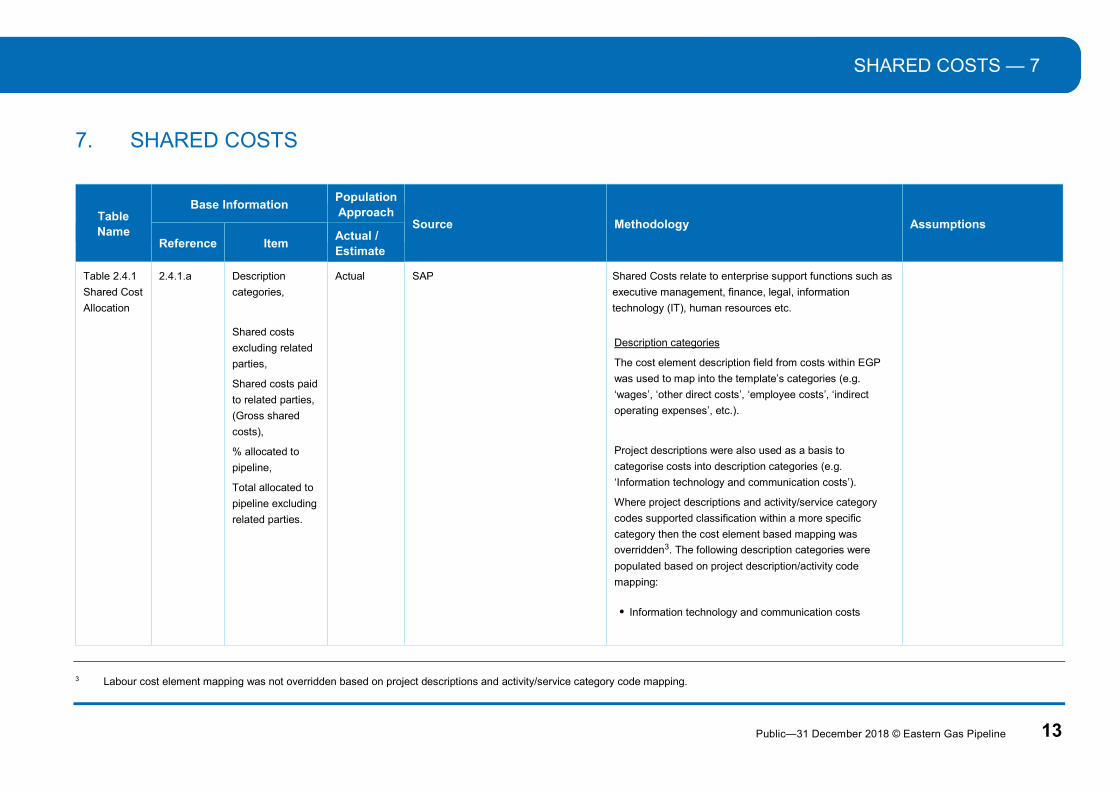
7. SHARED COSTS
Table Name
Base Information Population Approach
Source Methodology Assumptions
Reference Item Actual / Estimate
Table 2.4.1
Shared Cost
Allocation
2.4.1.a Description
categories,
Shared costs
excluding related
parties,
Shared costs paid
to related parties,
(Gross shared
costs),
% allocated to
pipeline,
Total allocated to
pipeline excluding
related parties.
Actual SAP Shared Costs relate to enterprise support functions such as
executive management, finance, legal, information
technology (IT), human resources etc.
Description categories
The cost element description field from costs within EGP
was used to map into the template’s categories (e.g.
‘wages’, ‘other direct costs’, ‘employee costs’, ‘indirect
operating expenses’, etc.).
Project descriptions were also used as a basis to
categorise costs into description categories (e.g.
‘Information technology and communication costs’).
Where project descriptions and activity/service category
codes supported classification within a more specific
category then the cost element based mapping was
overridden3. The following description categories were
populated based on project description/activity code
mapping:
Information technology and communication costs
3 Labour cost element mapping was not overridden based on project descriptions and activity/service category code mapping.

7 — SHARED COSTS
14 Public—31 December 2018 © Eastern Gas Pipeline
Table Name
Base Information Population Approach
Source Methodology Assumptions
Reference Item Actual / Estimate
Rental and leasing costs
Related party and non-related party:
Shared costs excluding related parties
Where projects costs are collected directly to the
pipeline and not through a related party entity they were
reported in the ‘Shared costs excluding related parties’
column. Shared asset depreciation is the only value
included in this column as depreciation is based on
shared assets purchased by the Jemena Group and
allocated to EGP.
Shared costs paid to related parties,
The gross shared costs paid to related parties e.g.
Finance, Legal, Managing Director are the total shared
costs incurred across The Jemena Group before
allocating to specific assets (e.g. pipelines, distribution
networks etc.). Gross shared costs are collected in SAP
at the JAM entity. It is at this entity that the allocation of
shared costs occur. These allocated costs are
transferred to EGP using SAP functionality and mapped
into the template categories based on a methodology
consistent with the approach outlined above for net
shared costs, therefore based on:
cost element mapping; and
SHARED COSTS — 7
Public—31 December 2018 © Eastern Gas Pipeline 15
Table Name
Base Information Population Approach
Source Methodology Assumptions
Reference Item Actual / Estimate
project descriptions and activity/service category codes
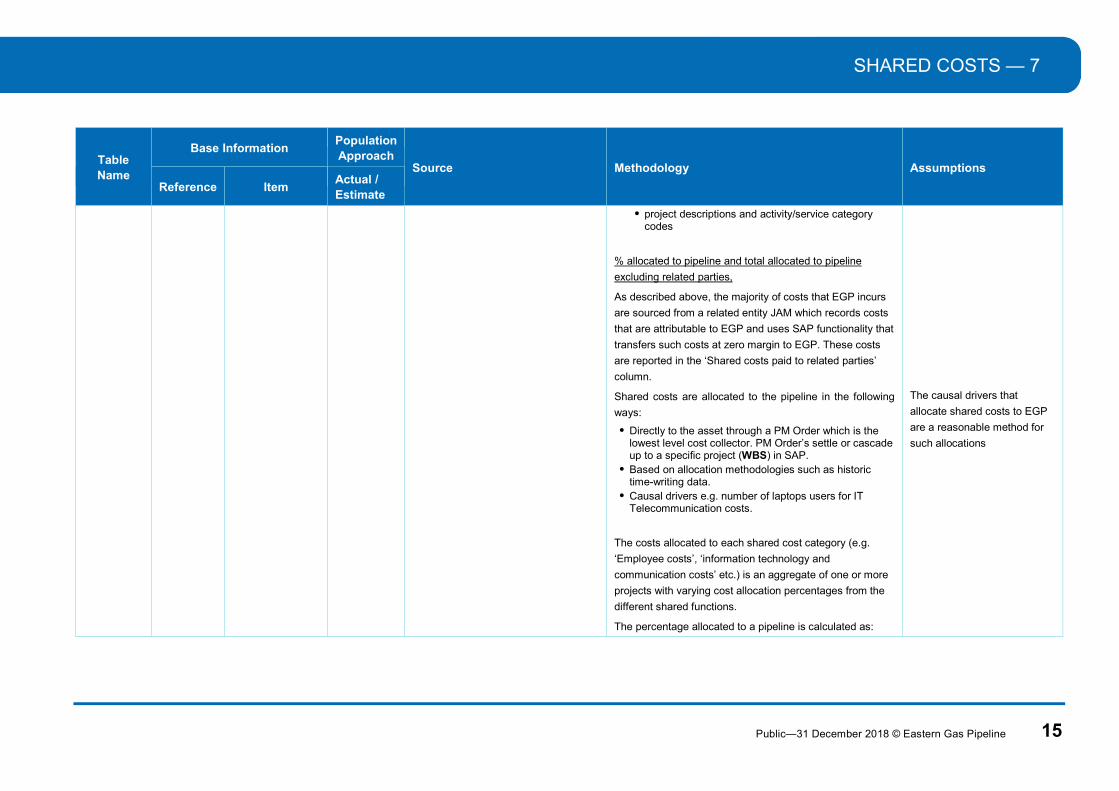
% allocated to pipeline and total allocated to pipeline
excluding related parties,
As described above, the majority of costs that EGP incurs
are sourced from a related entity JAM which records costs
that are attributable to EGP and uses SAP functionality that
transfers such costs at zero margin to EGP. These costs
are reported in the ‘Shared costs paid to related parties’
column.
Shared costs are allocated to the pipeline in the following
ways:
Directly to the asset through a PM Order which is the lowest level cost collector. PM Order’s settle or cascade up to a specific project (WBS) in SAP.
Based on allocation methodologies such as historic time-writing data.
Causal drivers e.g. number of laptops users for IT Telecommunication costs.
The costs allocated to each shared cost category (e.g.
‘Employee costs’, ‘information technology and
communication costs’ etc.) is an aggregate of one or more
projects with varying cost allocation percentages from the
different shared functions.
The percentage allocated to a pipeline is calculated as:
The causal drivers that
allocate shared costs to EGP
are a reasonable method for
such allocations

7 — SHARED COSTS
16 Public—31 December 2018 © Eastern Gas Pipeline
Table Name
Base Information Population Approach
Source Methodology Assumptions
Reference Item Actual / Estimate
Amounts allocated to pipeline divided by
the gross amount across the Jemena
Group.
The shared costs allocated to the pipeline is sourced from
SAP using a combination of projects and cost elements.

STATEMENT OF PIPELINE ASSETS — 8
Public—31 December 2018 © Eastern Gas Pipeline 17
8. STATEMENT OF PIPELINE ASSETS
Table Name
Base Information Population Approach
Source Methodology Assumptions
Reference Item Actual / Estimate
Table 3.1:
Pipeline
assets
3.1.a Initial construction cost,
Initial purchase cost,
Additions,
Additions and improvements capitalised,
Capitalised maintenance,
Asset disposal (at cost),
Less depreciation.
Actual
Table 3.3.1: Fixed assets at cost -
pipeline assets
Table 3.3.2: Shared assets at cost
(less straight line depreciation)
All items were populated based on Australian Energy
Regulator (AER) designed formulas which referenced the
supporting ‘Table 3.3.1: Fixed assets at cost - pipeline
assets’.
Update: Dec-18 vs Jun-18 Disclosures
Some assets and their historical cost were reclassified
from City Gates $(42.1)M to Compressors $35.9M and
Pipelines $6.2M based on better information within asset
additions reports.
Other non-depreciable pipeline assets.
Actual SGSPAA Group Consolidation support
schedule (Fair Value Adjustments and
Goodwill)
The SGSPAA Group consolidates its resulting Purchase
Price Adjustments from acquisitions at a Group entity level,
meaning that it does not distribute and fair value
adjustments to its subsidiary entities. These Group
adjustments are maintained in an excel spreadsheet
outside the Group’s SAP system.
Fair value adjustments (original cost and accumulated
depreciation) that relates to EGP has been allocated to the
categories in the template on the basis fixed asset
information contained in a Fair Value schedule and input
from a subject matter expert who assisted in the
EGP believes that the
allocation is reasonable as it
based on information
contained Fair Value uplift
schedule maintained by the
Group. This schedule has
sufficient EGP pipeline fixed
asset categorisation that
formed the basis of the
allocation of the assets as
categorised in the template.

8 — STATEMENT OF PIPELINE ASSETS
18 Public—31 December 2018 © Eastern Gas Pipeline
Table Name
Base Information Population Approach
Source Methodology Assumptions
Reference Item Actual / Estimate
categorisation of these adjustments into the template
categories
Table 3.1:
Pipeline
assets
3.1.a.1 Other non-depreciable pipeline assets
Actual SGSPAA Group Consolidation support
schedule (Fair Value Adjustments and
Goodwill)
The SGSPAA Group consolidates its resulting Goodwill
from acquisitions at a SGSPAA Group entity level,
meaning that it does not pass-on any Goodwill into its
subsidiary entities. These SGSPAA Group adjustments are
maintained in an excel spreadsheet outside the SGSPAA
Group’s SAP system and allocated to the SGSPAA
Group’s cash generating units (e.g. pipelines) for the
purpose of impairment testing, in accordance with
Australian Accounting Standards. The Guideline does not
restrict consideration to only those assets identifiable at
the direct pipeline owning entity level and accordingly EGP
allocated Goodwill to the pipeline in its statement of
assets. EGP considered this a reasonable allocation and
disclosure.
As there is no specific
Goodwill category, EGP has
included Goodwill in the
‘Other non-depreciable
pipeline assets’ in the
template.
Table 3.1:
Pipeline
assets
3.1.b Inventories,
Deferred tax assets,
Other assets
Actual SAP
All items were balances extracted from EGP’s Trial
Balances for the reporting period.
Other Assets include GL accounts such as accrued
receivables and amounts due from related parties as
sourced from the TB.
SAP has functionality that records and identifies any
transactions from related parties to EGP, known as trading
partner. Related party loan accounts with each trading
partner entity were aggregated, where the receivable
amount was greater the payable amount the net amount
was reported in ‘Other assets’. Where the payable amount
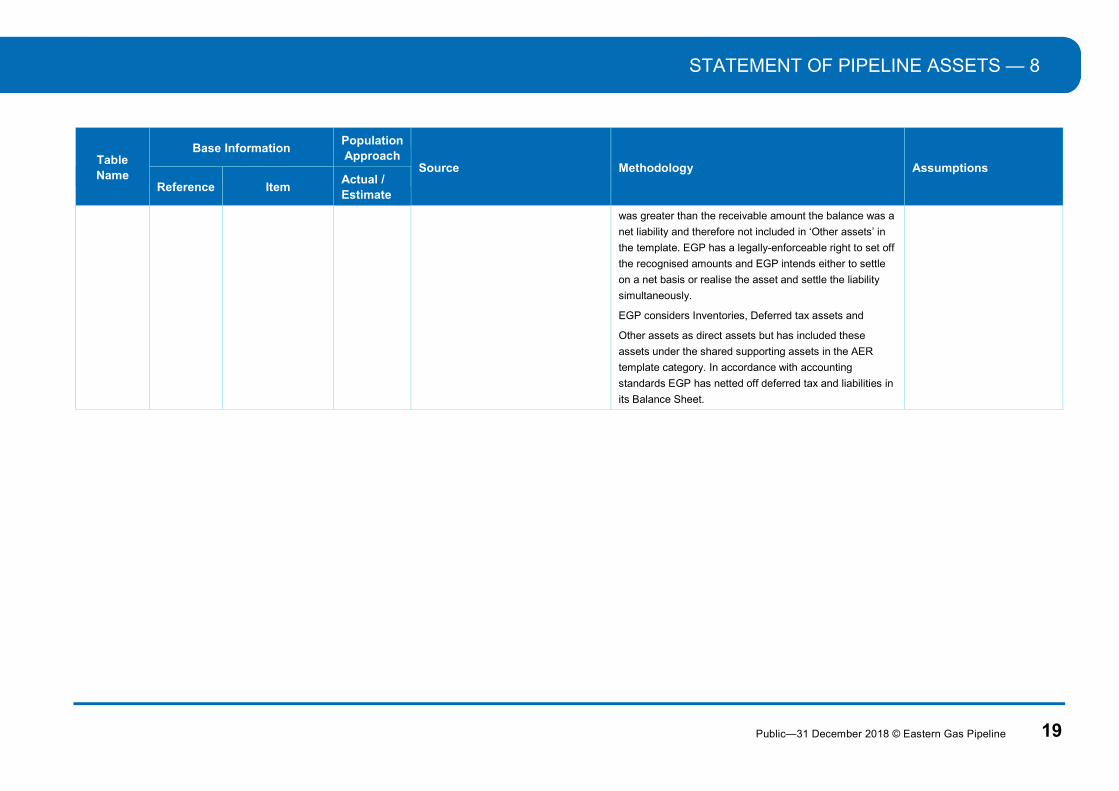
STATEMENT OF PIPELINE ASSETS — 8
Public—31 December 2018 © Eastern Gas Pipeline 19
Table Name
Base Information Population Approach
Source Methodology Assumptions
Reference Item Actual / Estimate
was greater than the receivable amount the balance was a
net liability and therefore not included in ‘Other assets’ in
the template. EGP has a legally-enforceable right to set off
the recognised amounts and EGP intends either to settle
on a net basis or realise the asset and settle the liability
simultaneously.
EGP considers Inventories, Deferred tax assets and
Other assets as direct assets but has included these
assets under the shared supporting assets in the AER
template category. In accordance with accounting
standards EGP has netted off deferred tax and liabilities in
its Balance Sheet.
9 — ASSET USEFUL LIFE
20 Public—31 December 2018 © Eastern Gas Pipeline
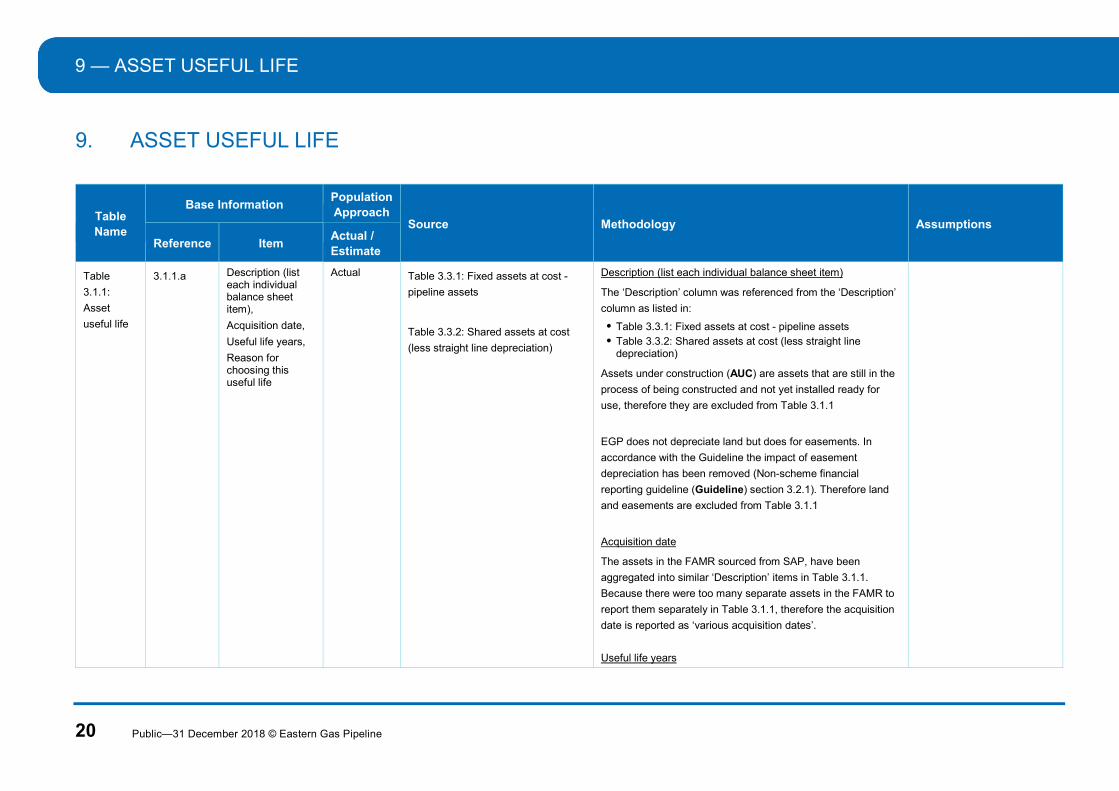
9. ASSET USEFUL LIFE
Table Name
Base Information Population Approach
Source Methodology Assumptions
Reference Item Actual / Estimate
Table
3.1.1:
Asset
useful life
3.1.1.a Description (list each individual balance sheet item),
Acquisition date,
Useful life years,
Reason for choosing this useful life
Actual Table 3.3.1: Fixed assets at cost -
pipeline assets
Table 3.3.2: Shared assets at cost
(less straight line depreciation)
Description (list each individual balance sheet item)
The ‘Description’ column was referenced from the ‘Description’
column as listed in:
Table 3.3.1: Fixed assets at cost - pipeline assets Table 3.3.2: Shared assets at cost (less straight line
depreciation)
Assets under construction (AUC) are assets that are still in the
process of being constructed and not yet installed ready for
use, therefore they are excluded from Table 3.1.1
EGP does not depreciate land but does for easements. In
accordance with the Guideline the impact of easement
depreciation has been removed (Non-scheme financial
reporting guideline (Guideline) section 3.2.1). Therefore land
and easements are excluded from Table 3.1.1
Acquisition date
The assets in the FAMR sourced from SAP, have been
aggregated into similar ‘Description’ items in Table 3.1.1.
Because there were too many separate assets in the FAMR to
report them separately in Table 3.1.1, therefore the acquisition
date is reported as ‘various acquisition dates’.
Useful life years
ASSET USEFUL LIFE — 9
Public—31 December 2018 © Eastern Gas Pipeline 21
Table Name
Base Information Population Approach
Source Methodology Assumptions
Reference Item Actual / Estimate
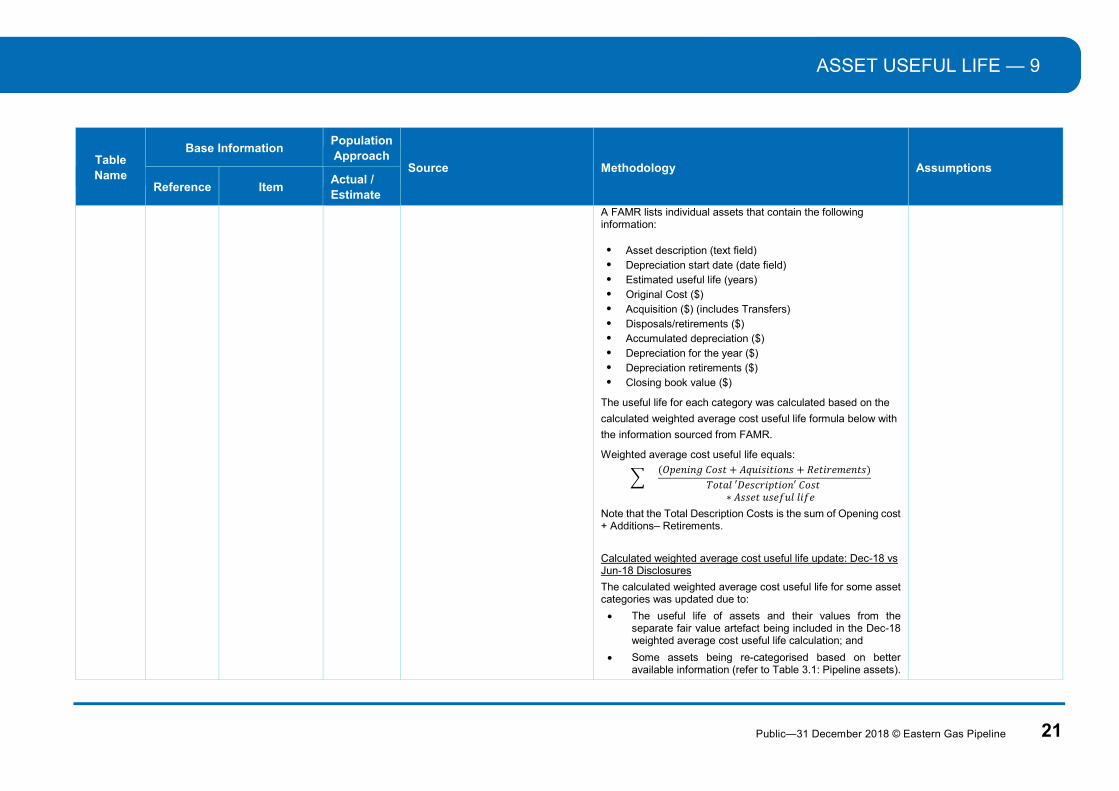
A FAMR lists individual assets that contain the following information:
Asset description (text field) Depreciation start date (date field) Estimated useful life (years) Original Cost ($) Acquisition ($) (includes Transfers) Disposals/retirements ($) Accumulated depreciation ($) Depreciation for the year ($) Depreciation retirements ($) Closing book value ($)
The useful life for each category was calculated based on the
calculated weighted average cost useful life formula below with
the information sourced from FAMR.
Weighted average cost useful life equals:
(𝑂𝑝𝑒𝑛𝑖𝑛𝑔 𝐶𝑜𝑠𝑡 + 𝐴𝑞𝑢𝑖𝑠𝑖𝑡𝑖𝑜𝑛𝑠 + 𝑅𝑒𝑡𝑖𝑟𝑒𝑚𝑒𝑛𝑡𝑠)
𝑇𝑜𝑡𝑎𝑙 ′𝐷𝑒𝑠𝑐𝑟𝑖𝑝𝑡𝑖𝑜𝑛′ 𝐶𝑜𝑠𝑡 ∗ 𝐴𝑠𝑠𝑒𝑡 𝑢𝑠𝑒𝑓𝑢𝑙 𝑙𝑖𝑓𝑒
Note that the Total Description Costs is the sum of Opening cost + Additions– Retirements.
Calculated weighted average cost useful life update: Dec-18 vs Jun-18 Disclosures
The calculated weighted average cost useful life for some asset categories was updated due to:
The useful life of assets and their values from the separate fair value artefact being included in the Dec-18 weighted average cost useful life calculation; and
Some assets being re-categorised based on better available information (refer to Table 3.1: Pipeline assets).
9 — ASSET USEFUL LIFE
22 Public—31 December 2018 © Eastern Gas Pipeline
Table Name
Base Information Population Approach
Source Methodology Assumptions
Reference Item Actual / Estimate
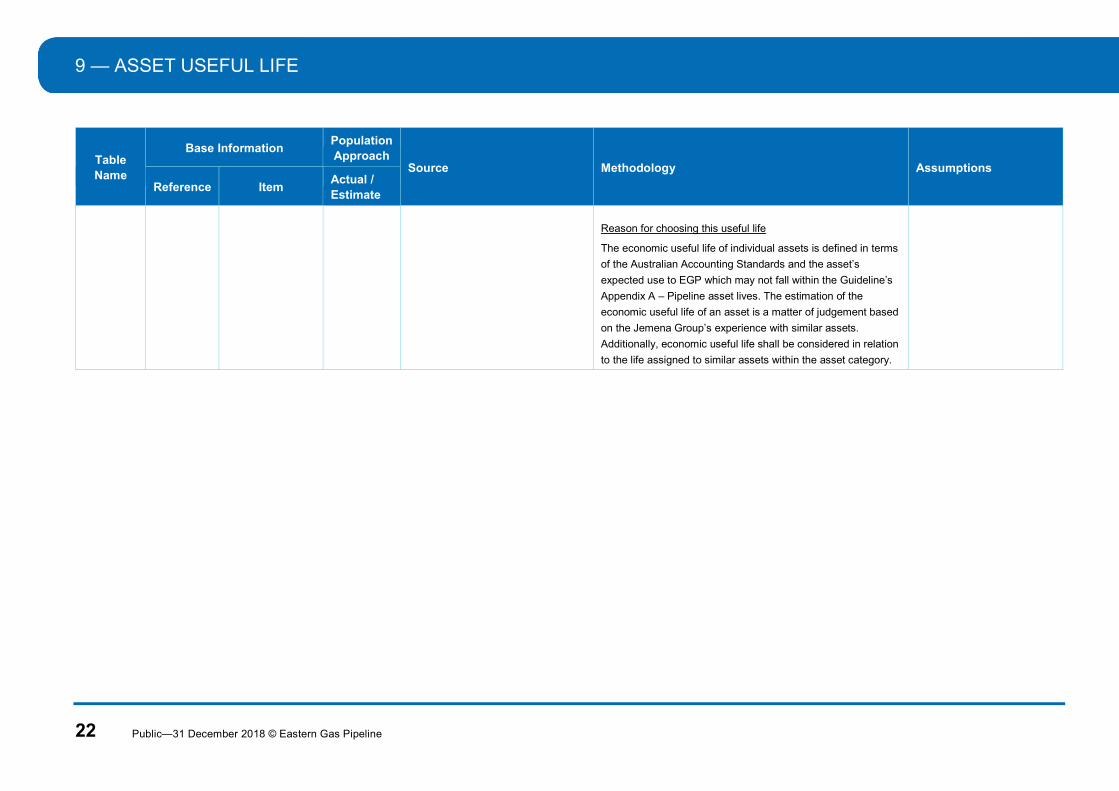
Reason for choosing this useful life
The economic useful life of individual assets is defined in terms
of the Australian Accounting Standards and the asset’s
expected use to EGP which may not fall within the Guideline’s
Appendix A – Pipeline asset lives. The estimation of the
economic useful life of an asset is a matter of judgement based
on the Jemena Group’s experience with similar assets.
Additionally, economic useful life shall be considered in relation
to the life assigned to similar assets within the asset category.
ASSET IMPAIRMENT — 10
Public—31 December 2018 © Eastern Gas Pipeline 23
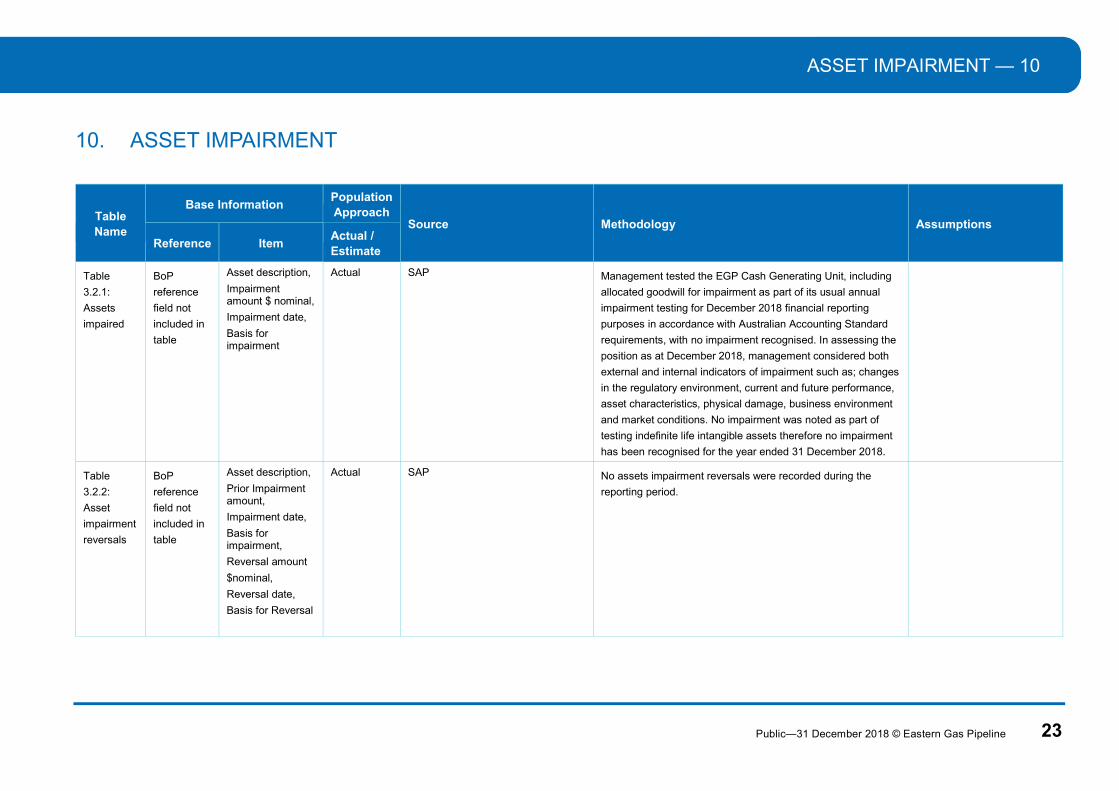
10. ASSET IMPAIRMENT
Table Name
Base Information Population Approach
Source Methodology Assumptions
Reference Item Actual / Estimate
Table
3.2.1:
Assets
impaired
BoP
reference
field not
included in
table
Asset description,
Impairment amount $ nominal,
Impairment date,
Basis for impairment
Actual SAP
Management tested the EGP Cash Generating Unit, including
allocated goodwill for impairment as part of its usual annual
impairment testing for December 2018 financial reporting
purposes in accordance with Australian Accounting Standard
requirements, with no impairment recognised. In assessing the
position as at December 2018, management considered both
external and internal indicators of impairment such as; changes
in the regulatory environment, current and future performance,
asset characteristics, physical damage, business environment
and market conditions. No impairment was noted as part of
testing indefinite life intangible assets therefore no impairment
has been recognised for the year ended 31 December 2018.
Table
3.2.2:
Asset
impairment
reversals
BoP
reference
field not
included in
table
Asset description,
Prior Impairment amount,
Impairment date,
Basis for impairment,
Reversal amount
$nominal,
Reversal date,
Basis for Reversal
Actual SAP
No assets impairment reversals were recorded during the
reporting period.

11 — DEPRECIATION
24 Public—31 December 2018 © Eastern Gas Pipeline
11. DEPRECIATION
Table Name
Base Information Population Approach
Source Methodology Assumptions
Reference Item Actual / Estimate
Table 3.3.1:
Fixed assets
at cost -
pipeline
assets &
Table 3.3.2:
Shared
assets at
cost (less
straight line
depreciation)
3.3.1.a
3.3.2.a
Description,
Category,
Acquisition date,
Useful life,
Estimated
residual value,
Construction or
acquisition cost,
Additions,
Capitalised
Maintenance
Disposals, Cost
Base, Prior years’
accumulated
depreciation
Current year
accumulated
depreciation,
Written Down
Value
Actual SAP FAMR and equipment listing
report
The FAMR lists individual assets that was downloaded from
SAP.
Category
Each asset was mapped into the relevant categories provided
in the AER template drop down list (e.g. Pipeline, Compressor,
City Gates etc.) based on:
analysis of the FAMR Asset description & Asset class; input from engineers and subject matter experts; and where relevant, analysis of a separate corresponding
equipment listing report which contains more detailed information than the FAMR.
EGP used subject matter experts to map its asset categories to
that in the template as EGP’s SAP system was designed prior
to the establishment of the GMR reporting regime.
Description
The asset description was mapped to the categories in the
template except for the following items which were not included
in the AER’s drop down list of categories: AUC Network, AUC-
Intangibles, AUC Non-Network.
AUC are assets that are still in the process of being
constructed and not yet installed ready for use. Therefore
depreciation expense was not yet applied.
DEPRECIATION — 11
Public—31 December 2018 © Eastern Gas Pipeline 25
Table Name
Base Information Population Approach
Source Methodology Assumptions
Reference Item Actual / Estimate
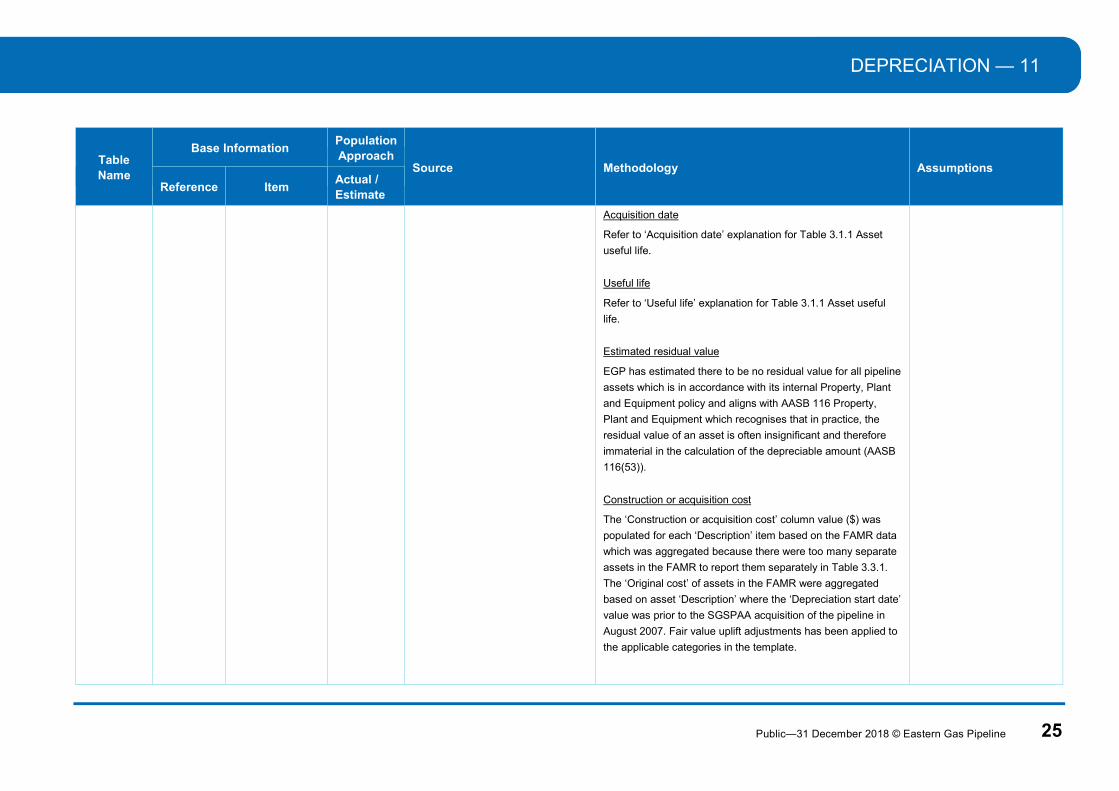
Acquisition date
Refer to ‘Acquisition date’ explanation for Table 3.1.1 Asset
useful life.
Useful life
Refer to ‘Useful life’ explanation for Table 3.1.1 Asset useful
life.
Estimated residual value
EGP has estimated there to be no residual value for all pipeline
assets which is in accordance with its internal Property, Plant
and Equipment policy and aligns with AASB 116 Property,
Plant and Equipment which recognises that in practice, the
residual value of an asset is often insignificant and therefore
immaterial in the calculation of the depreciable amount (AASB
116(53)).
Construction or acquisition cost
The ‘Construction or acquisition cost’ column value ($) was
populated for each ‘Description’ item based on the FAMR data
which was aggregated because there were too many separate
assets in the FAMR to report them separately in Table 3.3.1.
The ‘Original cost’ of assets in the FAMR were aggregated
based on asset ‘Description’ where the ‘Depreciation start date’
value was prior to the SGSPAA acquisition of the pipeline in
August 2007. Fair value uplift adjustments has been applied to
the applicable categories in the template.

11 — DEPRECIATION
26 Public—31 December 2018 © Eastern Gas Pipeline
Table Name
Base Information Population Approach
Source Methodology Assumptions
Reference Item Actual / Estimate
Prior year disposal removed from the ‘Construction or
acquisition cost’ were added back to report a life to date
‘Construction or acquisition cost’ (refer to disposal explanation
below for methodology explanation) prior to SGSPAA’s
acquisition of the pipeline during August 2007.
Additions
The ‘Additions’ column was populated for each description item
based on the FAMR data which was aggregated because there
were too many separate assets in the FAMR to report them
separately in Table 3.3.1. The ‘Original cost’ and the
‘Acquisition’ value of assets in the FAMR were aggregated
based on asset ‘Description’ where the ‘Depreciation start date’
value was after SGSPAA’s acquisition of the pipeline during
August 2007.
Prior year disposals removed from the original cost were added
back to report a life to date original cost after SGSPAA’s
acquisition of the pipeline during August 2007.
Capitalised Maintenance
EGP does not have any capitalised maintenance. Maintenance
costs such as day to day servicing including labour,
consumables and spare parts are excluded from measurement
of an item of PPE in accordance with the SGSPAA Group’s
PPE policy and AASB 116 (12).
Disposals
DEPRECIATION — 11
Public—31 December 2018 © Eastern Gas Pipeline 27
Table Name
Base Information Population Approach
Source Methodology Assumptions
Reference Item Actual / Estimate
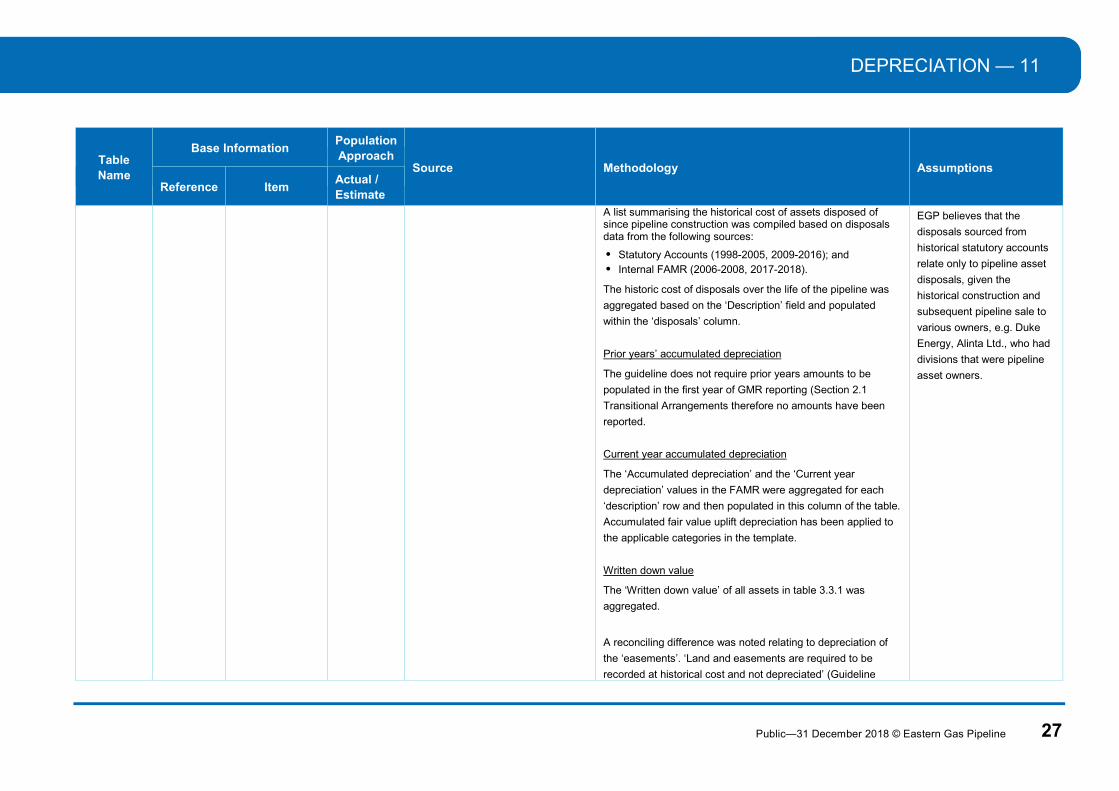
A list summarising the historical cost of assets disposed of since pipeline construction was compiled based on disposals data from the following sources:
Statutory Accounts (1998-2005, 2009-2016); and Internal FAMR (2006-2008, 2017-2018).
The historic cost of disposals over the life of the pipeline was
aggregated based on the ‘Description’ field and populated
within the ‘disposals’ column.
Prior years’ accumulated depreciation
The guideline does not require prior years amounts to be
populated in the first year of GMR reporting (Section 2.1
Transitional Arrangements therefore no amounts have been
reported.
Current year accumulated depreciation
The ‘Accumulated depreciation’ and the ‘Current year
depreciation’ values in the FAMR were aggregated for each
‘description’ row and then populated in this column of the table.
Accumulated fair value uplift depreciation has been applied to
the applicable categories in the template.
Written down value
The ‘Written down value’ of all assets in table 3.3.1 was
aggregated.
A reconciling difference was noted relating to depreciation of
the ‘easements’. ‘Land and easements are required to be
recorded at historical cost and not depreciated’ (Guideline
EGP believes that the
disposals sourced from
historical statutory accounts
relate only to pipeline asset
disposals, given the
historical construction and
subsequent pipeline sale to
various owners, e.g. Duke
Energy, Alinta Ltd., who had
divisions that were pipeline
asset owners.
11 — DEPRECIATION
28 Public—31 December 2018 © Eastern Gas Pipeline
Table Name
Base Information Population Approach
Source Methodology Assumptions
Reference Item Actual / Estimate
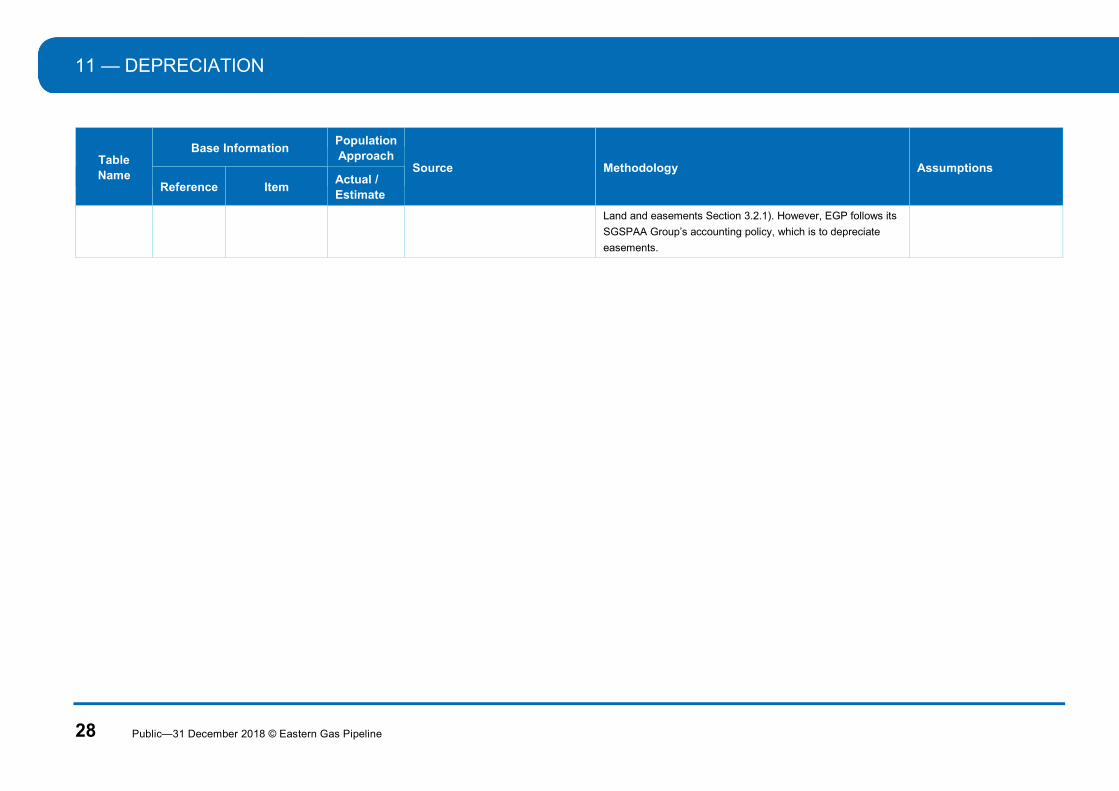
Land and easements Section 3.2.1). However, EGP follows its
SGSPAA Group’s accounting policy, which is to depreciate
easements.
SHARED SUPPORTING ASSETS — 12
Public—31 December 2018 © Eastern Gas Pipeline 29
12. SHARED SUPPORTING ASSETS
Table Name
Base Information Population Approach
Source Methodology Assumptions
Reference Item Actual / Estimate
Table
3.4.1:
Shared
supporting
asset
allocation
3.4.1.a Description (list
each individual
shared asset
category greater
than 5%),
Category of
shared assets,
Total amount,
% allocated to
pipeline,
Total allocated to
pipeline
Actual SAP – FAMR & project cost
download for Shared Assets Capex
at EGP’s level.
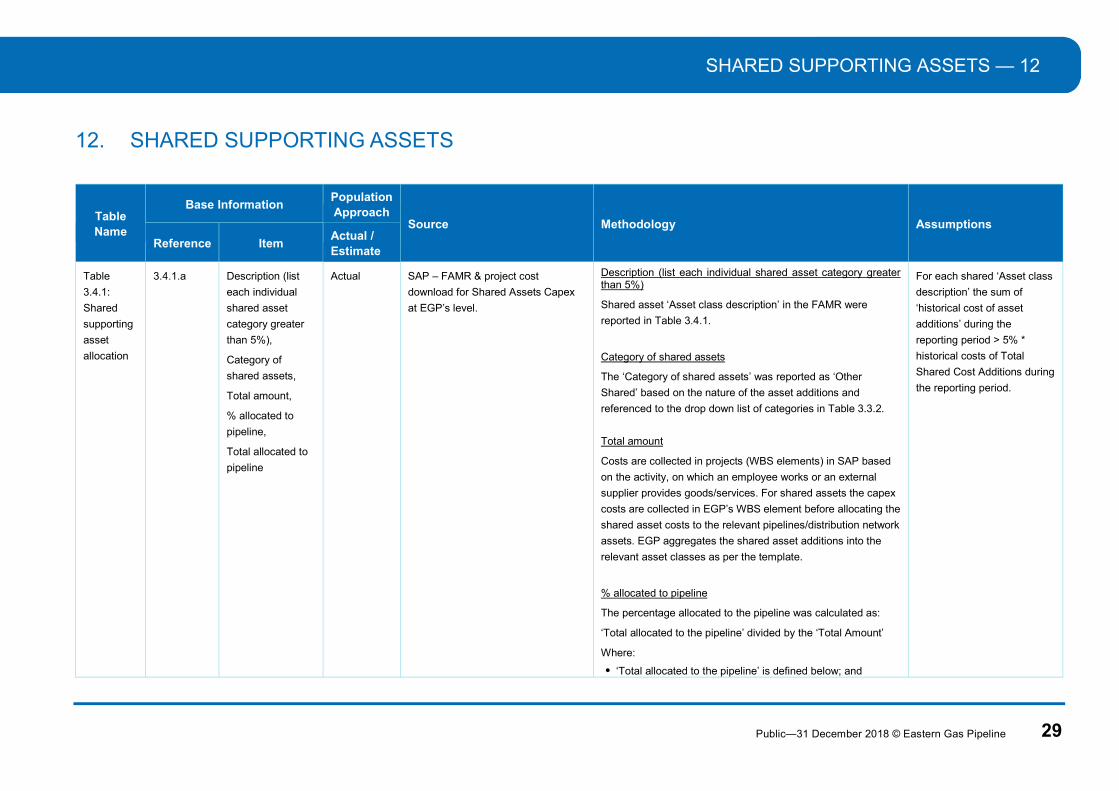
Description (list each individual shared asset category greater than 5%)
Shared asset ‘Asset class description’ in the FAMR were
reported in Table 3.4.1.
Category of shared assets
The ‘Category of shared assets’ was reported as ‘Other
Shared’ based on the nature of the asset additions and
referenced to the drop down list of categories in Table 3.3.2.
Total amount
Costs are collected in projects (WBS elements) in SAP based
on the activity, on which an employee works or an external
supplier provides goods/services. For shared assets the capex
costs are collected in EGP’s WBS element before allocating the
shared asset costs to the relevant pipelines/distribution network
assets. EGP aggregates the shared asset additions into the
relevant asset classes as per the template.
% allocated to pipeline
The percentage allocated to the pipeline was calculated as:
‘Total allocated to the pipeline’ divided by the ‘Total Amount’
Where:
‘Total allocated to the pipeline’ is defined below; and
For each shared ‘Asset class
description’ the sum of
‘historical cost of asset
additions’ during the
reporting period > 5% *
historical costs of Total
Shared Cost Additions during
the reporting period.
12 — SHARED SUPPORTING ASSETS
30 Public—31 December 2018 © Eastern Gas Pipeline
Table Name
Base Information Population Approach
Source Methodology Assumptions
Reference Item Actual / Estimate
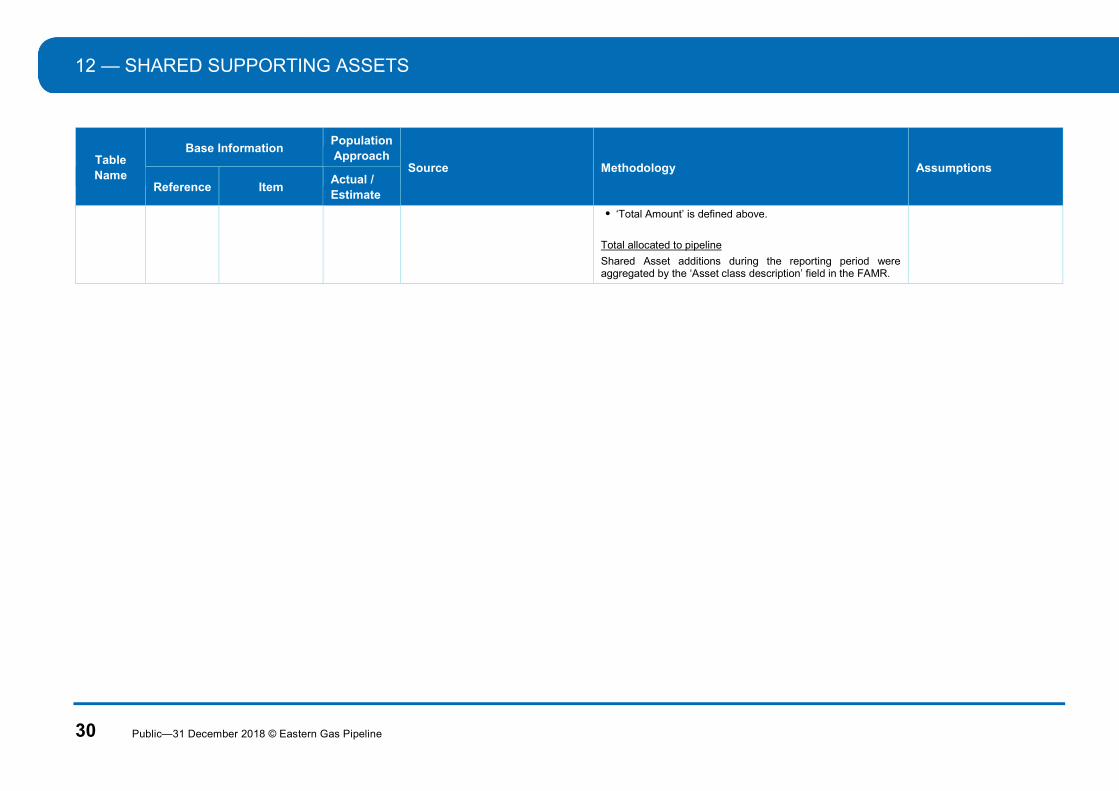
‘Total Amount’ is defined above.
Total allocated to pipeline
Shared Asset additions during the reporting period were aggregated by the ‘Asset class description’ field in the FAMR.

RECOVERED CAPITAL METHOD - PIPELINE ASSETS — 13
Public—31 December 2018 © Eastern Gas Pipeline 31
13. RECOVERED CAPITAL METHOD - PIPELINE ASSETS
Table Name
Base Information Population Approach
Source Methodology Assumptions Asset
Description Year
Item & Basis of Preparation (BoP)
Reference
Actual / Estimate4
Table 4.1:
Recovered
capital method
- pipeline
assets
Pipeline Assets
1998 - 2000 Construction Cost
BoP Reference: 4.1.a
Actual 1998: Westcoast
Energy, Annual
Report 1998, pg.
20.
1999 – 2000:;
Statutory accounts,
Statement of Cash
Flows:
Duke Energy NSW Gas Holdings (consolidated entity)
1998: The cost incurred during this period are
calculated from Westcoast Energy’s 1998 Annual
Report.
As noted in the report Westcoast Energy sold its 50
percent share of EGP for C$27 million (Canadian
dollars), which resulted in C$8 million net income from
the sale. Using this information, we calculated initial
construction costs to be A$40 million (refer to
calculation breakdown below).
Calculation breakdown
Construction costs = (Proceeds on Sale less Profit on
Sale) * 2
1999 – 2000: Extracted the following item from the
Statement of Cash Flows:
Cash flows from investing activities; Cash paid for
purchase of property, plant and equipment.
Construction took place
over 3 years.
All construction costs
are captured in the
Westcoast Energy
annual report.
All construction costs
are incurred mid-year.
4 For all Estimates, refer to the following table explaining why estimates were required, steps taken to locate actual information, the basis for the estimate and why the estimate represents the best estimate possible
and has been arrived at on a reasonable basis.
13 — RECOVERED CAPITAL METHOD - PIPELINE ASSETS
32 Public—31 December 2018 © Eastern Gas Pipeline
Table Name
Base Information Population Approach
Source Methodology Assumptions Asset
Description Year
Item & Basis of Preparation (BoP)
Reference
Actual / Estimate4
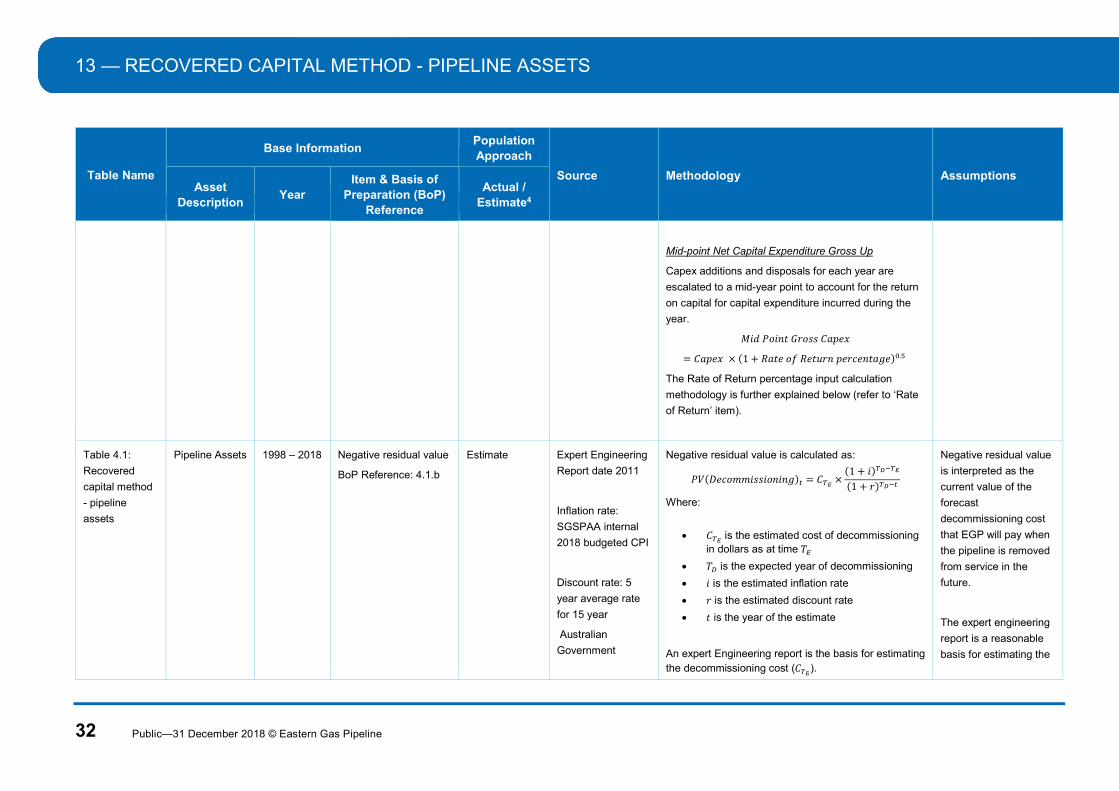
Mid-point Net Capital Expenditure Gross Up
Capex additions and disposals for each year are
escalated to a mid-year point to account for the return
on capital for capital expenditure incurred during the
year.
𝑀𝑖𝑑 𝑃𝑜𝑖𝑛𝑡 𝐺𝑟𝑜𝑠𝑠 𝐶𝑎𝑝𝑒𝑥
= 𝐶𝑎𝑝𝑒𝑥 × (1 + 𝑅𝑎𝑡𝑒 𝑜𝑓 𝑅𝑒𝑡𝑢𝑟𝑛 𝑝𝑒𝑟𝑐𝑒𝑛𝑡𝑎𝑔𝑒) .
The Rate of Return percentage input calculation
methodology is further explained below (refer to ‘Rate
of Return’ item).
Table 4.1:
Recovered
capital method
- pipeline
assets
Pipeline Assets
1998 – 2018 Negative residual value
BoP Reference: 4.1.b
Estimate Expert Engineering
Report date 2011
Inflation rate:
SGSPAA internal
2018 budgeted CPI
Discount rate: 5
year average rate
for 15 year
Australian
Government
Negative residual value is calculated as:
𝑃𝑉(𝐷𝑒𝑐𝑜𝑚𝑚𝑖𝑠𝑠𝑖𝑜𝑛𝑖𝑛𝑔) = 𝐶 ×(1 + 𝑖)
(1 + 𝑟)
Where:
𝐶 is the estimated cost of decommissioning in dollars as at time 𝑇
𝑇 is the expected year of decommissioning
𝑖 is the estimated inflation rate
𝑟 is the estimated discount rate
𝑡 is the year of the estimate
An expert Engineering report is the basis for estimating the decommissioning cost (𝐶 ).
Negative residual value
is interpreted as the
current value of the
forecast
decommissioning cost
that EGP will pay when
the pipeline is removed
from service in the
future.
The expert engineering
report is a reasonable
basis for estimating the
RECOVERED CAPITAL METHOD - PIPELINE ASSETS — 13
Public—31 December 2018 © Eastern Gas Pipeline 33
Table Name
Base Information Population Approach
Source Methodology Assumptions Asset
Description Year
Item & Basis of Preparation (BoP)
Reference
Actual / Estimate4
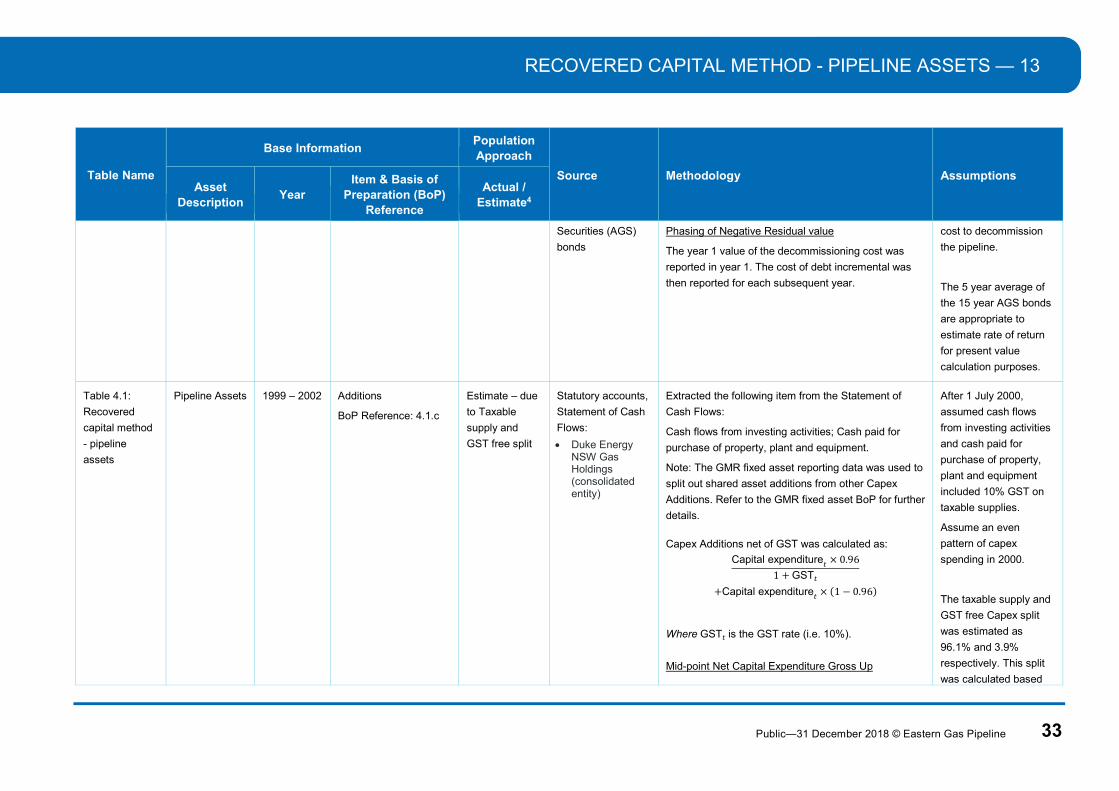
Securities (AGS)
bonds
Phasing of Negative Residual value
The year 1 value of the decommissioning cost was
reported in year 1. The cost of debt incremental was
then reported for each subsequent year.
cost to decommission
the pipeline.
The 5 year average of
the 15 year AGS bonds
are appropriate to
estimate rate of return
for present value
calculation purposes.
Table 4.1:
Recovered
capital method
- pipeline
assets
Pipeline Assets
1999 – 2002 Additions
BoP Reference: 4.1.c
Estimate – due
to Taxable
supply and
GST free split
Statutory accounts,
Statement of Cash
Flows:
Duke Energy NSW Gas Holdings (consolidated entity)
Extracted the following item from the Statement of
Cash Flows:
Cash flows from investing activities; Cash paid for
purchase of property, plant and equipment.
Note: The GMR fixed asset reporting data was used to
split out shared asset additions from other Capex
Additions. Refer to the GMR fixed asset BoP for further
details.
Capex Additions net of GST was calculated as:
Capital expenditure × 0.96
1 + GST
+Capital expenditure × (1 − 0.96)
Where GST is the GST rate (i.e. 10%).
Mid-point Net Capital Expenditure Gross Up
After 1 July 2000,
assumed cash flows
from investing activities
and cash paid for
purchase of property,
plant and equipment
included 10% GST on
taxable supplies.
Assume an even
pattern of capex
spending in 2000.
The taxable supply and
GST free Capex split
was estimated as
96.1% and 3.9%
respectively. This split
was calculated based
13 — RECOVERED CAPITAL METHOD - PIPELINE ASSETS
34 Public—31 December 2018 © Eastern Gas Pipeline
Table Name
Base Information Population Approach
Source Methodology Assumptions Asset
Description Year
Item & Basis of Preparation (BoP)
Reference
Actual / Estimate4
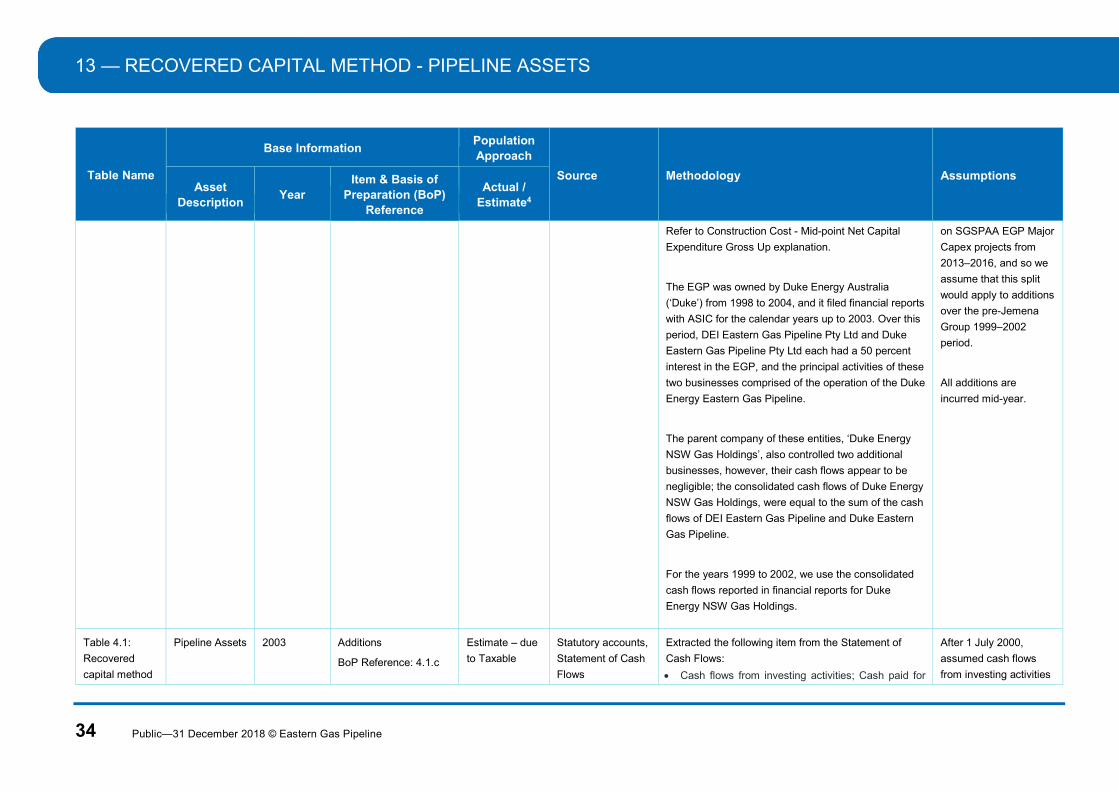
Refer to Construction Cost - Mid-point Net Capital
Expenditure Gross Up explanation.
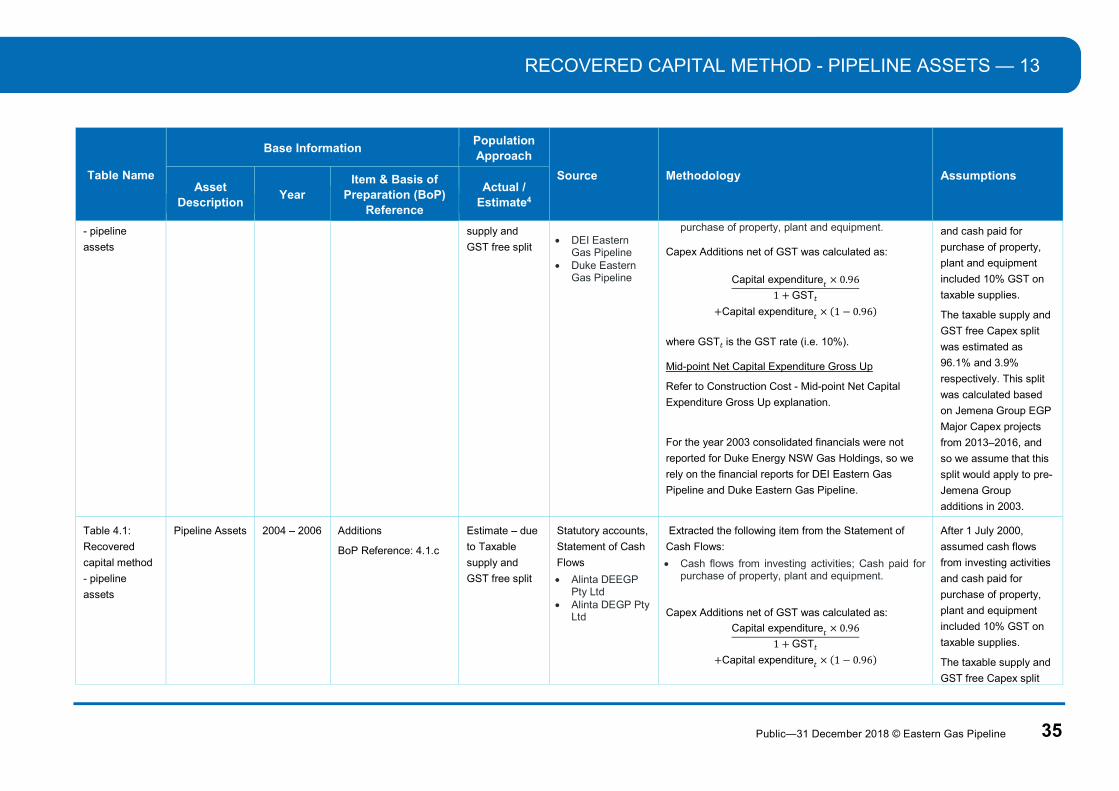
The EGP was owned by Duke Energy Australia
(‘Duke’) from 1998 to 2004, and it filed financial reports
with ASIC for the calendar years up to 2003. Over this
period, DEI Eastern Gas Pipeline Pty Ltd and Duke
Eastern Gas Pipeline Pty Ltd each had a 50 percent
interest in the EGP, and the principal activities of these
two businesses comprised of the operation of the Duke
Energy Eastern Gas Pipeline.
The parent company of these entities, ‘Duke Energy
NSW Gas Holdings’, also controlled two additional
businesses, however, their cash flows appear to be
negligible; the consolidated cash flows of Duke Energy
NSW Gas Holdings, were equal to the sum of the cash
flows of DEI Eastern Gas Pipeline and Duke Eastern
Gas Pipeline.
For the years 1999 to 2002, we use the consolidated
cash flows reported in financial reports for Duke
Energy NSW Gas Holdings.
on SGSPAA EGP Major
Capex projects from
2013–2016, and so we
assume that this split
would apply to additions
over the pre-Jemena
Group 1999–2002
period.
All additions are
incurred mid-year.
Table 4.1:
Recovered
capital method
Pipeline Assets
2003 Additions
BoP Reference: 4.1.c
Estimate – due
to Taxable
Statutory accounts,
Statement of Cash
Flows
Extracted the following item from the Statement of
Cash Flows:
Cash flows from investing activities; Cash paid for
After 1 July 2000,
assumed cash flows
from investing activities
RECOVERED CAPITAL METHOD - PIPELINE ASSETS — 13
Public—31 December 2018 © Eastern Gas Pipeline 35
Table Name
Base Information Population Approach
Source Methodology Assumptions Asset
Description Year
Item & Basis of Preparation (BoP)
Reference
Actual / Estimate4
- pipeline
assets
supply and
GST free split
DEI Eastern
Gas Pipeline Duke Eastern
Gas Pipeline
purchase of property, plant and equipment.
Capex Additions net of GST was calculated as:
Capital expenditure × 0.96
1 + GST
+Capital expenditure × (1 − 0.96)
where GST is the GST rate (i.e. 10%). Mid-point Net Capital Expenditure Gross Up
Refer to Construction Cost - Mid-point Net Capital
Expenditure Gross Up explanation.
For the year 2003 consolidated financials were not
reported for Duke Energy NSW Gas Holdings, so we
rely on the financial reports for DEI Eastern Gas
Pipeline and Duke Eastern Gas Pipeline.
and cash paid for
purchase of property,
plant and equipment
included 10% GST on
taxable supplies.
The taxable supply and
GST free Capex split
was estimated as
96.1% and 3.9%
respectively. This split
was calculated based
on Jemena Group EGP
Major Capex projects
from 2013–2016, and
so we assume that this
split would apply to pre-
Jemena Group
additions in 2003.
Table 4.1:
Recovered
capital method
- pipeline
assets
Pipeline Assets
2004 – 2006 Additions
BoP Reference: 4.1.c
Estimate – due
to Taxable
supply and
GST free split
Statutory accounts,
Statement of Cash
Flows
Alinta DEEGP Pty Ltd
Alinta DEGP Pty Ltd
Extracted the following item from the Statement of
Cash Flows:
Cash flows from investing activities; Cash paid for purchase of property, plant and equipment.
Capex Additions net of GST was calculated as:
Capital expenditure × 0.96
1 + GST
+Capital expenditure × (1 − 0.96)
After 1 July 2000,
assumed cash flows
from investing activities
and cash paid for
purchase of property,
plant and equipment
included 10% GST on
taxable supplies.
The taxable supply and
GST free Capex split
13 — RECOVERED CAPITAL METHOD - PIPELINE ASSETS
36 Public—31 December 2018 © Eastern Gas Pipeline
Table Name
Base Information Population Approach
Source Methodology Assumptions Asset
Description Year
Item & Basis of Preparation (BoP)
Reference
Actual / Estimate4
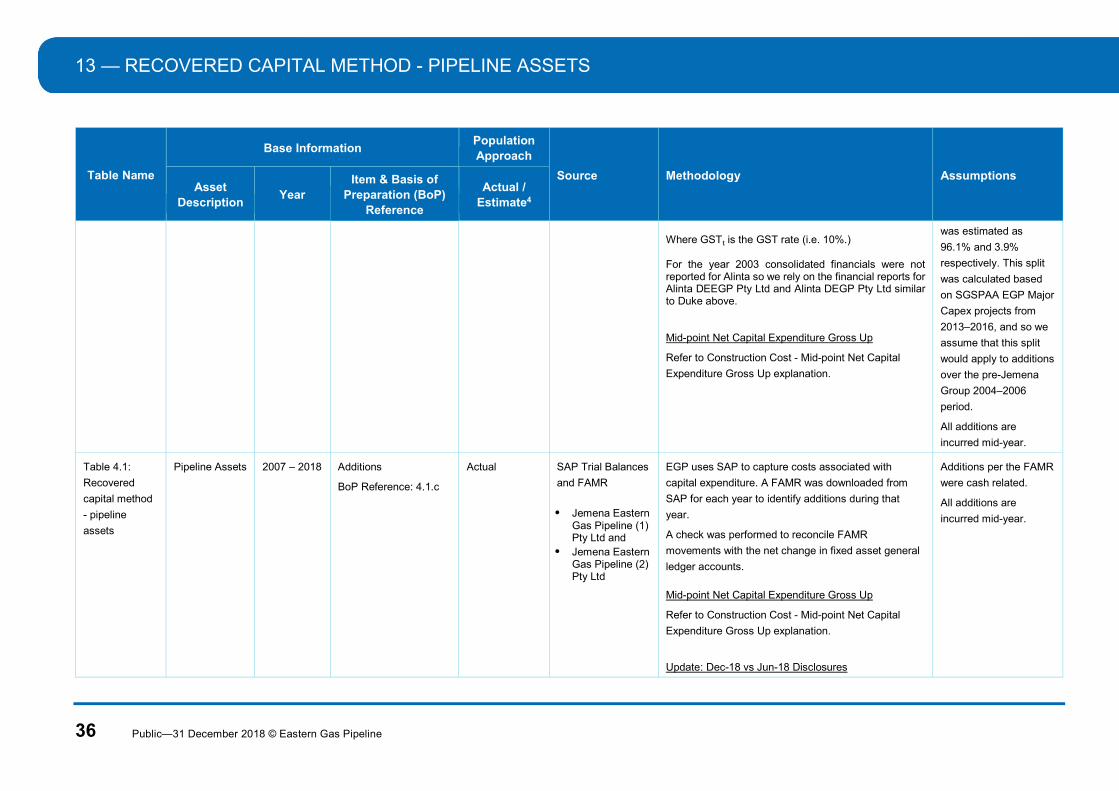
Where GST is the GST rate (i.e. 10%.) For the year 2003 consolidated financials were not reported for Alinta so we rely on the financial reports for Alinta DEEGP Pty Ltd and Alinta DEGP Pty Ltd similar to Duke above. Mid-point Net Capital Expenditure Gross Up
Refer to Construction Cost - Mid-point Net Capital
Expenditure Gross Up explanation.
was estimated as
96.1% and 3.9%
respectively. This split
was calculated based
on SGSPAA EGP Major
Capex projects from
2013–2016, and so we
assume that this split
would apply to additions
over the pre-Jemena
Group 2004–2006
period.
All additions are
incurred mid-year.
Table 4.1:
Recovered
capital method
- pipeline
assets
Pipeline Assets
2007 – 2018 Additions
BoP Reference: 4.1.c
Actual SAP Trial Balances
and FAMR
Jemena Eastern
Gas Pipeline (1) Pty Ltd and
Jemena Eastern Gas Pipeline (2) Pty Ltd
EGP uses SAP to capture costs associated with
capital expenditure. A FAMR was downloaded from
SAP for each year to identify additions during that
year.
A check was performed to reconcile FAMR
movements with the net change in fixed asset general
ledger accounts.
Mid-point Net Capital Expenditure Gross Up
Refer to Construction Cost - Mid-point Net Capital
Expenditure Gross Up explanation.
Update: Dec-18 vs Jun-18 Disclosures
Additions per the FAMR
were cash related.
All additions are
incurred mid-year.
RECOVERED CAPITAL METHOD - PIPELINE ASSETS — 13
Public—31 December 2018 © Eastern Gas Pipeline 37
Table Name
Base Information Population Approach
Source Methodology Assumptions Asset
Description Year
Item & Basis of Preparation (BoP)
Reference
Actual / Estimate4
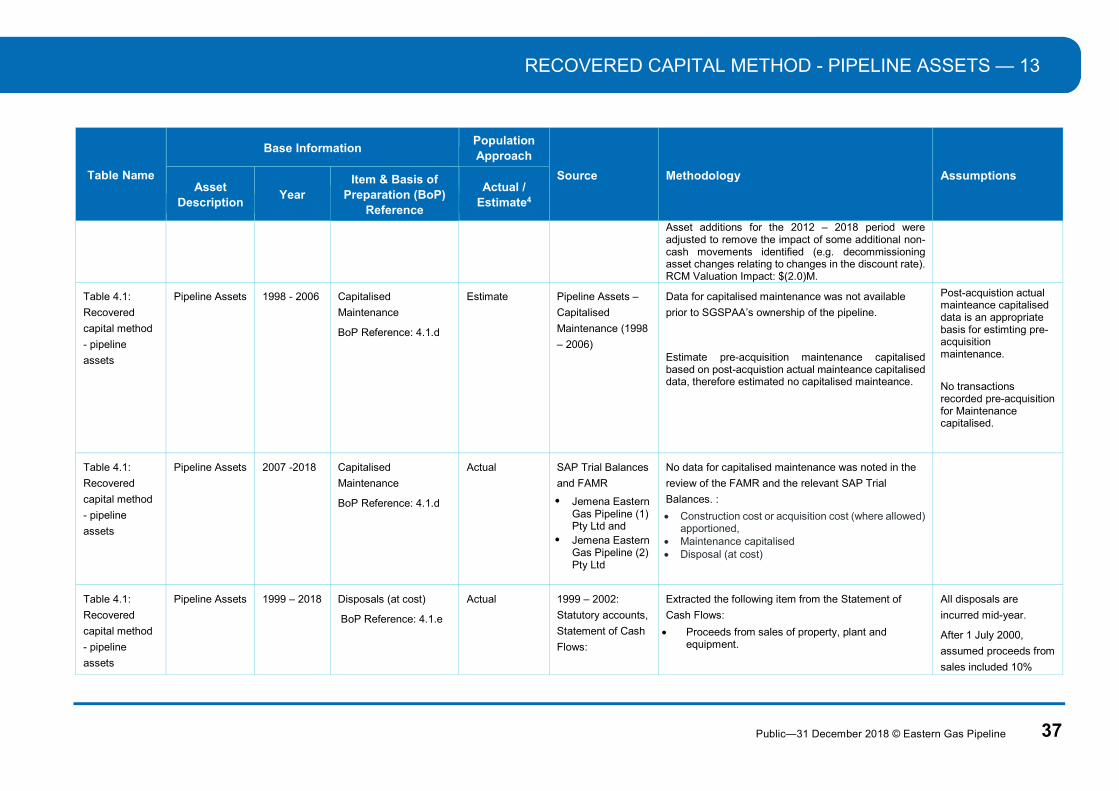
Asset additions for the 2012 – 2018 period were adjusted to remove the impact of some additional non-cash movements identified (e.g. decommissioning asset changes relating to changes in the discount rate). RCM Valuation Impact: $(2.0)M.
Table 4.1:
Recovered
capital method
- pipeline
assets
Pipeline Assets
1998 - 2006 Capitalised
Maintenance
BoP Reference: 4.1.d
Estimate Pipeline Assets –
Capitalised
Maintenance (1998
– 2006)
Data for capitalised maintenance was not available
prior to SGSPAA’s ownership of the pipeline.
Estimate pre-acquisition maintenance capitalised based on post-acquistion actual mainteance capitalised data, therefore estimated no capitalised mainteance.
Post-acquistion actual mainteance capitalised data is an appropriate basis for estimting pre-acquisition maintenance.
No transactions recorded pre-acquisition for Maintenance capitalised.
Table 4.1:
Recovered
capital method
- pipeline
assets
Pipeline Assets
2007 -2018 Capitalised
Maintenance
BoP Reference: 4.1.d
Actual SAP Trial Balances
and FAMR
Jemena Eastern Gas Pipeline (1) Pty Ltd and
Jemena Eastern Gas Pipeline (2) Pty Ltd
No data for capitalised maintenance was noted in the
review of the FAMR and the relevant SAP Trial
Balances. :
Construction cost or acquisition cost (where allowed) apportioned,
Maintenance capitalised Disposal (at cost)
Table 4.1:
Recovered
capital method
- pipeline
assets
Pipeline Assets
1999 – 2018 Disposals (at cost)
BoP Reference: 4.1.e
Actual
1999 – 2002:
Statutory accounts,
Statement of Cash
Flows:
Extracted the following item from the Statement of
Cash Flows:
Proceeds from sales of property, plant and equipment.
All disposals are
incurred mid-year.
After 1 July 2000,
assumed proceeds from
sales included 10%

13 — RECOVERED CAPITAL METHOD - PIPELINE ASSETS
38 Public—31 December 2018 © Eastern Gas Pipeline
Table Name
Base Information Population Approach
Source Methodology Assumptions Asset
Description Year
Item & Basis of Preparation (BoP)
Reference
Actual / Estimate4
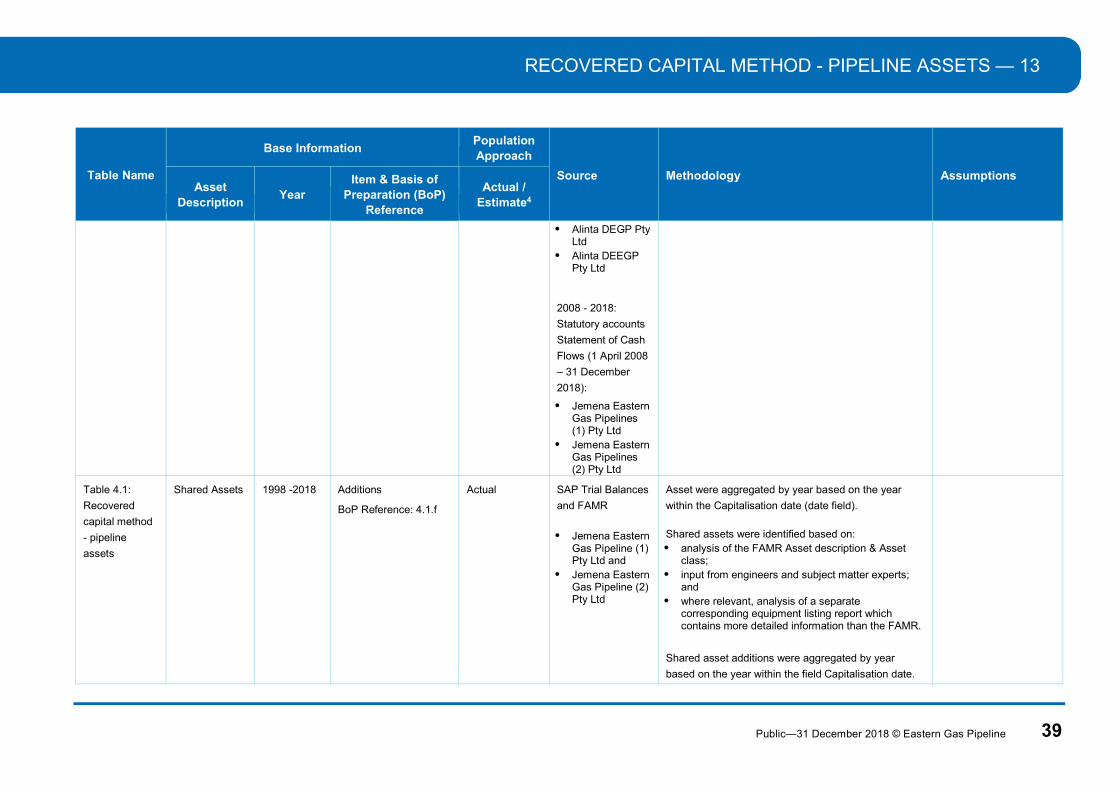
Duke Energy NSW Gas Holdings (consolidated entity)
2003: Statutory
accounts,
Statement of Cash
Flows:
DEI Eastern Gas Pipeline
Duke Eastern Gas Pipeline
2004- 2006:
Statutory accounts,
Statement of Cash
Flows:
Alinta DEEGP Alinta DEGP
2007: Statutory
accounts (15
months ending 31
March 2008)
Statement of Cash
Flows:
After 1 July 2000, where there was an amount for
Proceeds on sales of property, plant and equipment,
GST has been removed by multiplying the proceeds by
10/11.
Disposals net of GST was calculated by multiplying the
cash flow receipt by:
10/11 * 50% for 2000 (Note: GST was introduced 1 July 2000 => 50% in 2000); and
10/11 for subsequent calendar years. Mid-point Net Capital Expenditure Gross Up Refer to Construction Cost - Mid-point Net Capital Expenditure Gross Up explanation.
GST on taxable supply
applied to the sales
amount.
Disposal (as cost) has been interpreted to mean cash proceeds from the sales of property, plant and equipment which is the equivalent to the cost paid by the 3rd party which acquired the asset.
RECOVERED CAPITAL METHOD - PIPELINE ASSETS — 13
Public—31 December 2018 © Eastern Gas Pipeline 39
Table Name
Base Information Population Approach
Source Methodology Assumptions Asset
Description Year
Item & Basis of Preparation (BoP)
Reference
Actual / Estimate4
Alinta DEGP Pty Ltd
Alinta DEEGP Pty Ltd
2008 - 2018:
Statutory accounts
Statement of Cash
Flows (1 April 2008
– 31 December
2018):
Jemena Eastern Gas Pipelines (1) Pty Ltd
Jemena Eastern Gas Pipelines (2) Pty Ltd
Table 4.1:
Recovered
capital method
- pipeline
assets
Shared Assets 1998 -2018 Additions
BoP Reference: 4.1.f
Actual SAP Trial Balances
and FAMR
Jemena Eastern
Gas Pipeline (1) Pty Ltd and
Jemena Eastern Gas Pipeline (2) Pty Ltd
Asset were aggregated by year based on the year
within the Capitalisation date (date field).
Shared assets were identified based on: analysis of the FAMR Asset description & Asset
class; input from engineers and subject matter experts;
and where relevant, analysis of a separate
corresponding equipment listing report which contains more detailed information than the FAMR.
Shared asset additions were aggregated by year
based on the year within the field Capitalisation date.

13 — RECOVERED CAPITAL METHOD - PIPELINE ASSETS
40 Public—31 December 2018 © Eastern Gas Pipeline
Table Name
Base Information Population Approach
Source Methodology Assumptions Asset
Description Year
Item & Basis of Preparation (BoP)
Reference
Actual / Estimate4
Update: Dec-18 vs Jun-18 Disclosures
Update in 2016 Shared Asset Additions due to better
information resulted in the reclassification of $112,742
from Pipeline additions to Shared asset additions.
RCM Valuation Impact: none (zero-sum).
Table 4.1:
Recovered
capital method
- pipeline
assets
Shared Assets 1998 - 2006 Construction cost or
acquisition cost (where
allowed) apportioned,
Maintenance
capitalised ,
Disposal (at cost)
BoP Reference: 4.1.g
Estimate N/A Data for the following items was not available prior to
the SGSPAA ownership of the pipeline:
Construction cost or acquisition cost (where
allowed) apportioned, Maintenance capitalised Disposal (at cost)
Post-acquistion actual
mainteance capitalised
data is an appropriate
basis for estimting pre-
acquisition maintenance
No transactions
recorded pre-acquisition
for:
Construction cost or acquisition cost (where allowed) apportioned,
Maintenance capitalised
Disposal (at cost)
Table 4.1:
Recovered
capital method
- pipeline
assets
Shared Assets 2007 -2018 Construction cost or
acquisition cost (where
allowed) apportioned,
Maintenance
capitalised ,
Disposal (at cost)
Actual SAP Trial Balances
and FAMR
Jemena Eastern
Gas Pipeline (1) Pty Ltd and
No data for the following items were noted in the
review of the SAP FAMR and the relevant SAP Trial
Balances:
Construction cost or acquisition cost (where allowed) apportioned,
Maintenance capitalised Disposal (at cost)
RECOVERED CAPITAL METHOD - PIPELINE ASSETS — 13
Public—31 December 2018 © Eastern Gas Pipeline 41
Table Name
Base Information Population Approach
Source Methodology Assumptions Asset
Description Year
Item & Basis of Preparation (BoP)
Reference
Actual / Estimate4
BoP Reference: 4.1.g
Jemena Eastern Gas Pipeline (2) Pty Ltd
Table 4.1:
Recovered
capital method
- pipeline
assets
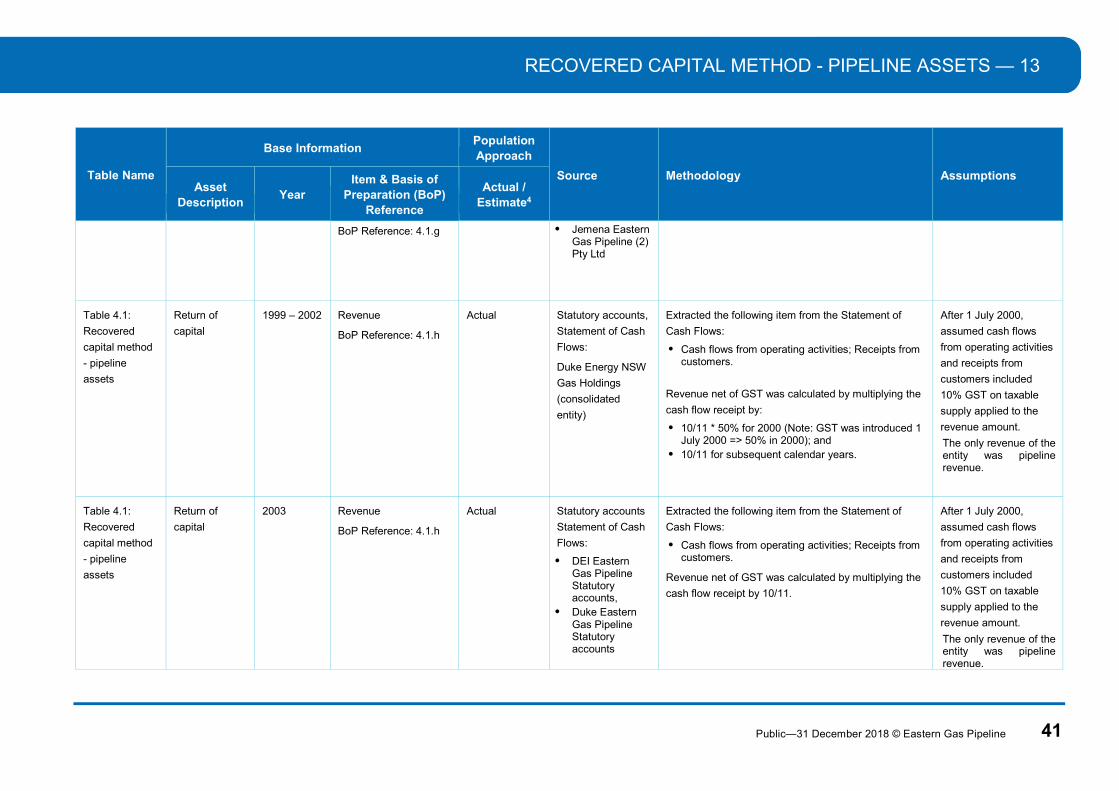
Return of
capital
1999 – 2002 Revenue
BoP Reference: 4.1.h
Actual Statutory accounts,
Statement of Cash
Flows:
Duke Energy NSW
Gas Holdings
(consolidated
entity)
Extracted the following item from the Statement of
Cash Flows:
Cash flows from operating activities; Receipts from customers.
Revenue net of GST was calculated by multiplying the
cash flow receipt by:
10/11 * 50% for 2000 (Note: GST was introduced 1 July 2000 => 50% in 2000); and
10/11 for subsequent calendar years.
After 1 July 2000,
assumed cash flows
from operating activities
and receipts from
customers included
10% GST on taxable
supply applied to the
revenue amount.
The only revenue of the entity was pipeline revenue.
Table 4.1:
Recovered
capital method
- pipeline
assets
Return of
capital
2003 Revenue
BoP Reference: 4.1.h
Actual Statutory accounts
Statement of Cash
Flows:
DEI Eastern Gas Pipeline Statutory accounts,
Duke Eastern Gas Pipeline Statutory accounts
Extracted the following item from the Statement of
Cash Flows:
Cash flows from operating activities; Receipts from customers.
Revenue net of GST was calculated by multiplying the
cash flow receipt by 10/11.
After 1 July 2000,
assumed cash flows
from operating activities
and receipts from
customers included
10% GST on taxable
supply applied to the
revenue amount.
The only revenue of the entity was pipeline revenue.

13 — RECOVERED CAPITAL METHOD - PIPELINE ASSETS
42 Public—31 December 2018 © Eastern Gas Pipeline
Table Name
Base Information Population Approach
Source Methodology Assumptions Asset
Description Year
Item & Basis of Preparation (BoP)
Reference
Actual / Estimate4
Table 4.1:
Recovered
capital method
- pipeline
assets
Return of
capital
2004 – 2006 Revenue
BoP Reference: 4.1.h
Actual Statutory accounts
Statement of Cash
Flows:
Alinta DEEGP Alinta DEGP
Extracted the following item from the Statement of
Cash Flows:
Cash flows from operating activities; Receipts from customers (inclusive of goods and services tax).
Revenue net of GST was calculated by multiply the
cash flow receipt by 10/11.
After 1 July 2000,
assumed cash flows
from operating activities
and receipts from
customers included
10% GST on taxable
supply applied to the
revenue amount.
The only revenue of the entity was pipeline revenue.
Table 4.1:
Recovered
capital method
- pipeline
assets
Return of
capital
2007 – 2018 Revenue
BoP Reference: 4.1.h
Actual SAP Trial Balances
of:
Jemena Eastern Gas Pipelines (1) Pty Ltd. and
Jemena Eastern Gas Pipelines (2) Pty Ltd
EGP uses its SAP system to capture revenue
transactions. A calendar year trial balance was
generated from the SAP system and the revenue
general ledger accounts were aggregated.
SAP trial balances were relied upon because EGP
statutory accounts did not report on a calendar year
end for the following period:
15 months ending 31 March 2008; Year ending 31 March 2009 – Year ending 31
March 2014.
A reconciliation check was performed to confirm that
the Life-to-date (LTD) trial balances and the statutory
accounts agreed.
No material non-cash
items are included in
the revenue general
ledger accounts.
Revenue per the
general ledger is
recorded excluding
GST. GST is separately
recorded in a balance
sheet account.
The only revenue of the entity was pipeline revenue.
RECOVERED CAPITAL METHOD - PIPELINE ASSETS — 13
Public—31 December 2018 © Eastern Gas Pipeline 43
Table Name
Base Information Population Approach
Source Methodology Assumptions Asset
Description Year
Item & Basis of Preparation (BoP)
Reference
Actual / Estimate4
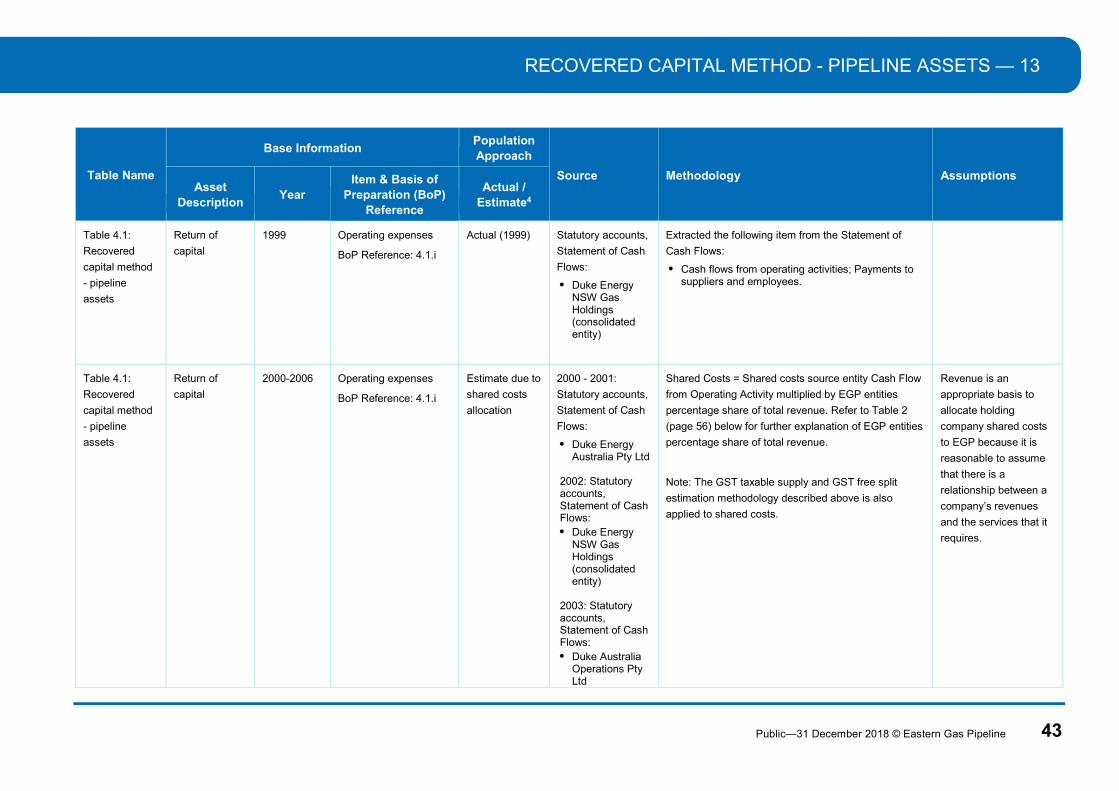
Table 4.1:
Recovered
capital method
- pipeline
assets
Return of
capital
1999 Operating expenses
BoP Reference: 4.1.i
Actual (1999)
Statutory accounts,
Statement of Cash
Flows:
Duke Energy NSW Gas Holdings (consolidated entity)
Extracted the following item from the Statement of
Cash Flows:
Cash flows from operating activities; Payments to suppliers and employees.
Table 4.1:
Recovered
capital method
- pipeline
assets
Return of
capital
2000-2006 Operating expenses
BoP Reference: 4.1.i
Estimate due to
shared costs
allocation
2000 - 2001:
Statutory accounts,
Statement of Cash
Flows:
Duke Energy Australia Pty Ltd
2002: Statutory accounts, Statement of Cash Flows: Duke Energy
NSW Gas Holdings (consolidated entity)
2003: Statutory accounts, Statement of Cash Flows: Duke Australia
Operations Pty Ltd
Shared Costs = Shared costs source entity Cash Flow
from Operating Activity multiplied by EGP entities
percentage share of total revenue. Refer to Table 2
(page 56) below for further explanation of EGP entities
percentage share of total revenue.
Note: The GST taxable supply and GST free split
estimation methodology described above is also
applied to shared costs.
Revenue is an
appropriate basis to
allocate holding
company shared costs
to EGP because it is
reasonable to assume
that there is a
relationship between a
company’s revenues
and the services that it
requires.
13 — RECOVERED CAPITAL METHOD - PIPELINE ASSETS
44 Public—31 December 2018 © Eastern Gas Pipeline
Table Name
Base Information Population Approach
Source Methodology Assumptions Asset
Description Year
Item & Basis of Preparation (BoP)
Reference
Actual / Estimate4
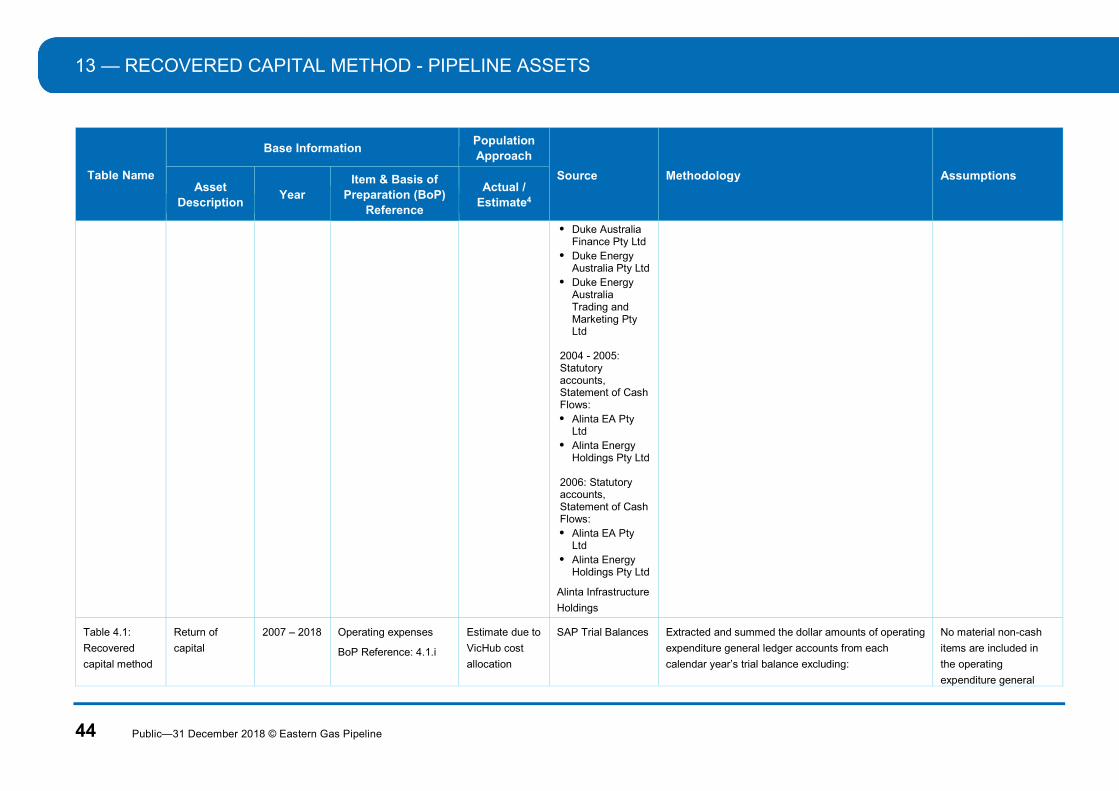
Duke Australia Finance Pty Ltd
Duke Energy Australia Pty Ltd
Duke Energy Australia Trading and Marketing Pty Ltd
2004 - 2005: Statutory accounts, Statement of Cash Flows: Alinta EA Pty
Ltd Alinta Energy
Holdings Pty Ltd
2006: Statutory accounts, Statement of Cash Flows: Alinta EA Pty
Ltd Alinta Energy
Holdings Pty Ltd
Alinta Infrastructure
Holdings
Table 4.1:
Recovered
capital method
Return of
capital
2007 – 2018 Operating expenses
BoP Reference: 4.1.i
Estimate due to
VicHub cost
allocation
SAP Trial Balances Extracted and summed the dollar amounts of operating
expenditure general ledger accounts from each
calendar year’s trial balance excluding:
No material non-cash
items are included in
the operating
expenditure general

RECOVERED CAPITAL METHOD - PIPELINE ASSETS — 13
Public—31 December 2018 © Eastern Gas Pipeline 45
Table Name
Base Information Population Approach
Source Methodology Assumptions Asset
Description Year
Item & Basis of Preparation (BoP)
Reference
Actual / Estimate4
- pipeline
assets
Interest Depreciation, and Tax Expense.
Maintenance operating expenses were undertaken on
behalf of VicHub by the EGP over the period from
2010 to 2018, inclusive. The maintenance operating
expenditure was estimated based on a 2018
engineering estimate which was then adjusted for
inflation.
Update: Dec-18 vs Jun-18 Disclosures
Revised engineering estimate of $50K per annum for
VicHub maintenance expense over the 2010 – 2018
period (previously $250K per annum) and resulting net
tax liability impact. RCM Valuation Impact: $1.1M.
EGP statutory accounts had a March period end of 31
March from 31 March 2008 to 31 March 2014.
Therefore statutory accounts were not used as the
source data input into the RCM table.
ledger accounts
reported. Depreciation
is the key non-cash item
which has been
removed.
There are no other
shared costs sitting
within SGSPAA that
need to be allocated to
EGP.
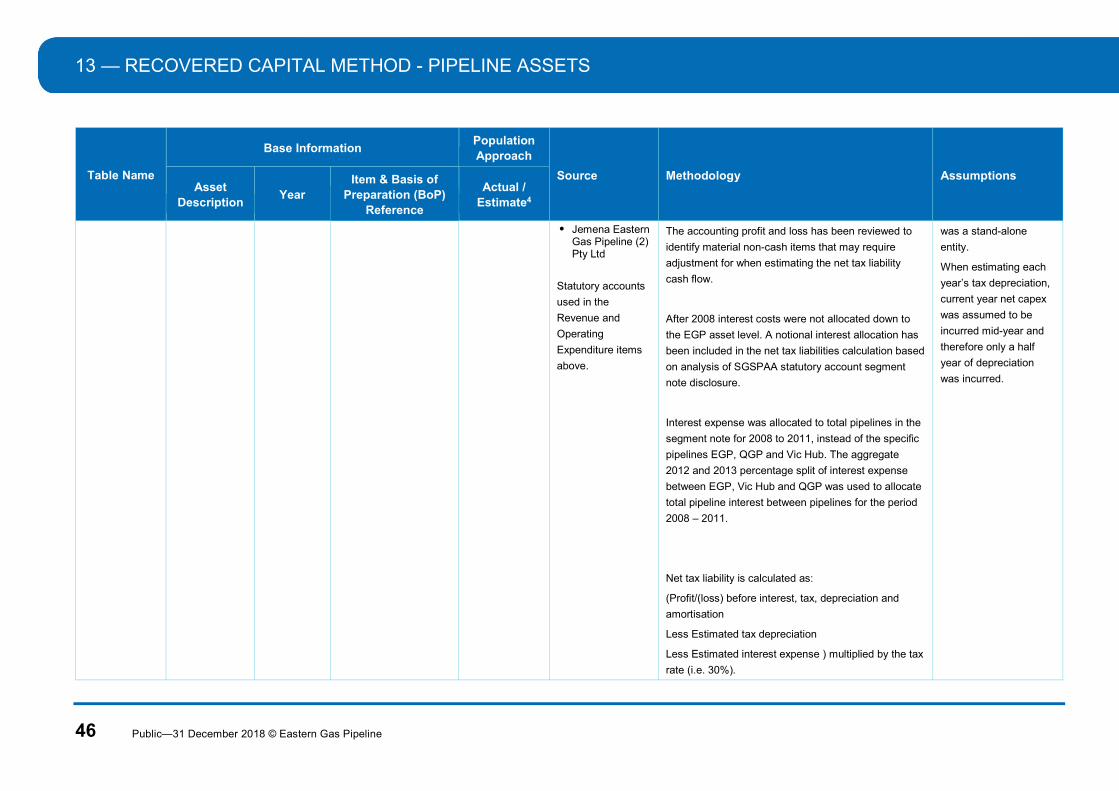
Table 4.1:
Recovered
capital method
- pipeline
assets
Return of
capital
1999 – 2018 Net tax liabilities
BoP Reference: 4.1.j
Estimate SAP Trial Balances
of :
Jemena Eastern Gas Pipeline (1) Pty Ltd, and
The pipeline is part of a consolidated tax group and
does not pay corporate tax as a stand-alone entity.
Therefore the net tax liability needs to be estimated.
‘Net tax liability’ is
interpreted as the
notional cash tax
payable that would be
payable if the pipeline
13 — RECOVERED CAPITAL METHOD - PIPELINE ASSETS
46 Public—31 December 2018 © Eastern Gas Pipeline
Table Name
Base Information Population Approach
Source Methodology Assumptions Asset
Description Year
Item & Basis of Preparation (BoP)
Reference
Actual / Estimate4
Jemena Eastern Gas Pipeline (2) Pty Ltd
Statutory accounts
used in the
Revenue and
Operating
Expenditure items
above.
The accounting profit and loss has been reviewed to
identify material non-cash items that may require
adjustment for when estimating the net tax liability
cash flow.
After 2008 interest costs were not allocated down to
the EGP asset level. A notional interest allocation has
been included in the net tax liabilities calculation based
on analysis of SGSPAA statutory account segment
note disclosure.
Interest expense was allocated to total pipelines in the
segment note for 2008 to 2011, instead of the specific
pipelines EGP, QGP and Vic Hub. The aggregate
2012 and 2013 percentage split of interest expense
between EGP, Vic Hub and QGP was used to allocate
total pipeline interest between pipelines for the period
2008 – 2011.
Net tax liability is calculated as:
(Profit/(loss) before interest, tax, depreciation and
amortisation
Less Estimated tax depreciation
Less Estimated interest expense ) multiplied by the tax
rate (i.e. 30%).
was a stand-alone
entity.
When estimating each
year’s tax depreciation,
current year net capex
was assumed to be
incurred mid-year and
therefore only a half
year of depreciation
was incurred.
RECOVERED CAPITAL METHOD - PIPELINE ASSETS — 13
Public—31 December 2018 © Eastern Gas Pipeline 47
Table Name
Base Information Population Approach
Source Methodology Assumptions Asset
Description Year
Item & Basis of Preparation (BoP)
Reference
Actual / Estimate4
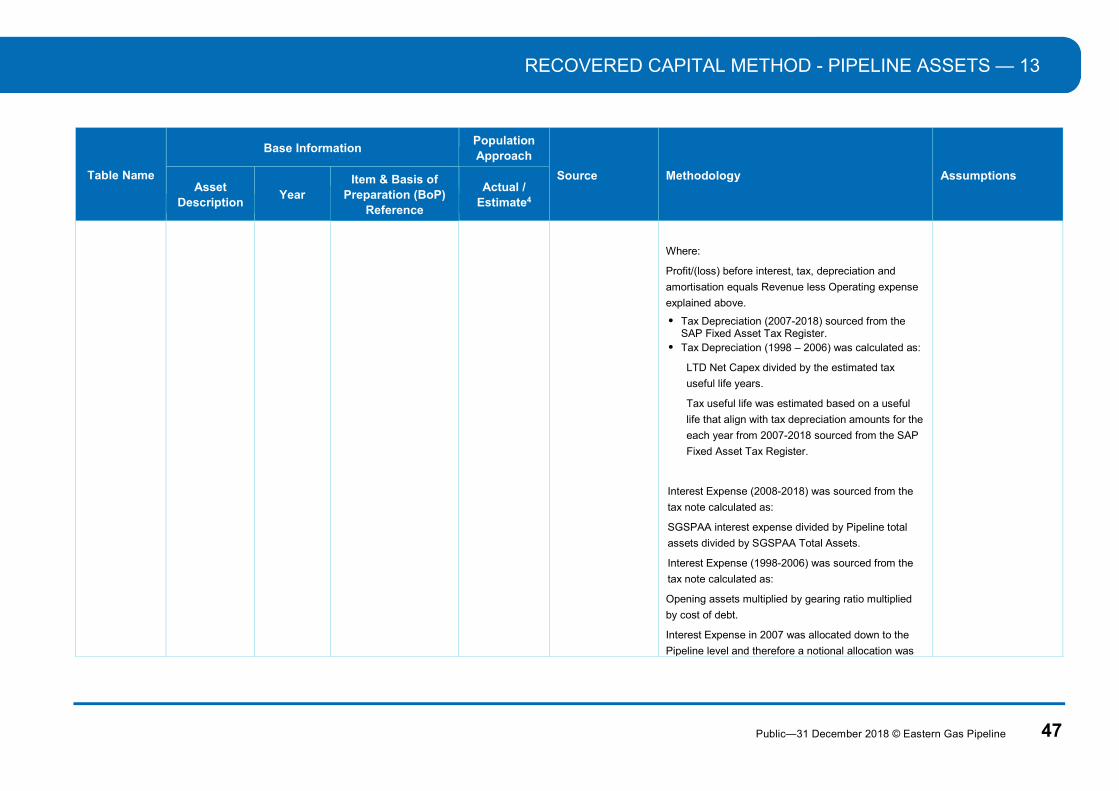
Where:
Profit/(loss) before interest, tax, depreciation and
amortisation equals Revenue less Operating expense
explained above.
Tax Depreciation (2007-2018) sourced from the SAP Fixed Asset Tax Register.
Tax Depreciation (1998 – 2006) was calculated as:
LTD Net Capex divided by the estimated tax
useful life years.
Tax useful life was estimated based on a useful
life that align with tax depreciation amounts for the
each year from 2007-2018 sourced from the SAP
Fixed Asset Tax Register.
Interest Expense (2008-2018) was sourced from the
tax note calculated as:
SGSPAA interest expense divided by Pipeline total
assets divided by SGSPAA Total Assets.
Interest Expense (1998-2006) was sourced from the
tax note calculated as:
Opening assets multiplied by gearing ratio multiplied
by cost of debt.
Interest Expense in 2007 was allocated down to the
Pipeline level and therefore a notional allocation was

13 — RECOVERED CAPITAL METHOD - PIPELINE ASSETS
48 Public—31 December 2018 © Eastern Gas Pipeline
Table Name
Base Information Population Approach
Source Methodology Assumptions Asset
Description Year
Item & Basis of Preparation (BoP)
Reference
Actual / Estimate4
not required
Update: Dec-18 vs Jun-18 Disclosures
Refer to Operating expenses explanation above
relating to revised engineering estimate of $50K per
annum for VicHub maintenance expense over the 2010
– 2018 period. (previously $250K per annum) and
resulting net tax liability impact.
Table 4.1:
Recovered
capital method
- pipeline
assets
Return of
capital
1998 – 2018 Return on capital
BoP Reference: 4.1.k
Estimate Rate of return
sources are
explained on the
next page.
Return on capital for a given year is estimated as the
opening asset value for that year multiplied by the rate
of return percentage for that year. Both the opening
asset value and the rate of return are explained below.
Table 4.1:
Recovered
capital method
- pipeline
assets
Return of
capital
1998 – 2018 Return on capital
(Opening asset value)
BoP Reference: 4.1.k
Estimate – Due
to the impact of
Rate of return
components.
Prior period within
the RCM
Calculation
Aggregation of Prior period Life-to-date (LTD) RCM
Inputs.
Opening Asset Value
= Prior year Closing Asset Value
= Prior year Opening Asset + Prior year net Capex
(adjusted to end of year timing) – Prior year Return of
capital.
Where Return of capital is,

RECOVERED CAPITAL METHOD - PIPELINE ASSETS — 13
Public—31 December 2018 © Eastern Gas Pipeline 49
Table Name
Base Information Population Approach
Source Methodology Assumptions Asset
Description Year
Item & Basis of Preparation (BoP)
Reference
Actual / Estimate4
Revenue – Operating expenditure – Net tax liabilities -
Return on Capital
Table 4.1:
Recovered
capital method
- pipeline
assets
Return of
capital
1998 – 2018 Retune on Capital
(Rate of return)
BoP Reference: 4.1.k
Estimate The rate of return is
estimated with
reference to the
following source
inputs.
Gearing assumption input source:
Asset betas adopted by Australian Competition and Consumer Commission (ACCC) and AER since 1998.
Asset betas identified by TDB and Frontier
Cost of debt and
risk free rate input
source: Reserve
Bank of Australia,
Indicative Mid
Rates of Australian
Weighted Average Cost of Capital (WACC)
EGP estimates the rate of return as the nominal vanilla
WACC. This approach estimates the rate of return as
the weighted average of opportunity costs assessed
across two sources of capital funding: debt and equity.
𝑊𝐴𝐶𝐶 = 𝑔𝑒𝑎𝑟𝑖𝑛𝑔 × 𝑟 + (1 − 𝑔𝑒𝑎𝑟𝑖𝑛𝑔) × 𝑟
Where
𝑟 is the cost of debt, and
𝑟 is the cost of equity.
Gearing
The proportion of debt funding ‘gearing’ has been
sourced based on guidance from previous, current,
forecast financial information used in statutory,
management and budgeting reporting.
The asset beta that we use is calculated as:
the regulatory asset betas adopted by the ACCC and AER since 1998, which has been paired with a gearing assumption of 60 percent; plus
the asset beta for samples of businesses with unregulated revenues identified by TDB and Frontier described above), at gearings of 39 percent and 28 percent respectively; less
Gearing assumption
The proportion of debt
funding to capital is
referred to as ‘gearing’.
EGP applies an
assumption of 50%
gearing, constant over
time.
The gearing assumption
reflects reliance on the
regulatory risk
assumption but takes
into account evidence
that the gearing
adopted by unregulated
businesses is lower
than that of regulated
businesses.
Imputation credits assumption
EGP assumes the value
of imputation credits
(‘gamma’) is equal to
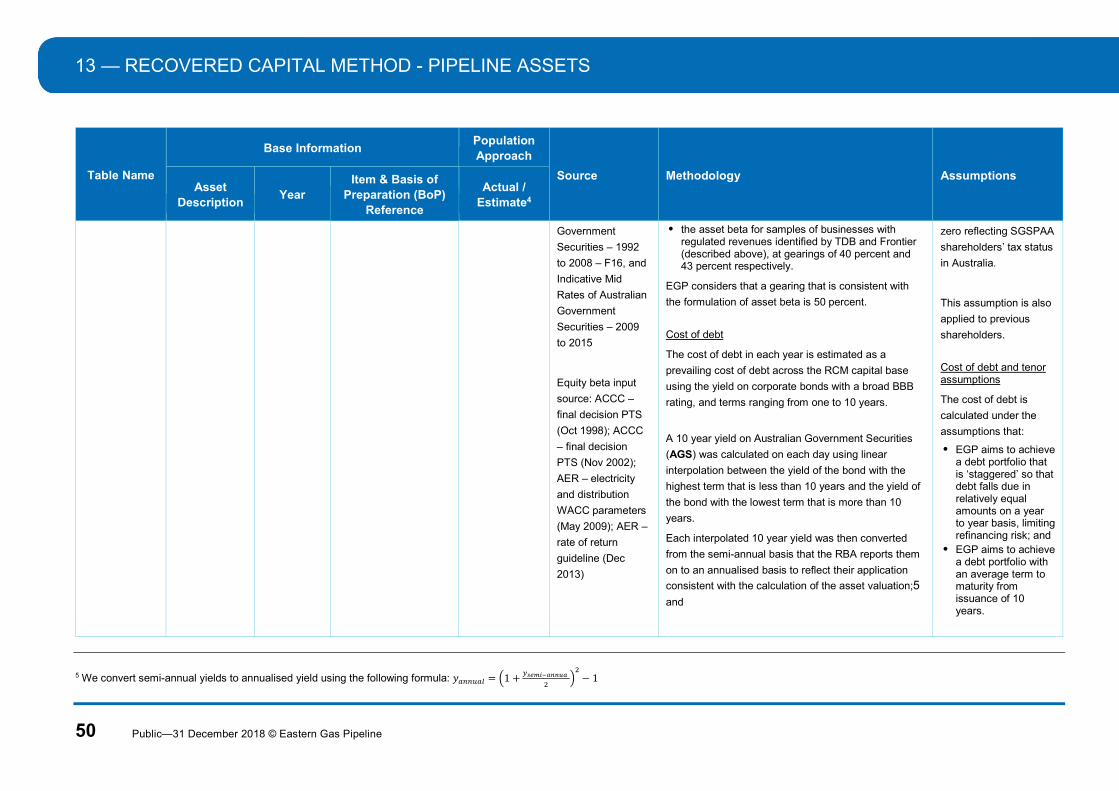
13 — RECOVERED CAPITAL METHOD - PIPELINE ASSETS
50 Public—31 December 2018 © Eastern Gas Pipeline
Table Name
Base Information Population Approach
Source Methodology Assumptions Asset
Description Year
Item & Basis of Preparation (BoP)
Reference
Actual / Estimate4
Government
Securities – 1992
to 2008 – F16, and
Indicative Mid
Rates of Australian
Government
Securities – 2009
to 2015
Equity beta input
source: ACCC –
final decision PTS
(Oct 1998); ACCC
– final decision
PTS (Nov 2002);
AER – electricity
and distribution
WACC parameters
(May 2009); AER –
rate of return
guideline (Dec
2013)
the asset beta for samples of businesses with regulated revenues identified by TDB and Frontier (described above), at gearings of 40 percent and 43 percent respectively.
EGP considers that a gearing that is consistent with
the formulation of asset beta is 50 percent.
Cost of debt
The cost of debt in each year is estimated as a
prevailing cost of debt across the RCM capital base
using the yield on corporate bonds with a broad BBB
rating, and terms ranging from one to 10 years.
A 10 year yield on Australian Government Securities
(AGS) was calculated on each day using linear
interpolation between the yield of the bond with the
highest term that is less than 10 years and the yield of
the bond with the lowest term that is more than 10
years.
Each interpolated 10 year yield was then converted
from the semi-annual basis that the RBA reports them
on to an annualised basis to reflect their application
consistent with the calculation of the asset valuation;5
and
zero reflecting SGSPAA
shareholders’ tax status
in Australia.
This assumption is also
applied to previous
shareholders.
Cost of debt and tenor assumptions
The cost of debt is
calculated under the
assumptions that:
EGP aims to achieve a debt portfolio that is ‘staggered’ so that debt falls due in relatively equal amounts on a year to year basis, limiting refinancing risk; and
EGP aims to achieve a debt portfolio with an average term to maturity from issuance of 10 years.
5 We convert semi-annual yields to annualised yield using the following formula: 𝑦 = 1 + − 1
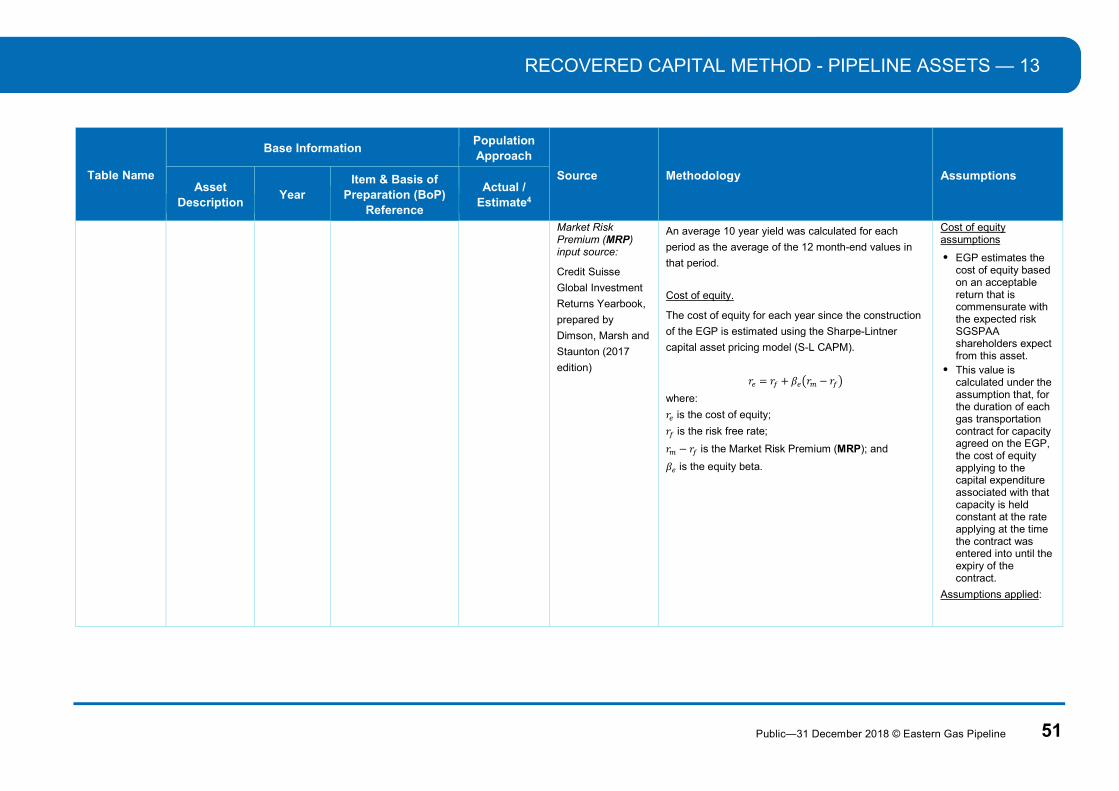
RECOVERED CAPITAL METHOD - PIPELINE ASSETS — 13
Public—31 December 2018 © Eastern Gas Pipeline 51
Table Name
Base Information Population Approach
Source Methodology Assumptions Asset
Description Year
Item & Basis of Preparation (BoP)
Reference
Actual / Estimate4
Market Risk Premium (MRP) input source:
Credit Suisse
Global Investment
Returns Yearbook,
prepared by
Dimson, Marsh and
Staunton (2017
edition)
An average 10 year yield was calculated for each
period as the average of the 12 month-end values in
that period.
Cost of equity.
The cost of equity for each year since the construction
of the EGP is estimated using the Sharpe-Lintner
capital asset pricing model (S-L CAPM).
𝑟 = 𝑟 + 𝛽 𝑟 − 𝑟
where:
𝑟 is the cost of equity;
𝑟 is the risk free rate;
𝑟 − 𝑟 is the Market Risk Premium (MRP); and
𝛽 is the equity beta.
Cost of equity assumptions
EGP estimates the cost of equity based on an acceptable return that is commensurate with the expected risk SGSPAA shareholders expect from this asset.
This value is calculated under the assumption that, for the duration of each gas transportation contract for capacity agreed on the EGP, the cost of equity applying to the capital expenditure associated with that capacity is held constant at the rate applying at the time the contract was entered into until the expiry of the contract.
Assumptions applied:
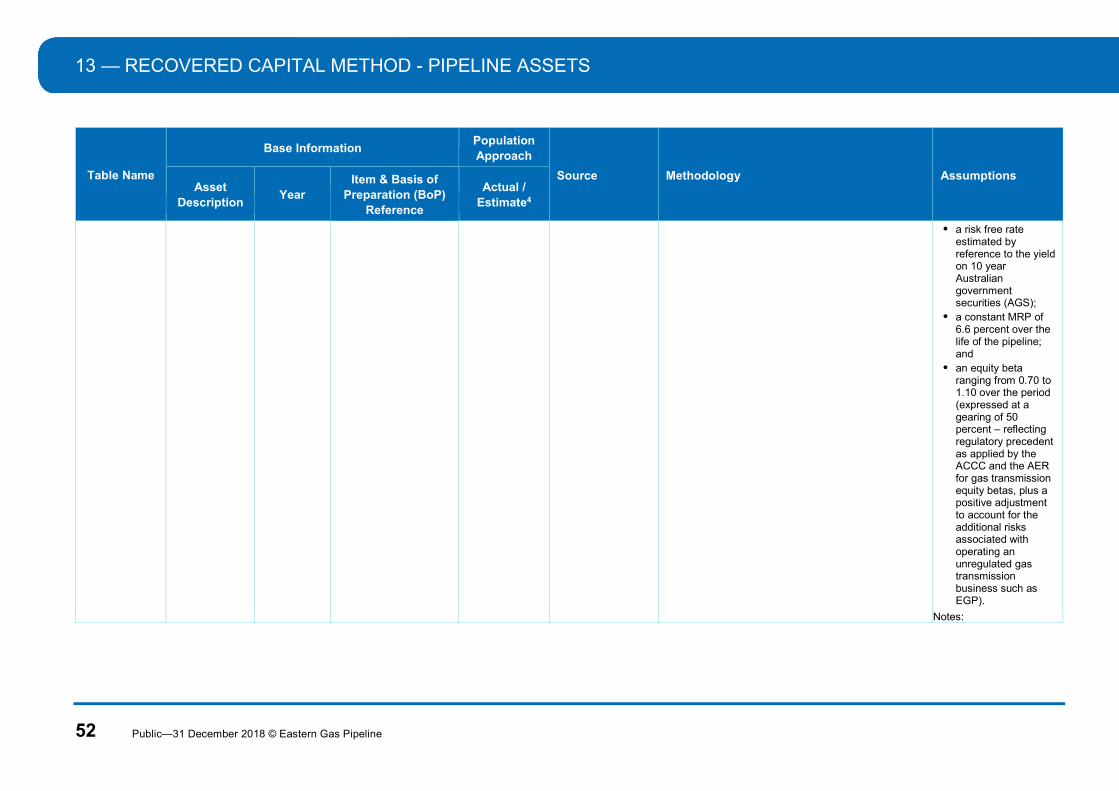
13 — RECOVERED CAPITAL METHOD - PIPELINE ASSETS
52 Public—31 December 2018 © Eastern Gas Pipeline
Table Name
Base Information Population Approach
Source Methodology Assumptions Asset
Description Year
Item & Basis of Preparation (BoP)
Reference
Actual / Estimate4
a risk free rate estimated by reference to the yield on 10 year Australian government securities (AGS);
a constant MRP of 6.6 percent over the life of the pipeline; and
an equity beta ranging from 0.70 to 1.10 over the period (expressed at a gearing of 50 percent – reflecting regulatory precedent as applied by the ACCC and the AER for gas transmission equity betas, plus a positive adjustment to account for the additional risks associated with operating an unregulated gas transmission business such as EGP).
Notes:

RECOVERED CAPITAL METHOD - PIPELINE ASSETS — 13
Public—31 December 2018 © Eastern Gas Pipeline 53
Table Name
Base Information Population Approach
Source Methodology Assumptions Asset
Description Year
Item & Basis of Preparation (BoP)
Reference
Actual / Estimate4
Equity raising costs (i.e. the upfront expenses business may incur when issuing new capital) are assumed to be equal to zero, which is a conservative assumption.
MRP

13 — RECOVERED CAPITAL METHOD - PIPELINE ASSETS
54 Public—31 December 2018 © Eastern Gas Pipeline
Table Name
Base Information Population Approach
Source Methodology Assumptions Asset
Description Year
Item & Basis of Preparation (BoP)
Reference
Actual / Estimate4
The Credit Suisse Global Investment Returns Yearbook, prepared by Dimson, Marsh and Staunton, is a well-accepted source of estimates for average excess returns. The 2017 edition of the yearbook estimates the arithmetic average premium of Australian equities over Australian government bonds to be 6.6 percent over the period from 1990 to 2016.6 Importantly, this estimate includes only the returns from dividends and capital gains, and is not grossed up for the value of imputation credits. This estimate is therefore consistent with a value for gamma of zero.
6 Dimson, E., Marsh, P. and Staunton, M., Credit Suisse Global Investment Returns Yearbook 2017, February 2017, Table 13, p 72

RECOVERED CAPITAL METHOD - PIPELINE ASSETS — 13
Public—31 December 2018 © Eastern Gas Pipeline 55
Table Name
Base Information Population Approach
Source Methodology Assumptions Asset
Description Year
Item & Basis of Preparation (BoP)
Reference
Actual / Estimate4
MRP of 6.6 percent represents our best estimate of a historical average of excess market returns, consistent with valuing imputation credits at zero.

13 — RECOVERED CAPITAL METHOD - PIPELINE ASSETS
56 Public—31 December 2018 © Eastern Gas Pipeline
Table 2: Explanation of EGP percentage share of total revenue (input into the Shared Costs calculation).
Year Item Actual / Estimate Source Methodology Assumptions
2000 Share of
total
revenue
Actual EGP entities share of total revenue:
Duke Energy NSW Gas Holdings Pty Ltd Consolidated entity
Total revenue for entities sharing Costs: DEI Victoria Power Pty Ltd Consolidated
entity Duke Energy Australian Holdings Pty Ltd
Consolidated entity Duke Energy NSW Gas Holdings Pty Ltd
Consolidated entity Duke Energy WA Holdings Pty Ltd
Consolidated entity
Revenue is interpreted as receipts from
customers, attributable to external parties
extracted from the Statement of Cash
Flows, this is consistent with the
interpretation of revenue for the Revenue
item in Table 4.1.
EGP entities share of total revenue is
calculated as
Revenue related to EGP divided by
Total revenue for entities sharing
Costs.
2001 - 2002 Share of
total
revenue
Actual EGP entities share of total revenue:
Duke Energy NSW Gas Holdings Pty Ltd Consolidated entity
Total revenue for entities sharing Costs:
DEI Victoria Power Pty Ltd Consolidated entity
Duke Energy Australian Holdings Pty Ltd Consolidated entity
Duke Energy NSW Gas Holdings Pty Ltd Consolidated entity
Duke Energy WA Holdings Pty Ltd Consolidated entity
DEI Tasmania Holdings Pty Ltd Consolidated entity
Duke Australia Pipeline Holdings Pty Ltd Consolidated entity
Revenue is interpreted as receipts from
customers, attributable to external parties
extracted from the Statement of Cash
Flows.
EGP entities share of total revenue is
calculated as
Revenue related to EGP divided by Total
revenue for entities sharing Costs.

RECOVERED CAPITAL METHOD - PIPELINE ASSETS — 13
Public—31 December 2018 © Eastern Gas Pipeline 57
Year Item Actual / Estimate Source Methodology Assumptions
2003 Share of
total
revenue
Actual EGP entities share of total revenue:
Duke Eastern Gas Pipeline Pty Ltd DEI Eastern Gas Pipeline Pty Ltd
Total revenue for entities sharing Costs: Duke Energy Limited Pty Ltd
Revenue is interpreted as receipts from
customers, attributable to external parties
extracted from the Statement of Cash
Flows.
EGP entities share of total revenue is
calculated as
Revenue related to EGP divided by
Total revenue for entities sharing
Costs.
2004 Share of
total
revenue
Actual EGP entities share of total revenue:
Alinta DEEGP Pty Ltd Alinta DEGP Pty Ltd
Total revenue for entities sharing Costs: Alinta Energy Holdings Pty Ltd
Revenue is interpreted as receipts from
customers, attributable to external parties
extracted from the Statement of Cash
Flows.
EGP entities share of total revenue is
calculated as
Revenue related to EGP divided by
Total revenue for entities sharing
Costs.
2005 Share of
total
revenue
Actual EGP entities share of total revenue:
Alinta DEEGP Pty Ltd Alinta DEGP Pty Ltd
Total revenue for entities sharing Costs:
Alinta Infrastructure Holdings Pty Ltd
Revenue is interpreted as receipts from
customers, attributable to external parties
extracted from the Statement of Cash
Flows.
EGP entities share of total revenue is
calculated as
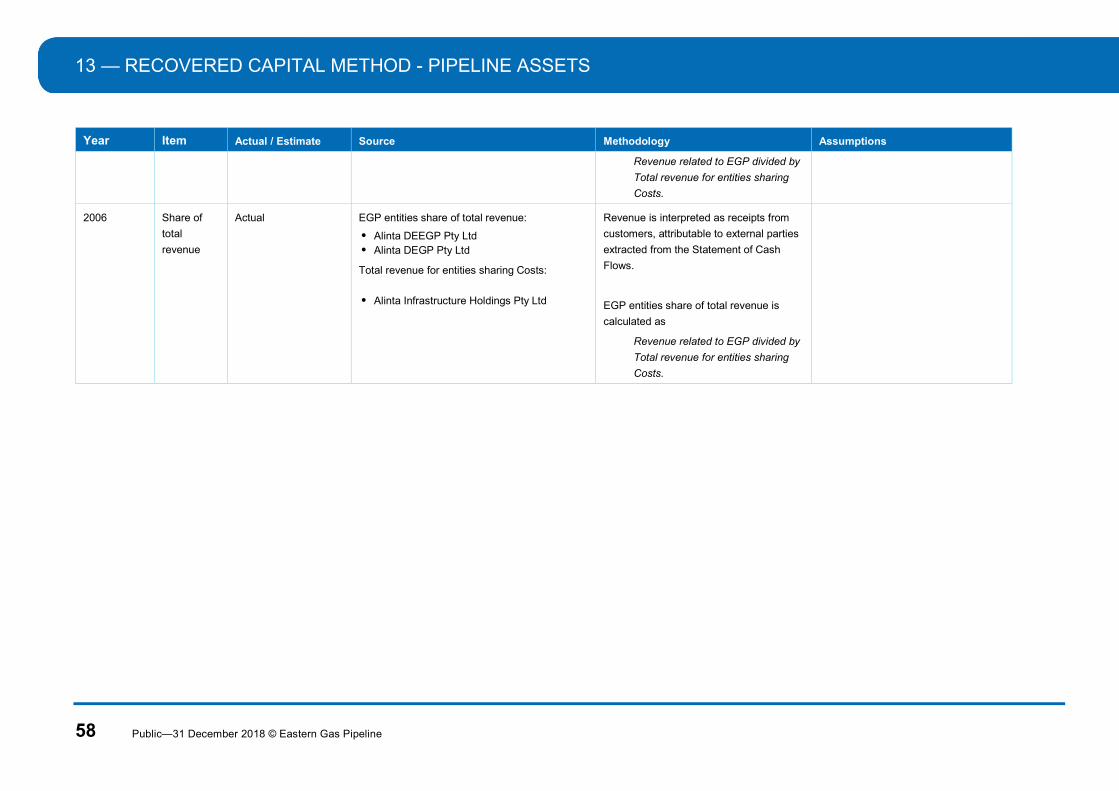
13 — RECOVERED CAPITAL METHOD - PIPELINE ASSETS
58 Public—31 December 2018 © Eastern Gas Pipeline
Year Item Actual / Estimate Source Methodology Assumptions
Revenue related to EGP divided by
Total revenue for entities sharing
Costs.
2006 Share of
total
revenue
Actual EGP entities share of total revenue:
Alinta DEEGP Pty Ltd Alinta DEGP Pty Ltd
Total revenue for entities sharing Costs:
Alinta Infrastructure Holdings Pty Ltd
Revenue is interpreted as receipts from
customers, attributable to external parties
extracted from the Statement of Cash
Flows.
EGP entities share of total revenue is
calculated as
Revenue related to EGP divided by
Total revenue for entities sharing
Costs.

RECOVERED CAPITAL METHOD - PIPELINE ASSETS — 13
Public—31 December 2018 © Eastern Gas Pipeline 59
Explanation for Estimated Amounts
For estimated amounts, in accordance with the Guideline Section 7 basis of preparation, the following table explains:
why it was not possible for the service provider to provide actual information;
what steps the service provider took to locate actual information;
if an estimate has been provided, the basis for the estimate, including the methods, assumptions and inputs used
why the estimate represents the best estimate possible in the circumstances and has been arrived at on a reasonable basis.
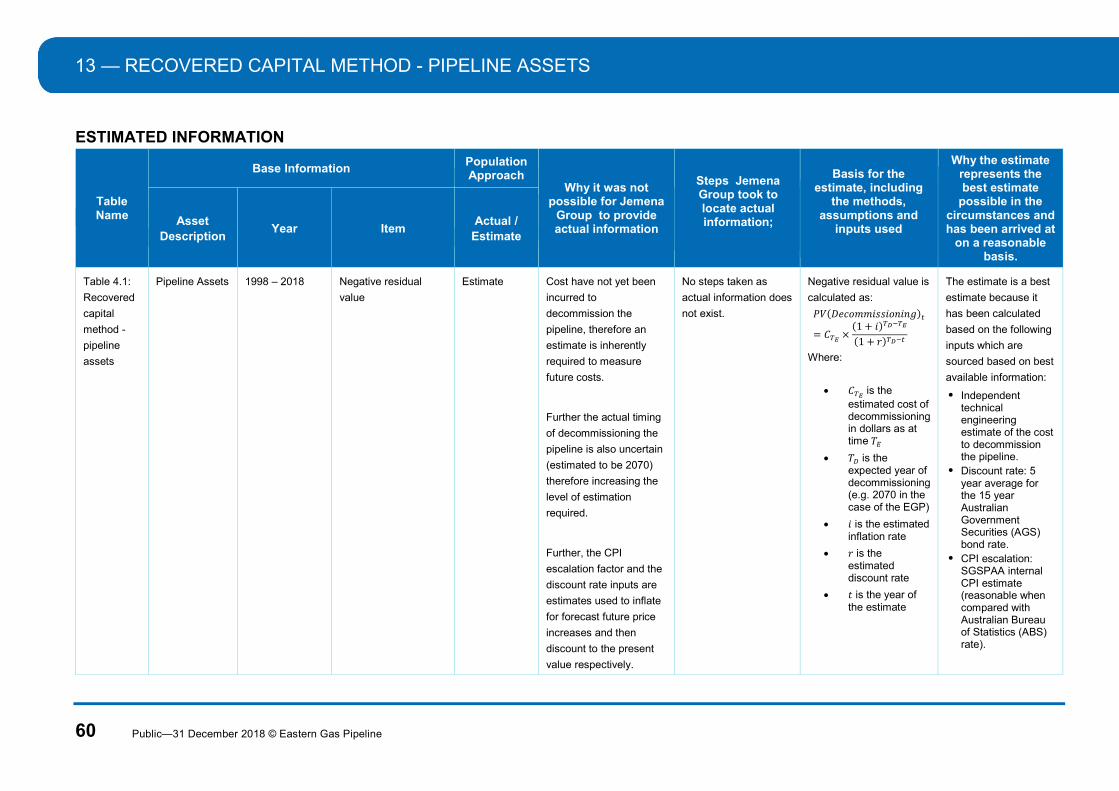
13 — RECOVERED CAPITAL METHOD - PIPELINE ASSETS
60 Public—31 December 2018 © Eastern Gas Pipeline
ESTIMATED INFORMATION
Table Name
Base Information Population Approach
Why it was not possible for Jemena
Group to provide actual information
Steps Jemena Group took to locate actual information;
Basis for the estimate, including
the methods, assumptions and
inputs used
Why the estimate represents the best estimate
possible in the circumstances and has been arrived at
on a reasonable basis.
Asset Description
Year Item Actual /
Estimate
Table 4.1:
Recovered
capital
method -
pipeline
assets
Pipeline Assets
1998 – 2018 Negative residual
value
Estimate Cost have not yet been
incurred to
decommission the
pipeline, therefore an
estimate is inherently
required to measure
future costs.
Further the actual timing
of decommissioning the
pipeline is also uncertain
(estimated to be 2070)
therefore increasing the
level of estimation
required.
Further, the CPI
escalation factor and the
discount rate inputs are
estimates used to inflate
for forecast future price
increases and then
discount to the present
value respectively.
No steps taken as
actual information does
not exist.
Negative residual value is
calculated as:
𝑃𝑉(𝐷𝑒𝑐𝑜𝑚𝑚𝑖𝑠𝑠𝑖𝑜𝑛𝑖𝑛𝑔)
= 𝐶 ×(1 + 𝑖)
(1 + 𝑟)
Where:
𝐶 is the estimated cost of decommissioning in dollars as at time 𝑇
𝑇 is the expected year of decommissioning (e.g. 2070 in the case of the EGP)
𝑖 is the estimated inflation rate
𝑟 is the estimated discount rate
𝑡 is the year of the estimate
The estimate is a best
estimate because it
has been calculated
based on the following
inputs which are
sourced based on best
available information:
Independent technical engineering estimate of the cost to decommission the pipeline.
Discount rate: 5 year average for the 15 year Australian Government Securities (AGS) bond rate.
CPI escalation: SGSPAA internal CPI estimate (reasonable when compared with Australian Bureau of Statistics (ABS) rate).
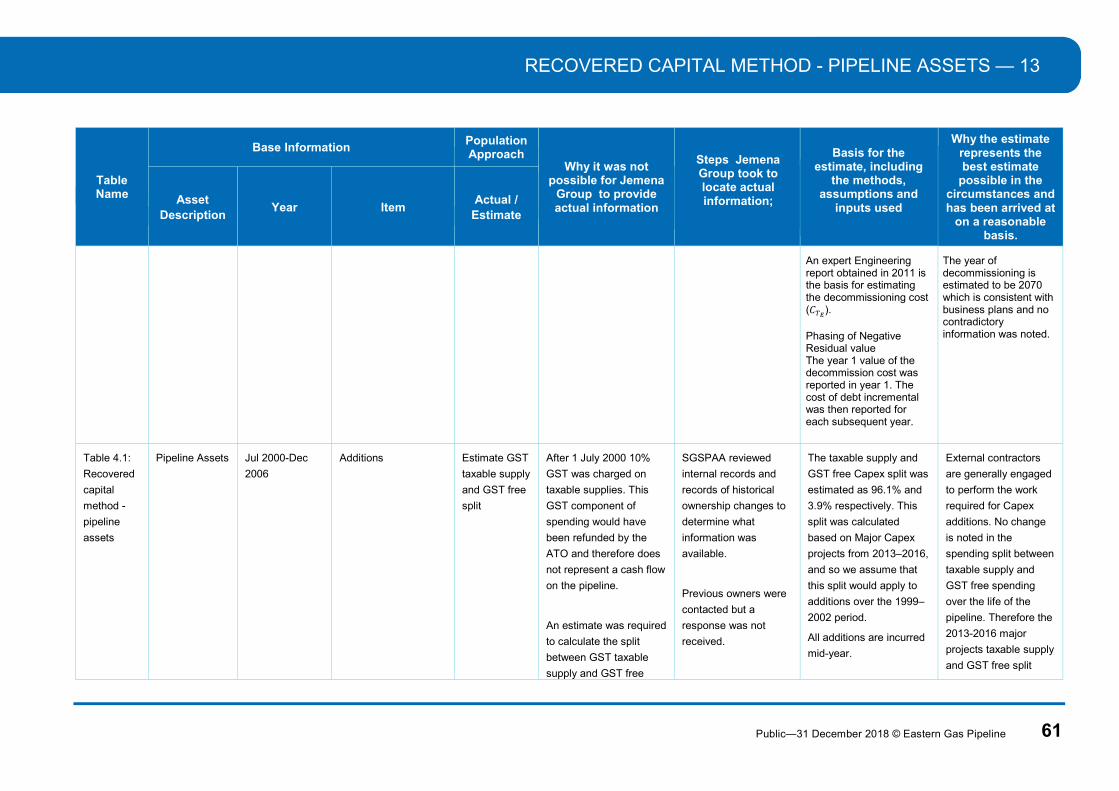
RECOVERED CAPITAL METHOD - PIPELINE ASSETS — 13
Public—31 December 2018 © Eastern Gas Pipeline 61
Table Name
Base Information Population Approach
Why it was not possible for Jemena
Group to provide actual information
Steps Jemena Group took to locate actual information;
Basis for the estimate, including
the methods, assumptions and
inputs used
Why the estimate represents the best estimate
possible in the circumstances and has been arrived at
on a reasonable basis.
Asset Description
Year Item Actual /
Estimate
An expert Engineering report obtained in 2011 is the basis for estimating the decommissioning cost (𝐶 ). Phasing of Negative Residual value The year 1 value of the decommission cost was reported in year 1. The cost of debt incremental was then reported for each subsequent year.
The year of decommissioning is estimated to be 2070 which is consistent with business plans and no contradictory information was noted.
Table 4.1:
Recovered
capital
method -
pipeline
assets
Pipeline Assets
Jul 2000-Dec
2006
Additions Estimate GST
taxable supply
and GST free
split
After 1 July 2000 10%
GST was charged on
taxable supplies. This
GST component of
spending would have
been refunded by the
ATO and therefore does
not represent a cash flow
on the pipeline.
An estimate was required
to calculate the split
between GST taxable
supply and GST free
SGSPAA reviewed
internal records and
records of historical
ownership changes to
determine what
information was
available.
Previous owners were
contacted but a
response was not
received.
The taxable supply and
GST free Capex split was
estimated as 96.1% and
3.9% respectively. This
split was calculated
based on Major Capex
projects from 2013–2016,
and so we assume that
this split would apply to
additions over the 1999–
2002 period.
All additions are incurred
mid-year.
External contractors
are generally engaged
to perform the work
required for Capex
additions. No change
is noted in the
spending split between
taxable supply and
GST free spending
over the life of the
pipeline. Therefore the
2013-2016 major
projects taxable supply
and GST free split

13 — RECOVERED CAPITAL METHOD - PIPELINE ASSETS
62 Public—31 December 2018 © Eastern Gas Pipeline
Table Name
Base Information Population Approach
Why it was not possible for Jemena
Group to provide actual information
Steps Jemena Group took to locate actual information;
Basis for the estimate, including
the methods, assumptions and
inputs used
Why the estimate represents the best estimate
possible in the circumstances and has been arrived at
on a reasonable basis.
Asset Description
Year Item Actual /
Estimate
spending included in the
Cash flows from
investing activities input
extracted from cash flow
statements.
The statutory accounts
do not disclose the split
between the split
between GST taxable
supply and GST free
spending.
SGSPAA does not have
access to actual records
because the records
were held by a previous
owner.
Current tax and
accounting laws only
require records to be
retained for 7 years.
represents the best
available information.
The split has been
calculated based on
actual major project
capex additions
historic records for the
2013-2016 period and
therefore has been
arrived at on a
reasonable basis.

RECOVERED CAPITAL METHOD - PIPELINE ASSETS — 13
Public—31 December 2018 © Eastern Gas Pipeline 63
Table Name
Base Information Population Approach
Why it was not possible for Jemena
Group to provide actual information
Steps Jemena Group took to locate actual information;
Basis for the estimate, including
the methods, assumptions and
inputs used
Why the estimate represents the best estimate
possible in the circumstances and has been arrived at
on a reasonable basis.
Asset Description
Year Item Actual /
Estimate
Table 4.1:
Recovered
capital
method -
pipeline
assets
Pipeline Assets
Jan 2000-Dec
2006
Opex Estimate GST
taxable supply
and GST free
split
GST taxable supply and
GST free split
After 1 July 2000 10%
GST was charged on
taxable supplies. This
GST component of
spending would have
been refunded by the
ATO and therefore does
not represent a cash flow
on the pipeline.
An estimate was required
to calculate the split
between GST taxable
supply and GST free
spending included in the
Cash flows from
investing activities input
extracted from cash flow
statements.
The statutory accounts
do not disclose the split
between the split
between GST taxable
SGSPAA reviewed
internal records,
published records, and
records of historical
ownership changes to
determine what
information was
available.
Previous owners were
contacted but a
response was not
received.
GST taxable supply and
GST free split
The taxable supply and
GST free Opex split was
estimated as 48.04% and
51.96% respectively. This
split was calculated
based on the average
split over the 2015–2017,
and so we assume that
this split applies equally
to the 1999–2002 period.
A calculated estimate of
the taxable supply and
GST free Opex split was
applied because historical
actual data is not
available.
Operating expense were
incurred evenly through
the year.
GST taxable supply
and GST free split
No change is noted in
the spending split
between taxable
supply and GST free
spending over the life
of the pipeline.
Therefore the 2015-
2017 taxable supply
and GST free split
represents the best
available information
and to calculate the
split.
The split has been
calculated based on
actual historic records
for the 2015-2017
period and therefore
has been arrived at on
a reasonable basis.

13 — RECOVERED CAPITAL METHOD - PIPELINE ASSETS
64 Public—31 December 2018 © Eastern Gas Pipeline
Table Name
Base Information Population Approach
Why it was not possible for Jemena
Group to provide actual information
Steps Jemena Group took to locate actual information;
Basis for the estimate, including
the methods, assumptions and
inputs used
Why the estimate represents the best estimate
possible in the circumstances and has been arrived at
on a reasonable basis.
Asset Description
Year Item Actual /
Estimate
supply and GST free
spending.
SGSPAA does not have
access to actual records
because the records
were held by a previous
owner.
Current tax and
accounting laws only
require records to be
retained for 7 years.
Table 4.1:
Recovered
capital
method -
pipeline
assets
Pipeline Assets
Jan 2000-Dec
2006
Opex Estimate
Shared Costs
Shared costs were not
allocated to EGP and
therefore these costs
have been estimated.
Shared costs relating to
supporting corporate
activities would be
expected to exist and
therefore should be
allocated to the EGP.
Previous owners were
contacted but a
response was not
received.
Shared Costs = Shared
costs source entity Cash
Flow from Operating
Activity multiplied by EGP
entities percentage share
of total revenue.
Revenue is an
appropriate basis to
allocate holding company
shared costs to EGP.
Audited statutory
accounts are a reliable
data source and have
been used as the
source data inputs into
the shared costs
calculation.
Revenue is the best
available cost driver
due to alternative cost
information not being
available.
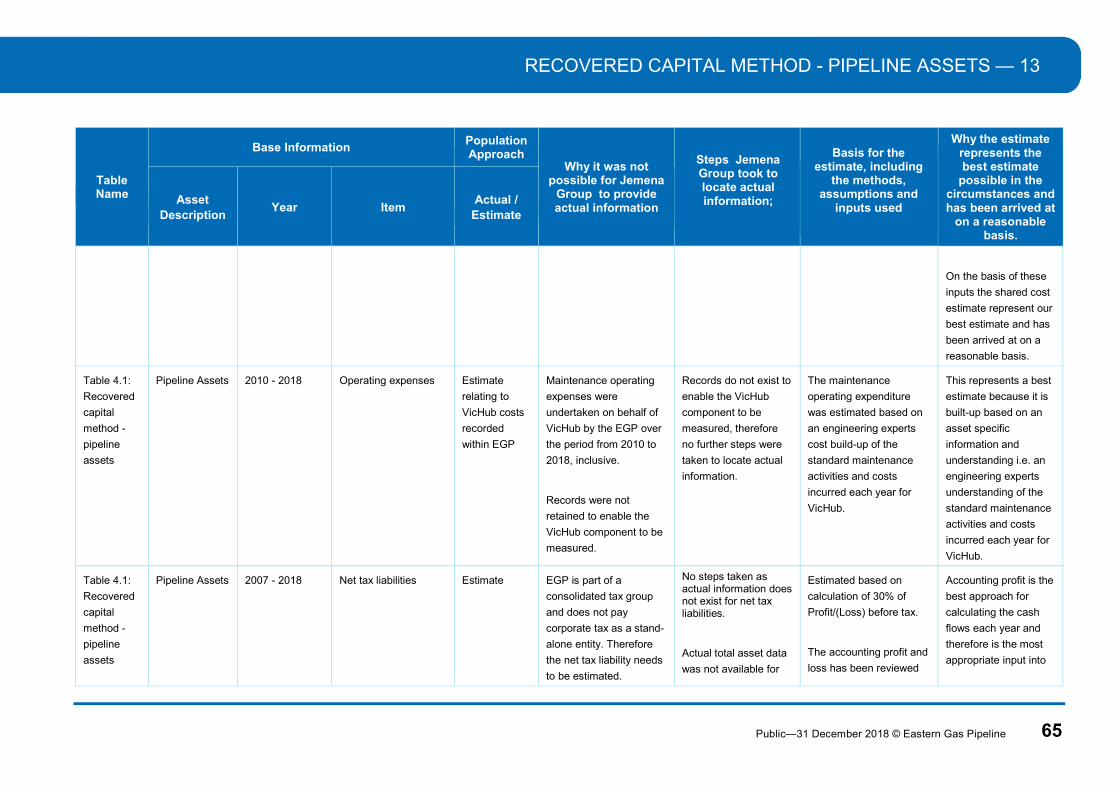
RECOVERED CAPITAL METHOD - PIPELINE ASSETS — 13
Public—31 December 2018 © Eastern Gas Pipeline 65
Table Name
Base Information Population Approach
Why it was not possible for Jemena
Group to provide actual information
Steps Jemena Group took to locate actual information;
Basis for the estimate, including
the methods, assumptions and
inputs used
Why the estimate represents the best estimate
possible in the circumstances and has been arrived at
on a reasonable basis.
Asset Description
Year Item Actual /
Estimate
On the basis of these
inputs the shared cost
estimate represent our
best estimate and has
been arrived at on a
reasonable basis.
Table 4.1:
Recovered
capital
method -
pipeline
assets
Pipeline Assets
2010 - 2018 Operating expenses Estimate
relating to
VicHub costs
recorded
within EGP
Maintenance operating
expenses were
undertaken on behalf of
VicHub by the EGP over
the period from 2010 to
2018, inclusive.
Records were not
retained to enable the
VicHub component to be
measured.
Records do not exist to
enable the VicHub
component to be
measured, therefore
no further steps were
taken to locate actual
information.
The maintenance
operating expenditure
was estimated based on
an engineering experts
cost build-up of the
standard maintenance
activities and costs
incurred each year for
VicHub.
This represents a best
estimate because it is
built-up based on an
asset specific
information and
understanding i.e. an
engineering experts
understanding of the
standard maintenance
activities and costs
incurred each year for
VicHub.
Table 4.1:
Recovered
capital
method -
pipeline
assets
Pipeline Assets
2007 - 2018 Net tax liabilities Estimate EGP is part of a
consolidated tax group
and does not pay
corporate tax as a stand-
alone entity. Therefore
the net tax liability needs
to be estimated.
No steps taken as actual information does not exist for net tax liabilities.
Actual total asset data
was not available for
Estimated based on
calculation of 30% of
Profit/(Loss) before tax.
The accounting profit and
loss has been reviewed
Accounting profit is the
best approach for
calculating the cash
flows each year and
therefore is the most
appropriate input into

13 — RECOVERED CAPITAL METHOD - PIPELINE ASSETS
66 Public—31 December 2018 © Eastern Gas Pipeline
Table Name
Base Information Population Approach
Why it was not possible for Jemena
Group to provide actual information
Steps Jemena Group took to locate actual information;
Basis for the estimate, including
the methods, assumptions and
inputs used
Why the estimate represents the best estimate
possible in the circumstances and has been arrived at
on a reasonable basis.
Asset Description
Year Item Actual /
Estimate
Actual total asset data
was not available for
each of the pipelines
EGP, QGP and VicHub
from 2008 to 2011.
Therefore total assets
could not be used as a
basis to allocate interest
costs across the
pipelines.
.
each of the pipelines
EGP, QGP and VicHub
from 2008 to 2011.
Therefore not steps
were taken to locate
actual information.
to identify material non-
cash items that may
require adjustment when
estimating the net tax
liability cash flow
Tax Depreciation (1998 –
2006) was calculated as:
LTD Net Capex divided
by the estimated tax
useful life years.
Tax useful life was
estimated based on a
useful life that align with
tax depreciation amounts
for 2007 sourced from the
SAP Fixed Asset Tax
Register.
The aggregate 2012 and
2013 percentage split of
interest expense between
EGP, Vic Hub and QGP
was used to allocate total
the net tax liability
calculation.
Accounting profit has
been sourced from
actual historic records
and therefore has
been arrived at on a
reasonable basis.
The first year of post-
acquisition tax
depreciation is the
most appropriate basis
to estimate pre-
acquisition tax
depreciation because it
is based on an actual
data source.
The 2012 to 2013
interest split
percentages between
EGP, QGP and
VicHub was the best
estimate for the years
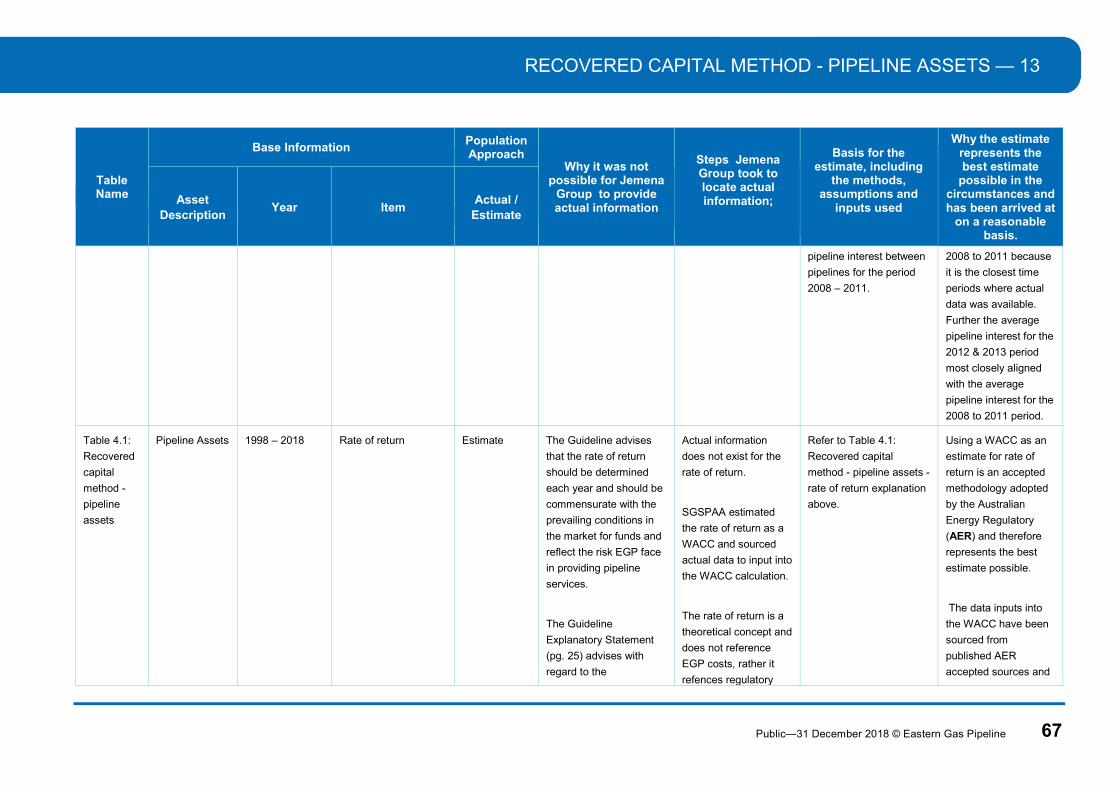
RECOVERED CAPITAL METHOD - PIPELINE ASSETS — 13
Public—31 December 2018 © Eastern Gas Pipeline 67
Table Name
Base Information Population Approach
Why it was not possible for Jemena
Group to provide actual information
Steps Jemena Group took to locate actual information;
Basis for the estimate, including
the methods, assumptions and
inputs used
Why the estimate represents the best estimate
possible in the circumstances and has been arrived at
on a reasonable basis.
Asset Description
Year Item Actual /
Estimate
pipeline interest between
pipelines for the period
2008 – 2011.
2008 to 2011 because
it is the closest time
periods where actual
data was available.
Further the average
pipeline interest for the
2012 & 2013 period
most closely aligned
with the average
pipeline interest for the
2008 to 2011 period.
Table 4.1:
Recovered
capital
method -
pipeline
assets
Pipeline Assets
1998 – 2018 Rate of return Estimate The Guideline advises
that the rate of return
should be determined
each year and should be
commensurate with the
prevailing conditions in
the market for funds and
reflect the risk EGP face
in providing pipeline
services.
The Guideline
Explanatory Statement
(pg. 25) advises with
regard to the
Actual information
does not exist for the
rate of return.
SGSPAA estimated
the rate of return as a
WACC and sourced
actual data to input into
the WACC calculation.
The rate of return is a
theoretical concept and
does not reference
EGP costs, rather it
refences regulatory
Refer to Table 4.1:
Recovered capital
method - pipeline assets -
rate of return explanation
above.
Using a WACC as an
estimate for rate of
return is an accepted
methodology adopted
by the Australian
Energy Regulatory
(AER) and therefore
represents the best
estimate possible.
The data inputs into
the WACC have been
sourced from
published AER
accepted sources and
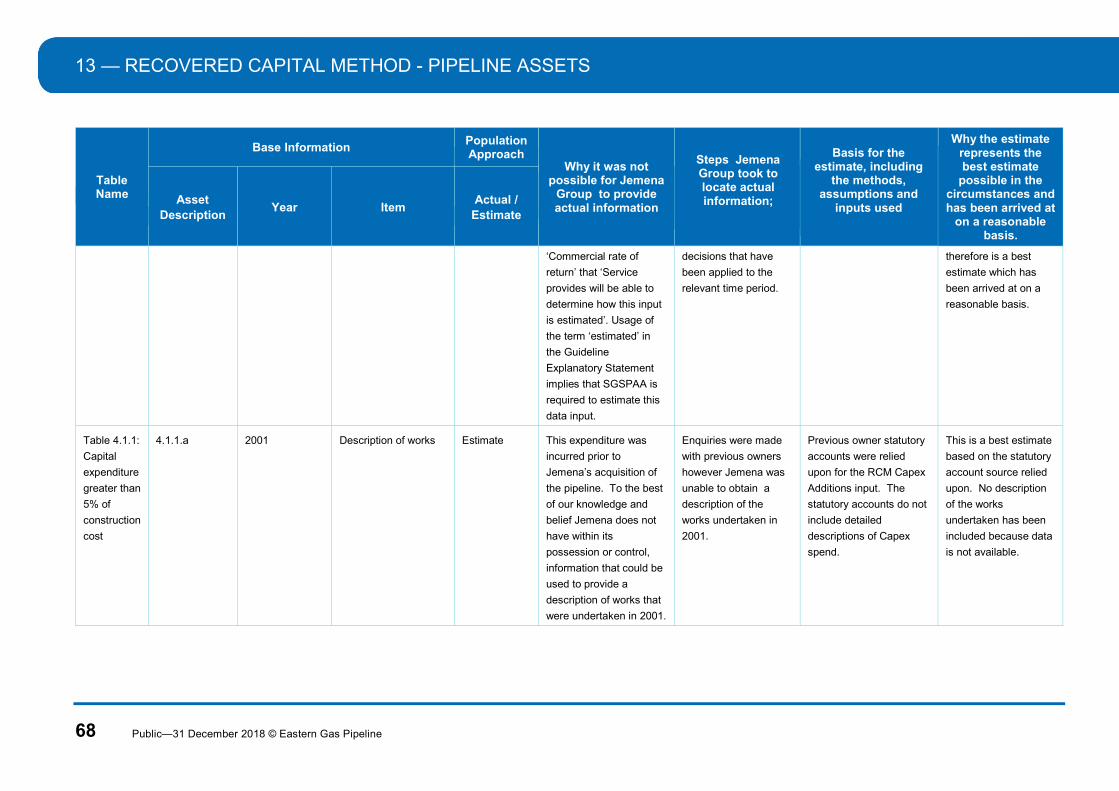
13 — RECOVERED CAPITAL METHOD - PIPELINE ASSETS
68 Public—31 December 2018 © Eastern Gas Pipeline
Table Name
Base Information Population Approach
Why it was not possible for Jemena
Group to provide actual information
Steps Jemena Group took to locate actual information;
Basis for the estimate, including
the methods, assumptions and
inputs used
Why the estimate represents the best estimate
possible in the circumstances and has been arrived at
on a reasonable basis.
Asset Description
Year Item Actual /
Estimate
‘Commercial rate of
return’ that ‘Service
provides will be able to
determine how this input
is estimated’. Usage of
the term ‘estimated’ in
the Guideline
Explanatory Statement
implies that SGSPAA is
required to estimate this
data input.
decisions that have
been applied to the
relevant time period.
therefore is a best
estimate which has
been arrived at on a
reasonable basis.
Table 4.1.1:
Capital
expenditure
greater than
5% of
construction
cost
4.1.1.a 2001 Description of works Estimate This expenditure was
incurred prior to
Jemena’s acquisition of
the pipeline. To the best
of our knowledge and
belief Jemena does not
have within its
possession or control,
information that could be
used to provide a
description of works that
were undertaken in 2001.
Enquiries were made
with previous owners
however Jemena was
unable to obtain a
description of the
works undertaken in
2001.
Previous owner statutory
accounts were relied
upon for the RCM Capex
Additions input. The
statutory accounts do not
include detailed
descriptions of Capex
spend.
This is a best estimate
based on the statutory
account source relied
upon. No description
of the works
undertaken has been
included because data
is not available.

PIPELINE DETAILS — 14
Public—31 December 2018 © Eastern Gas Pipeline 69
14. PIPELINE DETAILS
Table Name Item Actual / Estimate Source Methodology Assumptions
Table 4.2: Pipeline details Construction date Actual Westcoast Energy, Annual Report 1998, pg. 20
Extracted from report. Construction date is interpreted as the mid-point of the year when construction commenced
Table 4.2: Pipeline details Negative residual value Estimate Refer to ‘Table 4.1: Recovered capital method - pipeline assets’ source.
Refer to ‘Table 4.1: Recovered capital method - pipeline assets’ methodology explanation.
Refer to ‘Table 4.1: Recovered capital method - pipeline assets’ assumptions.
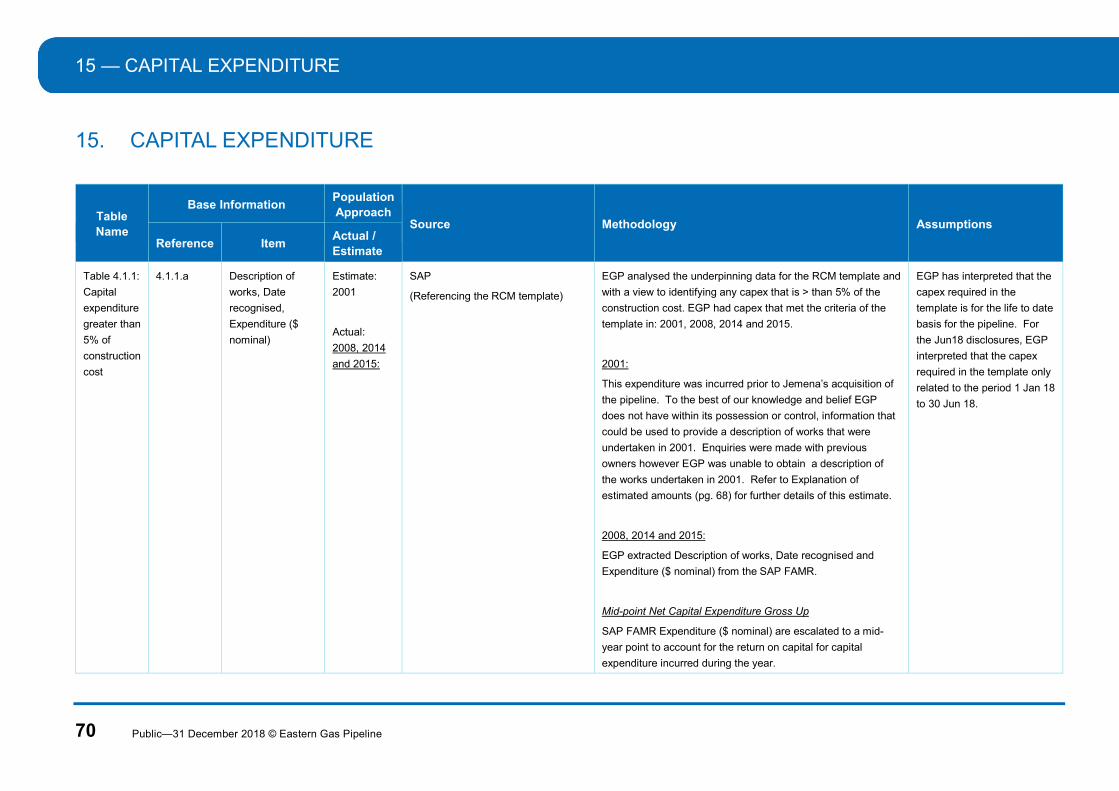
15 — CAPITAL EXPENDITURE
70 Public—31 December 2018 © Eastern Gas Pipeline
15. CAPITAL EXPENDITURE
Table Name
Base Information Population Approach
Source Methodology Assumptions
Reference Item Actual / Estimate
Table 4.1.1:
Capital
expenditure
greater than
5% of
construction
cost
4.1.1.a Description of
works, Date
recognised,
Expenditure ($
nominal)
Estimate:
2001
Actual:
2008, 2014
and 2015:
SAP
(Referencing the RCM template)
EGP analysed the underpinning data for the RCM template and
with a view to identifying any capex that is > than 5% of the
construction cost. EGP had capex that met the criteria of the
template in: 2001, 2008, 2014 and 2015.
2001:
This expenditure was incurred prior to Jemena’s acquisition of
the pipeline. To the best of our knowledge and belief EGP
does not have within its possession or control, information that
could be used to provide a description of works that were
undertaken in 2001. Enquiries were made with previous
owners however EGP was unable to obtain a description of
the works undertaken in 2001. Refer to Explanation of
estimated amounts (pg. 68) for further details of this estimate.
2008, 2014 and 2015:
EGP extracted Description of works, Date recognised and
Expenditure ($ nominal) from the SAP FAMR.
Mid-point Net Capital Expenditure Gross Up
SAP FAMR Expenditure ($ nominal) are escalated to a mid-
year point to account for the return on capital for capital
expenditure incurred during the year.
EGP has interpreted that the
capex required in the
template is for the life to date
basis for the pipeline. For
the Jun18 disclosures, EGP
interpreted that the capex
required in the template only
related to the period 1 Jan 18
to 30 Jun 18.

CAPITAL EXPENDITURE — 15
Public—31 December 2018 © Eastern Gas Pipeline 71
Table Name
Base Information Population Approach
Source Methodology Assumptions
Reference Item Actual / Estimate
𝑀𝑖𝑑 𝑃𝑜𝑖𝑛𝑡 𝐺𝑟𝑜𝑠𝑠 𝐶𝑎𝑝𝑒𝑥
= 𝐶𝑎𝑝𝑒𝑥 × (1 + 𝑅𝑎𝑡𝑒 𝑜𝑓 𝑅𝑒𝑡𝑢𝑟𝑛 𝑝𝑒𝑟𝑐𝑒𝑛𝑡𝑎𝑔𝑒) .
The Rate of Return percentage input calculation methodology
is further explained with the Recovered Capital Method above
(refer to ‘Rate of Return’ item).

16 — WEIGHTED AVERAGE PRICES
72 Public—31 December 2018 © Eastern Gas Pipeline
16. WEIGHTED AVERAGE PRICES
Table Name
Base Information Population Approach
Source Methodology Assumptions
Reference Item Actual / Estimate
Table 5.1
Weighted
average
prices
No BoP
Reference
cells in the
template
Volume Estimate PypIT is the best source to provide
data for the purposes of calculating
the weighted average price since it is
the only system that captures
information related to revenue,
volume and category breakdown and
details in the same place.
Data extracted from PypIT is compared and checked against
SAP balances and reference tariffs before being categorised
accordingly based on service type per details below Where
necessary, data has been manually categorised as follows:
Categorisation of Charge Method
The “Other Services” category represents revenue and
volumes associated with Firm Park and Premium Park
services. As these services are charged on an Maximum Daily
Quantity (MDQ) basis they have been categorised as Capacity-
based services in the template.
The "Postage Stamp Transportation Services" represents
revenue and volumes associated with TGP (Tasmanian Gas
Pipeline) Transfer Services. Per the Section 5 of the Guideline,
these services are where the same charge is payable along the
length of the pipeline, irrespective of the distance transported.
This includes the TGP Class A service which is a "Firm
Forward haul transportation service" and TGP Class B
services (B1 and B2) which are "Interruptible or as available
transportation services". Firm services are charged on a
capacity basis (i.e. MDQ), while Interruptible and As Available
services are charged on a volumetric basis (i.e. actual
deliveries).
Some specific charges /
services are not relevant to
the weighted average price
calculation (i.e. not part of
the service categories
required under the weighted
average price template as
specified in Section 5 of the
Guideline). This is discussed
further below.
In determining the total
revenue to be used in
calculating the weighted
average price, there are
certain service types which
fall under "Other Direct
Revenue" in Table 2.1.1 that
were intentionally be omitted
from the weighted average
price calculation as it does
not form part of the main
pipeline revenue generating
services. These services
include:
- As Available Park Service

WEIGHTED AVERAGE PRICES — 16
Public—31 December 2018 © Eastern Gas Pipeline 73
Table Name
Base Information Population Approach
Source Methodology Assumptions
Reference Item Actual / Estimate
The "Zonal Based Transportation Services" consists of data
relating to 3 service types: Firm Forward, As Available
Forward and As Available Backhaul.
1. Firm Forward data has been reported in the "Firm
Forward haul transportation services" row under the
capacity based column headings as the charges for these
services are based on MDQ volumes.
2. "Interruptible or as available transportation services"
consist of revenue and volumes for As Available
Forward services. Charges are based on actual delivered
volumes and thus captured under the volumetric based
column headings which are based on actual delivery
volumes.
3. "Backhaul Services" include revenue and volumes for
both As Available Backhaul and Firm Backhaul. As
there are both firm and as available components, data
has been allocated to the appropriate columns i.e. Firm
services charged at MDQ reported as capacity based and
As Available services charged on actual deliveries
recorded as volumetric based data.
Volumes are obtained and adjusted per below:
Volume Calculation
Volume data has been estimated for each service and charge
reported in the template by adjusting the raw data obtained
- Authorised Overrun Charge
- Unauthorised Overrun
Charge
- Imbalance Charge
- Minimum Monthly Service
Charge
- Odorisation Charge
- User Specific Facility
Charge
- Bairnsdale City Gate
Facility Charge
- Shipper Specific Facility
Charge
- Transfer Service.
The invoice data in PypIT
reflects actual invoicing and
has been used as the basis
of allocation of revenue to
services and charges. Based
on the invoice data retrieved
from PypIT, the revenue and
volume data used in the
weighted average price
calculation is
included/excluded based on

16 — WEIGHTED AVERAGE PRICES
74 Public—31 December 2018 © Eastern Gas Pipeline
Table Name
Base Information Population Approach
Source Methodology Assumptions
Reference Item Actual / Estimate
from the PypIT reports. Manual calculations have been
performed to calculate the relevant volumes to be included in
the WAP calculations.
The volume used in the weighted average price calculation are
based on the service type. For Firm Services, Premium Park
and TGP Transfer-Class A, volumes are based on MDQ. To
obtain the total relevant volumes for a particular month, the
MDQ needs to be multiplied out by the number of days in the
month. For As Available service and TGP Transfer-Class B2,
the actual delivery volumes would apply.
the revenue charge type and
service type categorisation.
The MDQ used in the
calculation (as referred to in
the methodology) is the
applicable MDQ on the last
day of the month. The
volume calculated is
therefore only an estimated
volume because there are
instances where MDQ in the
month is not constant on all
days. For services where
calculated volumes are
materially different from the
total invoiced volumes
(typically where there have
been curtailments or large
MDQ changes), the invoiced
volumes have been used.
Table 5.1
Weighted
average
prices
No BoP
Reference
cells in the
template
Revenue Actual PypIT Categorisation of data per above Volume Methodology.
Revenue Calculation
The revenue obtained in the report to be used in the weighted
average price calculation is based on the sum of the relevant
charges per the assumptions listed out in this paper. The
relevant charges are added together to come to an adjusted
As per above assumption,
using the invoice data
retrieved from PypIT, the
revenue and volume data
used in the weighted
average price calculation is
included/excluded based on
the revenue charge type and
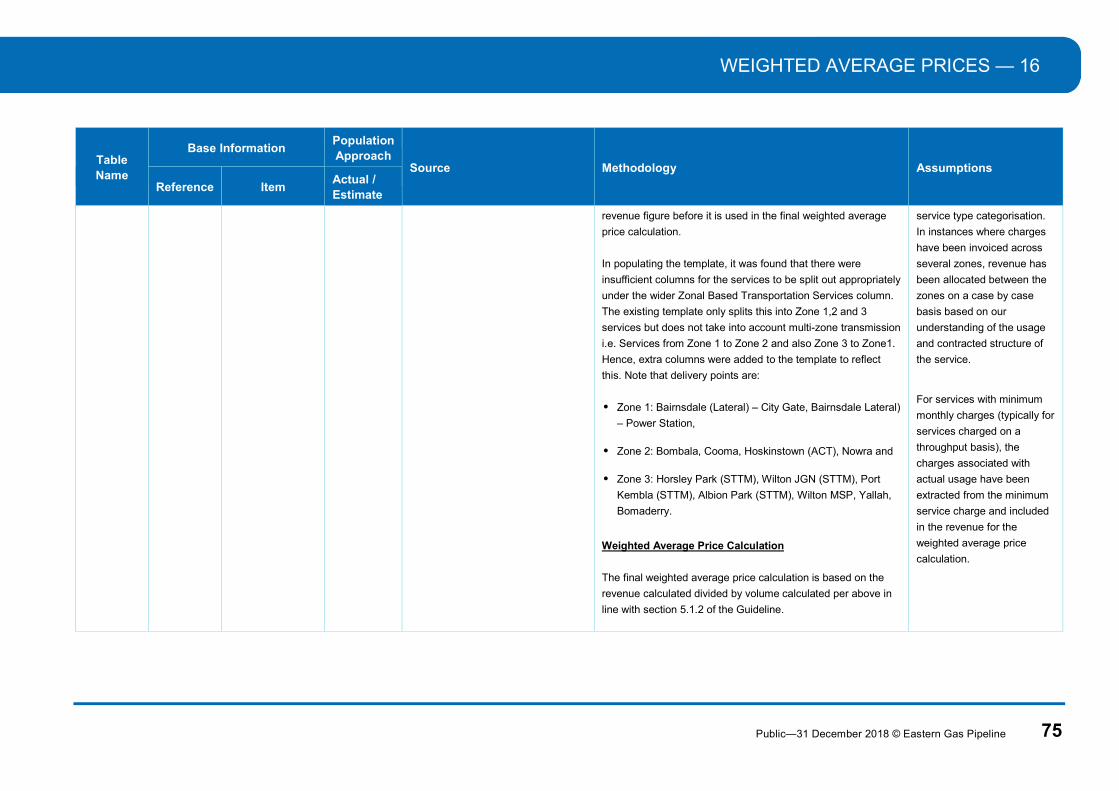
WEIGHTED AVERAGE PRICES — 16
Public—31 December 2018 © Eastern Gas Pipeline 75
Table Name
Base Information Population Approach
Source Methodology Assumptions
Reference Item Actual / Estimate
revenue figure before it is used in the final weighted average
price calculation.
In populating the template, it was found that there were
insufficient columns for the services to be split out appropriately
under the wider Zonal Based Transportation Services column.
The existing template only splits this into Zone 1,2 and 3
services but does not take into account multi-zone transmission
i.e. Services from Zone 1 to Zone 2 and also Zone 3 to Zone1.
Hence, extra columns were added to the template to reflect
this. Note that delivery points are:
Zone 1: Bairnsdale (Lateral) – City Gate, Bairnsdale Lateral)
– Power Station,
Zone 2: Bombala, Cooma, Hoskinstown (ACT), Nowra and
Zone 3: Horsley Park (STTM), Wilton JGN (STTM), Port
Kembla (STTM), Albion Park (STTM), Wilton MSP, Yallah,
Bomaderry.
Weighted Average Price Calculation
The final weighted average price calculation is based on the
revenue calculated divided by volume calculated per above in
line with section 5.1.2 of the Guideline.
service type categorisation.
In instances where charges
have been invoiced across
several zones, revenue has
been allocated between the
zones on a case by case
basis based on our
understanding of the usage
and contracted structure of
the service.
For services with minimum
monthly charges (typically for
services charged on a
throughput basis), the
charges associated with
actual usage have been
extracted from the minimum
service charge and included
in the revenue for the
weighted average price
calculation.

17 — EXEMPT WAP SERVICES
76 Public—31 December 2018 © Eastern Gas Pipeline
17. EXEMPT WAP SERVICES
Table Name
Base Information Population Approach
Source Methodology Assumptions
Reference Item Actual / Estimate
Table 5.1.1
AER
Exemptions
No BoP
Reference
cells in the
template
N/A Actual PypIT System as per description in
Table 5.1
Based on a report run out of PypIT, the number of customers
by service type by pipeline can be determined. Based on this
information, the service types by zone that have no more than
2 shippers were identified and were listed out to AER for
exemptions to apply in accordance with section 5.3 of the
Guideline. The AER notified us that no aggregation of services
were required.

ESTIMATED INFORMATION — 18
Public—31 December 2018 © Eastern Gas Pipeline 77
18. ESTIMATED INFORMATION
Table Name
Base Information Population Approach
Source Why it was not possible for Jemena
Group to provide actual information
Steps Jemena Group took to locate actual information
Basis for the estimate, including the methods, assumptions and inputs used
Why the estimate
represents the
best estimate
possible in the
circumstances and
has been arrived at
on a reasonable
basis.
Reference Item Actual /
Estimate
Table 5.1
Weighted
average
prices
No BoP
Reference
cells in the
template
Volume Estimate As Above This is due to the system limitations of PypIT
as it was not built for this reporting purpose.
Jemena Group is
currently working
towards developing
a PypIT report that
captures the
relevant data for the
WAP calculation. A
planned completion
date for these
software changes
has not been
finalised.
PypIT contains
contract details
(MDQ, tariff and
terms), nominations,
invoice amounts,
pipeline schedules
and actual deliveries
for all our shippers
and services.
Currently there is no
report in place in
PypIT that provides
the data in a way to
be used to calculate
the WAP. EGP is
required to manually
extract the relevant
information to be
used in the
calculations and
include/exclude
components in the
This is the best
estimate given the
information
available from
PypIT. We are not
aware of any
alternative
information
available to us at
this time.
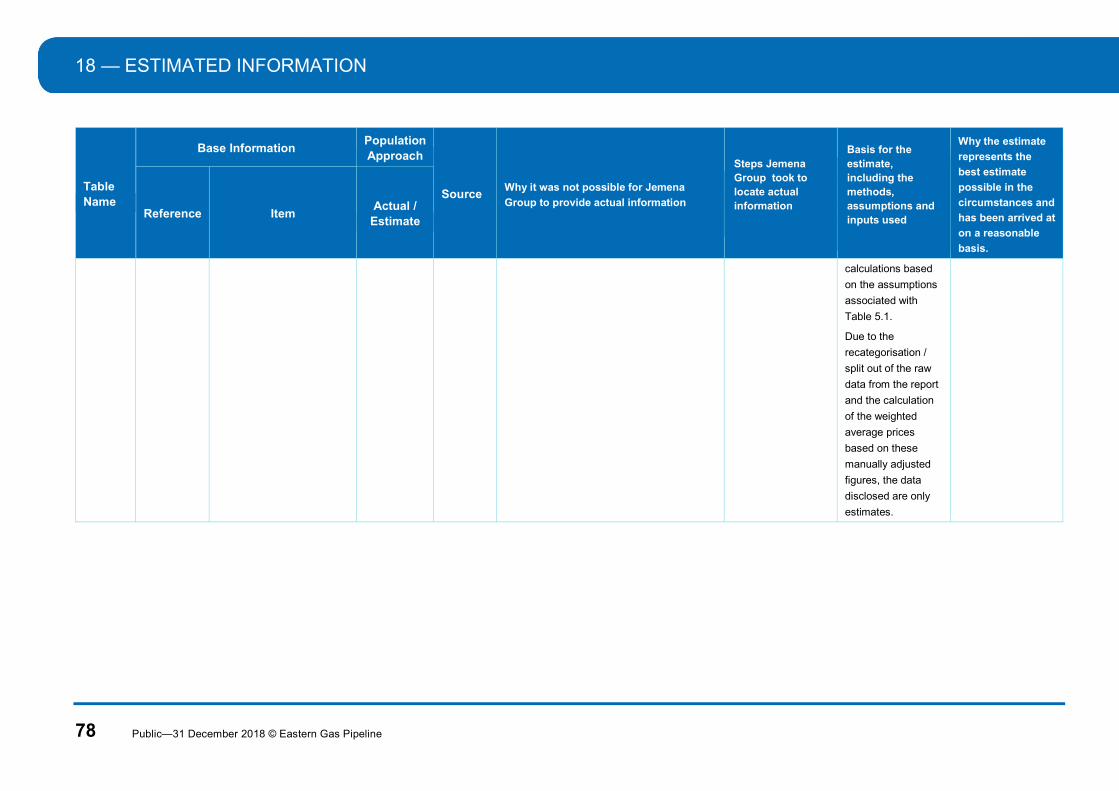
18 — ESTIMATED INFORMATION
78 Public—31 December 2018 © Eastern Gas Pipeline
Table Name
Base Information Population Approach
Source Why it was not possible for Jemena
Group to provide actual information
Steps Jemena Group took to locate actual information
Basis for the estimate, including the methods, assumptions and inputs used
Why the estimate
represents the
best estimate
possible in the
circumstances and
has been arrived at
on a reasonable
basis.
Reference Item Actual /
Estimate
calculations based
on the assumptions
associated with
Table 5.1.
Due to the
recategorisation /
split out of the raw
data from the report
and the calculation
of the weighted
average prices
based on these
manually adjusted
figures, the data
disclosed are only
estimates.

APPENDIX A - SUMMARY OF FORMULA UPDATES WITHIN TABLES — 19
Public—31 December 2018 © Eastern Gas Pipeline 79
19. APPENDIX A - SUMMARY OF FORMULA UPDATES WITHIN TABLES
# Table Worksheet Cell Ref Title Explanation & Justification Excel formula before change Excel formula after change
1 Table 2.1:
Statement
of pipeline
revenues
and
expenses
2. Revenues
and
expenses
D11 Change to prevent
the 'Other direct
revenue' item being
reported twice
The item 'Other direct revenue' appears
on both:
- Table 2.1: Statement of pipeline
revenues and expenses
- Table 2.1.1: Revenue by service
To prevent the number being reported
twice we updated the Table 2.1.1:
Revenue by service total to exclude
'Other direct revenue'.
='2.1 Revenue by service'!D23 =SUM('2.1 Revenue by
service'!D11:D21)
2 Table 2.1:
Statement
of pipeline
revenues
and
expenses
2. Revenues
and
expenses
D29:D37 Sumif() formula
referenced an
incorrect range was
not using fixed
addresses
The sumif() formula referenced an
incorrect range and was not using fixed
addresses. It appears that as the formula
was dragged down the sumif() range
continued to change when it should have
remained consistent.
E.g. D29 =SUMIF('2.4 Shared
costs'!$D10:$D36,'2. Revenues and
expenses'!$C29,'2.4 Shared
costs'!H10:H36)
E.g. D30 =SUMIF('2.4 Shared
costs'!$D11:$D37,'2. Revenues and
expenses'!$C30,'2.4 Shared
costs'!H11:H37)
E.g. D29 =SUMIF('2.4 Shared
costs'!$C$9:$C$17,$C29,'2.4 Shared
costs'!$H$9:$H$17)
E.g. D30 =SUMIF('2.4 Shared
costs'!$C$9:$C$17,$C30,'2.4 Shared
costs'!$H$9:$H$17)
3 Table 2.1:
Statement
of pipeline
revenues
2. Revenues
and
expenses
E29:E37 Sumif() formula
referenced an
incorrect range was
not using fixed
addresses
The sumif() formula referenced an
incorrect range and was not using fixed
addresses. It appears that as the formula
was dragged down the sumif() range
E.g. E29 =SUMIF('2.4 Shared
costs'!$D10:$D36,'2. Revenues and
expenses'!$C29,'2.4 Shared
costs'!I10:I36)
E.g. E30 =SUMIF('2.4 Shared
costs'!$D11:$D37,'2. Revenues and
E.g. E29 = SUMIF('2.4 Shared
costs'!$C$9:$C$18,$C29,'2.4 Shared
costs'!$I$9:$I$17)
E.g. E30 =SUMIF('2.4 Shared
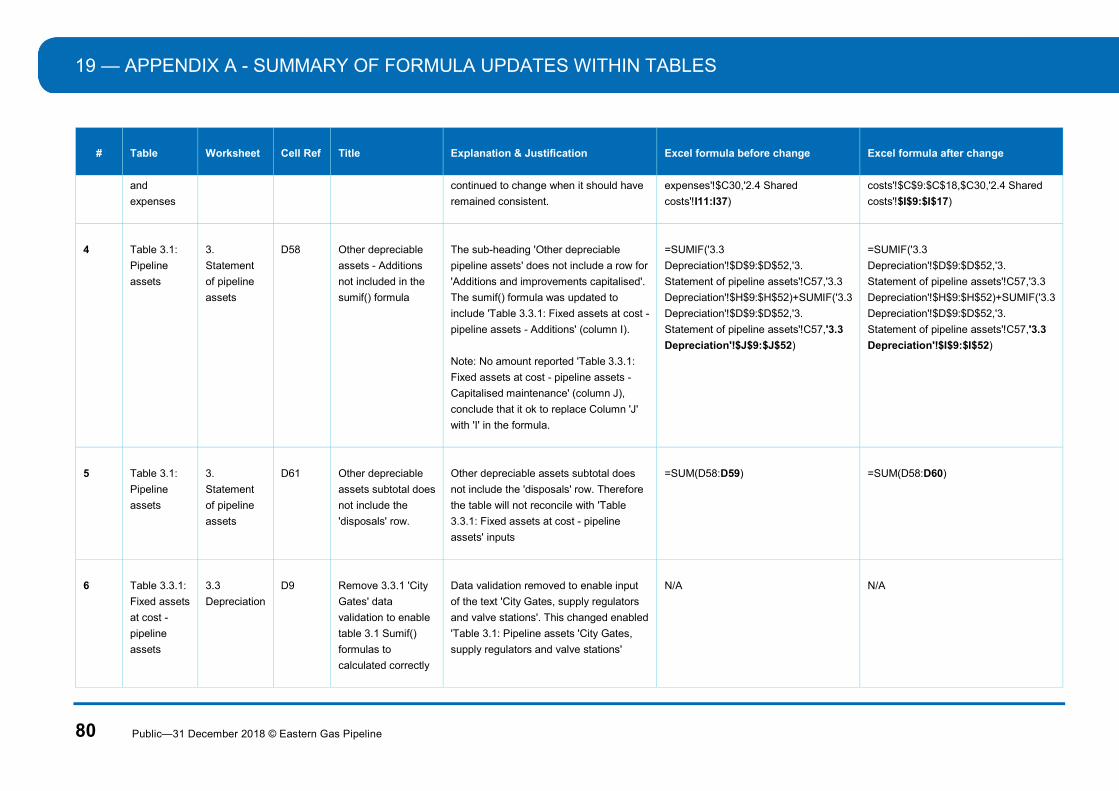
19 — APPENDIX A - SUMMARY OF FORMULA UPDATES WITHIN TABLES
80 Public—31 December 2018 © Eastern Gas Pipeline
# Table Worksheet Cell Ref Title Explanation & Justification Excel formula before change Excel formula after change
and
expenses continued to change when it should have
remained consistent. expenses'!$C30,'2.4 Shared
costs'!I11:I37) costs'!$C$9:$C$18,$C30,'2.4 Shared
costs'!$I$9:$I$17)
4 Table 3.1:
Pipeline
assets
3.
Statement
of pipeline
assets
D58 Other depreciable
assets - Additions
not included in the
sumif() formula
The sub-heading 'Other depreciable
pipeline assets' does not include a row for
'Additions and improvements capitalised'.
The sumif() formula was updated to
include 'Table 3.3.1: Fixed assets at cost -
pipeline assets - Additions' (column I).
Note: No amount reported 'Table 3.3.1:
Fixed assets at cost - pipeline assets -
Capitalised maintenance' (column J),
conclude that it ok to replace Column 'J'
with 'I' in the formula.
=SUMIF('3.3
Depreciation'!$D$9:$D$52,'3.
Statement of pipeline assets'!C57,'3.3
Depreciation'!$H$9:$H$52)+SUMIF('3.3
Depreciation'!$D$9:$D$52,'3.
Statement of pipeline assets'!C57,'3.3
Depreciation'!$J$9:$J$52)
=SUMIF('3.3
Depreciation'!$D$9:$D$52,'3.
Statement of pipeline assets'!C57,'3.3
Depreciation'!$H$9:$H$52)+SUMIF('3.3
Depreciation'!$D$9:$D$52,'3.
Statement of pipeline assets'!C57,'3.3
Depreciation'!$I$9:$I$52)
5 Table 3.1:
Pipeline
assets
3.
Statement
of pipeline
assets
D61 Other depreciable
assets subtotal does
not include the
'disposals' row.
Other depreciable assets subtotal does
not include the 'disposals' row. Therefore
the table will not reconcile with 'Table
3.3.1: Fixed assets at cost - pipeline
assets' inputs
=SUM(D58:D59) =SUM(D58:D60)
6 Table 3.3.1:
Fixed assets
at cost -
pipeline
assets
3.3
Depreciation D9 Remove 3.3.1 'City
Gates' data
validation to enable
table 3.1 Sumif()
formulas to
calculated correctly
Data validation removed to enable input
of the text 'City Gates, supply regulators
and valve stations'. This changed enabled
'Table 3.1: Pipeline assets 'City Gates,
supply regulators and valve stations'
N/A N/A
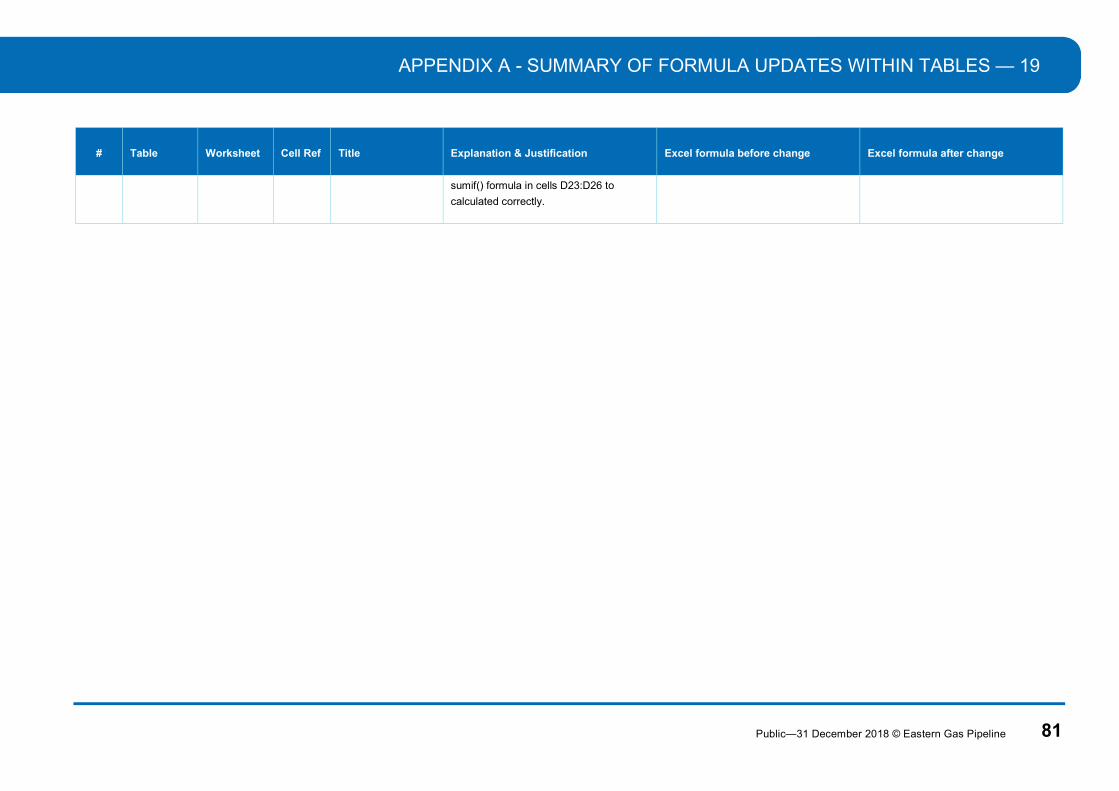
APPENDIX A - SUMMARY OF FORMULA UPDATES WITHIN TABLES — 19
Public—31 December 2018 © Eastern Gas Pipeline 81
# Table Worksheet Cell Ref Title Explanation & Justification Excel formula before change Excel formula after change
sumif() formula in cells D23:D26 to
calculated correctly.
Copyright © 2022 FDOKUMEN