Cost Estimation Study of Gas Pipeline Network and Alternative ...
51
30 December 2019 This publication was produced for review by the United States Agency for International Development. It was prepared by Deloitte Consulting LLP. The author’s views expressed in this publication do not necessarily reflect the views of the United States Agency for International Development or the United States Government. COST ESTIMATION STUDY OF GAS PIPELINE NETWORK AND ALTERNATIVE SYSTEMS FOR HIGH-MOUNTAINOUS SETTLEMENTS OF GEORGIA USAID ENERGY PROGRAM
-
Upload
khangminh22 -
Category
Documents
-
view
0 -
download
0
Transcript of Cost Estimation Study of Gas Pipeline Network and Alternative ...
30 December 2019
This publication was produced for review by the United States Agency for International Development. It was prepared by Deloitte Consulting LLP. The author’s views expressed in this publication do not necessarily reflect the views of the United States Agency for International Development or the United States Government.
COST ESTIMATION STUDY OF
GAS PIPELINE NETWORK AND
ALTERNATIVE SYSTEMS FOR
HIGH-MOUNTAINOUS
SETTLEMENTS OF GEORGIA USAID ENERGY PROGRAM

USAID ENERGY PROGRAM Cost Estimation Study of Gas Pipeline Network and Alternative Systems for High-Mountainous Settlements of Georgia i
COST ESTIMATION STUDY OF
GAS PIPELINE NETWORK AND
ALTERNATIVE SYSTEMS FOR
HIGH-MOUNTAINOUS
SETTLEMENTS OF GEORGIA
USAID ENERGY PROGRAM
CONTRACT NUMBER: AID-OAA-I-13-00018
DELOITTE CONSULTING LLP
USAID | GEORGIA
USAID CONTRACTING OFFICER’S
REPRESENTATIVE: NICHOLAS OKRESHIDZE
AUTHOR(S): GIORGI GIORGOBIANI, ALEKSI KOCHLASHVILI,
GIORGI JANGVELADZE
LANGUAGE: ENGLISH
30 DECEMBER 2019
DISCLAIMER:
This publication was produced for review by the United States Agency for International Development. It was prepared by Deloitte Consulting LLP. The author’s views expressed in this publication do not necessarily reflect the views of the United States Agency for International Development or the United States Government.

USAID ENERGY PROGRAM Cost Estimation Study of Gas Pipeline Network and Alternative Systems for High-Mountainous Settlements of Georgia ii
DATA Reviewed by: Daniel Potash, Ivane Pirveli
Practice Area: Strategic Advisory Assistance to the GoG to Increase Energy Security
Key Words: Natural Gas, Alternative Energy Technologies, Cost Benefit Analysis, Life-
Cycle Cost Analysis, High-mountainous Settlements of Georgia

USAID ENERGY PROGRAM Cost Estimation Study of Gas Pipeline Network and Alternative Systems for High-Mountainous Settlements of Georgia iii
ACRONYMS
BESS Battery Energy Storage System
Cal Calorific Value of Natural Gas
CBA Cost-Benefit Analysis
CNG Compressed Natural Gas
CoP Coefficient of Performance
EU European Union
GDP Gross Domestic Product
GEL Georgian Lari
GGTC Georgian Gas Transportation Company
GHG Greenhouse Gas
GJ Giga Joules
GNERC Georgian National Energy and Water Supply Regulatory Commission
GoG Government of Georgia
IRR Internal Rate of Return
J Joule
KJ Kilo Joules
kW Kilowatt
kWh Kilowatt Hour
kWp Kilowatt Peak
LCC Life-Cycle Cost
LCCA Life-Cycle Cost Analysis
LEDS Low Emissions Development Strategy
LPG Liquefied Petroleum Gas
MJ Mega Joules
MoESD Ministry of Economy and Sustainable Development of Georgia
MRDI Ministry of Infrastructure and Regional Development of Georgia
NPV Net Present Value
O&M Operation and Maintenance
PV Solar Photovoltaics
SOCAR State Oil Company of Azerbaijan Republic
UNFCCC United Nations Framework Convention on Climate Change
USAID United States Agency for International Development
USD U.S. Dollar
VAT Value Added Tax
WACC Weighted Average Cost of Capital
Wh Watt Hour
USAID ENERGY PROGRAM Cost Estimation Study of Gas Pipeline Network and Alternative Systems for High-Mountainous Settlements of Georgia iv
CONTENTS 1. EXECUTIVE SUMMARY .............................................................................................................. 5
2. BACKGROUND ............................................................................................................................ 7
3. METHODOLOGY ........................................................................................................................ 10
3.1 Cost Benefit Analysis ............................................................................................................ 11
3.2 Life-Cycle Cost Analysis ....................................................................................................... 12
3.2.1 LCCA Model Inputs and Assumptions ................................................................... 13
4. FINDINGS AND RECOMMENDATIONS ................................................................................... 22
4.1 CBA Findings ........................................................................................................................ 22
Analysis of impacts on natural gas distribution tariffs for different scenarios .................... 25
4.2 LCCA Findings ...................................................................................................................... 26
5. SUMMARY OF FINDINGS AND RECOMMENDATIONS .......................................................... 30
ANNEX 1: SAMPLE COST-ESTIMATION STUDY FOR PIPELINE GAS .......................................... 31
ANNEX 2: LIST OF SETTLEMENTS ................................................................................................... 36
ANNEX 3: ILLUSTRATIVE MAP OF SETTLEMENTS ........................................................................ 49

USAID ENERGY PROGRAM Cost Estimation Study of Gas Pipeline Network and Alternative Systems for High-Mountainous Settlements of Georgia 5
1. EXECUTIVE SUMMARY While urban areas in Georgia are adequately provided with necessary energy resources to meet the population’s household energy needs, many settlements in remote and high-mountainous areas are not, and some of them are still completely off-grid. The Government of Georgia (GoG) has been considering connecting all such settlements to natural gas network to meet their energy needs, specifically for heating, cooking and hot water. While natural gas is the most wide-spread source for the abovementioned uses in urban and suburban households, it is not given that natural gas will be the best way to meet energy demand of remote and high-mountainous settlements. Before moving forward with gasification1, the GoG will need to consider such crucial factors affecting economic viability of gasification, as settlements’ distance from gas mains, access roads and their condition, number of residents, willingness and ability to pay, etc. It is therefore essential to assess economic viability of gasification, as well as consider alternative energy sources though a comparative analysis in order to help GoG find an economically optimal solution.
According to clause 4 of the Decree of the Government of Georgia #791 dated April 5, 2019 on Measures to be implemented during 2019-2021 in Support of Gasification of the Georgian Population, Georgian Gas Transportation Company (GGTC) was tasked to evaluate feasibility of gasification of those villages that are included in the List of High-Mountainous Villages defined in the GoG Decree #671. Ministry of Economy and Sustainable Development of Georgia (MoESD) addressed USAID Energy Program to assist them in developing a study that would group 966 villages into clusters according to an agreed-upon criteria, carry out Cost-Benefit Analysis (CBA) of gasification for each cluster, and provide recommendations on alternative energy sources for those clusters where gasification could not be economically justified due to a negative impact on tariffs, lack of profitability or some other reason.
The settlements were grouped by municipality, therefore creating 38 distinctive clusters, and each cluster was analysed separately. The decision to cluster the settlements by municipalities was agreed with GGTC and was based on the rationale that it would be the optimal way to present the costs and it would be the easiest for the Government to carry out gasification (if decided) gradually or simultaneously in individual municipalities. In addition, since majority of information - number of customers, energy use trends, available resources, budgetary funds, etc. is available on municipal level, it was deemed most sensible to carry out cost-benefit analysis for individual municipalities.
In order for USAID Energy Program to perform an accurate cost-benefit analysis, it was necessary to have an adequate estimation of gasification costs, including the cost of laying gas mains and building local networks for the selected settlements. For this purpose, USAID Energy Program engaged a Georgian gas pipeline and network design and engineering company to develop the estimates. The subcontractor provided schematic drawings of gas pipes including mains and local networks for the provided settlements; technical parameters of the pipes including length, diameter and material; and cost estimates for gasification of each cluster including mains, connection points and local network costs, detailed to each settlement.
CBA was conducted for each cluster based on the provided cost estimates. The study showed that gasification costs vary significantly among clusters due to several factors, including distance from gas mains, geographical location, terrain, type of soil, etc. Therefore, a unified approach cannot be used for all clusters, and the decision on gasification or provision of energy through alternative sources should be made individually for each cluster. The alternative options overviewed in this report include:
Table 1: Natural Gas Alternatives
Electricity subsidies GoG could subsidize electricity for heating and cooking
Biomass
Biomass boilers have higher efficiency than traditional wood stoves and can operate on different types of biomass, including wood logs, wood chips, pellets, and plant-based biomass. Biomass can fully substitute natural gas usage
1 To avoid misunderstanding we note here that in standard engineering literature the term “gasification” has a different meaning, however in this report it describes delivery of natural gas through gas pipeline system and is established term in Georgia and neighboring countries.

USAID ENERGY PROGRAM Cost Estimation Study of Gas Pipeline Network and Alternative Systems for High-Mountainous Settlements of Georgia 6
Solar Photovoltaics (PV) with Battery Energy Storage System (BESS)
Solar PV, solar-thermal, and/or solar-hybrid systems can be used either independently or in conjunction with other technologies, e.g. heat pumps to meet energy demand
Heat pump
• Grid connected
• Powered by PV+BESS
A heat pump is a device that works on refrigeration cycle, transferring thermal energy from environment such as ground, air and water reservoirs to a desired destination
Wood Stoves Wood stoves are traditionally used in Georgia for space and water heating as well as cooking purposes
Compressed Natural Gas (CNG) virtual pipeline
Transportation of natural gas in a compressed form and distributing using a pipeline that’s not connected to the grid
The above-listed alternatives were compared to natural gas through a comparative Life-Cycle Cost Analysis (LCCA) in order to capture all costs associated with each technology throughout the projection period – 35 years, including initial, replacement, maintenance and energy costs. When looking purely from cost standpoint, the analyses showed that gasification is not economically viable, failing to achieve a positive Net Present Value (NPV), or acceptable Internal Rate of Return (IRR) in any of the clusters. Despite this, gasification still is the most-cost efficient solution in a few municipalities as compared to most of the alternatives, with only the biomass-based technologies - biomass boilers and energy efficient (improved) wood stoves having lower Life-Cycle Cost (LCC) in all instances. Additionally, It is important to consider that alternatives, especially those that are not grid-connected will not create an upward pressure on natural gas tariffs, will not be dependent on imported energy resources and may therefore be a better solution when looking at other aspects besides cost, like energy security, environment and social welfare. The results of CBA and LCCA along with assumptions and inputs used for calculations are described in detail in Sections 3 and 4 below.
This report provides an overview of the gas sector in Georgia as it relates to natural gas usage by households, describes the methodology applied to CBA and LCCA, and provides findings and recommendations towards decisions to be made with regards to gasification and alternative energy sources.
USAID ENERGY PROGRAM Cost Estimation Study of Gas Pipeline Network and Alternative Systems for High-Mountainous Settlements of Georgia 7
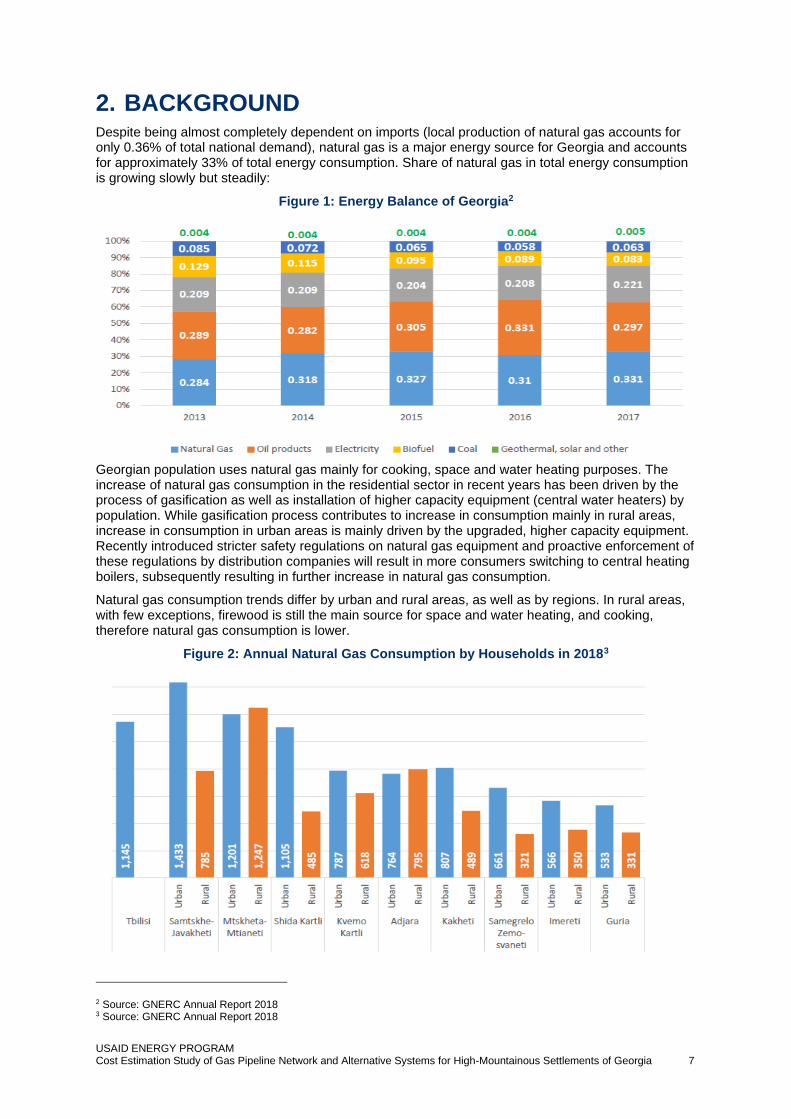
2. BACKGROUND Despite being almost completely dependent on imports (local production of natural gas accounts for only 0.36% of total national demand), natural gas is a major energy source for Georgia and accounts for approximately 33% of total energy consumption. Share of natural gas in total energy consumption is growing slowly but steadily:
Figure 1: Energy Balance of Georgia2
Georgian population uses natural gas mainly for cooking, space and water heating purposes. The increase of natural gas consumption in the residential sector in recent years has been driven by the process of gasification as well as installation of higher capacity equipment (central water heaters) by population. While gasification process contributes to increase in consumption mainly in rural areas, increase in consumption in urban areas is mainly driven by the upgraded, higher capacity equipment. Recently introduced stricter safety regulations on natural gas equipment and proactive enforcement of these regulations by distribution companies will result in more consumers switching to central heating boilers, subsequently resulting in further increase in natural gas consumption.
Natural gas consumption trends differ by urban and rural areas, as well as by regions. In rural areas, with few exceptions, firewood is still the main source for space and water heating, and cooking, therefore natural gas consumption is lower.
Figure 2: Annual Natural Gas Consumption by Households in 20183
2 Source: GNERC Annual Report 2018 3 Source: GNERC Annual Report 2018

USAID ENERGY PROGRAM Cost Estimation Study of Gas Pipeline Network and Alternative Systems for High-Mountainous Settlements of Georgia 8
As shown in Figure 2, Mtskheta-Mtianeti and Adjara are exceptions. The reasons behind this in Mtskheta-Mtianeti is that natural gas cost is subsidized by GoG, as well as the cold-climate and scarcity of firewood. As for Adjara, developed tourism is the main reason.
GoG has been moving the gasification process forward. In the last three years, number of households with access to natural gas has increased by 7.85% on average year-on-year, resulting in a total of 1,116,217 households with access to natural gas by 2018.
Figure 3: Number of Households with Access to Natural Gas
This escalating trend will continue as approximately 74,000 additional customers will have access to natural gas within the 2019-2021 period, according to GGTC and as stipulated by GoG decree.
As a result of GoG’s gasification efforts, Georgia has one of the highest levels of gasification in Europe.
Table 2: Level of Gasification in Various Countries
Country Number of households Number of households with access to gas Gasification level %
Georgia 1,235,000 1,116,217 90.3
Poland 14,465,800 7,000,000 48.4
Moldova 1,314,814 711,783 54.1
Ukraine 17,242,307 12,187,880 70.7
Slovenia 881,100 838,505 95.1
Turkey 2,3087,900 11,638,421 50.4
Romania 7,481,900 3,429,233 45.8
Latvia 850,100 443,600 52.2
Serbia 2,421,379 270,470 11.2
Despite the progressing gasification process, over 2,200 settlements in Georgia still do not have access to natural gas grids. GoG’s gasification efforts are motivated by the goal to provide access to reliable energy for all household throughout Georgia and alleviate energy poverty in the process, but other factors such as ability and willingness to pay hinder successful achievement of GoG’s goal in this regard. According to Georgian National Energy and Water Supply Regulatory Commission’s (GNERC) 2018 Annual Report, share of households with access to natural gas that do not consume it (non-active customers) is quite high:
1,021,621
1,116,217
1,196,926
8.47%
7.23%
900,000
950,000
1,000,000
1,050,000
1,100,000
1,150,000
1,200,000
1,250,000
2016 2017 2018
Households with natural gas access

USAID ENERGY PROGRAM Cost Estimation Study of Gas Pipeline Network and Alternative Systems for High-Mountainous Settlements of Georgia 9
Figure 4: Number of Active and Non-Active Customers in 20184
In addition to willingness and ability to pay, other factors such as abandoned and seasonal dwellings also contribute to the big number of non-active customers.
This is an important issue that must be considered when making the decision on gasification and when considering alternatives. This negative statistic is further compounded by the fact that under current legislation, customers only pay when they consume and there is no fixed component in the tariff, therefore denying the distribution licensees the ability to fully recover their costs.
Other important factor for consideration is environment - natural gas is a fossil fuel based energy carrier and has greater adverse impact on climate as compared to electricity derived from renewable sources, as is the case in Georgia, or other renewable sources like biomass, solar PV and heat pump. This point must also be taken into consideration when making the decision, as substituting fossil-based sources with renewable sources would be a positive step toward meeting Georgia’s international commitments to reducing Greenhouse Gas (GHG) emissions under the United Nations Framework Convention on Climate Change (UNFCCC) Paris Agreement, Low Emissions Development Strategy (LEDS), European Union’s (EU) Covenant of Mayors, etc.
Increasing dependence on natural gas imports in a generally volatile region is another major issue worthy of consideration that directly relates to Georgia’s energy security.
These issues, along with others, are the main reasons why GoG addressed USAID Energy Program to carry out CBA and provide analysis of alternative energy sources before moving forward with gasification of high-mountainous settlements.
4 Source: GNERC Annual Report 2018

USAID ENERGY PROGRAM Cost Estimation Study of Gas Pipeline Network and Alternative Systems for High-Mountainous Settlements of Georgia 10
3. METHODOLOGY Objective of this study, as set by MoESD was to carry out cost-benefit analysis of gasification for high-mountainous settlements (settlements) of Georgia, and where gasification was not deemed financially viable, propose alternatives. USAID Energy Program divided the analysis into two components: 1) Cost Benefit Analysis; and 2) Life-cycle Cost Analysis. The purpose of CBA was to evaluate financial viability of gasification through analysing such essential financial metrics as NPV, IRR and Payback Period (PB); potential impact on natural gas tariff was also evaluated. For the purpose of comparing alternatives, USAID Energy Program chose the LCCA method. LCCA allowed USAID Energy Program to capture all costs associated with installation and utilization of various technologies throughout the planning horizon, including cost of equipment with installation, replacement cost, operation and maintenance costs and energy costs required to run the equipment (if subsidization is required). The planning horizon was set at 35 years. Assumptions and inputs for CBA and LCCA are described in sub-chapters 3.1 and 3.2 of this section.
As the first step, USAID Energy Program needed to determine baselines in terms of gasification cost and energy consumption. Adequate estimates of the gasification costs were necessary to carry out an accurate CBA; to this end, USAID Energy Program in consultation with GGTC selected and subcontracted a local firm – Tsisferi Ali (the contractor) specializing in natural gas pipeline and network design and cost estimation. USAID Energy Program, together with the contractor and GGTC grouped the 966 settlements into their respective municipalities, creating 38 clusters. Table 3 below provides the list of clusters, number of settlements and population within each cluster.
Table 3: Municipal Clusters
Cluster Municipality Number of
Settlements Number of
Households
1 Dusheti 88 1,513
2 Mtskheta 6 186
3 Lentekhi 51 1,671
4 Oni 45 2,823
5 Aspindza 19 959
6 Ninotsminda 9 434
7 Dmanisi 20 718
8 Tetritskaro 35 1,563
9 Kaspi 10 831
10 Khashuri 6 69
11 Akhmeta 3 20
12 Ambrolauri 53 6,263
13 Marneuli 9 752
14 Tskaltubo 10 741
15 Gurjaani 3 37
16 Mestia 127 3,326
17 Sagarejo 11 385
18 Tianeti 37 818
19 Telavi 4 52
20 Kareli 7 192
21 Khulo 84 6,212
22 Tsageri 59 4,910
23 Gori 12 262
24 Kharagauli 9 847
25 Borjomi 5 595
26 Akhaltsikhe 18 1,280
27 Chiatura 13 3,352
28 Kazbegi Gasification undergoing
29 Khoni 4 161
30 Tsalka 37 3446
31 Khelvachauri 11 536
32 Akhalkalaki 76 192
33 Adigeni 26 865
34 Shuakhevi 53 3,425
35 Keda 58 3,112
36 Bolnisi 1 44

USAID ENERGY PROGRAM Cost Estimation Study of Gas Pipeline Network and Alternative Systems for High-Mountainous Settlements of Georgia 11
Cluster Municipality Number of
Settlements Number of
Households
37 Chokhatauri 3 349
38 Bagdati 1 208
However, as the cost-estimation effort was underway Kazbegi was dropped from the list, as it became evident that there was only one settlement in this municipality, which was already gasified, therefore the analyses were conducted for 37 clusters. The nature of estimating gas pipeline and network costs dictated that, costs for other, non-high-mountainous settlements, which were on the way to, and in the vicinity of subject settlements also needed to be calculated in order to accurately estimate all costs associated with connecting the settlements to gas network. As a result, cost-estimation was done for 1,171 settlements. The cost-estimation study provided schematic drawings of gas pipes including mains and local networks; technical parameters of the pipes including length, diameter and material; and cost estimates for gasification of each cluster including mains, connection points and local network costs, detailed to each settlement. A sample cost-estimation study can be viewed in Annex 1.
As for gas consumption numbers, they were derived from GNERC’s Annual Report from 2018 as shown in Figure 2 above, and CBA and LCCA calculations for each cluster were tailored according to the natural gas consumption figures in those regions where clusters are located.
Table 4: Estimated Annual Consumption for Each Cluster
3.1 COST BENEFIT ANALYSIS
An accurate CBA study needed the estimation of a total annual consumption in each cluster. Therefore, in addition to per household consumption provided in Table 4, the study incorporated the number of active households in each cluster. Respective data was collected from various sources. Data obtained from the Ministry of Infrastructure and Regional Development of Georgia (MRDI) comprised of both high and low mountainous settlements in all municipalities. Energo-Pro Georgia provided data on active consumers in each low and high mountain settlements for the last 24 months. This piece of information contributed to classification of seasonal consumers from all settlements and enabled the accurate calculation of active number of consumers in each municipality.
The two variables - average annual household consumption and the number of active consumers allowed the Program to calculate the expected gas consumption in all locations.
The multiplication of the number of active consumers by the annual gas consumption of one household reveals the total gas consumption in meter cubes for that particular municipality.
To identify the municipalities suitable for the gasification projects, both from the economic and financial perspectives, cost benefit analyses should be conducted for each location in view of installation cost (initial investment), cash inflows and outflows for each following year.
Based on available studies, the lifespan of gas pipeline is 35 years, therefore this number has been applied in the calculations.
Region - Average Annual Household
Consumption (m3)
Adjara 795 Guria 331 Imereti 350 Kakheti 489 Kvemo
Kartli618
Khulo Chokhataur Tskaltubo Akhmeta Dmanisi
Khelvachau Kharagauli Gurjaani Tetritskar
Shuakhevi Chiatura Sagarejo Marneuli
Keda Khoni Telavi Tsalka
Bagdati Bolnisi
Mtskheta-
Mtianeti1,247
Racha-
Lechkhumi
and Kvemo
Svaneti
400
Samegrelo-
Zemo
Svaneti
321Samtskhe-
Javakheti785
Shida
Kartli485
Dusheti Lentekhi Mestia Aspindza Kaspi
Mtskheta Oni Ninotsminda Khashuri
Tianeti Ambrolauri Borjomi Kareli
Tsageri Akhaltsikhe Gori
Akhalkalaki
Adigeni
Clusters within the region

USAID ENERGY PROGRAM Cost Estimation Study of Gas Pipeline Network and Alternative Systems for High-Mountainous Settlements of Georgia 12
For the purpose of comparative analysis and consistent comparison of municipalities different financial indicators were used: IRR, NPV, cost per consumer and payback period in combination with various assumptions.
The applied discount rate 13.5% was based on GNERC’s methodology for calculating the Weighted Average Cost of Capital (WACC) for gas projects; gas consumption for each municipality was calculated separately in line with the above provided methodology (consumption per household was taken from GNERC annual report which is different among municipalities and varies in the range of 321-1247 cubic meters per year); gasification tariff was taken 20 tetri for each cubic meter based on SOCAR Georgia and Saqorgaz tariffs, and we assumed the annual escalation of the tariff by 1%, maintenance cost per kilometre of gas pipeline per year was set at GEL 3,000 based on consultations with GNERC, natural gas demand annual growth rate was assumed at 5%, based on the approximate Gross Domestic Product (GDP) growth rate. Based on these assumptions IRR, NPV, cost per consumer and payback period were calculated for each municipality and compared, which enabled us to correctly asses each direction.
The main limitation of the study is time constraint. High mountain settlements are spread among 37 different municipalities and due to diverse geographical location, nature and climate conditions, etc. the above discussed variables will vary in all 37 municipalities. However, the shortage of time does not allow conduct separate research for each municipality.
Based on collected data the Program conducted cost benefit analysis separately for each municipality. The analysis process also included other villages located between high mountain settlements. In total 1,178 settlements were studied in which 973 are high mountain villages. There are 87,725 households in which 53,788 are from high mountain regions. We have different variables in our data: number of consumers, number of villages, instalment cost, length of the pipeline. All these variables were calculated separately for each municipality. The majority of variables are fixed, hence do not vary in municipalities: project duration, tariff, maintenance cost, discount rate, demand growth rate, tariff growth rate. Only gas consumption per household varies among municipalities due to climate conditions and other factors (in Mestia municipality electricity is free and in case of gasification demand on gas will be lower compared to other high mountainous parts of Georgia).
For accurate evaluation of different municipalities, the Program compared separate key parameters for each destination. IRR was applied for each location to evaluate the profitability of the project. “IRR is a metric used in capital budgeting to estimate the profitability of potential investments”. Another pivotal aspect NPV aided in investment assessment. (NPV) is the difference between the present value of cash inflows and the present value of cash outflows over a period of time. The Program also reviewed the payback period to find the breakeven point for each location. “The payback period refers to the amount of time it takes to recover the cost of an investment. Simply put, the payback period is the length of time an investment reaches a breakeven point”.
In addition to the key financial indicators, other basic variables have been applied in the study, since Gasification Study claims more comprehensive approach rather than sole focus on the financial ratios. Gasification of high mountain villages can be considered as a social project, with the focus on the number of consumers in each municipality, number of villages in each direction and an installation cost per consumer.
The combination of all variables will serve as a valuable input for the accurate assessment of investments in each municipality.
3.2 LIFE-CYCLE COST ANALYSIS
USAID Energy Program chose the LCCA method to compare cost-efficiency of various alternative energy sources to gasification. LCCA was deemed as the most suitable tool, as it enabled USAID Energy Program to capture all costs needed to purchase, own, operate, maintain and replace various technologies and/or services. Since the analysis was done at GoG’s request, all costs were analysed from GoG standpoint, i.e. how much would it cost the government to install, operate, maintain and replace the various alternatives over the 35-year period. The details of general assumptions based on which the LCCA model was built are described in section 3.2.1 below. The alternatives that were analysed are:
• CNG Virtual Pipeline
• Electricity Subsidies
• Biomass

USAID ENERGY PROGRAM Cost Estimation Study of Gas Pipeline Network and Alternative Systems for High-Mountainous Settlements of Georgia 13
• Solar PV with BESS
• Heat Pump o Grid-connected o Off-grid (powered by PV+BESS)
• Wood stoves
Description of each alternative, assumptions and calculations are provided in the respective sub-chapters of this chapter.
3.2.1 LCCA MODEL INPUTS AND ASSUMPTIONS
As the first step, USAID Energy Program needed to establish a baseline volume of energy required by households to meet their cooking, space and water heating demand. For this purpose, USAID Energy Program used the average annual natural gas consumption numbers provided in Table 4. Efficiency factor of 75% was used to derive required energy from consumption numbers, meaning that from every cubic meter of natural gas consumed, the households receive 0.75 cubic meters of usable energy. This assumption was based on the efficiency factors of the most widely used heating devices in Georgia: “Karma” individual space heater, individual water heaters and gas stoves. Efficiency factors for these devices vary from 87 to 95%, and 75% was used for calculations to account for system losses and based on consultations with MoESD. USAID Energy Program then calculated average annual required energy (cubic meters of natural gas) per household for each cluster:
Figure 5: Annual Energy Required per Household – M3
To make the process of comparing different technologies that use different sources of energy straightforward, USAID Energy Program converted the natural gas numbers into Kilowatt hours (kWh). The following coefficients were used to express one cubic meter of gas into kWh:
1 Cal = 4.19 J
1 Wh = 3,6 KJ
1 kWh = 3.6 MJ
1 MJ = 0.2778 kWh
Where:
• Cal = calorific value of m3 of natural gas
• J = Joules
• KJ = Kilo joules
• MJ = Mega joules
• kWh = Kilowatt hours
From these coefficients it follows that one Kilocalorie (Kcal) of gas equals 4.19 KJ, and since average calorific value of m3 of natural gas in Georgia is 8,495.25 Kcal5, one m3 of natural gas equals 35,595.10 KJ and equals 9.89 kWh (35,595.10 / 3.6 /1,000).
5 Source: GNERC Annual Report 2018
Region Required Energy - m3 of Natural Gas
Adjara 596
Guria 248
Imereti 263
Kakheti 367
Kvemo Kartli 464
Mtskheta - Mtianeti 935
Racha-Lechkhumi and Kvemo Svaneti 300
Samegrelo-Zemo Svaneti 241
Samtskhe Javakheti 589
Shida Kartli 364

USAID ENERGY PROGRAM Cost Estimation Study of Gas Pipeline Network and Alternative Systems for High-Mountainous Settlements of Georgia 14
Figure 6: Annual Energy Required per Household – kWh
As USAID Energy Program established the baseline figures, additional general assumptions were made to generate the LCCA model.
GENERAL ASSUMPTIONS
Planning Horizon: 35 Years All costs are calculated for the duration of planning horizon
USD/GEL exchange rate: 2.95 Used to calculate cost of various technologies, where relevant prices in Georgian Lari were not available
Energy carrier prices:
- Natural Gas 0.5694 GEL/m3 Current SOCAR tariff. Since all settlements are in the regions SOCAR tariff was deemed most suitable.
- Electricity 0.2273 GEL/kWh
Current Energo-Pro tariff. Since all settlements are in the regions Energo-Pro tariff was deemed most suitable.
- Biomass (wood logs) 100 GEL/m3 Current market price of air-dried wood logs in Georgia
For base case, USAID Energy Program assumed that GoG will fully subsidize household energy costs, except for those cases where an off-grid technology is installed. This assumption was predicated on the fact that majority of the settlements are high-mountainous rural settlements, with very poor economic conditions. Employment rate amongst high-mountainous population is only 22%. Main income for households is pension and government subsidies. Maximum monthly income for 35% of households is up to GEL 2506. USAID Energy Program developed an additional scenario where GoG does not provide subsidies (Scenario 2).
As for estimating the installation and maintenance cost of proposed alternatives, USAID Energy Program based them on local market prices, where available, and used international market prices, if the technologies were not available locally.
The formula to calculate the life cycle cost of each alternative is as follows: LCC = Installed cost + Replacement cost + (Operation and Maintenance (O&M) Cost + Energy cost) x Number of years
Where:
Installed cost is the total GEL amount required to purchase and install the equipment;
Replacement cost is the same as installed cost but is calculated only if useful life of a particular technology is less than the planning horizon. Replacement cost is proportioned to reflect the cost to be carried only within the planning horizon. For example, if a particular technology’s useful life is 20
6 Georgia’s High-mountainous Settlements Development Strategy 2019-2023
Region Required Energy - kWh
Adjara 5,897
Guria 2,455
Imereti 2,596
Kakheti 3,627
Kvemo Kartli 4,584
Mtskheta - Mtianeti 9,250
Racha-Lechkhumi and Kvemo Svaneti 2,967
Samegrelo-Zemo Svaneti 2,381
Samtskhe Javakheti 5,823
Shida Kartli 3,597
USAID ENERGY PROGRAM Cost Estimation Study of Gas Pipeline Network and Alternative Systems for High-Mountainous Settlements of Georgia 15
years, than replacement is required on the 21st year of utilization and the replacement cost is proportioned for the remaining years, in this case:15 (planning horizon – useful life, i.e. 35 – 20 = 15);
O&M Cost is annual operation and maintenance costs required to keep the equipment fully operational;
Energy cost is calculated only in case subsidization is required, i.e. if a particular alternative is either grid connected and requires subsidization of electricity, or if in case of biomass (Biomass boilers and woods stoves), GoG decides to cover the cost of the biomass itself, e.g. wood logs. If required, energy cost is calculated by multiplying the volume of required energy by the price of the respective energy carrier.
Number of years is the planning horizon, in our case 35 years.
The sum of annual O&M and Energy Costs is multiplied by the number of years in the planning horizon to get the full cost of operating and maintaining each alternative throughout 35 years.
The LCCA model allows changing of each variable to be able to accommodate virtually unlimited number of assumptions and scenarios.
USAID Energy Program made additional assumptions specific to each alternative, described below.
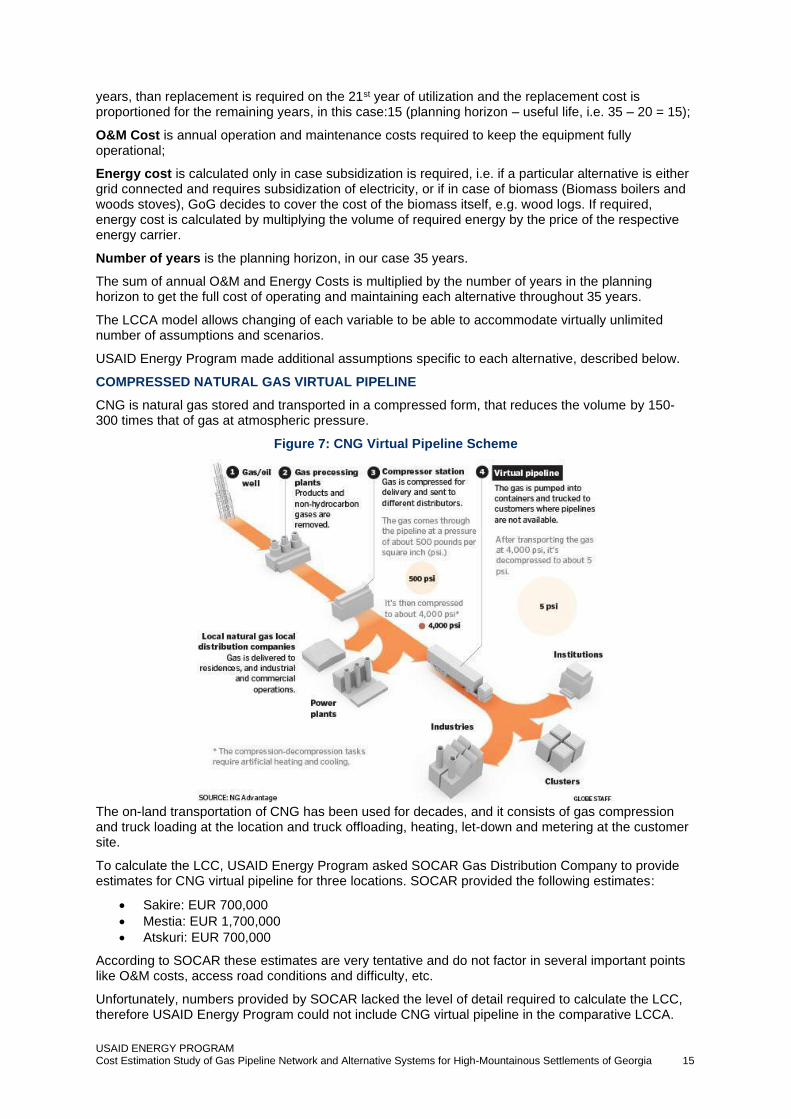
COMPRESSED NATURAL GAS VIRTUAL PIPELINE
CNG is natural gas stored and transported in a compressed form, that reduces the volume by 150-300 times that of gas at atmospheric pressure.
Figure 7: CNG Virtual Pipeline Scheme
The on-land transportation of CNG has been used for decades, and it consists of gas compression and truck loading at the location and truck offloading, heating, let-down and metering at the customer site.
To calculate the LCC, USAID Energy Program asked SOCAR Gas Distribution Company to provide estimates for CNG virtual pipeline for three locations. SOCAR provided the following estimates:
• Sakire: EUR 700,000
• Mestia: EUR 1,700,000
• Atskuri: EUR 700,000
According to SOCAR these estimates are very tentative and do not factor in several important points like O&M costs, access road conditions and difficulty, etc.
Unfortunately, numbers provided by SOCAR lacked the level of detail required to calculate the LCC, therefore USAID Energy Program could not include CNG virtual pipeline in the comparative LCCA.

USAID ENERGY PROGRAM Cost Estimation Study of Gas Pipeline Network and Alternative Systems for High-Mountainous Settlements of Georgia 16
ELECTRICITY SUBSIDIES
One of the widespread alternatives to natural gas for household consumption, is electricity. Even though electricity is more expensive to use for cooking, space and water heating purposes, it is more widely available throughout Georgia and will not require initial investment and time to cover the population’s energy needs. For the purpose of LCCA, USAID Energy Program assumed that instead of investing in gasification, GoG would fully subsidize the cost of electricity to households. To calculate the LCC, USAID Energy Program used the following assumptions and calculations:
Energy cost was calculated by multiplying the required volume of energy in kWh as indicated in Figure 6 above by 0.2273 GEL/kWh tariff.
Installed, replacement and O&M costs. Since electricity is accessible by majority of households, and it was assumed that GoG would not cover the cost of purchasing relevant household equipment, installed, replacement, and O&M costs were zeroed out.
As a result, the LCC of this alternative was calculated by simply multiplying annual energy cost by 35 (planning horizon). Despite this, electricity subsidies still came out as a more expensive alternative to gasification in 57% of the clusters in Scenario 1 and 68% in scenario 2.
BIOMASS BOILER
Biomass boilers can run at efficiencies of 90% and are commonly used to meet households’ hot water and heating needs. Biomass boilers are much more efficient than traditional wood stoves and can be operated unaided for extended periods of time therefore making it a more sensible choice for households. Moreover, biomass boilers increase comfort-level of households by being able to power central space and water heating systems, as opposed to wood stoves.
Biomass boilers can operate on all kinds of biomass. Biomass is any biological material that is used as fuel. Wood and its byproducts, leaves, plant-based biomass, agricultural waste and dried animal dung all belong to biomass fuels. Directly burning wood produces air polluting substances such as carbon dioxide and soot, therefore it is preferred to process biomass before burning it. There are different types of wood biomass products such as wood pellets, briquettes and wood chips which are pressed and given shape for easier transportation, storage and better heating qualities. For the purpose of LCCA, USAID Energy Program assumed that majority of households will be using most widely spread type of biomass in Georgia – wood logs.
To calculate the LCC, USAID Energy Program used the following assumptions and calculations:
Installed Cost was determined by calculating required installed capacity of the boiler (expressed in kW). To do so, USAID Energy Program analysed local and international cases: Department of Energy and Climate Change of UK completed an extensive survey of biomass boilers in the UK, and provided actual outputs of biomass boilers in various capacity bands:
Table 5: Average Annual Output of Biomass Boilers
The numbers in Table 5 above are actual produced energy documented through a survey in UK, therefore all system losses are considered.
Although the overall average output per kW came out to 1,530 kWh, lower capacity boilers seem to be less efficient, therefore we used an average number of the 1-44 kW capacity band – 1,138 kWh per kW installed for our calculations. For additional certainty a biomass boiler installed in Georgia’s Pshaveli Village at local Kindergarten (a 600 m2 building) was analysed as well. In this case, claimed annual output of the installed 60 kW capacity boiler is 72,000 kWh, which comes out to an output of 1,200 kWh per installed kW and is in line with our assumption. The required energy for each cluster
Capacity Band (range) Boiler Installed Capacity (kW) Mean Annual Heat Output (kWh) Average output Per kW Installed (kWh)
1‐44 kW 30 34,136 1,138
101‐150 kW 132 157,248 1,191
151‐199 kW 191 313,848 1,643
200‐400 kW 326 349,724 1,073
401‐600 kW 510 945,816 1,855
601‐800 kW 746 1,120,844 1,502
801‐1000 kW 942 2,171,380 2,305
Overall average 1,530
USAID ENERGY PROGRAM Cost Estimation Study of Gas Pipeline Network and Alternative Systems for High-Mountainous Settlements of Georgia 17
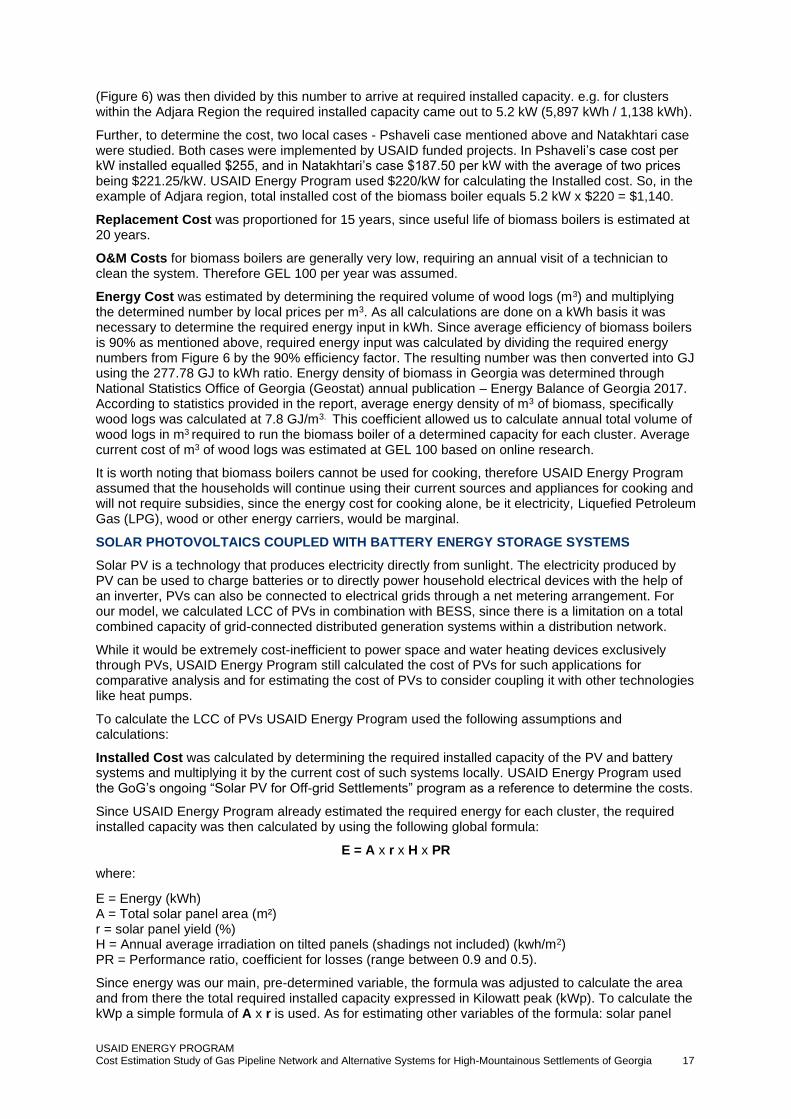
(Figure 6) was then divided by this number to arrive at required installed capacity. e.g. for clusters within the Adjara Region the required installed capacity came out to 5.2 kW (5,897 kWh / 1,138 kWh).
Further, to determine the cost, two local cases - Pshaveli case mentioned above and Natakhtari case were studied. Both cases were implemented by USAID funded projects. In Pshaveli’s case cost per kW installed equalled $255, and in Natakhtari’s case $187.50 per kW with the average of two prices being $221.25/kW. USAID Energy Program used $220/kW for calculating the Installed cost. So, in the example of Adjara region, total installed cost of the biomass boiler equals 5.2 kW x $220 = $1,140.
Replacement Cost was proportioned for 15 years, since useful life of biomass boilers is estimated at 20 years.
O&M Costs for biomass boilers are generally very low, requiring an annual visit of a technician to clean the system. Therefore GEL 100 per year was assumed.
Energy Cost was estimated by determining the required volume of wood logs (m3) and multiplying the determined number by local prices per m3. As all calculations are done on a kWh basis it was necessary to determine the required energy input in kWh. Since average efficiency of biomass boilers is 90% as mentioned above, required energy input was calculated by dividing the required energy numbers from Figure 6 by the 90% efficiency factor. The resulting number was then converted into GJ using the 277.78 GJ to kWh ratio. Energy density of biomass in Georgia was determined through National Statistics Office of Georgia (Geostat) annual publication – Energy Balance of Georgia 2017. According to statistics provided in the report, average energy density of m3 of biomass, specifically wood logs was calculated at 7.8 GJ/m3. This coefficient allowed us to calculate annual total volume of wood logs in m3 required to run the biomass boiler of a determined capacity for each cluster. Average current cost of m3 of wood logs was estimated at GEL 100 based on online research.
It is worth noting that biomass boilers cannot be used for cooking, therefore USAID Energy Program assumed that the households will continue using their current sources and appliances for cooking and will not require subsidies, since the energy cost for cooking alone, be it electricity, Liquefied Petroleum Gas (LPG), wood or other energy carriers, would be marginal.
SOLAR PHOTOVOLTAICS COUPLED WITH BATTERY ENERGY STORAGE SYSTEMS
Solar PV is a technology that produces electricity directly from sunlight. The electricity produced by PV can be used to charge batteries or to directly power household electrical devices with the help of an inverter, PVs can also be connected to electrical grids through a net metering arrangement. For our model, we calculated LCC of PVs in combination with BESS, since there is a limitation on a total combined capacity of grid-connected distributed generation systems within a distribution network.
While it would be extremely cost-inefficient to power space and water heating devices exclusively through PVs, USAID Energy Program still calculated the cost of PVs for such applications for comparative analysis and for estimating the cost of PVs to consider coupling it with other technologies like heat pumps.
To calculate the LCC of PVs USAID Energy Program used the following assumptions and calculations:
Installed Cost was calculated by determining the required installed capacity of the PV and battery systems and multiplying it by the current cost of such systems locally. USAID Energy Program used the GoG’s ongoing “Solar PV for Off-grid Settlements” program as a reference to determine the costs.
Since USAID Energy Program already estimated the required energy for each cluster, the required installed capacity was then calculated by using the following global formula:
E = A x r x H x PR
where:
E = Energy (kWh) A = Total solar panel area (m²) r = solar panel yield (%) H = Annual average irradiation on tilted panels (shadings not included) (kwh/m2) PR = Performance ratio, coefficient for losses (range between 0.9 and 0.5).
Since energy was our main, pre-determined variable, the formula was adjusted to calculate the area and from there the total required installed capacity expressed in Kilowatt peak (kWp). To calculate the kWp a simple formula of A x r is used. As for estimating other variables of the formula: solar panel

USAID ENERGY PROGRAM Cost Estimation Study of Gas Pipeline Network and Alternative Systems for High-Mountainous Settlements of Georgia 18
yield was estimated at 19% (referencing the GoG program mentioned above), Annual average irradiation was estimated for each cluster by referencing the irradiation map of Georgia:
Figure 8: Irradiation Map of Georgia7
PR was estimated at 0.75 with details of estimated losses as follows:
- Inverter losses: 8% - Temperature losses: 8% - DC cable losses: 2% - Ac cable losses: 2% - Shadings: 3% - Losses, weak irradiation: 3% - Losses, dust, snow: 2%
With all variables in places, USAID Energy Program calculated total required installed capacity for each cluster and multiplied it by the price of $3,300 per installed kW of PV modules and BESS. As mentioned above the price was taken from GoG’s ongoing program, therefore it should be reflective of realistic and up to date prices of such systems locally.
Replacement Cost was proportioned for 10 years, since useful life of PV system is estimated at 25 years.
O&M Costs were set at zero, as USAID Energy Program assumed that households will be cleaning the PV modules themselves and will not encounter any breakdowns.
Energy costs were also set at zero, as PV + BESS systems are autonomous off-grid systems and do not require energy input from outside sources to run.
HEAT PUMP
Heat Pump is a highly efficient device that works on refrigeration cycle to transfer thermal energy from environment such as ground, air and water to a desired destination. A simplified heat pump consists of a condenser, expansion valve, evaporator and a compressor. There are several types of heat
7 Source: Solargis.com
USAID ENERGY PROGRAM Cost Estimation Study of Gas Pipeline Network and Alternative Systems for High-Mountainous Settlements of Georgia 19
pumps that are mainly differentiated by the source where they take the heat from – the main types of heat pumps are air-source, geothermal (ground-source) and water source.
For this study, USAID Energy Program concentrated on air-source heat pumps, specifically air to water type. Although ground and water-source heat pumps may be slightly more efficient in some cases, the cost of these type of heat pumps is very high, since their installation requires ground works, and therefore is very cost-inefficient for households.
Air to water heat pumps take heat from the outside air and transfer it to a water-based system. The created heat can be used for space heating or as a hot water supply for the house. Air to water heat pumps are among the most efficient air source heat pumps on the market. Their Coefficient of Performance (CoP) ranges from 200% to 420%, meaning that for every 1 kW consumed the heat pump outputs anywhere from 2kW to 4.2 kW energy. This type of heat pump works best in moderate climates. The efficiency of an air to water heat pump is most optimal at 7°C, as opposed to dry and cold locations, where outside temperatures fall below -20°C. Keeping the working principles of an air to water heat pump in mind, the decline in temperatures will affect the coefficient of performance.
USAID Energy Program considered two cases for heat pumps, grid connected, and PV powered. Grid connected heat pumps draw required power from electricity grids, whereas in case of PV-powered heat pumps PV modules and batteries will also be installed to power the heat pump.
To calculate the LCC USAID Energy Program used the following assumptions and calculations:
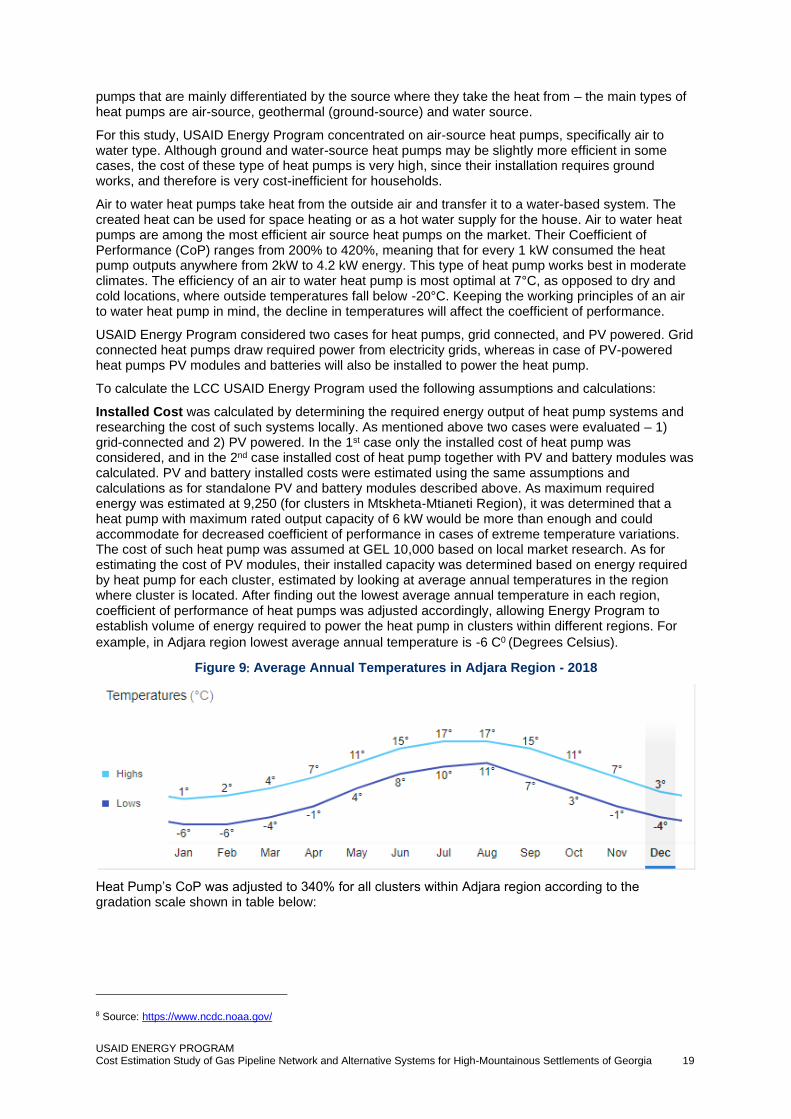
Installed Cost was calculated by determining the required energy output of heat pump systems and researching the cost of such systems locally. As mentioned above two cases were evaluated – 1) grid-connected and 2) PV powered. In the 1st case only the installed cost of heat pump was considered, and in the 2nd case installed cost of heat pump together with PV and battery modules was calculated. PV and battery installed costs were estimated using the same assumptions and calculations as for standalone PV and battery modules described above. As maximum required energy was estimated at 9,250 (for clusters in Mtskheta-Mtianeti Region), it was determined that a heat pump with maximum rated output capacity of 6 kW would be more than enough and could accommodate for decreased coefficient of performance in cases of extreme temperature variations. The cost of such heat pump was assumed at GEL 10,000 based on local market research. As for estimating the cost of PV modules, their installed capacity was determined based on energy required by heat pump for each cluster, estimated by looking at average annual temperatures in the region where cluster is located. After finding out the lowest average annual temperature in each region, coefficient of performance of heat pumps was adjusted accordingly, allowing Energy Program to establish volume of energy required to power the heat pump in clusters within different regions. For
example, in Adjara region lowest average annual temperature is -6 C0 (Degrees Celsius).
Figure 9: Average Annual Temperatures in Adjara Region - 2018
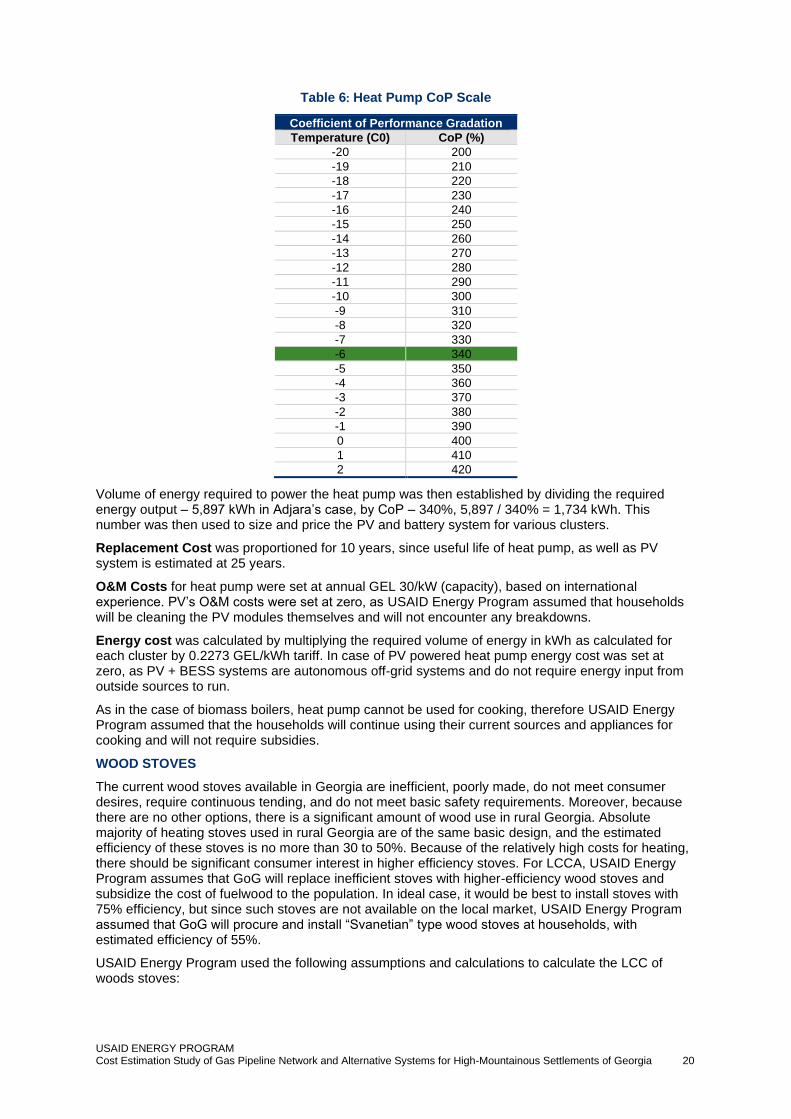
Heat Pump’s CoP was adjusted to 340% for all clusters within Adjara region according to the gradation scale shown in table below:
8 Source: https://www.ncdc.noaa.gov/
USAID ENERGY PROGRAM Cost Estimation Study of Gas Pipeline Network and Alternative Systems for High-Mountainous Settlements of Georgia 20
Table 6: Heat Pump CoP Scale
Coefficient of Performance Gradation
Temperature (C0) CoP (%)
-20 200
-19 210
-18 220
-17 230
-16 240
-15 250
-14 260
-13 270
-12 280
-11 290
-10 300
-9 310
-8 320
-7 330
-6 340
-5 350
-4 360
-3 370
-2 380
-1 390
0 400
1 410
2 420
Volume of energy required to power the heat pump was then established by dividing the required energy output – 5,897 kWh in Adjara’s case, by CoP – 340%, 5,897 / 340% = 1,734 kWh. This number was then used to size and price the PV and battery system for various clusters.
Replacement Cost was proportioned for 10 years, since useful life of heat pump, as well as PV system is estimated at 25 years.
O&M Costs for heat pump were set at annual GEL 30/kW (capacity), based on international experience. PV’s O&M costs were set at zero, as USAID Energy Program assumed that households will be cleaning the PV modules themselves and will not encounter any breakdowns.
Energy cost was calculated by multiplying the required volume of energy in kWh as calculated for each cluster by 0.2273 GEL/kWh tariff. In case of PV powered heat pump energy cost was set at zero, as PV + BESS systems are autonomous off-grid systems and do not require energy input from outside sources to run.
As in the case of biomass boilers, heat pump cannot be used for cooking, therefore USAID Energy Program assumed that the households will continue using their current sources and appliances for cooking and will not require subsidies.
WOOD STOVES
The current wood stoves available in Georgia are inefficient, poorly made, do not meet consumer desires, require continuous tending, and do not meet basic safety requirements. Moreover, because there are no other options, there is a significant amount of wood use in rural Georgia. Absolute majority of heating stoves used in rural Georgia are of the same basic design, and the estimated efficiency of these stoves is no more than 30 to 50%. Because of the relatively high costs for heating, there should be significant consumer interest in higher efficiency stoves. For LCCA, USAID Energy Program assumes that GoG will replace inefficient stoves with higher-efficiency wood stoves and subsidize the cost of fuelwood to the population. In ideal case, it would be best to install stoves with 75% efficiency, but since such stoves are not available on the local market, USAID Energy Program assumed that GoG will procure and install “Svanetian” type wood stoves at households, with estimated efficiency of 55%.
USAID Energy Program used the following assumptions and calculations to calculate the LCC of woods stoves:

USAID ENERGY PROGRAM Cost Estimation Study of Gas Pipeline Network and Alternative Systems for High-Mountainous Settlements of Georgia 21
Installed Cost is the cost of procuring the Svanetian type wood stove. Online research of local market showed that such wood stoves cost GEL 450 on average.
Replacement Cost was proportioned for 20 years, since useful life of a wood stove is estimated at 15 years.
O&M Costs were set at zero, as wood stoves require almost no maintenance and rarely break down.
Energy Cost was estimated by determining the required volume of wood logs (m3) and multiplying the determined number by local prices per m3. Same method was applied here as in the case of biomass boilers. Average current cost of m3 of wood logs was estimated at GEL 100 based on online research.
It is worth noting that although wood stove is the lowest cost option, even if cost of fuelwood is fully subsidized by GoG, wood stove provides very low level of comfort, cannot be used to centrally heat space and water and is generally the least attractive option in terms of comfort and safety.

USAID ENERGY PROGRAM Cost Estimation Study of Gas Pipeline Network and Alternative Systems for High-Mountainous Settlements of Georgia 22
4. FINDINGS AND RECOMMENDATIONS
Based on the assumptions and calculations described above, USAID Energy Program developed CBA and LCCA models. The results and findings of the analyses are provided below.
4.1 CBA FINDINGS
The main purpose of this study was to conduct the cost-benefit analysis for high-mountainous settlements. Due to complex landscape of Georgia, there are many settlements located on the way to, or in the vicinity of high-mountainous settlements.
The construction of gas pipeline in high mountainous settlements will require passage through certain low mountainous settlements as well. As noted above, Gasification project is of a social character, therefore avoidance of settlements located in the vicinity of high mountain villages is inappropriate. In addition, the gasification of low mountain villages is justified by cost benefit analysis. Data assessment showed that it will decrease the gasification cost per consumer in 29 municipalities (out of 37) and increases the IRR in 36 municipalities (out of 37). This study also calculated the NPVs for each municipality which remains negative in both cases of high and low mountainous settlements.
It should be mentioned that a big portion of gasification cost is fixed, which includes the construction of the main pipeline directed to that municipality (In Mestia municipality cost of the building pipeline from Zugdidi to Mestia is 72% of the whole cost and in Tskaltubo municipality respective share of the cost is 80%) . An increased number of consumers within municipality decreases cost per consumer due to economies of scale and increases IRR of the project.
Figure 10: NPV by Cluster
-12.0 -9.9
-4.8 -22.4
-2.7 -9.9
-1.9 -13.5
-6.7 -1.3
-3.9 -2.1
-26.5 -23.3
-34.4 -35.7
-5.1 -5.3
-9.9 -25.5
-48.0 -106.4
-11.2 -2.8 -3.2
-5.0 -16.4
-28.9 -2.1
-41.8 -4.2
-21.6 -16.2
-28.3 -5.3
-34.7
-120.0 -100.0 -80.0 -60.0 -40.0 -20.0 -
Aspindza
Akhalcikhe
Borjomi
Chiatura
Choxatauri
Dmanisi
Gurjaani
Axalqalaqi
Marneuli
Mtskheta
Ninotsminda
Telavi
Tsalka
Tetritskaro
Shuaxevi
Dusheti
Axmeta
Sagarejo
Xelvachauri
Qeda
Xulo
Mestia
Adigeni
Xashuri
Qareli
Kaspi
Tianeti
Ambrolauri
Bagdati
Cageri
Gori
Lentexi
Oni
Tskaltubo
Xoni
Xaragauli
NPV in millions GEL
USAID ENERGY PROGRAM Cost Estimation Study of Gas Pipeline Network and Alternative Systems for High-Mountainous Settlements of Georgia 23
The graph above demonstrates the NPVs of gasification projects which remain negative for all municipalities. On average NPV is minus GEL 18 million for one municipality, while for Mestia municipality, it accounts for -106.4 million and for Mtksheta -1.3 million.
Based on the NPV analysis the project does not seem lucrative, unless the projects are separately considered as private investment projects. The results prove that the projects are not commercially viable and only in 7 municipalities investor will lose less than 5 million.
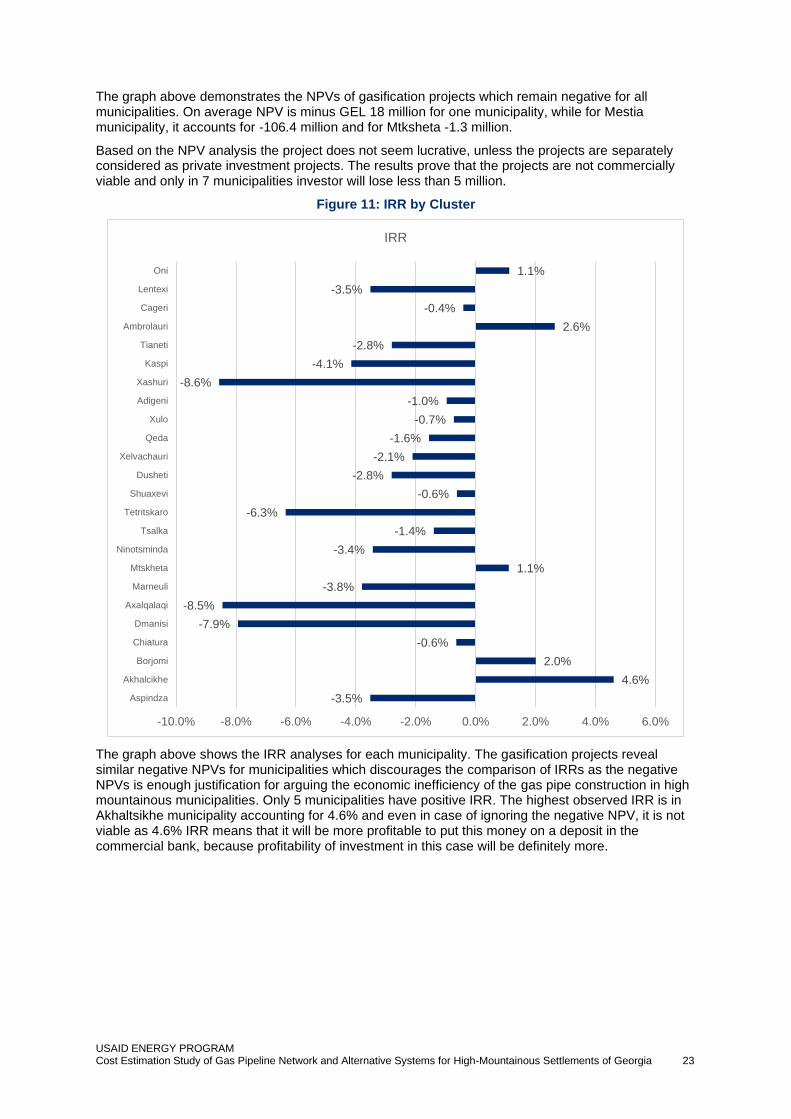
Figure 11: IRR by Cluster
The graph above shows the IRR analyses for each municipality. The gasification projects reveal similar negative NPVs for municipalities which discourages the comparison of IRRs as the negative NPVs is enough justification for arguing the economic inefficiency of the gas pipe construction in high mountainous municipalities. Only 5 municipalities have positive IRR. The highest observed IRR is in Akhaltsikhe municipality accounting for 4.6% and even in case of ignoring the negative NPV, it is not viable as 4.6% IRR means that it will be more profitable to put this money on a deposit in the commercial bank, because profitability of investment in this case will be definitely more.
-3.5%
4.6%
2.0%
-0.6%
-7.9%
-8.5%
-3.8%
1.1%
-3.4%
-1.4%
-6.3%
-0.6%
-2.8%
-2.1%
-1.6%
-0.7%
-1.0%
-8.6%
-4.1%
-2.8%
2.6%
-0.4%
-3.5%
1.1%
-10.0% -8.0% -6.0% -4.0% -2.0% 0.0% 2.0% 4.0% 6.0%
Aspindza
Akhalcikhe
Borjomi
Chiatura
Dmanisi
Axalqalaqi
Marneuli
Mtskheta
Ninotsminda
Tsalka
Tetritskaro
Shuaxevi
Dusheti
Xelvachauri
Qeda
Xulo
Adigeni
Xashuri
Kaspi
Tianeti
Ambrolauri
Cageri
Lentexi
Oni
IRR
USAID ENERGY PROGRAM Cost Estimation Study of Gas Pipeline Network and Alternative Systems for High-Mountainous Settlements of Georgia 24
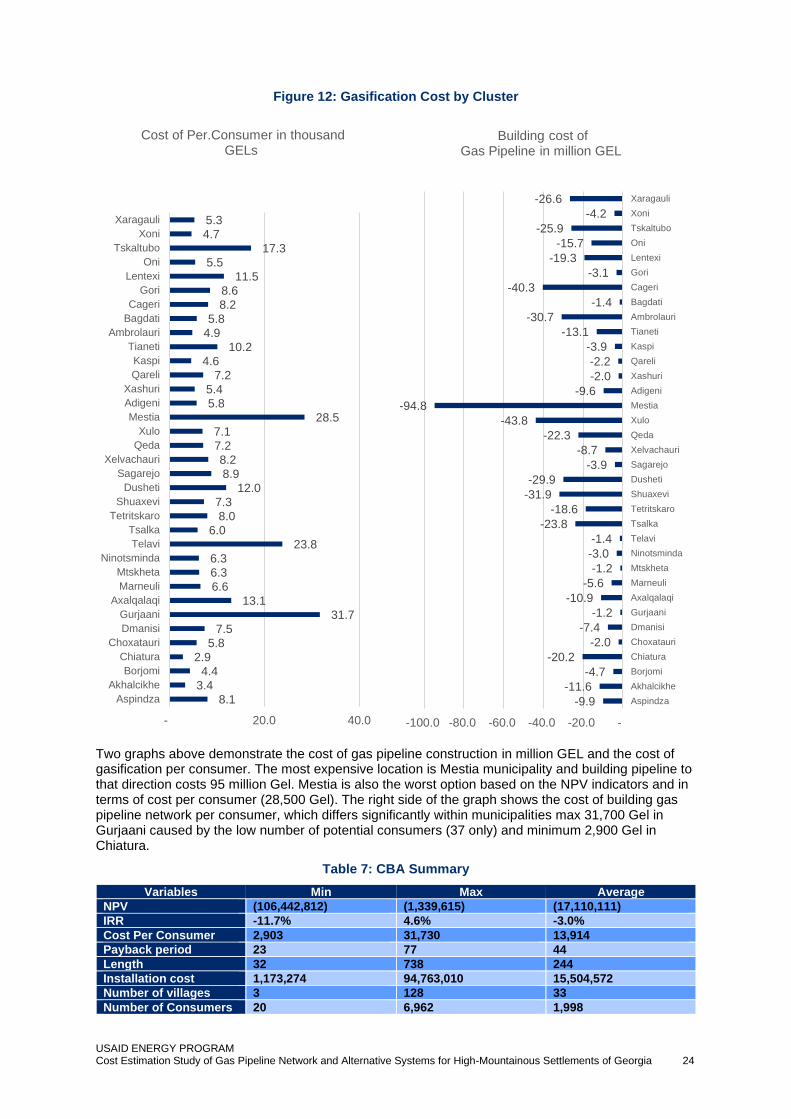
Figure 12: Gasification Cost by Cluster
Two graphs above demonstrate the cost of gas pipeline construction in million GEL and the cost of gasification per consumer. The most expensive location is Mestia municipality and building pipeline to that direction costs 95 million Gel. Mestia is also the worst option based on the NPV indicators and in terms of cost per consumer (28,500 Gel). The right side of the graph shows the cost of building gas pipeline network per consumer, which differs significantly within municipalities max 31,700 Gel in Gurjaani caused by the low number of potential consumers (37 only) and minimum 2,900 Gel in Chiatura.
Table 7: CBA Summary
Variables Min Max Average
NPV (106,442,812) (1,339,615) (17,110,111)
IRR -11.7% 4.6% -3.0%
Cost Per Consumer 2,903 31,730 13,914
Payback period 23 77 44
Length 32 738 244
Installation cost 1,173,274 94,763,010 15,504,572
Number of villages 3 128 33
Number of Consumers 20 6,962 1,998
8.1
3.4
4.4
2.9
5.8
7.5
31.7
13.1
6.6
6.3
6.3
23.8
6.0
8.0
7.3
12.0
8.9
8.2
7.2
7.1
28.5
5.8
5.4
7.2
4.6
10.2
4.9
5.8
8.2
8.6
11.5
5.5
17.3
4.7
5.3
- 20.0 40.0
Aspindza
Akhalcikhe
Borjomi
Chiatura
Choxatauri
Dmanisi
Gurjaani
Axalqalaqi
Marneuli
Mtskheta
Ninotsminda
Telavi
Tsalka
Tetritskaro
Shuaxevi
Dusheti
Sagarejo
Xelvachauri
Qeda
Xulo
Mestia
Adigeni
Xashuri
Qareli
Kaspi
Tianeti
Ambrolauri
Bagdati
Cageri
Gori
Lentexi
Oni
Tskaltubo
Xoni
Xaragauli
Cost of Per.Consumer in thousand GELs
-9.9
-11.6
-4.7
-20.2
-2.0
-7.4
-1.2
-10.9
-5.6
-1.2
-3.0
-1.4
-23.8
-18.6
-31.9
-29.9
-3.9
-8.7
-22.3
-43.8
-94.8
-9.6
-2.0
-2.2
-3.9
-13.1
-30.7
-1.4
-40.3
-3.1
-19.3
-15.7
-25.9
-4.2
-26.6
-100.0 -80.0 -60.0 -40.0 -20.0 -
Aspindza
Akhalcikhe
Borjomi
Chiatura
Choxatauri
Dmanisi
Gurjaani
Axalqalaqi
Marneuli
Mtskheta
Ninotsminda
Telavi
Tsalka
Tetritskaro
Shuaxevi
Dusheti
Sagarejo
Xelvachauri
Qeda
Xulo
Mestia
Adigeni
Xashuri
Qareli
Kaspi
Tianeti
Ambrolauri
Bagdati
Cageri
Gori
Lentexi
Oni
Tskaltubo
Xoni
Xaragauli
Building cost of Gas Pipeline in million GEL

USAID ENERGY PROGRAM Cost Estimation Study of Gas Pipeline Network and Alternative Systems for High-Mountainous Settlements of Georgia 25
The table above shows the summary of each variable for all 37 municipalities. The worst-case scenario is building the gas pipeline towards the Mestia municipality, with NPV negative 106.4 mln GEL. The best direction for building the gas pipeline is Mtskheta municipality with NPV 1.4 mln GEL. This is attributed to the lowest length of pipeline which might be built in Mtskheta Municipality and by the highest consumption of gas per consumer in this location (1247 cube meters per family during year). The IRR on average is negative 3% and even the highest IRR, positive 4.6% is not acceptable due to its low profitability. The Lowest cost per consumer is in Chiatura GEL 2,903, the shortest payback period is 23 year for Akhaltsikhe municipality, and the shortest length of building pipeline is in Telavi.
It is evident from the graph, that we have municipalities with 128 settlements (Mestia) and municipalities with 3 villages (Gurjaani). This can be explained by the total absence of gas in Mestia. As for Gurjaani only three villages are left without gas, In Chiatura, Khulo and Ambrolauri have 6,962; 6,212 and 6,293 potential consumers while in Akhmeta there are only 20 households.
As shown by the analysis, NPV is negative for each municipality and therefore gasification cannot be deemed as a viable project purely from economic and financial standpoint. When calculated based on SOCAR Georgia’s current distribution tariff of 20 Tetri/m3, annual revenue inflows are less than cash outflows (operational and maintenance expenses). Table 8 below shows distribution tariff at which NPV becomes zero for each municipality.
Table 8: Distribution Tariff at Which NPV Becomes Zero
Municipality Needed Tariff Municipality Needed Tariff Municipality Needed Tariff
Aspindza 1.22 Tetritskaro 1.54 Tianeti 1.04
Akhaltsikhe 0.50 Shuakhevi 1.02 Ambrolauri 0.67
Borjomi 0.67 Dusheti 1.14 Bagdati 2.19
Chiatura 0.96 Akhmeta 43.0 Tsageri 1.08
Chokhatauri 2.12 Sagarejo 2.26 Gori 2.18
Dmanisi 1.52 Khelvachauri 1.17 Lentekhi 1.53
Gurjaani 8.64 Keda 1.05 Oni 0.79
Akhalkalaki 1.90 Khulo 1.00 Tskaltubo 4.63
Marneuli 1.26 Mestia 8.39 Khoni 1.63
Mtskheta 0.67 Adigeni 0.91 Kharagauli 1.84
Ninotsminda 1.05 Khashuri 1.46 Bolnisi 0.89
Telavi 5.98 Kareli 2.00
Tsalka 1.09 Kaspi 1.20
As Table 8 shows there are outlier municipalities where gas distribution tariff should equal 43 GEL/m3 (Akhmeta) and 8.64 GEL/m3 (Gurjaani). Best case scenario is Akhaltsikhe Municipality where tariff should increase to 50 Tetri/m3, but even in this case tariff increase constitutes 150% over the current tariff.
Same analysis conducted cumulatively for all 37 municipalities, shows that gas distribution tariff which will make cumulative NPV equal to zero, and the gasification project for all 37 municipalities financially acceptable is 1.265 GEL instead of current 0.2 GEL (constituting a 533% tariff increase).
ANALYSIS OF IMPACTS ON NATURAL GAS DISTRIBUTION TARIFFS FOR DIFFERENT SCENARIOS
Obtaining economic and technical data of high mountainous settlements without access to gas distribution made it possible to analyse different scenarios of impact on the current natural gas tariffs. Likely scenarios were provided by the MoESD, analysis about the impact was prepared by Georgian National Energy and Water Supply Regulatory Commission. Based on methodology of natural gas distribution approved by GNERC as well as “SOCAR Georgia Gas” Ltd and JSC “Saqorggas” tariffs information, it was possible to analyse 4 theoretical scenarios. All 4 scenarios consider transfer/sale of property with different conditions by “SOCAR Georgia Gas” Ltd and JSC “Saqorggas” to the high mountainous settlements. Brief description of each scenario and impact on natural gas distribution tariffs9 is provided below:
9 Weighted average tariff of SOCAR Georgia Gas and Saqorggas.
USAID ENERGY PROGRAM Cost Estimation Study of Gas Pipeline Network and Alternative Systems for High-Mountainous Settlements of Georgia 26
Scenario 1: In case “SOCAR Georgia Gas” Ltd and JSC “Saqorggas” were to receive constructed grid free of charge, natural gas distribution tariff would increase by approximately 2 tetri per 1 m3.
Scenario 2: In case “SOCAR Georgia Gas” Ltd and JSC “Saqorggas” were to buy the grid (cost of 558 mil. Lari) natural gas distribution tariff in their licensing area would increase by approximately 14.7 tetri per 1 m3.
Scenario 3: In case “SOCAR Georgia Gas” Ltd and JSC “Saqorggas” were to receive constructed grid with lease (14 mil. Lari per year, 40-year lease) natural gas distribution tariff in their licensing area would increase by approximately 4 tetri per 1 m3.
Scenario 4: In case “SOCAR Georgia Gas” Ltd and JSC “Saqorggas” were to purchase the grid in portions (14 mil. Lari per year, within 40 years) natural gas distribution tariff in their licensing area would increase by approximately 2.4 tetri per 1 m3 for the first year, while increasing by 0.32 tetri per 1 m3 for each of the following years.
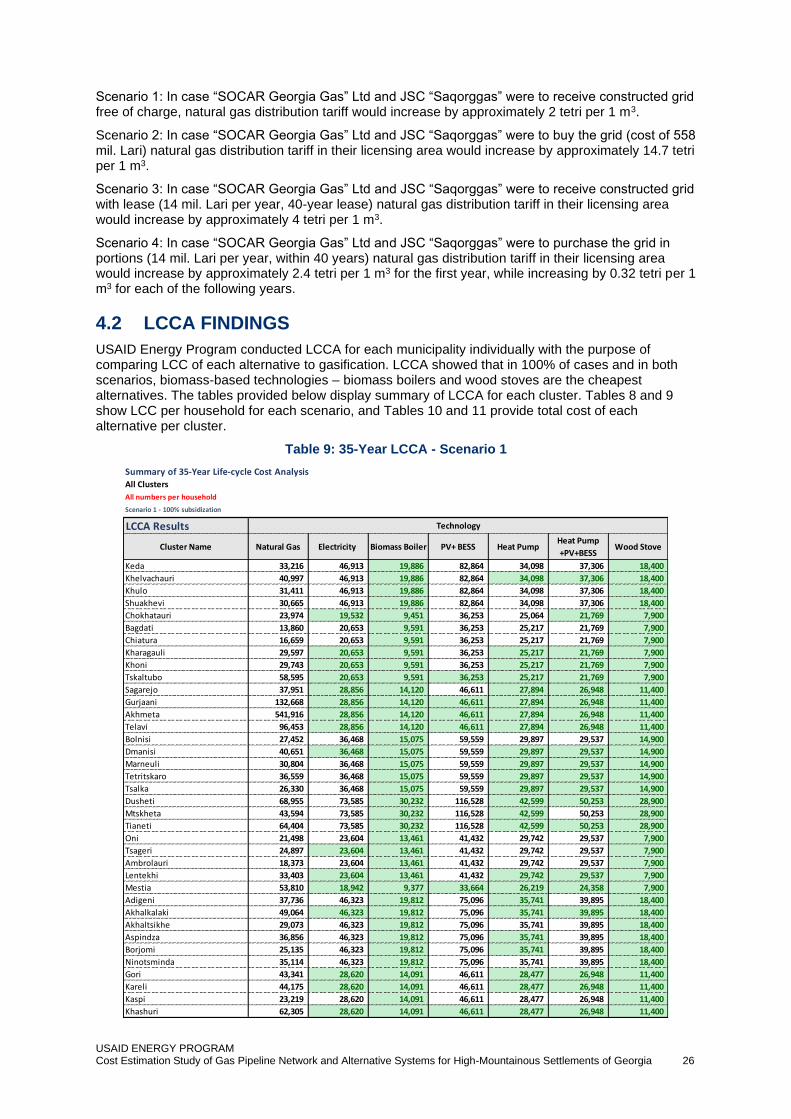
4.2 LCCA FINDINGS
USAID Energy Program conducted LCCA for each municipality individually with the purpose of comparing LCC of each alternative to gasification. LCCA showed that in 100% of cases and in both scenarios, biomass-based technologies – biomass boilers and wood stoves are the cheapest alternatives. The tables provided below display summary of LCCA for each cluster. Tables 8 and 9 show LCC per household for each scenario, and Tables 10 and 11 provide total cost of each alternative per cluster.
Table 9: 35-Year LCCA - Scenario 1
Summary of 35-Year Life-cycle Cost AnalysisAll Clusters
All numbers per household
Scenario 1 - 100% subsidization
LCCA Results
Cluster Name Natural Gas Electricity Biomass Boiler PV+ BESS Heat PumpHeat Pump
+PV+BESSWood Stove
Keda 33,216 46,913 19,886 82,864 34,098 37,306 18,400
Khelvachauri 40,997 46,913 19,886 82,864 34,098 37,306 18,400
Khulo 31,411 46,913 19,886 82,864 34,098 37,306 18,400
Shuakhevi 30,665 46,913 19,886 82,864 34,098 37,306 18,400
Chokhatauri 23,974 19,532 9,451 36,253 25,064 21,769 7,900
Bagdati 13,860 20,653 9,591 36,253 25,217 21,769 7,900
Chiatura 16,659 20,653 9,591 36,253 25,217 21,769 7,900
Kharagauli 29,597 20,653 9,591 36,253 25,217 21,769 7,900
Khoni 29,743 20,653 9,591 36,253 25,217 21,769 7,900
Tskaltubo 58,595 20,653 9,591 36,253 25,217 21,769 7,900
Sagarejo 37,951 28,856 14,120 46,611 27,894 26,948 11,400
Gurjaani 132,668 28,856 14,120 46,611 27,894 26,948 11,400
Akhmeta 541,916 28,856 14,120 46,611 27,894 26,948 11,400
Telavi 96,453 28,856 14,120 46,611 27,894 26,948 11,400
Bolnisi 27,452 36,468 15,075 59,559 29,897 29,537 14,900
Dmanisi 40,651 36,468 15,075 59,559 29,897 29,537 14,900
Marneuli 30,804 36,468 15,075 59,559 29,897 29,537 14,900
Tetritskaro 36,559 36,468 15,075 59,559 29,897 29,537 14,900
Tsalka 26,330 36,468 15,075 59,559 29,897 29,537 14,900
Dusheti 68,955 73,585 30,232 116,528 42,599 50,253 28,900
Mtskheta 43,594 73,585 30,232 116,528 42,599 50,253 28,900
Tianeti 64,404 73,585 30,232 116,528 42,599 50,253 28,900
Oni 21,498 23,604 13,461 41,432 29,742 29,537 7,900
Tsageri 24,897 23,604 13,461 41,432 29,742 29,537 7,900
Ambrolauri 18,373 23,604 13,461 41,432 29,742 29,537 7,900
Lentekhi 33,403 23,604 13,461 41,432 29,742 29,537 7,900
Mestia 53,810 18,942 9,377 33,664 26,219 24,358 7,900
Adigeni 37,736 46,323 19,812 75,096 35,741 39,895 18,400
Akhalkalaki 49,064 46,323 19,812 75,096 35,741 39,895 18,400
Akhaltsikhe 29,073 46,323 19,812 75,096 35,741 39,895 18,400
Aspindza 36,856 46,323 19,812 75,096 35,741 39,895 18,400
Borjomi 25,135 46,323 19,812 75,096 35,741 39,895 18,400
Ninotsminda 35,114 46,323 19,812 75,096 35,741 39,895 18,400
Gori 43,341 28,620 14,091 46,611 28,477 26,948 11,400
Kareli 44,175 28,620 14,091 46,611 28,477 26,948 11,400
Kaspi 23,219 28,620 14,091 46,611 28,477 26,948 11,400
Khashuri 62,305 28,620 14,091 46,611 28,477 26,948 11,400
Technology

USAID ENERGY PROGRAM Cost Estimation Study of Gas Pipeline Network and Alternative Systems for High-Mountainous Settlements of Georgia 27
Table 10: 35-Year LCCA - Scenario 1
As mentioned above costs of alternatives are compared against the cost of gasification. The cells highlighted in green mean that these alternatives have lower LCC, i.e. are more cost efficient than gasification in respective municipalities. Biomass-based technologies are more cost-efficient in 100% of cases. Even such relatively expensive technologies as PV and battery storage proved to be a better option in several instances. Heat pumps, both grid-connected and PV powered also proved to be a cost-efficient option in multiple instances, specifically in 65% of municipalities for grid-connected heat pumps and 57% of municipalities for PV-powered heat pumps in Scenario 1. Numbers are similar in scenario 2, where grid-connected heat pumps are more cost efficient in 65% of municipalities and PV-powered heat pumps in 35% of municipalities.
Tables 10 and 11 below provide summed up LCC of gasification and alternatives for each municipality to help put things in perspective:
Summary of 35-Year Life-cycle Cost AnalysisAll Clusters
All numbers per household
Scenario 2 - No Subsidization
LCCA Results
Cluster Name Natural Gas Electricity Biomass Boiler PV+ BESS Heat PumpHeat Pump
+PV+BESSWood Stove
Keda 21,333 46,913 9,386 82,864 20,300 37,306 900
Khelvachauri 29,114 46,913 9,386 82,864 20,300 37,306 900
Khulo 19,528 46,913 9,386 82,864 20,300 37,306 900
Shuakhevi 18,782 46,913 9,386 82,864 20,300 37,306 900
Chokhatauri 19,027 19,532 5,951 36,253 20,300 21,769 900
Bagdati 8,628 20,653 6,091 36,253 20,300 21,769 900
Chiatura 11,428 20,653 6,091 36,253 20,300 21,769 900
Kharagauli 24,366 20,653 6,091 36,253 20,300 21,769 900
Khoni 24,512 20,653 6,091 36,253 20,300 21,769 900
Tskaltubo 53,364 20,653 6,091 36,253 20,300 21,769 900
Sagarejo 30,642 28,856 7,120 46,611 20,300 26,948 900
Gurjaani 125,359 28,856 7,120 46,611 20,300 26,948 900
Akhmeta 534,607 28,856 7,120 46,611 20,300 26,948 900
Telavi 89,144 28,856 7,120 46,611 20,300 26,948 900
Bolnisi 18,215 36,468 8,075 59,559 20,300 29,537 900
Dmanisi 31,414 36,468 8,075 59,559 20,300 29,537 900
Marneuli 21,567 36,468 8,075 59,559 20,300 29,537 900
Tetritskaro 27,322 36,468 8,075 59,559 20,300 29,537 900
Tsalka 17,093 36,468 8,075 59,559 20,300 29,537 900
Dusheti 50,316 73,585 12,732 116,528 20,300 50,253 900
Mtskheta 24,955 73,585 12,732 116,528 20,300 50,253 900
Tianeti 45,766 73,585 12,732 116,528 20,300 50,253 900
Oni 15,519 23,604 6,461 41,432 20,300 29,537 900
Tsageri 18,918 23,604 6,461 41,432 20,300 29,537 900
Ambrolauri 12,395 23,604 6,461 41,432 20,300 29,537 900
Lentekhi 27,424 23,604 6,461 41,432 20,300 29,537 900
Mestia 49,012 18,942 5,877 33,664 20,300 24,358 900
Adigeni 26,003 46,323 9,312 75,096 20,300 39,895 900
Akhalkalaki 37,331 46,323 9,312 75,096 20,300 39,895 900
Akhaltsikhe 17,340 46,323 9,312 75,096 20,300 39,895 900
Aspindza 25,123 46,323 9,312 75,096 20,300 39,895 900
Borjomi 13,402 46,323 9,312 75,096 20,300 39,895 900
Ninotsminda 23,381 46,323 9,312 75,096 20,300 39,895 900
Gori 36,092 28,620 7,091 46,611 20,300 26,948 900
Kareli 36,926 28,620 7,091 46,611 20,300 26,948 900
Kaspi 15,970 28,620 7,091 46,611 20,300 26,948 900
Khashuri 55,056 28,620 7,091 46,611 20,300 26,948 900
Technology

USAID ENERGY PROGRAM Cost Estimation Study of Gas Pipeline Network and Alternative Systems for High-Mountainous Settlements of Georgia 28
Table 11: Total Cost of Alternatives - Scenario 1
As we can see, in Scenario 1, total LCC of gasification is GEL 1,720,178,424, whereas total LCC of biomass alternative is 859,323,882 – 51% less.
Summary of 35-Year Life-cycle Cost AnalysisAll Clusters
Total LCC
Scenario 1 - 100% subsidization
LCCA Results
Cluster Name Natural Gas Electricity Biomass Boiler PV+ BESS Heat PumpHeat Pump
+PV+BESSWood Stove
Keda 103,366,744 145,992,906 61,885,055 257,873,764 106,112,690 116,094,996 57,260,800
Khelvachauri 21,974,435 25,145,308 10,658,865 44,415,276 18,276,479 19,995,796 9,862,400
Khulo 195,124,122 291,422,856 123,531,478 514,753,156 211,816,205 231,742,325 114,300,800
Shuakhevi 105,026,434 160,676,639 68,109,355 283,810,296 116,785,335 127,771,646 63,020,000
Chokhatauri 8,367,017 6,816,767 3,298,268 12,652,346 8,747,326 7,597,217 2,757,100
Bagdati 2,882,842 4,295,922 1,994,989 7,540,653 5,245,239 4,527,854 1,643,200
Chiatura 55,842,514 69,230,440 32,150,023 121,520,525 84,529,038 72,968,113 26,480,800
Kharagauli 25,068,774 17,493,491 8,123,827 30,706,410 21,359,217 18,437,945 6,691,300
Khoni 4,788,648 3,325,209 1,544,199 5,836,756 4,060,016 3,504,733 1,271,900
Tskaltubo 43,419,242 15,304,223 7,107,150 26,863,577 18,686,163 16,130,481 5,853,900
Sagarejo 14,611,216 11,109,503 5,436,358 17,945,304 10,739,053 10,374,807 4,389,000
Gurjaani 4,908,706 1,067,667 522,455 1,724,614 1,032,065 997,059 421,800
Akhmeta 10,838,321 577,117 282,408 932,224 557,873 538,951 228,000
Telavi 5,015,540 1,500,504 734,261 2,423,781 1,450,470 1,401,273 592,800
Bolnisi 1,207,895 1,604,598 663,321 2,620,584 1,315,463 1,299,631 655,600
Dmanisi 29,187,479 26,184,118 10,824,200 42,763,168 21,465,957 21,207,609 10,698,200
Marneuli 23,164,653 27,424,035 11,336,767 44,788,165 22,482,451 22,211,869 11,204,800
Tetritskaro 57,141,748 56,999,689 23,562,987 93,090,295 46,728,818 46,166,425 23,288,700
Tsalka 90,734,868 125,669,181 51,950,131 205,239,384 103,024,637 101,784,709 51,345,400
Dusheti 104,328,512 111,334,668 45,741,646 176,306,788 64,451,678 76,033,001 43,725,700
Mtskheta 8,108,501 13,686,879 5,623,229 21,674,199 7,923,339 9,347,084 5,375,400
Tianeti 52,682,874 60,192,834 24,730,117 95,319,863 34,845,653 41,107,069 23,640,200
Oni 60,687,523 66,634,003 38,001,760 116,962,988 83,960,501 83,383,120 22,301,700
Tsageri 122,241,868 115,895,485 66,095,871 203,431,906 146,031,194 145,026,965 38,789,000
Ambrolauri 115,072,797 147,831,655 84,309,254 259,489,618 186,271,562 184,990,607 49,477,700
Lentekhi 55,816,152 39,442,231 22,494,134 69,233,139 49,698,193 49,356,427 13,200,900
Mestia 178,970,848 63,001,706 31,186,533 111,965,233 87,205,833 81,014,841 26,275,400
Adigeni 32,641,390 40,069,212 17,137,299 64,957,858 30,915,904 34,509,262 15,916,000
Akhalkalaki 40,772,085 38,494,237 16,463,694 62,404,601 29,700,712 33,152,828 15,290,400
Akhaltsikhe 37,213,537 59,293,169 25,359,240 96,122,611 45,748,390 51,065,728 23,552,000
Aspindza 35,345,149 44,423,554 18,999,618 72,016,863 34,275,551 38,259,401 17,645,600
Borjomi 14,955,384 27,562,059 11,788,084 44,681,995 21,265,853 23,737,585 10,948,000
Ninotsminda 15,239,607 20,104,090 8,598,367 32,591,573 15,511,563 17,314,473 7,985,600
Gori 11,355,444 7,498,391 3,691,788 12,212,129 7,460,997 7,060,258 2,986,800
Kareli 8,481,649 5,495,004 2,705,433 8,949,347 5,467,601 5,173,930 2,188,800
Kaspi 19,294,842 23,783,064 11,709,451 38,733,891 23,664,461 22,393,414 9,473,400
Khashuri 4,299,064 1,974,767 972,265 3,216,171 1,964,919 1,859,381 786,600
Total 1,720,178,424 1,878,557,180 859,323,882 3,207,771,050 1,680,778,400 1,729,538,811 721,525,700
Technology
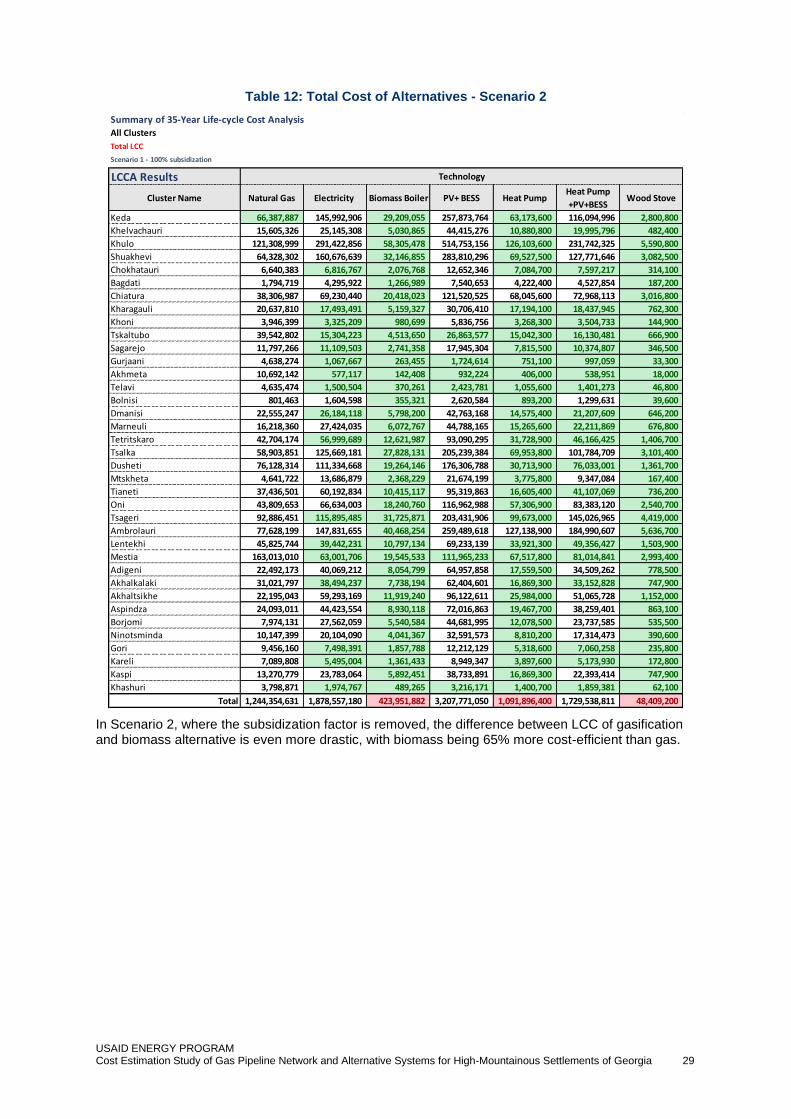
USAID ENERGY PROGRAM Cost Estimation Study of Gas Pipeline Network and Alternative Systems for High-Mountainous Settlements of Georgia 29
Table 12: Total Cost of Alternatives - Scenario 2
In Scenario 2, where the subsidization factor is removed, the difference between LCC of gasification and biomass alternative is even more drastic, with biomass being 65% more cost-efficient than gas.
Summary of 35-Year Life-cycle Cost AnalysisAll Clusters
Total LCC
Scenario 1 - 100% subsidization
LCCA Results
Cluster Name Natural Gas Electricity Biomass Boiler PV+ BESS Heat PumpHeat Pump
+PV+BESSWood Stove
Keda 66,387,887 145,992,906 29,209,055 257,873,764 63,173,600 116,094,996 2,800,800
Khelvachauri 15,605,326 25,145,308 5,030,865 44,415,276 10,880,800 19,995,796 482,400
Khulo 121,308,999 291,422,856 58,305,478 514,753,156 126,103,600 231,742,325 5,590,800
Shuakhevi 64,328,302 160,676,639 32,146,855 283,810,296 69,527,500 127,771,646 3,082,500
Chokhatauri 6,640,383 6,816,767 2,076,768 12,652,346 7,084,700 7,597,217 314,100
Bagdati 1,794,719 4,295,922 1,266,989 7,540,653 4,222,400 4,527,854 187,200
Chiatura 38,306,987 69,230,440 20,418,023 121,520,525 68,045,600 72,968,113 3,016,800
Kharagauli 20,637,810 17,493,491 5,159,327 30,706,410 17,194,100 18,437,945 762,300
Khoni 3,946,399 3,325,209 980,699 5,836,756 3,268,300 3,504,733 144,900
Tskaltubo 39,542,802 15,304,223 4,513,650 26,863,577 15,042,300 16,130,481 666,900
Sagarejo 11,797,266 11,109,503 2,741,358 17,945,304 7,815,500 10,374,807 346,500
Gurjaani 4,638,274 1,067,667 263,455 1,724,614 751,100 997,059 33,300
Akhmeta 10,692,142 577,117 142,408 932,224 406,000 538,951 18,000
Telavi 4,635,474 1,500,504 370,261 2,423,781 1,055,600 1,401,273 46,800
Bolnisi 801,463 1,604,598 355,321 2,620,584 893,200 1,299,631 39,600
Dmanisi 22,555,247 26,184,118 5,798,200 42,763,168 14,575,400 21,207,609 646,200
Marneuli 16,218,360 27,424,035 6,072,767 44,788,165 15,265,600 22,211,869 676,800
Tetritskaro 42,704,174 56,999,689 12,621,987 93,090,295 31,728,900 46,166,425 1,406,700
Tsalka 58,903,851 125,669,181 27,828,131 205,239,384 69,953,800 101,784,709 3,101,400
Dusheti 76,128,314 111,334,668 19,264,146 176,306,788 30,713,900 76,033,001 1,361,700
Mtskheta 4,641,722 13,686,879 2,368,229 21,674,199 3,775,800 9,347,084 167,400
Tianeti 37,436,501 60,192,834 10,415,117 95,319,863 16,605,400 41,107,069 736,200
Oni 43,809,653 66,634,003 18,240,760 116,962,988 57,306,900 83,383,120 2,540,700
Tsageri 92,886,451 115,895,485 31,725,871 203,431,906 99,673,000 145,026,965 4,419,000
Ambrolauri 77,628,199 147,831,655 40,468,254 259,489,618 127,138,900 184,990,607 5,636,700
Lentekhi 45,825,744 39,442,231 10,797,134 69,233,139 33,921,300 49,356,427 1,503,900
Mestia 163,013,010 63,001,706 19,545,533 111,965,233 67,517,800 81,014,841 2,993,400
Adigeni 22,492,173 40,069,212 8,054,799 64,957,858 17,559,500 34,509,262 778,500
Akhalkalaki 31,021,797 38,494,237 7,738,194 62,404,601 16,869,300 33,152,828 747,900
Akhaltsikhe 22,195,043 59,293,169 11,919,240 96,122,611 25,984,000 51,065,728 1,152,000
Aspindza 24,093,011 44,423,554 8,930,118 72,016,863 19,467,700 38,259,401 863,100
Borjomi 7,974,131 27,562,059 5,540,584 44,681,995 12,078,500 23,737,585 535,500
Ninotsminda 10,147,399 20,104,090 4,041,367 32,591,573 8,810,200 17,314,473 390,600
Gori 9,456,160 7,498,391 1,857,788 12,212,129 5,318,600 7,060,258 235,800
Kareli 7,089,808 5,495,004 1,361,433 8,949,347 3,897,600 5,173,930 172,800
Kaspi 13,270,779 23,783,064 5,892,451 38,733,891 16,869,300 22,393,414 747,900
Khashuri 3,798,871 1,974,767 489,265 3,216,171 1,400,700 1,859,381 62,100
Total 1,244,354,631 1,878,557,180 423,951,882 3,207,771,050 1,091,896,400 1,729,538,811 48,409,200
Technology
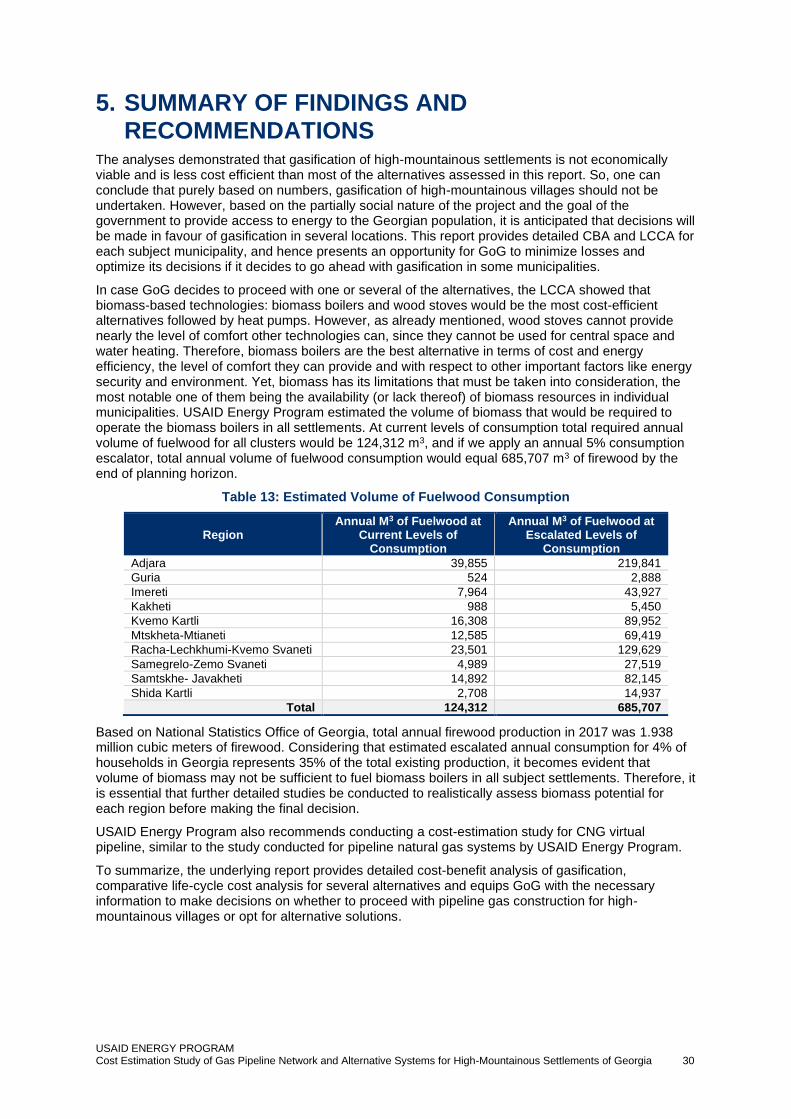
USAID ENERGY PROGRAM Cost Estimation Study of Gas Pipeline Network and Alternative Systems for High-Mountainous Settlements of Georgia 30
5. SUMMARY OF FINDINGS AND RECOMMENDATIONS
The analyses demonstrated that gasification of high-mountainous settlements is not economically viable and is less cost efficient than most of the alternatives assessed in this report. So, one can conclude that purely based on numbers, gasification of high-mountainous villages should not be undertaken. However, based on the partially social nature of the project and the goal of the government to provide access to energy to the Georgian population, it is anticipated that decisions will be made in favour of gasification in several locations. This report provides detailed CBA and LCCA for each subject municipality, and hence presents an opportunity for GoG to minimize losses and optimize its decisions if it decides to go ahead with gasification in some municipalities.
In case GoG decides to proceed with one or several of the alternatives, the LCCA showed that biomass-based technologies: biomass boilers and wood stoves would be the most cost-efficient alternatives followed by heat pumps. However, as already mentioned, wood stoves cannot provide nearly the level of comfort other technologies can, since they cannot be used for central space and water heating. Therefore, biomass boilers are the best alternative in terms of cost and energy efficiency, the level of comfort they can provide and with respect to other important factors like energy security and environment. Yet, biomass has its limitations that must be taken into consideration, the most notable one of them being the availability (or lack thereof) of biomass resources in individual municipalities. USAID Energy Program estimated the volume of biomass that would be required to operate the biomass boilers in all settlements. At current levels of consumption total required annual volume of fuelwood for all clusters would be 124,312 m3, and if we apply an annual 5% consumption escalator, total annual volume of fuelwood consumption would equal 685,707 m3 of firewood by the end of planning horizon.
Table 13: Estimated Volume of Fuelwood Consumption
Region Annual M3 of Fuelwood at
Current Levels of Consumption
Annual M3 of Fuelwood at Escalated Levels of
Consumption
Adjara 39,855 219,841
Guria 524 2,888
Imereti 7,964 43,927
Kakheti 988 5,450
Kvemo Kartli 16,308 89,952
Mtskheta-Mtianeti 12,585 69,419
Racha-Lechkhumi-Kvemo Svaneti 23,501 129,629
Samegrelo-Zemo Svaneti 4,989 27,519
Samtskhe- Javakheti 14,892 82,145
Shida Kartli 2,708 14,937
Total 124,312 685,707
Based on National Statistics Office of Georgia, total annual firewood production in 2017 was 1.938 million cubic meters of firewood. Considering that estimated escalated annual consumption for 4% of households in Georgia represents 35% of the total existing production, it becomes evident that volume of biomass may not be sufficient to fuel biomass boilers in all subject settlements. Therefore, it is essential that further detailed studies be conducted to realistically assess biomass potential for each region before making the final decision.
USAID Energy Program also recommends conducting a cost-estimation study for CNG virtual pipeline, similar to the study conducted for pipeline natural gas systems by USAID Energy Program.
To summarize, the underlying report provides detailed cost-benefit analysis of gasification, comparative life-cycle cost analysis for several alternatives and equips GoG with the necessary information to make decisions on whether to proceed with pipeline gas construction for high-mountainous villages or opt for alternative solutions.

USAID ENERGY PROGRAM Cost Estimation Study of Gas Pipeline Network and Alternative Systems for High-Mountainous Settlements of Georgia 31
ANNEX 1: SAMPLE COST-ESTIMATION STUDY FOR PIPELINE GAS Explanatory Notes – Akhalkalaki Municipality
The following estimation has been developed by Ltd “Tsisferi Ali”.
The chart accounts gasification of the villages of Akhalkalaki municipality which are not connected to the gas grid: Gogasheni, Apnia, Karcebi, Azmana, Okami, Erenji, Davnia, Khavati, Miasnikiani, Suldi, Philipovka, Kartsakhi, Buzaveti, Takhcha, Abuli, Modegi, Didi Samsara, Patara Samsara and Dadeshi.
The chart was developed upon assignment by Deloitte Consulting Overseas Projects LLP. The goal of the project is to calculate approximate cost of construction of gasification systems in villages with no access to gas grid, guiding with the presented scheme.
This project is based on the following initial data and materials:
• Situational plans for gas pipelines passing between settlements and through villages.
• Information about number of households in villages that are being studied.
• Construction norms and rules 2.04.08-87*.
• Construction norms and rules 2.04.08.86.
• Norms and rules 01.05-08 “„Building Climatology” approved under the order of the Minister of Economic Development of Georgia 25.08.08 N1-1/1743.
• Different data and references.
The project envisages the use of natural gas for the household and sanitary-hygienic needs of the population, as well as providing gas for heating households and public buildings.
The schemes contain probable gas pipeline networks between source of gas to the territory of the settlements as well as pipeline connections for customers in the villages.
Diameters of pipelines are determined based on hydraulic calculations. Hydraulic calculations are carried out based on estimated hourly gas consumption. Estimated hourly gas consumption for sanitary-hygienic needs of the population were determined according to chart N4 in construction norms and rules 2.04.08-87*.
Estimated hourly gas consumption for heating 1m2 area of a household is determined according to construction norms and rules 2.04.07-86 “Heating Networks” taking into account outdoor air temperature. Outdoor air temperature is used from 01.05.08 “Building Climatology” approved under the order of the Minister of Economic Development of Georgia 25.08.08 N1-1/1743.
The average heating area of residential houses per household was calculated to be equal to 40 m2. Average gas consumption for heating public buildings was calculated using same method as for calculating household consumption, but the average area was 4 m2 per household. Final calculations show that estimated hourly gas consumption per household, considering the need for heating public buildings, is Q=1,28 m3/ hr.
Ltd „Tsisferi Ali“ studied the existing gas pipeline system in Akhalkalaki municipality and concluded that villages of Gogasheni, Apnia, Karcebi, Azmana, Okami, Erenji, Davnia, Khavati, Miasnikiani, Suldi, Philipovka and Kartsakhi can only be supplied with gas from automated gas distribution station with average pressure pipeline in the city of Akhalkalaki. Pipeline that will deliver gas to villages, must be connected to the source of gas near the distribution station. Pressure of gas in the connection point must be 2,0 kg/cm2.
Located in Akhalkalaki municipality, village of Kartikami with an average pressure polyethylene pipeline, with d=90mm is taken as the source of gas for village of Buzaveti. Gas pressure in point of connection is 0,5kg/cm2.
Source of gas for villages of Tachkha and Abuli, was pipeline passing through village of Toria in Akhalkalaki municipality, which is polyethylene d=75mm average pressure pipeline. Pressure in the point of connection is 2,1kg/cm2.
Source of gas for village Modegi, was pipeline passing through Ghado in Akhalkalaki municipality, which is polyethylene d=90mm average pressure pipeline. Pressure in the point of connection is 0,8kg/cm2. Source of gas for villages of Didi samsara and Patara Samsara, was pipeline passing
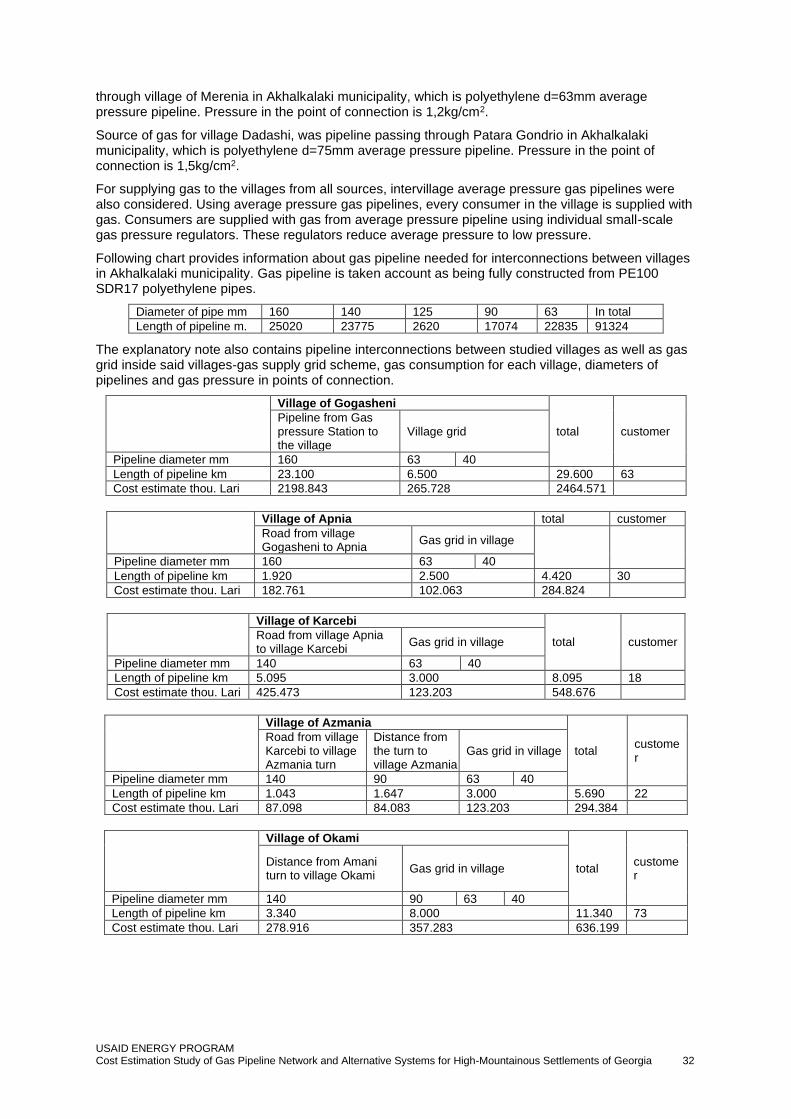
USAID ENERGY PROGRAM Cost Estimation Study of Gas Pipeline Network and Alternative Systems for High-Mountainous Settlements of Georgia 32
through village of Merenia in Akhalkalaki municipality, which is polyethylene d=63mm average pressure pipeline. Pressure in the point of connection is 1,2kg/cm2.
Source of gas for village Dadashi, was pipeline passing through Patara Gondrio in Akhalkalaki municipality, which is polyethylene d=75mm average pressure pipeline. Pressure in the point of connection is 1,5kg/cm2.
For supplying gas to the villages from all sources, intervillage average pressure gas pipelines were also considered. Using average pressure gas pipelines, every consumer in the village is supplied with gas. Consumers are supplied with gas from average pressure pipeline using individual small-scale gas pressure regulators. These regulators reduce average pressure to low pressure.
Following chart provides information about gas pipeline needed for interconnections between villages in Akhalkalaki municipality. Gas pipeline is taken account as being fully constructed from PE100 SDR17 polyethylene pipes.
Diameter of pipe mm 160 140 125 90 63 In total
Length of pipeline m. 25020 23775 2620 17074 22835 91324
The explanatory note also contains pipeline interconnections between studied villages as well as gas grid inside said villages-gas supply grid scheme, gas consumption for each village, diameters of pipelines and gas pressure in points of connection.
Village of Gogasheni
total customer Pipeline from Gas pressure Station to the village
Village grid
Pipeline diameter mm 160 63 40
Length of pipeline km 23.100 6.500 29.600 63
Cost estimate thou. Lari 2198.843 265.728 2464.571
Village of Apnia total customer
Road from village Gogasheni to Apnia
Gas grid in village
Pipeline diameter mm 160 63 40
Length of pipeline km 1.920 2.500 4.420 30
Cost estimate thou. Lari 182.761 102.063 284.824
Village of Karcebi
total customer Road from village Apnia to village Karcebi
Gas grid in village
Pipeline diameter mm 140 63 40
Length of pipeline km 5.095 3.000 8.095 18
Cost estimate thou. Lari 425.473 123.203 548.676
Village of Azmania
total customer
Road from village Karcebi to village Azmania turn
Distance from the turn to village Azmania
Gas grid in village
Pipeline diameter mm 140 90 63 40
Length of pipeline km 1.043 1.647 3.000 5.690 22
Cost estimate thou. Lari 87.098 84.083 123.203 294.384
Village of Okami
total customer
Distance from Amani turn to village Okami
Gas grid in village
Pipeline diameter mm 140 90 63 40
Length of pipeline km 3.340 8.000 11.340 73
Cost estimate thou. Lari 278.916 357.283 636.199
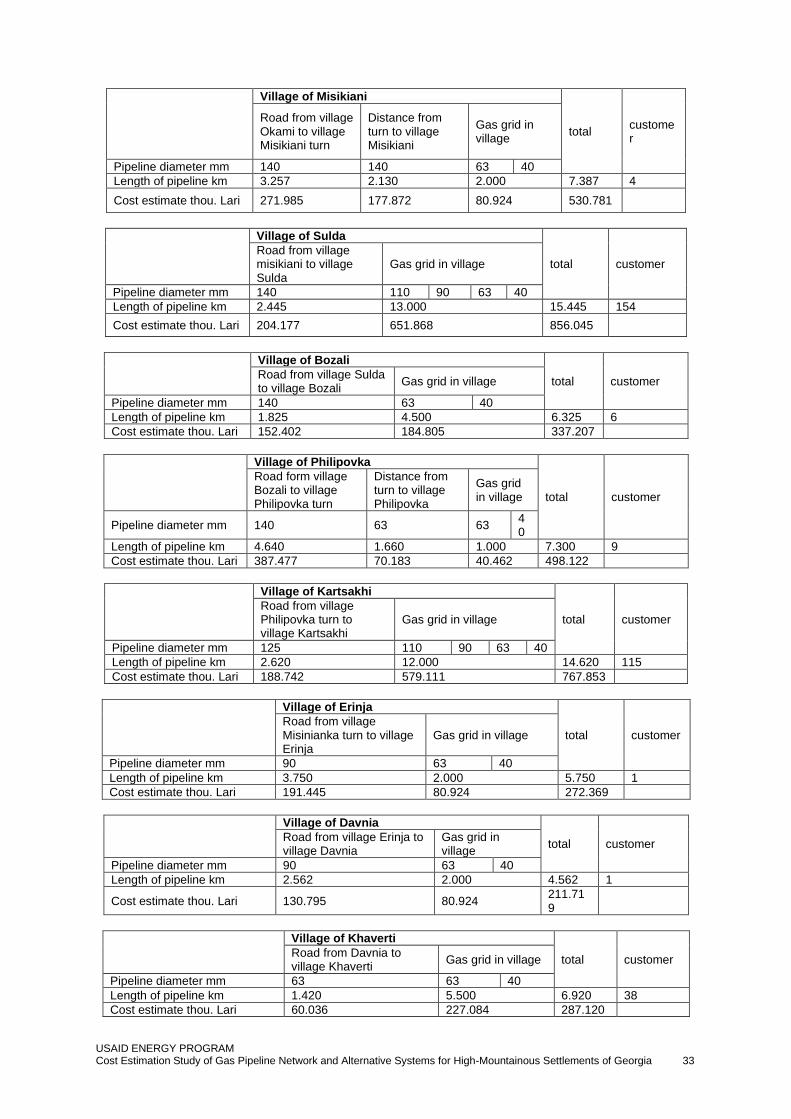
USAID ENERGY PROGRAM Cost Estimation Study of Gas Pipeline Network and Alternative Systems for High-Mountainous Settlements of Georgia 33
Village of Misikiani
total customer
Road from village Okami to village Misikiani turn
Distance from turn to village Misikiani
Gas grid in village
Pipeline diameter mm 140 140 63 40
Length of pipeline km 3.257 2.130 2.000 7.387 4
Cost estimate thou. Lari 271.985 177.872 80.924 530.781
Village of Sulda
total customer Road from village misikiani to village Sulda
Gas grid in village
Pipeline diameter mm 140 110 90 63 40
Length of pipeline km 2.445 13.000 15.445 154
Cost estimate thou. Lari 204.177 651.868 856.045
Village of Bozali
total customer Road from village Sulda to village Bozali
Gas grid in village
Pipeline diameter mm 140 63 40
Length of pipeline km 1.825 4.500 6.325 6
Cost estimate thou. Lari 152.402 184.805 337.207
Village of Philipovka
total customer
Road form village Bozali to village Philipovka turn
Distance from turn to village Philipovka
Gas grid in village
Pipeline diameter mm 140 63 63 40
Length of pipeline km 4.640 1.660 1.000 7.300 9
Cost estimate thou. Lari 387.477 70.183 40.462 498.122
Village of Kartsakhi
total customer Road from village Philipovka turn to village Kartsakhi
Gas grid in village
Pipeline diameter mm 125 110 90 63 40
Length of pipeline km 2.620 12.000 14.620 115
Cost estimate thou. Lari 188.742 579.111 767.853
Village of Erinja
total customer Road from village Misinianka turn to village Erinja
Gas grid in village
Pipeline diameter mm 90 63 40
Length of pipeline km 3.750 2.000 5.750 1
Cost estimate thou. Lari 191.445 80.924 272.369
Village of Davnia
total customer Road from village Erinja to village Davnia
Gas grid in village
Pipeline diameter mm 90 63 40
Length of pipeline km 2.562 2.000 4.562 1
Cost estimate thou. Lari 130.795 80.924 211.719
Village of Khaverti
total customer Road from Davnia to village Khaverti
Gas grid in village
Pipeline diameter mm 63 63 40
Length of pipeline km 1.420 5.500 6.920 38
Cost estimate thou. Lari 60.036 227.084 287.120
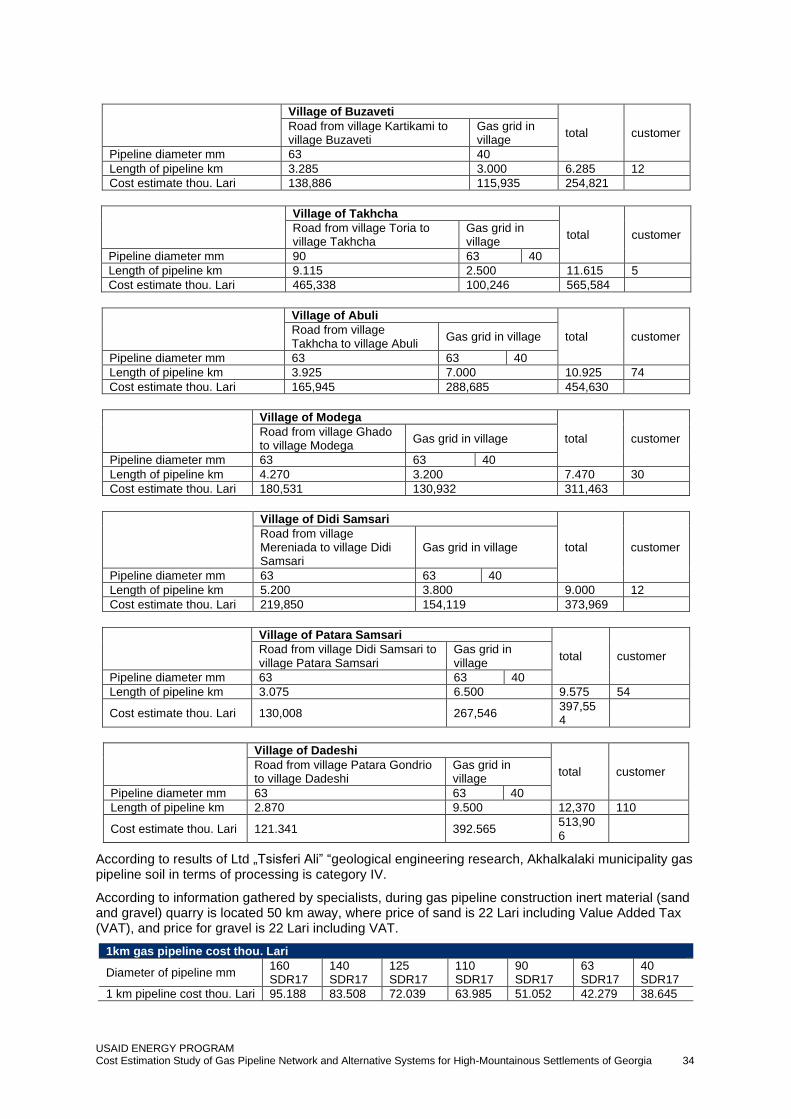
USAID ENERGY PROGRAM Cost Estimation Study of Gas Pipeline Network and Alternative Systems for High-Mountainous Settlements of Georgia 34
Village of Buzaveti
total customer Road from village Kartikami to village Buzaveti
Gas grid in village
Pipeline diameter mm 63 40
Length of pipeline km 3.285 3.000 6.285 12
Cost estimate thou. Lari 138,886 115,935 254,821
Village of Takhcha
total customer Road from village Toria to village Takhcha
Gas grid in village
Pipeline diameter mm 90 63 40
Length of pipeline km 9.115 2.500 11.615 5
Cost estimate thou. Lari 465,338 100,246 565,584
Village of Abuli
total customer Road from village Takhcha to village Abuli
Gas grid in village
Pipeline diameter mm 63 63 40
Length of pipeline km 3.925 7.000 10.925 74
Cost estimate thou. Lari 165,945 288,685 454,630
Village of Modega
total customer Road from village Ghado to village Modega
Gas grid in village
Pipeline diameter mm 63 63 40
Length of pipeline km 4.270 3.200 7.470 30
Cost estimate thou. Lari 180,531 130,932 311,463
Village of Didi Samsari
total customer Road from village Mereniada to village Didi Samsari
Gas grid in village
Pipeline diameter mm 63 63 40
Length of pipeline km 5.200 3.800 9.000 12
Cost estimate thou. Lari 219,850 154,119 373,969
Village of Patara Samsari
total customer Road from village Didi Samsari to village Patara Samsari
Gas grid in village
Pipeline diameter mm 63 63 40
Length of pipeline km 3.075 6.500 9.575 54
Cost estimate thou. Lari 130,008 267,546 397,554
Village of Dadeshi
total customer Road from village Patara Gondrio to village Dadeshi
Gas grid in village
Pipeline diameter mm 63 63 40
Length of pipeline km 2.870 9.500 12,370 110
Cost estimate thou. Lari 121.341 392.565 513,906
According to results of Ltd „Tsisferi Ali” “geological engineering research, Akhalkalaki municipality gas pipeline soil in terms of processing is category IV.
According to information gathered by specialists, during gas pipeline construction inert material (sand and gravel) quarry is located 50 km away, where price of sand is 22 Lari including Value Added Tax (VAT), and price for gravel is 22 Lari including VAT.
1km gas pipeline cost thou. Lari
Diameter of pipeline mm 160 SDR17
140 SDR17
125 SDR17
110 SDR17
90 SDR17
63 SDR17
40 SDR17
1 km pipeline cost thou. Lari 95.188 83.508 72.039 63.985 51.052 42.279 38.645

USAID ENERGY PROGRAM Cost Estimation Study of Gas Pipeline Network and Alternative Systems for High-Mountainous Settlements of Georgia 35
Unit valuation on building materials, is taken from association of construction cost assessment specialist’s publication „Building Resource Prices“, year 2019, III Q, in accordance with market prices.
კ=4.6 workforce per meter, კ=6,0 კ=7,8
კ=3.2 on machinery and materials
Following costs are taken for construction of1km gas pipeline:
Overhead expenses 10%
Estimated profit 8%
Temporary buildings -1,5%
Work during winter periods -0,6%
Author’s supervision -0,2%
Unforeseen work -3%
Value added tax VAT-18%
Distance of road from Automated gas distribution station to the village
Pipeline diameter mm 160 140 125 90 63 Total
Length of pipeline km 25.020 23.775 2.620 17.074 25,705 94,194
Cost estimate thou. Lari 2381.604 1985.403 188.742 871,661 1086.781 6514.191
Pipeline grid in the village
Pipeline diameter mm 110 90 63 40 Total
Length of pipeline km 7.000 8.000 51,500 34.000 100.500
Cost estimate thou. Lari 447.895 408.416 2177.368 1313.930 4347.609
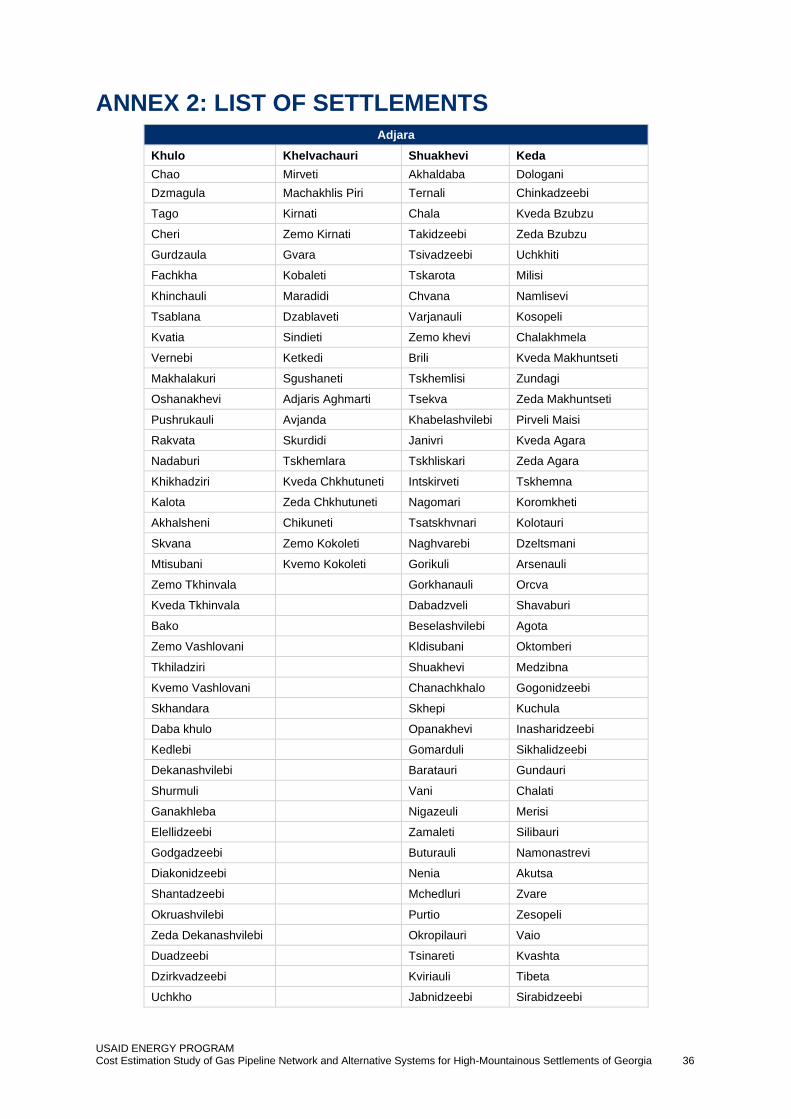
USAID ENERGY PROGRAM Cost Estimation Study of Gas Pipeline Network and Alternative Systems for High-Mountainous Settlements of Georgia 36
ANNEX 2: LIST OF SETTLEMENTS Adjara
Khulo Khelvachauri Shuakhevi Keda
Chao Mirveti Akhaldaba Dologani
Dzmagula Machakhlis Piri Ternali Chinkadzeebi
Tago Kirnati Chala Kveda Bzubzu
Cheri Zemo Kirnati Takidzeebi Zeda Bzubzu
Gurdzaula Gvara Tsivadzeebi Uchkhiti
Fachkha Kobaleti Tskarota Milisi
Khinchauli Maradidi Chvana Namlisevi
Tsablana Dzablaveti Varjanauli Kosopeli
Kvatia Sindieti Zemo khevi Chalakhmela
Vernebi Ketkedi Brili Kveda Makhuntseti
Makhalakuri Sgushaneti Tskhemlisi Zundagi
Oshanakhevi Adjaris Aghmarti Tsekva Zeda Makhuntseti
Pushrukauli Avjanda Khabelashvilebi Pirveli Maisi
Rakvata Skurdidi Janivri Kveda Agara
Nadaburi Tskhemlara Tskhliskari Zeda Agara
Khikhadziri Kveda Chkhutuneti Intskirveti Tskhemna
Kalota Zeda Chkhutuneti Nagomari Koromkheti
Akhalsheni Chikuneti Tsatskhvnari Kolotauri
Skvana Zemo Kokoleti Naghvarebi Dzeltsmani
Mtisubani Kvemo Kokoleti Gorikuli Arsenauli
Zemo Tkhinvala Gorkhanauli Orcva
Kveda Tkhinvala Dabadzveli Shavaburi
Bako Beselashvilebi Agota
Zemo Vashlovani Kldisubani Oktomberi
Tkhiladziri Shuakhevi Medzibna
Kvemo Vashlovani Chanachkhalo Gogonidzeebi
Skhandara Skhepi Kuchula
Daba khulo Opanakhevi Inasharidzeebi
Kedlebi Gomarduli Sikhalidzeebi
Dekanashvilebi Baratauri Gundauri
Shurmuli Vani Chalati
Ganakhleba Nigazeuli Merisi
Elellidzeebi Zamaleti Silibauri
Godgadzeebi Buturauli Namonastrevi
Diakonidzeebi Nenia Akutsa
Shantadzeebi Mchedluri Zvare
Okruashvilebi Purtio Zesopeli
Zeda Dekanashvilebi Okropilauri Vaio
Duadzeebi Tsinareti Kvashta
Dzirkvadzeebi Kviriauli Tibeta
Uchkho Jabnidzeebi Sirabidzeebi
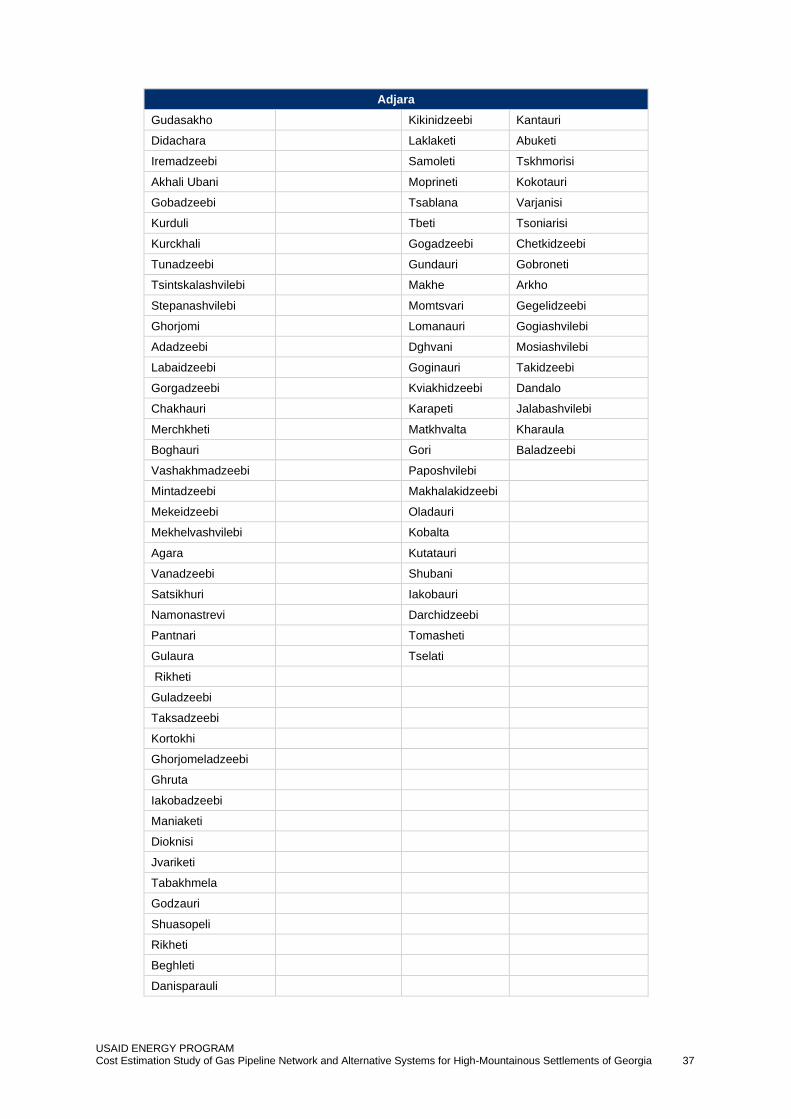
USAID ENERGY PROGRAM Cost Estimation Study of Gas Pipeline Network and Alternative Systems for High-Mountainous Settlements of Georgia 37
Adjara
Gudasakho Kikinidzeebi Kantauri
Didachara Laklaketi Abuketi
Iremadzeebi Samoleti Tskhmorisi
Akhali Ubani Moprineti Kokotauri
Gobadzeebi Tsablana Varjanisi
Kurduli Tbeti Tsoniarisi
Kurckhali Gogadzeebi Chetkidzeebi
Tunadzeebi Gundauri Gobroneti
Tsintskalashvilebi Makhe Arkho
Stepanashvilebi Momtsvari Gegelidzeebi
Ghorjomi Lomanauri Gogiashvilebi
Adadzeebi Dghvani Mosiashvilebi
Labaidzeebi Goginauri Takidzeebi
Gorgadzeebi Kviakhidzeebi Dandalo
Chakhauri Karapeti Jalabashvilebi
Merchkheti Matkhvalta Kharaula
Boghauri Gori Baladzeebi
Vashakhmadzeebi Paposhvilebi
Mintadzeebi Makhalakidzeebi
Mekeidzeebi Oladauri
Mekhelvashvilebi Kobalta
Agara Kutatauri
Vanadzeebi Shubani
Satsikhuri Iakobauri
Namonastrevi Darchidzeebi
Pantnari Tomasheti
Gulaura Tselati
Rikheti
Guladzeebi
Taksadzeebi
Kortokhi
Ghorjomeladzeebi
Ghruta
Iakobadzeebi
Maniaketi
Dioknisi
Jvariketi
Tabakhmela
Godzauri
Shuasopeli
Rikheti
Beghleti
Danisparauli
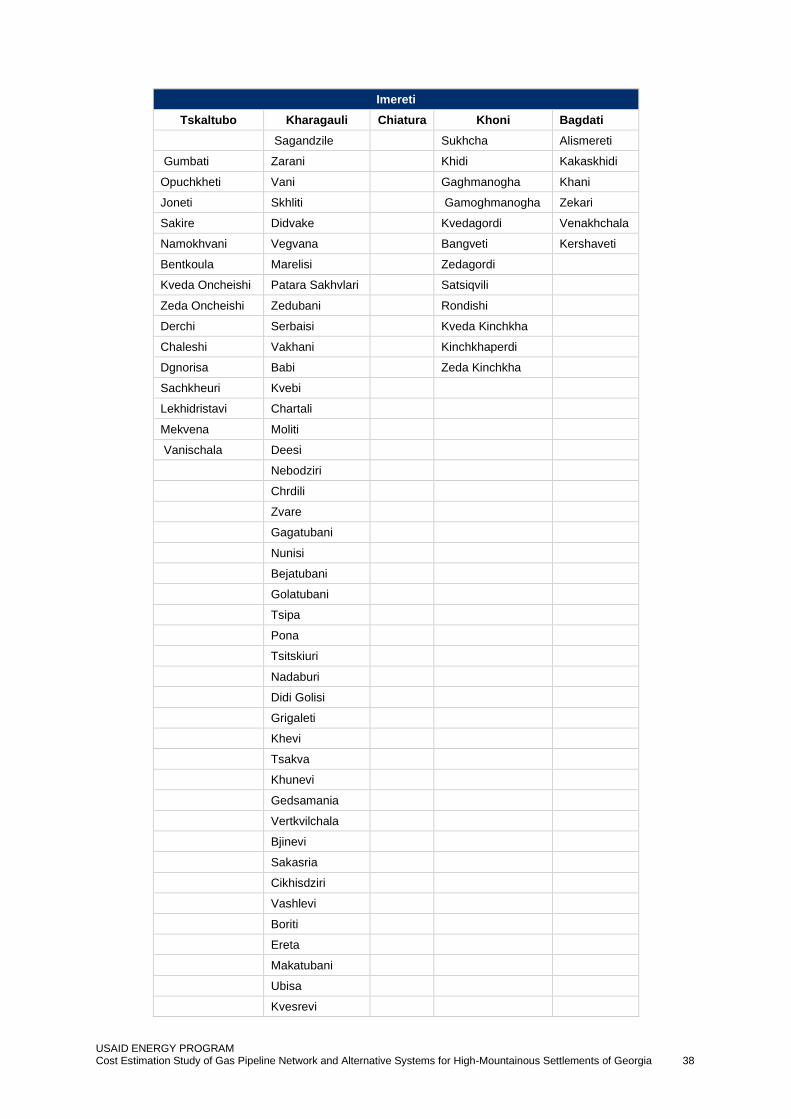
USAID ENERGY PROGRAM Cost Estimation Study of Gas Pipeline Network and Alternative Systems for High-Mountainous Settlements of Georgia 38
Imereti
Tskaltubo Kharagauli Chiatura Khoni Bagdati
Sagandzile Sukhcha Alismereti
Gumbati Zarani Khidi Kakaskhidi
Opuchkheti Vani Gaghmanogha Khani
Joneti Skhliti Gamoghmanogha Zekari
Sakire Didvake Kvedagordi Venakhchala
Namokhvani Vegvana Bangveti Kershaveti
Bentkoula Marelisi Zedagordi
Kveda Oncheishi Patara Sakhvlari Satsiqvili
Zeda Oncheishi Zedubani Rondishi
Derchi Serbaisi Kveda Kinchkha
Chaleshi Vakhani Kinchkhaperdi
Dgnorisa Babi Zeda Kinchkha
Sachkheuri Kvebi
Lekhidristavi Chartali
Mekvena Moliti
Vanischala Deesi
Nebodziri
Chrdili
Zvare
Gagatubani
Nunisi
Bejatubani
Golatubani
Tsipa
Pona
Tsitskiuri
Nadaburi
Didi Golisi
Grigaleti
Khevi
Tsakva
Khunevi
Gedsamania
Vertkvilchala
Bjinevi
Sakasria
Cikhisdziri
Vashlevi
Boriti
Ereta
Makatubani
Ubisa
Kvesrevi
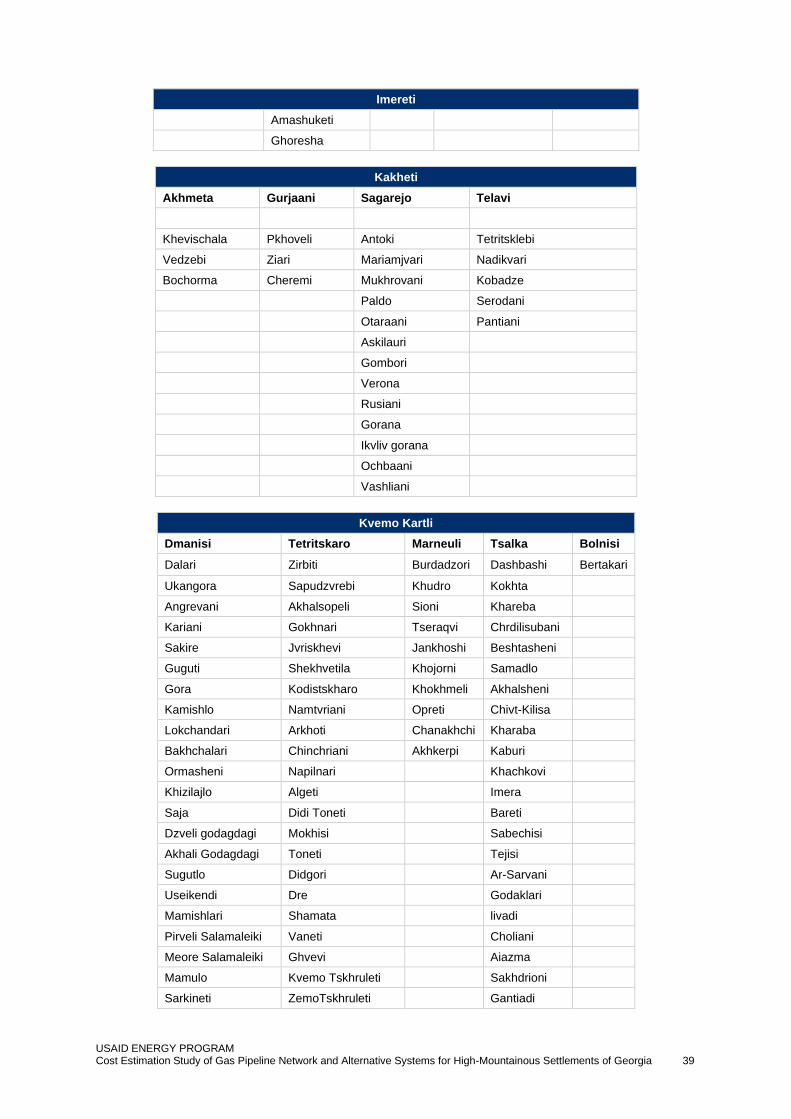
USAID ENERGY PROGRAM Cost Estimation Study of Gas Pipeline Network and Alternative Systems for High-Mountainous Settlements of Georgia 39
Imereti
Amashuketi
Ghoresha
Kakheti
Akhmeta Gurjaani Sagarejo Telavi
Khevischala Pkhoveli Antoki Tetritsklebi
Vedzebi Ziari Mariamjvari Nadikvari
Bochorma Cheremi Mukhrovani Kobadze
Paldo Serodani
Otaraani Pantiani
Askilauri
Gombori
Verona
Rusiani
Gorana
Ikvliv gorana
Ochbaani
Vashliani
Kvemo Kartli
Dmanisi Tetritskaro Marneuli Tsalka Bolnisi
Dalari Zirbiti Burdadzori Dashbashi Bertakari
Ukangora Sapudzvrebi Khudro Kokhta
Angrevani Akhalsopeli Sioni Khareba
Kariani Gokhnari Tseraqvi Chrdilisubani
Sakire Jvriskhevi Jankhoshi Beshtasheni
Guguti Shekhvetila Khojorni Samadlo
Gora Kodistskharo Khokhmeli Akhalsheni
Kamishlo Namtvriani Opreti Chivt-Kilisa
Lokchandari Arkhoti Chanakhchi Kharaba
Bakhchalari Chinchriani Akhkerpi Kaburi
Ormasheni Napilnari Khachkovi
Khizilajlo Algeti Imera
Saja Didi Toneti Bareti
Dzveli godagdagi Mokhisi Sabechisi
Akhali Godagdagi Toneti Tejisi
Sugutlo Didgori Ar-Sarvani
Useikendi Dre Godaklari
Mamishlari Shamata livadi
Pirveli Salamaleiki Vaneti Choliani
Meore Salamaleiki Ghvevi Aiazma
Mamulo Kvemo Tskhruleti Sakhdrioni
Sarkineti ZemoTskhruleti Gantiadi

USAID ENERGY PROGRAM Cost Estimation Study of Gas Pipeline Network and Alternative Systems for High-Mountainous Settlements of Georgia 40
Kvemo Kartli
Ganakhleba Gholovani Darakovi
Velispiri Orbeti Tsintskharo
Akha Akhali Zirbiti Santa
Pantiani Nadrevani
Tsveri Kushi
Tskhrakudaani Artsivani
Patara Toneti Berta
Abrameti Burnasheti
Amlevi Ozni
Tbisi Izil-Kilisa
Abeliani Avranlo
Khopisi Gumbati
Ksovreti Ashkala
Gudarekhi Rekha
Vake Khando
Chivchavi Trialeti
Ivanovka Kavta
Ipari Khramesi
Samghereti Bediani
Kvemo Akhalsheni
Shikhilo
Lipi
Didi Iraga
Jigrasheni
Patara Iraga
Dumanisi
Alekseevka
Navtiani
Menkalisi
Didi Kldisi
Mtskheta-Mtianeti
Dusheti Mtskheta Tianeti
Keriaantkari Bevreti Churchelauri
Akhali Osebi Tabaruki Mamadaanebi
Mtsiturebi Temazi Lisho
Lapanaantkari Kevliani Bodakheva
Dzveli Osebi(Nokorna) Skhaltba Tetraulebi
Khiznebi Mshralkhevi Kvemo artani
Davati Zemo artani
Kvemo Gharistskali Ghorgha
Kenchaklde Akhalsopeli
Satskhatlo Chabano
Kheobis chiaura
Tsiteli Klde Gojiaanebi
Varcla Duluzaurebi
Dolosha Kvernaura

USAID ENERGY PROGRAM Cost Estimation Study of Gas Pipeline Network and Alternative Systems for High-Mountainous Settlements of Georgia 41
Mtskheta-Mtianeti
Akhali toncha sxlovani
Javakhiaantkari Tetrakhevi
Arghuni Bokoni
Dudaurebi paloti
Kvemo Ashi Chekuraant Gori
Akhalani Evjeneti
Kerani Melias khevi
Veltuatrtkari Tolenji
Vedzartkhevi Tsalughelaantkari
Iori Simoniant Khevi
Chilurti Gorana
Ebnisi Nadorka
Karkushaani Siontgori
Milekiani Balebis Khevi
Akhalai Berghuli Kvernauli
Dzveli Berghuli Kviriaskhevi
Petriani Khevturtsopeli
Tsikhisubani Devenaant Khevi
Kedeloba Sakdrioni
Tsigriaantkari Vedzatkheva
Toncha Zurabebi
Tsitsamuri, Kvemo Shuakhevi Doreuli
Zemo Shuakhevi Kvemo Nakalakari
Kvitkiristskaro Zemo Nakalakari
Chivilianebi Magraneti
Bantsuraantkari Trani
Tandilaantkari Tokholcha
Kadoeti Khadoelebi
Pavleuri Tskarotubani
Tsivtskharo Gudanelebi
Dgnali Toladsopeli
Tsinamkhari Ghulelebi
Veshagurni Orkhevi
Ukanamkhare Betsentsurebi
Tskhvedieti Sajinibo
Dikhcho Badaani
Bakhani Khudro
Makareti Pichviani
Lutkhubi Bochorma
Torelaani Omaraane
Pakhviji Grdzelvelebi
Totiaurni
Bakurkhvi
Kitokhi
Zanduki
Gamsi
Chokha
Dumatskho
Jijoni
Tsipori
Khevsha
Kharkheti
Sepa
Gvidaqe
Lakatkhevi

USAID ENERGY PROGRAM Cost Estimation Study of Gas Pipeline Network and Alternative Systems for High-Mountainous Settlements of Georgia 42
Mtskheta-Mtianeti
Khvelaani
Salajuri
Manaseurni
Bodavi
Khartisho
Gudrukhi
Tvalivi
Stsrofavi
Nedzikhi
Lausha
Sondisveli
Kvemo Khorkhi
Zemo Khorkhi
Kvemo Sharakhevi
Sharakhevi
Tsipnari
Kanatia
Kuchecha
Magharoskari
Khiliani
Gometsari
Kalilo
Chargali
Migriaulta
Gudarakhi
Katsalkhevi
Khomi
Apsho
Udzilauri
Tkhiliani
Shuapkho
Muko
Khorasha
Akhadi
Ukanapshavi
Datvisi
Gveleti
Barisakho
Korsha
Roshka
Gudani
Biso
Khakhmati
Shatili
Mutso
Racha-Lechkhumi and Kvemo Svaneti
Lentekhi Oni Ambrolauri Tsageri
Doghurashi Mukhli Zeda Tlughi Korenishi
Naghomari Santisi Kveda Tlughi Tvishi
Rckhmeluri Kvemobari Ukeshi Orkhvi
Kvedreshi Zemobari Agara Lakhepa
Lagharvashi Mravaldzali Cheliaghele Alpana
Gvimbrala Chibrevi Kachaeti Achara
Tsiplakakia Kheiti Nikortsminda Zeda Sairme
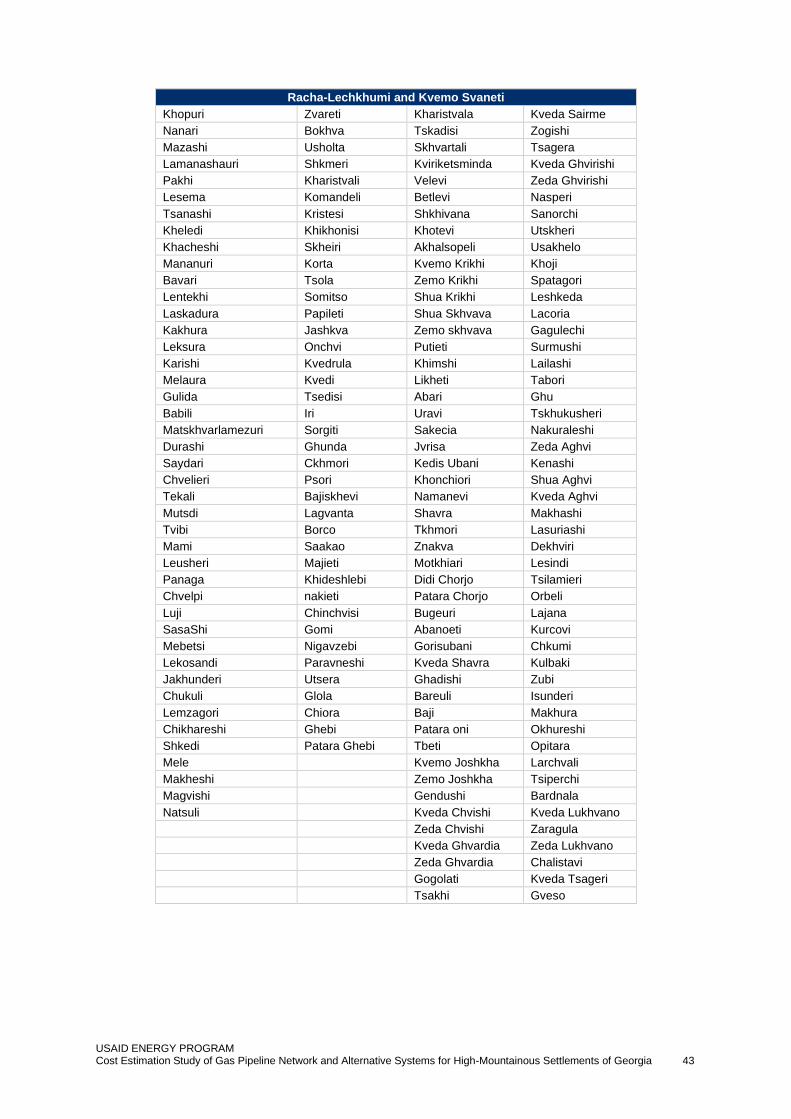
USAID ENERGY PROGRAM Cost Estimation Study of Gas Pipeline Network and Alternative Systems for High-Mountainous Settlements of Georgia 43
Racha-Lechkhumi and Kvemo Svaneti
Khopuri Zvareti Kharistvala Kveda Sairme
Nanari Bokhva Tskadisi Zogishi
Mazashi Usholta Skhvartali Tsagera
Lamanashauri Shkmeri Kviriketsminda Kveda Ghvirishi
Pakhi Kharistvali Velevi Zeda Ghvirishi
Lesema Komandeli Betlevi Nasperi
Tsanashi Kristesi Shkhivana Sanorchi
Kheledi Khikhonisi Khotevi Utskheri
Khacheshi Skheiri Akhalsopeli Usakhelo
Mananuri Korta Kvemo Krikhi Khoji
Bavari Tsola Zemo Krikhi Spatagori
Lentekhi Somitso Shua Krikhi Leshkeda
Laskadura Papileti Shua Skhvava Lacoria
Kakhura Jashkva Zemo skhvava Gagulechi
Leksura Onchvi Putieti Surmushi
Karishi Kvedrula Khimshi Lailashi
Melaura Kvedi Likheti Tabori
Gulida Tsedisi Abari Ghu
Babili Iri Uravi Tskhukusheri
Matskhvarlamezuri Sorgiti Sakecia Nakuraleshi
Durashi Ghunda Jvrisa Zeda Aghvi
Saydari Ckhmori Kedis Ubani Kenashi
Chvelieri Psori Khonchiori Shua Aghvi
Tekali Bajiskhevi Namanevi Kveda Aghvi
Mutsdi Lagvanta Shavra Makhashi
Tvibi Borco Tkhmori Lasuriashi
Mami Saakao Znakva Dekhviri
Leusheri Majieti Motkhiari Lesindi
Panaga Khideshlebi Didi Chorjo Tsilamieri
Chvelpi nakieti Patara Chorjo Orbeli
Luji Chinchvisi Bugeuri Lajana
SasaShi Gomi Abanoeti Kurcovi
Mebetsi Nigavzebi Gorisubani Chkumi
Lekosandi Paravneshi Kveda Shavra Kulbaki
Jakhunderi Utsera Ghadishi Zubi
Chukuli Glola Bareuli Isunderi
Lemzagori Chiora Baji Makhura
Chikhareshi Ghebi Patara oni Okhureshi
Shkedi Patara Ghebi Tbeti Opitara
Mele Kvemo Joshkha Larchvali
Makheshi Zemo Joshkha Tsiperchi
Magvishi Gendushi Bardnala
Natsuli Kveda Chvishi Kveda Lukhvano
Zeda Chvishi Zaragula
Kveda Ghvardia Zeda Lukhvano
Zeda Ghvardia Chalistavi
Gogolati Kveda Tsageri
Tsakhi Gveso

USAID ENERGY PROGRAM Cost Estimation Study of Gas Pipeline Network and Alternative Systems for High-Mountainous Settlements of Georgia 44
Samegrelo-Zemo Svaneti
Mestia
Narkorvali
Tsitskhvari
Idliani
Leburtskhila
Nashikhvi
Naki
Zeda Khaishi
Skormeti
Gaghma Khaishi
Shgedi
Kvemo Tsvirnindi
Nankhburi
Kvemo Vendi
Khaishi
Tobari
Lukhi
Lakhami
Letsperi
Devra
Khari
Larilari
Kveda Marghi
Lekulmakhi
Zeda Marghi
Sgurishi
Tita
Jorkvali
Kveda Ipari
Khelra
Dizi
Shdikhiri
Anili
Nakra
Kvitsani
Lekvanshi
Gentsvishi
Tsaleri
Lotsomba
Nodashi
Lakhamula
Kveda Luha
Khosrari

USAID ENERGY PROGRAM Cost Estimation Study of Gas Pipeline Network and Alternative Systems for High-Mountainous Settlements of Georgia 45
Samegrelo-Zemo Svaneti
Gheshderi
Zeda Luha
Lamkheri
Zagari
Pari
Katskhi
Svipi
Landreri
Lashkhreri
Lanteli
Tsalnari
Khuteri
Iskari
Kurashi
Barshi
Cheriri
Kalashi
Ughvashi
Ebuti
Lankhvari
Kartvani
Doli
Dolasvipi
Chkhidanari
Ushkhvanari
Galashi
Nashtkoli
Chokhuldi
Bagvdnari
Mazeri
Tvebishi
Tskhekvani
Magardeli
Labskhaldi
Tviberi
Lezgara
Svipi
Ghvebaldi
Matskhvarishi
Shkhaleri
Lankhva-Zagrali
Ipkhi
Leshukvi
Lelbagi

USAID ENERGY PROGRAM Cost Estimation Study of Gas Pipeline Network and Alternative Systems for High-Mountainous Settlements of Georgia 46
Samegrelo-Zemo Svaneti
Kvanchianari
Ienashi
Lakhushdi
Soli
Kaeri
Kashveti
Lemsia
Lashtkhveri
Mezguni
Mestia
Lamjurishi
Heshkiri
Ieli
Ghvebra
Zardalashi
Artskheli
Musrshkeli
Lakhiri
Jhaamushi
Cholashi
Majvdieri
Chvabiani
Tsaladashi
Jabeshi
Askarti
Tsvirmi
Chobani
Nakipari
Zegani
Adishi
Bogreshi
Vichnashi
Khe
Lalkhorali
Iprari
Khalde
Davberi
Murkhmeli
Chajashi
Chvibiani
Jibiani
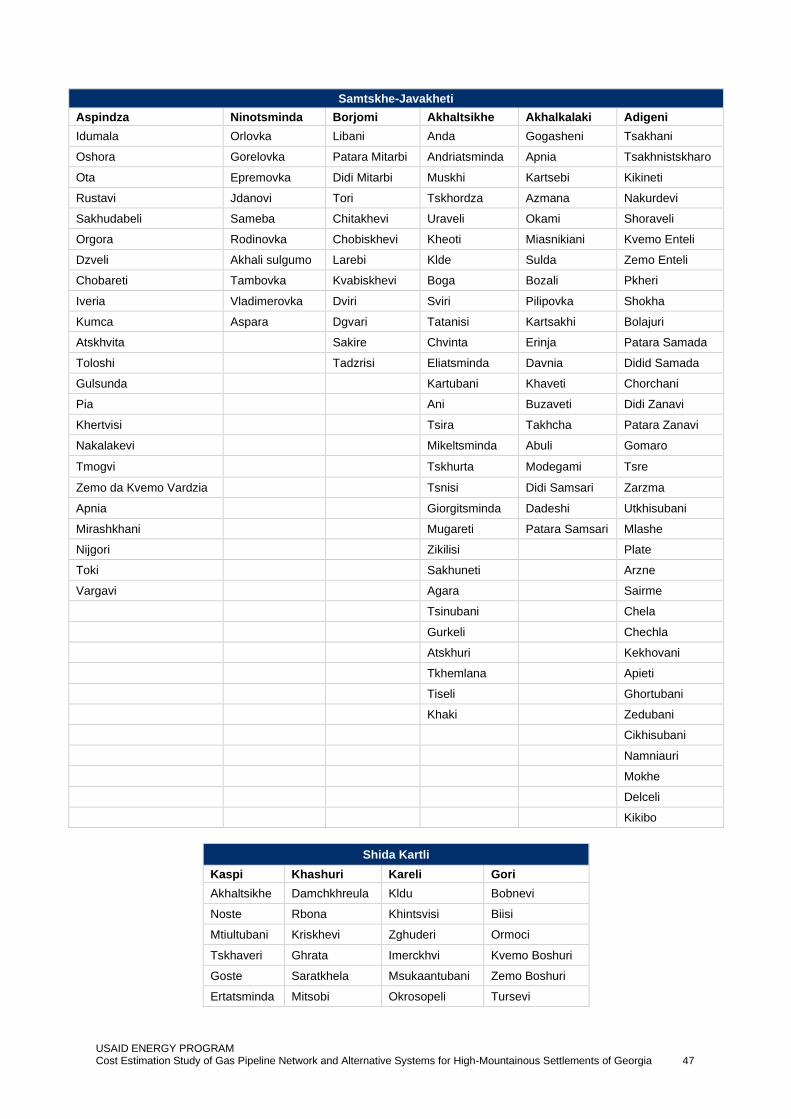
USAID ENERGY PROGRAM Cost Estimation Study of Gas Pipeline Network and Alternative Systems for High-Mountainous Settlements of Georgia 47
Samtskhe-Javakheti
Aspindza Ninotsminda Borjomi Akhaltsikhe Akhalkalaki Adigeni
Idumala Orlovka Libani Anda Gogasheni Tsakhani
Oshora Gorelovka Patara Mitarbi Andriatsminda Apnia Tsakhnistskharo
Ota Epremovka Didi Mitarbi Muskhi Kartsebi Kikineti
Rustavi Jdanovi Tori Tskhordza Azmana Nakurdevi
Sakhudabeli Sameba Chitakhevi Uraveli Okami Shoraveli
Orgora Rodinovka Chobiskhevi Kheoti Miasnikiani Kvemo Enteli
Dzveli Akhali sulgumo Larebi Klde Sulda Zemo Enteli
Chobareti Tambovka Kvabiskhevi Boga Bozali Pkheri
Iveria Vladimerovka Dviri Sviri Pilipovka Shokha
Kumca Aspara Dgvari Tatanisi Kartsakhi Bolajuri
Atskhvita Sakire Chvinta Erinja Patara Samada
Toloshi Tadzrisi Eliatsminda Davnia Didid Samada
Gulsunda Kartubani Khaveti Chorchani
Pia Ani Buzaveti Didi Zanavi
Khertvisi Tsira Takhcha Patara Zanavi
Nakalakevi Mikeltsminda Abuli Gomaro
Tmogvi Tskhurta Modegami Tsre
Zemo da Kvemo Vardzia Tsnisi Didi Samsari Zarzma
Apnia Giorgitsminda Dadeshi Utkhisubani
Mirashkhani Mugareti Patara Samsari Mlashe
Nijgori Zikilisi Plate
Toki Sakhuneti Arzne
Vargavi Agara Sairme
Tsinubani Chela
Gurkeli Chechla
Atskhuri Kekhovani
Tkhemlana Apieti
Tiseli Ghortubani
Khaki Zedubani
Cikhisubani
Namniauri
Mokhe
Delceli
Kikibo
Shida Kartli
Kaspi Khashuri Kareli Gori
Akhaltsikhe Damchkhreula Kldu Bobnevi
Noste Rbona Khintsvisi Biisi
Mtiultubani Kriskhevi Zghuderi Ormoci
Tskhaveri Ghrata Imerckhvi Kvemo Boshuri
Goste Saratkhela Msukaantubani Zemo Boshuri
Ertatsminda Mitsobi Okrosopeli Tursevi

USAID ENERGY PROGRAM Cost Estimation Study of Gas Pipeline Network and Alternative Systems for High-Mountainous Settlements of Georgia 48
Shida Kartli
Chachubeti Tsromi Tsitelsopeli Khvelaantubani
Rkoni Nadarbazevi Ortubani Gagluaantubani
Kaprashiani I,merliantkari Elbakiantkari Levitana
Chkhopiani Didi Khavleti Gverdzineti Tsedisi
Varjani Patara Kheleti Bnavisi
Didi Kheleti Olozi
Ghvarevi
Guria
Chokhatauri
Kvabgha
Chkhakoura
Zoti

USAID ENERGY PROGRAM Cost Estimation Study of Gas Pipeline Network and Alternative Systems for High-Mountainous Settlements of Georgia 49
ANNEX 3: ILLUSTRATIVE MAP OF SETTLEMENTS

USAID Energy Program
Deloitte Consulting Overseas Projects LLP
Address: 29 I. Chavchavadze Ave.,0179, Tbilisi, Georgia
Phone: +(995) 595 062505
E-mail: [email protected]