Appendix J Powertech Pumping Tests
194
APPENDIX J Powertech Pumping Tests July 2012 J-i Appendix J
-
Upload
khangminh22 -
Category
Documents
-
view
0 -
download
0
Transcript of Appendix J Powertech Pumping Tests

APPENDIX J
Powertech Pumping Tests
July 2012 J-i Appendix J

Knight Piesold CONaUL.TING
Rev. No. 0
Date
Powertech (USA) Inc. Dewey-Burdock Project
2008 Pumping Tests: Results and Analysis
November 2008
Prepared for
Powertech (USA) Inc. 5575 DTC Parkway, Suite 140 Greenwood Village, CO 80111
Telephone: (303) 790-7528 Telefax: (303) 790-3885
Prepared by
Knight Piesold and Co. 1580 Lincoln Street, Suite 1000
Denver, Colorado 80203 Telephone: (303) 629-8788
Telefax: (303) 629-8789
Project DV102.00279.01
Descri~tion Knight Pi esold Client
November 2008 Final to Client Paul Berg strom Powertech (USA)
July 2012 J-1 Appendix J

Knight Piesold CON8ULTING
Powertech (USA) Inc. Dewey-Burdock Project
2008 Pumping Tests: Results and Analysis
Table of Contents
List of Tables ................................................................................................................................. iv
List of Figures ................................................................................................................................. v
List of Drawings ............................................................................................................................ vii
List of Appendices ........................................................................................................................ viii
1. Introduction .............................................................................................................................. 1-1
1.1. Objectives ................................................................................................................. 1-1
1.2. Report Organization .................................................................................................. 1-2
1.3. Limitations and Disclaimer ....................................................................................... 1-3
2. Site Characterization ................................................................................................................ 2-1
2.1. Stratigraphy ............................................................................................................... 2-1
2.1.1 Overlying Unit: Skull Creek Formation Shales. .......................................... 2-1
2.1.2 Inyan Kara Group: Fall River Formation and Lakota Formation Sandstones .............................................................................. 2-2
2.1.3 Underlying Units: Morrison Formation Shale and
Unkpapa/Sundance Formation Sandstone ............................................... 2-3
2.2. Hydrogeologic Conditions: Potentiometric Surface and Hydraulic
Gradient. ............................................................................................................... 2-3
2.3. Summary of Previous Aquifer Testing Results ........................................................ 2-5
2.3.1 Dewey Project Area .................................................................................... 2-5
2.3.2 Burdock Project Area .................................................................................. 2-6
3. 2008 Pumping Tests: Design and Procedures .......................................................................... 3-l
3.1. Well Installation, Completion and Mechanical Integrity Testing ............................. 3-1
3.2. Pumping Test Equipment and Facilities ................................................................... 3-1
3.3. Background Monitoring and Water Level Corrections ............................................ 3-2
3.4. Test Procedures, Data Collection, Data Processing .................................................. 3-4
4. Dewey Project Area Pumping test ........................................................................................... 4-1
DV1 02.00279.01 November 2008
Dewey-Burdock 2008 Pump Test Report Rev O.doc
July 2012 J-2 Appendix J

Knight Piesold CONSULTING
Table of Contents (Continued)
4.1. Test Layout and Initial Potentiometric Surface Measurements ............................... .4-1
4.2. Pumping Rate and Duration ......................................................................................... 4-2
4.3. Responses at Pumping and Observation Wt::lls .......................................................... A-2
4.4. Determination of Aquifer Parameters .......................................................................... 4-3
4.4.1 Theis Drawdown and Recovery Analysis ..................................................... 4-3
4.4.2 Theis-Cooper-Jacob Straight-line Analysis ................................................. 4-4
4.4.3 Distance-Drawdown Analysis ....................................................................... 4-5
4.4.4 Summary of Dewey Test - Lower Fall River Formation
Aquifer Parameters .................................................................................... 4-5
4.5. Underlying Lakota Aquifer Test Results ................................................................... .4-6
4.6. Underlying Unkpapa Aquifer Test Results ................................................................. 4-6
5. Burdock Project Area Pumping test.. ......................................................................................... 5-1
5 .1. Test Layout and Initial Potentiometric Surface Measun:ments ................................ 5-l
5.2. Pumping Rate and Duration ....................................................................................... 5-2
5.3. Responses at Pumping and Observation Wells .......................................................... 5-2
5.4. Determination of Aquifer Parameters ....................................................................... 5-3
5 .4.1 Theis Draw down Analysis .......................................................................... 5-3
5 .4.2 Hantush-Jacob Draw down Analysiis ........................................................... 5-4
5.4.3 Theis-Cooper-Jacob Straight-line Analysis ................................................ 5-5
5.4.4 Distance-Drawdown Analysis .................................................................... 5-5
5.4.5 Summary of Burdock Test - Lower Lakota (Chilson)
Formation Aquifer Parameters ................................................................. 5-6
5.5. Overlying Fall River Aquifer Test Results ............................................................... 5-7
5.6. Underlying Unkpapa Aquifer Test Results ............................................................... 5-8
6. Laboratory Core Data .............................................................................................................. 6-1
6.1. Background ............................................................................................................... 6-1
6.2. Conversion from Intrinsic Permeability to Hydraulic Conductivity ......................... 6-1
6.3. Interpretations of the Laboratory Core Data ............................................................. 6-2
6.4. Conclusions ............................................................................................................... 6-3
7. Summary and Conclusions ...................................................................................................... 7-1
DV1 02.00279.01 ii November 2008
Dewey-Burdock 2008 Pump Test Report Rev O.doc
July 2012 J-3 Appendix J

Knight Piesold GONaULTING
Table of Contents (Continued)
7.1. Burdock Project Area ................................................................................................... 7-1
7.1.1 Summary ........................................................................................................ 7-1
7.1.2 Conclusions .................................................................................................... 7-2
7.2. Dewey Project Area ..................................................................................................... 7-4
7.2.1 Summary ........................................................................................................ 7-4
7.2.2 Conclusions .................................................................................................... 7-4
8. Certification ............................................................................................................................... 8-1
9. References .................................................................................................................................. 9-1
DV1 02.00279.01 lll November 2008
Dewey-Burdock 2008 Pump Test Report Rev O.doc
July 2012 J-4 Appendix J

Knight Piesold CON8ULTING
List of Tables
Table Title
4.1 Dewey Pump Test Completion Information
4.2 Dewey Pump Test Drawdown and Response Summary
4.3 Summary of Aquifer Hydraulic Characteristics for the Dewey Pumping Test
5.1 Burdock Pump Test Completion Information
5.2 Burdock Pump Test, Drawdown and Response Summary
5.3 Summary of Aquifer Hydraulic Characteristics for the Burdock Pumping Test
6.1 Laboratory Core Analyses for Powertech USA, Inc. at Dewey-Burdock Site
DV102.00279.01 iv November 2008
Dewey-Burdock 2008 Pump Test Report Rev O.doc
July 2012 J-5 Appendix J

Knight Piesold CON8ULTING
List of Figures
Figure
1.1
2.1
2.2
2.3
2.4
2.5
3.1
3.2
4.1
4.2
4.3
4.4
4.5
4.6
4.7
4.8
5.1
5.2
5.3
DV1 02.00279.01
Title
1979-1982 and 2008 Pumping Test Locations
Site Stratigraphy
Site Surface Geology
Potentiometric Surface, Fall River Aquifer, 2008
Potentiometric Surface, Lakota Aquifer, 2008
Potentiometric Surface, Unkpapa Aquif~:r, 2008
Background Monitoring (April 8 to May 26, 2008)
Flowmeter Readings (May 9 to May 24, 2008)
Dewey May 2008 Pumping Test Well Locations
Transducer Response at Dewey Test Pumping Well 32-3C, Observation Wells
32-5 and 32-4C
Transducer Response at Dewey Test Observation Wells GW-49, 29-7, and 32-9C
Non-responding Dewey Test Observation Wells 32-10 (Lakota) and 32-11
(Unkpapa) compared to Pumping Well
Drawdown and Analysis at Dewey Test Observation Wdl 32-5
Theis Recovery Analysis at Dewey Observation Well32-5
Straight-line Analyses of Drawdown and Recove:ry at Dewey Pumping Well
32-3C
Distance Drawdown Analysis, Dewey Pumping Test
Burdock May 2008 Pumping Test Well Locations
Transducer Response at Burdock Test Pumping Wdl 11-llC, Observation Wells
11-15 and ll-14C
Transducer Response at Burdock Test Observation Wells 11-2, 11-19 and 11-17
v November 2008
Dewey-Burdock 2008 Pump Test Report Rev O.doc
July 2012 J-6 Appendix J

Knight Piesold CON.ULTING
List of Figures (Continued)
Figure
5.4
5.5
5.6
5.7
5.8
DV1 02.00279.01
Title
Non-responding Burdock Test Observation Well 11-18 (Unkpapa) compared to
Pumping Well and Observation Well 11-17 (Fall River)
Drawdown and Analysis at Burdock Test Observation Wellll-14C
Hantush-Jacob Leaky Confined Aquifer Analysis at Burdock Observation Well
11-14C
Straight-line Analyses ofDrawdown and Recovery at Burdock Pumping Well 11-
llC
Distance-Drawdown Analysis, Burdock Pumping n~st
VI November 2008
Dewey-Burdock 2008 Pump Test Report Rev O.doc
July 2012 J-7 Appendix J

Knight Piesold CON8ULTING
List of Drawings
Drawing Title
4.1 Stratigraphic Cross-Section C-C', Dewey Pump Test
4.2 Stratigraphic Cross-Section D-D', Dewey Pump Test
5.1 Stratigraphic Cross-Section C-C', Burdock Pump T~est
5.2 Stratigraphic Cross-Section D-D', Burdock Pump Test
5.3 Stratigraphic Cross-Section E-E', Burdock Pump Test
DV102.00279.01 vii November 2008
Dewey-Burdock 2008 Pump Test Report Rev O.doc
July 2012 J-8 Appendix J

Knight Piesold CON8ULTING
List of Appendices
Appendix Title
A Additional Information and Analysis Procedures
A-1 Background Monitoring and Barometric Efficiency Calculations
Figure A.l-1 Background Water Level and Site Barometer Readings, Dewey/Fall River Barometric Efficiency Calculations
Figure A.1-2 Background Water Level and Site Barometer Readings, Burdock/Lakota Barometric Efficiency Calculations
Figure A.l-3 Time-series from USGS Spreadsheet Method (Halford, 2006) for Dewey, Observation Well 32-4C Background Measurements and Site Barometer Readings
Figure A.l-4 Plotted Time-series Output for Dewey Observation Well 32-4C Background Measurements and Site Barometer Readings
A-2 Overview of Aquifer Test Analysis Procedures and Tools Used
B Dewey Test Supplemental Information
DV1 02.00279.01
B-1 Well Completion Diagrams B-2 Time and Water Level Data Values Used in Pumping Test Analysis:
Dewey Test, Drawdown Data B-3 Time and Water Level Data Values Used in Pumping Test Analysis:
Dewey Test, Recovery Data B-4 Additional Aquifer Parameter Determinations
Figure B.4-1 Theis Drawdown Analysis at Dew1ey Pumping Well32-3C
Figure B.4-2 Theis Drawdown Analysis at Dewey Observation Well32-5
Figure B.4-3 Theis Drawdown Analysis at Dewey Observation Well 32-4C
Figure B.4-4 Theis Drawdown Analysis at Dewey Stock Well GW-49
Figure B.4-5 Theis Drawdown Analysis at Dew1ey Observation Well 29-7
Figure B.4-6 Theis Drawdown Analysis at Dewey Upper Fall River Observation Well 32-9C
viii November 2008
Dewey-Burdock 2008 Pump Test Report Rev O.doc
July 2012 J-9 Appendix J

Knight Piesold CONaULTING
List of Appendices (Continued)
Appendix Title
Figure B.4-7 Theis-Cooper-Jacob Recovery Analyses, Dewey Observation
Wells 32-4C and GW-49
Figure B.4-8 Theis-Cooper-Jacob Recovery Analyses, Dewey Observation
Wells 32-5 and 32-9C
C Burdock Test Supplemental Information
DV102.00279.01
C-1 Well Completion Diagrams C-2 Time and Water Level Data Values Used in Pumping Test Analysis:
Burdock Test, Drawdown Data C-3 Time and Water Level Data Values Used int Pumping Test Analysis:
Burdock Test, Recovery Data C-4 Additional Aquifer Parameter Determinations
Figure C.4-1 Theis Drawdown Analysis at Burdock Pumping Well
11-11C
Figure C.4-2 Theis Drawdown Analysis at Burdock Observation Well
11-15
Figure C.4-3 Theis Drawdown Analysis at Burdock Observation Well
11-14C
Figure C.4-4 Theis Recovery Analysis at Burdock Observation Well
ll-14C
Figure C.4-5 Theis Drawdown Analysis at Burdock Observation Well
11-2
Figure C.4-6 Hantush-Jacob Leaky Confined Aquifer Analysis at Burdock
Observation Well 11-2
Figure C.4-7 Drawdown and Analysis at Burdock Test Observation Well
11-19 (Upper Lakota)
Figure C.4-8 Theis-Cooper-Jacob Recovery Analyses at Burdock
Observation Wells 11-15 and 11-19
Figure C.4-9 Theis-Cooper-Jacob Recovery at Burdock Observation Wells
ll-14C and 11-02
ix November 2008
Dewey-Burdock 2008 Pump Test Report Rev O.doc
July 2012 J-10 Appendix J

Knight Piesold CONaULTING
List of Appendices (Continued)
Appendix Title
D Laboratory Core Data
E CD-ROM: Raw Pressure Transducer Data in Win Situ TM Format
DV1 02.00279.01 X November 2008
Dewey-Burdock 2008 Pump Test Report Rev O.doc
July 2012 J-11 Appendix J

Knight Piesold CONaULTING
1.0 Introduction
Powertech (USA) Inc. Dewey-Burdock Project
2008 Pumping Tests: Results and Analysis
Powertech Uranium Corp. (Powertech) is submitting an application to the United States Nuclear
Regulatory Commission (USNRC) for the Radioactive Source Materials License to develop and
operate the Dewey-Burdock Uranium Project using in-·situ recovery (ISR) methods. The project
is located near Edgemont, South Dakota in Custer and Fall River Counties and will consist of
injection and production well fields and a central proc:essing plant (ion exchange resin columns
and yellowcake dryer) to recover the final uranium product.
Figure 1.1 shows the project location and license boundary. The Project is located
approximately 12 miles north-northwest of Edgemont, South Dakota and spans northern Fall
River and southern Custer Counties. The project boundary encompasses approximately
11,000 acres of private land on either side of County Road 6463. The Dewey-Burdock project
will operate uranium ISR production facilities at both the Dewey and Burdock project areas, with
a central processing plant located at the Burdock site. It is anticipatedl that the ISR well fields at
each site will operate at an estimated flow rates of between 1500 gallons per minute (gpm) to
2000 gpm. Net withdrawal of groundwater during ISR leaching operations is expected to be
0.5 to 3 percent of total flow, or 10 to 60 gpm at each site. Total! production from both sites is
expected to produce approximately 1,000,000 pounds ofU308 per year.
1.1 Objectives
USNRC NUREG 1569 Sections 2.7.2 and 2.7.3, Hydrology, Review Procedures (3) and
Acceptance Criteria (3), describe the type of infonnation and analyses that can fulfill the
requirements for a description of Site hydrogeology. Consistent with the examples provided in
the NUREG sections referenced above, the objective of this report is to provide the
determinations of aquifer properties obtained with two pumping te:sts together with the results of
laboratory tests Powertech conducted on related core samples. Th1;: pumping tests are interpreted
in the context of geological and hydrogeological data that are summarized here and presented
authoritatively in greater detail in NRC Technical Report Sections 2.6 and 2.7. The more
detailed information presented outside this report consists of: ( 1) geologic cross-sections,
including the underlying electric log data from test pumping wells, test observation wells and
DV1 02.00279.01 1-1 November 2008
Dewey-Burdock 2008 Pump Test Report Rev O.doc
July 2012 J-12 Appendix J

Knight Piesold CONaULTING
nearby exploration boreholes; (2) isopach maps ofthe production zone, overlying confining units
and aquifers and underlying confining units and aquifers; and (3) potentiometric surface maps of
the major aquifers.
Other information prescribed in NUREG 1569 Section 2.7.1, Hydrology, Areas of Review (3),
notably soil survey and baseline groundwater quality information, is presented in separate
reports. It is noted that the pumping tests described here are not intended to replace well field
scale pumping tests that are proposed to be conducted prior to startup of each particular mine
unit. The following information is included in this report:
• Site location maps
• A summary of previous pumping test results
• A synopsis of geologic and hydrogeologic information for the Project Area relevant
to the interpretation of pumping tests, including detailed conceptual stratigraphic
cross-sections illustrating the test layouts relative to ore-body features
• Presentation of the pumping test results, including raw test data (drawdown graphs)
that provide overall response characteristics for all wells monitored during the tests
• Interpretation of aquifer parameters using type curve mat1:hes and other methods of
parameter determinations
• Interpretation, based on the communication of pumping and observation wells that it
is likely feasible to conduct ISR mining within limited portlions of the major aquifers
• Interpretation, based on the pumping test data and laboratory core data, that there is
likely additional vertical containment between major aquitards overlying and
underlying the major aquifers
1.2 Report Organization
This report includes seven sections. Section 1 (this section) is th1~ introduction. Section 2
describes site-specific geologic and hydrogeologic conditions foliowed by a summary of
previous aquifer tests in the period 1979 to 1982. Section 3 describes the general procedures for
well installation, test equipment used, background measurements, and data processing
procedures for the pumping tests. Details of the background monitoring and analysis are
provided in Appendix A-1, and Appendix A-2 provides an overview of pumping test
interpretation methods, theoretical considerations, and spreadsheet tools used for test analysis.
Section 4 describes the results and analysis of the pumping test at the Dewey test location;
Appendix B provides backup data for the Dewey Pumping Te:st including well completion
DV1 02.00279.01 1-2 November 2008
Dewey-Burdock 2008 Pump Test Report Rev O.doc
July 2012 J-13 Appendix J

Knight Piesold CONeULTING
diagrams, processed time-drawdown data used to perform tht:: test analysis, and the
determinations of aquifer parameters with graphical methods not dirc~ctly presented in the text.
Similarly, Section 5 describes the results and analysis at th1~ Burdock test location and
Appendix C provides the related data for the Burdock test. Section 6 is a summary of laboratory
core testing information and Appendix D provides the laboratory data report for the core testing.
Section 7 is a summary describing major conclusions from the h~sting. Appendix E is a
CD-ROM that contains the raw digital pressure transducer data in binary files.
1.3 Limitations and Disclaimer
This report entitled "Powertech (USA) Inc., Dewey-Burdock Project, 2008 Pumping Tests:
Results and Analysis" has been prepared by Knight Piesold andl Co. for the exclusive use of
Powertech (USA) Inc. No other party is an intended beneficiary of this report or the information,
opinions, and conclusions contained herein. Any use by any party other than Powertech (USA)
Inc. of any of the information, opinions, or conclusions is the sole n~sponsibility of said party.
The use of this report shall be at the sole risk of the user regardless of any fault or negligence of
Powertech (USA) Inc. or Knight Piesold and Co.
The information and analyses contained herein have been completed to a level of detail
commensurate with the objectives of the assignment. This r~eport and its supporting
documentation have been reviewed and/or checked for conformance with industry-accepted
norms and applicable government regulations. Calculations and computer simulations have been
checked and verified for reasonableness, and the content of the report has been reviewed for
completeness, accuracy, and appropriateness of conclusions. To the best of the information and
belief of Knight Piesold and Co. the information presented in this report is accurate to within the
limitations specified herein.
Any reproductions of this report are uncontrolled and may not be the most recent revision.
DV1 02.00279.01 1-3 November 2008
Dewey-Burdock 2008 Pump Test Report Rev O.doc
July 2012 J-14 Appendix J

Knight Piesold CONaULTING
2.0 Site Characterization
This section presents a synopsis of geologic and hydrogeologic infonnation. Section 2.1
presents geologic infonnation (see Figure 2.2) taken from Section 2.6 of the USNRC Technical
Report. Section 2.2 presents hydrogeologic infonnation presente:d in Section 2. 7 of the
Technical Report. Section 2.3 describes the history of previous aquifer testing in relation to
uranium exploration and development.
2.1 Stratigraphy
The sedimentary rocks of interest that underlie the Dewey-Burdock Project range in age from
Upper Jurassic to Early Cretaceous. These are the Upper Jurassic Sundance Fonnation, the
Unkpapa Fonnation, and the Morrison Fonnation. The Early Cretace:ous Lakota Formation, the
Fall River Fonnation, the Skull Creek Shale Fonnation and the Mowry Shale Formation.
Figure 2.1.
Underlying these, are rocks that range in age from Cambrian to Pc~nnsylvanian in age. The
sediments exposed at the Dewey-Burdock Project are of Early Cretaceous age.
2.1.1 Overlying Unit: Skull Creek Formation Shales
The combined Skull Creek Shale- Mowry Shale reaches a thickness of 400ft (ft) in the western
part of the Dewey-Burdock project.
Mowry Shale
The Mowry Shale consists of light gray marine shale with minor amounts of siltstone, fine
grained sandstone, and a few thin beds of bentonite.
Newcastle Sandstone Formation
The Newcastle Sandstone, nonnally occurring between the Skull! Creek Shale and the Mowry
Shale, is composed of fine-grained sandstone interbedded with siltstones. This formation is
discontinuous across the region and is absent across the project area. At the Dewey-Burdock
Project the Skull Creek Shale is directly overlain by the Mowry shale.
Skull Creek Shale Formation
The Skull Creek Shale is a sequence of dark-gray to black marine shales. The Skull Creek shale
consists of black shale, organic material, and some silt sized quartz grains. The Skull Creek
DV1 02.00279.01 2-1 November 2008
Dewey-Burdock 2008 Pump Test Report Rev O.doc
July 2012 J-15 Appendix J

Knight Piesold CON.ULTINO
Shale has a thickness of approximately 200 ft. The Skull Creek Shale is eroded from the eastern
parts ofthe project.
2.1.2 lnyan Kara Group: Fall River Formation and Lakota Formation Sandstones
lnyan Kara Group
The Early Cretaceous Inyan Kara Group consists of two formations, the Lakota and the Fall
River. The Inyan Kara is composed of interbedded sandstone siltstone and shale. The
depositional environment of the Inyan Kara is fluvial to marginal marine.
Fall River Formation
The Fall River formation is composed of carbonaceous interbedded siltstone and sandstone,
channel sandstones, and a sequence of interbedded sandstone and shale. The lower part of the
Fall River consists of dark carbonaceous siltstone: interbeddt~d with thin laminations of
fine-grained sandstone. Channels were cut into this interbedded seqmmce by northwest flowing
rivers and fluvial sandstones were deposited. These channel sandstones occur across various
parts of the Dewey-Burdock Project and generally contain the uranium deposits. Overlying the
channel sandstones is another sequence of alternating sandstone and shales.
Lakota Formation
The Lakota Formation consists of three members, from lower to uppt~r is the Chilson Member,
the Minnewasta Limestone Member and the Fuson Member.
The Minnewasta Limestone Member is not present in the Dewey-Burdock Project area.
The Chilson Member is composed largely of fluvial deposits.. These deposits consist of
sandstone, shale, siltstone, and shale. The unit consists of a complex of channel sandstone
deposits and their fine-grained equivalents. The unit contains uranilum deposits.
The Fuson Member is the upper most member of the Lakota Formation and the shale-siltstone
portion of the Fuson has been used to divide the Lakota Formation from the Fall River
Formation.
The Fuson is described as having a lower discontinuous sandstone unit at its' base and an upper
discontinuous sandstone at the top of the member. If present the lower sandstone unit was
DV102.00279.01 2-2 November 2008
Dewey-Burdock 2008 Pump Test Report Rev O.doc
July 2012 J-16 Appendix J

Knight Piesold CON8ULTING
mapped as a Lakota sandstone. Similarly if the upper sandstone was ]present it was mapped as a
Fall River sandstone. The Lakota was deposited by a northwest flowing river system.
2.1.3 Underlying Units: Morrison Formation Shale and Unkp,apa/Sundance Formation Sandstone
Morrison Formation
The Upper Jurassic Morrison Formation was deposited as flood plain deposits. It is composed of
waxy, unctuous, calcareous, noncarbonaceous massive shale with numerous limestone lenses and
a few thin fine grained sandstones.
Unkpapa Formation
Overlying the Sundance Formation is a sandstone unit that has been called the Unkpapa
formation. The Unkpapa is a massive tine grained sandstone that was deposited as sand dunes.
Sundance Formation
The Sundance Formation of Upper Jurassic age consists of marine roc:ks composed of red shales
and sandstones. The Sundance has been subdivided into five members. In ascending order they
are the Canyon Springs sandstone member, the Stockade Beaver shale member, the Hulett
sandstone member, the Lak member, and the Redwater shale member.
2.2 Hydrogeologic Conditions: Potentiometric Surface and Hydraulic Gradient
Groundwaters within the Inyan Kara formations are under artesian conditions in much of the
Dewey-Burdock area. Some wells are known to have flowed for years. Figure 2.3 is a
potentiometric surface map of the Fall River Formation aquifer within the Inyan Kara group.
The map is based on measurements made in 2008. Based on Figure 2.3, groundwater flow
direction in the Fall River aquifer is generally to the southwest, consistent with the topography of
the broad Black Hills domal uplift, with significant components either more southerly or more
westerly as reflected by the curvature of the potentiometric surface equtipotentiallines.
Groundwater gradient in the Fall River aquifer varies significantly throughout the project area.
Near the outcrop areas upgradient of both the Dewey and Burdock project portions of the Site,
the gradient is about 20 to 25 ft per mile (0.0038 to 0.0047 feet pe:r foot [ftlft]). At the Burdock
portion of the Site, the Fall River aquifer gradient flattens to about 14 ft per mile (0.0026 ft!ft)
extending downgradient to the southwestern project boundary. At the Dewey portion of the Site,
DV102.00279.01 2-3 November 2008
Dewey-Burdock 2008 Pump Test Report Rev O.doc
July 2012 J-17 Appendix J

Knight Piesold CONeULTING
however, the groundwater gradient in the Fall River aquifer increases sharply to as much as
about 52ft per mile [0.01 ftlft] within the central portion of the prqject area.
Figure 2.4 is a potentiometric surface map of the Lakota Formation aquifer below the Fall River
aquifer within the Inyan Kara Group, based on measurements madle in 2008. Groundwater flow
direction is generally to the southwest with locally more southerly component. At the Burdock
portion of the site, the groundwater gradient is relatively unifomt from the outcrop area to the
project boundary, about 18 ft per mile (about 0.0034 ftlft). At the Dewey portion of the site
Figure 2.4 indicates a somewhat flatter overall gradient, about 16 ft per mile (0.003 ft/ft).
However, within the central portion of the Dewey project area there a broad area where the
potentiometric surface elevations in the Lakota are between 3,680 and 3,690 ft above mean sea
level (amsl).
The variations in the potentiometric surfaces in both Inyan Kara formations produce variations in
the direction of vertical gradients throughout the project area. At the Burdock portion of the Site,
the potentiometric surface in the Fall River aquifer is generally close to that in underlying Lakota
(Chilson) aquifer; where there are differences, the Fall River appears to be slightly higher in
elevation by a few (less than five) feet. This indicates minimal overall vertical gradients with
possible downward flow direction between the two formations through the intervening Fuson
Member of the Lakota Formation.
By contrast, at the Dewey portion of the Site there are areas where th1~ potentiometric surface in
the Lakota Formation is 20 to 30 ft higher than in the overlying Fall River Formation, indicating
a vertically upward gradient. This is consistent with the character of the intervening Fuson
Member in previous pumping tests, described in Section 2.6 below, where the Fuson was
described as leaky in the Burdock area but a more effective aquitard in the Dewey area. This
was also noted in earlier investigations (Keene, 1973, p. 26), which s1tated that "pressures in the
Lakota Formation appear greater than those of the Fall River aquifer in the northwestern
townships of the [Fall River] county. This is reasonable when one considers the higher intake
elevation of the Lakota Formation, the greater thickness of the Chilson Member than the Fall
River sands, and the smaller production from the Lakota aquifer."
Figure 2.5 is a potentiometric surface map of the Unkpapa aquifer below the Inyan Kara group,
based on measurements made in 2008 at four locations. The potentiometric surface in the
Unkpapa Formation indicates groundwater flow direction to the southwest with locally more
southerly components. Overall gradient is about 100 ft per 3 miles., which corresponds to an
DV1 02.00279.01 2-4 November 2008
Dewey-Burdock 2008 Pump Test Report Rev O.doc
July 2012 J-18 Appendix J

Knight Piesold CONaULTING
average gradient of about 0.006 ftlft. The potentiometric surface elevation is generally about
50 to 100 ft higher in both the overlying Lakota and Fall River Formation aquifers. This
indicates vertical upward gradients between the Unkpapa Formation,, the intervening Morrison
Formation and the Inyan Kara Group. The Morrison Formation lthus: appears to function as an
effective aquitard throughout the project area.
2.3 Summary of Previous Aquifer Testing Results
The Tennessee Valley Authority (TVA) conducted groundwat,er pumping tests from 1977
through 1982 as part of a uranium mine development project near the towns of Edgemont and
Dewey, South Dakota. TVA produced two summary pumping test reports, "Analysis of Aquifer
Tests Conducted at the Proposed Burdock Uranium Mine Site" (Boggs and Jenkins, 1980) and
"Hydrogeologic Investigations at Proposed Uranium Mine Near Dewc~y, South Dakota" (Boggs,
1983). In addition, TV A prepared a draft Environmental Impac:t Sltatement for the proposed
Edgemont Uranium Mine in 1979.
TV A first conducted two unsuccessful tests in 1977 at the Burdoek t1~st site. The results of the
1977 tests were considered inconclusive because of various problems including questionable
discharge measurements, some observation wells improperly constructed, and some pressure
gauges malfunctioned. No data from the 1977 tests are currently available.
TVA conducted three successful pumping tests, two in 1979 near the current Burdock Project
Area, and one in 1982 about two miles north of the current Dewey Project Area. The results of
these successful tests are described in separate sections below. However, no data for these tests,
in particular electronic records of drawdown, are available, other than information contained in
the reports.
2.3.1 Dewey Project Area
The Dewey test was conducted in 1982 northeast of the Dewey Road at the location shown on
Figure 1.1. The test consisted of pumping in the Lakota formation for 11 days at an average rate
of 495 gpm. The test developed the following information:
• Transmissivity of the Lakota averaged about 4,400 gallons per day per foot (gpd/ft)
which is equivalent to 590 ft squared per day (ft2/day).
• Storativity of the Lakota was about 1.0 X 1 o-4 (dimensionless).
DV1 02.00279.01 2-5 November 2008
Dewey-Burdock 2008 Pump Test Report Rev O.doc
July 2012 J-19 Appendix J

Knight Piesold CONSULTING
• There was response between the Fall River and Lakota formations through the
intervening Fuson shale-siltstone member that was manife:sted at relatively late time
(3000 to 10000 minutes).
• The vertical hydraulic conductivity of the Fuson aquitard using the Neuman
Witherspoon ratio method (Neuman and Witherspoon, 1973) was 2 x 1 o-4 ft/day;
storativity of the Fuson Member was not determined and specific storage was about 7 x w-7 ft- 1•
• A barrier boundary, or a decrease in transmissivity due to lithologic changes with
distance from the test site, or both, were observed; a possible geologic feature
corresponding to a barrier was noted to be the Dewey Fault Zone, located about
1.5 miles north of the test site, where the Lakota and Fall River formations are
structurally offset.
2.3.2 Burdock Project Area
The Burdock tests were conducted in 1979 near the Dewey road at the location shown on
Figure 1.1. The Burdock tests consisted of separate pumping tests from the Lakota (Chilson) and
Fall River Aquifer, respectively in April and July of 1979. The tests used the same pumping
well with packers to alternately isolate screens open to the respective formations. Test durations
were 73 hours for the Lakota test and 49 hours for the Fall River test. Pumping rates were about
200 gpm from the Lakota aquifer and 8.5 gpm from the Falll Rilver. The reason for the
unexpected low pumping rate from the Fall River aquiter was not specified in the TVA report.
The tests developed the following information:
• Interpreted transmissivity of the Lakota was based on anallysis of later time data and
inferred decreasing transmissivity with distance from the test site due to changes in
lithology; overall transmissivity averaged about 1,400 gpd/ft (190 ft2/day) and
storativity about 1.8 x 10⁻⁴ (dimensionless}; maximum transmissivity from early time
data was about 2,300 gpd/ft (310 ft2/day).
• Transmissivity of the Fall River averaged about 400 gpd/ft (54 ft2/day) and storativity
about 1.4 x 10⁻⁵ (dimensionless).
• There was communication between the Fall River and Lakota formations through the
intervening Fuson shale-siltstone member; leaky behavior was observed in the Fall
River Formation and believed to exist in the Lakota although "leakage effects in the
Lakota drawdown data are masked by the conflicting effect of a decreasing
transmissivity in site vicinity" (p. 16 in Boggs and Jenkins, 1980).
• The vertical hydraulic conductivity of the Fuson aquitard determined with the
Neuman-Witherspoon ratio method (Neuman and Witherspoon, 1973) ranged from
DV1 02.00279.01 2-6 November 2008
Dewey-Burdock 2008 Pump Test Report Rev O.doc
July 2012 J-20 Appendix J

Knight Piesold CONaULTING
1 o-3 to 1 o-4 ftlday; storativity was not determined, and spt!cific storage was assumed to be about 10-6 ft- 1
•
DV1 02.00279.01 2-7 November 2008
Dewey-Burdock 2008 Pump Test Report Rev O.doc
July 2012 J-21 Appendix J

Knight Piesold CONaULTING
3.0 2008 Pumping Tests: Design and Procedures --------------------
In 2008 pumping tests were performed at both the Dewey and Burdock project areas. A work
plan (Knight Piesold, 2008) was prepared and distributed to interested representatives of State
and Federal agencies, including the South Dakota DENR and the USEPA. Individual production
zones within the Inyan Kara Group will likely be on the order of 10 to 15 ft thick to target ore
horizons in both the Fall River and Lakota aquifers. Uranium ore is often located at different
horizons in both aquifers at the same spatial locations (Drawings 4.1, 4.2, 5.1, 5.2 and 5.3).
Powertech performed geologic interpretations, well design, well installation and mechanical
integrity testing. Well completions are described in detail for the test layout at each of the
Dewey and Burdock project areas (Sections 4 and 5). Field activities for the Dewey and
Burdock pumping tests were jointly performed by Powertech and Knight Piesold personnel.
Aquifer test analyses were performed and this aquifer testing report was written by Knight
Piesold.
3.1 Wei/Installation, Completion and Mechanical Integrity resting
Well bores are drilled to diameters specified in SDDENR regulations. New casing is set and
15.2 pounds per gallon (lb/gal) cement is positively displaced into the annulus. After a cement
cure time not less than 24 hours, the well is pressured up with air for a minimum of 1 hour.
After the mechanical integrity test has passed, the well is developed until the water runs clear,
and the screen is then pushed into place. The casing is cut off to 2.5 ft above ground surface and
capped. Applicable reports are filed with the State. Wells are not ust!d under conditions that do
not meet manufacturer's recommendations and specifications for its type (SDA74:02:04:42).
3.2 Pumping Test Equipment and Facilities
Powertech personnel installed the pumping and monitoring equipment prior to testing. Knight
Piesold verified the performance of the pumping test equipment by ·~onducting step-drawdown
tests at each site. Thereafter, Knight Piesold performed or supervised pump operations
throughout the constant rate tests together with the datalogger programming and day-to-day
downloads of data.
The tests were performed using a 5-horsepower (Hp) electrical submt!rsible pump powered by a
portable generator. At each site the pump was set at 300 ft with 2-inch diameter drop pipe.
Surface flow monitoring equipment were Cameron l-inch NUFLOTM flowmeters and MP-III™
digital flow analyzer with readout of instantaneous flow and totaliz•~r of flow. In accordance
DV1 02.00279.01 3-1 November 2008
Dewey-Burdock 2008 Pump Test Report Rev O.doc
July 2012 J-22 Appendix J

Knight Piesold CON8ULTING
with the temporary discharge permit received from South Dakota DENR, the pump discharge
water was piped to temporary holding ponds via 1 114-inch diamc~ter high density polyethylene
plastic pipe. Throughout the tests, a portion of the discharge wate:r was routed through a YSI™
flow-through cell with multi-parameter probe that read field parameters (temperature, pH,
conductivity, dissolved oxygen and turbidity) that were recorded twice daily through pumping
phases of the tests.
Water levels in each well were measured and recorded with vent,ed In-Situ™ Level TROLL™
pressure transducers with built in data loggers. The pressure ratings. for the transducers range
from 100 to 300 pounds per square inch (psi). Transducer accuracy (in comparison to known
pressure or other pressure reading devices) is stated by the manufacturer to be ±0.1 percent of
full-scale reading (i.e., 100 to 300 psi), so the limit of accuracy varies from 0.1 to 0.3 psi, or
about 0.2 to 0.7 ft. Transducer sensitivity is stated to be ±0.01 percent of full-scale, resulting in
sensitivity limits of about 0.01 to 0.03 psi, or 0.02 to 0.07 ft.
The sequence of events before and during the 2008 pumping tests is summarized in Figures 3.1
and 3.2. Figure 3.1 illustrates background pressure transducer and sit'e barometer measurements
that are described in Section 3.3, below. Evaluation of the background[ monitoring data produced
several methods for correcting water levels; however, after these were applied on a test data set it
was concluded that necessary corrections to water level data were minimal and that the test
interpretations could equally well rely on uncorrected time-drawdown data.
Figure 3.2 displays output from the discharge flow data logger that is described in Section 3.4,
below.
3.3 Background Monitoring and Water Level Corrections
Pressure transducers were installed in wells at both sites by April 2, 2008 in order to obtain
background groundwater level measurements. At the Burdock te:st site, a transducer was
installed in the designated pumping well (DB07-11-11C) in the lower Lakota Formation. At the
Dewey test site, a transducer was installed in observation well (DB07-32-4C), screened in the
same zone as the pumping well in the lower Fall River Formation. The right hand axis of
Figure 3.1 graphs hourly barometric pressure measurements in millibars obtained from the
meteorological station installed at the site. The site station is maintained by South Dakota State
University (SDSU) and data are available at the following URL: "http://climate.sdstate.edu/
awdn/edgemont/archive3 .asp".
DV1 02.00279.01 3-2 November 2008
Dewey-Burdock 2008 Pump Test Report Rev O.doc
July 2012 J-23 Appendix J

Knight Piesold CON8ULTING
One month of background measurements were obtained from April 8 to May 9, 2008
(Figure 3.1 ). Background measurements shown on Figure 3.1 fluctuate over a range of about
0.4 psi with the expected inverse relationship between silte barometer readings and
increases/decreases in groundwater levels. There are also smaHer cyclic sinusoidal variations
that occur twice daily and are attributable to Earth tide cycles. A period of two weeks (April 23
to May 8, 2008) after pump installation and initial testing produced undisturbed background
water level data.
Three types of water level correction procedures were evaluatt:d using the background
monitoring data. The first procedure was manually correcting the transducer psi values with a
constant barometric efficiency (BE) determined for each major aquifer (e.g., Kruseman and de
Ridder, 1991 ). The BE is defined as the change in water level in a well versus a related change
in atmospheric pressure. Gontheir (2007) describes the historical! methods of determining BE,
which by convention is dimensionless and ranges from zero to one.
The second type of correction that was evaluated considers additional factors, chiefly long-term
seasonal trends and Earth tides (Gontheir, 2007). A spreadsheet distributed by the USGS as an
open-file report (Halford, 2006) has programming that empirically factors the overall water level
response into multiple synthetically generated time series with adjustments to both phase and
amplitude of each component (see Appendix A.l, Figures A.l-3 and A.l-4). The USGS
spreadsheet was used to determine that the Dewey background water level data from April 23 to
May 8, 2008, could be closely matched as a series of four components: ( 1) water level increase at
a linear rate [i.e., slope], (2) variation in air pressure measured with the site barometer, (3 and 4)
two Earth tide components.
The third type of correction procedure evaluated was a computer method known as BETCO
(Sandia Corporation, 2005; Toll and Rasmussen, 2006). This software is available at
"http://www.sandia.gov/betco/". To correct data, water level, time and barometric pressure are
input and BETCO calculates corrected water level values. Compared with the manual BE
correction, the corrected water levels calculated in BETCO yielded similar results, generally
within about± 0.01 psi.
The manual BE method was judged to be better than the BETCO computer method for the
background calibration period examined (Appendix A). Moreover, both the BETCO and USGS
methods were difficult to apply with confidence to the drawdown data after the background
monitoring period because wells with similar construction to the pumping test wells, but outside
DV102.00279.01 3-3 November 2008
Dewey-Burdock 2008 Pump Test Report Rev O.doc
July 2012 J-24 Appendix J

Knight Piesold CONaULTING
the area of test influence, are not available to validate the correctiions. A further difficulty with
the BETCO and USGS computer methods is that they do not accommodate logarithmic
measurement times as input data.
To examine the possible importance of BE corrections on water levels, the drawdown phase of
the Dewey test was manually corrected with a BE of 0.48 (see Figure A.1-1 in Appendix A)
relative to the site barometer over the test period. The maximum dfe<;t of the BE correction was
to add about 0.2 ft to the water levels at the end of the drawdown phase due to an overall
barometric pressure decline of about 15 millibars (i.e., from about 1,030 to 1,015 millibars,
Figure 3.1 ). Test interpretations (Theis drawdown) were made with and without the BE
corrections for the Dewey test. The corrections were found to have no discemable effect on the
visual fits to type curves. Because the changes in barometric pressun: during the 3-day constant
rate tests at Burdock and Dewey were similar (Figure 3.1), the analysis determined that BE
corrections would be no greater for the Burdock test compared to the Dewey test. Therefore,
corrections to water level data were not further performed and the test interpretations rely on
uncorrected time-drawdown data.
3.4 Test Procedures, Data Collection, Data Processing
The discharge flow data logger was set to record at hourly intervals and was downloaded at the
end of the tests (Figure 3.2). The discharge flow rate was adjusted with a manual gate valve.
Step-drawdown tests were performed on May 12 and 13, 2008 (Figures 3.1 and 3.2). The
step-drawdown tests consisted of four steps at 1 0 gpm, 20 gpm, 2:5 gpm, and 30 gpm for a
minimum of 90 minutes at each step. The step-draw down data indicated successful performance
of all equipment at both test sites. Subsequent analysis of the step-drawdown data was not
performed due to the better quality (i.e., much longer time) data obtained from the constant rate
tests for determining both aquifer parameters and well efficiencies.
Constant rate tests were performed on May 15 to May 18, 2008 at Dewey and from May 18 to
May 21, 2008 at Burdock (Figures 3.1 and 3 .2) after recovery from the step-rate tests. At both
test sites the recorded hourly flow rates during the constant rate tests varied no more than
2 percent (between 30.0 and 30.7 gpm) throughout the tests and the pumping rates for the entire
3-day tests at each site averaged 30.2 gpm.
The data loggers in all wells were synchronized to the same clock-time immediately prior to
start-up. To collect closely-spaced measurements during the start-up of the drawdown phase of
the test, the transducers were programmed to record temperature and psi measurements at
DV1 02.00279.01 3-4 November 2008
Dewey-Burdock 2008 Pump Test Report Rev O.doc
July 2012 J-25 Appendix J

Knight Piesold CONeULTING
one-second intervals for two hours, then at ten second-intervals for 70 to 72 hours. For recovery,
the data loggers returned to a measurement frequency of one-second D)f two hours, during which
time the pump was shut off, followed by ten-second measurement intervals thereafter.
The time-drawdown data output from the data loggers consisted of two hours of data at
one-second intervals followed by 72 or 74 hours of data collected at ten-second intervals, with
the sequence repeated for the recovery phase. The WinSitu ™ software produced draw down
graphs that are reproduced in Sections 4 and 5. The software exported records to text ".csv" files
with approximately 60,000 to 70,000 records for each well. The time-drawdown data were
processed using a custom FORTRAN program that wrote data records to an output file based on
a template file specifYing which date-time records would be written. The template file was
prepared to produce logarithmically spaced data with 30 records per log cycle (in seconds). Due
to slight variations in transducer output and the precision of the Microsoft Excel date-time
format, there are some ± one-second variations in the sequences of records from well to well.
The FORTRAN program also converted transducer psi to drawdown in ft using formulas
described in Appendix A. The reference value for zero drawdown was set as the average of psi
readings from the start of the data log to the time just prior to test startup. Separate time
drawdown files were prepared for both drawdown and recovery phases of the tests. Tables ofthe
processed time-drawdown data used for test interpretations are providt~d in Appendices B and C.
Complete binary files with the raw data for each well in Win-Situ TM fi::>rmat are also provided on
a CD-ROM in Appendix E.
DV1 02.00279.01 3-5 November 2008
Dewey-Burdock 2008 Pump Test Report Rev O.doc
July 2012 J-26 Appendix J

Knight Piesold CONaULTING
4.0 Dewey Project Area Pumping Test
4.1 Test Layout and Initial Potentiometric Surface Measurements
The Dewey pumping test well is located in NE Y4 NW Y4 Sec. 32, T.6S, R.IE, Custer County,
South Dakota (Figure 4.1, Table 4.1). Powertech completed the pumping well (DB07-32-3C)
with a fifteen-ft screen within the lower sandstone layer in the Fall River Formation near the roll
front ore zones (Drawings 4.1 and 4.2). Three new observation wells were similarly screened at
the same stratigraphic horizon within the lower Fall River Formation, located at radial distances
of 265, 467 and 2,400 ft away from the pumped well (Figure 4.1 Table 4.1 ). A pre-existing
stock watering well (GW-49) was also monitored. The stock well is located approximately
I ,400 ft west of the pumped well and is believed (based on a recent electric log) to be an open
hole for about 70 ft corresponding to about the top half of the Fall River formation.
Additional information on the design of the pumping test well layout and objectives for test
analysis are provided in Appendix A.2. Well Construction diagrams and borehole electric logs
for the Dewey test wells are provided, respectively, in Appendices B.! and B.2.
Within a fifty-ft radius around the pumping well, additional observation wells were completed in
a vertical nest in order to provide hydraulic data for the degree of confinement of both the test
sandstone horizon and the entire Fall River Formation aquifer. Obse:rvation well DB-07-32-9C
was screened in the upper Fall River aquifer at 41 ft lateral distance and 95 ft vertically above the
screen in pumping well 32-3C. Observation well DB-07-32-10 was located within the
underlying Lakota Formation 61 ft laterally and 130 ft vertically below the screen in the
pumping well. Observation well DB-07-32-11 was located in the underlying Unkpapa Formation
aquifer 50 ft laterally and 325 ft vertically below the screen in pumping well 32-3C.
Piezometric measurements (Eric Krantz, RESPEC, personal communication, May 2008) and
well survey data provided by Powertech were used to calculate potentiometric surface elevations
in ft above mean sea level with an estimated accuracy of± 3 ft (Table 4.2). The potentiometric
surface elevations for the Unkpapa, Lakota, and Fall River aquifers at the wells in the vertical
well nest at the Dewey test site indicate artesian conditions. The three major geologic formations
appear to be locally hydraulically isolated with upward vertical gradients, as follows:
nearly 80 ft head difference upward (Table 4.2) between the Unkpapa and lower Lakota aquifers
DV1 02.00279.01 4-1 November 2008
Dewey-Burdock 2008 Pump Test Report Rev O.doc
July 2012 J-27 Appendix J

Knight Piesold CONaULTING
• nearly 40 ft head difference upward between the lower Lakota and lower Fall River aquifers
• nearly 20 ft head difference upward between the wells screened in the lower Fall River and upper Fall River formation
4.2 Pumping Rate and Duration
The pumping phase of the constant-rate test at the Dewey area was started at 10:30:09 AM on
May 15, 2008 and the pump was shut down at 12:30:59 PM on May 18, 2006, for a total duration
of 4,440 minutes or 3.08 days (Figure 3.2). Because of the artesian condition in the pumping
zone, the pumping well (32-3C) was shut-in, the pump turned on at 10:29:54 AM and the shut-in
valve opened at 10:30:09 AM, the designated starting time of the test. The artesian observation
wells had been left open for at least a day prior to startup to test for leakage from gaskets
surrounding the transducer cables. Leakage during the constant rate te:st was not observed at any
well except observation well 32-11 in the Unkpapa Formation, as described in Section 4.6,
below.
The average pumping rate for the 3.08 day test was 30.2 gpm (Figure 3.2). During drawdown,
there was a major flow rate adjustment where the gate valve was opened and throttled back; this
occurred from 0.4 to 1.2 minutes and produces a discontinuity on logarithmically displayed time
drawdown data at the pumping well (Figure 4.7). Minor flow rate adjustments were also made at
21, 125, and 2777 minutes into the test that can also be seen on time-drawdown data for the
pumping well (Figure 4.7). During recovery, the pumping wdl was initially left open to
discharge water in piping and then shut-in when it was determined that the well was discharging
due to artesian flow; this produces a discontinuity shown on the recovery plot for the well
(Figure 4.7).
4.3 Responses at Pumping and Observation Wells
Table 4.2 summarizes the responses to pumping for the Dewey test. Figures 4.2, 4.3 and 4.4
display the transducer responses. Drawdown throughout the lower Fall River aquifer was 44.8 ft
at the pumping well and ranged from 13.0 to 1.5 ft at the observation wells. Response to
pumping varied progressively with distance from the pumping well throughout the lower Fall
River: within 3 minutes at the two observation wells at 265 and 467 ft, and response was at
140 minutes at 2,400 ft distance. Similarly, the upper Fall River stock well (GW-49) responded
at 40 minutes at 1,400 ft distance (Table 4.2).
DV1 02.00279.01 4-2 November 2008
Dewey-Burdock 2008 Pump Test Report Rev O.doc
July 2012 J-28 Appendix J

Knight Piesold CON8ULTING
However, it took 10.6 minutes for upper Fall River well (32-9C) to respond at 41 ft radial
distance and 95 ft vertical distance (Table 4.2. The delayed response at the upper Fall River well
is attributed to vertical anisotropy due to shale interbeds overlying the lower sandstone layer
(Drawings 4.1 and 4.2).
The pumping and observation wells generally had symmetrical patterns of drawdown response
and recovery response, except at the distant observation well 29-7 (Figure 4.3). There, the
drawdown began at 140 minutes into the test, and drawdown continued to a maximum of2.1 ft at
about two days after the pump was shut down (Table 4.2). Then!for•e, the recovery response at
well 29-7 was not further analyzed.
4.4 Determination of Aquifer Parameters
Aquifer parameters determined with the Theis drawdown, Theis recovery, Cooper-Jacob
drawdown, Theis-Cooper-Jacob recovery, and distance drawdown methods are summarized in
Table 4.3. Appendix A provides a definition ofthe well function parameters (u, u'), a complete
description of the methods used, and corresponding assumptions for aquifer parameter
determinations. For the straight-line methods, analyses with u or u' > 0.01 are reported but are
not considered acceptable, as indicated in the table. Appendix B provides the graphical analyses
that determined aquifer parameters at each well listed in Table 4.3.
The following discussion and Figures 4.5 through 4.8 illustrate the overall analysis of the
pumping test and exemplifY the determination of aquifer parameters with figures illustrating each
of the major graphical analysis methods used. The observatiion well exhibiting the most
diagnostic response is discussed first, followed by the drawdown at all observation wells, the
drawdown at the pumping well, and finally the recovery at all wells.
4.4.1 Theis Drawdown and Recovery Analysis
Figure 4.5 displays time drawdown data and analysis on the log--log Theis plot for the closest
observation well (32-5 at 265 ft distance). The data indicate a confined aquifer response fitting
the Theis type curve until latest time, where there is a barrier boundary, where the drawdown
increased above the theoretical rate of drawdown. The boundary was encountered at a time of
about 0.6 days into the test (Table 4.2). The data at the next closest observation wells (32-4C
and the stock well GW-49) also suggest a barrier boundary at times ranging from about 0.7 to
1.9 days into the test (Table 4.2).
DV1 02.00279.01 4-3 November 2008
Dewey-Burdock 2008 Pump Test Report Rev O.doc
July 2012 J-29 Appendix J

Knight Piesold CONaULTING
Drawdown analyses using the Theis method for all applicable wells (i.e., 32-3C, 32-5, 32-4C,
29-7, and GW-49) are given in Appendix 8.4 (Figures 8.4-1 through Figure 8.4-5) and
summarized in Table 4.3. The Theis analyses in Appendix 8 use test analysis software
(AquiferWin32 TM ESI, 2003). Input data is weighted to ignore the late-time barrier boundary
using an automated curve matching procedure. The weighting for all samples is the same, as
follows: time-drawdown data before the first response are ignored, and data after the earliest
occurrence of the barrier boundary at any of the wells (0.6 days) are ignored. The aquifer
parameters transmissivity and storativity determined with Theis analyses are summarized in
Table 4.3.
Figure 8.4-6 in Appendix 8 shows the data at observation well 32-9C, completed in the upper
Fall River 41 ft radially and 95 ft vertically from the screened int<:~rval in the pumping well.
Samples are weighted as described above. This data cannot be interpreted successfully with the
Theis analysis because only the middle-time portion of the drawdown closely follows the type
curve. The poor fit to the Theis curve for well 32-9C yields a transmissivity of 217 ft2 /d, a value
within the range of other observation wells, but a high storativity value of 0.016, which is
inappropriate for a confined aquifer (e.g., Freeze and Cherry, 1979, Halford and Kuniansky,
2002). The artificially high storativity is attributed to the time-delay in response. The time
delay is attributed to vertical anisotropy as described in Section 4.3, above. Therefore, aquifer
parameters from this well are reported in Table 4.3 but are not considered reliable determinations
and are not used in determining the overall average aquifer parameters for the test.
4.4.2 Theis-Cooper-Jacob Straight-line Analysis
Figure 4.6 displays the Theis recovery analysis at the closest observation well 32-5 using
automated straight-line fitting in AquiferWin32 TM software. Appendix A.2 provides an overview
of the theoretical basis for straight-line test analysis and definitions for the terms u', t and t'.
Samples are weighted according to (1) the theoretical criterion that u' be< 0.01, which restricts
the data to later-time (to the left on the t/t' axis); and (2) the portion of the recovery before the
change in slope due the barrier boundary. The sample weighting restricts the matched straight
line portion of the recovery plot to the line-segment shown in Figure 4.6 and a value for the
transmissivity, but not storativity, is obtained (Table 4.3).
Figure 4.7 (top) shows a Cooper-Jacob straight-line drawdown plot for the Dewey pumping well
32-3C. This USGS graphical-analysis tool is a spreadsheet that allows manual fitting of the
straight-line (Halford and Kuniansky, 2002). The portion of the plot corresponding to later time
DV1 02.00279.01 4-4 November 2008 Dewey-Burdock 2008 Pump Test Report Rev O.doc
July 2012 J-30 Appendix J

Knight Piesold CONeULTING
where is indicated, and this slope is used to determine transmissivity of 250 ff/d and well
efficiency of 81 percent (Table 4.3).
The bottom portion of Figure 4.7 shows the USGS spreadsheet implementation of the Theis
recovery analysis for the pumping well 32-3C, referred to as the Theis-Cooper-Jacob method
(Halford and Kuniansky, 2002). Similar to Figure 4.6, the portion of the plot corresponding to
later time is indicated to the left on the tit' axis, and this slope is used to determine transmissivity
of 270 ft?/d (Table 4.3). The recovery plot at the pumping well also shows the change in slope
with an increase in rate of draw down at the latest times which is ignored in the manual fit of the
straight-line.
4.4.3 Distance-Drawdown Analysis
Figure 4.8 is distance-drawdown analysis plot that determines transmissivity, storativity, and
pumping well efficiency by considering all observation wells at once. The pumping well
efficiency of 93 to 95 percent is determined by extending the straight line to the assumed
diameter of the pumping well (0.25 ft for the 6-inch diameter well casing or possibly 0.33 ft for
the 8-inch diameter borehole) relative to the actual drawdown observed at the pumping well.
The aquifer parameters and the high efficiency are somewhat questionable given the relatively
poor (? = 0.7) straight-line fit through all data points. However, transmissivity and storativity
values obtained are reasonable and the distance drawdown resullts are included in the overall
average aquifer parameters for the test (Table 4.3).
The distance-drawdown analysis also gives the maximum radius of influence of the test. Based
on Figure 4.8, the radius of influence was about 5, 700 ft, about twict;! the radial distance to the
most distant responding well (i.e., 29-7 at 2,400 ft). The radius of influence may be compared to
the dimensions of prospective well fields in the area to evaluate whether aquifer parameters have
been adequately characterized.
4.4.4 Summary of Dewey Test- Lower Fall River Formation Aquifer Parameters
The aquifer parameters determined by the techniques describt:d above are summarized in
Table 5.3. Ten accepted determinations of transmissivity (outlined) range from 180 to
330 ft2/day and the mean and median are close at 251 to 255 ft2/day. The five accepted
storativity determinations ranged from 2.3 x 10⁻⁵ to 2.0 x 10⁻⁴. The gt:ometric mean and median
storativity values are respectively 5.2 to 4.6 x 10⁻⁵• The median transmissivity of255 ft2/day and
median storativity of 4.6 x 1 o-5 are considered the best measures of the central tendency of the
test results.
DV1 02.00279.01 4-5 November 2008 Dewey-Burdock 2008 Pump Test Report Rev O.doc
July 2012 J-31 Appendix J

Knight Piesold CON8ULTING
4.5 Underlying Lakota Aquifer Test Results
Observation well (DB-07-32-1 0, Figure 4.1, Drawing 4.2) was located within the underlying
Lakota Formation 61 ft laterally and 130 ft vertically below the scre1en in pumping well 32-3C.
Figure 4.4 illustrates that there was no response of observation well 32-10 to the drawdown or
recovery phases at the pumping well 32-3C. Therefore, there was no further analysis of this
observation well.
4.6 Underlying Unkpapa Aquifer Test Results
Observation well DB-07-32-11 is screened in the underlying Unkpapa Formation aquifer 50 ft
radially and 325 ft vertically below the screen in pumping well 32-3C {Table 4.1 ). Figure 4.4
depicts a generally rising trend in transducer response with sinusoidal variations associated with
Earth tides indicating the aquifer remained undisturbed when the pump was turned on and turned
off. Mid-way through the recovery, a shift in the pressure response on May 20, 2008 was noted
similar to when leaks in the gasket-seal were observed previously. The threaded cap and gasket
were checked on May 21, 2008 and found to be moist suggesting that a temporary leak may have
occurred.
Figure 4.4 illustrates that there was no response of observation well 32-11 to the drawdown or
recovery phases at the pumping well 32-3C. Therefore, there was no further analysis of this
observation well.
DV1 02.00279.01 4-6 November 2008
Dewey-Burdock 2008 Pump Test Report Rev O.doc
July 2012 J-32 Appendix J

Knight Piesold CON8ULTING
5.0 Burdock Project Area Pumping Test
5.1 Test Layout and Initial Potentiometric Surface Measurements
The Burdock pumping test well is located in NE V4 SW V4 Sec. 11, T.7S, R.lE, Fall River
County, South Dakota (Figure 5.1, Table 5.1). Powertech 'completed the pumping well
(DB07-11-11 C) with a ten-ft screen within a lower sandstone lay{:r in the Lakota (Chilson)
formation. Hereafter, the term Lakota is used to refer to the Chilson member of the Lakota
formation. The ten-ft screen was set near the horizon of the lower Lakota ore zone(s), indicated
by the roll fronts on Drawings 5.1 through 5.3. Three new observation wells were similarly
screened at the same stratigraphic horizon within the lower Lakota Formation, located at radial
distances of 243, 250 and 1,292 ft away from the pumped well (Figun: 5.1, Table 5.1 ).
Additional information on the design of the pumping test well layout and objectives for test
analysis are provided in Appendix A.2. Well Construction diagrams and borehole electric logs
for the Burdock test pumping and observation wells are provided respectively, in
Appendices C.1 and C.2.
Within a fifty-ft radius around the pumping well, additional observation wells were completed in
a vertical nest in order to provide hydraulic data for the degree of confinement of both the test
sandstone horizon and the entire Lakota formation aquifer. Observa1tion well DB-07-11-19 was
screened in the upper Lakota aquifer at 50 ft lateral distance and 100 ft vertical distance above
the screen in pumping well 11-11 C. Observation well DB-07--11-19 was located within the
overlying Fall River Formation 61 ft laterally and 180 ft vertiically above the screen in the
pumping well. Observation well DB-07-11-18 was located in the underlying Unkpapa Formation
aquifer 50 ft radially and 195 ft vertically below the screen in the pumping well.
Piezometric measurements (Eric Krantz, RESPEC, personal communication, May 2008) and
well survey data provided by Powertech were used to calculate potentiometric surface elevations
in ft msl with an estimated accuracy of ±3 ft (Table 5.2). The potentiometric surfaces of the
Lakota and Fall River aquifers at the wells in the vertical well nest at the Burdock site indicate
confined and non-artesian conditions. The two major aquifers (Fall River and Lakota) appear to
be locally hydraulically connected through the intervening Fuson Member with minimal vertical
gradients because the water levels are similar within± 2-3 ft (Table 5 .2).
DV102.00279.01 5-1 November 2008
Dewey-Burdock 2008 Pump Test Report Rev O.doc
July 2012 J-33 Appendix J

Knight Piesold CONaULTING
Piezometric surface information for the Unkpapa and Lakota/Fall River aquifers indicate that the
Unkpapa formation aquifer is artesian and hydraulically isolated with a nearly 70 ft head
difference directed vertically upward (Table 5.2).
5.2 Pumping Rate and Duration
The pumping phase of the constant-rate test at the Burdock area was started at 2:20:36 PM on
May 18, 2008 and the pump was shut down at 2:30:3 7 PM on May 21, 2008, for a total duration
of 4,320 minutes or 3.0 days. The average pumping rate was 30.2: gpm. A flow rate adjustment
was made at 160 minutes into the test that can be seen on logarithmic time-drawdown data for
the pumping well (Figure 5.7). The average pumping rate for the 3.0 day test was 30.2 gpm
(Figure 3.2).
5.3 Responses at Pumping and Observation Wells
Table 5.2 summarizes the responses to pumping for the Burdock test Figures 5.2, 5.3 and 5.4
display the transducer responses. Drawdown throughout the lower Lakota aquifer was 91.1 ft at
the pumping well and ranged from 17.0 to 3.1 ft at the observation wdls. Response to pumping
varied with distance from the pumping well in the Lakota aquifc~r in a non-systematic manner
indicating significant lateral and vertical anisotropy, as follows:
• Response was within 3.6 minutes at the observation well (11-14C) at 250 ft distance
with 17ft of ultimate drawdown (Table 5.2).
• But the other lower Lakota observation well at 243 ft distance ( 11-15) took
140 minutes to respond, with 10 ft of ultimate drawdown.
• Upper Lakota observation well 11-19 took 160 minutt!s to respond with 3.4 ft
ultimate draw down at 50 ft radial distance and 100 ft vc~rtic:al distance.
• First response was at 280 minutes at the most distant well (11-2) at 1,2:92 ft distance.
The responses of close-in well 11-14C and the distant well 11-2 are interpreted as a typical
sequence of response to pumping well in a confined aquift::r with similar transmissivity
connecting all three wells. The delayed response at the upper Lakota well 11-19 is attributable to
vertical anisotropy due to shale interbeds overlying the lower sandstone layer (Drawings 5.1
through 5.3). The delayed response of the closest observation well 11-15 requires an explanation
in addition to lateral anisotropy. Powertech geologists were contacted and have subsequently
indicated that there may have been problems with the installation of well 11-15 because it was
subjected to intensive efforts during development.
DV1 02.00279.01 5-2 November 2008
Dewey-Burdock 2008 Pump Test Report Rev O.doc
July 2012 J-34 Appendix J

Knight Piesold CONSULTING
Figures 5.2 through 5.4 indicate symmetrical patterns of drawdown response and recovery
response, such that if the drawdown response was delayed there was a generally similar time
before the recovery response (e.g., wells 11-2, and 11-19 on Figure 5.3). The anomalous
recovery response at observation well 11-17, screened in the overlying Fall River aquifer, is
discussed in Section 5.5, below.
5.4 Determination of Aquifer Parameters
Aquifer parameters determined with the Theis drawdown, Hantush-Jacob drawdown, Cooper
Jacob drawdown, Theis-Cooper-Jacob recovery and distan•;e drawdown methods are
summarized in Table 5.3. For the straight-line methods, analyses with u or u' > 0.01 are reported
but are not considered acceptable, as indicated in the table. Appendix A provides a complete
description of the methods used and corresponding assumptions for aquifer parameter
determinations. Appendix C provides the graphical analyses that dett:rmined aquifer parameters
at each well listed in Table 5.3.
The following discussion and Figures 5.5 through 5.8 illustrate the overall analysis of the
pumping test and exemplifY the determination of aquifer parameters with figures illustrating each
of the major graphical analysis methods used. The observation well exhibiting the most
diagnostic response is discussed first, followed by the drawdown at all observation wells, the
drawdown at the pumping well, and finally the recovery at all wells.
5.4.1 Theis Drawdown Analysis
Figure 5.5 displays time-drawdown data and analysis on the log-log Theis plot for close-in
observation well 11-14C at 250 ft distance. The data indicate confined aquifer response fitting
the Theis type curve for the first 1.1 days of the test. After 1.1 days, the draw down indicates a
recharge boundary or vertical leakage from an adjacent confining layer where the actual rate of
drawdown is Jess than the theoretical rate of drawdown. The drawdown at the most distant
observation well (11-2 at 1,292 ft distance) also fits the Theis type curve for the first 1.8 days of
the test (see Appendix C, Figure C.4-5) at which time a recharge boundary is encountered.
Boundary responses are summarized in Table 5.2.
Draw down analyses using the Theis method for all applicable wells (i.e., 11-11 C, 11-15, 11-14C
and 11-29) are given in Appendix C.4 (Figures C.4-1 through Figure C.4-5) and summarized in
Table 5.3. The Theis analyses in Appendix C use test analysis sofuvare (AquiferWin32 TM ESI,
2003). Input data is weighted to ignore the late-time recharge boundary using an automated
curve matching procedure. The weighting for all samples i:s the same, as follows:
DV1 02.00279.01 5-3 November 2008
Dewey-Burdock 2008 Pump Test Report Rev O.doc
July 2012 J-35 Appendix J

Knight Piesold CONaULTING
time-drawdown data before the first response are ignored, and data after the earliest occurrence
of the recharge boundary at any of the wells (1.1 days) are ignored. The aquifer parameters
transmissivity and storativity determined with Theis analyses are summarized in Table 5.3.
The data at the close-in Lakota observation well 11-15 at 243 ft distance are successfully fitted
with the Theis curve and recharge boundary (see Appendix C, Figure C.4-2). A trial analysis of
the best fit yields a transmissivity value lower than the range of other observation wells and a
relatively high storativity value of 0.0013. Because this storativity value is high compared to
confined aquifers in general (e.g., Freeze and Cherry, 1979, Halfi)rd and Kuniansky, 2002) and
also the other Burdock test wells (Table 5.3), aquifer parameters from this well were not further
considered. The high storativity is attributable to the delayed response time ( 140 minutes at
243ft distance), and the cause ofthe delay is attributed to problems with well construction.
At observation well 11-19, completed in the upper Lakota 50 ft radially and 130 ft vertically
from the screened interval in the pumping well, the drawdown data appear to be interpretable
with the Theis analysis and yield a transmissivity value within the range of other observation
wells (see Appendix C, Figure C.4-7). However, the very high storativity value of 0.10 is
inappropriate for a confined aquifer. As described in Appendix A.2, there are a number of
violations of the Theis test conditions when attempting to analyze drawdown due to pumping
between partially penetrating well screens set apart 130 ft ve1tically. The artificially high
storativity is attributed to the time-delay in response (l60 minutes). The time-delay is attributed
to vertical anisotropy as described in Section 5.3, above. Therefore, aquifer parameters from this
well were not further considered.
5.4.2 Hantush-Jacob Drawdown Analysis
The AquiferWin32™ software implements the Hantush-Jacob (Hantush and Jacob, 1955)
analytical model for drawdown analysis that follows the Theis curve in early-time and calculates
a flattening recharge boundary due to vertical leakage from an assumed overlying leaky
confining layer. The vertical leakage is described in the term riB, which is implemented in this
analysis as follows:
• r/B = r/( (T b')/K')05
T transmissivity of confined Lakota aquifer (assume provisional value of 145 ft2/day)
b' thickness of Fuson member aquitard/confining layer (35ft, based on Drawing 5.3)
DV1 02.00279.01 5-4 November 2008
Dewey-Burdock 2008 Pump Test Report Rev O.doc
July 2012 J-36 Appendix J

Knight Piesold CONeULTING
• K' vertical hydraulic conductivity of Fuson ( 1 o-3 ft/day from the TV A test,
Section 2.3.2)
• radial distance (r = 250 ft to well 11-14C and 1,292 ft to wdl 11-2)
• riB well11-14C = 0.11; r/b well11-2 = 0.57
Figure 5.6 shows the Hantush-Jacob analysis at observation well 11--14C where riB is input as
fixed and all data after initial response are equally weighted. It is noted that automated
curve-fitting in the AquiferWin32 ™ software can also be set to optimize to riB, and a value of
0.11 is also obtained, indicating that this is a good match. For distant observation well 11-2 the
software optimized to an riB value of 0.77, so the calculated value of 0.57 was fixed (see
Figure C.4-6 in Appendix C). Transmissivity and storativity values obtained through the curve
matching at the two observation wells are entered in Table 5.3.
5.4.3 Theis-Cooper-Jacob Straight-line Analysis
Figure 5.7 (top) shows a Cooper-Jacob drawdown plot for the Burdock pumping well 11-11C.
This USGS graphical-analysis tool is a spreadsheet that allows manual fitting of the straight-line
(Halford and Kuniansky, 2002). Appendix A.2 provides an overview of the theoretical basis for
straight-line test analysis and definitions for the terms u, u', t and t'. The portion of the plot
corresponding to later time where u < 0.01 is indicated, and this slope is used to determine
transmissivity of 150 ft2/day and well efficiency of 65 percent (Table 5.3).
The bottom portion of Figure 5.7 shows the USGS spreadsheet implementation of the Theis
recovery analysis for the pumping well 11-11 C, referred to as the Theis-Cooper-Jacob method
(Halford and Kuniansky, 2002). The portion of the plot com:sponding to later time where
u' < 0.01 is indicated to the left on the t/t' axis, and this slope is used to determine transmissivity
of 140 ft2/d (Table 5.3). A definite change in slope indicating a late time leakage/recharge
boundary is not apparent at the pumping well, but the late-time data has a slight upward
concavity indicating reduction in the rate of drawdown.
The results of Theis recovery analyses for all wells are summarized in Table 5.3, together the
u' criteria on which each transmissivity determination is based. Analyses with u' > 0.01 are
tabulated but are not considered acceptable, as indicated in the table.
5.4.4 Distance-Drawdown Analysis
Figure 5.8 is distance-drawdown analysis plot that determines transmissivity, storativity, and
pumping well efficiency by considering all observation wells at once. As shown on Figure 5.8,
DV1 02.00279.01 5-5 November 2008
Dewey-Burdock 2008 Pump Test Report Rev O.doc
July 2012 J-37 Appendix J

Knight Piesold CON.ULTING
fitting a straight line to incorporate the close-in observation wells 11-14C and 11-15
simultaneously is not ideal because it averages the clearly anisotropic response between the
close-in wells. On the other hand, convention (Driscoll, 1986 and numerous other references)
dictates that a distance-drawdown analysis should be based on a minimum of three observation
wells. It is noted that if a two-well solution is used ignoring the anisotropic response at well
11-14C, transmissivity is 108 ft2/day and storativity is 2.8 X 10⁻⁵. Nevertheless, the three-well
solution with greater transmissivity and storativity is accepted as indicated on the figure and in
Table 5.3.
The pumping well efficiency of 61 to 63 percent is determined with the three-well distance
drawdown solution by extending the straight line to the assumed diameters of the pumping well.
These efficiencies agree with the 65 percent determined in the USGS spreadsheet (Table 5.3).
The aquifer parameters are somewhat questionable given the relatively poor (r2 = 0.7) straight
line fit through all data points. Based on the large u criterion (0.08) at one of the wells (11-15),
the transmissivity and storativity values obtained are not included in the overall average aquifer
parameters for the test (Table 5.3).
The distance-drawdown analysis also gives the maximum radius of influence of the test. Based
on Figure 5.8, the radius of influence was about 2,100 ft, somewhat greater than the radial
distance to the most distant responding well (i.e., 11-2 at 1,292 ft). The radius of influence may
be compared to the dimensions of prospective well fields in the area 1to evaluate whether aquifer
parameters have been adequately characterized.
5.4.5 Summary of Burdock Test- Lower Lakota (Chilson) Formation Aquifer
Parameters
The aquifer parameters determined by the techniques described above are summarized in
Table 5.3. Nine accepted determinations of transmissivity (outlined) range from 120 to
223 ft2/day and the mean and median are close at 150 and 158 ft2/day. Four accepted storativity
determinations ranged from 6.8 x 10⁻⁵ to 1.9 x 10⁻⁴• The geometric mean and median storativity
values are 1.1 x 1 o-4 and 1.2 x 1 o-4• The median transmissivity of 150 ft2/day and median
storativity of 1.2 x 1 o-4 are considered the best measures of the c1~ntral tendency of the test
results.
Only two wells were used to contribute to the overall storativity msults because of the large
anisotropy in responses exhibited between wells 11-15 and 11-14C and the anomalous results at
DV1 02.00279.01 5-6 November 2008
Dewey-Burdock 2008 Pump Test Report Rev O.doc
July 2012 J-38 Appendix J

Knight Piesold CONaULTING
11-15 described above. Powertech geologists have noted that then! were problems with the
installation ofwellll-15.
5.5 Overlying Fall River Aquifer Test Results
Observation well 11-17 is screened in the lower Fall River 50 ft laterally and about 185 ft
vertically above the screen in pumping well 11-11C (Table 5.2, Drawing 5.3). Piezometric
surface information for the Lakota aquifer indicates the two wells are locally hydraulically
connected with similar water levels within± 2ft (Table 5.2).
Figure 5.3 illustrates response of observation welll1-17 to the drawdown phase of the Burdock
well 11-11 C pumping in the Lakota Formation. The first response was a very slight increase in
pressure over a period of about 600 minutes, corresponding to a water level increase of about
0.12 ft (3 .5 centimeter [em]). The water level stopped increasing then underwent 1.1 ft of
drawdown to time ofpump shut-down (2:00PM) on May 21, 2008. Drawdown continued for
about a day to a maximum of 1.4 ft, then remained flat with erratic fluctuations for another
24 hours, until the evening of May 23, 2008 where a partial and sharply "spiked" recovery
started.
The response of a "reverse" drawdown monitored in a zone abovt! (or below) the pumping zone
is known as the Noordbergum effect (Ohio EPA, 2006). There is uncertainty whether the water
level increase at Burdock well 11-17 is the Noordbergum etiect or alternatively a barometric
response. In any case, the Noordbergum effect was observed in the 1979 TV A Lakota aquifer
pumping test at Burdock pumping at 200 gpm where increases in water levels were monitored in
the Fall River aquifer and Fuson Member observation wells for 30 to 90 minutes after the start of
the test. Judging from the water level plot figures (Boggs and Jenkins, 1980), the increases were
a fraction of a ft in the Fall River and up to about 1.5 ft in the Fuson.
In a 1985 pumping test in the Eastern Black Hills near Wall, South Dakota, pumping at 125 gpm,
a water level rise of about 1. 7 ft just after pumping started, eventually declining in an "erratic
manner", was attributed to the Noordbergum effect (Rahn, 1992). There the well (Kelly Well)
with the anomalous response was open to an unknown portion of the Inyan Kara aquifer;
however it was considered to be somewhat hydraulically isolated from the pumping and other
observation wells based on differing background water levels.
The fact that substantial Noordbergum effects were observed in pumping tests in the Fuson/Fall
River and Inyan Kara (undifferentiated) monitoring wells at widely spaced locations in the Black
DV1 02.00279.01 5-7 November 2008
Dewey-Burdock 2008 Pump Test Report Rev O.doc
July 2012 J-39 Appendix J

Knight Piesold CON8ULTING
Hills uplift (i.e., the TVA and Wall tests) suggests the effect is a characteristic of the Inyan Kara
Group. A small magnitude Noordbergum effect response observed in the 2008 test at Burdock is
attributable to the much lower pumping rate and relatively short, 10-ft screened intervals ofboth
pumping and observation wells. The Noordbergum effect of a 10 em rise in water levels has been
simulated with numerical models by the USGS (Hsieh, 1997), where three-dimensional
deformation caused by groundwater withdrawal from a confined aquifer can induce positive
hydraulic head changes in adjacent aquitards (and presumably in an aquifer overlying an
aquitard).
An alternative explanation for the slight rise in water level in the Falll River (Burdock 11-17) is
found in similar patterns of water level changes seen in the Unkpapa Formation
(Burdock 11-18), underlying the Lakota Formation, at about the same time and magnitude. This
will be described further in Section 5.6 below.
Referring again to Figure 5.3, an explanation for the drawdown in the Fall River aquifer at
Burdock continuing for about a day past the pump shut-down and then stabilizing for another
day is not apparent. It is most similar to the 1.5 days of extended drawdown and poor recovery
observed at well 29-7 at the Dewey pumping test. These anomalous responses are attributed to
the observation wells having been located away from the sandstone layer with the pumping well;
it is possible the observation wells are monitoring localized effects in sedimentary facies
separated from the pumping well by numerous shale layers,
5.6 Underlying Unkpapa Aquifer Test Results
As discussed in Section 3, observation well 11-18 is screened in the Unkpapa aquifer 35 ft
laterally and 195 ft vertically below the screen in pumping well 11-11 C (Table 5.1 ). Piezometric
surface information for the Unkpapa and Lakota aquifers indicate the two wells are locally
hydraulically isolated, with a nearly 70 ft head difference directed vertically upward (Table 5.1 ).
Figure 5.4 illustrates that there was no response of observation well 11-18 to the draw down or
recovery phases at the pumping well 11-11 C. However, comparison with the Fall River
observation well (Burdock 11-17, Figure 5.3) finds a similar pattern, timing and magnitude of
several water level changes. In addition to the early time rise in water levels (i.e. possible
Noordbergum effect described above) starting at about 2:00 PM on 5/18/08 (i.e., the time of
pump shut-down and start of recovery), there are the following similarities:
• the erratic transducer readings starting at about 3:00PM on 5/22/08
DV1 02.00279.01 5-8 November 2008
Dewey-Burdock 2008 Pump Test Report Rev O.doc
July 2012 J-40 Appendix J

Knight Piesold CONaULTING
• the upward spike in transducer readings at about 7:00 PM on 5/23/08
The barometer readings for the site (Figure 3.1) were examined in detail, and there is a possible
correlation with barometric fluctuations where the water level incn~ases start at the times of
temporary declines (troughs) in barometric pressure throughout an overall period of increasing
atmospheric pressure (i.e., going forward in time from the start of Burdock Recovery on Figure
3.1 ). However, throughout several days there were equally large fluctuations in barometric
pressure with no similar corresponding changes in water levels.
An explanation for the water level variations simultaneously in both wells is that the Unkpapa
monitoring well 11-18 (Figure 5.4) records a barometric and tidal response while the Fall River
monitoring well 11-17 (Figure 5 .3) records a combination of both draw down (without recovery)
and barometric response. As noted above, the existence of the Noordbergum effect at the Fall
River monitoring well is possible but uncertain.
DV1 02.00279.01 5-9 November 2008
Dewey-Burdock 2008 Pump Test Report Rev O.doc
July 2012 J-41 Appendix J

Knight Piesold CON.ULTING
6.0 Laboratory Core Data
6.1 Background
Selected core samples were sent to Core Laboratories by Powert{:ch (Personal Communication,
Frank Lichnovsky, February 1, 2008) for measurement of intrinsic permeability to assess the
differences in the less permeable Skull Creek shale, Fuson shale,. Morrison shale, and interbed
units of the Dewey (Fall River) and Burdock (Lakota) sandstone units. The intrinsic
permeability data were converted to hydraulic conductivity values as shown in Table 6.1.
6.2 Conversion from Intrinsic Permeability to Hydraulic Conductivity
Intrinsic permeability is a property of the core material (rock) only andl does not include any fluid
properties. The core intrinsic permeability was measured by moving air through the core under
confining pressure in the laboratory which resulted in the measurement of both porosity (from
the bulk density and particle density of the core) and intrinsic permeability in milliDarcys (mD)
as shown in Table 6.1. The footnotes at the bottom of Table 6.1 slhow the constants assumed for
the conversion from intrinsic permeability to hydraulic conductivity at the prevailing
temperatures ofthe laboratory, assumed to be 70 °F, and the site groundwater (average of52.8 °F
from field measurements by RESPEC (Personal Communication, Crystal M. Hocking, February
4, 2008).
It is well known that the units of intrinsic permeability can be changed from mD to cm2 by using
equations shown in Table 6.1. The intrinsic permeability is multiplied by the fluid properties of
water density times the gravitational constant divided by the dynamic viscosity (both temperature
dependent) of the site groundwater to obtain the hydraulic conductiivity.
Analyses of core data in Table 6.1 indicate that the horizontal hydrauliic conductivity of the Skull
Creek shale is approximately 6.0 x 10⁻⁸ centimeters per second (cm/s). The horizontal hydraulic
conductivity of the Fuson Shale ranges from 8.0 x 10⁻⁷ to 3.2 x 1 o-8 cm/s, and for the Morrison
between 7.7 x 10⁻⁷ and 3.1 x 10⁻⁹ cm/s. Vertical hydraulic conductivities ofthe Skull Creek and
Morrison shales, and the Fuson shale from the Dewey project area, are typically one-tenth to
one-twentieth the horizontal values. In terms of ft per day (ft/day) vertical hydraulic
conductivities for all the above shale units range from about 2 to 6 x 1 o-5 ft/day.
The average vertical hydraulic conductivity for the two core samples from the Fuson shale from
the Burdock project area is considerably more permeable (9.8 x 10⁻⁸ em/sec), at roughly
25 percent the horizontal value. In terms of ft/day, vertical hydraulic conductivities for the
DV1 02.00279.01 6-1 November 2008
Dewey-Burdock 2008 Pump Test Report Rev O.doc
July 2012 J-42 Appendix J

Knight Piesold CONeULTING
Burdock Fuson shale units are about 3 x 10⁻⁴ ft/day, about one order of magnitude less than the
Fuson shale sample at the Dewey project area (2 x 10⁻⁵ ft/day) and also all the Skull Creek and
Morrison shale samples.
In contrast, the core units of the Burdock Lakota sandstone unit have an average horizontal
hydraulic conductivity of2.6 x 10-3 cm/s (7.4 ft/day), ranging trom 2.1 x 10⁻³ to 3.2 x 10⁻³ cm/s.
Core from the Dewey Fall River sandstone unit has a horizontal hydraulic conductivity of
2.2 x 10⁻³ cm/s (6.1 ft/day). The ratio of horizontal to vertical hydraulic conductivity (Kh:Kv) for
the Burdock sandstone units is 2.4:1, and for the Dewey sandstone unit it is 4.5: l, based on the
core data shown in Table 6.1.
6.3 Interpretations of the Laboratory Core Data
Comparison of horizontal hydraulic conductivity of the Dewey and Burdock sandstone samples
in Table 6.1 with the conductivity calculated from pumping test transmissivity (Tables 4.3 and
5.3) can be made as follows:
• Dewey Transmissivity 255 ft2/d divided by 15 ft screen length = 17 ft/day
• Dewey Transmissivity 255 ft2/d divided by 165 ft formation thickness = 1.5 ft/day
• Burdock Transmissivity 150 ft2 /d divided by I 0 ft screen length = 15.0 ft/day
• Burdock Transmissivity 150 ft2/d divided by 170ft formation thickness = 0.9 ft/day
The most commonly used procedure when converting test results is to use the screen length of
the pumping well as the divisor. The above analysis indicates that the pumping test data may be
interpreted to yield up to two to three times greater higher hydraulic conductivity than core data.
However, the above analysis also indicates that the hydraulic conductivities calculated from the
pumping test transmissivities and the overall formation thicknesses bracket the core data at the
lower end of ranges in hydraulic conductivity, with the core falling in the middle of the range.
The core data can be considered to be generally consistent with, and therefore independently
confirming, the pumping test results. Generally, the above ranges in calculated hydraulic
conductivity also indicate order-of-magnitude uncertainty (generally, about one to 17ft/day),
Powertech reports that the laboratory would not take samples containing uranium, so sandstone
core samples from outside of the ore zone were submitted. The electric logs and boring
lithologic logs indicate that the core samples were taken from sandstone layers which may have
DV1 02.00279.01 6-2 November 2008
Dewey-Burdock 2008 Pump Test Report Rev O.doc
July 2012 J-43 Appendix J

Knight Piesold CONeULTING
had slightly different, possibly less permeable, ideologies than the scn~ened intervals used for the
pumping tests in the ore zones.
6.4 Conclusions
The first conclusion from the core analyses is that the major shale aquitards (Fuson, Skull Creek,
Morrison formations) have hydraulic conductivities several orders of magnitude lower than
hydraulic conductivities of either the Fall River or Lakota sandstom! units. Using the vertical
hydraulic conductivities as a measure of degree of confinement, at the Burdock project area
Table 6.1 indicates that the shales in the Fuson overlying the Lakota formation (Kh = 7.4 ft/day)
have an average vertical permeability of about 2.7 x 1 o-4 ftlday and the underlying Morrison
formation 6.0 x 10⁻⁵ ft/day. At the Dewey project area, shales in the Fuson formation underlying
the Fall River formation (Kh = 6.6 ft/day) have an average vertical permeability of
1.8 x 10⁻⁵ ft/day, and shale in the single sample of overlying Skull Creek shale has a vertical
permeability of 1.5 X 10⁻⁵ ftlday.
The second conclusion is that core data from the sandstones are within the range of hydraulic
conductivities determinable from test transmissivities, specifically 1.5 to 17 ft/day at the Dewey
project area and 0.9 to 15 ftlday at the Burdock project area. This is also an appropriate range of
uncertainty for converting the test results to hydraulic conductivity. Using the usual procedure
for determining hydraulic conductivity from pumping test transmissivity, the sandstone core
results may have two to three times smaller hydraulic conductivities than those estimated from
the pumping tests, perhaps due to slightly different lithologies between the core and screened
intervals. Overall, there is reasonable agreement between the laboratory and field hydraulic tests
considering typically order-of-magnitude differences in hydraulic conductivity determinations.
DV1 02.00279.01 6-3 November 2008
Dewey-Burdock 2008 Pump Test Report Rev O.doc
July 2012 J-44 Appendix J

Knight Piesold CONeUI.TING
7.0 Summary and Conclusions
The following sections first summarize new facts about the Dewey and Burdock project areas
based on the 2008 tests and related information. A discussion of the r1esults in comparison to the
1979 to 1982 TV A pumping tests follows. The Burdock site is discussed first because
comparison with the TV A tests is most straightforward.
7.1 Burdock Project Area
7.1.1 Summary
A summary of aquifer parameters for the 2008 Burdock pumping test and related laboratory core
testing is as follows:
• Nine determinations of transmissivity (Table 5.3) ranged from 120 to 223 ft?/day with
the median value of 150 ft?/day.
Four storativity determinations (Table 5.3) ranged from 6 .. 8 x 10⁻⁵ to 1.9 x 10⁻⁴ with
the median value of 1.2 x I o-4•
• The radius of influence of the pumping test determined by a distance-drawdown plot
was 2,100 ft (Section 5.3.3).
• The pumping well in the lower Lakota formation was. determined to be moderately
efficient: 80 to 83 percent by the empirical distance-drawdown method and
65 percent the USGS (Halford and Kuniansky, 2002) theon~tical method.
• Laboratory measurements of horizontal and vertical hydraulic conductivity
(Table 6.1) were made on sandstone layers similar to that tested in the pumping test;
measured horizontal hydraulic conductivity ranged from 5.9 to 9.1 ft/day, the mean
value was 7.4 ftlday and the mean ratio of horizontal to vertical hydraulic
conductivity in Burdock area sandstone was 2.47:1
• Laboratory measurements of horizontal and vertical hydraulic conductivity
(Table 6.1) were made on shale layers from the two major confining units for the
Lakota formation in the pumping test area with the following results:
- Fuson Shale: the laboratory core data indicate vt:rtical permeabilities of about
2 x 10⁻⁷ to 1 x 10⁻⁸ em/sec (average 2.7 x 10⁻⁴ fit/day) for shale samples from
within the Fuson member overlying the Lakota formation.
- Morrison Shale: the laboratory core data for the shales in the underlying Morrison
formation indicate vertical permeabilities of 9 x 10⁻⁹ to 3 x 10⁻⁸ em/sec (average
6.0 X 10⁻⁵ ftlday).
DV102.00279.01 7-1 November 2008
Dewey-Burdock 2008 Pump Test Report Rev O.doc
July 2012 J-45 Appendix J

Knight Piesold CONaVLTING
• The range of hydraulic conductivities determinable from test transmissivities
(Section 6.3) was 0.9 to 15.0 ft/day, which is considen~d an appropriate range that is
also verified by the sandstone core sample results falling in the middle of the range; it
is noted that the lower end of the hydraulic conductivity range is probably appropriate
for use with the entire formation thickness (shale layers included) and the upper end
represents the most permeable sandstone layers such as the ore zone areas tested in
the pumping test.
7.1.2 Conclusions
The Burdock pumping test in 2008 may be directly compared to the 1979 TV A test for the
Lakota (Chilson) aquifer as the tests were nearly at the same location (Figure 1.1 ). The average
transmissivity and storativity values determined from the TV A tests were 190 ft2/d and 1.8 x 10⁻⁴
(Section 2.3, see p. 17 in Boggs and Jenkins, 1980). Comparing median transmissivity of
150 ft2/d and storativity of 1.2 X 10⁻⁴determined in the 2008 test (Section 5.4.4) to the TV A test,
the new aquifer parameters for the lower Lakota are respectively about 80 and 70 percent of the
1979 results. Because transmissivity and storativity depend on aquifer thickness, comparing the
results suggests that there may be some scaling effect between the tests due to the differing
lengths of screened intervals.
Therefore, the 1979 TV A test is transmissivity of 190 ft2/d is considered representative of the
entire Lakota aquifer for a regional application, such as groundwater flow model where an
average hydraulic conductivity of about 1 ft/day over a thickness of 170 ft could be specified.
The 2008 test provides specific data at the operational-scale of a prospective ISR well field
where local hydraulic conductivities of up to 15 ftlday could be specified for the most permeable
ore zones horizons.
Within the Lakota formation, vertical communication throughout the entire formation is
indicated by the delayed response at the upper Lakota observation well (11-19). The 160-minute
delay in response at the upper Lakota observation well 11-19 is attributed to lateral and vertical
anisotropy due to the shale interbeds seen on the conceptual stratigraphic cross-sections for the
pumping test site (Drawings 5.1, 5.2 and 5.3 ). The extent and continuity of the shale interbeds
are unknown. Whether the shale interbeds in the Lakota aquifer are sufficiently thick and
continuous to serve as vertical confinement for ISR operations will probably need to be
evaluated by analyzing cores from borings as well fields are drilled.
The 2008 test indicates that the lower and upper portions of the Lakota formation behave as a
single, confined, leaky aquifer. Confinement and leakage from the overlying Fuson member is
DV1 02.00279.01 7-2 November 2008
Dewey-Burdock 2008 Pump Test Report Rev O.doc
July 2012 J-46 Appendix J

Knight Piesold CON.ULTING
evident in the matches to the Hantush-Jacob type curves seen most clearly at observation wells
11-14C and 11-2. These results are more definitive than the 1979 TV A test where confined,
leaky behavior for the Lakota was predicted but not demonstralted with curve match results.
Hydraulic communication through the Fuson member between the Lakota and Fall River
aquifers is evidenced by the drawdown at the Fall River observatiion well 11-17, indicating that
leakage was established through underlying the Fuson formation.
The laboratory core data indicate an average vertical permeability of9.3 x 10-8 (2.7 x 10⁻⁴ ftlday)
for shale samples from within the Fuson member. The shale core permeability values are about
one to two orders of magnitude less permeable than pumping test values determined in the 1979
TV A test at Burdock, where the vertical hydraulic conductivi~y of the Fuson aquitard was
calculated using the Neuman-Witherspoon ratio method to be about 10-3 ftlday (see page i in
Boggs and Jenkins, 1980).
As described in Section 5.1, the potentiometric surface in the Fall Riv{:r aquifer is close to that in
the Lakota aquifer at the Burdock pumping test site, indicating some local connection between
the two formations through the intervening Fuson member. In oth1~r locations in the Inyan Kara,
the Fuson member is known to have sandstone layers that are downcut into the Lakota member
(Gott et al., 1974). Therefore, determining the degree of vertical confinement for ISR operations
by the Fuson will probably need to be evaluated by analyzing cores from borings as well fields
are drilled, and with well field-scale pumping tests that are proposed to be conducted prior to
startup of each particular mine unit.
The aquifer tests in 1979 and 2008 indicate that the Lakota Formation is a confined aquifer with
a leaky confining layer, which is demonstrably the Fuson member. The laboratory core data for
the shales in the underlying Morrison formation indicate an av1~rage vertical permeability of
2.1 x 10⁻⁸ em/sec ( 6 x 10⁻⁵ ftlday). Together with the pumping t<:st data, the core data indicate
that the underlying Morrison formation and overlying Fuson member can serve as aquitards for
ISR operations.
For the Lakota sandstone, the laboratory core data indicate an av<!rage horizontal hydraulic
conductivity of7 ftlday, and as high as 9.1 ftlday. Interpretation of the test results calculates that
horizontal permeability may be as great as 15 ft/day throughout one of the ore zones. Within the
lower Lakota formation, the test results indicate transmissive response between pumping and
observation wells up to 250 ft apart with 17 ft of drawdown. Response was nearly 3 ft of
DV1 02.00279.01 7-3 November 2008
Dewey-Burdock 2008 Pump Test Report Rev O.doc
July 2012 J-47 Appendix J

Knight Piesold CONeULTING
drawdown at 1,290 ft distance. This indicates the aquifer was stresst!d to produce good quality
analytical results.
7.2 Dewey Project Area
7.2.1 Summary
A summary of aquifer parameters for the 2008 Dewey pumping t1est and related laboratory core
testing is as follows:
Ten determinations oftransmissivity (Table 4.3) ranged from 180 to 330 ft2/day with
the median value of255 ft2/day.
• Five storativity determinations (Table 4.3) ranged from 2.3 X 1 o-5 to 2.0 X 1 o-4 with
the median value of 4.6 x 10⁻⁵•
• The radius of influence of the pumping test determined by a distance-drawdown plot
was 5, 700 ft (Section 4.4.3).
• The pumping well in the Fall River formation was det1:!rmined to be highly efficient:
93 to 95 percent by the empirical distance-drawdown method and 81 percent the
USGS (Halford and Kuniansky, 2002) theoretical method.
• Laboratory measurements of horizontal and vertical hydraulic conductivity
(Table 6.1) were made in a core sample from the sands1tone layer similar to that tested
in the pumping test; measured horizontal hydraulic conductivity was 6.1 ftlday, and
the ratio of horizontal to vertical hydraulic conductivity was 4.5: 1.
• Laboratory measurements of horizontal and vertical hydraulic conductivity
(Table 6.1) were made on shale samples from the two major confining units overlying
and underlying the pumping test area with the following results:
- Skull Creek shale: laboratory core data for the shale sample from the overlying
Skull Creek formation indicate a vertical perme:ability of 5.4 x 10⁻⁹ em/sec
(1.5 x 10⁻⁵ ftlday).
- Fuson Formation: laboratory core data for the shalle sample from the underlying
Fuson formation indicate a vertical permeability of 6.2 x 1 o-9 em/sec
(1.8 x 10⁻⁵ ft/day).
7.2.2 Conclusions
The Dewey pumping test in 2008 in the Fall River aquifer is not directly comparable to the
1982 TV A test because the underlying Lakota aquifer was teste:d in 1982. As demonstrated
above for the Lakota aquifer (Section 7.1 ), a scaling effect may lbe assumed between total
formation transmissivity and storativity (i.e., regional-scale) and the 2008 operational-scale test.
DV1 02.00279.01 7-4 November 2008
Dewey-Burdock 2008 Pump Test Report Rev O.doc
July 2012 J-48 Appendix J

Knight Piesold CONaULTING
However, there are several lines of evidence that the 2008 test transmissivity and storativity
results are representative of the entire Fall River aquifer at the Dewey test site, as follows:
1. Thickness of the sandstone layer screened by the pumping well is about one-half the total
formation thickness as shown in Drawings 4.1 and 4.2.
2. Response at the stock tank well (GW-49 at 1,400 ft distance) was within the acceptable
range for a confined aquifer; this is interpreted to indicate that the effects of partial
penetration (due to elevation differences between the pumping well screen and the
observation well open to the upper half of the aquifer) were diminished at the 1,400 ft
distance and 40 minute response time.
3. The delay in response at the upper Fall River observation well 32-9C was a relatively
brief 11 minutes (Table 4.2), compared to 160 minutes in the Burdock test; together with
(2) above, these responses suggest that the vertical anisotropy due to shale interbeds
overlying the lower sandstone layer does not extend laterally for more than about
1,400 ft.
The 2008 test indicates that the lower and upper sandstone portions of the Fall River formation
behave as a single, confined, aquifer with some form of lateral barrier due changing lithology,
such as a channel boundary. The TVA test in 1982 observ,:d a barrier boundary in the
underlying Lakota formation which was attributed to either a change in lithology or the Dewey
Fault zone. Apparently, both the Lakota and Fall River formations in the general Dewey project
area are highly transmissive and show barrier boundaries. These test results are more definitive
than the 1982 TVA test concerning the proximity of the barrier boundary, because the 2008
radius of influence was about one mile compared to greater than two to three miles distance to
the fault zone.
Vertical communication throughout the entire Fall River formation i:s indicated by the delayed
response at the upper Fall River observation well (32-9C). Within th1~ Fall River formation, the
11-minute delay in response at the upper observation well is attributed to lateral and vertical
anisotropy due to the shale interbeds seen on the conceptual stratigraphic cross-sections for the
pumping test site (Drawings 4.1 and 4.2). The extent and continuity of the shale interbeds are
not known. Whether the shale interbeds in the Fall River aquiifer are sufficiently thick and
continuous to serve as vertical confinement for ISR operations will need to be evaluated by
analyzing cores from borings as well fields are drilled.
DV1 02.00279.01 7-5 November 2008
Dewey-Burdock 2008 Pump Test Report Rev O.doc
July 2012 J-49 Appendix J

Knight Piesold GON8ULTING
Leakage from a confining layer, presumably the Fuson member, was observed in the 1982 TVA
test of the Lakota formation. However, the leakage was observed only relatively late in the TV A
tests, at 3,000 to 10,000 minutes, with a much greater pumping ratt;: ( 495 gpm) and radius of
influence. The large-scale vertical hydraulic conductivity value of 2 x I o-4 ft/day
(7 .I x 1 o-8 em/sec) determined in the 1982 TV A regional test at Dewey using the
Neuman-Witherspoon ratio method is sufficiently impermeable to be considered an aquitard or
aquiclude_
Hydraulic communication through the Fuson member between the Fall River and underlying
Lakota aquifers is not indicated by the 2008 response at observation well 32-10_ The 2008 test
demonstrates that vertical leakage through the Fuson may not occur over a mile-wide radius. As
described in Section 4.1, the Lakota and Fall River aquifers at the~ Dewey test site appear to be
locally hydraulically isolated by the intervening Fuson member with nearly 40 ft head difference.
The laboratory core data indicate a very low vertical permeability of 6.2 x 1 o-9 em/sec
(1.8 x 10⁻⁵ ft/day) for the shale sample from within the Fuson shale member.
The laboratory core data for the shale sample from the Skull Creek formation, overlying the Fall
River formation, indicate a very low vertical permeability of 5.4 x 10⁻⁹ em/sec ( 1.5 x 10⁻⁵ ftlday),
also appropriate for an aquitard or aquiclude.
For the Fall River sandstone, the laboratory core data indicate a horizontal hydraulic conductivity
of 6.1 ftlday, and interpretation of the test results calculates that horizontal permeability may be
as great as 17 ftlday throughout one of the ore zones. Within the lower Fall River formation, the
test results indicate transmissive, rapid response (two to three minutes) between pumping and
observation wells up to 467 ft apart with nearly 10 ft of drawdown. Response was nearly 9 ft of
drawdown at I ,400 ft distance. This indicates the aquifer was stressed to produce good quality
analytical results.
DV1 02.00279.01 7-6 November 2008
Dewey-Burdock 2008 Pump Test Report Rev O.doc
July 2012 J-50 Appendix J

Knight Piesold CONSULTING
8.0 Certification
This report "Powertech (USA) Inc., Dewey-Burdock Project, 2008 Pumping Tests: Results and
Analysis" has been prepared for Powertech (USA) Inc. by Knight Piesold and Co. The material
in it reflects the best judgment of Knight Piesold and Co. in light of the information available to
both firms at the time of the report preparation. Any use which a third party makes of this report,
or any reliance on or decisions made based on it, are the responsibility of such third parties.
Knight Piesold and Co. and Powertech (USA), Inc. accept no responsibility for damages, if any,
suffered by any third party as a result of decisions made or actions based on this report.
This numbered report is a controlled document. Any reproductions of this report are
uncontrolled and may not be the most recent revision.
Additional specialist input was provided to the design by the following individuals: Dr. Cory
Conrad, Ph.D., P.G., Dr. James R. Kunkel, Ph.D., P.E., Mr. Paul D. Bergstrom, C.E.P.
Sincerely,
Knight Piesold and Co.
Paul~- M/z:_?<L~~ Cory Conrad, Ph.D, P.G. ' •
Associate Hydrogeologist
DV102.00279.01 8-1 November 2008
Dewey-Burdock 2008 Pump Test Report Rev O.doc
July 2012 J-51 Appendix J

Knight Piesold CON8ULTING
9.0 References
Boggs, J. M., 1983. "Hydrogeologic Investigations at Proposed Uranium Mine Near Dewey,
South Dakota," Report No. WR28-2-520-l 09, Norris, Tenness~:e, October.
Boggs, J. M., and A. M. Jenkins, 1980. "Analysis of Aquifer Tests Conducted at the Proposed
Burdock Uranium Mine Site: Burdock, South Dakota," Report No. WR28-1-520-1 09, Norris,
Tennessee, May.
Driscoll, F. M., 1986. "Groundwater and Wells", Johnson Filtration Systems, Inc., St. Paul, MN,
1089 pp.
Environmental Simulations, Inc. (ESI), 2003. Software Manual for Aquifer-Win32™ Reinholds,
PA. www .groundwatermodels.com
Freeze, R.A. and Cherry, J.A., 1979. Groundwater. Prentice-Hall, Inc., New Jersey, 604 p.
Gontheir, G.J, 2007. "A Graphical Method for Estimation of Barometric Efficiency from
Continuous Data- Concepts and Application to a Site in the: Piedmont Air Force Plant 6,
Marietta, Georgia."" U.S. Geological Survey Scientific Investigations Report 2007-5111.
Gott, B.B., Wollcott, D.E., and C. G.Bowles, 1974. "Stratigraphy of the Inyan Kara Group and
Localization of Uranium Deposits, Southern Black Hills, South Dakota and Wyoming," U.S.
Geological Survey Professional Paper 763.
Halford, K.J ., 2006, "Documentation of a Spreadsheet for Time-Series Analysis and Draw down
Estimation" U.S. Geological Survey Scientific Investigations Report 2006-5024.
Halford, K.J. and E.L. Kuniansky, 2002, "Documentation of Spreadsheets for the Analysis of
Aquifer-Test and Slug-Test Data," U.S. Geological Survey Open File Report 02-197.
Hantush, M.S. and C.E. Jacob, 1955, Non-steady radial flow in an infinite leaky aquifer, Am.
Geophys. Union Trans., v. 36, no. 1, p. 95-100.
Hsieh, P. E, 1997. "Poroelasticity Simulation of Ground-wate:r Flow and Subsurface
Deformation" U.S. Geological Survey Open File Report 97-47. p 5-9
Keene, J.R., 1973 "Ground-water Resopurces of the Western Half of Fall River County, S.D., Dept. of Natural Resource Development, Geological Survey, Report of Investigations
109.
Knight Piesold, 2008. Pump Test Work Plan, Dewey-Burdock In Situ Uranium Project, April25.
Kruseman, G. P. and N. A. de Ridder, 1990. "Analysis and Evaluation of Pumping Test Data,"
Second Edition International Institute for Land Reclamation and Improvement (ILRI),
Publication 47, Wageningen, The Netherlands.
DV1 02.00279.01 9-1 November 2008
Dewey-Burdock 2008 Pump Test Report Rev O.doc
July 2012 J-52 Appendix J

Knight Piesold CONaULTING
Neuman, S.P and Witherspoon, P.A., 1973. "Field Determination of the Hydraulic Properties of
Leaky Multiple Aquifer Systems". Water Resources Research, 8. p.l284-1298.
Ohio Environmental Protection Agency, 2006. Technical Guidance for Ground Water
Investigations, accessed October 5, 2007, from the
Sandia Corporation, 2005. User Manual for BETCO Version 1.00, October.
Rahn, P., 1992. "Aquifer Hydraulics in a Deep Confined Cretaceous Aquifer at Wall, South
Dakota". Association of Engineering Geologists, Proceedings,. October 2 - 9, 1992, Los
Angeles, CA, p. 409-418.
Toll, N.J. and Rasmussen, T.C., 2007. Removal ofBarometric Pressure Effects and Earth Tides
from Observed Water Levels., Ground Water, 45, p. 101-105.
DV1 02.00279.01 9-2 November 2008
Dewey-Burdock 2008 Pump Test Report Rev O.doc
July 2012 J-53 Appendix J

Knight Piesold CONaULTING
Tables
July 2012 J-54 Appendix J

Knight Piesold C 011• U LTI II G
Table 4.1 Powertech (USA) Inc.
Dewey-Burdock Project 2008 Pumping Tests: Results and Analysis
Dewey Pumping Test Completion Information WeiiiD and Well Type
Stratigraphic Interval
Ore Zone (lower Fall River Sandstone)
DB 07-32-3C DB 07-32-05 DB 07-32-4C DB 07-29-7
Pumping Well Obs. Well #1 Obs. Well #2 Obs. Well #3
Upper Fall River Sandstone
DB 08-32-9C Obs. Well
Lakota Sandstone Layer
DB 08-32-10 Obs. Well
Unkpapa Formation
DB 07-32-11 Obs Well
Additiona I Wells GW-49 Upper Fall River 70 ft
Location Radial Distance Depth to top
NWQ Sec. 32 NWQ Sec. 32 NWQ Sec. 32 SEQ Sec. 29
NWQ Sec. 32
NWQ Sec. 32
NWQ Sec. 32
NEQ Sec. 29
from pumping Well of Screen (ft) (ft bgs)
0 265 467
2,400
41
61
50
1,433
585 593 580 635
490
715
910
475
Notes: Screen completion information from diagrams prepared by Powertech, Appendix B Radial distance information provided by Powertech.
DV102.00279.01 Table 4_1.xls
1 of 1
Depth to bottom of Screen
(ft bgs)
600 608 595 650
505
730
930
540
Note
Stock Well
November 2008
July 2012J-55
Appendix J

Knight Pie.r;old CONaULTINO
Table 4.2 Powertech (USA) Inc.
Dewey-Burdock Project 2008 Pumping Tests: Results and Analysis
Dewey Pumping Test Drawdown and Response Summary WeiiiDand Well Type Radial Distance
Stratigraphic from pumping Interval Well
(ft)
Ore Zone (lower Fall River Sandstone)
DB 07-32-3C DB 07-32-05 DB 07-32-4C DB 07-29-7
Pumping Well Obs. Well#1 Obs. Well #2 Obs. Well #3
Upper Fall River Sandstone
DB 08-32-9C Obs. Well
Lakota Sandstone Layer
DB 08-32-10 Obs. Well
Unkpapa Formation
DB 07-32-11 ObsWel!
Additional Wells GW-49 Stock Well
0 265 467
2,400
41
61
50
1,433
Approximate Ground Surface
Elevation
(ft amsl)1
3626.3 3622.2 3626.3 3662.5
3625.9
3625.2
3625 2
3628
Approximate z 0
Groundwater ID Elevation
(ft amsl)2
3643.9 3641.0 3644.0 3659.3
3626.3
3682.8
3761 0
3652
A A A
A
A
A
A
Notes: Screen completion information from diagrams prepared by Powertech, Appendix A Radial distance informationprovided by Powertech.
1 Ground Surface Elevations from Powertech
Maximum Drawdown at
3.08 days (ft)3
44.8 13.0 9.8 1.5
10.6
-0.1
-20
9.0
z 0 ID
a
Time of First Drawdown Response
(min)
0.0 1.6 to 2.4
2.8 140 to 850
11.5
N No Response
N No Response
40
2 Pressure or depth to water measurements relative to ground surface, Eric Krantz, RESPEC, personal communication.
Minimum Pumping Groundwater
Elevation (ft amsl)
3599.1 3628.0 3634.2 3657.8
3615.7
NA
NA
3643.0
3 From table of processed drawdown data in Appendix B, or calculated visually from WinSituTM graph and table of data in non-responding wells. 4 Boundary time estimated based on time of deviation from Theis type curve; 0.7 days used for weighting calculations. A Artesian pressure surface above ground level. N N response to pumping, water level rose slightly through drawdown phase of test a Drawdown continued for about 1.5 days past pump shut-down to a maximum of 2.1 ft at about 3:00 AM on May 20, 2008.
DV102.00279.01 Table 4_2.xls
1 of 1
Boundary Type
(days)4
Barrier (0.7) Barrier (0.6)
Barrier (1.9)
November 2008
July 2012J-56
Appendix J

Knight Piesold CON.ULTIN.
Table 4.3 Powertech (USA) Inc.
Dewey-Burdock Project 2008 Pumping Tests: Results and Analysis
Summary of Aquifer Hydraulic Characteristics for the Dewey Pumping Test
Dewey Test Site Pumping Test Interpretations
Well Weiii.D.
Ore zone (lower Fall River Sandstone)
32-3C Pumping 0.25 (0.33)
Pumping Well Efficiency= 80%(3)
32-5 Obs #1 243
32-4C Obs#2 467
29-7 Obs#3 2,400
Interpretation Method
Theis DD(1l
CJ DD (3l
CJ Recovery (3)
Theis DD(1l
Theis Recovery(1l
CJ Recovery(3l
Theis DD(1l
CJ Recovery (3l
Theis DD(2l
Transmissivity (tetday)
250
250
270
294
260
280
333 ·--::II 120
178
u or u'
<0.01
<0.01
<0.01
<0.01
<0.01
CJ Recovery (3) Insufficient recovery for analysis
Fall River Aquifer Stock Well (Screened in top half of Fall River)
GW-49 Stock 1 ,400 Theis DD(1l II 177
Upper Fall River Sandstone 32-9C Obs 41
DV102.00297.01 Table 4_3 Summary T&S.xls
CJ Recovery (3)
Theis DD(1l CJ Recove~ · (3)
1 of2
110
217 150
<0.05
<0.05
Storativity
1.2E-06(dl
3.3E-05
1.6E-02
Note
November 2008
July 2012J-57
Appendix J

Knight Piesold CON.ULTIND
Table 4.3 Powertech (USA) Inc.
Dewey-Burdock Project 2008 Pumping Tests: Results and Analysis
Summary of Aquifer Hydraulic Characteristics for the Dewey Pumping Test
Dewey Test Site Pumping Test Interpretations
Well
Weiii.D. Lakota Sandstone Layer
32-10 Obs
Unkpapa Formation 32-11 Obs
Radial Dist.
ft
61
50
Interpretation
Method
Transmissivity (ft2/day)
No response during pumping test.
No response during pumping test.
u or u'
Distance Drawdown (32-5, 32-4C, 29-7, GW-49)<2>
Pumping Well Efficiency = 93% to 95% II 218 II <o.os
Summary: Median 255
Average/Geometric Mean<4> 251
Notes/References: DD = drawdown, CJ = Cooper -Jacob, Obs = Observation Well <1> Calculated by automated curve fitting in AquiferWin32 TM software (ESI, 2003).
<2> Knight Piesold spreadsheet after methods in Driscoll (1986).
<3> Spreadsheet methods in U.S. Geol. Surv. Open File Rept. 02-197, Halford and Kuniansky (2002).
<4> Average value valculated for Transmissivity, Geometric Mean value calculated for Storativity. <a> only slope satisfying u 'critereon occurs after intersection with barrier boundary. (bJ not accepted due to anomalous response at well, see text. <a> storativity not valid at pumping well.
II II= accepted value based on conformance with theory discussed in the text.
DV102.00297.01 2 of2
Table 4_3 Summary T&S.xls
Storativity Note
it:-uo ~~~ = 0.78 (4 point line)
I 4.60E-05
-uo
November 2008
July 2012J-58
Appendix J

Knight Piesold COII.ULTIN.
Table 5.1 Powertech (USA) Inc.
Dewey-Burdock Project 2008 Pumping Tests: Results and Analysis
Burdock Pumping Test Completion Information WeiiiD and
Stratigraphic Interval
Well Type Location Radial Distance Depth to top
Ore Zone (lower Lakota Sandstone)
DB 07-11-11C DB 07-11-15 DB 07-11-14C DB 07-11-02
Pumping Well Obs. Well #1 Obs. Well #2 Obs. Well #3
Upper Lakota Sandstone
DB 07-11-19 Obs. Well
Fall River (lower Sandstone layer)
DB 07-11-17 Obs. Weli
Unkpapa Formation
DB07-11-18 Obs Well
Additiona I Distant Wells None
DV102.00279.01 Table 5_1.xls
SWQ Sec. 11 SWQ Sec. 11 SWQ Sec. 11 NWQ Sec.11
SWQ Sec. 11
SWQ Sec. 11
SWQ Sec. 11
from pumping Well of Screen
1 of 1
(ft) (ft bgs)
0 243 250
1,292
50
50
<100
426 418 413 450
325
245
621
Depth to bottom of Screen
(ft bgs)
436 428 423 460
335
255
631
Note
November 2008
July 2012J-59
Appendix J

Knight Piesuld OONeU~TINO
Well ID and Well Type Stratigraphic
Interval
Ore Zone (lower Lakota Sandstone)
DB 07-11-11C DB 07-11-15 DB 07-11-14C DB 07-11-02
Pumping Well Obs. \Nell #1 Obs. \Nell #2 Obs. \Nell #3
Upper Lakota Sandstone
DB 07-11-19 Obs. \Nell
Fall River (lower Sandstone layer)
DB 07-11-17 Obs. \Nell
Unkpapa Formation
Table 5.2 Powertech (USA) Inc.
Dewey-Burdock Project 2008 Pumping Tests: Results and Analysis
Burdock Pumping Test Drawdown and Response Summary Radial Distance from pumping
Well (ft)
0 243 250
1,292
50
50
Approximate Ground Surface
Elevation (ft amsl)1
3700.5 3691.5 3688.4 3717.9
3701.7
3700.1
Approximate Groun~ter ~
Elevation ;-(ft amsl)2
NA 3660.2 3660.9 3664.8
3662.1
3660.3
Maximum Drawdown at
3.0days (ft)3
91.1 10.4 17.0 3.1
3.4
2.1
z 0 -CD
a
Time of First Drawdown Response
(min)
0.0 140.2 3.6 280
160
see note b
Minimum Pumping Groundwater
Elevation (ft arnsl)
3529 3649.8 3643.9 3661.7
3658.7
3657.2
DB07-11-18 Obs \Nell 35 3699.2 3728.4 A -0.5 N No Response NA
Boundary Type
(days)4
Recharge (1.1) Recharge (1.8)
I~~ ~-None
Notes: Radial distance information from Autocad drawing provided by Powertech.
1 Ground Surface Elevations from Powertech 2 Pressure or depth to water measurements relative to ground surface, Eric Krantz, RESPEC, personal communication. 3 From table of processed drawdown data in Appendix B, or calculated from WinSitu™ graph and table of data in non-responding wells. 4 Boundary time estimated based on time of deviation from Theis type curve; shortest time used for weighting calculations. A Artesian pressure surface above ground level. N N response to pumping, water level rose slightly through drawdown phase of test (a)Drawdown continued for about 1 day past pump shut-down to a maximum of 3.1 ft at about 5:00 PM, May 22, 2008. (b)First response was a 0.23 ft rise in water levels peaking at about 12:00 AM on May 19, 2008, interpreted as a possible Noordbergum effect.
DV102.00279.01 Table 5_2.xls
I of I November 2008
July 2012J-60
Appendix J

Knight Piesold . C:ON.UL'I'ING
Table 5.3 Powertech (USA) Inc.
Dewey-Burdock Project 2008 Pumping Tests: Results and Analysis
Summary of Aquifer Hydraulic Characteristics for the Burdock Pumping Test Burdock Project Pumping Test Interpretations
Well Radial Dist. Interpretation Transmissivity u or u' Storativity Weiii.D. T~~e (ft) Method (ft2/da~) (unitless) (unitless
Ore zone (lower Lakota Sandstone)
11-11C Pumping 0.25 (0.33) Theis oo<1l
II 145 II -- 2.9E-09(a)
CJ DD <3l I 150 I <0.01 Pumping Well Efficiency= 65%<3l
CJ Recovery <3l II 140 II <0.01 11-15 Obs #1 243 Theis oo<1l 67 -- 1.3E-03
CJ Recovery (J) 100 <0.1 11-14C Obs#2 250 Theis oo<1l 128
H-J oo<1l 120 -- II 6.9E-05 Theis Recovery<1l 174 <0.01
CJ Recovery <3l 160 <0.01 11-02 Obs#3 1,292 Theis DD<1l 223 -- oE-0
H-J oo<1l 185 -- 7E-04 CJ Recovery <3l 260 <0.15
Upper Lakota Sandstone 11-19 Obs 50 Theis oo<2l 260 -- 1.0E-01
CJ Recovery <3l 190 <0.15 Fall River (lower sandstone layer)
11-17 Obs 50 Noordbergum Effect and response cannot be interpreted analytically
DV102.00279.01 Table 5_3 Summary T&S .xis 1 of2
Note
II
November 2008
July 2012J-61
Appendix J
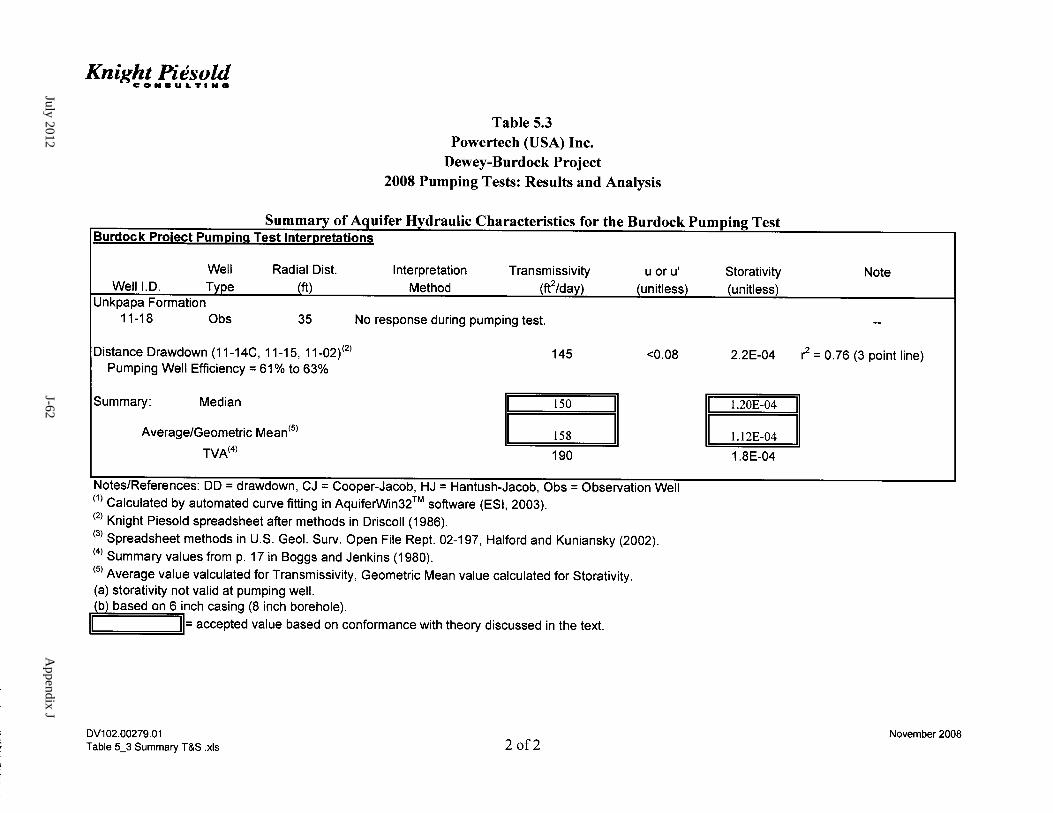
Knight Piesold ~ CON.UI.'I'ING
Table 5.3 Powertech (USA) Inc.
Dewey-Burdock Project 2008 Pumping Tests: Results and Analysis
Summary of Aquifer Hydraulic Characteristics for the Burdock Pumping Test Burdock Project Pumping Test Interpretations
Well Weiii.D. Type
Unkpapa Formation 11-18 Obs
Radial Dist. (ft)
35
Distance Drawdown (11-14C, 11-15, 11-02)<2)
Pumping Well Efficiency = 61% to 63%
Summary: Median
Average/Geometric Mean<5l
TVA<4l
Interpretation Method
Transmissivity
(ft2/d~
No response during pumping test.
145
150
158
190
u or u' (unitless)
<0.08
Notes/References: DO= drawdown, CJ =Cooper-Jacob, HJ = Hantush-Jacob, Obs =Observation Well (1) Calculated by automated curve fitting in AquiferWin32™ software (ESI, 2003).
12\ ., . • • -· • • • . . •. " . . - . ~~ ~ ~ - - - ~ ,-, 1\.mgm t-'leso1a spreaasneet aner metnoas 1n LJnscoll ( 1986).
<3) Spreadsheet methods in U.S. Geol. Surv. Open File Rept. 02-197, Halford and Kuniansky (2002). <4) Summary values from p. 17 in Boggs and Jenkins (1980). (S) Average value valculated for Transmissivity, Geometric Mean value calculated for Storativity. (a) storativity not valid at pumping well. (b) based on 6 inch casing (8 inch borehole).
II II= accepted value based on conformance with theory discussed in the text.
DV1 02.00279.01 Table 5_3 Summary T&S .xis 2 of2
Storativity (unitless)
2.2E-04
r- 1.2oE-o4 ~
'I 1.12E-04 I 1.8E-04
Note
r = 0.76 (3 point line)
November 2008
July 2012J-62
Appendix J

Knight Piesold CONeULTINCI
Table 6.1 Powertech (USA) Inc.
Dewey-Burdock Project 2008 Pumping Tests: Results and Analysis
Laboratory Core Analyses for Powertech USA Inc. at Dewey-Burdock Site Air Water
Intrinsic Hydraulic Confining Permeability(1l Particle Conductivity(2l(3 l
Sample Depth Stress Porosity ka Density Kw Number (ft) (psig) (%) (mD) (g/cm3
) Notes (cm/s)
DB 07-11-11C Burdock 1H 252.20 600 10.50 1.040 2.356 Fuson Shale 8.0073E-07 1V 252.35 600 10.15 0.228 2.356 Fuson Shale 1.7555E-07 4H 412.30 600 9.68 0.041 2.511 Fuson Shale 3.1567E-08 4V 412.45 600 9.59 0.015 2.514 Fuson Shale 1.1549E-08
DB 07-29-1C Dewey 2H 480.70 600 8.90 0.078 2.613 Skull Creek shale 6.0055E-08 2V 480.80 600 9.30 0.007 2.610 Skull Creek shale 5.3896E-09 3H 609.10 600 12.26 0.073 2.603 Fuson Shale 5.6205E-08 3V 609.10 600 10.84 0.008 2.793 Fuson Shale 6.1595E-09
DB 07-11-14C Burdock 5H 423.60 600 29.56 3,207 2.645 Lakota Sand 2.4692E-03 5V 423.35 600 30.34 1,464 2.645 Lakota Sand 1.1272E-03 6H 430.20 600 31.90 4,161 2.640 Lakota Sand 3.2037E-03 6V 430.35 600 30.16 939 2.646 Lakota Sand 7.2297E-04 7H 453.50 600 10.86 1.000 2.519 Morrison Shale 7.6994E-07 7V 453.45 600 11.82 0.043 2.543 Morrison Shale 3.3107E-08
DV102.00279.01 1 of3
Table 6_1 Core Perm_Cond ftday.xls
Core Core
Kh Kv (ft/day) (ft/day)
7.0 3.2
9.1 2.1
November 2008
July 2012J-63
Appendix J

Knight Piesold COII.ULTIIIO
Table 6.1 Powertech (USA) Inc.
Dewey-Burdock Project 2008 Pumping Tests: Results and Analysis
Laboratory Core Analyses for Powertech USA Inc. at Dewey-Burdock Site Air Water
Intrinsic Hydraulic Confining Permeability<1> Particle Conductivity<2><3>
Sample Depth Stress Porosity ka Density Kw Number (ft) (psig) (%) JmD) (g/cm3
) Notes (cm/s) DB-07 -11-16C Burdock 8H 420.40 600 30.50 2,697 2.643 Lakota Sand 2.0765E-03 8V 420.10 600 30.17 1,750 2.651 Lakota Sand 1.3474E-03 9H 455.90 600 6.99 0.004 2.536 Morrison Shale 3.0797E-09 9V 455.45 600 7.65 0.012 2.556 Morrison Shale 9.2392E-09 10H 503.30 600 12.96 0.697 2.474 Morrison Shale 5.3665E-07 10V 503.45 600 No data
DB 07-32-4C Dewey 11H 573.25 600 29.15 2,802 2.641 Fall River Sand 2.1574E-03 11V 573.40 600 29.04 619 2.645 Fall River Sand 4.7659E-04
Summary Average Lakota Sand Kh, Kv Average Lakota Sand Kh,Kv Fall River Sand Kh, Kv Fall River Sand Kh,Kv Dewey Skull Creek Shale Kh 6.01E-08 Dewey Skull Creek Shale Kv 5.39E-09 Dewey Skull Creek Shale Kh/Kv 11.14
DV102.00279.01 2 of3 Table 6_1 Core Perm_Cond ftday.xls
Core Core Kh Kv
(ft/day) (ft/day) I I
5.9 3.8
6.1 1.4
7.4 3.0 2.42 6.1 1.4
4.53 1.71 E-04
1.54E-05
--
November 2008
July 2012J-64
Appendix J

Knight Piesold ~ COIIeULTINO
Table 6.1 Powertech (USA) Inc.
Dewey-Burdock Project 2008 Pumping Tests: Results and Analysis
Laboratory Core Analyses for Powertech USA Inc. at Dewey-Burdock Site Air Water
Intrinsic Hydraulic Confining Permeability11 l Particle Conductivity12l13 l
Sample Depth Stress Porosity ka Density Kw Number (ft) (psig) (%) (mD) (g/cm3
) Notes (cm/s) Average Burdock Fuson Shale Kh 4.16E-07 Average Burdock Fuson Shale Kv 9.35E-08 Average Burdock Fuson Shale Kh/Kv 4.45 Dewey Fuson Shale Kh 5.62E-08 Dewey Fuson Shale Kv 6.16E-09 Dewey Fuson Shale Kh/Kv 9.13 Average Burdock Morrison Shale Kh 4.37E-07 Average Burdock Morrison Shale Kv 2.12E-08 Average Burdock Morrison Shale Kh/Kv 20.62
Notes: (1) Assumed air temperature= 70°F. (2) Assumed water temperature= 52.8°F, water density= 0.999548 g/cm3
, and water dynamic viscosity= 0.012570 g/cm-s. (3) l<w = ka X (Pw911Jw), and 1.0 mD = 0.987 x 10⁻¹¹ cm2
Constants: At 52.8 °F Water (11.5 °C} Density= 0.999548 g/cm3
Dynamic Viscosity= '0.01257 g/cm-s 1 mD = 9.87E-12 cm2
gravity= 981 cm/s2
DV102.00279.01 3 of3
Table 6_1 Core Perm_Cond ftday.xls
Core Core Kh Kv
(ft/day) (ft/day) 1.19E-03
2.67E-04
1.60E-04 1.76E-05
1.24E-03 6.03E-05
November 2008
July 2012J-65
Appendix J

Knight Piesold GONaULTING
Figures
July 2012 J-66 Appendix J

104'4'0'W 104'2'0'W
TVA 1982 Dewey Pumping Test 43'32'0"N
43'30'0"N
3 6
43'28'0"N 0 0 f! I'll ... ..c 0 z
43'26'0"N
43'24'0"N 34 31
3
6
Legend N
t/11 Proposed Permit Boundary A Sections
--Roads 0 0.4 0.8 1.2 1.6
104'0'0"W 103'58'0"W
/ I
t'"""" · . ..... .. /' ·~
<. \ ..
)
/ •.. /·-···
\ '~
(~ .. ,, _\
103'58'0''W 103'54'0"W
36 31
Custer Co.
Fall River Co. I ,
Powertech 2008 Burdock Pump1ng Test
Figure 1.1
Lakota Formation 3 days, 203 gpm
1979-1982 and 2008 Pumping Test
Locations South Dakota
-+-- Railroad Miles Dewey-Burdock Project Wyoming
""'-- Perennial Streams _ ... ,. ... Ephemeral Streams
e Pumping Test Wells • PowERTEc:k (USAI INc:.
NAD 1983 South Dakota South (ft)
Created By: C. Hocldng, RESPEC Nebraska
Date: 11/11/08
Map File: Figure_1_1.mxd
July 2012 J-67 Appendix J

I
Sym-
PERIOD FORMATION bol COLUMN LITHOLOGIC DESCRIPTION Thickness CORRELATION
Tertl•rv White River Fm. --- Twr 0 0 lil g . . ~~-·-,-----------
Volcan1c Ash 0-500 ft --
c r • t I c • 0 u I
Pierre Fm. Kp
- - --=-- ~ 7 =- :- ~7- ~
- - - - - -- -E c c c c c C ~ Dark Gray Shale weather brown
:. :. :. :. :. :. :. .: fossili ferous -------· - - - ~ - - - ~
===== === 0- 1000 fl
I
I ~--------------~- = = = = = =~- --------------------------------~-1
~~ ~: -l Gray calcareous shale weathers yellow Niobrara Fm. Kn 0-225 tt
- '_:-:r_ -_ r. -~'~--------------------------------;
Carlile Fm. Kcr :;; ;; :; :; :; :; :; i Gray shale w/ th1n ss beds
Greenhorn LS Kg Belle Fourche Fm.
Mowry Shale
Newcastle SS Skull Creek Sh Kgs
Thm bed hard limestone. fosSi liferous
= = = == = = ==
:.... :.. :..... :...._ -_ -:_ :... :.
:_ :_ :_ :_ :_ :_ :_;; Ll gy shale ben loM e wlconcret,ons
_ Th,n brn -yellow ss
~ ~~~~~~~ B lack carbonaceous sh
0-540 It
0 50 tt I
I
0-870 It
~--------------~- -- - - - ~ ~1-nt-er_oo_d--re-d --br_n _m_a-ss-,v-e---ss--a-nd------------------~
Fall River Fm. Kfr Fuson Sh
Minnewasta LS
Lakota Fm. Klk
_ ____.._ carbonaceous shale
: -:--- : -:-- _-___ ,: :- ~ Gy-purple sh. bentonite, concret1ons
Ll gy masSive Is
Coarse mass,ve ss bull -gray coal near
base
30-165 ft
0-160 ft
0-25 It
130-230 ft
Uranium Zone
Uranium Zone
0-125 It ~-----+~--~----------~ -~~-7~- ~~----------------------------------i f.:.M;;.o.::.r:..;i.::.so=n..:.F..:.m::.::.... _ _ _ .::.Jm;.;.;...--=-=-, .=o'-- =- :..:.. :.. ~ Green maroon sh
.lureulc Unkapa Fm Ju fine gr mass,ve ss 0-240 ft
red ss 1nteibeds and red to green
Sundance Fm Jsd manne stl 250-450 ft
Client Pro·ect Title
Knight Piesold
DEWEY-BURDOCK
HYDROGEOLOGIC TESTING REPORT
Site Stratigraphy
GOM.ULTtN• L Date: 11/12/08 Pro·ect No: DV10200279.01
G:\102\00279.01\A\Reports Specs\KP'AII Reports\Work in Progress\Hydrogeolog lc Testing Report\Figures\Figure 2_1 Site Stratig raphy .xls
I
I
I
Fiaure 2.1
11112/2008
I I
I
J July 2012 J-68 Appendix J

Eolian Deposits Qe Gravel Deposits Qt Landslide Deposits Ql Carlile Shale Kc Greenhorn Kg Belle Fourche Shale Kb Mowry and Skull Creek Shale Fall River Kf Lakota Kl
Legend
t:iJ Proposed Permit Boundary
--Roads
-+---+- Railroad
....rv-- Perennial Streams
...... ··-...··-· Ephemeral Streams
Qe
N
A O-·Oii:.4=0:Ji.8 .... 1.2=:::i1.tiles
1:92,597
~ PowERTEclt IUSAl INc.
Figure 2.2
Site Surface Geology South Dakota
Dewey-Burdock Project Wyoming
NAD 1983 South Dakota South (II
Created By: C. Hocking Nebraska Date: 11/11/08
Map File: Figure_2_2.mxd
July 2012 J-69 Appendix J

43.32'0"N
43.30'0"N
43.28'0"N
43.26'0"N
--- -- 3610 ·
104. 4'0'W
-0 0
0 0 c 0 ... Ill
~
- nl -.. ~
' .Q 0 z - - - --
-- ....
....
\
104.2'0'W 104.0'0'W
' 1
\
' ' ' ' ' ' ' ' ' ' ' ' '
'
103.58'0''W
43.24'0"N
' ' ' ' ' ' 31 ' ' , .,6..,0
' ' ' ' ' -~---
- -~- - ' ' ' ~ ·.?~ -----.;;;-- - - - --
' ' ~0~ ' .... 3
Legend
t/1 Proposed Permit Boundary
C3 Fall River Outcrop
..,__ Perennial Streams
...,· .. - .. Ephemeral Streams
6
- 2008 Potentiometric Surface in Feet
e Fall River Water Elevations in Feet
N
A Figure 2.3
Potentiometric Surface Fall River Aquifer
0~-0~.4==0~.8--·12==~1.6 2008 - Miles
1:89,172 Dewey-Burdock Project
Map File: Figure_2_3.mxd
NAD 1983 South Dakota South (ft) • PowERTEclt (USII~ INc.
Creal8d By: C. Hocking, RESPEC
Dote: 11/12/08
103.56'0''W 103'54'0''W
31 G
Custer Co.
Fall River Co.
6
South Dakota
Wyoming
Nebraska
July 2012 J-70 Appendix J

' .... ' --'
- - .....
- - - .....
36'\0 - - '
\ \ ~ o .
0 0 c 0 ... Ill
;!
' .... ' .... .... '
' '
\
\ \
' '
'
\
.... .;>~
' ~0
' ' .1. ~0 ...
' ' 3578. ' ' ' ' ' ' ' \ .16' ~ ' \
~0 ~
' &_,.
' "&
\ ' ~-
\ ' ' ~--' .1. ' ' ~0 ....
' ' ' ' ~------~-----
Legend
• Proposed Permit Boundary
~ Lakota Outcrop
"""-- Perennial Streams
-'-~·· Ephemeral Streams
- 2008 Potentiometric Surface in Feet
e Lakota Water Elevations in Feet
0
' ' N
A 0.4 0.8 1.2 1.6
Miles
1:89,172
~ PowERTEck (USI\) INc.
.... Figure 2.4
Potentiometric Surface Lakota Aquifer
2008 Dewey-Burdock Project
NAD 1983 South Dakota South (ft)
Created By: C. Hocking, RESPEC
Date: 11/12108
Map Ale: Ftgure_2_ 4.mxd
' · ' ' ' '
31
South Dakota
Wyoming
Nebraska
July 2012 J-71 Appendix J

34
3
Legend
3
0 0
~ ~
.Q 0 z
0 0 s::: 0 -Ill ~
• Proposed Permit Boundary
Ill Sundance/Unkpapa Outcrop
""'- Perrenial Streams
--···- ·· Ephemeral Streams
6
31
- 2008 Potentiometric Surface in Feet
e Unkpapa Water Elevations in Feet
•
-------------------------~-
N
A Figure 2.5
Potentiometric Surface Unkpapa Aquifer
o~-o~.4==oi.a ... 1 . 2==~1.6 2008 _ Miles
1:89 ,172 Dewey-Burdock Project
NAD 1983 South Dakota South (ft)
@ PowERTEclt (USAI INc.
Created By: C. Hocking, RESPEC
Date: 11112108
Map File: F~gure_2_5. mxd
31
Custer Co.
Fall River Co.
6
31
South Dakota
Wyoming
Nebraska
July 2012 J-72 Appendix J

Background Water Level and Site Barometer Changes Pump Test Sequence of Events
(April 8 to May 26, 2008) 82.15 00 -,- 00 1045
o 0 I 0 o I ..,.o I ..,.ol ION ooN
' ~ ..-- ro-1-..--.,..: I 1040 >...-- I >-N I
82.05 ro >- I ro >-I
:::!!: ro I :::!!: ro I J W y I I :::!!: ---t- :::!!: +------ + 1035 81.95 I tri. • '11
I I Iii
- 81.85 ~~ 1030 :; tJ> 6 1 I .0
~ d,R I IE. I ~ § ~ 81.75 ~ I t.A I 6 1025 ,S_ -6 t I ~ f 6
I ~ i Ill 1:. 6 I A 1:. I 1:. IU. ~ Iii 81.65 6 6 ~:>. 6 6
_, 1020 E ._ 6 6 6 I v 1:. I 6 0 1- 6 1:. 61:. A 1111:. ._ 'C A I t:. I Hi:. I:. &I ,2! 81.55 6
l:tJ. 66 I ~ 6 1 6 /Z. 1015-
Ill 6 lilY!. t:.t:. I I t:. l t:. c .:=_ 6l:JII:J. Ill I I Lll t:. Eo 'C 6 1:. I I ::... 'ti .11:11tl. <C 81.45 6 6 ~ {!!, a UL:. 1010 &
& Testing ~a ~ I ~ I I I :: i 4.6 ~ ~ a 1 ~:. 1 1 1 .. o E
81 _35 6 I 6 I StepTesting L ~= _l ~j I 1005
& Recovery 1 Cl ..... 1 ::, I!! 1 --1..,1: IIQQ
1 May 9 to May 1 ::.. ~ 1 ---r- 15 2008 I ~ j - 1000 81.25
I ' I ~ 1!! I I Cl
Undisturbed Background Barometric Efficiency Calibration
April 23 to May 8, 2008 Background Monitoring
and Pump Installation/Testing
81.15~~~~~~~~::~~~~~--~,-----~,---~--,-~----,_--i__:~~::~,-----J 4/8/2008 12 4/13/2008 995 4/18/2008
12AM 4/23/2008
12AM 4/28/2008 5/3/2008 12 5/8/2008 12 5/13/2008 5/18/2008
12AM 5/23/2008
12AM AM 12AM 12 AM AM AM 12 AM
Date-Time [ • Dewey 32-4C (Fall River) • Burdock 11-11C (Lakota) 6 Barometer I
Client
Knight Piesold c•llaULT I Ma
Project
DEWEY -BURDOCK HYDROGEOLOGIC TESTING
REPORT Project No: DV10200279.01
Title
Date: 11/12/08
G:\102100279.01\A\Reports Specs\KPIAII Reports\Work in Progress\Hydrogeologic Testing Report\Figures\Figure 3_1 Background Water Levels.xls
Background Monitoring (April 8 to May 26, 2008)
Figure 3.1
11/12/2008
July 2012J-73
Appendix J

Flowmeter Readings Sequence of Events
(May 9 to May 2-4, 2008) 40.U
Burdock 9 Hour SWp-rate Test$
10, 20, 25, 30 gpm 35.0 I 'I I
Dewey7HourStep- ~ I II I rate Tests I II I
10, 20, 25, 30 gpm ~ ... - 1- I 30.0 i
E I
1 25.o Oewey74 Burdock 72 I
~ Hnur Hour : I ! Com>tant (".cm~nt-
I I lillt: Tt:sl rate Te$t I i 20.0 t Aver~~-:l Avt:lilljt: 30.2 I
j I ! • & llllfTl gpm I
>o r -: I ~ 15.0 2i 0 t i i. 10.30111111 2:30PM I % l • May 15 to May 16to I ~ 12:30PM
' I I 2:30PM May I 10.0 !' ~ I May 18, 21. 2000 I
! I 2008 I I I
5.0 I I I I
L. I I I I I
0.0 1 1
5181200812 5/10!2008 12 511212008 12 5/14.12008 12 51161200812 5118/2008 12 512012008 12 5122!2008 12 512412008 12 AM AM AM AM AM AM AM AM AM
Date-Time
I ~Hourly Flow Rate (~pm) I Note: Flowmeter reedings for partial hoo rs are not exact
Client Project Title
DEWEY -BURDOCK Flowmeter Readings HYDROGEOLOGIC TESTING
Knight Piesold REPORT (May 9 to May 24 2008)
C.M.UL'YI •• Project No: DV10200279.01 Date: 11/12/08 I Figure 3.2
G:\102100279.01\A\Reports Specs\KPIAII Reports\Work in Progress\Hydrogeologic Testing Report\Figures\F igure 3_2 Flowmeter. xis 11 /1 2/2008
July 2012J-74
Appendix J

43'29'50"N•
43'29'40"N•
#683 0807-29-07
---------------- -- -- -- -- --
43'29'30"N• • #49
~---------------------~~· 0 Cross-section C-C' (Drawing 4.1) Cross-section D-D' (Drawing 4.2)
Legend
c #689 0807-32-10
#681 I 0807 -32-3C
#687--D·~~~--~~==~~ 0807-32-5 - ~#69~-r~
DB
C'
N Figure 4.1
Dewey May 2008
#685 DB07-32-4C
_,TI A • Fall River Pump Well Pumping Test Well
1 * ,~ • Fall River Monitor Well Locations • 0 100 200 300 400 Fall River Stock Well Fee Dewey-Burdock Project
LJ • Lakota Monitor Well
§ NAD 1983 South Dakota South (ft)
6. Unkpapa Monitor Well Created By: C. Hoc~ng . RESPEC ,... Date: 11 / 11 /08
1 0 ft contour interval PowERTEck (USAI INc. Map File: F~gure 4 1.mxd
July 2012 J-75 Appendix J
Vshea
Sticky Note
Dewey Pumping Test Well Location Map

125.000 15000
120.000
14 500
115.000
1A 000
110 .000-
13 5<X)
105.000
13000 100.000
12 750 130.000
128000 12 700
126000 12 650
69.000
1 650
68.000
11 600 67.000
66.000
11 550 65.000
Client
Dewey 32-3C (r = 0 Ft, Pumping \Nell @ 30.2 gpm) ~~ ~ ~ I ~ ~ [
I I ..... _ ... ,_ .... ~ __ ,,---t .,., ... ·-- I ' ,I
I ·- .+-. -· - - -- · ~ · ·---
I
I
I ~ I
I I l I I
~-- ·--- ----~~~- ~----_j----__ j __
511612008 12:00:00 AM
511612008 12:00:00 AM
5/1612008 12:00:00 AM
5/17/2008 511812008 12:00:00 AM 12:00:00 AM
511912008 12:00:00 AM
512012008 12:00:00 AM
Dewey 32-5 (r = 265 Ft)
511712008 511812008 511912008 5120/2008 12:00:00 AM 12"00:00 AM 12:00:00 AM 12:0000 AM
Dewey 32-4C (r = 467 Ft)
5/17/2008 12:00:00 AM
5/1812006 12:00:00 AM
5/1912008 12:00:00 AM
Title
512012008 12:00:00 AM
5121/2008 12:00:00 AM
512112008 12:00:00 AM
5121/2008 12:00:00 AM
- Pressure ( PSI)
- TerT1)erature ( C)
- Pressure ( PSI)
- Terrperature ( c)
Transducer Response at Dewey Test Pumping WeJI32-3C,
Knight Piesold
DEWEY-BURDOCK HYDROGEOLOGIC TESTING
REPORT Observation Wells 32-5 and 32-4C ·
0 0 M. ULY INa Pro· No: 0¥10200279.01 Date: 11/12108
G:\102\00279.01\A\Reports Specs\KP\AII Reports\Work in Progress\Hydrogeologic Testing Report\Figures\f"igure 4_2 323c_32-5_32-4C.xls 11/1212006
July 2012 J-76 Appendix J

13 800 165.000
164.000
13 750
163.000
13 700
162.000
13 ()50 161.000
2 16.500
15 000
14 980
2 16.000 14 960
14 9 40
14 9 20 . 2 15.500
13 050
133.000
132.000 13 000
131.000
12 950 130.000
129.000
12 l!OO
Client
'5/1612008 12:00:00 AM
'5/1612008 12:00:00 AliA
Dewey 49 (r = 1,433 Ft)
'5/1712008 '5/1812008 12:00:00 AM 12:00:00 AM
'5/1912008 12:00.00 AM
'512012008 12:00:00 AM
Dewey 29-7 (r = 2,400 Ft)
'5/1 712008 '5/1 812008 '5/1912008 12:00:00 AM 12:00:00 AliA 12:00·00 AM
'512012008 12:00:00 AM
Dewey 32-9C (r = 41 Ft, Upper Fall River)
I .. __ ___ L ....
'5121/2008 12:00:00 AM
'5/2112008 12:00:00 AM
5/1612008 '5/17/2008 511812008 5/1912008 '512012008 512112008
12:00:00 AM 12:00:00 AliA 12:00:00 AM 12:00:00 AM 12:00:00 AM 12:00:00 AM
Pro'ect Title
- Pressure ( RSI )
- Terrperature ( c)
- Pressure ( RSI )
- Terrperature ( C)
- Pressure ( RSI )
- Terrpera1ure ( C)
Knight Piesold
DEWEY-BURDOCK HYDROGEOLOGIC TESTING
REPORT
Transducer Response at Dewey Test Observation Wells GW-49, 29 7 and 32-9C
................. Pro· No: DV10200279.01 Date: 11/12108
G:\102\00279.01\A.\Reports Specs\KP\AII Reports\WOrk in Progress\Hydrogeologlc Testing Report\Figures\Figure 4_3 GW49_29-9_32·9C .xls 11/12/2008
. _L __ _
July 2012 J-77 Appendix J

125.000 5000
120.000
14 500
115.000
t a ooo 110.000
13 500
105.000
13 000 100.000
12 150
1 16 .500
12 100 -
1 16 .400
12 050 1 16 .300
187.500
12 950
187.000
12900
186.500
12 850
186.000
Client
Dewey 32-3C (r = 0 Ft, Pumping Well @ 30.2 gpm)
-- - ---T=-~~~.- -~--~c~:.-. : __ ........ J·-·r . ~
/ I
I
511612006 12:00:00 AM
5/1712008 12:00:00 AM
·- - ·-· ----
1 5/1812008 5119/2008
12:00:00 AM 12:0000 AM 512012008
12:00:00 AM
Dewey 32-10 (r = 61 Ft, Lakota)
511612006 5/1712008 12:00:00 AM 12:00:00 AM
511812008 12:0000 AM
5/19/2008 512012008 12:00:00 AM 12:00:00 AM
Dewey 32-11 (r = 50 Ft, Unkpapa)
I
5/16/2008 12:00:00 AM
511712008 12:00:00 AM
511612008 5119/2008 12:00:00 AM 12:00:00 AM
Title
5120i2008 12:00:00 AM
.J 5/2112008
12:00:00 AM
5/21/2006 12:00:00 AM
512112008 12:00:00 AM
- A-essure ( PSI )
- T""""rature ( C)
- Pressure ( PSI)
- Te~rature(C)
- Fl'essure ( PSI)
- T&111)11rature ( C)
Knight Piesold
DEWEY-BURDOCK HYDROGEOLOGIC TESTING
REPORT
Non-responding Dewey Test Observation Wells 32-10 (Lakota) and 32-11 (Unkpapa) compared to Pumping Well
c ............ . Pro· No: DV10200279.01 Date: 11/12/08
G:\102\00279 .01\~~eports Specs\KP\AII Reports\WOrk in Progress\Hydrogeologic Testing Report\Figures\Figure 4_ 4 32·23c_32·10 Non Resp.xls 1111212008
July 2012 J-78 Appendix J

!
:
Dewey 32-5 Theis Drawdown
100
Maximum Drawdown -13ft at 3.08 Days
Aquifer Parameters: - r =265ft ..........
T = 294 ft2/d ~ 10 S-3.34 X 10"5 ---,. J
l/ IJ
1 1 Drawdown shows Barrier
Boundary at -0.7 Days
g c , J: 0 "0 f ~ 1/ c
0.1 Dewey 32-5 DO Drawdown Response •
exceeds Baseline at -1 .6 Minutes at -0.03 t.psi
- Theis
• • •
0.01
II II
• •
0.001 J 0.0001 0.001 0 .01 0.1 1 10
Time (days)
:
Client Project Title
DEWEY-BURDOCK HYDROGEOLOGIC TESTING Drawdown and Analysis at Dewey Test Observation Well 32-5
Knight Piesold REPORT OeN eu LT ....
Project No: DV10200279.01 Date: 11/12108 I Figure 4.5
G:\102\00279.01\A\Reports Specs\KP\AII Reports\Wor1<. in Progress \Hydrogeologic Testing Report\Figures\Figure 4_5 Theis 32-S.xls 1111212008
July 2012 J-79 Appendix J

-~ c::
~ "'C 3: ~ 0 ca ::I
"'C ·c;; Cl,)
0::
Theis Recovery 13 .0-r--------------------------------------------------------~~ .. r,
10.4
I Data with tit'< 15.8 has u' < 0.01 1 7.8
5.2
2.6
[ Latest Time Change in Slope Ignored J
Tr.namlulvlty Storage Coetrlclent Ratio Linear Regr .. ion Slope Linear Regr .. ton Intercept
260.621 sq ftld 0.329018 4.08298 ft 1.97118 ft
X Data Used A Data Ignored
QO .
100
Client
Knight Piesold CONeUL.TINe
101 102 103
Time, t/t'
Project
DEWEY-BURDOCK HYDROGEOLOGIC TESTING
REPORT Project No: DV10200279.01
Title
Theis Recovery Analysis at Dewey Observation Well32-5
Date: 11 /12/08 Fiaure 4-6
G:\102100279.01\A\Reports Specs\KPIAII Reports\ Work in Progress\Hydrogeologic Testing Report\Figures\Figure 4_6 Theis Recovery 32-5.xls 11 /1212008
July 2012J-80
Appendix J

50
45
40
35
30 g c
! 25 "D ~ I!
Q 20
15
10
5
0 0 .00001
45
40
35
30 g c
~ 25 'C
~ Q
j 20 "D ·;; &!
15
10
5
0
Client
Knight Piesold COM.UL T IMO
Dewey Pumping Well 32-3C
Aquifer Parameters -Adj....-
T = 250 ft2/d
1 'lb: / '\.
Well Efficiency: 8/ .r111i
All data has u < 0.01
Indicated data range for t'c > 25R/IT
Ha~ord and Kuniansl<y, USGS Open-file Report 02-197, 2002 Cooper-Jaoob analysis of single-well aquifer test
0.00010 0 .00100
Pumping Well 32-3C
0 .01000 TIME(Days)
Halford and Kuniansky, USGS Open-f1le Report 02-197, 2002 Cooper-Jacob recovery analysis of single-well aquifer test
Aquifer Parameters:
T = 270 112/d
12:39:30 PM May 18, 2008 Shut In Wei 8 5 M1nutes 1nto ReccNery after Artesian Flow
Ra.u~ ~
0 .10000 1.00000
0 0
0 0
0
t5'
All values have u· <0.01
10
Pro·ect
Indicated range haa t' > 25rc 2/T
Late-bme change 1n slope (later lime to left) diwegarded due to barrier bOundary ob&el\led dunng drawdown phase of test
100 (t+~ 10,000 100,000
Title
10.00000
0
1.000.000
DEWEY -BURDOCK HYDROGEOLOGIC TESTING
REPORT
Straight-line Analyses of Drawdown and Recovery at Dewey Pumping Well 32-3C
Pro·ect No: DV1 0200279.01 Date: 11114/08 ure4.7
G:\102\00279 .01\~I.Reports Specs\KP\AII Reports\WOrk in Progress\Hydrogeologic Testing Report\Figures\Figure 4_7 Straight-line Analysis Dewey Pumping Well.xls 11/14/2008
July 2012 J-81 Appendix J

I
Cone of Depression Plot at 3.08 Days
Radial Distance from Pumping Well
0 500 1000 1500 2000 2500 3000 3500 4000
0 • 5 29-7
I
10 ... 32-5 • I
~ I
g 15 GW-49 L !
/ y = -4.2497Ln(x) + 36.753 I
i I
20 I 32-4C I R2 = 0.7798
0
j 25
"' Drawdown at Pumpif!g Well 44.8 ft a5 30
35 I
40 I 45
., I
Distance-Drawdown Plot at 3.08 Days
I r0=5,700 ft I 0 29-71~1 I 5 I
32-4C I ~ 10 1 .. GW-49 I L'.S 9.78 I ..... ~
g 15 tj sat r 0.25 ft 42.6 ft ~-""""'" 32-5
c 20 sat r- 0.33 ft- 40.5 ft , I II ~ .... ~ 25 Aquifer Parameters:
~ I io"""" 30 ~~ T = 218 ft2/d
~
~ 35 -~ S = 4.6 X 10⁻⁵
I ~
40 - I Efficiency - 91- 95 % I ... ~- -~ - I 45 Drawdown at Pum_12ing Well= 44.8 ft
I 50 I IIIII I I I IIIII I I I
0.1 1 10 100 1000 10000
Radial Distance from Pumping Well (ft) I I
Cl~nt Pro"ect Title
DEVVEY -BURDOCK HYDROGEOLOGIC TESTING Distance Drawdown Analysis, Dewey Pumping Test
Knight Piesold REPORT oo••uLT•M• Project No: DV10200279.01 Date: 11/12/08 I Figure 4.8
G:\102\00279.01\A\Reports Specs\KP\AII Reports\Work in Progress\J-iydrogeologic Testing Report\FiguresiFigure 4_6 Distance Orawdown.xls 11/12/2008
July 2012 J-82 Appendix J

103'~'10'W 103'~'0''W
37so .. #682
43'2T30''N- DB07-11-02
~16.()
~ ~
I
~ !:)
'• .,.~:> -~
~::~1::1 ,;;
D' C' I
36'so I '
43'2T20"N-
.?:>oo '• ~ 692 DBO -1 19
' 1
E #688 A ;v-- #690
DB08-11-17 - --GSO.a-1,1-18
l 80 -E'
DB -11-1 c ~ '
...> I 0 I c D
Cross-section C-C' (Drawing 5.1) #686 #684 Cross-section D-D' (Drawing 5.2) DB07-11-15 DB07-11-14C Cross-section E-E' (Drawing 5.3) .,
Legend N Figure 5.1
Jl A Burdock May 2008
A. Lakota Pump Well Pumping Test Well -
~ ~~ .. Lakota Monitor Well Locations
0 50 100 150 200
A Fall River Monitor Well Feet Dewey-Burdock Project
LJ D,. Unkpapa Monitor Well
~ NAD 1983 South Dakota South (ft)
Created By: C. Hocking, RESPEC *,.. 1 0 ft contour interval Date: 11 /11 /08
PowERTEclt (USA, INc. Map File : Ftgure 5 1.mxd
July 2012 J-83 Appendix J
Vshea
Sticky Note
Burdock Pumping Test Well Location Map

120.000
12 GOO
11 0.000
12 :lOO 100 000
90.000
12 200
80.000
162.000 1:> sao
161.000
160.000 12 450
159.000
158.000 1'2 40()
1? 550 156.000
154.000
12 500
152.000
12 450 150.000
Client
Burdock 11-11 C (r = 0 Ft, Pumping VVell @ 30.2 gpm)
I
L_--[-__ -511912008
12:00:00 AM 512012008
12:0000 AM 512112008
12:00:00 AM
... --1
512212008 12:00:00 AM
_ __ __ __ . ] _ A'essure( PSI)
- - l - Ten"f)erature ( C)
512312008 1200:00 AM
512412008 12:00:00 AM
Burdock 11-15 (r = 243 Ft)
1'
511912008 12:00:00 AM
512012008 12:00:00 AM
512112008 12:00:00 AM
512212008 12:00:00 AM
:
·'·h· 1~'?i '"'"'i"l'·" ........ .. < "' ' t"l l ji'"~ -,q ,.,r l·'t l'f'l;
5123/2008 12:00:00 AM
I
512412008 12:00·00 AM
- A'essure ( PSI ) - Ten"f)erature ( C)
Burdock 11 -14C (r = 250 Ft)
511912008 12:00:00 AM
512012008 12:00:00 AM
Pro'ect
512112008 12:00:00 AM
512212008 12:00:00 AM
Title
- A'essure ( PSI) __ J_-------~~~ - Ten"f)eratui (C)
512312008 12:00:00 AM
512412008 12:00:00 AM
Knight Piesold
DEWEY-BURDOCK HYDROGEOLOGIC TESTING
REPORT
Transducer Response at Burdock Test Pumping Well 11-11C, Observation Wells 11-15, and 11-14C
Ce .. eULTIMe Pro·ect No: DV1 0200279.01 Date: 11/12/08
G:\102\00279.01\A\Reports Specs\KP\AII Reports\Work in Progress\Hydrogeologic Testing Report\Figures\f'igure 5_2 11·11c_11·15_11-14C.xls 11/12/2008
July 2012 J-84 Appendix J

12 6 SO
12 600
12 550-
12 500
12 450
1/ 2SO
12 200
12 000
1' 9 50
1 ~ 900
11 850
163.500
163.000
162.500
162.000
120.000
119.500
119.000
118.500
118.000
78.800
78.600
78.400
78.200
511912008 12:00:00 AM
511912008 12:00:00 AM
511Si2008 12:00:00 AM
Burdock 11-2 (r = 1,292 Ft)
512012008 12:00:00 AM
512112008 12:00:00 AM
512212008 12:00:00 AM
512312008 120000 AM
512412008 12:00:00 AM
Burdock 11-19 (r =50Ft, Upper Lakota)
512012008 12:00:00 AM
512112008 12:00:00 AM
i
l/.'lll~ ill , ,. " ''"'ll ·•i., W· 'I.'' ''"'.. I \! ~ t rr'~~ i\tr P.·t. j;jFll!!n q~~~Y .:~"o;:tit;?f~r-'1X~· +;.!t,t ~
' L I ' I - - - - - - - __ _l - - - - - - - - - - - - _ J
5122/2008 12:00:00 AM
512312008 12:00:00 AM
5124/2008 12:0000 AM
Burdock 11-17 (r = 50 Ft, Fall River)
512012008 12:0000 AM
512112008 12:00:00 AM
5J2212008 12:00:00 AM
512312008 12:00:00 AM
5J2412008 12:00:00 AM
- Pressure ( PSI ) - Terrperature ( C)
- Pressure ( PSI )
- Terrperature ( C)
- Pressure ( PSI )
- Terrperature ( C)
Client Pro'ect Title
Knight Piesold COit.ULTIMO
DEWEY-BURDOCK HYDROGEOLOGIC TESTING
REPORT
Pro·ect No: DV10200279.01
Transducer Response at Burdock Test Observation Wells 11-2, 11-19and11-17
Date: 11/12/08 Fi ure 5.3
G:\102\00279.01\A\Reports SpecsiJ<P\AII Reports\WOrk in Progress\Hydrogeologic Testing Report\Figures\Figure 5_3 11-2_11-19_11-17.xls 11/12/2008
July 2012 J-85 Appendix J
Vshea
Sticky Note
Burdock pump test Fall River observation well drawdown curve.

120.000
12 600
110.000
12 400 100.000
9().000
12 200
80.000
12 450 134.800
134.700
12 400 134.600
134.500 12 350
134.400
12 300 134.300
12 000
78.800
1 950
78.600
11 9()0 78.400
78.200 11 850
Client
Burdock 11-11 C (r = 0 Ft, Pumping \Nell @ 30.2 gpm)
,L~ -~ I
\. __ I
l_.J_ ._. ___ --···-··--·----···-··-···-511912008 512012008 512112008 512212008 512312008 512412008
12:00:00 AM 12:00:00 AM 12:00:00 AM 12:00:00 AM 12:00:00 AM 12:00:00 AM
Burdock 11-18 (r = 35 Ft, Unkpapa)
5119/2008 512012008 12:00:00 AM 12:00:00 AM
512112008 12:00:00 AM
512212008 512312008 12:00:00 AM 12:00:00 AM
Burdock 11-17 (r = 50 Ft, Fall River)
511912008 12:00:00 AM
5/2012008 12:00:00 AM
p •ect
512112008 12:00:00 AM
5/2212008 12:00:00 AM
TiUe
512312008 12:00:00 AM
512412008 12:00:00 AM
5/2412008 12:00:00 AM
- A"essure ( PSI)
- Terrperatur ( C)
I 1- A"essure ( PSI )
1 - Tertl)erature ( C) I
Knight Piesold
DEWEY-BURDOCK HYDROGEOLOGIC TESTING
REPORT
Non-responding Burdock Test Observation Well11-18 (Unkpapa) compared to Pumping Well and Observation Well 11-17 Fall River)
GOM.Ut.TIMa Pro· No: DV10200279.01 Date: 11/12/08
G:\102\00279.01\A.\Reports Specs\KP'A.II Reports\Work In Progress\Hydrogeologic Testing Report\Figures\Figure 5_4 11-11c_11-18 Non Resp.xls 11/12/2008
July 2012 J-86 Appendix J

Burdock 11-14C
100 Drawdown shows Recharge
Aquifer Parameters: Boundary at -1.1 Days 1----
1----r=250ft 1\ T = 132 ft 2/d
1---- S=7.0x1o·5 -~
10 ..... .... j.ll~ /
Maximum Drawdown
~,. 17.0ft at 3.0 Days
.. ' 1
v Drawdown Response
g exceeds Baseline
~ at -3.6 Minutes at -0.04 t.psi ~
l \. IJ 0 ' ~ ... ·J . Burdock 11-14C
0.1
I - Theis
• • .. , • I • • • 1 • • • • • 0.01
I• I•
• •
0.001 ~
0 .0001 0.001 0.01 0.1 1 10
Time (days)
Client Project Title
DEWEY -BURDOCK HYDROGEOLOGIC TESTING Drawdown and Analysis at Burdock Test Observation We1111 -14C
Knight Piesold REPORT CIOM a Ut..T t NO
Pro"ed No: DV1 0200279.01 Date: 11/12/08 I Fiaure 5.5
G:\102\00279.01\A\Reports Specs\KP\AII Reports\Work in Progress\Hydrogeologic Testing Report\Figures\Figure 5_5 Theis 11-14C.xls 11/12/2008
1. July 2012 J-87 Appendix J

Hantush and Jacob (1955) 101 11----------------~--------------------------~~-------
10°
- 10-1
~ J
::::s
~ 10-~~ 6 i{// t:;, b. 1\ /\ t'
!::. t::. 1::. b.t::. ~! ' /\ '1 A .l L\. ~
---Y · -· .• -
Tr ... misslvlty Storage Coefficient Rad ... Dlatance
118.888 eqftld 8.844S.OOS 250ft
tl riB 0.11 6 <it o-3 • c.
M
)', Data Ull8<l 1:1. Data ~glared
10-4 ~~~~ !::. 10-1 1o0 101 102
1/u 103 1o4 105
Client Project Title
Knight Piesold
DEWEY -BURDOCK HYDROGEOLOGIC TESTING I Hantush-Jacob Leaky Confined Aquifer Analysis at Burdock Observation Wei
REPORT 11-14C GeMaULTIM. Project No: DV10200279.01 Date: 11/12/08 Figure 5.6
G:\102100279.01\A\Reports Specs\KPIAII Reports\Work in Progress\Hydrogeologic Testing Report\Figures\Figure 5_6 HJ 11-14C.xls 11/12/2008
July 2012J-88
Appendix J

g c
I I! c
Client
100
90
60
70
60
50
40
30
20
10
Burdock Pwnplng Weii11-11C
Indicated range is for values where tc > 25Rc2/T
Aquifer Parameters: T = t50 11 2/d Eftieiency: 65%
All values have u < 0.01
Halford and Kuniansky, UGGS Open-fi le Report 02-1 97, 2002 Cooper-Jacob analysis of single-well
aquifer test
0 L-~--~~~~~~--~~~~--~--~~~--~~~--~~
0.00000 0.00001 0.00010 0. 00100 0.01000 0.10000 1.00000 10.00000
TIME (Days)
100 r---------------------------------------------------------,
80
60
40
20
0
Pumping Weii11-11C
Aquifer Parameters: r = 0 II T = 140 ft 2/d
10 100
00
All Data Has u' <0.01
Indicated valid Range for r > 25r2/T
1 .000 10,000 100,000
Halford and Kunianaky. USGS Open-fole Report 02-197. 2002 Cooper-Jacob recr:NerY analysis~ single-- aquifer lest
1, ,000
-20 L---------------------~~~~----------------------~ (t+At)IAI
Tide
DEWEY-BURDOCK HYDROGEOLOGIC TESTING
REPORT
Straight-line Analyses of Drawdown and Recovery at Burdock PumpingWeii11-11C J
Knight Piesold e•llleULTIIII. Pro· No: DV10200279.01 Date: 11/12108
G:\102\00279.01\A\Reports Specs\KP\AII Reports\Work in Progress\Hydrogeologic Testing Report\Figures\Figure 5_7 Straight line Burdock Pump.xls 11 /12/2008
July 2012 J-89 Appendix J

Knight Piesold CON8ULTING
Drawings
July 2012 J-90 Appendix J

362~
32-10
c Northwest
J(,l ''
DWA 116 DWA 133
SKULL CREEK
FALL RIVER
FUSON
LAKOTA
Pumping Well
3626
32-3c
' ~ I ~J?<.. ~'
:;.;< ;:i( '"0:~
""g::::
Legend
I Screen
Ore
DWA 116 Bore/Well Hole ID
3627
DWA 2
b
iL " > Not to Scale
~7t;~,-:~c::__ '-M·-
CHECK SCALES
lllhlsblrdoMnot ..-..... 11rtc:!11tismap lonot •!h~rtglnolocalo
CONFIDENTIAL NOT for Reproduction or Distribution
SubJect to Revision REVISIONS
# DRAWN CHECKED APPROVED DATE
32-4c
c· ~u
Southeast
~
fj
F. Uchnovsky !cOORDs ____ ___ __ _
1"=60'IFILEtWJE c:\powertech\dewey-burdocks cross--sectioils 11-11-08\dewey pump test c-c' 11-11...08.dwg I 1 01'" 5 July 2012
J-91 Appendix J

West
SKULL CREEK
Top of Fall River
FALL RIVER
FUSON
D 3622
32-5
LAKOTA
MORRISON
3625
DWA 3
Pumping Well 3626
32-3C ?:i
l i i ' ! i ~ I
'z-"- -,u ',, .?££ ~
Sand Stone
Sand Stone
Sand Stone
3628
DWA 31
::::
D'
3627
DWT 81
East
'--- -----320.28' 200.47' 275.90' 39719''-----------
Legend
I Screen
!:;:; 0"
DWAII6 BorcWcllllole lD L Not to Scale CHECK SCALES
lllhlo~rol<leSrl<)! ,._....,1h::hllllo...., lorl<)! at llaotlglnol..,..&
CONFIDENTIAL NOT for Reproduction or Distribution
Subject to Revision REVISIONS
# DRAWN CHECKED APPROVED DATE ~
2 ~ 5 July 2012
J-92 Appendix J

Southwest
SKULL CREEK 1
FALL RIVER
Top of Fuson
FUSON
LAKOTA
c
3691 11-15 3696
FBT 31
;. .,,;":: ~
. ........ -. ; . c.M:w~. "~
3701 Pump Well
11-llC
Shale
Sand Stone
3702
FBS 99 3699
FBS 135
C'
3705
FBS 138
~~.;;:~~
~-:.:: ~
FAH~Y ?n
Nort heast
'----- - 228.21' 258.06' 230.71' 264. 5' 356.57''--- --- - -
legend
I Screen
~ Ore
DWA 11 6 Bore/Well Hole 1D L No1 To Scale
CHECK SCALES
'"""'*-""' _,_ .... ,..., .. ,..,. ..... ~""""
CONFIDENTIAL NOT for Reproduction or Distribution
SubJect to Revision REVISIONS
# DRAWN CHECKED APPROVED DATE
12-NOV·2008 I~TE
~ Pow Eanck CuSAl INc.
DRAWING 5.1 Stratigraphic Cross-Section C-C'
Burdock Pumo Test
~ 5 July 2012
J-93 Appendix J

Southeast
SKULL CREEK
FALL RIVER
Top of Fuson
FUSON
LAKOTA
D
3688
ll-14c :!!·1rjl. r · i r.~--.>i ; ir ·I j )i '!'.1·' : :~;i , ' ., '. · __ · . . • . 1 ~ t , ' q·( ' ' · l ·o ~ ; ' ·~ r-f· i' . ·~ . ! ' ' ' l I . ____ :_j_·!,, _, .,!_l
/1- .,.., • - "{!'
r'N • ..i
3692
FBT 70
3696
FBT 53 Pumping Well
3701
3704
FBS 105
D'
Northwest
3707 3705 FBS 104
1 155.5871' 171.7140' 183.8315' 201.4414' I 214.9643' 223 .2349''----~-'
Legend
I Screen
p ·'7·f Ore
ll-14c Bore/Well Hole ID
1L CHECK SCALES ·----~-~ ..... ....................
CONFIDENTIAL NOT for Reproduction or Distribution
SubJect to Revision REVISIONS
# DRAWN CHECKED APPROVED DATE ~ PowERTEclt (USA) INc.
DRAWING 5.2 Stratigraphic Cross-Section D-D'
Burdock Pumo Test 12-NI)II·2008 )MT£ 12-Novembef-2008(PROJEcr Burdock Pump r.st
F. llchi"'IVsky !COI:JA)S ,~,..50' 1~ c:\powertech\dew"ey-burdocb cross-sections 11-11-08\burdock pump test d-d' 11-12-0S.dwg) 4 OF 5
July 2012
J-94 Appendix J

West
SKULL CREEK.
FALL RIVER
Top of Fuson
FUSON
LAKOTA
E
3695
FBS 121
HH!
3695
FBS 120 ~::::
89.78'--~1
3699
FBS 127 ii.U ==== -:7

Knight Piesold CON8ULTING
Appendix A
Additional Information and Analysis Procedures
Appendix A-1:
Appendix A-2
Background Monitoring and Barometric Efficiency Calculations
Overview of Aquifer Test Analysis Procedures and Tools Used
July 2012 J-96 Appendix J

Knight Piesold CON8ULTING
Appendix A-1
Background Monitoring and Barometric Efficiency Calculations
July 2012 J-97 Appendix J

Knight Piesold CON8ULTINO
Background Monitoring and Barometric Efficiency Calculations
Pressure transducers were installed in both wells at both sites by April 2, 2008 in order to
obtain background ground water level measurements. At tht:~ Burdock test site, a
transducer was installed in the designated pumping well (0807-11-11 C) in the lower
Lakota Formation. At the Dewey test site, a transducer was installed in observation well
(DB07-32-4C), screened in the same zone as the pumping well in the lower Fall River
Formation.
Figure 3.1 in the text illustrates background measurements before the pumping tests and
also the sequence of subsequent test events. The left axis of the figure indicates a narrow
range of 1 psi. The background measurements shown on the figun~ fluctuate over a range
of about 0.4 psi.
Converting Pressure Measurements to Head
Pressure transducer psi coverts directly to head [feet of water overlying the transducer]
according to the relationship:
Head [ft H2o] = P [psi] x 144 in2/if + YH2o [pounds per eubic foot]
= P [Psrl x 144/62.48
= p [PSI] X 2.31
Where y H20 [pounds per cubic foot] is the unit weight of water, ignoring temperature
effects.
Therefore, a change in transducer pressure (~psi) corresponds to a change in water level
of about 2.31 [ft H2o] x ~psi with the same sense of increase or decrease. Total variations
in background changes in groundwater levels over the one month period of record on
Figure 3.1 (in the text) thus correspond to about 0.9 feet of water, which could be
significant, although it will be established that such background variations over the time
of a pump test do not significantly affect interpretations of the tests.
As indicated on Figure 3.1 (in the text), more than one month of background
measurements were obtained from April 8 to May 9, 2008. However, this was also a
period when pump installation and testing produced temporary drawdowns where the psi
readings dropped below the scale of the figure.
DV1 02.00279.01 November 12, 2008
App A_1 Background Monitoring_ Barometric Efficiency.doc
July 2012 J-98 Appendix J

Knight Piesold CON8ULTINO
The right hand axis on Figure 3.1 (in the text) illustrates hourly barometric pressure
measurements in millibars obtained from the meteorological station installed at the site.
The site station is maintained by South Dakota State University (SDS U) at the following
URL: "http://climate.sdstate.edu/awdn/edgemont/archive3.a5f!L. Barometric pressure
reported by SDS U data is available only in the hourly dataset.
Barometric and Other Water Level Corrections
A period of about two weeks (April 23 to May 8, 2008) after pump installation and initial
testing was designated as a period for undisturbed background water level monitoring in
order to obtain data for possible barometric corrections. Inspt~ction of Figure 3.1 (in the
text) finds the expected inverse relationship between site barometer readings and
increases or decreases in ground water levels. There are also smaller order cyclic
sinusoidal variations which occur twice daily attributable to lunar tidal cycles.
Two types of barometric and other water level corrections w1ere employed as described
separately below.
Manual Barometric Efficiency Corrections
The first correction was manually evaluating the data base:d on total head (i.e., the
transducer psi reading) and correcting the values to the barometric pressure (i.e.,
barometer millibars converted to psi) trends throughout the test. Kruseman and de Ridder
(1991) and Gontheir (2007) state that the barometric efficiency (BE) can be defined as
the change in water level in a well versus a change in atmosphe:ric pressure, as follows:
BE= y H20 [pounds per cubic foot] x ~hw + ~Pa
Where ~hw is the change in elevation in the well associated with atmospheric pressure
change (exclusive of other simultaneous effects that may also induce a change) and ~pais
the change in atmospheric pressure at the top of the welll and land surface. By
convention, the BE is dimensionless and ranges from zero to one.
Measurable water level changes in a well may also be due to a number of other factors in
addition to changes induced during a pumping test. These are chiefly long-term seasonal
trends and earth tides (Halford, 2006). Gontheir (2007) descrilbes the historical methods
of determining barometric efficiency. The methods can generally be said to determine an
average response with selective application of corrections depending on the overall
trends. The methods employ best fit lines to graphical displays of data and numerical
DV1 02.00279.01 2 November 12, 2008
App A_1 Background Monitoring_ Barometric Efficiency.doc
July 2012 J-99 Appendix J

Knight Piesold CON8ULTING
analysis of the data sequence with sign tests to determine when a change is significant
and should be applied.
The Site barometer readings were interpolated to the 15 minute background water level
data using a custom FORTRAN computer method described in Section 1.3, below. A
spreadsheet calculation was used to determine BE corrections throughout the background
measurement period from April23 to May 26. The results for the Dewey Site/Fall River
aquifer are shown in Figure A.l-1 and the Burdock Site/Lakota aquifer in Figure A.l-2.
The empirical method also determines a trend of rising water levels throughout the
calibration period. Corrections for earth tides were not employed because these have
demonstrably small amplitudes (i.e., 0.05 psi = 0.1 ft) below the limit of transducer
accuracy. The figures illustrate that, after correction for the seasonal increase in water
levels, BE's of 0.48 and 0.42 are determined for the newey and Burdock sites,
respectively. It is noted that the barometer data on the right hand side of Figures A.1-l
and A.1-2 are scaled in reverse order to invert the data and allow superimposition of air
pressure trends with ground water levels, as presented in Kruseman and de Ridder
(1991 ).
Computer Applications
Two public domain computer applications were used to analyze the barometric and
background water level data collected prior to the pumping tests. However, it was
determined that use of either method for correction of actual test drawdown data could
introduce more error than working with uncorrected data because background water level
variations in the same aquifer at the same time as the test (but at great enough distance to
be unaffected by the tests) were not available to validate the correction methods.
The first is a spreadsheet developed by the U.S. Geological Survey (USGS - Halford,
2006). The USGS spreadsheet empirically factors the overall water level response into
multiple synthetically generated time series with adjustments to both phase and amplitude
of each component (Figure A.1-3). The USGS spreadsheet was used to verify that the
Dewey background water level data from April 23 to May 8, 2008, could be closely
matched as a series of four components: (1) water level inc:rease at a liner rate [i.e.,
slope], (2) variation in air pressure as measured with the site barometer, (3) two earth tide
components (Figure A.l-4).
The second computer method used is BETCO (Sandia Corporation, 2005), which is
publically available at "http://www.sandia.gov/betco/". To correct data, water level, time
DV1 02.00279.01 3 November 12. 2008
App A_1 Background Monitoring_ Barometric Efficiency.doc
July 2012 J-100 Appendix J

Knight Piesold CON8ULTINO
and barometric pressure are input and BETCO calculates corrected water level values.
As described under Section 1.3 "Data Processing" below, the hourly site barometer data
were interpolated to the 15 minute water level measurement frequency. Figure A.1-1
compares the BETCO corrected water levels (as equivalent psi) with the manual BE
calculations, and the two methods yield equivalent results, generally within about ±
0.01 psi, except that BETCO did not fully correct the water level for the peak (actually a
trough with the vertical axis reversed) in barometric pressure at the middle of the
calibration period (i.e., about April 30, 2008, Figure A.1-1 }.
Summary
As shown in Figure A.1-1, the manual BE method was better than the BETCO computer
method for the background calibration period examined. Similar to the USGS method, a
difficulty with applying BETCO corrections to the Dewey or Burdock tests is that
background wells with similar construction to the pumping test wdls are not available to
validate the corrections. This would have required drilling a well at each site specifically
for background measurements. A further difficulty with the available computer methods
is that they do not easily accommodate variable measurement tiimes as input data.
To examine the possible importance of BE corrections, th{: drawdown phase of the
Dewey test (10:30 AM, May 15,2008 through 12:30 PM May 18,2008, see Figure 3.1 in
the text) was selected for manual correction with a BE of 0.48 relative to the Site
barometer over the test period. The corrections were applied aft:er Site barometer data
were interpolated to the logarithmically-space time-drawdown data using a custom
FORTRAN computer program as described in Section 1.3, bellow.. The maximum effect
of the BE correction was to add about 0.2 ft to the water levds at the end of the
drawdown phase due to an overall barometric pressure decline of about 15 millibars (i.e.,
from about 1,030 to 1,015 millibars).
Test interpretations (Theis drawdown, Section 4 in the text) Wl:!re made with and without
the BE corrections for the data at all wells screened in the Falll River aquifer for the
Dewey test, and the corrections were found to have no discernable effect on the visual fits
to type curves. Because the changes in barometric pressure during the three day constant
rate tests at Burdock and Dewey were similar (Figure 3.1 in the te:xt), the above analysis
indicates the magnitude of the BE corrections would be no greater for the Burdock test
compared to the Dewey test. Therefore, corrections to water llevel data were not further
performed and the test interpretations rely on uncorrected time-drawdown data.
DV1 02.00279.01 4 November 12, 2008
App A_1 Background Monitoring_ Barometric Efficiency.doc
July 2012 J-101 Appendix J

Knight Piesold CON8ULTING
Time-drawdown and Barometer Data Processing
The time-drawdown data from the data loggers consisted of two hours of data at one
second intervals followed by 72 or 74 hours of data collected at 1 0-second intervals, with
the sequence repeated for the recovery phase. The WinSituTM software exported
transducer data logger records to ".csv" files with approximately 60,000 to 70,000
records for each well. The time-drawdown data were processed using a custom
FORTRAN program employing a template file specifYing which date-time records would
be written to an output file. The program cycled through the raw data input file and
wrote data records to the output file. The template tile was prepared to produce
logarithmically spaced data with about 30 records per log cycle: (in seconds). Due to
slight variations in transducer output and the precision of the Mi1::rosoft Excel date-time
format, there are some ± 1 second variations in the sequenc1es of records from well to
well.
The FORTRAN program for drawdown data also converted transducer psi to drawdown
in feet using formulas presented in Section 1.1. The referenc1e value for zero drawdown
was set to be the average of all psi readings from the start of the data log to the time just
prior to test startup.
Two custom FORTRAN programs were also used to interpolate: hourly site barometer
readings to ( 1) the evenly spaced background transducer measurements described in
Section 1.2.2 and (2) the logarithmically spaced drawdown data described in Section
1.2.3.
DV102.00279.01 5 November 12, 2008
App A_1 Background Monitoring_ Barometric Efficiency.doc
July 2012 J-102 Appendix J

10.15
10.1
Dewey - Fall River Ore Zone Barometric Efficiency Calibration (April 23 to May 8, 2008)
~--------------------------------------------------------------------------~ 6.95
Barometric Efficiency of 0.48 with 0.135 psi increase
in Water Level over 2 Week Period
• 7
CD' iii u
rJ) G)
u; 10.05 I!! ~
7.05 i ll. 'i:' G) u :::s 'tl Ill c I! !::.. 'CD > G) ...J ... s ~
10
9.95
9.9
9.85
7.1
! e :::s Ill Ill e ll. u ·;:: Gi E 7.15 ~ ., r:c 'tl
* :::s 7.2 '6'
<(
9.8 7.25 4/22/2008 12 4/24/2008 12 4/26/2008 12 4/28/2008 12 4/30/2008 12 5/2/2008 12 5/4/2008 12 5/6/2008 12 5/8/2008 12 5/1 0/2008 12 ~ ~ ~ ~ ~ ~ ~ ~ ~ ~
Date Time o 32-4C Uncorrected Transducer PSI
- 32-4C Corrected with BETCO Software
-32-4C Corrected to BE= 0.48 and Slope= 0.135 psi
--Site Barometric Pressure x BE = 0.48
Client
Knight Piesold ceMaUL"'' •••
Project
DEWEY -BURDOCK HYDROGEOLOGIC TESTING
REPORT Project No: DV1 0200279.01
Title
Background Water Level and Site Barometer Readings Dewey/Fall River Barometric Efficiency Calculations
(April 23 to May 8 2008) Date: 10/14/08 Appendix A, Fiaure A.1-1
G:\102100279.01\A\Reports SpecsiKPIAII Reports\Worl< in Progress\Hydrogeologic Testing Report\Appendices\Appendix A\Figure App A_1-1 Dewey BE.xls 10/14/2008
July 2012J-103
Appendix J

82.1
82.08
82.06
82.04 u; D. "C' 82.02 Gl ... :::1
"C 82 Ill c
f! 1-
~ 81 .98 > Gl ...I
~ 81 .96 ~
81.94
81.92
81.9
Burdock - Lakota [Chilson] Barometric Efficiency Calibration (April 23 to May 8, 2008)
.---------------------------------------------------------------------------------------~6.1
Barometric Efficiency of 0.42 with 0.085 psi increase
in Water Level over 2 Week Period
•
Gl
6.15 "B rn
~ ~ ~ ·;;;
6.2 S: e :::1 Ill Ill e D. ...
6.25 ~ E !:! I'G al "C
~ :::1
6.3 ~
81 .88 6.35 39560 39562 39564 39566 39568 39570 39572 3957 4 39576 39578
Date Time
Client
<> 11-11C Uncorrected Transducer PSI
--Site Barometric Pressure x BE = 0.42
Project
Knight Piesold
DEWEY -BURDOCK HYDROGEOLOGIC TESTING
REPORT C:ONaULTINO Project No: DV10200279 01
--11-11 C Corrected to BE= 0.42 and Slope= 0.085 psi
Title
Background Water Level and Site Barometer Readings Burdock/Lakota Barometric Efficiency Calculations
(April 23 to May 8 2008) Date: 10/14/08
G:\102100279.01\A\Reports Specs\KP\AII Reports\Work in Progress\Hydrogeologic Testing Report\Appendices\Appendix A\Figure App A_1-2 Burdock BE.xls 10/14/2008
July 2012J-104
Appendix J

o .•r-------------------------------------------------------------------------------------------~
0.4
0.3
0.2
0. 1
0 Me.s.ured 4C R --· • ti:.nce.
.ilt.~.,......... ......... ~_.,.. -·
-0.1
-0.2~~-----------:;;;-----------~;.;,~------------:;~------------~~------------~::;-------------:::---------------------~~:!~~J """""' ""-"'- ·~- ·-- • .. ·- · RillS • 0.0210 ""'- 4127100 4121100 511108 513100 ...... 517/00 510100
Client Project Title
Knight Piesold
DEWEY -BURDOCK HYDROGEOLOGIC TESTING
REPORT
Time-series from USGS Spreadsheet Method (Halford, 2006) for Dewey Observation Well 32-4C Background Measurements and Site Barometer
Readings (April 23 to May 8 2008) ..... u ........ Project No: DV1 0200279.01 Date: 10/14/08 Appendix A. Fioure A.1-3
G:\102100279.01\A\Reports Specs\KPIAII Reports\Work in Progress\Hydrogeologic Testing Report\Appendices\Appendix A\Figure App A_1 -3 Dewey USGS Time Series.xls 1011412008
July 2012J-105
Appendix J

Time Series Deconvolution of 32-4C (April 23 to May 8, 2008)
0.4 I I
-Site Barometer
0.3 - Earth Tide (USGS)
~ ~ - Gravity Tide (USGS)
l ~ 0.2 ' 1:: n " ,. \~ I
" c \ ,. lrV f 0 .1
' ~ ~ ~ :g
~ ~ ~ I ~ .a
I ( " ~ v ~ 'i ~ ~ :s ~ ~ " " N 1\ n.. 11\.. \.J lit. J ~ 1:: l 'U ~ 0 0 u " '\. ~ ~ ~ A " .ll u ~ ~ I' ~ ~ \ ~ ~ ~ r ' ~ m W\ *' ~ \j v • " ~ ~ \ \ >
~ \ i " j .,
J a:: -0.1 ,, ~ J
I I -0.2
I
I~
I -0.3
4122/2008 4124/2008 4/26/2008 412812008 4130/2008 5/212008 5/412008 5/612008 518/2008 5/10/2008 12:00:00 AM 1200:00 AM 12:00 00 AM 12:00 :00 AM 12:00:00 AM 12:00:00 AM 12:00 00 AM 1200:00 AM 12:00:00 AM 12:00:00 AM
Date-Time
Client Project Title DEWEY -BURDOCK
Plotted Time-series Output for Dewey Observation Well 32-4C Background HYDROGEOLOGIC TESTING
Knight Piesold REPORT Measurements and Site Barometer Readings (April 23 to May 8 2008)
CellaULTIN. Project No: DV10200279.01 Date: 11/12/08 Appendix A, Figure A.1-4
G:\102\00279.01\A\Reports Specs\KPIAII Reports\Work in Progress\Hydrogeologic Testing Report\RevB\Appendix A\F igure App A_ 1-4 Dewey USGS Time Series. xis 11/12/2008
July 2012J-106
Appendix J

Knight Piesold CONaULTING
Appendix A-2
Overview of Aquifer Test Analysis Procedures and Tools Used
July 2012 J-107 Appendix J

Knight Piesold CONaULTINO
Overview of Aquifer Test Analysis Procedures and Tc»ols Used ----------------
This section describes the methods used to analyze the pump test data from both the
Dewey and Burdock tests.
Determining Response
Water levels in each well were measured and recorded wi1th vented In-Situ ™ Level
TROLL ™ pressure transducers with built in data loggers. The pressure ratings for the
transducers range from 100 to 300 pounds per square inch (psi). Transducer accuracy (in
comparison to known pressure or other pressure reading devices) is stated by the
manufacturer to be ±0.1 percent of full-scale reading (i.e., 100 to 300 psi), so the limit of
accuracy varies from 0.1 to 0.3 psi, or about 0.2 to 0. 7 ft. Transducer sensitivity is stated
to be ±0.01 percent of full-scale, resulting in sensitivity limits of about 0.01 to 0.03 psi,
or 0.02 to 0.07 ft.
Transducer response figures in the text (Figures 4.2 through 4.4 at Dewey and Figures 5.2
through 5.4 at Burdock) were made from graphs displaying raw transducer data produced
directly from Win-Situ™ software provided by In-Situ with the rental transducers. The
software should be publically available and can be used to read the binary data files that
are provided on CD-ROM in Appendix E. The Win Situ TM software exported transducer
data logger records to ".csv" text files with approximately 60,000 to 70,000 records for
each well.
The Win-Situ graphs display complete drawdown and recovery data tiles that exceed the
capacity of individual spreadsheets for display and storage. The pumping well data are
repeated on some figures for reference as timing marks for the phases of the tests. The
data at observation wells also exhibit spikes in the transducer temperature measurements
when the data logging shifted from 10 second to 1 second int1~rvals; these can be used to
judge within ± 2 hours when the pump was shut off and recovery began at the pumping
well.
Precise timing of responses is more clearly analyzed on spn!adsheet log-log plots after
the data are reduced to 30 points per log cycle (in seconds). The computer method to
reduce the large text file to manageable time-drawdown data files is described in Section
A.l-3 (above).
DV1 02.00279.01 November 12, 2008
App A_2 Test Interpretation Methods
July 2012 J-108 Appendix J

Knight Piesold CON.ULTING
Theis Drawdown and Recovery Analysis
Drawdown data collected from all wells were graphically analyzed to determined aquifer
properties of transmissivity and storativity using the Theis method (Driscoll, 1986, and
numerous other references).
Assumptions for the Theis Method
At observation wells, the Theis method is mathematically valid for all distances and times
during the drawdown phase of a test, and there is general agn::ement about interpretation
of deviations of drawdown data from Theis type curves in terms of features such as
barrier boundaries and leakage from an overlying leaky aquiter (Kruseman and de
Ridder, 1991).
The following simplif:Ying assumptions underlie the Theis analysis (Driscoll, 1986):
• The water-bearing materials have uniform hydraulic conductivity (i.e., are
isotropic) within the radius of influence of the well (i.e., the aquifer has infinite
extent for the analysis).
• The aquifer is confined and not stratified.
• The aquifer thickness is constant.
• The pumping well is 100 percent efficient.
• The intake portion of the well penetrates the entire aquifer; well diameter is small
so well bore storage is negligible.
• The potentiometric surface has no slope (perfectly horizontal).
• Laminar flow exists throughout the radius of influence of the well.
These assumptions are rarely completely satisfied in any pumping test. A first-order
violation of the ideal test assumptions for the Powertech pumping test is partial
penetration: at Dewey, the lower Fall River pumping and obs1;:rvation wells have 15-foot
well screens within an approximate 85-foot sandstone zone~ within an approximately
160-foot thick sandstone-shale formation; at Burdock the lower Lakota pumping and
observation wells have 10-foot well screens within an approximate 35-foot sandstone
zone within an approximately 170-foot thick sandstone-shale formation
Secondly, the variegated sandstone-shale lithology clearly re:sponds hydraulically in an
anisotropic manner both laterally and vertically. It was determined with Powertech during
the test design that an investigation of lateral aquifer anisotropy using four-well
DV1 02.00279.01 2 November 12, 2008
App A_2 Test Interpretation Methods
July 2012 J-109 Appendix J

Knight Piesold CON8ULTINO
triangulation was not warranted. The test design did investigate vertical anisotropy
within each aquifer.
Pumping Test Design and Objectives
As noted in the pumping test work plan, (Knight Piesold, 2008), interpretation of test
results with the above non-ideal conditions may result in uncertainties in the estimated
transmissivity and storativity values. Reasons for conducting the 2008 tests with
conditions contrary to the Theis assumptions were as follows:
• Powertech expects that the operational well field screens will be completed in ore,
and the thickness of the ore determines the screen interval.
• The pump test was designed to see what flow could be I!Xpl:cted in the wellfield.
• There are multiple ore zones (e.g., three ore zones in the Fall River at Dewey) and
each one will have its own well screens, so one ore zone was picked to test.
• At new mines there are usually two pump tests, one to get regional aquifer
characteristics and a second one to test the ore zone characteristics.
• The previous TV A tests constitute regional tests and had already been
successfully conducted using pumping and observation wells more closely fully
penetrating the entire aquifer.
• In comparison with the TV A tests, these newer t1:sts would offer valuable
differential diagnostic information.
Theis Analysis Methods
Theis analysis was initially performed in spreadsheets developed by Knight Piesold that
allow interactive entry of transmissivity and storativity to caleulate the dimensional
version of the type curve that matches time-drawdown data (t!.g., Figures 4.5 and 5.5 in
the text). Theis analysis was expanded to use using automated curve matching in
commercial AquiferWin32™ software (ESI, 2003). The software also performed
Hantush-Jacob drawdown analysis as described in the text. In automated drawdown
analysis samples are weighted as follows: samples before the first response are ignored,
and samples after the first occurrence of the barrier or leakage boundary are ignored.
The AquiferWin32 TM software was also used to analyze recovery data with the straight
line Theis recovery procedures, with theoretical considerations described in greater detail
below. Samples are weighted according to (1) the theoretical criterion that u' be < 0.01,
which restricts the data to later-time (to the left on the t/t' axis); and (2) the portion of the
recovery before the change in slope due to a barrier or recharge boundary is used. Data
DV1 02.00279.01 3 November 12, 2008
App A_2 Test Interpretation Methods
July 2012 J-110 Appendix J

Knight Piesold CONSULTING
not satisfYing u' < 0.01 or obtained after a boundary was encountered were weighted to
be ignored.
The analysis of data from the pumping wells is complicated by well losses due to well
inefficiency, partial penetration effects, and drawdown modified by borehole storage.
This is accounted for in Theis drawdown analyses by fitting just the later time data (at
pumping wells) to the type curve. This is done with the Aquift:rWin32™ software by
assigning sample weights to data after the time at which borehole storage becomes
negligible.
Driscoll (1986) provides an empirical formula for determining the time at which borehole
storage effect become negligible, as follows:
tc = 0.6 (dc2- dp2
) divided by Q/s
Where tc is time in minutes, de is the inside diameter of the well casing in inches, dp is
the outside diameter of the pump column pipe in inches, and Q/s is the specific capacity
of the well in gpm per foot of drawdown at time tc. Calculated times were 21 minutes for
the pumping well at Dewey and 50 minutes at Burdock.
Theis-Cooper-Jacob Straight-line Analysis
Spreadsheets are published by the U.S. Geological Survey (USGS) with sophisticated
programming for the analysis of aquifer test data (Halford and Kuniansky, 2002). These
were used for most straight-line analyses of the tests.
Straight-line Drawdown Analysis
A USGS spreadsheet for drawdown analysis with the Cooper-Jacob straight-line
approximation was used for the drawdown phase at the pumping wells. Another USGS
spreadsheet programmed for Theis Recovery analysis with the straight-line
approximation was used to analyze the recovery data at all wells.
The Theis method is linearized with the Cooper-Jacob straight-line approximation
(Halford and Kuniansky, 2002). The approximation is only valid at later times as
determined by u or u', the relationship of aquifer paramete:rs with distance from the
pumping well (r) and elapsed timet or t' (where t and u refer to the time from the start of
pumping and t' and u' to the time from the cessation of pumping), as follows:
u or u' = (r2 x S) + [4 x T x (tort' )] and uoru'<O.OL
DV1 02.00279.01 4 November 12, 2008
App A_2 Test Interpretation Methods
July 2012 J-111 Appendix J

Knight Piesold CONaULTING
For a pumping well the distance becomes the radius of the casing (rc) which is small, and
to obtain a time criterion (tc or tc' where the straight-line approximation is theoretically
valid), the above relationship is inverted by setting u or u' <= 0.01 and S = 1 x 10⁻⁴,
yielding (Halford and Kuniansky, 2002):
4 x (tort') x 0.01 >= r/ x 10-4 -o- T
tc or tc' >= 100 x r/ -o- (4 x T)
tc or tc' >= 25 x r / -o- T
The calculation of tc or tc' gives a criterion for theoretically valid data at the pumping
well in terms of time, and similarly for u or u' for observation wdls. In this report only
transmissivity is determined by the straight-line methods. The drawdown phase and
Theis or Hantush-Jacob type-curve analysis are used to det•ermine storativity. To
calculate u or u' at observation wells, the storativity result from the drawdown phase is
used. At the pumping wells, a storativity of 1 x 1 o-4 is assumed.
The USGS spreadsheet allows interactive determination of transmissivity by moving the
yellow endpoints ofthe red line to match the desired slope (se:e re:d lines between yellow
endpoints on Figures 4.7 and 5.7 in the text). The USGS spre:adsheet has been modified
to also calculate the value of u or u' and tc or tc', and the length of the straight line has
been manually set on the figures to approximately correspond to data ranges where the
critical values are met. The figures thus indicate the data where the straight-line solutions
are theoretically valid, which aids in visually determining which portions of the plots to
use for analysis.
The analysis of data from the pumping well is complicated by well losses due to well
inefficiency, partial penetration effects, and drawdown modified by borehole storage. The
straight-line approximation with the tc criterion described above~ is used in the USGS
spreadsheet to select the late-time data during the drawdown phase at pumping wells.
This is because at later times borehole storage and partial penetration effects are
eliminated and change in drawdown and the straight-line slope are due to aquifer
transmissivity rather than the fixed offset due to well losses (Halford and Kuniansky,
2002). The USGS spreadsheet determines transmissivity and well efficiency, with the
efficiency based on the theoretical drawdown with the assumed storativity of 1.0 x 10⁻⁴.
DV102.00279.01 5 November 12, 2008
App A_2 Test Interpretation Methods
July 2012 J-112 Appendix J

Knight Piesold CON8ULTING
Straight-line Recovery Analysis
The analysis of recovery data involves the measurement of the nse in water levels
referred to as residual drawdown. The method determines the ~s', the change in residual
draw down over one log cycle of tit', where t is the time from the start of pumping and t'
is the time from the cessation of pumping. Figures 4.7 and 5.7 in the text illustrate the
Theis recovery analysis at the pumping wells. On each recovery analysis figure the data
range where the tc' or u' criteria is satisfied (see red lines betwetm yellow endpoints on
Figures 4.7 and 5.7 in the text) are indicated together with the transmissivity reported by
the USGS spreadsheet.
Distance Drawdown Analysis
Distance-drawdown analysis (Driscoll, 1986) was performed to determine average
aquifer parameters using all appropriate observation wells simultaneously and also to
determine a pumping well efficiency. The distance draw down analysis relies on the same
Cooper-Jacob straight-line approximation as described above, although according to
Driscoll (1986) the value ofu can be as great as 0.05. The value ofu is calculated using
the storativity of the observation wells determined in the Theis draw down analysis. The
aquifer parameters are determined by calculating ~s, the change in drawdown along the
straight line over one log cycle, and r0 which is the intercept at zero drawdown.
On a linear graph (see top portions of Figures 4.8 and 5.8 in the text), plotting the
maximum drawdown in observation wells at the same time should map a profile of the
cone of depression surrounding the pumped well. On a semi-log graph (bottom portions
of Figures 4.8 and 5.8 in the text) there should theoretically bt: a straight line through the
data points, except at the greatest distance from the pumping well where u is likely to be
> 0.05 (Driscoll, 1986).
DV1 02.00279.01 6 November 12, 2008
App A_2 Test Interpretation Methods
July 2012 J-113 Appendix J

Knight Piesold CONSULTING
Appendix 8 Dewey Test Supplemental Information
Appendix 8-1:
Appendix 8-2:
Appendix 8-3:
Appendix 8-4:
Well Completion Diagrams
Time and Water Level Data Values Used in Pumping Test Analysis: Dewey Test, Drawdown Data
Time and Water Level Data Values Used in Pumping Test Analysis: Dewey Test, Recover Data
Additional Aquifer Parameter Determinations
July 2012 J-114 Appendix J

Knight Piesold CON8ULTING
Appendix B-1 Well Completion Diagran1s
July 2012 J-115 Appendix J

POWERTECH WELL AND PUMP DATA
Location of Well Drilling Contractor Driller Well Name DB07-32-3C Dewey, SD Davis Drilling Tony
County Type of Rig Drilling Fluid Well Depth 600' Custer mud
LAT 4815593N LONG 578732E Elevation 3635" Datum point from which all measurements are taken
Screened Monitoring Well Completion Detail Method of Drilling Date: 11127/07
0 CabelTool 0 Hollow Rod
.---® Screened Well No . ~ Direct Rotary 0 Air Rotary
A. Stick-up Length 2.0' D Bucket Auger 0 Reverse Rotary
© B. Key No. NA 0 ~light Auger 0 Jetted
"" C. Protective Casing
0 Dug 0 Driven
/ 0 Other mud rl1till:Y_ Ground Diameter NA
Surface Material NA Use -
Length NA 0 Domestic 0 Public Supply ~ Depth to Bottom NA 0 Industrial D Irrigation
@Y'/ -p- D. Surface Completion 0 Municipal D Commercial
r.--- Diameter NA 0 Test Well 0 Heating or Cooling
v / Depth NA 181 Monitoring
v / :Material NA 0 Other
v / E. Well Casing Data One wel1 volume (V) = gallons
®- / / Diameter 6" ID Initial Development Water
v / Material PVC Water Level (TIC) __
Length 587' Well Depth __ v / Weight SCH 40 Color --v v Depth to Bottom 585' Odor
v v F. Grout cement Date 11/29/07 Clarity __
v v Depth to Top 0' Developed By __
587' Date v v Depth to Bottom ---
Material sulfatf rf)§:i§. ~fmfnt Well Development Date __
/ v Density 15.1lbtgal Descriptwn of Development Technique
/ v Volume 21.5 bbls
® / / %Excess 70 Pnmp
Method of Installation di§Qlacemfnt / v Depth to Cement in Casing 505'
Date Inst.!lled --- Type __
/ / Manufacturer Model No. Return Constant DYes 181 No --- --
/ / H.P. --- Volts --Volume of Grout Return 0 Capacity ___
/ / G. Borehole Diameter Depth of Pump Intake Setting __
i L Drilling Dates 8. 75" 11/28/07 No. of Stages __
H. Pack Type/SizeNA Date NA OOil D Water Lubrication
® Depth to Top NA Power Source --Depth to Bottom Material of drop pipe __
- Material Bowls --
Method of Installation Shafting ___ lmpellors __
Gradation Bowl Diameter ---
r·: I. Screen Date Jl2.1IQ8 Column Pipe Diameter __ Length __
Modification Depth to Top 585-600" --
r---- Depth to Bottom .. r---- Manufacturer Geophysical Logs Run Gamma Resistivity SP ran 11/27/Q7
Material PVC
, I. Slot .01" r----
J. Bottom Cap
Material PVC
Length !"
Driller TQmmy
Boring Depth 630"
®-. -: ..
Additional Information
******Mechanical Integrity Test******
PSI Increments Calibration Date of Gage PSI Full Scale Test Run By Stan Davis, Len Eakin Date Test Run 1/25/08 Water Quality
Time Beginning of Test 800 Time End of Test 1000 Sample taken? []Yes 0No Initial Pressure 35.0 PSIG Initial Fluid Level 4.0 inches Where analyzed?
Final Pressure 35.0 PSIG Final Fluid Level 4.0inches Date well comph::ted 1127/08
July 2012 J-116 Appendix J

WELL DEVELOPMENT RECORD- PARAMETER MEASUREMENTS
Total Volume
Well Withdrawal Conductivity Temp Turbidity
No. Time pH (ms/cm) (oC) (NTU)
Comments
Gallons Borehole Volume
32-3C 1400 appears cl. 1/27/08 well developed
1425 water cleared up within 5 minutes
approx 50 gpm while pumping
July 2012 J-117 Appendix J

POWERTECH WELL AND PUMP DATA
Location of Well Drilling Contractor Driller Well Name DB07-32-5
Dewey, SD Davis Drilling Tony
County Type of Rig Drilling Fluid Well Depith 608'
Custer mud
LAT 4815588N LONG 578650E Elevation 3628' Datum point from which all measurements are taken
Screened Monitoring Well Completion Detail Method of Drilling Date: 11117/07
D Cabel Tool 0 Hollow Rod
,---@ Screened Well No. 181 Direct Rotary 0 Air Rotary
A Stick-up Length 2.0' 0 Bucket Auger D Reverse Rotary
© B. Key No. NA 0 Flight Auger D Jetted
/ ""' C. Protective Casing
0 Dug D Driven
0 Other mud~~ Ground Diameter NA
Surface Material NA Use 1-
Length NA D DomeBtic 0 Public Supply
~~v Depth to Bottom NA 0 Industrial D Irrigation
® D. Surface Completion 0 Municipal D Commercial
p.-r- Diameter NA OTestWell D Heating or Cooling
v v Depth NA 181 Monitoring
v v Material NA 0 Other
v v E. Well Casing Data One well volume (V) = gallons
v Diameter 4" ID Initial Development Water
v v Material PVQ Water Level (TIC) __
Length 59(i' Well Depth __
/ v Weight ~QH40 Color --
/ v Depth to Bottom 593' Odor
/ / F. Grout cement Date 11/17/07 Clarity ___
/ / Depth to Top 0' Developed By __
/ / Depth to Bottom 5l)3' Da1e --Material sulfat~ r~~:~i~:~. cement Well Development Date __
/ / Density 15.2b/g~l Description of Development Technique
/ / Volume 13.4 bbls
@ / / %Excess 6Q_ Pump
/ / Method of Installation displacement
Depth to Cement in Casing 52Q' Date Installed --- Type __
/ / Return Constant DYes 181 No Manufacturer -- Model No. --
v v Volume of Grout Return H.P. --- Volts --
0 Capacity·--v v G. Borehole Diameter Depth of Pump Tntake Setting __
~ ~ Drilling Dates 6.25" 11/17/07 No. of Stages ___
H. Pack Type/SizeNA Date NA OOil D Water Lubrication
Depth to Top NA Power Source --Depth to Bottom Material of drop pipe ___ . Material Bowls ---
Method of Installation Shafting ___ lmpellors __
i'· Gradation Bowl Dmmeter ----...
I. Screen Date 2/6/08 Column Pipe Diameter __ Length __
Modification Depth to Top 5~3-6Q8'
---
- ·, Depth to Bottom
Manufacturer Geophysical Logs Run Gamma Resistivity SP ran 11117/07
Material PVQ 1---,- . Slot .01" 1--- J. Bottom Cap -
Material PVC
Length 1"
Driller TQmmy
Boring Depth 634' . .. Additional Information
******Mechanical Integrity Test******
PSI Increments Calibration Date of Gage PSI Full Scale Test Run By Stan Davis, Len Eakin Date Test Run 2/5/08 Water Quality
Time Beginning of Test 0900 Time End of Test 1100 Sample taken? DYes 0No Initial Pressure 35.0 PSIG Initial Fluid Level 5.0 inches Where analyzed?
Final Pressure 35.0 PSIG Final Fluid Level 5.0inches Date well compl-eted 216L08
July 2012 J-118 Appendix J

WELL DEVELOPMENT RECORD- PARAMETER MEASUREMENTS
Total Volume
Well Withdrawal Conductivity Temp Turbidity
No. Time pH
(ms/cm) ("C) (NTU) Comments
Gallons Borehole Volume
32-5 1500 appears cl. 2/6/08 well developed
1535 water cleared up within 5 minutes
app.rox 20 gpm while pumping
220psi kickoff, 130psi sustained
July 2012 J-119 Appendix J

POWERTECH WELL AND PUMP DATA
Location of Well Drilling Contractor Driller Well Name DB07-32-4C Dewey, SD Davis Drilling Tony
County Type of Rig Drilling Fluid Well Depth 595'
Custer mud
LAT 4815507N LONG 578846E Elevation 3640' Datum point from which all measurements are taken
Screened Monitoring Well Completion Detail Method of Drilling Date: 12/4/07
D Cabel Tool 0 Hollow Rod
.---® Screened Well No . 181 Direct Rotary 0 Air Rotary
A Stick-up Length 2.0' D Bucket Aug•er D Reverse Rotary
© B. Key No. NA D Flight Auger D Jetted
/ ~ C. Protective Casing
0Dug 0 Driven
0 Other mud rnto rv Ground Diameter NA 1---· Surface Material NA Use
1-Length NA D Domestic 0 Public Supply
@Y/~[/ Depth to Bottom NA D Industrial 0 Irrigation
~~ D. Surface Completion DMunidpal 0 Commercial
IT.-- Diameter NA OTestWell D Heating or Cooling
1/ I/ Depth NA 1:81 Monitoring
1/ v Material NA D Other
f-.=---
I/ / E. Well Casing Data One well volume (V) = gallons
®- / Diameter 4" ID Imtial Development Water
IV / Material PVC Water Level (TIC)~-
Length !i82' Well Depth~-
1/ v Weight SQH 40 Color --1/ v Depth to Bottom 580' Odor
1/ v F Grout cement Date ll&!Q1 ClaritY~--
1/ v Depth to Top 0' DevelopE'd By ___
1/ v Depth to Bottom 582' Date --Material ::l:Ulfate re§i§:. !;;~ment Well Development Date __
1/ v Density l(i.1l!l/gal DescriptLon of Development Techmque
1/ v Volume 17.4 billa
1/ v %Excess 70 i-=='
® Pump
v 1/ Method of Installation displacement
Depth to Cement in Casing 480' Date Installed -- Type __
I/ v Return Constant 0 Yes 181 No Manufacturer --- Model No --
I/ I/ Volume of Grout Return 0 H.P. -- Volts --Capacity --·
1/ v G. Borehole Diameter Depth of Pump Intake Setting __
~ ~ Drilling Dates 6.25" 12/4/07 No. of Stages ___
H. Pack Type/SizeNA Date NA OOil 0 Water Lubrication
® Depth to Top NA Power Source ---Depth to Bottom Material of drop pipe ___
Material Bowls ---
Method of Installation Shafting __ Impellers -~
Gradation Bowl Diameter --1--· ,-: I. Screen Date 2/4/08
Column Pipe Diameter __ Length __
Modification 1----- Depth to Top !i80-595'
--
1----- ·, Depth to Bottom 1---· --:;-1----- Manufacturer Geophysical Logs Run Gamma, Resistivity SP ran 12/4/07
Material PV<O ,· I. Slot .01"
J. Bottom Cap
Material PVQ
Length 1" ----Driller Tgmmy
Boring Depth ""n' .. _- .. Additional Information
******Mechanical Integrity Test******
PSI Increments Calibration Date of Gage f----· PSI Full Scale Test Run By Stan Davis, Len Eakin Date Test Run 1/28/08 Water QILlality
Time Beginning of Test 1000 Time End of Test 1200 Sample taken? DYes 0No Initial Pressure 35.0 PSIG Initial Fluid Level 6.0 inches ~~alyzed?
Final Pressure 35.0 PSIG Final Fluid Level 6.0inches Date well completed 2/4/Q8
July 2012 J-120 Appendix J

WELL DEVELOPMENT RECORD- PARAMETER MEASUREMENTS
Total Volume
I I Well Withdrawal Conductivity Temp Turbidity No. Time pH (ms/cm) (OC) (NTU) Comments
Gallons Borehole Volume
32·4C 1400 appears cl. 2/4/08 well developed
1425 water cleared up within 5 minutes
approx 30 gpm while pumping
July 2012 J-121 Appendix J

POWERTECH WELL AND PUMP DATA
Location of Well Drilling Contractor Driller Well Name DB07-29-7 Dewey, SD Davis Drilling Tony
County Type of Rig Drilling Fluid Well Depth 650' Custer mud
LAT 4816313N LONG 578652E Elevation 3703' Datum point from which all measurements are taken
Screened Monitoring Well Completion Detail Method of Drilling Date: 11/20/07
D Cabel Tool 0 Hollow Rod
---® Screened Well No. 181 Direct Rotary D Air Rotary
A Stick-up Length 2.0' D Bucket Auger 0 Reverse Rotary
© B. Key No. NA D Flight Auger D Jetted
!'-... C. Protective Casing 0Dug 0 Driven
Ground / Diameter NA ~- !l!J!li.r2ti!n'-
Surface Material NA Use -
Length NA D Domestic 0 Public Supply , Depth to Bottom NA D Industrial D Irrigation
~-p- ® D. Surface Completion D Munieipal 0 Commercial
rr- Diameter NA D Test Well 0 Heating or Coohng
v / Depth NA 181 Monitoring
v / Material NA D Other
v / E. Well Casing Data One well volume (V) = gallons
/ Diameter 4" lD Initial Development Water
v / Material PVC Water Level (TIC) __ Length RR7' Well Depth __ v v Weight SQH4Q Color --v v Depth to Bottom 6aii' Odor
v v F. Grout cement Date 11120/07 Clarity ___
v v Depth to Top 0' Developed By ___
'/ v Depth to Bottom 593' Date --Material §:ulfat~ re§is. cemflnt Well Development Date __
'/ v Density 1Q.2Qi~al Description of Development Technique
/ '/ Volume 17.2 bbls
® / / %Excess 70 Pump
'/ '/ Method oflnstallation displacement
Depth to Cement in Casing 5!i0' Date Installed --- Type __
/ / DYes 181 No Manufacturer --- Model No --Return Constant
'/ '/ H.P. -- Volts --Volume of Grout Return _o ____ Capacity __
'/ '/ G. Borehole Diameter Depth of Pump Intake Setting __
i ~ Drilling Dates 6.25" 11/20/07 No ofStages __
H. Pack Type/SizeNA Date NA 00Il 0 Water Lubrication
Depth to Top NA Power Source ---. - Depth to Bottom Material of drop pipe ___
1--- Material Bowls ---
Method of Installation Shafting __ lmpellors __
Gradation Bowl Diameter
-· 1------
1---- I. Screen Date 2/8/08 Column Pipe Diameter __ Length __
Modification . --Depth to Top 6a5-650' !--- ·, Depth to Bottom
Manufacturer Geophysical Lo~~s Run Gamma Resistivity SP ran ll/2Q/07
Material PV~
, I. Slot 01"
J. Bottom Cap
Material PVC
Length 1" . Driller Tonv
Boring Depth !l6Q' . .. ~
Additional Information
******Mechanical Integrity Test******
PSI Increments Calibration Date of Gage --PSI Full Scale Test Run By Stan Davis, Len Eakin Date Test Run 217/08 Water Quality
Time Beginning of Test 0930 Time End of Test 1130 Sample taken? 0 Yes 0No Initial Pressure 35.0 PSlG Initial Fluid Level 5.0 inches Where analyzed?
Final Pressure 35.0 PSIG Final Fluid Level 5.0inches Date well completed 2/8/08
July 2012 J-122 Appendix J

WELL DEVELOPMENT RECORD- PARAMETER MEASUREMENTS
Total Volume
Well Withdrawal Conductivity Temp Turbidity No.
Time pH (ms/cm) (oC) (NTU) Comments
Gallons Borehole Volume
29-7 1500 appears cl. 2/8/08 well developed
1530 water cleared up within 3 minutes
i less than 1 gpm while pumping
lOOpsi kickoff, 50psi sustained
v. sllow recharge
I ,____
July 2012 J-123 Appendix J

POWERTECH WELL AND PUMP DATA
Location of Well Drilling Contractor Driller Well Name DB07-32-9C
Dewey, SD Davis Drilling Tony
County Type of Rig Drilling Fluid Well Depth 501i'
Custer mud
LAT 4815586N LONG 578744E Elevation 3683" Datum point from which all measurements are taken
Screened Monitoring Well Completion Detail Method of Drilhng Date: 1/15/08
D Cabel Tool D Hollow Rod
.---@ Screened Well No . ~ Direct Rotary D Air Rotary
A. Stick-up Length 2 0' D Bucket Auger 0 Reverse Rotary
© B. Key No. NA D Flight Auger D Jetted
/ "" C. Protective Casing
DDug 0 Driven
OOther!ill!d...;~ Ground Diameter NA
Surface Material NA Use 1- D Domestic D Public Supply Length NA
1.-- Depth to Bottom NA 0 Industrial D Irrigation
~_....----' '-r- D. Surface Completion 0Municipal D Commercial
17-r- Diameter NA DTestWell 0 Heating or Cooling
I/ v Depth NA 181 Monitoring
I/ I/ Material NA D Other
I/ l/ E. Well Casing Data One well volume (\[) = gallons
I/ Diameter 6" ID Initial Development Water
I/ v Material pvr. Water Level (TIC) __
Length 492' Well Depth __
I/ I/ Weight ~CH40 Color --I/ v Depth to Bottom 49Q' Odor
1/ I/ F. Grout cement Date 2/20/08 Clarity ___
I/ I/ Depth to Top 0' Developed By ___
I/ I/ Depth to Bottom 4~1' Date --Material sulfat~ resi§. cem~nt Well Dev,elopm~mt Date __
I/ v Density 1!:i 21!1/gal Description of Development Technique
I/ I/ Volume 24.8llllls
@ l/ I/ %Excess on Pump
I/ I/ Method of Installation displacement
Depth to Cement in Casing 370' Date Installed --- Type __
I/ I/ Return Constant 181 Yes DNo Manufac1urer --- Model No. --
I/ I/ Volume of Grout Return 8bbls H.P. -- Volts --
I/ I/ Capacity __
G. Borehole Diameter Depth of Pump Intake Setting ___
~ ~ Drilling Dates 6.25" 1115/08 No. of Stages __
H. Pack Type/SizeNA Date NA D01l 0 Water Lubrication
(8) Depth to Top NA Power Source ---Depth to Bottom Material of drop pipe ___
1--- ' Material Bowls ---
Method of Installation Shafting __ Impellors __
·- ,,_ Gradation Bowl Diameter --
1-· I. Screen Date 3/10/08 Column Pipe Diameter __ Length __
ModificatiOn ---I· Depth to Top 49Q-505"
1--- ·- Depth to Bottom
Manufacturer Geophysical Lo1~s Run Gamma Resistivity SP ran 1115/08
~ Material pvr. ,· I. Slot .01"
'• J. Bottom Cap
Material PVC
Length 1" I· Driller TQmmy
Boring Depth .. ..
Additional Information Dewey pump test site - upper Fall River sand lens (not in pumped lens)
******Mechanical Integrity Test******
PSI Increments Calibration Date of Gage PSI Full Scale Test Run By Stan Davis, Len Eakin Date Test Run 3/9/08 Water Quality
Time Beginning of Test 0800 Time End of Test 1000 Sample taken? DYes DNo Initial Pressure 35.0 PSIG Initial Fluid Level 4.0 inches Where analyzed?
Final Pressure 35.0 PSIG Final Fluid Level 4.0inches Date well completed 3/10/0R
July 2012 J-124 Appendix J

WELL DEVELOPMENT RECORD- PARAMETER MEASUREMENTS
Total Volume
Well Withdrawal Conductivity Temp Turbidity No. Time pH (ms/cm) (OC) (NTU) Comments
Gallons Borehole Volume
32-9C 1400 dirty-clear. 3/10/08 well developed
1430 water cleared up after 20 minutes
very black water and sand coming out
approx 40-45 gpm while pumping
220psi kickoff 90psi sustained
6gpm flow by itself
screened interval in Fall River formation
July 2012 J-125 Appendix J

POWERTECH WELL AND PUMP DATA
Location of Well Drilling Contractor Driller Well Name DB07-32-10 Dewey, SD Davis Drilling Tony
~---------------------r------------------+------------------r-------------------------------------~1 County Custer
LAT 4815611N
Ground Surface
©
Additional Information
PSI Increments PSI Full Scale Test Run By Time Beginning of Test Initial Pressure
Final Pressure
Type of Rig Drilling Fluid mud
LONG 578729E Elevation 3655"
Screened Monitoring Well Completion Detail
Screened Well No.
A Stick-up Length
B. Key No.
C. Protective Casing
Diameter
Material
2. '
NA
NA
NA ~ngth ~N~A __________ __
Depth to Bottom .,N"'A'-------------
D. Surface Completion
Diameter NA
Depth NA
Material NA
E. Well Casing Data
Diameter 6" ID
Material PVC
~ngth 717'
Weight SQH40
Depth to Bottom 715'
F. Grout cement Date 1128/08
Depth to Top 0'
Depth to Bottom
Material sulfate resif!:. ~~m~nt Density 15.a ~~/gal
Volume IVbbls
%Excess 70
Method of Installation di~a:ula~~ment
Depth to Cement in Casing f>IQ'
Return Constant 181 Yes 0No
Volume of Grout Return I bbl~
G. Borehole Diameter
Drilling Dates 8. 75" ream 1128/08
H. Pack Type/SizeNA Date NA
Depth to Top NA
Depth to Bottom
Material
Method of Installation
Gradation
I. Screen Date 3111/08
Depth to Top 715-7a0"
Depth to Bottom
Manufacturer
Material PVQ
Slot I"
J. Bottom Cap
Material PVQ
~ngth I"
Driller Tommy
Boring Depth
******Mechanical Integrity Test******
Calibration Date of Gage
Stan Davis, Len Eakin 1200 35.0 PSIG
35.0 PSIG
Date Test Run Time End of Test Initial Fluid Level
Final Fluid Level
3110/08 1405 6.0 inches
6.0inches
Well Depth 730'
Datum point from which all measurements are taken
Method of Drilling Date: 1126/08
0 Gabel Tool 0 Hollow Rod
181 Direct Rotary 0 Air Rotary
0 Bucket Auger 0 Reverse Rotary
0 Flight Auger 0 Jetted
ODug 0 Driven
0 Other J!!l!l!_r
Use
0 Domestic 0 Public Supply
0 Industrial 0 Irrigation
0 Munieipal 0 Commercial
OTestWell 0 Heating or Cooling
181 Monitoring
OOther __
One well volume (V) = gallons
Initial D~~velopment Water
Water LE•vel (TIC) __ _
W"ll Depth __ _
Color
Odor
Clarity·---Developed By __ _
Date
Well Developm~mt Date __
Description of Development Technique _______ __
-------====================~ Pump
Date Installed
Manufacturer
H.P.
Capacity __
Type __
Model No.
Volts
Depth of Pump Intake Setting __ No. of Stages __ _
OOI!
Power Source Material of drop pipe __ _
Bowls Shafting __
Bowl Diameter
Column Pipe Diameter __ _
Modification
0 Water Lubrication
lmpellors __
~ngth __ _
Geophysical Logs Run Gamma Resistivity SP ran 1126/08
-------------------
Water Quality
Sample taken? 0 Yes 0 No
Where analyzed~?==================--11 Date well completed ;>!J.I!!li-"082.__ _____________ _
July 2012 J-126 Appendix J

WELL DEVELOPMENT RECORD- PARAMETER MEASUREMENTS
Total Volume Well Withdrawal Conductivity Temp Turbidity No.
Time pH (ms/cm) ("C) (NTU) Comments
Gallons I Borehole Volume
32-10 1600 v. dirty 3/11/08 well developed
1630 water v. sl. dirty at end of test
approx 2 gpm while pumping
llOpsi kickoff decreases quickly to 2gpm at 50psi
well recharges quickly when pump shut off
screened interval in Lakota formation
July 2012 J-127 Appendix J

POWERTECH WELL AND PUMP DATA
Location of Well Drilling Contractor Driller Well Name DB07-32-ll Dewey, SD Davis Drilling Tony
County Type of Rig Drilling Fluid Well Depth 930' Custer mud
LAT 4815572N LONG 578734E Elevation 3664" Datum point from which all measurements are taken
Screened Monitoring Well Completion Detail Method of Drilling Date: 2/7/08
D Cabel Tool D Hollow Rod
...----® Screened Well No . 181 Direct Rotary D Air Rotary
A. Stick-up Length 2.0' 0 Bucket Auger 0 Reverse Rotary
© B. Key No. NA D Flight Auge:r D Jetted
/ C. Protective Casing DDug 0 Driven
!'-- D Other mud rotarv Ground Diameter NA f---·
Surface Material NA Use 1- 0 Domestic D Pubhc Supply Length NA
I.- Depth to Bottom NA 0 Industrial D Irrigation
@Y___.------' '-IT D. Surface Completion D Munieipal D Commercial
trr- Diameter NA D Test Well 0 Heating or Cooling
[/ l/ Depth NA 181 Monitoring
I/ l/ Material NA D Other
!-----· [/ l/ E. Well Casing Data One well volume (V) ::: gallons
l/ Diameter 6" ID Initial Development Water
I/ l/ Material PVC: Water Level (TIC) __
Length 912' Well Depth __
I/ I/ Weight ~CH40 Color --I/ I/ Depth to Bottom 910' Odor
I/ I/ F. Grout cement Date 2/12/08 Clarity ___
I/ I/ Depth to Top 0' Developed By ___
I/ I/ Depth to Bottom 911' Date --
Material sulfat!i:: r~l2if!. !,;~ment Well Development Date __
I/ I/ Density 15.21~/l:l!l Description of Development 'T'echnique
l/ 1/ Volume 55.0 bbls
~ I/ I/ %Excess 70 Pnmp
~ [/ I/ Method of Installation di§;ulac~ment
Depth to Cement in Casing 76Q' Date Installed --- Type __
I/ I/ Return Constant 181 Yes 0No Manufacturer --- Model No. --
I/ I/ Volume of Grout Return 8b~la HP. -- Volts --
l/ 1/ Capacity __
G. Borehole Diameter Depth of Pump Intake Setting ___
~ ~ Drilling Dates 6.25" 2/7/08 No. of Stages __
H. Pack Type/SizeNA Date NA OOII 0 Water Lubrication
Depth to Top NA Power Source ---Depth to Bottom Material of drop pipe __
1------ Material Bowls --
1------ Method of Installation Shafting __ lmpellors __
.. 1-----''· Gradation Bowl Diameter --
1-· Column Pipe Diameter __ Length __ I. Screen Date 3/8/08
1------ Modification I· Depth to Top 910-930" --
1------ ·, Depth to Bottom 1------1· Manufacturer Geophysical Lo!~S Run Gamma Resistivity SP ran 2/8/08 1------
PV" 1------ Material _. I. Slot .01"
f------J. Bottom Cap
Material PVC
Length I"
Driller Tommy
- ·: ·' Boring Depth
Additional Information
******Mechanical Integrity Test******
PSI Increments Calibration Date of Gage PSI Full Scale Test Run By Stan Davis, Len Eakin Date Test Run 3/5/08 Water Quality
Time Beginning of Test 0830 Time End of Test 1000 Sample taken? 0 Yes 0No Initial Pressure 35.0 PSIG Initial Fluid Level 4.0 inches Where analyzed?
Final Pressure 35.0 PSIG Final Fluid Level 4.0inches Date well completed 3/8/08
July 2012 J-128 Appendix J

WELL DEVELOPMENT RECORD- PARAMETER MEASUREMENTS
Total Volume
Well Withdrawal Conductivity Temp Turbidity
No. Time pH (ms/cm) (OC) (NTU) Comments
Gallons Borehole Volume
32·11 1200 appears cl. 3/8/08 well developed
1230 water cleared up within 5 minutes
approx 5 gpm while pumping
llOpsi kickoff slowly decreases to 2gpm at 75psi
well recharges quickly when pump shut off
screened interval in U nkpapa formation
- I
-----i I
~
July 2012 J-129 Appendix J

Knight Piesold CONaULTING
Appendix B-2 Time and Water Level Data Values Used in Pumping Test
Analysis: Dewey Test, Drawdown Data
July 2012 J-130 Appendix J

Table B.2-1:
Time and Water Level Data Values Used in Pumping Test Analysis: Dewey Test, Drawdown Data
32-3C 3643.9 GW-49 3652 29-7 3659.3 32-4C 3644.0 32-5 3641.0 32-9C 3626.3
Time (days) Drawdown (ft) Elevation (ft) Time (days) Drawdown (ft) Elevation (ft) Time (days) Drawdown (ft) Elevation (ft) Time (days) Drawdown (ft) Elevation (ft) Time (days) Drawdown (ft) Elevation (ft) Time (days) Drawdown (ft) Elevation (ft)
0.000012 16.362759 3,627.5 0.000012 -0.008329 3,652.0 0.000012 0.045472 3,659.3 0.000012 -0.002208 3,644.0 0.000000 -0.048216 3,641.0 0.000012 -0.025243 3,626.3
0.000023 19.161989 3,624.7 0.000023 -0.001406 3,652.0 0.000023 -0.000681 3,659.3 0.000023 0.004715 3,644.0 0.000012 -0.022831 3,641.0 0.000023 0.027834 3,626.3
0.000035 19.948912 3,624.0 0.000035 0.007825 3,652.0 0.000035 0.029319 3,659.3 0.000035 0.007023 3,644.0 0.000023 0.000246 3,641.0 0.000035 0.034757 3,626.3
0.000046 20.355066 3,623.5 0.000046 -0.001406 3,652.0 0.000046 -0.023758 3,659.3 0.000046 0.009331 3,644.0 0.000035 0.002553 3,641.0 0.000046 -0.009089 3,626.3
0.000058 21.017374 3,622.9 0.000058 0.035517 3,652.0 0.000058 0.013165 3,659.3 0.000058 0.007023 3,644.0 0.000046 0.000246 3,641.0 0.000058 0.011680 3,626.3
0.000069 21.402758 3,622.5 0.000069 -0.012944 3,652.0 0.000069 -0.012220 3,659.3 0.000069 0.002408 3,644.0 0.000058 0.004861 3,641.0 0.000069 0.009372 3,626.3
0.000081 21.651989 3,622.2 0.000081 -0.008329 3,652.0 0.000081 0.052395 3,659.2 0.000081 0.013946 3,644.0 0.000069 -0.011293 3,641.0 0.000081 0.023219 3,626.3
0.000093 22.035067 3,621.9 0.000093 -0.036021 3,652.0 0.000093 0.057011 3,659.2 0.000093 0.002408 3,644.0 0.000081 -0.020523 3,641.0 0.000093 0.013988 3,626.3
0.000104 22.071989 3,621.8 0.000104 0.007825 3,652.0 0.000104 0.001626 3,659.3 0.000104 0.016254 3,644.0 0.000093 0.004861 3,641.0 0.000104 -0.002166 3,626.3
0.000116 22.016603 3,621.9 0.000116 0.014748 3,652.0 0.000116 -0.028374 3,659.3 0.000116 0.000100 3,644.0 0.000104 -0.015908 3,641.0 0.000116 0.037065 3,626.3
0.000127 22.381220 3,621.5 0.000127 -0.006021 3,652.0 0.000127 -0.000681 3,659.3 0.000127 0.000100 3,644.0 0.000116 0.000246 3,641.0 0.000127 0.013988 3,626.3
0.000139 22.337374 3,621.6 0.000139 -0.001406 3,652.0 0.000139 -0.005297 3,659.3 0.000139 0.009331 3,644.0 0.000127 -0.002062 3,641.0 0.000139 -0.006781 3,626.3
0.000150 22.618912 3,621.3 0.000150 -0.008329 3,652.0 0.000150 0.045472 3,659.3 0.000150 0.009331 3,644.0 0.000139 0.002553 3,641.0 0.000150 -0.004474 3,626.3
0.000162 22.508142 3,621.4 0.000162 0.005517 3,652.0 0.000162 0.006242 3,659.3 0.000162 0.007023 3,644.0 0.000150 0.021015 3,641.0 0.000162 -0.018320 3,626.3
0.000174 22.847374 3,621.1 0.000174 -0.019867 3,652.0 0.000174 -0.021451 3,659.3 0.000174 0.011639 3,644.0 0.000162 -0.008985 3,641.0 0.000174 0.018603 3,626.3
0.000185 22.914297 3,621.0 0.000185 -0.008329 3,652.0 0.000185 -0.026066 3,659.3 0.000185 -0.004515 3,644.0 0.000174 0.014092 3,641.0 0.000185 0.000142 3,626.3
0.000197 22.999681 3,620.9 0.000197 -0.017559 3,652.0 0.000197 0.024703 3,659.3 0.000197 0.000100 3,644.0 0.000185 -0.018216 3,641.0 0.000197 0.013988 3,626.3
0.000208 22.893528 3,621.0 0.000208 -0.029098 3,652.0 0.000208 0.003934 3,659.3 0.000208 0.013946 3,644.0 0.000197 0.016400 3,641.0 0.000208 0.000142 3,626.3
0.000220 23.131220 3,620.8 0.000220 -0.003713 3,652.0 0.000220 0.020088 3,659.3 0.000220 0.013946 3,644.0 0.000208 -0.013600 3,641.0 0.000220 0.002449 3,626.3
0.000231 23.131220 3,620.8 0.000231 0.010133 3,652.0 0.000231 0.006242 3,659.3 0.000231 0.013946 3,644.0 0.000220 0.018707 3,641.0 0.000231 -0.013704 3,626.3
0.000243 23.271988 3,620.6 0.000243 -0.012944 3,652.0 0.000243 -0.014528 3,659.3 0.000243 0.011639 3,644.0 0.000231 0.023323 3,641.0 0.000243 0.011680 3,626.3
0.000255 23.121988 3,620.8 0.000255 0.017056 3,652.0 0.000255 0.031626 3,659.3 0.000255 0.004715 3,644.0 0.000243 -0.004370 3,641.0 0.000255 -0.011397 3,626.3
0.000266 23.101219 3,620.8 0.000266 0.005517 3,652.0 0.000266 0.038549 3,659.3 0.000266 0.023177 3,644.0 0.000255 -0.002062 3,641.0 0.000266 0.011680 3,626.3
0.000278 23.934296 3,620.0 0.000278 -0.022175 3,652.0 0.000278 0.006242 3,659.3 0.000278 0.009331 3,644.0 0.000266 -0.011293 3,641.0 0.000278 -0.002166 3,626.3
0.000289 24.737373 3,619.2 0.000289 -0.026790 3,652.0 0.000289 -0.032989 3,659.3 0.000289 0.007023 3,644.0 0.000278 0.009477 3,641.0 0.000289 0.009372 3,626.3
0.000301 25.408913 3,618.5 0.000301 0.007825 3,652.0 0.000301 -0.009912 3,659.3 0.000301 0.009331 3,644.0 0.000289 0.057938 3,640.9 0.000301 -0.009089 3,626.3
0.000312 26.036604 3,617.9 0.000312 -0.001406 3,652.0 0.000312 0.020088 3,659.3 0.000312 0.002408 3,644.0 0.000301 -0.008985 3,641.0 0.000312 0.002449 3,626.3
0.000324 27.222757 3,616.7 0.000324 -0.022175 3,652.0 0.000324 0.020088 3,659.3 0.000324 0.013946 3,644.0 0.000312 -0.018216 3,641.0 0.000324 -0.013704 3,626.3
0.000336 27.725836 3,616.2 0.000336 -0.008329 3,652.0 0.000336 -0.021451 3,659.3 0.000336 -0.004515 3,644.0 0.000324 0.009477 3,641.0 0.000336 -0.016012 3,626.3
0.000347 28.452759 3,615.4 0.000347 -0.029098 3,652.0 0.000347 0.010857 3,659.3 0.000347 0.007023 3,644.0 0.000336 -0.002062 3,641.0 0.000347 -0.043704 3,626.3
0.000359 29.391989 3,614.5 0.000359 0.017056 3,652.0 0.000359 0.006242 3,659.3 0.000359 0.002408 3,644.0 0.000347 -0.011293 3,641.0 0.000359 0.037065 3,626.3
0.000370 30.266603 3,613.6 0.000370 -0.017559 3,652.0 0.000370 -0.005297 3,659.3 0.000370 -0.002208 3,644.0 0.000359 0.000246 3,641.0 0.000370 -0.004474 3,626.3
0.000382 30.670450 3,613.2 0.000382 -0.012944 3,652.0 0.000382 0.013165 3,659.3 0.000382 0.013946 3,644.0 0.000370 0.000246 3,641.0 0.000382 0.018603 3,626.3
0.000394 30.815834 3,613.1 0.000394 -0.038329 3,652.0 0.000394 -0.000681 3,659.3 0.000394 0.004715 3,644.0 0.000382 0.025630 3,641.0 0.000394 0.002449 3,626.3
0.000417 30.891989 3,613.0 0.000405 -0.010636 3,652.0 0.000417 0.015472 3,659.3 0.000417 0.009331 3,644.0 0.000394 0.000246 3,641.0 0.000417 -0.004474 3,626.3
0.000451 29.811989 3,614.1 0.000417 -0.006021 3,652.0 0.000451 -0.035297 3,659.3 0.000451 0.013946 3,644.0 0.000417 -0.006677 3,641.0 0.000451 0.030142 3,626.3
0.000463 28.955835 3,614.9 0.000451 0.000902 3,652.0 0.000463 0.057011 3,659.2 0.000463 0.000100 3,644.0 0.000451 0.048707 3,641.0 0.000463 -0.022935 3,626.3
0.000486 27.504297 3,616.4 0.000463 -0.017559 3,652.0 0.000486 -0.014528 3,659.3 0.000486 0.002408 3,644.0 0.000463 0.016400 3,641.0 0.000486 -0.013704 3,626.3
0.000498 26.318142 3,617.6 0.000486 0.000902 3,652.0 0.000498 -0.000681 3,659.3 0.000498 -0.002208 3,644.0 0.000486 0.000246 3,641.0 0.000498 -0.011397 3,626.3
0.000521 25.127373 3,618.8 0.000498 0.014748 3,652.0 0.000521 0.017780 3,659.3 0.000521 0.007023 3,644.0 0.000498 -0.027447 3,641.0 0.000521 -0.025243 3,626.3
0.000532 24.181219 3,619.7 0.000521 0.012441 3,652.0 0.000532 -0.007605 3,659.3 0.000532 0.011639 3,644.0 0.000521 0.016400 3,641.0 0.000532 -0.004474 3,626.3
0.000556 23.816605 3,620.1 0.000532 -0.019867 3,652.0 0.000556 0.033934 3,659.3 0.000556 0.013946 3,644.0 0.000532 -0.004370 3,641.0 0.000556 -0.029858 3,626.3
0.000590 24.716604 3,619.2 0.000556 0.010133 3,652.0 0.000590 -0.014528 3,659.3 0.000590 -0.002208 3,644.0 0.000556 0.002553 3,641.0 0.000590 -0.048320 3,626.3
0.000625 26.325066 3,617.6 0.000590 0.042441 3,652.0 0.000625 0.003934 3,659.3 0.000625 0.011639 3,644.0 0.000590 0.016400 3,641.0 0.000625 -0.020628 3,626.3
0.000660 28.007374 3,615.9 0.000625 0.007825 3,652.0 0.000660 0.010857 3,659.3 0.000660 0.007023 3,644.0 0.000625 0.000246 3,641.0 0.000660 0.013988 3,626.3
0.000694 29.479681 3,614.4 0.000660 -0.022175 3,652.0 0.000694 -0.019143 3,659.3 0.000694 0.011639 3,644.0 0.000660 -0.002062 3,641.0 0.000694 0.011680 3,626.3
0.000729 29.885836 3,614.0 0.000694 -0.017559 3,652.0 0.000729 0.010857 3,659.3 0.000729 0.016254 3,644.0 0.000694 -0.029754 3,641.0 0.000729 0.023219 3,626.3
0.000764 30.118912 3,613.8 0.000729 0.005517 3,652.0 0.000764 0.045472 3,659.3 0.000764 0.000100 3,644.0 0.000729 -0.018216 3,641.0 0.000764 0.000142 3,626.3
0.000799 29.791220 3,614.1 0.000764 -0.012944 3,652.0 0.000799 0.020088 3,659.3 0.000799 -0.004515 3,644.0 0.000764 0.034861 3,641.0 0.000799 0.020911 3,626.3
0.000833 29.622759 3,614.3 0.000799 0.010133 3,652.0 0.000833 -0.012220 3,659.3 0.000833 0.000100 3,644.0 0.000799 0.039477 3,641.0 0.000833 0.025526 3,626.3
0.000903 29.613527 3,614.3 0.000833 -0.008329 3,652.0 0.000903 -0.026066 3,659.3 0.000903 0.007023 3,644.0 0.000833 0.021015 3,641.0 0.000903 -0.018320 3,626.3
0.000972 29.675835 3,614.2 0.000903 -0.022175 3,652.0 0.000972 -0.005297 3,659.3 0.000972 0.030100 3,644.0 0.000903 -0.008985 3,641.0 0.000972 0.020911 3,626.3
G:\102\00279.01\Deliverables\Reports - Specs\Hydrogeologic Testing Report\Rev1\Appendices\AppendixB-Rev1\
App B_2 Dewey Drawdown Data Tables_RevTR 1 of 411/12/2008
Revised July 2010
July 2012J-131
Appendix J

Table B.2-1:
Time and Water Level Data Values Used in Pumping Test Analysis: Dewey Test, Drawdown Data
32-3C 3643.9 GW-49 3652 29-7 3659.3 32-4C 3644.0 32-5 3641.0 32-9C 3626.3
Time (days) Drawdown (ft) Elevation (ft) Time (days) Drawdown (ft) Elevation (ft) Time (days) Drawdown (ft) Elevation (ft) Time (days) Drawdown (ft) Elevation (ft) Time (days) Drawdown (ft) Elevation (ft) Time (days) Drawdown (ft) Elevation (ft)
0.001042 29.874296 3,614.0 0.000972 0.021671 3,652.0 0.001042 -0.028374 3,659.3 0.001042 0.004715 3,644.0 0.000972 0.025630 3,641.0 0.001042 -0.016012 3,626.3
0.001111 29.814297 3,614.1 0.001042 0.023979 3,652.0 0.001111 -0.014528 3,659.3 0.001111 0.011639 3,644.0 0.001042 0.067169 3,640.9 0.001111 0.018603 3,626.3
0.001181 29.823526 3,614.1 0.001111 0.012441 3,652.0 0.001181 -0.005297 3,659.3 0.001181 0.013946 3,644.0 0.001111 0.069477 3,640.9 0.001181 0.018603 3,626.3
0.001250 29.851219 3,614.0 0.001181 0.010133 3,652.0 0.001250 -0.030681 3,659.3 0.001250 0.011639 3,644.0 0.001181 0.090246 3,640.9 0.001250 -0.013704 3,626.3
0.001319 29.989681 3,613.9 0.001250 -0.015252 3,652.0 0.001319 0.027011 3,659.3 0.001319 0.016254 3,644.0 0.001250 0.076400 3,640.9 0.001319 0.064757 3,626.2
0.001389 30.010450 3,613.9 0.001319 -0.040636 3,652.0 0.001389 -0.056066 3,659.4 0.001389 0.002408 3,644.0 0.001319 0.131784 3,640.9 0.001389 -0.041397 3,626.3
0.001493 30.190451 3,613.7 0.001389 0.007825 3,652.0 0.001493 0.001626 3,659.3 0.001493 0.016254 3,644.0 0.001389 0.152553 3,640.8 0.001493 -0.025243 3,626.3
0.001597 30.144297 3,613.8 0.001493 0.014748 3,652.0 0.001597 -0.032989 3,659.3 0.001597 0.023177 3,644.0 0.001493 0.180246 3,640.8 0.001597 -0.025243 3,626.3
0.001701 30.280451 3,613.6 0.001597 -0.019867 3,652.0 0.001701 -0.012220 3,659.3 0.001701 0.016254 3,644.0 0.001597 0.203323 3,640.8 0.001701 -0.032166 3,626.3
0.001806 30.506603 3,613.4 0.001701 -0.022175 3,652.0 0.001806 -0.000681 3,659.3 0.001806 0.030100 3,644.0 0.001701 0.274861 3,640.7 0.001806 0.013988 3,626.3
0.001944 30.497374 3,613.4 0.001806 -0.026790 3,652.0 0.001944 -0.035297 3,659.3 0.001944 0.041639 3,644.0 0.001806 0.291015 3,640.7 0.001944 -0.004474 3,626.3
0.002083 30.527374 3,613.4 0.001944 0.060902 3,651.9 0.002083 -0.014528 3,659.3 0.002083 0.030100 3,644.0 0.001944 0.330246 3,640.7 0.002083 -0.041397 3,626.3
0.002222 30.758142 3,613.1 0.002083 0.007825 3,652.0 0.002222 0.031626 3,659.3 0.002222 0.037023 3,644.0 0.002083 0.411015 3,640.6 0.002222 -0.029858 3,626.3
0.002361 30.873528 3,613.0 0.002222 -0.029098 3,652.0 0.002361 -0.009912 3,659.3 0.002361 0.039331 3,644.0 0.002222 0.452553 3,640.5 0.002361 -0.016012 3,626.3
0.002500 31.071989 3,612.8 0.002361 0.007825 3,652.0 0.002500 0.015472 3,659.3 0.002500 0.055485 3,643.9 0.002361 0.494092 3,640.5 0.002500 -0.009089 3,626.3
0.002639 30.954296 3,612.9 0.002500 -0.008329 3,652.0 0.002639 -0.012220 3,659.3 0.002639 0.050869 3,643.9 0.002500 0.512553 3,640.5 0.002639 -0.022935 3,626.3
0.002778 31.159681 3,612.7 0.002639 0.014748 3,652.0 0.002778 -0.012220 3,659.3 0.002778 0.048562 3,644.0 0.002639 0.581784 3,640.4 0.002778 -0.009089 3,626.3
0.002951 31.143528 3,612.8 0.002778 0.000902 3,652.0 0.002951 0.024703 3,659.3 0.002951 0.067023 3,643.9 0.002778 0.595630 3,640.4 0.002951 -0.013704 3,626.3
0.003125 31.323526 3,612.6 0.002951 -0.022175 3,652.0 0.003125 -0.026066 3,659.3 0.003125 0.071639 3,643.9 0.002951 0.713323 3,640.3 0.003125 -0.025243 3,626.3
0.003299 31.420450 3,612.5 0.003125 -0.006021 3,652.0 0.003299 0.006242 3,659.3 0.003299 0.080869 3,643.9 0.003125 0.701784 3,640.3 0.003299 -0.052935 3,626.4
0.003472 31.475836 3,612.4 0.003299 0.003210 3,652.0 0.003472 -0.005297 3,659.3 0.003472 0.080869 3,643.9 0.003299 0.761784 3,640.2 0.003472 -0.004474 3,626.3
0.003704 31.637373 3,612.3 0.003472 -0.006021 3,652.0 0.003704 0.015472 3,659.3 0.003704 0.099331 3,643.9 0.003472 0.791784 3,640.2 0.003704 0.009372 3,626.3
0.003935 31.695066 3,612.2 0.003704 0.010133 3,652.0 0.003935 -0.005297 3,659.3 0.003935 0.103946 3,643.9 0.003704 0.872553 3,640.1 0.003935 -0.046012 3,626.3
0.004167 31.757374 3,612.1 0.003935 0.007825 3,652.0 0.004167 0.050088 3,659.2 0.004167 0.143177 3,643.9 0.003935 0.916400 3,640.1 0.004167 -0.013704 3,626.3
0.004398 31.796604 3,612.1 0.004167 -0.019867 3,652.0 0.004398 -0.000681 3,659.3 0.004398 0.133946 3,643.9 0.004167 0.983323 3,640.0 0.004398 -0.004474 3,626.3
0.004630 32.068913 3,611.8 0.004398 0.005517 3,652.0 0.004630 0.010857 3,659.3 0.004630 0.143177 3,643.9 0.004398 1.011015 3,640.0 0.004630 -0.092166 3,626.4
0.004861 32.036606 3,611.9 0.004630 0.000902 3,652.0 0.004861 0.010857 3,659.3 0.004861 0.166254 3,643.8 0.004630 1.119477 3,639.9 0.004861 -0.006781 3,626.3
0.005208 32.232758 3,611.7 0.004861 0.000902 3,652.0 0.005208 0.017780 3,659.3 0.005208 0.187023 3,643.8 0.004861 1.158707 3,639.8 0.005208 -0.032166 3,626.3
0.005556 32.179680 3,611.7 0.005208 -0.008329 3,652.0 0.005556 0.043165 3,659.3 0.005556 0.196254 3,643.8 0.005208 1.204861 3,639.8 0.005556 0.030142 3,626.3
0.005903 32.373528 3,611.5 0.005556 -0.006021 3,652.0 0.005903 -0.012220 3,659.3 0.005903 0.221639 3,643.8 0.005556 1.304092 3,639.7 0.005903 0.041680 3,626.3
0.006250 32.382759 3,611.5 0.005903 -0.015252 3,652.0 0.006250 -0.014528 3,659.3 0.006250 0.244715 3,643.8 0.005903 1.357169 3,639.6 0.006250 0.000142 3,626.3
0.006597 32.398911 3,611.5 0.006250 -0.015252 3,652.0 0.006597 -0.021451 3,659.3 0.006597 0.260869 3,643.7 0.006250 1.421784 3,639.6 0.006597 0.023219 3,626.3
0.006944 32.641220 3,611.3 0.006597 0.007825 3,652.0 0.006944 0.008549 3,659.3 0.006944 0.283946 3,643.7 0.006597 1.530246 3,639.5 0.006944 0.048603 3,626.3
0.007292 32.781990 3,611.1 0.006944 -0.029098 3,652.0 0.007292 -0.009912 3,659.3 0.007292 0.309331 3,643.7 0.006944 1.534861 3,639.5 0.007292 0.041680 3,626.3
0.007639 32.922756 3,611.0 0.007292 -0.033713 3,652.0 0.007639 -0.002989 3,659.3 0.007639 0.309331 3,643.7 0.007292 1.567169 3,639.4 0.007639 0.080911 3,626.2
0.007986 32.874298 3,611.0 0.007639 -0.015252 3,652.0 0.007986 -0.000681 3,659.3 0.007986 0.339331 3,643.7 0.007639 1.645630 3,639.4 0.007986 0.083219 3,626.2
0.008333 32.980450 3,610.9 0.007986 0.019364 3,652.0 0.008333 -0.026066 3,659.3 0.008333 0.371639 3,643.6 0.007986 1.714861 3,639.3 0.008333 0.055526 3,626.2
0.009028 33.077374 3,610.8 0.008333 0.019364 3,652.0 0.009028 0.022395 3,659.3 0.009028 0.401639 3,643.6 0.008333 1.728707 3,639.3 0.009028 0.090142 3,626.2
0.009722 33.061218 3,610.8 0.009028 0.030902 3,652.0 0.009722 0.010857 3,659.3 0.009722 0.436254 3,643.6 0.009028 1.876400 3,639.1 0.009722 0.073988 3,626.2
0.010417 33.261990 3,610.6 0.009722 -0.006021 3,652.0 0.010417 0.010857 3,659.3 0.010417 0.480100 3,643.5 0.009722 1.954861 3,639.0 0.010417 0.099372 3,626.2
0.011111 33.460449 3,610.4 0.010417 -0.012944 3,652.0 0.011111 -0.007605 3,659.3 0.011111 0.521639 3,643.5 0.010417 2.024092 3,639.0 0.011111 0.133988 3,626.2
0.011806 33.536606 3,610.4 0.011111 -0.022175 3,652.0 0.011806 0.047780 3,659.3 0.011806 0.558562 3,643.4 0.011111 2.079477 3,638.9 0.011806 0.145526 3,626.2
0.012500 33.552757 3,610.3 0.011806 -0.036021 3,652.0 0.012500 0.010857 3,659.3 0.012500 0.581639 3,643.4 0.011806 2.178707 3,638.8 0.012500 0.131680 3,626.2
0.013194 33.728142 3,610.2 0.012500 -0.017559 3,652.0 0.013194 0.006242 3,659.3 0.013194 0.611639 3,643.4 0.012500 2.277938 3,638.7 0.013194 0.166296 3,626.1
0.013889 33.753529 3,610.1 0.013194 0.000902 3,652.0 0.013889 0.045472 3,659.3 0.013889 0.657792 3,643.3 0.013194 2.317169 3,638.7 0.013889 0.187065 3,626.1
0.014931 34.346603 3,609.6 0.013889 -0.015252 3,652.0 0.014931 -0.000681 3,659.3 0.014931 0.699331 3,643.3 0.013889 2.361015 3,638.6 0.014931 0.196296 3,626.1
0.015972 34.362759 3,609.5 0.014931 0.007825 3,652.0 0.015972 0.015472 3,659.3 0.015972 0.747792 3,643.3 0.014931 2.499476 3,638.5 0.015972 0.267834 3,626.0
0.017014 34.570450 3,609.3 0.015972 -0.012944 3,652.0 0.017014 0.001626 3,659.3 0.017014 0.796254 3,643.2 0.015972 2.568707 3,638.4 0.017014 0.288603 3,626.0
0.018056 34.745834 3,609.2 0.017014 -0.008329 3,652.0 0.018056 0.024703 3,659.3 0.018056 0.844715 3,643.2 0.017014 2.637938 3,638.4 0.018056 0.353219 3,625.9
0.019444 34.872757 3,609.0 0.018056 0.040133 3,652.0 0.019444 0.013165 3,659.3 0.019444 0.911639 3,643.1 0.018056 2.734861 3,638.3 0.019444 0.392449 3,625.9
0.020833 34.872757 3,609.0 0.019444 0.051671 3,651.9 0.020833 0.008549 3,659.3 0.020833 0.967023 3,643.0 0.019444 2.868707 3,638.1 0.020833 0.417834 3,625.9
0.022222 35.149681 3,608.8 0.020833 0.026287 3,652.0 0.022222 -0.012220 3,659.3 0.022222 1.022408 3,643.0 0.020833 2.961015 3,638.0 0.022222 0.487065 3,625.8
G:\102\00279.01\Deliverables\Reports - Specs\Hydrogeologic Testing Report\Rev1\Appendices\AppendixB-Rev1\
App B_2 Dewey Drawdown Data Tables_RevTR 2 of 411/12/2008
Revised July 2010
July 2012J-132
Appendix J

Table B.2-1:
Time and Water Level Data Values Used in Pumping Test Analysis: Dewey Test, Drawdown Data
32-3C 3643.9 GW-49 3652 29-7 3659.3 32-4C 3644.0 32-5 3641.0 32-9C 3626.3
Time (days) Drawdown (ft) Elevation (ft) Time (days) Drawdown (ft) Elevation (ft) Time (days) Drawdown (ft) Elevation (ft) Time (days) Drawdown (ft) Elevation (ft) Time (days) Drawdown (ft) Elevation (ft) Time (days) Drawdown (ft) Elevation (ft)
0.023611 35.149681 3,608.8 0.022222 0.030902 3,652.0 0.023611 -0.012220 3,659.3 0.023611 1.066254 3,642.9 0.022222 3.037169 3,638.0 0.023611 0.549372 3,625.8
0.025000 35.355064 3,608.5 0.023611 0.049364 3,652.0 0.025000 0.020088 3,659.3 0.025000 1.123946 3,642.9 0.023611 3.113323 3,637.9 0.025000 0.600142 3,625.7
0.026389 35.320450 3,608.6 0.025000 0.053979 3,651.9 0.026389 0.010857 3,659.3 0.026389 1.156254 3,642.8 0.025000 3.194092 3,637.8 0.026389 0.553988 3,625.7
0.027778 35.645836 3,608.3 0.026389 0.053979 3,651.9 0.027778 0.027011 3,659.3 0.027778 1.204715 3,642.8 0.026389 3.256400 3,637.7 0.027778 0.556296 3,625.7
0.029514 35.567375 3,608.3 0.027778 0.077056 3,651.9 0.029514 -0.026066 3,659.3 0.029514 1.285485 3,642.7 0.027778 3.300246 3,637.7 0.029514 0.616296 3,625.7
0.031250 35.588142 3,608.3 0.029514 0.083979 3,651.9 0.031250 0.036242 3,659.3 0.031250 1.315485 3,642.7 0.029514 3.408707 3,637.6 0.031250 0.623219 3,625.7
0.032986 35.680450 3,608.2 0.031250 0.134748 3,651.9 0.032986 0.036242 3,659.3 0.032986 1.363946 3,642.6 0.031250 3.482553 3,637.5 0.032986 0.690142 3,625.6
0.034722 35.735836 3,608.2 0.032986 0.100133 3,651.9 0.034722 -0.014528 3,659.3 0.034722 1.423946 3,642.6 0.032986 3.544861 3,637.5 0.034722 0.745526 3,625.6
0.037037 35.950451 3,607.9 0.034722 0.141671 3,651.9 0.037037 -0.016835 3,659.3 0.037037 1.481639 3,642.5 0.034722 3.607169 3,637.4 0.037037 0.784757 3,625.5
0.039352 35.978142 3,607.9 0.037037 0.125517 3,651.9 0.039352 0.024703 3,659.3 0.039352 1.532408 3,642.5 0.037037 3.713323 3,637.3 0.039352 0.863219 3,625.4
0.041667 35.952759 3,607.9 0.039352 0.164748 3,651.8 0.041667 0.001626 3,659.3 0.041667 1.587792 3,642.4 0.039352 3.807938 3,637.2 0.041667 0.865526 3,625.4
0.043981 36.153526 3,607.7 0.041667 0.201671 3,651.8 0.043981 0.006242 3,659.3 0.043981 1.645485 3,642.4 0.041667 3.863323 3,637.1 0.043981 0.890911 3,625.4
0.046296 36.012756 3,607.9 0.043981 0.208594 3,651.8 0.046296 0.001626 3,659.3 0.046296 1.696254 3,642.3 0.043981 3.953323 3,637.0 0.046296 0.960142 3,625.3
0.048611 36.144295 3,607.8 0.046296 0.247825 3,651.8 0.048611 0.010857 3,659.3 0.048611 1.735485 3,642.3 0.046296 4.015630 3,637.0 0.048611 0.999372 3,625.3
0.052083 36.488144 3,607.4 0.048611 0.289364 3,651.7 0.052083 -0.021451 3,659.3 0.052083 1.827792 3,642.2 0.048611 4.061784 3,636.9 0.052083 1.091680 3,625.2
0.055556 36.432758 3,607.5 0.052083 0.303210 3,651.7 0.055556 -0.016835 3,659.3 0.055556 1.887792 3,642.1 0.052083 4.200246 3,636.8 0.055556 1.147065 3,625.2
0.059028 36.527374 3,607.4 0.055556 0.402441 3,651.6 0.059028 0.033934 3,659.3 0.059028 1.940869 3,642.1 0.055556 4.253323 3,636.7 0.059028 1.243988 3,625.1
0.062500 36.478912 3,607.4 0.059028 0.471671 3,651.5 0.062500 -0.000681 3,659.3 0.062500 2.003177 3,642.0 0.059028 4.368707 3,636.6 0.062500 1.315526 3,625.0
0.065972 36.508911 3,607.4 0.062500 0.476287 3,651.5 0.065972 -0.000681 3,659.3 0.065972 2.056254 3,641.9 0.062500 4.426400 3,636.6 0.065972 1.313219 3,625.0
0.069444 36.580452 3,607.3 0.065972 0.584748 3,651.4 0.069444 0.015472 3,659.3 0.069444 2.107023 3,641.9 0.065972 4.481784 3,636.5 0.069444 1.324757 3,625.0
0.072917 36.688911 3,607.2 0.069444 0.573210 3,651.4 0.073021 0.059319 3,659.2 0.072917 2.157792 3,641.8 0.069444 4.548707 3,636.5 0.072917 1.382449 3,624.9
0.076389 36.806602 3,607.1 0.072917 0.653979 3,651.3 0.076493 0.057011 3,659.2 0.076389 2.231638 3,641.8 0.072917 4.647938 3,636.4 0.076389 1.474757 3,624.8
0.079861 36.647373 3,607.3 0.076389 0.716287 3,651.3 0.079965 0.033934 3,659.3 0.079861 2.273177 3,641.7 0.076389 4.650246 3,636.3 0.079965 1.564757 3,624.7
0.083368 36.778912 3,607.1 0.079861 0.711671 3,651.3 0.083438 0.070857 3,659.2 0.083449 2.317023 3,641.7 0.079931 4.777169 3,636.2 0.083438 1.513988 3,624.8
0.090312 37.895836 3,606.0 0.083449 0.771671 3,651.2 0.090382 0.084703 3,659.2 0.090394 2.409331 3,641.6 0.083403 4.807169 3,636.2 0.090382 1.668603 3,624.6
0.097257 37.900452 3,606.0 0.090394 0.799364 3,651.2 0.097326 0.084703 3,659.2 0.097338 2.510869 3,641.5 0.090347 4.936399 3,636.1 0.097326 1.693988 3,624.6
0.104201 38.121990 3,605.8 0.097338 0.972441 3,651.0 0.104271 -0.060681 3,659.4 0.104282 2.598562 3,641.4 0.097292 5.116400 3,635.9 0.104271 1.843988 3,624.5
0.111147 38.013527 3,605.9 0.104282 1.080902 3,650.9 0.111215 0.050088 3,659.2 0.111227 2.667792 3,641.3 0.104236 5.215631 3,635.8 0.111215 1.998603 3,624.3
0.118091 38.108143 3,605.8 0.111227 1.159364 3,650.8 0.118160 0.057011 3,659.2 0.118171 2.743946 3,641.3 0.111181 5.340246 3,635.7 0.118160 1.931680 3,624.4
0.125035 38.172756 3,605.7 0.118171 1.307056 3,650.7 0.125104 0.047780 3,659.3 0.125116 2.815485 3,641.2 0.118125 5.411784 3,635.6 0.125104 2.077065 3,624.2
0.131979 38.331989 3,605.6 0.125116 1.327825 3,650.7 0.132049 0.068549 3,659.2 0.132060 2.880100 3,641.1 0.125069 5.524861 3,635.5 0.132049 2.139373 3,624.2
0.138924 38.493526 3,605.4 0.132060 1.413210 3,650.6 0.138993 0.077780 3,659.2 0.139005 2.949331 3,641.1 0.132014 5.566400 3,635.4 0.138993 2.210911 3,624.1
0.149340 38.484295 3,605.4 0.139005 1.533210 3,650.5 0.149410 0.075472 3,659.2 0.149421 3.032408 3,641.0 0.138958 5.633323 3,635.4 0.149410 2.416296 3,623.9
0.159757 38.350449 3,605.5 0.149421 1.637056 3,650.4 0.159826 0.022395 3,659.3 0.159838 3.110869 3,640.9 0.149375 5.794861 3,635.2 0.159826 2.510911 3,623.8
0.170174 38.484295 3,605.4 0.159838 1.747825 3,650.3 0.170243 0.082395 3,659.2 0.170255 3.198562 3,640.8 0.159792 5.875630 3,635.1 0.170243 2.476295 3,623.8
0.180590 38.627373 3,605.3 0.170255 1.881671 3,650.1 0.180660 0.031626 3,659.3 0.180671 3.265485 3,640.7 0.170208 5.907938 3,635.1 0.180660 2.713988 3,623.6
0.194479 38.631989 3,605.3 0.180671 1.976287 3,650.0 0.194549 0.061626 3,659.2 0.194560 3.364715 3,640.6 0.180625 6.007169 3,635.0 0.194549 2.843219 3,623.5
0.208368 38.811989 3,605.1 0.194560 2.096287 3,649.9 0.208437 0.070857 3,659.2 0.208449 3.452408 3,640.5 0.194514 6.221784 3,634.8 0.208437 2.877834 3,623.4
0.222257 38.763527 3,605.1 0.208449 2.267056 3,649.7 0.222326 0.103165 3,659.2 0.222338 3.540100 3,640.5 0.208403 6.184861 3,634.8 0.222326 2.986295 3,623.3
0.236146 38.920452 3,605.0 0.222338 2.336287 3,649.7 0.236215 0.054703 3,659.2 0.236227 3.572408 3,640.4 0.222292 6.406400 3,634.6 0.236215 3.247065 3,623.1
0.250035 38.839680 3,605.1 0.236227 2.465518 3,649.5 0.250104 0.057011 3,659.2 0.250116 3.697023 3,640.3 0.236181 6.473323 3,634.5 0.250104 3.251680 3,623.0
0.263924 38.908913 3,605.0 0.250116 2.583210 3,649.4 0.263993 0.027011 3,659.3 0.264005 3.784715 3,640.2 0.250069 6.581784 3,634.4 0.263993 3.427065 3,622.9
0.277812 39.130451 3,604.8 0.264005 2.652441 3,649.3 0.277882 0.066242 3,659.2 0.277894 3.853946 3,640.1 0.263958 6.655631 3,634.3 0.277882 3.463988 3,622.8
0.295174 39.375065 3,604.5 0.277894 2.781671 3,649.2 0.295243 0.073165 3,659.2 0.295255 3.950869 3,640.0 0.277847 6.711015 3,634.3 0.295243 3.683219 3,622.6
0.312535 39.285065 3,604.6 0.295255 2.931671 3,649.1 0.312604 0.036242 3,659.3 0.312616 4.045485 3,640.0 0.295208 6.893322 3,634.1 0.312604 3.747834 3,622.6
0.329896 39.349682 3,604.6 0.312616 3.000902 3,649.0 0.329965 0.073165 3,659.2 0.329977 4.133177 3,639.9 0.312569 6.967169 3,634.0 0.329965 3.883988 3,622.4
0.347257 39.538914 3,604.4 0.329977 3.118594 3,648.9 0.347326 0.093934 3,659.2 0.347338 4.211638 3,639.8 0.329931 7.096400 3,633.9 0.347326 4.006296 3,622.3
0.370405 39.342758 3,604.6 0.347338 3.263979 3,648.7 0.370475 0.063934 3,659.2 0.370486 4.331638 3,639.7 0.347292 7.179477 3,633.8 0.370475 4.140141 3,622.2
0.393553 39.598911 3,604.3 0.370486 3.407056 3,648.6 0.393623 0.084703 3,659.2 0.393634 4.442408 3,639.6 0.370440 7.308707 3,633.7 0.393623 4.333988 3,622.0
0.416701 39.898911 3,604.0 0.393634 3.510902 3,648.5 0.416771 0.077780 3,659.2 0.416782 4.548562 3,639.5 0.393588 7.401015 3,633.6 0.416771 4.453988 3,621.8
0.439965 39.430450 3,604.5 0.416782 3.647056 3,648.4 0.440035 0.066242 3,659.2 0.440046 4.650100 3,639.3 0.416736 7.537169 3,633.5 0.440035 4.562449 3,621.7
0.462998 39.878143 3,604.0 0.440046 3.753210 3,648.2 0.463067 0.061626 3,659.2 0.463079 4.765485 3,639.2 0.440000 7.645630 3,633.4 0.463067 4.772449 3,621.5
G:\102\00279.01\Deliverables\Reports - Specs\Hydrogeologic Testing Report\Rev1\Appendices\AppendixB-Rev1\
App B_2 Dewey Drawdown Data Tables_RevTR 3 of 411/12/2008
Revised July 2010
July 2012J-133
Appendix J

Table B.2-1:
Time and Water Level Data Values Used in Pumping Test Analysis: Dewey Test, Drawdown Data
32-3C 3643.9 GW-49 3652 29-7 3659.3 32-4C 3644.0 32-5 3641.0 32-9C 3626.3
Time (days) Drawdown (ft) Elevation (ft) Time (days) Drawdown (ft) Elevation (ft) Time (days) Drawdown (ft) Elevation (ft) Time (days) Drawdown (ft) Elevation (ft) Time (days) Drawdown (ft) Elevation (ft) Time (days) Drawdown (ft) Elevation (ft)
0.486146 39.965836 3,603.9 0.463079 3.912441 3,648.1 0.486215 0.080088 3,659.2 0.486227 4.857792 3,639.1 0.463032 7.784092 3,633.2 0.486215 4.832449 3,621.5
0.520868 40.173527 3,603.7 0.486227 4.004748 3,648.0 0.520938 0.084703 3,659.2 0.520949 4.970869 3,639.0 0.486181 7.864861 3,633.1 0.520938 5.026296 3,621.3
0.555590 40.101990 3,603.8 0.520949 4.136287 3,647.9 0.555660 0.082395 3,659.2 0.555671 5.095485 3,638.9 0.520903 8.028708 3,633.0 0.555660 5.208603 3,621.1
0.590312 40.249680 3,603.7 0.555671 4.283979 3,647.7 0.590382 0.114703 3,659.2 0.590394 5.213177 3,638.8 0.555625 8.107169 3,632.9 0.590382 5.317065 3,621.0
0.625035 40.685837 3,603.2 0.590394 4.424748 3,647.6 0.625104 0.114703 3,659.2 0.625116 5.337792 3,638.7 0.590347 8.259477 3,632.7 0.625104 5.483219 3,620.8
0.659757 40.494297 3,603.4 0.625116 4.523979 3,647.5 0.659826 0.114703 3,659.2 0.659838 5.420869 3,638.6 0.625069 8.423323 3,632.6 0.659826 5.653988 3,620.6
0.694479 40.639683 3,603.3 0.659838 4.678595 3,647.3 0.694549 0.135472 3,659.2 0.694560 5.522408 3,638.5 0.659792 8.527169 3,632.5 0.694549 5.836296 3,620.5
0.729549 40.833527 3,603.1 0.694560 4.768594 3,647.2 0.729618 0.123934 3,659.2 0.729630 5.635485 3,638.4 0.694514 8.571015 3,632.4 0.729618 5.974757 3,620.3
0.763924 40.755066 3,603.1 0.729630 4.826287 3,647.2 0.763993 0.147011 3,659.2 0.764005 5.700100 3,638.3 0.729583 8.702554 3,632.3 0.763993 6.064757 3,620.2
0.798646 41.034298 3,602.9 0.764005 4.937056 3,647.1 0.798715 0.181626 3,659.1 0.798727 5.808562 3,638.2 0.763958 8.827168 3,632.2 0.798715 6.212450 3,620.1
0.833368 41.082760 3,602.8 0.798727 5.098594 3,646.9 0.833438 0.200088 3,659.1 0.833449 5.947023 3,638.1 0.798681 8.944861 3,632.1 0.833438 6.332449 3,620.0
0.902814 41.218910 3,602.7 0.833449 5.190902 3,646.8 0.902882 0.234703 3,659.1 0.902893 6.161639 3,637.8 0.833403 9.046400 3,632.0 0.902882 6.581680 3,619.7
0.972951 41.555836 3,602.3 0.902893 5.433210 3,646.6 0.973021 0.204703 3,659.1 0.973032 6.307023 3,637.7 0.902847 9.254092 3,631.7 0.973021 6.800911 3,619.5
1.041701 41.576603 3,602.3 0.973032 5.627056 3,646.4 1.041771 0.276242 3,659.0 1.041782 6.487023 3,637.5 0.972986 9.424861 3,631.6 1.041771 6.907065 3,619.4
1.111146 41.629681 3,602.3 1.041782 5.779364 3,646.2 1.111215 0.310857 3,659.0 1.111227 6.620869 3,637.4 1.041736 9.572554 3,631.4 1.111215 7.170142 3,619.1
1.180590 41.911221 3,602.0 1.111227 5.890133 3,646.1 1.180660 0.340857 3,659.0 1.180671 6.722408 3,637.3 1.111181 9.699476 3,631.3 1.180660 7.343219 3,619.0
1.250035 41.809681 3,602.1 1.180671 6.007825 3,646.0 1.250104 0.391626 3,658.9 1.250116 6.844716 3,637.2 1.180625 9.821784 3,631.2 1.250104 7.516295 3,618.8
1.319479 41.920452 3,602.0 1.250116 6.148594 3,645.9 1.319549 0.417011 3,658.9 1.319560 7.010870 3,637.0 1.250069 10.041015 3,631.0 1.319549 7.650142 3,618.6
1.388924 42.229683 3,601.7 1.319560 6.298594 3,645.7 1.388993 0.430857 3,658.9 1.389005 7.167792 3,636.8 1.319514 10.024861 3,631.0 1.388993 7.786295 3,618.5
1.493090 42.545834 3,601.4 1.389005 6.467056 3,645.5 1.493160 0.463165 3,658.8 1.493171 7.389331 3,636.6 1.388958 10.255630 3,630.7 1.493160 8.090911 3,618.2
1.597257 42.432758 3,601.5 1.493171 6.704748 3,645.3 1.597326 0.557780 3,658.7 1.597338 7.603946 3,636.4 1.493125 10.532554 3,630.5 1.597326 8.335526 3,618.0
1.701424 42.813526 3,601.1 1.597338 6.898594 3,645.1 1.701493 0.580857 3,658.7 1.701505 7.770100 3,636.2 1.597292 10.733323 3,630.3 1.701493 8.522449 3,617.8
1.805590 42.917374 3,601.0 1.701505 7.087825 3,644.9 1.805660 0.627011 3,658.7 1.805671 7.989331 3,636.0 1.701458 10.841784 3,630.2 1.805660 8.739372 3,617.6
1.944479 44.018143 3,599.9 1.805671 7.272440 3,644.7 1.944549 0.735472 3,658.6 1.944560 8.307793 3,635.7 1.805625 11.028708 3,630.0 1.944549 9.013988 3,617.3
2.083368 44.029682 3,599.9 1.944560 7.604748 3,644.4 2.083437 0.830088 3,658.5 2.083449 8.510869 3,635.5 1.944514 11.467169 3,629.5 2.083437 9.277064 3,617.0
2.222257 44.138142 3,599.8 2.083449 7.805518 3,644.2 2.222326 0.807011 3,658.5 2.222338 8.670100 3,635.3 2.083403 11.667938 3,629.3 2.222326 9.452450 3,616.8
2.361146 44.244297 3,599.7 2.222338 7.997056 3,644.0 2.361215 0.996242 3,658.3 2.361227 8.845485 3,635.2 2.222292 11.787938 3,629.2 2.361215 9.558603 3,616.7
2.500035 44.426605 3,599.5 2.361227 8.121672 3,643.9 2.500104 1.086242 3,658.2 2.500116 9.090100 3,634.9 2.361181 11.997938 3,629.0 2.500104 9.870142 3,616.4
2.638924 44.592758 3,599.3 2.500116 8.357056 3,643.6 2.638993 1.217780 3,658.1 2.639005 9.244716 3,634.8 2.500070 12.251784 3,628.7 2.638993 10.087065 3,616.2
2.777813 44.657372 3,599.2 2.639005 8.516287 3,643.5 2.777882 1.210857 3,658.1 2.777894 9.413177 3,634.6 2.638958 12.422553 3,628.6 2.777882 10.220911 3,616.1
2.951423 44.666603 3,599.2 2.777894 8.696287 3,643.3 2.951493 1.381626 3,657.9 2.951505 9.646254 3,634.4 2.777847 12.574862 3,628.4 2.951493 10.474757 3,615.8
3.083843 44.781990 3,599.1 2.951505 8.933979 3,643.1 3.083843 1.480857 3,657.8 3.083843 9.766253 3,634.2 2.951458 12.708707 3,628.3 3.083843 10.599373 3,615.7
3.083843 9.033210 3,643.0 3.083843 12.953322 3,628.0
General Methodology: PSI, temperature, and time readings from Win-SituTM
digital data log were exported to Excel ".csv" file.
Drawdown was calculated as PSI at time after pumping minus average PSI before pumping; therefore, at small or zero changes
in PSI negative drawdowns may be calculated.
A FORTRAN program was written to read the ".csv" file and produce a second file by extracting the records at a frequency of 40
per log-time cycle (in minutes) in order achieve equal representation of data throughout the pumping and drawdown phases of the test.
Elevation (in ft above mean sea level) based on initial groundwater elevation (see Table 4.2) minus drawdown.
G:\102\00279.01\Deliverables\Reports - Specs\Hydrogeologic Testing Report\Rev1\Appendices\AppendixB-Rev1\
App B_2 Dewey Drawdown Data Tables_RevTR 4 of 411/12/2008
Revised July 2010
July 2012J-134
Appendix J

Knight Piesold CONaULTING
Appendix 8-3 Time and Water Level Data Values Used in Pumping Test
Analysis: Dewey Test, Recovery Data
July 2012 J-135 Appendix J

Table B.3-1:
Time and Water Level Data Values Used in Pumping Test Analysis: Dewey Test, Recovery Data
32-3C 3643.9 GW-49 3652 32-4C 3644.0 32-5 3641.0 32-9C 3626.3
Time (days) Drawdown (ft) Elevation (ft) Time (days) Drawdown (ft) Elevation (ft) Time (days) Drawdown (ft) Elevation (ft) Time (days) Drawdown (ft) Elevation (ft) Time (days) Drawdown (ft) Elevation (ft)
3.083866 42.133311 3,601.8 3.083866 9.035518 3,643.0 3.083889 9.763947 3,634.2 3.083866 12.934861 3,628.1 3.083889 10.606296 3,615.7
3.083877 41.493441 3,602.4 3.083877 9.053979 3,642.9 3.083901 9.766253 3,634.2 3.083877 12.930245 3,628.1 3.083901 10.603988 3,615.7
3.083889 40.624881 3,603.3 3.083889 9.042440 3,643.0 3.083912 9.775485 3,634.2 3.083889 12.925631 3,628.1 3.083912 10.557834 3,615.7
3.083901 39.645441 3,604.3 3.083901 9.063210 3,642.9 3.083924 9.770869 3,634.2 3.083901 12.904861 3,628.1 3.083924 10.585526 3,615.7
3.083912 38.712201 3,605.2 3.083912 9.148595 3,642.9 3.083935 9.768561 3,634.2 3.083912 12.907168 3,628.1 3.083935 10.594757 3,615.7
3.083924 37.792821 3,606.1 3.083924 9.053979 3,642.9 3.083947 9.759331 3,634.2 3.083924 12.914092 3,628.1 3.083947 10.615526 3,615.7
3.083935 36.931191 3,607.0 3.083935 9.058595 3,642.9 3.083958 9.768561 3,634.2 3.083935 12.909476 3,628.1 3.083958 10.564757 3,615.7
3.083947 36.228951 3,607.7 3.083947 9.060902 3,642.9 3.083970 9.768561 3,634.2 3.083947 12.946400 3,628.1 3.083970 10.567065 3,615.7
3.083958 35.328051 3,608.6 3.083958 9.060902 3,642.9 3.083981 9.773177 3,634.2 3.083958 12.918707 3,628.1 3.083981 10.562449 3,615.7
3.083970 34.549581 3,609.4 3.083970 9.028594 3,643.0 3.083993 9.770869 3,634.2 3.083970 12.897938 3,628.1 3.083993 10.638603 3,615.7
3.083982 33.812691 3,610.1 3.083981 9.056287 3,642.9 3.084005 9.775485 3,634.2 3.083981 12.895631 3,628.1 3.084005 10.583219 3,615.7
3.083993 33.055011 3,610.8 3.083993 9.157825 3,642.8 3.084016 9.766253 3,634.2 3.083993 12.944092 3,628.1 3.084016 10.640911 3,615.7
3.084005 32.371251 3,611.5 3.084005 9.042440 3,643.0 3.084028 9.775485 3,634.2 3.084005 12.946400 3,628.1 3.084028 10.525526 3,615.8
3.084016 31.673631 3,612.2 3.084016 9.033210 3,643.0 3.084039 9.768561 3,634.2 3.084016 12.914092 3,628.1 3.084039 10.594757 3,615.7
3.084028 30.980631 3,612.9 3.084028 9.049364 3,643.0 3.084051 9.759331 3,634.2 3.084028 12.955630 3,628.0 3.084051 10.617834 3,615.7
3.084039 30.350001 3,613.5 3.084039 9.051671 3,642.9 3.084062 9.770869 3,634.2 3.084039 12.897938 3,628.1 3.084062 10.666296 3,615.6
3.084051 29.723991 3,614.2 3.084051 9.063210 3,642.9 3.084074 9.770869 3,634.2 3.084051 12.914092 3,628.1 3.084074 10.580911 3,615.7
3.084063 29.162661 3,614.7 3.084062 9.063210 3,642.9 3.084086 9.766253 3,634.2 3.084062 12.909476 3,628.1 3.084086 10.601680 3,615.7
3.084074 28.545891 3,615.4 3.084074 9.051671 3,642.9 3.084097 9.763947 3,634.2 3.084074 12.921015 3,628.1 3.084097 10.599373 3,615.7
3.084086 27.984561 3,615.9 3.084086 9.012441 3,643.0 3.084109 9.770869 3,634.2 3.084086 12.964861 3,628.0 3.084109 10.555527 3,615.7
3.084097 27.448641 3,616.5 3.084097 9.047056 3,643.0 3.084120 9.770869 3,634.2 3.084097 12.939477 3,628.1 3.084120 10.583219 3,615.7
3.084109 26.901171 3,617.0 3.084109 9.028594 3,643.0 3.084132 9.775485 3,634.2 3.084109 12.909476 3,628.1 3.084132 10.562449 3,615.7
3.084120 26.367561 3,617.5 3.084120 9.056287 3,642.9 3.084143 9.761639 3,634.2 3.084120 12.930245 3,628.1 3.084143 10.606296 3,615.7
3.084132 25.877841 3,618.0 3.084132 9.065517 3,642.9 3.084155 9.773177 3,634.2 3.084132 12.891015 3,628.1 3.084155 10.599373 3,615.7
3.084143 25.432011 3,618.5 3.084143 9.051671 3,642.9 3.084167 9.773177 3,634.2 3.084143 12.897938 3,628.1 3.084167 10.599373 3,615.7
3.084155 25.004661 3,618.9 3.084155 9.040133 3,643.0 3.084178 9.773177 3,634.2 3.084155 12.934861 3,628.1 3.084178 10.590141 3,615.7
3.084167 24.496461 3,619.4 3.084167 9.132441 3,642.9 3.084190 9.761639 3,634.2 3.084167 12.897938 3,628.1 3.084190 10.583219 3,615.7
3.084178 24.161511 3,619.7 3.084178 9.012441 3,643.0 3.084201 9.775485 3,634.2 3.084178 12.897938 3,628.1 3.084201 10.578603 3,615.7
3.084190 23.711061 3,620.2 3.084190 9.051671 3,642.9 3.084213 9.768561 3,634.2 3.084190 12.951015 3,628.0 3.084213 10.585526 3,615.7
3.084201 23.359941 3,620.5 3.084201 9.035518 3,643.0 3.084224 9.757023 3,634.2 3.084201 12.916400 3,628.1 3.084224 10.585526 3,615.7
3.084213 22.955691 3,620.9 3.084213 9.063210 3,642.9 3.084236 9.761639 3,634.2 3.084213 12.925631 3,628.1 3.084236 10.606296 3,615.7
3.084224 22.567611 3,621.3 3.084224 9.077056 3,642.9 3.084248 9.768561 3,634.2 3.084224 12.930245 3,628.1 3.084248 10.583219 3,615.7
3.084236 22.262691 3,621.6 3.084236 9.042440 3,643.0 3.084259 9.754716 3,634.2 3.084236 12.918707 3,628.1 3.084259 10.583219 3,615.7
3.084248 21.946221 3,622.0 3.084248 9.047056 3,643.0 3.084282 9.766253 3,634.2 3.084248 12.893323 3,628.1 3.084282 10.597065 3,615.7
3.084271 21.320211 3,622.6 3.084259 9.047056 3,643.0 3.084317 9.773177 3,634.2 3.084259 12.893323 3,628.1 3.084317 10.592449 3,615.7
3.084305 20.518641 3,623.4 3.084282 9.049364 3,643.0 3.084329 9.766253 3,634.2 3.084282 12.937169 3,628.1 3.084329 10.601680 3,615.7
3.084317 20.299191 3,623.6 3.084317 9.067825 3,642.9 3.084352 9.763947 3,634.2 3.084317 12.900246 3,628.1 3.084352 10.603988 3,615.7
3.084340 19.844121 3,624.1 3.084329 9.065517 3,642.9 3.084363 9.759331 3,634.2 3.084329 12.886399 3,628.1 3.084363 10.622449 3,615.7
3.084352 19.626981 3,624.3 3.084352 9.044748 3,643.0 3.084387 9.766253 3,634.2 3.084352 12.895631 3,628.1 3.084387 10.594757 3,615.7
3.084375 19.225041 3,624.7 3.084363 9.035518 3,643.0 3.084398 9.775485 3,634.2 3.084363 12.909476 3,628.1 3.084398 10.564757 3,615.7
3.084386 19.079511 3,624.8 3.084387 9.023979 3,643.0 3.084421 9.770869 3,634.2 3.084387 12.930245 3,628.1 3.084421 10.578603 3,615.7
3.084410 18.739941 3,625.2 3.084398 9.047056 3,643.0 3.084456 9.766253 3,634.2 3.084398 12.918707 3,628.1 3.084456 10.606296 3,615.7
3.084444 18.402681 3,625.5 3.084421 9.141671 3,642.9 3.084491 9.770869 3,634.2 3.084421 12.925631 3,628.1 3.084491 10.583219 3,615.7
3.084479 18.125481 3,625.8 3.084456 9.040133 3,643.0 3.084526 9.766253 3,634.2 3.084456 12.930245 3,628.1 3.084526 10.578603 3,615.7
3.084514 17.938371 3,626.0 3.084491 9.063210 3,642.9 3.084560 9.780100 3,634.2 3.084491 12.914092 3,628.1 3.084560 10.599373 3,615.7
3.084549 17.758191 3,626.1 3.084526 9.063210 3,642.9 3.084595 9.757023 3,634.2 3.084526 12.879477 3,628.1 3.084595 10.585526 3,615.7
3.084583 17.649621 3,626.3 3.084560 9.125518 3,642.9 3.084630 9.763947 3,634.2 3.084560 12.932553 3,628.1 3.084630 10.567065 3,615.7
3.084618 17.520261 3,626.4 3.084595 9.058595 3,642.9 3.084664 9.761639 3,634.2 3.084595 12.932553 3,628.1 3.084664 10.597065 3,615.7
3.084653 17.388591 3,626.5 3.084630 9.033210 3,643.0 3.084699 9.766253 3,634.2 3.084630 12.925631 3,628.1 3.084699 10.601680 3,615.7
G:\102\00279.01\Deliverables\Reports - Specs\Hydrogeologic Testing Report\Rev1\Appendices\AppendixB-Rev1\
App B_3 Dewey Recovery Data Tables_RevTR 1 of 411/12/2008
Revised July 2010
July 2012J-136
Appendix J

Table B.3-1:
Time and Water Level Data Values Used in Pumping Test Analysis: Dewey Test, Recovery Data
32-3C 3643.9 GW-49 3652 32-4C 3644.0 32-5 3641.0 32-9C 3626.3
Time (days) Drawdown (ft) Elevation (ft) Time (days) Drawdown (ft) Elevation (ft) Time (days) Drawdown (ft) Elevation (ft) Time (days) Drawdown (ft) Elevation (ft) Time (days) Drawdown (ft) Elevation (ft)
3.084688 17.256921 3,626.6 3.084664 9.056287 3,642.9 3.084769 9.766253 3,634.2 3.084664 12.867938 3,628.1 3.084769 10.587834 3,615.7
3.084757 17.035161 3,626.9 3.084699 9.153210 3,642.8 3.084838 9.770869 3,634.2 3.084699 12.909476 3,628.1 3.084838 10.592449 3,615.7
3.084826 16.811091 3,627.1 3.084769 9.077056 3,642.9 3.084907 9.750100 3,634.2 3.084769 12.934861 3,628.1 3.084907 10.599373 3,615.7
3.084896 16.531581 3,627.4 3.084838 9.033210 3,643.0 3.084977 9.754716 3,634.2 3.084838 12.902554 3,628.1 3.084977 10.624757 3,615.7
3.084965 16.325991 3,627.6 3.084907 9.021671 3,643.0 3.085046 9.768561 3,634.2 3.084907 12.851785 3,628.1 3.085046 10.590141 3,615.7
3.085035 16.078821 3,627.8 3.084977 9.042440 3,643.0 3.085116 9.770869 3,634.2 3.084977 12.851785 3,628.1 3.085116 10.583219 3,615.7
3.085104 15.880161 3,628.0 3.085046 9.077056 3,642.9 3.085185 9.768561 3,634.2 3.085046 12.886399 3,628.1 3.085185 10.594757 3,615.7
3.085173 15.803931 3,628.1 3.085116 9.053979 3,642.9 3.085255 9.770869 3,634.2 3.085116 12.844861 3,628.2 3.085255 10.594757 3,615.7
3.085243 15.519801 3,628.4 3.085185 9.074748 3,642.9 3.085359 9.757023 3,634.2 3.085185 12.835630 3,628.2 3.085359 10.610911 3,615.7
3.085347 15.348861 3,628.6 3.085255 9.056287 3,642.9 3.085463 9.752408 3,634.2 3.085255 12.807938 3,628.2 3.085463 10.578603 3,615.7
3.085452 15.247221 3,628.7 3.085359 9.023979 3,643.0 3.085567 9.770869 3,634.2 3.085359 12.796400 3,628.2 3.085567 10.606296 3,615.7
3.085556 15.161751 3,628.7 3.085463 9.033210 3,643.0 3.085671 9.752408 3,634.2 3.085463 12.773323 3,628.2 3.085671 10.617834 3,615.7
3.085660 15.032391 3,628.9 3.085567 9.053979 3,642.9 3.085810 9.752408 3,634.2 3.085567 12.731784 3,628.3 3.085810 10.583219 3,615.7
3.085798 14.916891 3,629.0 3.085671 9.056287 3,642.9 3.085961 9.747792 3,634.3 3.085671 12.674092 3,628.3 3.085961 10.608603 3,615.7
3.085939 14.775981 3,629.1 3.085810 9.040133 3,643.0 3.086088 9.747792 3,634.3 3.085810 12.641785 3,628.4 3.086088 10.633987 3,615.7
3.086076 14.782911 3,629.1 3.085961 9.040133 3,643.0 3.086227 9.740870 3,634.3 3.085961 12.584092 3,628.4 3.086227 10.594757 3,615.7
3.086215 14.810631 3,629.1 3.086088 9.047056 3,643.0 3.086366 9.736254 3,634.3 3.086088 12.537938 3,628.5 3.086366 10.615526 3,615.7
3.086354 14.764431 3,629.1 3.086227 9.021671 3,643.0 3.086505 9.731639 3,634.3 3.086227 12.524092 3,628.5 3.086505 10.627065 3,615.7
3.086493 14.688201 3,629.2 3.086366 9.037826 3,643.0 3.086643 9.729331 3,634.3 3.086366 12.475631 3,628.5 3.086643 10.647834 3,615.7
3.086632 14.623521 3,629.3 3.086505 9.104749 3,642.9 3.086817 9.715485 3,634.3 3.086505 12.429477 3,628.6 3.086817 10.592449 3,615.7
3.086806 14.563461 3,629.3 3.086643 9.042440 3,643.0 3.086991 9.703946 3,634.3 3.086643 12.392553 3,628.6 3.086991 10.599373 3,615.7
3.086979 14.586561 3,629.3 3.086817 9.049364 3,643.0 3.087164 9.703946 3,634.3 3.086817 12.314092 3,628.7 3.087164 10.643219 3,615.7
3.087153 14.496471 3,629.4 3.086991 9.146287 3,642.9 3.087338 9.687793 3,634.3 3.086991 12.321015 3,628.7 3.087338 10.654757 3,615.6
3.087327 14.461821 3,629.4 3.087164 9.058595 3,642.9 3.087570 9.690100 3,634.3 3.087164 12.212553 3,628.8 3.087570 10.622449 3,615.7
3.087558 14.415621 3,629.5 3.087338 9.017056 3,643.0 3.087801 9.667023 3,634.3 3.087338 12.175631 3,628.8 3.087801 10.645526 3,615.7
3.087789 14.350941 3,629.5 3.087570 9.049364 3,643.0 3.088032 9.662408 3,634.3 3.087570 12.117938 3,628.9 3.088032 10.622449 3,615.7
3.088021 14.281641 3,629.6 3.087801 9.060902 3,642.9 3.088264 9.662408 3,634.3 3.087801 12.051015 3,628.9 3.088264 10.615526 3,615.7
3.088252 14.244681 3,629.7 3.088032 9.030902 3,643.0 3.088495 9.639331 3,634.4 3.088032 12.014091 3,629.0 3.088495 10.622449 3,615.7
3.088484 14.184621 3,629.7 3.088264 9.113979 3,642.9 3.088727 9.630100 3,634.4 3.088264 11.949476 3,629.1 3.088727 10.622449 3,615.7
3.088715 14.205411 3,629.7 3.088495 9.044748 3,643.0 3.089074 9.600101 3,634.4 3.088495 11.887169 3,629.1 3.089074 10.594757 3,615.7
3.089062 14.032161 3,629.9 3.088727 9.035518 3,643.0 3.089421 9.600101 3,634.4 3.088727 11.864092 3,629.1 3.089421 10.599373 3,615.7
3.089410 14.025231 3,629.9 3.089074 9.060902 3,642.9 3.089768 9.570100 3,634.4 3.089074 11.815630 3,629.2 3.089768 10.576296 3,615.7
3.089757 13.847361 3,630.1 3.089421 9.051671 3,642.9 3.090116 9.558561 3,634.4 3.089421 11.762553 3,629.2 3.090116 10.580911 3,615.7
3.090104 12.685431 3,631.2 3.089768 9.042440 3,643.0 3.090463 9.535484 3,634.5 3.089768 11.658708 3,629.3 3.090463 10.615526 3,615.7
3.090451 12.315831 3,631.6 3.090116 9.047056 3,643.0 3.090810 9.512407 3,634.5 3.090116 11.617168 3,629.4 3.090810 10.594757 3,615.7
3.090799 12.163371 3,631.7 3.090463 9.040133 3,643.0 3.091157 9.500870 3,634.5 3.090463 11.511015 3,629.5 3.091157 10.587834 3,615.7
3.091146 12.066351 3,631.8 3.090810 9.100133 3,642.9 3.091505 9.473177 3,634.5 3.090810 11.492554 3,629.5 3.091505 10.585526 3,615.7
3.091493 11.960091 3,631.9 3.091157 9.060902 3,642.9 3.091852 9.459331 3,634.5 3.091157 11.439477 3,629.6 3.091852 10.567065 3,615.7
3.091840 12.001671 3,631.9 3.091505 9.063210 3,642.9 3.092199 9.440869 3,634.6 3.091505 11.342553 3,629.7 3.092199 10.562449 3,615.7
3.092187 11.782221 3,632.1 3.091852 9.058595 3,642.9 3.092893 9.413177 3,634.6 3.091852 11.296400 3,629.7 3.092893 10.530142 3,615.8
3.092882 11.675961 3,632.2 3.092199 9.060902 3,642.9 3.093588 9.364716 3,634.6 3.092199 11.261785 3,629.7 3.093588 10.520911 3,615.8
3.093576 11.574321 3,632.3 3.092893 9.042440 3,643.0 3.094282 9.337023 3,634.7 3.092893 11.178707 3,629.8 3.094282 10.490911 3,615.8
3.094271 11.470371 3,632.4 3.093588 9.067825 3,642.9 3.094977 9.295485 3,634.7 3.093588 11.049477 3,630.0 3.094977 10.453988 3,615.8
3.094965 11.331771 3,632.6 3.094282 9.072440 3,642.9 3.095683 9.256254 3,634.7 3.094282 10.952554 3,630.0 3.095683 10.488604 3,615.8
3.095671 11.375661 3,632.5 3.094977 9.056287 3,642.9 3.096366 9.233177 3,634.8 3.094977 10.869476 3,630.1 3.096366 10.414757 3,615.9
3.096354 11.204721 3,632.7 3.095683 9.023979 3,643.0 3.097060 9.189331 3,634.8 3.095683 10.823322 3,630.2 3.097060 10.382449 3,615.9
3.097049 11.160831 3,632.7 3.096366 9.056287 3,642.9 3.097755 9.161638 3,634.8 3.096366 10.703322 3,630.3 3.097755 10.363988 3,615.9
3.097743 11.103081 3,632.8 3.097060 9.030902 3,643.0 3.098796 9.108562 3,634.9 3.097060 10.613322 3,630.4 3.098796 10.373219 3,615.9
3.098785 11.001441 3,632.9 3.097755 9.049364 3,643.0 3.099838 9.073946 3,634.9 3.097755 10.592553 3,630.4 3.099838 10.292449 3,616.0
G:\102\00279.01\Deliverables\Reports - Specs\Hydrogeologic Testing Report\Rev1\Appendices\AppendixB-Rev1\
App B_3 Dewey Recovery Data Tables_RevTR 2 of 411/12/2008
Revised July 2010
July 2012J-137
Appendix J

Table B.3-1:
Time and Water Level Data Values Used in Pumping Test Analysis: Dewey Test, Recovery Data
32-3C 3643.9 GW-49 3652 32-4C 3644.0 32-5 3641.0 32-9C 3626.3
Time (days) Drawdown (ft) Elevation (ft) Time (days) Drawdown (ft) Elevation (ft) Time (days) Drawdown (ft) Elevation (ft) Time (days) Drawdown (ft) Elevation (ft) Time (days) Drawdown (ft) Elevation (ft)
3.099826 10.885941 3,633.0 3.098796 9.148595 3,642.9 3.100880 9.013947 3,635.0 3.098796 10.463323 3,630.5 3.100880 10.287834 3,616.0
3.100868 10.761201 3,633.1 3.099838 9.118594 3,642.9 3.101921 8.970100 3,635.0 3.099838 10.435631 3,630.6 3.101921 10.225526 3,616.1
3.101910 10.719621 3,633.2 3.100880 9.070133 3,642.9 3.103310 8.910100 3,635.1 3.100880 10.322554 3,630.7 3.103310 10.264757 3,616.0
3.103299 10.511721 3,633.4 3.101921 9.017056 3,643.0 3.104699 8.857023 3,635.1 3.101921 10.255630 3,630.7 3.104699 10.188603 3,616.1
3.104687 10.403151 3,633.5 3.103310 9.123210 3,642.9 3.106088 8.808561 3,635.2 3.103310 10.119476 3,630.9 3.106088 10.147065 3,616.2
3.106076 10.289961 3,633.6 3.104699 9.047056 3,643.0 3.107477 8.762407 3,635.2 3.104699 10.043323 3,631.0 3.107477 10.093987 3,616.2
3.107465 10.206801 3,633.7 3.106088 9.026287 3,643.0 3.108866 8.713946 3,635.3 3.106088 9.957938 3,631.0 3.108866 10.070910 3,616.2
3.108854 10.116711 3,633.8 3.107477 8.998594 3,643.0 3.110255 8.658562 3,635.3 3.107477 9.946400 3,631.1 3.110255 10.063988 3,616.2
3.110243 9.950391 3,633.9 3.108866 9.095517 3,642.9 3.111643 8.628562 3,635.4 3.108866 9.780246 3,631.2 3.111643 10.031680 3,616.3
3.111632 9.878781 3,634.0 3.110255 8.989364 3,643.0 3.113380 8.563946 3,635.4 3.110255 9.717938 3,631.3 3.113380 10.001680 3,616.3
3.113368 9.719391 3,634.2 3.111643 8.970902 3,643.0 3.115116 8.520100 3,635.5 3.111643 9.648707 3,631.4 3.115116 9.946296 3,616.4
3.115104 9.532281 3,634.4 3.113380 9.074748 3,642.9 3.116852 8.462408 3,635.5 3.113380 9.561015 3,631.4 3.116852 9.893219 3,616.4
3.116840 9.310521 3,634.6 3.115116 9.012441 3,643.0 3.118588 8.402408 3,635.6 3.115116 9.473323 3,631.5 3.118588 9.851680 3,616.4
3.118576 9.218121 3,634.7 3.116852 8.963979 3,643.0 3.120903 8.344715 3,635.7 3.116852 9.447938 3,631.6 3.120903 9.807834 3,616.5
3.120891 9.091071 3,634.8 3.118588 9.047056 3,643.0 3.123217 8.287024 3,635.7 3.118588 9.339477 3,631.7 3.123217 9.782450 3,616.5
3.123206 9.116481 3,634.8 3.120903 9.014749 3,643.0 3.125532 8.243177 3,635.8 3.120903 9.277169 3,631.7 3.125532 9.720141 3,616.6
3.125521 8.975571 3,634.9 3.123217 8.959364 3,643.0 3.127847 8.173946 3,635.8 3.123217 9.147938 3,631.9 3.127847 9.676295 3,616.6
3.127836 8.890101 3,635.0 3.125532 8.846287 3,643.2 3.130162 8.123177 3,635.9 3.125532 9.067169 3,631.9 3.130162 9.680911 3,616.6
3.130150 8.834661 3,635.1 3.127847 8.825518 3,643.2 3.132477 8.077024 3,635.9 3.127847 9.011785 3,632.0 3.132477 9.648603 3,616.7
3.132465 8.751501 3,635.1 3.130162 8.807055 3,643.2 3.135949 8.007792 3,636.0 3.130162 8.935631 3,632.1 3.135949 9.521680 3,616.8
3.135937 8.700681 3,635.2 3.132477 8.848595 3,643.2 3.139421 7.938561 3,636.1 3.132477 8.887169 3,632.1 3.139421 9.477834 3,616.8
3.139410 8.594421 3,635.3 3.135949 8.721671 3,643.3 3.142893 7.878561 3,636.1 3.135949 8.790246 3,632.2 3.142893 9.431680 3,616.9
3.142882 8.522811 3,635.4 3.139421 8.788594 3,643.2 3.146366 7.825485 3,636.2 3.139421 8.695630 3,632.3 3.146366 9.380911 3,616.9
3.146354 8.435031 3,635.5 3.142893 8.640903 3,643.4 3.149838 7.765485 3,636.2 3.142893 8.603323 3,632.4 3.149838 9.290911 3,617.0
3.149826 8.405001 3,635.5 3.146366 8.564748 3,643.4 3.153310 7.707792 3,636.3 3.146366 8.541015 3,632.5 3.153310 9.265527 3,617.0
3.153299 8.287191 3,635.6 3.149838 8.550902 3,643.4 3.156782 7.661639 3,636.3 3.149838 8.448708 3,632.6 3.156782 9.203218 3,617.1
3.156771 8.217891 3,635.7 3.153310 8.493210 3,643.5 3.160301 7.615485 3,636.4 3.153310 8.377169 3,632.6 3.160255 9.131680 3,617.2
3.160243 8.190171 3,635.7 3.156829 8.467825 3,643.5 3.163773 7.569331 3,636.4 3.156782 8.351784 3,632.6 3.163762 9.136295 3,617.2
3.163715 8.109321 3,635.8 3.160301 8.456286 3,643.5 3.167361 7.523177 3,636.5 3.160255 8.268707 3,632.7 3.167350 9.071680 3,617.2
3.167268 8.042331 3,635.9 3.163773 8.370902 3,643.6 3.174421 7.435485 3,636.6 3.163727 8.229477 3,632.8 3.174410 8.947064 3,617.4
3.174329 7.991511 3,635.9 3.167361 8.366286 3,643.6 3.181250 7.345485 3,636.7 3.167315 8.079476 3,632.9 3.181238 8.877834 3,617.4
3.181157 7.859841 3,636.0 3.174421 8.211671 3,643.8 3.188194 7.283177 3,636.7 3.174375 8.051785 3,632.9 3.188183 8.697834 3,617.6
3.188102 7.746651 3,636.2 3.181250 8.133210 3,643.9 3.195139 7.202408 3,636.8 3.181204 7.917938 3,633.1 3.195127 8.686296 3,617.6
3.195046 7.614981 3,636.3 3.188194 8.057055 3,643.9 3.202083 7.091639 3,636.9 3.188148 7.804861 3,633.2 3.202072 8.637834 3,617.7
3.201991 7.612671 3,636.3 3.195139 7.948595 3,644.1 3.209028 7.057023 3,636.9 3.195092 7.744861 3,633.3 3.209016 8.547834 3,617.8
3.208935 7.501791 3,636.4 3.202083 7.874748 3,644.1 3.215972 6.999331 3,637.0 3.202037 7.645630 3,633.4 3.215961 8.473988 3,617.8
3.215880 7.404771 3,636.5 3.209028 7.752440 3,644.2 3.222917 6.932408 3,637.1 3.208981 7.583323 3,633.4 3.222905 8.377065 3,617.9
3.222824 7.360881 3,636.5 3.215972 7.724748 3,644.3 3.233333 6.840100 3,637.2 3.215926 7.502553 3,633.5 3.233322 8.268603 3,618.0
3.233241 7.215351 3,636.7 3.222917 7.625517 3,644.4 3.243750 6.773177 3,637.2 3.222870 7.449477 3,633.6 3.243738 8.171680 3,618.1
3.243657 7.150671 3,636.7 3.233333 7.526287 3,644.5 3.254167 6.715485 3,637.3 3.233287 7.225630 3,633.8 3.254155 8.056295 3,618.2
3.254074 7.060581 3,636.8 3.243750 7.408595 3,644.6 3.264583 6.641639 3,637.4 3.243704 7.188707 3,633.8 3.264572 7.980142 3,618.3
3.264491 6.986661 3,636.9 3.254167 7.297825 3,644.7 3.278472 6.540100 3,637.5 3.254120 7.114861 3,633.9 3.278461 7.827834 3,618.5
3.278380 6.873471 3,637.0 3.264583 7.189363 3,644.8 3.292361 6.457023 3,637.5 3.264537 6.939476 3,634.1 3.292350 7.747065 3,618.6
3.292268 6.755661 3,637.1 3.278472 7.041671 3,645.0 3.306250 6.392408 3,637.6 3.278426 6.918707 3,634.1 3.306238 7.645526 3,618.7
3.306157 6.684051 3,637.2 3.292361 6.960902 3,645.0 3.320139 6.270100 3,637.7 3.292315 6.798707 3,634.2 3.320127 7.509372 3,618.8
3.320046 6.575481 3,637.3 3.306250 6.866287 3,645.1 3.334028 6.203177 3,637.8 3.306204 6.701784 3,634.3 3.334016 7.451680 3,618.8
3.333935 6.462291 3,637.4 3.320139 6.737056 3,645.3 3.347917 6.122408 3,637.9 3.320092 6.600246 3,634.4 3.347905 7.264757 3,619.0
3.347824 6.448431 3,637.5 3.334028 6.633210 3,645.4 3.361806 6.062408 3,637.9 3.333981 6.503323 3,634.5 3.361794 7.234757 3,619.1
3.361713 6.295971 3,637.6 3.347917 6.524748 3,645.5 3.379167 6.025485 3,638.0 3.347870 6.369476 3,634.6 3.379155 7.123988 3,619.2
G:\102\00279.01\Deliverables\Reports - Specs\Hydrogeologic Testing Report\Rev1\Appendices\AppendixB-Rev1\
App B_3 Dewey Recovery Data Tables_RevTR 3 of 411/12/2008
Revised July 2010
July 2012J-138
Appendix J

Table B.3-1:
Time and Water Level Data Values Used in Pumping Test Analysis: Dewey Test, Recovery Data
32-3C 3643.9 GW-49 3652 32-4C 3644.0 32-5 3641.0 32-9C 3626.3
Time (days) Drawdown (ft) Elevation (ft) Time (days) Drawdown (ft) Elevation (ft) Time (days) Drawdown (ft) Elevation (ft) Time (days) Drawdown (ft) Elevation (ft) Time (days) Drawdown (ft) Elevation (ft)
3.379074 6.265941 3,637.6 3.361806 6.471671 3,645.5 3.396528 5.949331 3,638.1 3.361759 6.327938 3,634.7 3.396516 7.024757 3,619.3
3.396435 6.166611 3,637.7 3.379167 6.328594 3,645.7 3.413889 5.889331 3,638.1 3.379120 6.270246 3,634.7 3.413877 6.925526 3,619.4
3.413796 6.023391 3,637.9 3.396528 6.284748 3,645.7 3.431250 5.817792 3,638.2 3.396481 6.159477 3,634.8 3.431238 6.793988 3,619.5
3.431157 6.060351 3,637.8 3.413889 6.167056 3,645.8 3.454398 5.750869 3,638.2 3.413842 6.083323 3,634.9 3.454387 6.690142 3,619.6
3.454306 5.935611 3,638.0 3.431250 6.081671 3,645.9 3.477546 5.667792 3,638.3 3.431204 6.027938 3,635.0 3.477535 6.593219 3,619.7
3.477454 5.778531 3,638.1 3.454398 5.966287 3,646.0 3.500694 5.593946 3,638.4 3.454352 5.850246 3,635.1 3.500683 6.477834 3,619.8
3.500602 5.746191 3,638.2 3.477546 5.910902 3,646.1 3.523958 5.536254 3,638.5 3.477500 5.861784 3,635.1 3.523947 6.403988 3,619.9
3.523866 5.702301 3,638.2 3.500694 5.781672 3,646.2 3.546991 5.471639 3,638.5 3.500648 5.757938 3,635.2 3.546979 6.247065 3,620.1
3.546898 5.623761 3,638.3 3.523958 5.774748 3,646.2 3.570139 5.413946 3,638.6 3.523912 5.688707 3,635.3 3.570127 6.173219 3,620.1
3.570046 5.556771 3,638.3 3.546991 5.721671 3,646.3 3.604861 5.330869 3,638.7 3.546945 5.568707 3,635.4 3.604850 6.060142 3,620.2
3.604768 5.480541 3,638.4 3.570139 5.523210 3,646.5 3.639583 5.240870 3,638.8 3.570092 5.527169 3,635.5 3.639572 5.910141 3,620.4
3.639491 5.369661 3,638.5 3.604861 5.433210 3,646.6 3.674306 5.155485 3,638.8 3.604815 5.455630 3,635.5 3.674294 5.700142 3,620.6
3.674213 5.231061 3,638.7 3.639583 5.322441 3,646.7 3.709028 5.047023 3,639.0 3.639537 5.310246 3,635.7 3.709016 5.658603 3,620.6
3.708935 5.138661 3,638.8 3.674306 5.269363 3,646.7 3.743750 4.991639 3,639.0 3.674259 5.241015 3,635.8 3.743738 5.527065 3,620.8
3.743657 5.069361 3,638.8 3.709028 5.172441 3,646.8 3.778472 4.931639 3,639.1 3.708981 5.155631 3,635.8 3.778461 5.427834 3,620.9
3.778380 5.030091 3,638.9 3.743750 5.036287 3,647.0 3.813542 4.873946 3,639.1 3.743704 5.001015 3,636.0 3.813530 5.395526 3,620.9
3.813449 4.916901 3,639.0 3.778472 4.967056 3,647.0 3.847917 4.811638 3,639.2 3.778426 4.975630 3,636.0 3.847905 5.270911 3,621.0
3.847824 4.900731 3,639.0 3.813542 4.890902 3,647.1 3.882639 4.767792 3,639.2 3.813495 4.941015 3,636.1 3.882627 5.180911 3,621.1
3.882546 4.856841 3,639.0 3.847917 4.853979 3,647.1 3.917361 4.726254 3,639.3 3.847870 4.864861 3,636.1 3.917350 5.148603 3,621.2
3.917268 4.782921 3,639.1 3.882639 4.784748 3,647.2 3.986806 4.633946 3,639.4 3.882592 4.846400 3,636.2 3.986794 4.952449 3,621.3
3.986713 4.655871 3,639.2 3.917361 4.724748 3,647.3 4.056944 4.543946 3,639.5 3.917315 4.733323 3,636.3 4.056933 4.825526 3,621.5
4.056852 4.651251 3,639.2 3.986806 4.727056 3,647.3 4.125694 4.444715 3,639.6 3.986759 4.657169 3,636.3 4.125683 4.723988 3,621.6
4.125602 4.512651 3,639.4 4.056944 4.540133 3,647.5 4.195139 4.301639 3,639.7 4.056898 4.594861 3,636.4 4.195127 4.523219 3,621.8
4.195046 4.337091 3,639.6 4.125694 4.413210 3,647.6 4.264583 4.211638 3,639.8 4.125648 4.511784 3,636.5 4.264572 4.465526 3,621.8
4.264491 4.274721 3,639.6 4.195139 4.293210 3,647.7 4.334028 4.110100 3,639.9 4.195092 4.366400 3,636.6 4.334016 4.317834 3,622.0
4.333935 4.221591 3,639.7 4.264583 4.267825 3,647.7 4.403472 4.029331 3,640.0 4.264537 4.248707 3,636.8 4.403461 4.181680 3,622.1
4.403380 4.076061 3,639.8 4.334028 4.092441 3,647.9 4.472917 3.985485 3,640.0 4.333981 4.126400 3,636.9 4.472905 4.163218 3,622.1
4.472824 4.020621 3,639.9 4.403472 4.069364 3,647.9 4.577083 3.886254 3,640.1 4.403426 4.041015 3,637.0 4.577072 4.031680 3,622.3
4.576991 3.875091 3,640.0 4.472917 3.983979 3,648.0 4.681250 3.775485 3,640.2 4.472870 4.015630 3,637.0 4.681238 3.842449 3,622.5
4.681157 3.849681 3,640.1 4.577083 3.843210 3,648.2 4.785417 3.662408 3,640.3 4.577037 3.826400 3,637.2 4.785405 3.727065 3,622.6
4.785324 3.715701 3,640.2 4.681250 3.732440 3,648.3 4.889583 3.574715 3,640.4 4.681204 3.810246 3,637.2 4.889572 3.669373 3,622.6
4.889491 3.604821 3,640.3 4.785417 3.598594 3,648.4 5.028472 3.431638 3,640.6 4.785370 3.639477 3,637.4 5.028461 3.487065 3,622.8
5.028380 3.558621 3,640.3 4.889583 3.492440 3,648.5 5.167361 3.279331 3,640.7 4.889537 3.597938 3,637.4 5.167350 3.362449 3,622.9
5.167268 3.357651 3,640.5 5.028472 3.407056 3,648.6 5.306250 3.076254 3,640.9 5.028426 3.466400 3,637.5 5.306238 3.157065 3,623.1
5.306157 3.154371 3,640.7 5.167361 3.323979 3,648.7 5.445139 2.944715 3,641.1 5.167315 3.309477 3,637.7 5.445127 2.960911 3,623.3
5.445046 2.997291 3,640.9 5.306250 3.130133 3,648.9 5.584028 2.810869 3,641.2 5.306204 3.092553 3,637.9 5.584016 2.917065 3,623.4
5.583935 2.837901 3,641.1 5.445139 2.869364 3,649.1 5.722917 2.674716 3,641.3 5.445092 2.947169 3,638.1 5.722905 2.713988 3,623.6
5.722824 2.738571 3,641.2 5.584028 2.777056 3,649.2 5.861806 2.552408 3,641.4 5.583981 2.852553 3,638.1 5.861794 2.582449 3,623.7
5.861713 2.653101 3,641.2 5.722917 2.622441 3,649.4 6.008217 2.469331 3,641.5 5.722871 2.661015 3,638.3 6.008206 2.513219 3,623.8
6.008125 2.521431 3,641.4 5.861806 2.479364 3,649.5 5.861759 2.497169 3,638.5
6.008217 2.403210 3,649.6 6.008171 2.494861 3,638.5
General Methodology: PSI, temperature, and time readings from Win-SituTM
digital data log were exported to Excel ".csv" file.
Drawdown was calculated as PSI at time after pumping minus average PSI before pumping; therefore, at small or zero changes
in PSI negative drawdowns may be calculated.
A FORTRAN program was written to read the ".csv" file and produce a second file by extracting the records at a frequency of 40
per log-time cycle (in minutes) in order achieve equal representation of data throughout the pumping and drawdown phases of the test.
Elevation (in ft above mean sea level) based on initial groundwater elevation (see Table 4.2) minus drawdown.
G:\102\00279.01\Deliverables\Reports - Specs\Hydrogeologic Testing Report\Rev1\Appendices\AppendixB-Rev1\
App B_3 Dewey Recovery Data Tables_RevTR 4 of 411/12/2008
Revised July 2010
July 2012J-139
Appendix J

Knight Piesold CONaULTING
Appendix 8-4 Additional Aquifer Parameter Determinations
July 2012 J-140 Appendix J

103r--~~--Theis
[ E..;-d of Borehole Storage at t = 21 Minutes 10::.!
101
- 1 l~
::::J
~ 10°
10"1
Tra•mleslvlty storage coemcaent Radial Distance
250.312 sq ftld 1.182878-006 0.25 ft
10"2
A Data Ignored
~~~~~ Data L*ld
105 10G 107 106
1/u 1o9 1010 1011
Client
Knight Piesold C:ON.ULTIIIIG
Project
DEWEY -BURDOCK HYDROGEOLOGIC TESTING
REPORT Project No: DV1 0200279.01
Title
Theis Drawdown Analysis at Dewey Pumping Well 32-3C
Date: 10/16/08 Appendix B, Figure 8.4-1
G:\102100279.01\A\Reports Specs\KPIAII Reports\Work in Progress\Hydrogeologic Testing Report\Appendices\Appendix B\Appendix 6.4-1 Theis 32-3C.xls 10/16/2008
July 2012J-141
Appendix J

6
Theis 101 1r--------r-------~--------~------~=-----~~-------
10°
~ 101
~ it
.Jf.. ;; ::::J - 6 /£('
~ 6 ' t:. J t:.
~A (\(\ I
I
A "Aj I / 6.
10-3 I 7 -I I i
6 I l .ro.66 10-4
I
10-1
Client
Knight Piesold CONaULTIND
' I
10° 101
Project
DEWEY -BURDOCK HYDROGEOLOGIC TESTING
REPORT Project No: DV1 0200279.01
1o2 1/u
Title
TransmiMivtty Storage coefficient Rmi81 Distance
X DataUied
1~
293.753 8q ftld 3.34105e-005 265ft
A Data lgnot'ed
1o4 105
Theis Drawdown Analysis at Dewey Observation Well 32-5
Date: 10/16/08 Appendix B, Figure 8.4-2
G:\102100279.01\A\Reports Specs\KPIAII Reports\Work in Progress\Hydrogeologic Testing Report\Appendices\Appendix 8\Appendix 8.4-2 Theis 32-S.xls 10/1612008
July 2012J-142
Appendix J

101
~
/\ i\
i\
Theis
~----=-==:~== - .. ·t
r .,;_ .
'
/; 1
.
10-1
Client
·~
£. ~:
><x<.' ' !),_'(
/\ /
I
~~---
/ I
(\
I
i I
1o0
Knight Piesold CGitaULTING
101
Project
DEWEY-BURDOCK HYDROGEOLOGIC TESTING
REPORT Project No: DV10200279.01
102
1/u
Title
Tr .. mlaalvlty Storage Coeftlclent Radial Distance
X Oetal.leed
103
t I
333.024 sq ftld 5.5559S.005 487ft
A Data Ignored
104 10~
Theis Drawdown Analysis at Dewey Observation Well 32-4C
Date: 10/16/08 Appendix B, Figure 8.4-3
G:\102100279.01\A\Reports Specs\KPIAII Reports\Work in Progress\Hydrogeologic Testing Report\Appendices\Appendix B\Appendix 8.4-3 Theis 32-4C.xls 10/16/2008
July 2012J-143
Appendix J

-:::J
~
!::. 6
A £:A
D.
Theis 10
1 • -
--··-~
10° =I
/~ .
'
.
-;t."' D.y/ ll f
f 6. j A
6 I fo-3
.' t:,.
10-4
1 o-1 100
Client Project
101
.- ------
to-2 1/u
Title
----- - -
T1'811M1Iulvlly Stonlge Ca.ftlcient A.tial Distance
X o.taUeed
103
176..888 aq ttld 2.32133e-005 14133 ft
A Deta Ignored
104 10~
DEWEY -BURDOCK HYDROGEOLOGIC TESTING
REPORT Theis Drawdown Analysis at Dewey Stock Well GW-49
Knight Piesold ee••UL"'' fMG Project No: DV10200279.01 Date: 10/16/08 Appendix B, Figure B.4-4
G:\102100279.01\A\Reports Specs\KPIAII Reports\Work in Progress\Hydrogeologic Testing Report\Appendices\Appendix 8\Appendix 8.4-4 Theis GW-49.xls 10/16/2008
July 2012J-144
Appendix J

.A,
1\
M
Theis 10
1 I 1 I I -
t:.
10-4
----- --;---- ------I ----~--_ ..... -------___ .. ___ .. -
-----~-T" ,.,...... - + --t -
,/- I
;( 6 ui1/ f &#~I
D. I -·A·- - /- - --+ - - - - -- • ...,.. + -~
~ I I
I -1 I 1 I
I
I
10-1
Client
1o0 101
Project
102
1/u
Title
y,.,.,. ... lvtty storage Ca.lftclent Radial Distance
Detal.Jeed
163
177.815 aq ftld 0.000117036 2-tOO ft
t.. Oeta Ignored
104 1cil
DEWEY -BURDOCK HYDROGEOLOGIC TESTING
REPORT Theis Drawdown Analysis at Dewey Observation Well 29-7
Knight Piesold C::ONaULTINO Project No: DV10200279 01 Date: 1 0/16/08 Appendix B, Figure 8.4-5
G:\102100279.01\A\Reports Specs\KPIAII Reports\Work in Progress\Hydrogeologic Testing Report\Appendices\Appendix B\Appendix 8.4-5 Theis 29-7.xls 10/16/2008
July 2012J-145
Appendix J

Theis
10' ~-- ---- -T -- - f
10°~ - -~
, .... ~ efr&::>bservation Well 32-9C
10-1 X'/--c ~
- §(
::::J
f~l-1 ~(\
tf:J::,.""' 1 o-2
if.. 6
Transmisaivity 217.373 sq ftld Storage Coefficient 0.01 ... R_.lal Distance 41 ft
1o-3 .J I J +<- -+-
I
X CatalJBed A C... Ignored
10-4 I I I I
6 l:. 1o0 10-1
Client Project
101
DEWEY -BURDOCK
102
1/u
Title
103 104 105
Knight Piesold HYDROGEOLOGIC TESTING I Theis Drawdown Analysis at Dewey Upper Fall River Observation Well 32-9C
REPORT CeMaULTIJIO. Project No: DV1 0200279.01 Date: 10/16/08 Appendix B, Figure 8.4-6
G:\102100279.01\A\Reports Specs\KPIAII Reports\ Work in Progress\Hydrogeologic Testing Report\Appendices\Appendix B\Appendix 8.4-6 Theis 32-9C.xls 10/16/2008
July 2012J-146
Appendix J

g c ~
-8 ~ I! Q
j 1 .!
Client
12
Aquifer Parameters: r=467ft
10 T = 120 ft2/d
8
6
4
2
10
9
8
7
6
5
4
3
2
---------.:1::000 0 0 Observation Well 32-4C
Red Line Indicates data range for u' < 0.01
Late-time slope (later time to left) disregarded due to barrier boundary observed during drawdown phase or test.
10
Halford and Kuniansky, USGS Open-file Report 02-197, 2002 Cooper-Jacob recowry analySis of single-well aqutfer test
100 1,000 Ct+At)IAt
10,000 100.000
Observation Stock Well GW-49
Due to distance, no values have u' <0 .01
Red Line Indicates data range for u' < 0.05
Aquifer Parameters: r = 1,400 fl
T = 110tt2td
Late-time slope (later time to left) disregarded due to
barrier boundary observed during drawdown phase oftest.
Halford and Kuniansky, USGS Open-file Report 02-197, 2002
Cooper-Jacob rec011ery analysis of single-well aquifer test
1,000.000
0 L---------~~----~~--------~--------~------~----------~ 10 100 1,000
(t+At)IAt
Title
10,000 100,000 1,000,000
Knight Piesold
DEWEY-BURDOCK HYDROGEOLOGIC TESTING
REPORT
Theis-Cooper-Jacob Recovery Analyses, Dewey Observation Wells 32-4C and GW-49
•••ellllt.TI .. e Pro· No: DV10200279.01 Date: 10/16/08
G:\102\00279.01\A'Reports Specs\KP\AII Reports\WOrk in Progress\Hydrogeologic Testing Report\Appendices\Appendix B\Appendix 8 .4-7 CR 32-4c_GW-49.xls 10/16/2008
_] , . ---- - -·- -- -
July 2012 J-147 Appendix J

Client
15 r----------------------------------------------------,
13
11
9
7
5
3
-1
Aquifer Parameters: r=26511 T = 280112/d
Observation Well 32-a
Red Line Indicates data range for u' < 0.01
Late-time slope (later time to left) disregarded due to barrier boundary observed during drawdown phase or
10 100 1,000 10,000 100,000
HaWord and Kunlan&ky, USGS Open-file Report 02-197, 2002
Cooper-Jacob recovery analy&lS o# single-well aquifer lest
1, ,000
-3 '-------------------- (t+At)/At - -------------'
Observation Well 32-9C
12 r-----------------------------,
10
8
6
4
2
Due to high S, no values have u' < 0.01
Example Parameters; r • 41
T = 150 tt 2/d
Indicated range is for values with u' <0.05
Halford and Kunian&ky, USGS Open-fole Report 02-197, 2002
Cooper -Jacob reocrvery analysis ot "'ngle-wen aqu~er test
0 L-----------------------------------------~------~ 10 100 1,000
(t+At)IAt
Title
10,000 100,000 1.000,000
Knight Piesold
DEWEY-BURDOCK HYDROGEOLOGIC TESTING
REPORT
Theis-Cooper-Jacob Recovery Analyses, Dewey Observation Wells 32-5 and 32-9C
..... _, .......... Pro· No: DV10200279.01 Date : 10/16108
G:\1 02\00279.01\A\Reports Specs\KP\AII Reports\Worll. in Progress\Hydrogeologic Testing Report\Appendices\Appendix B\Appendix 8 .4-8 CR 32-9C_32-5.xls 10/16/2008
_j, __
July 2012 J-148 Appendix J

Knight Piesold CONaULTING
Appendix C Burdock Test Supplemental Information
Appendix C-1:
Appendix C-2:
Appendix C-3:
Appendix C-4:
Well Completion Diagrams
Time and Water Level Data Values Used in Pumping Test Analysis: Burdock Test, Drawdown Data
Time and Water Level Data Values Used in Pumping Test Analysis: Burdock Test, Recover Data
Additional Aquifer Parameter Determinations
July 2012 J-149 Appendix J

Knight Piesold CONaULTING
Appendix C-1 Well Completion Diagran1s
July 2012 J-150 Appendix J

POWERTECH WELL AND PUMP DATA
Location of Well Drilling Contractor Driller Well Name DB07-ll-11C
Burdock, SD Davis Drilling Tony
County Type of Rig Drilling Fluid Well Depth 436'
Fall River mud
LAT 4811G60N LONG 583455E Elevation 4163' Datum point from which all measurements are taken
Screened Monitoring Well Completion Detail Method of Drillmg Date: 1Q/1Q/Q7
D Gabel Tool D Hollow Rod
...---® Screened Well No . I8J Direct Rotary D Air Rotary
A Stick-up Length 2.0' 0 Bucket Auger D Reverse Rotary
© B Key No. NA D Flight Auger D Jetted
C. Protective Casing DDug D Driven
Ground / '-..... Diameter NA ~-mud rotarv
Surface Material NA Use 1-
Length NA D Domestic D Public Supply
(gY/~v Depth to Bottom NA 0 Industrial 0 Irrigation
® D. Surface Completion 0Munieipal D Commercial
!7-r- Diameter NA DTestWell D Heating or Cooling
v v Depth NA 181 Monitoring
v v Material NA D Other
v v E. Well Casing Data One well volume (V) ::: gallons
v Diameter 6" ID Initial DE!Velopment Water
/ v Material PVC Water Level (TIC)-~
Length 428' Well Depth_~
/ / Weight SQH 40 Color --/ / Depth to Bottom 426' Odor
/ / F. Grout cement Date 10/30/07 Clarity ___
/ / Depth to Top 0' Developed By ___
/ / Depth to Bottom 427' Date
-~
Material sulfatfl rS)§i§. cem!ilnt Well Development Date __
/ / Density 15.21!/g~l DescriptiOn of Development Technique
/ / Volume 24.1 bbls
@) v / %Excess 50 Pump
v / Method of Installation displacement
Date Installed Depth to Cement in Casing 3~6'
--- Type __
v / Return Constant DYes 181 No Manufacturer --- Model No. --
v v Volume of Grout Return H.P. -~
Volts --0
Capacity __
v v G. Borehole Diameter Depth of Pump Intake Setting __
~ ~ Drilling Dates 6.5" 10/10/07 No. of Stages __
H. Pack Type/SizeNA Date NA DOil 0 Water Lubrication
Depth to Top NA Power Source ---
Depth to Bottom Material of drop pipe ___
Material Bowls --
- Method of Installation Shafting __ lmpellors __
-- 1-· Gradation Bowl Diameter --
·-· ---=-- L Screen Date 12/18/08 Column Pipe Diameter __ Length_~
- Modification Depth to Top 426-4a6"
~--
- ·, Depth to Bottom r-----Manufacturer Geophys Leal Logs Run Gamma Resistivity, SP ran 10/10/07
Material PVC -' . Slot .01" -
J. - Bottom Cap
Material PVC
Length 1"
Driller Tony
Boring Depth 4!l~'TD 41ff ~a§ing'
®- . ·:
Additional Information
******Mechanical Integrity Test******
PSI Increments Calibration Date of Gage --PSI Full Scale Test Run By Stan Davis, Len Eakin Date Test Run 12/13/08 Water Quality
Time Beginning of Test 0900 Time End of Test 1100 Sample taken? DYes DNo
Initial Pressure 35.0PSIG Initial Fluid Level 5.0 inches Where analyzed? --Final Pressure 35.0PSIG Final Fluid Level 5.0inches
Date well completed 12/18/QB
July 2012 J-151 Appendix J

WELL DEVELOPMENT RECORD- PARAMETEIR MEASUREMENTS
Total Volume
I Well Withdrawal Conductivity Temp Turbidity
No. Time pH (ms/cm) (oC) (NTU)
Comments
Gallons Borehole Volume
11-11c 1400 appears cl. 12/18/08 well developed
1430 water appeared clear within 5 minutes
approx. 30 gpm while pumping
150psi kickoff, 90psi sustained
July 2012 J-152 Appendix J

POWERTECH WELL AND PUMP DATA
Location of Well Drilling Contractor Driller Well Name DB07-11-14C
Burdock, SD Davis Drilling Tony
County Type of Rig Drilling Fluid Well Depth 423'
Fall River mud
LAT 4811591N LONG 583496E Elevation 3645' Datum point from which all measurements are taken
Screened Monitoring Well Completion Detail Method of Drilling Date: 11/2/07
D Cabel Tool D Hollow Rod
....--® Screened Well No . ~ Direct Rotary D Air Rotary
A Stick-up Length 2.0' D Bucket Auger D Reverse Rotary
© B. Key No. NA D Flight Auger D Jetted
/ C. Protective Casing
DDug D Driven
~ 0 Other mud rQt;ary
Ground Diameter NA
Surface Material NA Use 1-
Length D Domestic D Public Supply NA
@Y/~~~ Depth to Bottom NA D Industrial 0 Irrigation
A D. Surface Completion D Municipal D Commercial
trr- Diameter NA DTestWell 0 Heating or Cooling
I/ v Depth NA 1:81 Monitoring
I/ v Material NA D Other
/ v E. Well Casing Data One well volume (V) ::: gallons
®- 1/ Diameter 4" ID Initial Development Water
/ / Material PVC Water Level (TIC) __
Length <115' Well Depth __
I/ I/ Weight SQH40 Color --I/ I/ Depth to Bottom 413' Odor
I/ I/ F. Grout cement Date 11/3/07 Clarity ___
I/ I/ Depth to Top 0' Developed By __
I/ I/ Depth to Bottom .U4' Date --Material sulfat!il; r~§:is. Q~ment Well Development Date __
I/ I/ Density 1fi.2b/gal Description of Development Technique
I/ I/ Volume 15.8 bbls
I/ I/ %Excess 50 Pump
I/ I/ Method of Installation displacement
Depth to Cement in Casing !l03' Date Installed --- Type __
v I/ Return Constant DYes 181 No Manufacturer --- Model No. --
i/ I/ Volume of Grout Return H. I'. -- Volts --
0
I/ I/ Capacity __
G. Borehole Diameter Depth of Pump Intake Setting __
~ ~ Drilling Dates 6.25" 11/2/07 No ofStages __
H. Pack Type/SizeNA Date NA DOil D Water Lubrication
® Depth to Top NA Power Source __
Depth to Bottom Material of drop pipe ___
Material Bowls --Method of Installation Shafting __ Impellors __
1---- Gradation Bowl Diameter 1----
--
I··· I. Screen Date 2/13/08 Column Pipe Diameter __ Length __
ModificatiOn ---Depth to Top 413-42!l'
Depth to Bottom
Manufacturer Geophysical Logs Run Gamma Resistivity SP ran 11/2/07
~~ Material PVC
: I. Slot .01" C---C---
J. Bottom Cap
Material PVC
Length 1"
Driller Tonv
Boring Depth 4QQ'T!l 411;' ream' . .. ~
Additional Information
******Mechanical Integrity Test******
PSI Increments Calibration Date of Gage 1---PSI Full Scale Test Run By Stan Davis, Len Eakin Date Test Run 2/12/08 Water Quality
Time Beginning of Test 1400 Time End of Test 1445 Sample taken? DYes D No
Initial Pressure 40.0PSIG Initial Fluid Level 5.0 inches ~~alyzed?
Final Pressure 40.0PSIG Final Fluid Level 5.0inches Date well completed 2/1!J/Q8
July 2012 J-153 Appendix J

WELL DEVELOPMENT RECORD- PARAMETER MEASUREMENTS
Total Volume
I Well Withdrawal Conductivity Temp Turbidity
Comments No.
Time pH (ms/cm) (OC) (NTU)
Gallons Borehole Volume
11-14c 1500 appears cl. 2/13'08 well developed
1530 wat€!r cleared up in approx. 3 minutes
approx. 30 gpm while pumping
150psi kickoff, 100psi sustained
July 2012 J-154 Appendix J

POWERTECH WELL AND PUMP DATA
Location of Well Drilling Contractor Driller Well Name DB07-11-15 Burdock, SD Davis Drilling Tony
County Type of Rig Drilling Fluid Well Depth 428'
Fall River mud
LAT 4811590N LONG 583428E Elevation 3710' Datum point from which all measurements are taken
Screened Monitoring Well Completion Detail Method of Drilling Date: 11/4/07
D Cabel Tool D Hollow Rod
----® Screened Well No. 181 Direct Rotary D Air Rotary
A Stick-up Length 2.0' D Bucket Auger 0 Reverse Rotary
© B. Key No. NA D Flight Auger D Jetted
/ C. Protective Casing
0Dug 0 Driven
~ D Other mud r•lli!IY._ Ground Diameter NA
Surface Material NA Use 1- D Domestic D Public Supply Length NA
@Y/~~ Depth to Bottom NA D Industrial 0 Irrigation
D. Surface Completion D Municipal 0 Commercial
lrr- Diameter NA D Test Well D Heating or Cooling
[/ I/ Depth NA 1m Monitoring
I/ I/ Material NA D Other
[/ / E. Well Casing Data One well volume M = gallons
/ / Diameter 4" ID Initial Development Water
[/ / Material PVC Water Level (TIC)-~-Length 420' Well Depth-~-v / Weight SCH 4Q Color
-~
[/ I/ Depth to Bottom 41R' Odor
v v F. Grout cement Date illf1!.Q1 Clarity __
v I/ Depth to Top 0' Developed By __
v v Depth to Bottom 419' Date -~-
Material sulf;ate resi§ !;;~ment Well Development Date __
1/ I/ Density 1(1 2b/~al Description of Development Technique
v v Volume 15.7b)ll§
~ I/ I/ %Excess 50 Pump
~ v 1/ Method of Installation dis:gla~e:m~nt
Depth to Cement in Casing 2~Q' Date Installed
~-
Type __
I/ I/ Return Constant DYes 181 No Manufacturer
-~-
Model No. --
v v Volume of Grout Return 0 HP
-~-
Volts --Capacity--~
I/ I/ G. Borehole Diameter Depth of Pump Intake Setting __
~ k:: Drilling Dates 6.5" 11/4/07 No. of Stag·es __
H. Pack Type/SizeNA Date NA OOil D Water Lubrication
Depth to Top NA Power Source --I·
Depth to Bottom Material of drop pipe __
Material Bowls --
Method of Installation Shafting __ ~ Impellors __
Bowl Diameter I----
Gradation --~
I·· 1--- I. Screen Date 2/24/08 Column P"Lpe Diameter __ Length __
Modification Depth to Top 418-428' --
1---- Depth to Bottom ~.1---- Manufacturer Geophysical Logs Run Gamma Resistivity SP ran 11/4/07
Material PVQ
; I. Slot .01" 1----
J. Bottom Cap
Material PVC
Length 1"
Driller Tonv
Boring Depth 49Q'TD 418' casing' . ·' ~
Additional Information
******Mechanical Integrity Test******
PSI Increments Calibration Date of Gage PSI Full Scale Test Run By Stan Davis, Len Eakin Date Test Run 2/9/08 Water Quality
Time Beginning of Test 0930 Time End of Test 1015 Sample taken? DYes 0No Initial Pressure 40.0PSIG Initial Fluid Level 5.0 inches Where analyzed'?
Final Pressure 40.0PSIG Final Fluid Level 5.0inches Date well wmpleted 2/24/QS
July 2012 J-155 Appendix J

WELL DEVELOPMENT RECORD- PARAMETER MEASUREMENTS
Total Volume
I Well Withdrawal Conductivity Temp Turbidity
No. Time pH (ms/cm) (OC) (NTU)
Comments
Gallons Borehole Volume
11-15 1400 appears d. 2/12/08 well initially developed
1430 water appeared clear instantly
less than 1 gpm while pumping
100psi kickoff, 50psi sustained
v. slow recharge, we suspect cement is covering formation. will retrieve screen and
shoot with perf. truck to clean off cement
2/23-2/24/08 came back to well, pulled
screen, perforated screen interval, and developed again. made 2-3gpm, but recharged much more quickly
July 2012 J-156 Appendix J

POWERTECH WELL AND PUMP DATA
Location of Well Drilling Contractor Driller Well Nam'' DB07-ll-2
Burdock, SD Davis Drilling Tony
County Type of Rig Drilling Fluid Well Depth 460'
Fall River mud
LAT 4811591N LONG 583496E Elevation 3645' Datum pomt from which all measurements are taken
Screened Monitoring Well Completion Detail Method of Drilling Date: 6/2/07
D Cabel Tool D Hollow Rod
...---® Screened Well No . 181 Direct Rotar} D Air Rotary
A. Stick-up Length 2.0' D Bucket Auger D Reverse Rotary
© B. Key No. NA D Flight Auger D Jetted
/ ~ C. Protective Casing
D Dug D Driven
D Other mud rotarv
Ground Diameter NA
Surface Material NA Use 1-
Length NA D Domestic D Public Supply
@Y~v-Depth to Bottom NA D Industrial 0 Irrigation
D. Surface Completion D Munic1pal 0 Commercial
b-.-- Diameter NA DTestWell D Heating or Cooling
v I/ Depth NA 181 Monitoring
v / Material NA DOther
v / E. Well Casing Data One well volume (V) :::: gallons
/ Diameter 4" ID Initial Development Water
v / Material PVC Water Level (TIC) __
Length 415' Well Depth __
v / Weight SQH 4Q Color __
v / Depth to Bottom 450' Odor
v / F. Grout cement Date .lMWQ1 Clarity __
v / Depth to Top 0' Developed By __
v l/ Depth to Bottom 451' Da1e --Material §ulfate r~§is. !:;~ment Well Development Date __
v v Density 1§.2b/gi!l Description of Development Technique
v l/ Volume 17.Q bbl§
v / %Excess 50 Pump
v / Method of Installation di§glacem~nt
Depth to Cement in Casing 37Q' Date Installed --- Type __
v / Return Constant DYes 181 No Manufacturer --- Model No --
v / Volume of Grout Return 0 H.P. --- Volts __
Capacity __
v / G. Borehole Diameter Depth of Pump Intake Setting __
~ ?. Drilling Dates 6.5" 6/2/07 No ofStages __
H. Pack Type/SizeNA Date NA DOil D Water Lubrication
®- Depth to Top NA Power Source --. Depth to Bottom Material of drop pipe ___
. Material Bowls ---
Method of Installation Shafting __ Impellers __
t--- Gradation Bowl Diameter --
I··· I. Screen Date~ Column Pipe Diameter __ Length __
Depth to Top Modification --45Q-460'
. ' Depth to Bottom
Manufacturer Geophysical Logs Run Gamma Resistivity SP ran 6/2/07
Material pvc: ,· . Slot .01"
1--- J. Bottom Cap 1---
Material PVC
Length 1" . Driller Tonv
.. Boring Depth 57!i'TD 4/ili' ream'
®-. _,
Additional Information
******Mechanical Integrity Test******
PSI Increments Calibration Date of Gage 1---PSI Full Scale Test Run By Stan Davis, Len Eakin Date Test Run 2/20/08 Water Quality
Time Beginning of Test 1100 Time End of Test 1200 Sample taken? DYes DNo
Initial Pressure 40.0PSIG Initial Fluid Level 5.0 inches Where analyzed?
Final Pressure 40.0PSIG Final Fluid Level 5.0inches Date well completed 2/21/QB
July 2012 J-157 Appendix J

WELL DEVELOPMENT RECORD- PARAMETER MEASUREMENTS
Total Volume
I Well Withdrawal Conductivity Temp Turbidity No.
Time pH (ms/cm) (OC) (NTU) Comments
Gallons Borehole Volume
11·2 1300 appears cl. 2/21108 well developed
1330 water cleared up in approx. 10 minutes
approx. 25·30 gpm while pumping
175psi kickoff, 90psi sustained
we lifted well for 10 minutes before pushing screen to make sure that the formation was not blocked off by cement. appeared to be making good water, so we pushed screened then lifted for another 30 minutes.
July 2012 J-158 Appendix J

POWERTECH WELL AND PUMP DATA
Location of Well Drilling Contractor Driller Well Name DB08-11-17 Dewey, SD Davis Drilling Tony
County Type of Rig Drilling Fluid Well Depth 255' Fall River Speed Star 1500 Mud
LAT 4811660N LONG 583440E Elevation ?' Datum point from which all measurements are taken
Screened Monitoring Well Completion Detail Method of Drilling Date: OiJ/2(i/Q8
0 Cabel Tool 0 Hollow Rod
.---@ Screened Well No . 0 Direct Rotary 0 Air Rotary
A. Stick-up Length 2.0' 0 Bucket Auger 0 Reverse Rotary
© B. Key No. NA 0 Flight Auger 0 Jetted
/ ~ C. Protective Casing
Ollug D Driven
181 Other Mud !Marx Ground Diameter NA Surface Material NA Use
1- D Domestic 0 Public Supply Length NA
@Y/~T Depth to Bottom NA 0 Industrial 0 Irrigation
D. Surface Completion D Municipal 0 Commercial
p--Diameter NA 0 Test Well D Heating or Cooling
/ v Depth NA 181 Monitoring
v v Material NA 0 Other
/ / E. Well Casing Data One well volume (V) ::: gallons
v Diameter 6" ID lnit1al Development Water
/ / Material PVC Water Level (TIC) 38.08 ft below ground surface Length 247' Well Depth ___ v v Weight SDR17 Color ---
/ / Depth to Bottom 245' Odor
v v F. Grout Cement Date 03/26/08 Clarity __
v v Depth to Top 0' Developed By __
v v Depth to Bottom 247' Date ---
Material Tyye V "L.A." Cem~nt Well Development Date __
v v Density 15.2ly/g~l Descriptio a of Development Technique
v v Volume 10.05 bbl~
® v v %Excess 10 Pump
Method oflnstallation Di§gla~m~nt v v Depth to Cement in Casing ?• Dat(' Installed -- Type __
v v Return Constant 181 Yes 0No Manufacturer -- Model No. --
/ v Volume of Grout Return 2.5 bbls HP --- Volts --Capacity ___
/ v G. Borehole Diameter Depth of Pump Intake Setting __
i ~ Drilling Dates 8. 7/l" Qa/2!1/QB No. of Stages __
H. Pack Type/SizeNA Date NA OOil D Water Lubrication
® Depth to Top NA Power Source --Depth to Bottom Material of drop pipe __
Material Bowls --Methnd of Installation Shafting ___ lmpellors __
Gradation Bowl Diameter --I·· r----1·: L Screen Date Q1LQlLQl!
Column Pipe Diameter __ Length __
Depth to Top ModificatiOn --245-255'
r---- .• Depth to Bottom
:· Manufacturer Geophysical Logs Run Gamma B:f§i§tivity S:P
Material PVC .-1- Slot .01"
'----J. Bottom Cap
Material PVC
Length 1"
Driller TQmmy
Boring Depth 257'
®- - .; ..
Additional Information
******Mechanical Integrity Test******
PSI Increments Calibration Date of Gage PSI Full Scale Test Run By Stan Davis, Dan Tschopp Date Test Run 04/01/08 Water Quality
Time Beginning of Test 0830 Time End of Test 0930 Sample taken? D Yes 0No Initial Pressure 35.0 PSIG Initial Fluid Level 4 inches Where analyzed? Final Pressure 35.0 PSIG Final Fluid Level 4inches
Date well completed Q4/Q1/Q8
July 2012 J-159 Appendix J

WELL DEVELOPMENT RECORD- PARAMETER MEASUREMENTS
Total Volume
I Well Withdrawal Conductivity Temp Turbidity No.
Time pH (ms/cm) (oC) (NTU) Comments
Gallons Borehole Volume
Well developed: 04/01108
Wat<lr cleared up within 5 minutes
Unload Pressure: llOpsi
Steady Lift Pressure: lOpsi
20 minute Recovery Pressure: 15psi
Output: Approximately 1.5 gpm
Screened Interval: Fall River SS Formation
July 2012 J-160 Appendix J

POWERTECH WELL AND PUMP DATA
Location of Well Drilling Contractor Driller Well Name DB08-11-18
Dewey, SD Davis Drilling Tony
County Type of Rig Drilling Fluid Well Depth 631'
Fall River Speed Star 1500 Mud
LAT 583471N LONG 4811660E Elevation 3791' Datum point from which all measurements are taken
Screened Monitoring Well Completion Detail Method of Drilling Date: Q4101108
D Cabel Tool D Hollow Rod
.---® Screened Well No . 0 Direct Rotaqr D Air Rotary
A Stick-up Length 2.0' 0 Bucket Auger 0 Reverse Rotary
© B. Key No. NA 0 Flight Auger D Jetted
/ C. Protective Casing
0Dug D Driven
['.. 181 Other Mud R<llar~ Ground Diameter NA
Surface Material NA Use 1-
Length NA D Domestic 0 Public Supply
@Y/~r.r-Depth to Bottom NA 0 Industrial D Irrigation
A D. Surface Completion OMunicipal D Commercial
b'-r- Diameter NA OTestWell D Heating or Coolmg
I/ v Depth NA 181 Monitoring
/ v Material NA OOther
/ v E. Well Casing Data One well volume (V) :::: gallons
® / Diameter 6" ID Initial D€•velopment Water
/ v Material Sl~~l Water Level (TIC) __
Length 628'
I/ [/ Well Depth ___
Weight Schedule 40 Color --
I/ 1/ Depth to Bottom 621' Odor
I/ 1/ F. Grout Cement Date 04/Q2/Q8 Clarity __
I/ 1/ Depth to Top 0' Developed By ___
I/ I/ Depth to Bottom 623' Date --
Material Tyye V "LA" Cem~nt Well Development Date __
I/ v Density 15.15lblgal Description of Development Technique
I/ 1/ Volume 23.14 bbl§
I/ v %Excess 10 t--=='
Pump
v v Method of Installation Displacement
Depth to Cement in Casing 4~Q' Date Insl alled ---
Type __
/ I/ Return Constant 181 Yes 0No Manufacturer ___ Model No. --
I/ v Volume of Grout Return I bbls H.P. --- Volts --Capacity __
/ / G. Borehole Diameter Depth of Pump Intake Setting __
~ ~ Drilling Dates 8. 7fl" Q;;!i311QB No. of Stages __
H. Pack Type/SizeNA Date NA OOil 0 Water Lubrication
-r1\ Depth to Top NA Power Source ___
\UI 1----- Depth to Bottom Material of drop pipe __
I· . Material Bowls --Method of Installation Shafting __ Impellors __
Bowl Dtameter Gradation --I···
1----- Column Pipe Diameter __ Length __ I. Screen Date 04115/Q8
Depth to Top Modrfica1ton --
§21 tQ 231'
. ' Depth to Bottom --:- Manufacturer Geophys1:cal Logs Run Gamma Resistivity SP
Material PVC _.
1- Slot .01"
f-----J. Bottom Cap
Material PVC
Length I"
Driller TQmmy
Boring Depth 233' - ·. _,
Additional Information
******Mechanical Integrity Test******
PSI Increments 5 Calibration Date of Gage 1-----PSI Full Scale Test Run By Stan Davis, Dan Tschopp Date Test Run 04114108 Water Quality
Time Beginning of Test 1200 Time End of Test 1300 Sample taken? 0 Yes 0No
Initial Pressure 35.0 PSIG Initial Fluid Level 4 inches ~:alyzed? Final Pressure 35.0 PSIG Final Fluid Level 4inches
Date well completed 04/12/QB
July 2012 J-161 Appendix J

WELL DEVELOPMENT RECORD- PARAMETER MEASUREMENTS
Total Volume
I Well Withdrawal Conductivity Temp Turbidity
No. Time pH (ms/cm) (DC) (NTU)
Comments
Gallons Borehole Volume
Well developed: 04/15/08
Water cleared up within 5 minutes
Unload Pressure: 245psi
Steady Lift Pressure: 30psi
Output: Approximately <2 gpm
Screened Interval: Unkpapa SS formation
20 min reeovery lift: 50 psi
July 2012 J-162 Appendix J

POWERTECH WELL AND PUMP DATA
Location of Well Drilling Contractor Driller Well Name DBOS-11-19
Dewey, SD Davis Drilling Tony
County Type of Rig Drilling Fluid Well Depth 335'
Fall River Speed Star 1500 Mud
LAT 583453N LONG 4811673E Elevation 4029' Datum point from which all measurements are taken
Screened Monitoring Well Completion Detail Method of Drilling Date: Q4/3/08
D Cabel Tool D Hollow Rod
.---® Screened Well No . D Direct Rotary D Air Rotary
A Stick-up Length 2.0' D Bucket Auger 0 Reverse Rotary
© B. Key No. NA D Flight Auger D Jetted
/ C. Protective Casing
0Dug 0 Driven
Ground ~ Diameter NA 181 Other Mud Rotary
Surface Material NA Use 1-
Length NA D Domestic D Pub~c Supply
@Y/~[/ Depth to Bottom NA D Industrial D Irrigation
® D. Surface Completion 0 Municipal 0 Commercial
fro.-- Diameter NA D Test Well D Heating or Cooling
[/ I/ Depth NA 18:1 Monitoring
I/ / Material NA D Other
[/ / E. Well Casing Data One well volume (V) = gallons
/ / Diameter 6" ID Initial Development Water
I/ / Material PVQ Water Level (TIC) __
Length 327' Well Depth __
I/ I/ Weight SDR17 Color ---[/ I/ Depth to Bottom 325' Odor
I/ I/ F. Grout Cement Date 04/4/08 Clarity_~
[/ I/ Depth to Top 0' Developed By ___
[/ I/ Depth to Bottom ~27' Date --
Material TYI!:e V "LA" Cement Well Development Date __
[/ I/ Density 15.65 lbigal Description of Development Technique
[/ I/ Volume 12.71 bbl§
@) I/ I/ %Excess 10 Pump
[/ I/ Method of Installation Displacement
Depth to Cement in Casing 223' Date Installed --- Type __
I/ I/ Return Constant 181 Yes 0No Manufacturer --- Model No. --
[/ I/ Volume of Grout Return 2 bbls H.P. -- Volts --Capacity __
[/ / G. Borehole Diameter Depth of Pump Intake Setting __
~ ~ Drilling Dates a. 1 5" Q41o1Qa No. of Stages __
H. Pack Type/SizeNA Date NA OOil 0 Water Lubrication
Depth to Top NA Power Source --. Depth to Bottom Material of drop pipe __
Material Bowls --Method oflnstalla tion Shafting __ lmpellors __
1----- Bowl Diameter Gradation ----I~· I. Screen Date 04116/QS
Column Pipe Diameter __ Length __
. Modification --
: Depth to Top 325 to3oii'
Depth to Bottom
Manufacturer Geophysical Logs Run Gamma R~si§tivi:ty SP
PVIO 1-----
Material
_. I- Slot .01" 1-----f-----
J. Bottom Cap
Material PW'-'
Length I"
Driller TQmmx
Boring Depth 3~7'
®- . - · ...
Additional Information
******Mechanical Integrity Test******
PSI Increments 5 Calibration Date of Gage t--· PSI Full Seale Test Run By Stan Davis, Dan Tschopp Date Test Run 04115/08 Water Quality
Time Beginning of Test 0830 Time End of Test 0930 Sample taken? DYes 0No
Initial Pressure 35.0 PSIG Initial Fluid Level 4 inches Where analyzed.? Final Pressure 35.0 PSIG Final Fluid Level 4inches
Date well completed Q411!l/Qa
July 2012 J-163 Appendix J

WELL DEVELOPMENT RECORD- PARAMETER MEASUREMENTS
Total Volume
I Well Withdrawal Conductivity Temp Turbidity
No. Time pH
(ms/cm) (OC) (NTU) Comments
Gallons Borehole Volume
Well developed: 04/16/08
Water cleared up within 5 minutes
Unload Pressure: 150 psi
Steady Lift Pressure: 45 psi
Output: Approximately 30 gpm
Screened Interval: Lakota SS formation
July 2012 J-164 Appendix J

Knight Piesold CON8ULTING
Appendix C-2 Time and Water Level Data Values Used in Pumping Test
Analysis: Burdock Test, Drawdc•wn Data
July 2012 J-165 Appendix J

Table C.2-1:
Time and Water Level Data Values Used in Pumping Test Analysis: Burdock Test, Drawdown Data
11-2 3664.8 11-14C 3660.9 11-15 3660.2 11-19* 3662.1 11-11C** 3662
Time (days) Drawdown (ft) Elevation (ft) Time (days) Drawdown (ft) Elevation (ft) Time (days) Drawdown (ft)Elevation (ft) Time (days) Drawdown (ft) Elevation (ft) Time (days) Drawdown (ft) Elevation (ft)
0.000012 -0.024157 3664.8 0.000012 -0.009060 3660.9 0.000012 0.000000 3660.2 0.000012 0.047297 3662.1 0.000025 1.516154 3660
0.000023 -0.047234 3664.8 0.000023 0.018633 3660.9 0.000023 -0.023077 3660.2 0.000058 0.072682 3662.0 0.000035 1.781538 3660
0.000035 -0.038003 3664.8 0.000035 0.002479 3660.9 0.000035 -0.025385 3660.2 0.000069 0.042682 3662.1 0.000046 2.453077 3660
0.000046 0.081997 3664.7 0.000046 0.002479 3660.9 0.000046 0.030000 3660.2 0.000093 0.010374 3662.1 0.000058 2.967692 3659
0.000058 0.033535 3664.8 0.000058 -0.078290 3661.0 0.000058 -0.013846 3660.2 0.000116 0.042682 3662.1 0.000069 3.648462 3658
0.000069 0.021997 3664.8 0.000069 -0.015983 3660.9 0.000069 0.009231 3660.2 0.000162 0.031143 3662.1 0.000083 4.463077 3658
0.000081 0.070458 3664.7 0.000081 0.060171 3660.8 0.000081 -0.053077 3660.3 0.000174 0.054220 3662.0 0.000093 5.010000 3657
0.000093 -0.028772 3664.8 0.000093 0.007094 3660.9 0.000093 -0.009231 3660.2 0.000185 0.031143 3662.1 0.000104 5.016923 3657
0.000104 -0.051849 3664.9 0.000104 0.011710 3660.9 0.000104 -0.018462 3660.2 0.000197 0.010374 3662.1 0.000116 5.480769 3657
0.000116 -0.040311 3664.8 0.000116 -0.027521 3660.9 0.000116 0.011538 3660.2 0.000208 0.047297 3662.1 0.000127 5.746154 3656
0.000127 -0.061080 3664.9 0.000127 -0.015983 3660.9 0.000127 -0.032308 3660.2 0.000220 0.031143 3662.1 0.000141 5.981538 3656
0.000139 -0.021849 3664.8 0.000139 -0.004444 3660.9 0.000139 0.129231 3660.1 0.000255 0.017297 3662.1 0.000150 6.256154 3656
0.000150 0.072766 3664.7 0.000150 0.016325 3660.9 0.000150 0.025385 3660.2 0.000289 0.010374 3662.1 0.000162 6.306923 3656
0.000162 -0.058772 3664.9 0.000162 0.011710 3660.9 0.000162 0.009231 3660.2 0.000370 0.042682 3662.1 0.000174 6.773077 3655
0.000174 -0.040311 3664.8 0.000174 0.002479 3660.9 0.000174 -0.011538 3660.2 0.000498 0.051912 3662.0 0.000185 6.969231 3655
0.000185 -0.044926 3664.8 0.000185 -0.013675 3660.9 0.000185 0.002308 3660.2 0.000521 0.003451 3662.1 0.000199 7.061539 3655
0.000197 -0.031080 3664.8 0.000197 -0.022906 3660.9 0.000197 0.018462 3660.2 0.000833 0.056528 3662.0 0.000208 7.377692 3655
0.000208 -0.021849 3664.8 0.000208 -0.032137 3660.9 0.000208 0.101538 3660.1 0.001111 0.051912 3662.0 0.000220 7.467692 3655
0.000220 -0.061080 3664.9 0.000220 -0.034444 3660.9 0.000220 -0.006923 3660.2 0.001319 0.012682 3662.1 0.000231 7.873846 3654
0.000231 -0.012619 3664.8 0.000231 0.023248 3660.9 0.000231 0.013846 3660.2 0.002639 0.054220 3662.0 0.000243 8.206154 3654
0.000243 -0.008003 3664.8 0.000243 0.016325 3660.9 0.000243 -0.027692 3660.2 0.004167 0.001143 3662.1 0.000257 9.445385 3653
0.000255 0.045074 3664.8 0.000255 -0.002137 3660.9 0.000255 -0.020769 3660.2 0.005903 0.033451 3662.1 0.000266 9.078462 3653
0.000266 -0.019542 3664.8 0.000266 0.030171 3660.9 0.000266 -0.004615 3660.2 0.007292 0.070374 3662.0 0.000278 9.729231 3652
0.000278 0.040458 3664.8 0.000278 0.009402 3660.9 0.000278 0.018462 3660.2 0.008333 0.008066 3662.1 0.000289 9.835384 3652
0.000289 0.001228 3664.8 0.000289 -0.020598 3660.9 0.000289 0.023077 3660.2 0.009028 0.024220 3662.1 0.000301 10.308461 3652
0.000301 0.063535 3664.7 0.000301 -0.039060 3660.9 0.000301 -0.009231 3660.2 0.020833 0.003451 3662.1 0.000312 10.712308 3651
0.000312 0.045074 3664.8 0.000312 -0.006752 3660.9 0.000312 -0.018462 3660.2 0.025000 0.019605 3662.1 0.000324 11.180769 3651
0.000324 -0.065696 3664.9 0.000324 0.000171 3660.9 0.000324 0.006923 3660.2 0.072917 0.077297 3662.0 0.000336 11.457692 3651
0.000336 0.081997 3664.7 0.000336 0.004786 3660.9 0.000336 -0.027692 3660.2 0.079896 0.005759 3662.1 0.000347 11.833846 3650
0.000347 0.070458 3664.7 0.000347 0.032479 3660.9 0.000347 -0.004615 3660.2 0.083368 0.003451 3662.1 0.000359 12.263077 3650
0.000359 0.091228 3664.7 0.000359 -0.009060 3660.9 0.000359 0.011538 3660.2 0.090313 0.028836 3662.1 0.000370 11.210770 3651
0.000370 0.058920 3664.7 0.000370 -0.029829 3660.9 0.000370 -0.002308 3660.2 0.097257 0.038066 3662.1 0.000382 11.289230 3651
0.000382 0.056612 3664.7 0.000382 0.018633 3660.9 0.000382 -0.020769 3660.2 0.104201 0.081912 3662.0 0.000394 12.422308 3650
0.000394 0.077381 3664.7 0.000394 -0.006752 3660.9 0.000394 0.013846 3660.2 0.111146 0.088836 3662.0 0.000405 12.669230 3649
0.000417 -0.070311 3664.9 0.000405 0.002479 3660.9 0.000417 0.011538 3660.2 0.118206 0.128066 3662.0 0.000417 12.837692 3649
0.000451 -0.061080 3664.9 0.000417 0.004786 3660.9 0.000451 -0.011538 3660.2 0.125035 0.155759 3661.9 0.000428 12.692307 3649
0.000463 -0.008003 3664.8 0.000451 0.002479 3660.9 0.000463 0.090000 3660.1 0.131979 0.155759 3661.9 0.000451 13.112308 3649
0.000486 -0.019542 3664.8 0.000463 0.009402 3660.9 0.000486 -0.018462 3660.2 0.138924 0.160374 3661.9 0.000463 13.324615 3649
0.000498 0.072766 3664.7 0.000486 -0.027521 3660.9 0.000498 0.000000 3660.2 0.149340 0.174220 3661.9 0.000486 13.633846 3648
0.000521 0.008151 3664.8 0.000498 -0.043675 3660.9 0.000521 0.000000 3660.2 0.159757 0.204220 3661.9 0.000498 13.970769 3648
0.000532 0.061228 3664.7 0.000521 -0.039060 3660.9 0.000532 0.006923 3660.2 0.170174 0.208836 3661.9 0.000521 14.370000 3648
0.000556 0.079689 3664.7 0.000532 -0.006752 3660.9 0.000556 0.009231 3660.2 0.180590 0.238836 3661.9 0.000532 15.939231 3646
0.000590 0.035843 3664.8 0.000556 0.014017 3660.9 0.000590 0.013846 3660.2 0.194479 0.275759 3661.8 0.000556 15.150000 3647
0.000625 -0.047234 3664.8 0.000590 0.011710 3660.9 0.000625 0.000000 3660.2 0.208368 0.326528 3661.8 0.000590 16.077692 3646
0.000660 0.045074 3664.8 0.000625 0.050940 3660.8 0.000660 -0.025385 3660.2 0.222257 0.342682 3661.8 0.000625 17.023846 3645
0.000694 -0.049542 3664.8 0.000660 0.055556 3660.8 0.000694 -0.009231 3660.2 0.236146 0.368066 3661.7 0.000660 17.820000 3644
0.000729 0.088920 3664.7 0.000694 -0.009060 3660.9 0.000729 0.016154 3660.2 0.250035 0.398066 3661.7 0.000694 18.664616 3643
0.000764 -0.040311 3664.8 0.000729 -0.004444 3660.9 0.000764 -0.027692 3660.2 0.263924 0.478836 3661.6 0.000729 19.426153 3643
0.000799 0.091228 3664.7 0.000764 0.018633 3660.9 0.000799 0.126923 3660.1 0.277812 0.485759 3661.6 0.000764 20.319231 3642
G:\102\00279.01\Deliverables\Reports - Specs\Hydrogeologic Testing Report\Rev1\Appendices\AppendixB-Rev1\
App C_2 Burdock Drawdown Data Tables_RevTR 1 of 411/12/2008
Revised July 2010
July 2012J-166
Appendix J

Table C.2-1:
Time and Water Level Data Values Used in Pumping Test Analysis: Burdock Test, Drawdown Data
11-2 3664.8 11-14C 3660.9 11-15 3660.2 11-19* 3662.1 11-11C** 3662
Time (days) Drawdown (ft) Elevation (ft) Time (days) Drawdown (ft) Elevation (ft) Time (days) Drawdown (ft)Elevation (ft) Time (days) Drawdown (ft) Elevation (ft) Time (days) Drawdown (ft) Elevation (ft)
0.000833 -0.047234 3664.8 0.000799 0.014017 3660.9 0.000833 0.122308 3660.1 0.295174 0.548066 3661.6 0.000799 20.972307 3641
0.000903 0.049689 3664.8 0.000833 0.041710 3660.9 0.000903 0.018462 3660.2 0.312535 0.548066 3661.6 0.000833 21.867693 3640
0.000972 -0.012619 3664.8 0.000903 -0.004444 3660.9 0.000972 0.053077 3660.1 0.329896 0.617297 3661.5 0.000903 23.321539 3639
0.001042 -0.035696 3664.8 0.000972 -0.015983 3660.9 0.001042 0.002308 3660.2 0.347257 0.642682 3661.5 0.000972 24.676153 3637
0.001111 -0.038003 3664.8 0.001042 -0.004444 3660.9 0.001111 -0.020769 3660.2 0.370405 0.753451 3661.3 0.001042 25.989231 3636
0.001181 -0.044926 3664.8 0.001111 0.004786 3660.9 0.001181 0.000000 3660.2 0.393553 0.801912 3661.3 0.001111 27.496155 3635
0.001250 -0.038003 3664.8 0.001181 0.011710 3660.9 0.001250 0.032308 3660.2 0.416701 0.799605 3661.3 0.001181 28.686924 3633
0.001319 -0.077234 3664.9 0.001250 0.023248 3660.9 0.001319 -0.041538 3660.2 0.439965 0.824989 3661.3 0.001250 30.036922 3632
0.001389 -0.019542 3664.8 0.001319 0.018633 3660.9 0.001389 -0.032308 3660.2 0.462998 0.912682 3661.2 0.001319 31.310770 3631
0.001493 -0.058772 3664.9 0.001389 0.034786 3660.9 0.001493 0.002308 3660.2 0.486146 0.947297 3661.2 0.001389 32.589230 3629
0.001597 -0.021849 3664.8 0.001493 -0.002137 3660.9 0.001597 -0.046154 3660.2 0.520868 1.004989 3661.1 0.001493 34.361538 3628
0.001701 -0.061080 3664.9 0.001597 0.027863 3660.9 0.001701 0.023077 3660.2 0.555590 1.060374 3661.0 0.001597 36.092308 3626
0.001806 -0.012619 3664.8 0.001701 0.050940 3660.8 0.001806 0.013846 3660.2 0.590312 1.099605 3661.0 0.001701 37.631538 3624
0.001944 -0.044926 3664.8 0.001806 0.037094 3660.9 0.001944 0.006923 3660.2 0.625035 1.233451 3660.9 0.001806 39.083076 3623
0.002083 -0.019542 3664.8 0.001944 0.018633 3660.9 0.002083 -0.020769 3660.2 0.659757 1.270374 3660.8 0.001944 41.026154 3621
0.002222 -0.077234 3664.9 0.002083 0.044017 3660.9 0.002222 0.018462 3660.2 0.694479 1.332682 3660.8 0.002083 42.489231 3620
0.002361 -0.001080 3664.8 0.002222 0.037094 3660.9 0.002361 -0.002308 3660.2 0.729549 1.408836 3660.7 0.002222 44.259232 3618
0.002500 -0.044926 3664.8 0.002361 0.023248 3660.9 0.002500 0.006923 3660.2 0.763924 1.466528 3660.6 0.002361 45.662308 3616
0.002639 -0.056465 3664.9 0.002500 0.101710 3660.8 0.002639 -0.046154 3660.2 0.798646 1.535759 3660.6 0.002500 47.166924 3615
0.002778 -0.038003 3664.8 0.002639 0.108633 3660.8 0.002778 -0.006923 3660.2 0.833368 1.604989 3660.5 0.002639 48.606922 3613
0.002951 -0.038003 3664.8 0.002778 0.057863 3660.8 0.002951 -0.016154 3660.2 0.902928 1.736528 3660.4 0.002778 49.860001 3612
0.003125 -0.019542 3664.8 0.002951 0.129402 3660.8 0.003125 -0.023077 3660.2 0.972951 1.794220 3660.3 0.002951 51.387692 3611
0.003299 -0.068003 3664.9 0.003125 0.090171 3660.8 0.003299 -0.011538 3660.2 1.041701 1.907297 3660.2 0.003125 52.799999 3609
0.003472 -0.084157 3664.9 0.003299 0.092479 3660.8 0.003472 0.041538 3660.2 1.111146 1.960374 3660.1 0.003299 54.080769 3608
0.003704 -0.040311 3664.8 0.003472 0.108633 3660.8 0.003704 0.027692 3660.2 1.180590 2.094220 3660.0 0.003472 55.310768 3607
0.003935 -0.051849 3664.9 0.003704 0.129402 3660.8 0.003935 -0.011538 3660.2 1.250035 2.101143 3660.0 0.003704 56.683846 3605
0.004167 -0.038003 3664.8 0.003935 0.150171 3660.7 0.004167 0.016154 3660.2 1.319479 2.193451 3659.9 0.003935 57.895386 3604
0.004398 -0.063388 3664.9 0.004167 0.164017 3660.7 0.004398 0.013846 3660.2 1.388924 2.311143 3659.8 0.004167 59.180771 3603
0.004630 -0.058772 3664.9 0.004398 0.196325 3660.7 0.004630 0.006923 3660.2 1.493090 2.396528 3659.7 0.004398 60.244614 3602
0.004861 -0.021849 3664.8 0.004630 0.228633 3660.7 0.004861 -0.053077 3660.3 1.597257 2.504989 3659.6 0.004630 61.167694 3601
0.005208 -0.035696 3664.8 0.004861 0.247094 3660.7 0.005208 -0.023077 3660.2 1.701424 2.620374 3659.5 0.004861 61.975384 3600
0.005556 -0.086465 3664.9 0.005208 0.295556 3660.6 0.005556 -0.036923 3660.2 1.805590 2.756528 3659.3 0.005208 63.325386 3599
0.005903 -0.026465 3664.8 0.005556 0.330171 3660.6 0.005903 -0.011538 3660.2 1.944479 2.848835 3659.3 0.005556 64.400772 3598
0.006250 -0.028772 3664.8 0.005903 0.374017 3660.5 0.006250 0.025385 3660.2 2.083368 2.890374 3659.2 0.005903 65.418465 3597
0.006597 -0.058772 3664.9 0.006250 0.429402 3660.5 0.006597 0.041538 3660.2 2.222257 2.915759 3659.2 0.006250 66.311539 3596
0.006944 -0.063388 3664.9 0.006597 0.498633 3660.4 0.006944 -0.016154 3660.2 2.361146 2.984989 3659.1 0.006597 67.100769 3595
0.007292 -0.051849 3664.9 0.006944 0.560940 3660.3 0.007292 0.011538 3660.2 2.500035 3.086528 3659.0 0.006944 67.728462 3594
0.007639 -0.070311 3664.9 0.007292 0.620940 3660.3 0.007639 -0.023077 3660.2 2.638924 3.148836 3659.0 0.007292 68.552307 3593
0.007986 -0.086465 3664.9 0.007639 0.653248 3660.2 0.007986 0.000000 3660.2 2.777813 3.222682 3658.9 0.007639 69.124619 3593
0.008333 -0.088772 3664.9 0.007986 0.678633 3660.2 0.008333 0.009231 3660.2 2.951423 3.358835 3658.7 0.007986 69.708458 3592
0.009028 -0.024157 3664.8 0.008333 0.745556 3660.2 0.009028 -0.002308 3660.2 2.999988 3.358835 3658.7 0.008333 70.416924 3592
0.009722 -0.021849 3664.8 0.009028 0.881710 3660.0 0.009722 -0.009231 3660.2 0.009028 71.642311 3590
0.010417 -0.033388 3664.8 0.009722 0.950940 3659.9 0.010417 0.002308 3660.2 0.009722 72.440773 3590
0.011111 0.075074 3664.7 0.010417 1.103248 3659.8 0.011111 -0.016154 3660.2 0.010417 73.167694 3589
0.011806 -0.065696 3664.9 0.011111 1.193248 3659.7 0.011806 -0.004615 3660.2 0.011111 73.636154 3588
0.012500 -0.044926 3664.8 0.011806 1.287863 3659.6 0.012500 0.025385 3660.2 0.011806 74.150772 3588
0.013194 -0.056465 3664.9 0.012500 1.424017 3659.5 0.013194 0.011538 3660.2 0.012500 74.545387 3587
0.013889 -0.031080 3664.8 0.013194 1.504786 3659.4 0.013889 -0.046154 3660.2 0.013194 74.815384 3587
0.014931 0.065843 3664.7 0.013889 1.703248 3659.2 0.014931 -0.002308 3660.2 0.013889 74.995384 3587
G:\102\00279.01\Deliverables\Reports - Specs\Hydrogeologic Testing Report\Rev1\Appendices\AppendixB-Rev1\
App C_2 Burdock Drawdown Data Tables_RevTR 2 of 411/12/2008
Revised July 2010
July 2012J-167
Appendix J

Table C.2-1:
Time and Water Level Data Values Used in Pumping Test Analysis: Burdock Test, Drawdown Data
11-2 3664.8 11-14C 3660.9 11-15 3660.2 11-19* 3662.1 11-11C** 3662
Time (days) Drawdown (ft) Elevation (ft) Time (days) Drawdown (ft) Elevation (ft) Time (days) Drawdown (ft)Elevation (ft) Time (days) Drawdown (ft) Elevation (ft) Time (days) Drawdown (ft) Elevation (ft)
0.015972 -0.047234 3664.8 0.014931 1.770171 3659.1 0.015972 -0.023077 3660.2 0.014931 75.251541 3587
0.017014 -0.084157 3664.9 0.015972 1.934017 3659.0 0.017014 -0.011538 3660.2 0.015972 75.565384 3586
0.018056 -0.061080 3664.9 0.017014 2.047094 3658.9 0.018056 0.000000 3660.2 0.017014 75.904617 3586
0.019444 0.008151 3664.8 0.018056 2.213248 3658.7 0.019444 0.011538 3660.2 0.018056 76.105385 3586
0.020833 -0.061080 3664.9 0.019444 2.377094 3658.5 0.020833 0.057692 3660.1 0.019444 76.299232 3586
0.022222 -0.049542 3664.8 0.020833 2.550171 3658.3 0.022222 -0.018462 3660.2 0.020833 76.631538 3585
0.023611 -0.093388 3664.9 0.022222 2.727863 3658.2 0.023611 0.004615 3660.2 0.022222 76.746925 3585
0.025000 -0.042619 3664.8 0.023611 2.861710 3658.0 0.025000 0.025385 3660.2 0.023611 76.998459 3585
0.026389 -0.077234 3664.9 0.025000 3.018633 3657.9 0.026389 0.020769 3660.2 0.024990 77.176155 3585
0.027778 -0.065696 3664.9 0.026389 3.168633 3657.7 0.027778 0.000000 3660.2 0.026389 77.411537 3585
0.029514 -0.068003 3664.9 0.027778 3.297863 3657.6 0.029514 -0.034615 3660.2 0.027778 77.464615 3585
0.031250 -0.051849 3664.9 0.029514 3.415556 3657.5 0.031250 -0.009231 3660.2 0.029514 77.723076 3584
0.032986 -0.040311 3664.8 0.031250 3.563248 3657.3 0.032986 0.000000 3660.2 0.031250 77.755386 3584
0.034722 -0.079542 3664.9 0.032986 3.766325 3657.1 0.034722 -0.004615 3660.2 0.032986 78.025383 3584
0.037037 -0.074926 3664.9 0.034722 3.872479 3657.0 0.037037 -0.025385 3660.2 0.034722 78.302307 3584
0.039352 -0.077234 3664.9 0.037037 4.091710 3656.8 0.039352 0.030000 3660.2 0.037037 78.260773 3584
0.041667 -0.079542 3664.9 0.039352 4.195556 3656.7 0.041667 0.090000 3660.1 0.039352 78.567696 3583
0.043981 0.049689 3664.8 0.041667 4.417094 3656.5 0.043981 -0.027692 3660.2 0.041667 78.678459 3583
0.046296 0.049689 3664.8 0.043981 4.640940 3656.3 0.046296 0.057692 3660.1 0.043981 78.959999 3583
0.048611 -0.047234 3664.8 0.046296 4.664017 3656.2 0.048611 0.009231 3660.2 0.046296 79.008461 3583
0.052083 0.084304 3664.7 0.048611 4.827863 3656.1 0.052083 0.011538 3660.2 0.048611 79.151535 3583
0.055556 0.051997 3664.7 0.052083 5.035556 3655.9 0.055556 -0.009231 3660.2 0.052083 79.290001 3583
0.059028 0.049689 3664.8 0.055556 5.222479 3655.7 0.059028 0.000000 3660.2 0.055556 79.437691 3583
0.062500 -0.008003 3664.8 0.059028 5.358633 3655.5 0.062500 0.018462 3660.2 0.059028 79.666153 3582
0.065972 0.028920 3664.8 0.062500 5.568633 3655.3 0.065972 0.034615 3660.2 0.062500 79.823074 3582
0.069444 -0.012619 3664.8 0.065972 5.750940 3655.1 0.069444 0.036923 3660.2 0.065972 80.005386 3582
0.072917 0.061228 3664.7 0.069444 5.854786 3655.0 0.072917 0.027692 3660.2 0.069444 80.173843 3582
0.076470 -0.054157 3664.9 0.072917 6.044017 3654.9 0.076389 0.106154 3660.1 0.072917 80.266151 3582
0.079942 -0.003388 3664.8 0.076389 6.161710 3654.7 0.079861 0.060000 3660.1 0.076389 80.420769 3582
0.083414 -0.047234 3664.8 0.079942 6.325556 3654.6 0.083449 0.057692 3660.1 0.079861 80.533844 3581
0.090359 -0.038003 3664.8 0.083414 6.470940 3654.4 0.090394 0.101538 3660.1 0.083368 80.702309 3581
0.097303 -0.005696 3664.8 0.090359 6.738633 3654.2 0.097338 0.152308 3660.0 0.090313 80.923843 3581
0.104248 0.035843 3664.8 0.097303 6.953248 3653.9 0.104282 0.170769 3660.0 0.097257 81.223846 3581
0.111192 0.003535 3664.8 0.104248 7.172479 3653.7 0.111227 0.163846 3660.0 0.104201 81.373848 3581
0.118137 0.021997 3664.8 0.111192 7.414786 3653.5 0.118171 0.233077 3660.0 0.111146 83.363075 3579
0.125081 -0.001080 3664.8 0.118137 7.659402 3653.2 0.125116 0.267692 3659.9 0.118206 83.801537 3578
0.132025 0.026612 3664.8 0.125081 7.855556 3653.0 0.132060 0.306923 3659.9 0.125035 84.023079 3578
0.138970 0.045074 3664.8 0.132025 8.058633 3652.8 0.139005 0.346154 3659.9 0.131979 84.295387 3578
0.149387 0.047381 3664.8 0.138970 8.254786 3652.6 0.149421 0.433846 3659.8 0.138924 84.408463 3578
0.159803 0.021997 3664.8 0.149387 8.520171 3652.4 0.159838 0.450000 3659.8 0.149340 84.701538 3577
0.170220 0.045074 3664.8 0.159803 8.787864 3652.1 0.170255 0.567692 3659.6 0.159757 84.886154 3577
0.180637 0.072766 3664.7 0.170220 9.032478 3651.9 0.180671 0.634615 3659.6 0.170174 85.036156 3577
0.194525 0.102766 3664.7 0.180637 9.251710 3651.6 0.194560 0.745385 3659.5 0.180590 85.093849 3577
0.208414 0.125843 3664.7 0.194525 9.535556 3651.4 0.208449 0.860769 3659.3 0.194481 85.407692 3577
0.222303 0.169689 3664.6 0.208414 9.777864 3651.1 0.222338 0.960000 3659.2 0.208368 85.668465 3576
0.236192 0.167381 3664.6 0.222303 10.004017 3650.9 0.236227 1.112308 3659.1 0.222257 85.698463 3576
0.250081 0.190458 3664.6 0.236192 10.220941 3650.7 0.250116 1.174615 3659.0 0.236146 85.924614 3576
0.263970 0.271228 3664.5 0.250081 10.463248 3650.4 0.264005 1.359231 3658.8 0.250035 86.176155 3576
0.277859 0.268920 3664.5 0.263970 10.629402 3650.3 0.277894 1.467692 3658.7 0.263924 86.381538 3576
0.295220 0.301228 3664.5 0.277859 10.839402 3650.1 0.295255 1.615385 3658.6 0.277812 86.476151 3576
0.312581 0.342766 3664.5 0.295220 11.037864 3649.9 0.312616 1.804615 3658.4 0.295174 86.568459 3575
G:\102\00279.01\Deliverables\Reports - Specs\Hydrogeologic Testing Report\Rev1\Appendices\AppendixB-Rev1\
App C_2 Burdock Drawdown Data Tables_RevTR 3 of 411/12/2008
Revised July 2010
July 2012J-168
Appendix J

Table C.2-1:
Time and Water Level Data Values Used in Pumping Test Analysis: Burdock Test, Drawdown Data
11-2 3664.8 11-14C 3660.9 11-15 3660.2 11-19* 3662.1 11-11C** 3662
Time (days) Drawdown (ft) Elevation (ft) Time (days) Drawdown (ft) Elevation (ft) Time (days) Drawdown (ft)Elevation (ft) Time (days) Drawdown (ft) Elevation (ft) Time (days) Drawdown (ft) Elevation (ft)
0.329942 0.368151 3664.4 0.312581 11.213248 3649.7 0.329977 1.929231 3658.3 0.312535 86.683846 3575
0.347303 0.411997 3664.4 0.329942 11.411710 3649.5 0.347338 2.118462 3658.1 0.329896 86.801537 3575
0.370451 0.499689 3664.3 0.347303 11.594017 3649.3 0.370486 2.303077 3657.9 0.347257 87.147690 3575
0.393600 0.548151 3664.3 0.370451 11.884787 3649.0 0.393634 2.524615 3657.7 0.370405 87.223846 3575
0.416748 0.561997 3664.2 0.393600 12.039402 3648.9 0.416782 2.764615 3657.4 0.393553 87.353073 3575
0.440012 0.619689 3664.2 0.416748 12.240171 3648.7 0.440046 2.933077 3657.3 0.416701 87.613846 3574
0.463044 0.688920 3664.1 0.440012 12.397094 3648.5 0.463079 3.168462 3657.0 0.439965 87.560768 3574
0.486192 0.762766 3664.0 0.463044 12.602479 3648.3 0.486227 3.297692 3656.9 0.462998 87.625381 3574
0.520914 0.806612 3664.0 0.486192 12.685555 3648.2 0.520949 3.620769 3656.6 0.486146 87.985382 3574
0.555637 0.820458 3664.0 0.520914 12.969402 3647.9 0.555671 3.913846 3656.3 0.520868 88.033844 3574
0.590359 0.894304 3663.9 0.555637 13.144787 3647.8 0.590394 4.144615 3656.1 0.555590 88.010773 3574
0.625081 0.995843 3663.8 0.590359 13.317863 3647.6 0.625116 4.352308 3655.8 0.590312 88.456154 3574
0.659803 1.044304 3663.8 0.625081 13.433248 3647.5 0.659838 4.668461 3655.5 0.625035 88.396156 3574
0.694525 1.097381 3663.7 0.659803 13.574018 3647.3 0.694560 4.846154 3655.4 0.659757 88.737694 3573
0.729595 1.136612 3663.7 0.694525 13.707864 3647.2 0.729630 5.088461 3655.1 0.694479 88.555382 3573
0.763970 1.224304 3663.6 0.729595 13.867094 3647.0 0.764005 5.245385 3655.0 0.729549 88.721535 3573
0.798692 1.295843 3663.5 0.763970 13.973248 3646.9 0.798727 5.476154 3654.7 0.763924 88.975388 3573
0.833414 1.399689 3663.4 0.798692 14.224787 3646.7 0.833449 5.651538 3654.5 0.798646 88.666153 3573
0.902859 1.487381 3663.3 0.833414 14.324018 3646.6 0.902893 6.032308 3654.2 0.833368 88.786156 3573
0.972998 1.598151 3663.2 0.902859 14.557095 3646.3 0.973032 6.346154 3653.9 0.902928 88.931541 3573
1.041748 1.711228 3663.1 0.972998 14.723248 3646.2 1.041782 6.643846 3653.6 0.972951 89.081535 3573
1.111192 1.757381 3663.0 1.041748 14.868632 3646.0 1.111227 6.946154 3653.3 1.041701 89.093079 3573
1.180637 1.840458 3663.0 1.111192 15.067094 3645.8 1.180671 7.181539 3653.0 1.111146 89.376923 3573
1.250081 1.900458 3662.9 1.180637 15.187094 3645.7 1.250116 7.375385 3652.8 1.180590 89.307693 3573
1.319525 2.008920 3662.8 1.250081 15.297863 3645.6 1.319560 7.629231 3652.6 1.250035 89.554619 3572
1.388970 2.117381 3662.7 1.319525 15.378633 3645.5 1.389005 7.820769 3652.4 1.319479 89.826920 3572
1.493137 2.207381 3662.6 1.388970 15.614017 3645.3 1.493171 8.093077 3652.1 1.388924 90.085388 3572
1.597303 2.299689 3662.5 1.493137 15.789402 3645.1 1.597338 8.406923 3651.8 1.493090 89.976921 3572
1.701470 2.440458 3662.4 1.597303 15.893248 3645.0 1.701505 8.614615 3651.6 1.597257 90.182304 3572
1.805637 2.486612 3662.3 1.701470 16.008633 3644.9 1.805671 8.824615 3651.4 1.701424 90.168465 3572
1.944525 2.585843 3662.2 1.805637 16.149403 3644.8 1.944560 9.115385 3651.1 1.805590 90.166153 3572
2.083414 2.634305 3662.2 1.944525 16.310940 3644.6 2.083449 9.323077 3650.9 1.944479 90.678459 3571
2.222303 2.668920 3662.1 2.083414 16.405556 3644.5 2.222338 9.459230 3650.7 2.083368 90.639229 3571
2.361192 2.724304 3662.1 2.222303 16.516325 3644.4 2.361227 9.602307 3650.6 2.222257 90.736153 3571
2.500081 2.844305 3662.0 2.361192 16.587864 3644.3 2.500116 9.766154 3650.4 2.361146 90.819229 3571
2.638970 2.837381 3662.0 2.500081 16.634018 3644.3 2.639005 9.953077 3650.2 2.500035 91.047691 3571
2.777859 2.966612 3661.8 2.638970 16.770170 3644.1 2.777894 10.040770 3650.2 2.638924 91.165382 3571
2.951470 3.084305 3661.7 2.777859 16.874018 3644.0 2.951505 10.250770 3649.9 2.777813 91.137695 3571
2.999988 3.063535 3661.7 2.951470 17.010172 3643.9 2.999988 10.373077 3649.8 2.951423 91.176926 3571
2.999988 17.014786 3643.9 2.999988 91.066154 3571
General Methodology: PSI, temperature, and time readings from Win-SituTM
digital data log were exported to Excel ".csv" file.
Drawdown was calculated as PSI at time after pumping minus average PSI before pumping; therefore, at small or zero changes
in PSI negative drawdowns may be calculated.
A FORTRAN program was written to read the ".csv" file and produce a second file by extracting the records at a frequency of 40
per log-time cycle (in minutes) in order achieve equal representation of data throughout the pumping and drawdown phases of the test.
Elevation (in ft above mean sea level) based on initial groundwater elevation (see Table 5.2) minus drawdown.
Notes: * = early time data filtered to remove calculated negative drawdown values
** = initial measurement of groundwater elevation not available; approximate initial groundwater elevation estimated from adjacent wells.
G:\102\00279.01\Deliverables\Reports - Specs\Hydrogeologic Testing Report\Rev1\Appendices\AppendixB-Rev1\
App C_2 Burdock Drawdown Data Tables_RevTR 4 of 411/12/2008
Revised July 2010
July 2012J-169
Appendix J

Knight Piesold CON.ULTING
Appendix C-3 Time and Water Level Data Values Used in Pumping Test
Analysis: Burdock Test, Recovery Data
July 2012 J-170 Appendix J

Table C.3-1:
Time and Water Level Data Values Used in Pumping Test Analysis: Burdock Test, Recovery Data
11-2 3664.8 11-14C 3660.9 11-15 3660.2 11-19 3662.1 11-11C 3662
Time (days) Drawdown (ft) Elevation (ft) Time (days) Drawdown (ft) Elevation (ft) Time (days) Drawdown (ft) Elevation (ft) Time (days) Drawdown (ft) Elevation (ft) Time (days) Drawdown (ft) Elevation (ft)
3.000035 3.052742 3661.7 3.000035 17.052603 3643.8 3.000035 10.293365 3649.9 3.000035 3.347297 3658.8 3.002651 91.335097 3571
3.000046 3.045798 3661.8 3.000046 17.017954 3643.9 3.000046 10.353427 3649.8 3.000046 3.370374 3658.7 3.002662 89.775840 3572
3.000058 3.094334 3661.7 3.000058 17.075690 3643.8 3.000058 10.328013 3649.9 3.000058 3.455759 3658.6 3.002674 89.062054 3573
3.000070 3.050451 3661.7 3.000070 16.999449 3643.9 3.000070 10.318778 3649.9 3.000070 3.448836 3658.7 3.002685 88.339016 3574
3.000081 3.089717 3661.7 3.000081 17.036424 3643.9 3.000081 10.309544 3649.9 3.000081 3.444220 3658.7 3.002697 87.676058 3574
3.000093 3.061977 3661.7 3.000093 17.006393 3643.9 3.000093 10.328013 3649.9 3.000093 3.444220 3658.7 3.002708 87.077762 3575
3.000104 3.075829 3661.7 3.000104 17.027189 3643.9 3.000104 10.445812 3649.8 3.000104 3.358835 3658.7 3.002720 86.327019 3576
3.000116 3.055068 3661.7 3.000116 17.013337 3643.9 3.000116 10.274895 3649.9 3.000116 3.351912 3658.7 3.002732 85.668660 3576
3.000127 3.078155 3661.7 3.000127 16.997158 3643.9 3.000127 10.291038 3649.9 3.000127 3.430374 3658.7 3.002743 85.077308 3577
3.000139 3.057359 3661.7 3.000139 16.980979 3643.9 3.000139 10.399637 3649.8 3.000139 3.437297 3658.7 3.002755 84.428184 3578
3.000151 3.066594 3661.7 3.000151 17.052603 3643.8 3.000151 10.307217 3649.9 3.000151 3.335759 3658.8 3.002766 83.869172 3578
3.000162 3.055068 3661.7 3.000162 17.020246 3643.9 3.000162 10.328013 3649.9 3.000162 3.400374 3658.7 3.002778 83.215448 3579
3.000174 3.071212 3661.7 3.000174 17.001776 3643.9 3.000174 10.267951 3649.9 3.000174 3.432682 3658.7 3.002789 82.612535 3579
3.000185 3.089717 3661.7 3.000185 17.013337 3643.9 3.000185 10.445812 3649.8 3.000185 3.393451 3658.7 3.002801 82.021165 3580
3.000197 3.048124 3661.8 3.000197 17.020246 3643.9 3.000197 10.323396 3649.9 3.000197 3.409605 3658.7 3.002813 81.385929 3581
3.000208 3.050451 3661.7 3.000208 17.004067 3643.9 3.000208 10.291038 3649.9 3.000208 3.432682 3658.7 3.002824 80.928536 3581
3.000220 3.098952 3661.7 3.000220 17.013337 3643.9 3.000220 10.300273 3649.9 3.000220 3.391143 3658.7 3.002836 80.267886 3582
3.000232 3.036563 3661.8 3.000232 17.027189 3643.9 3.000232 10.300273 3649.9 3.000232 3.448836 3658.7 3.002847 79.845142 3582
3.000243 3.075829 3661.7 3.000243 16.992541 3643.9 3.000243 10.330304 3649.9 3.000243 3.356528 3658.7 3.002859 79.119812 3583
3.000255 3.085099 3661.7 3.000255 16.990214 3643.9 3.000255 10.281804 3649.9 3.000255 3.488066 3658.6 3.002870 78.657802 3583
3.000266 3.087390 3661.7 3.000266 17.020246 3643.9 3.000266 10.399637 3649.8 3.000266 3.344989 3658.8 3.002882 78.015622 3584
3.000278 3.085099 3661.7 3.000278 16.974036 3643.9 3.000278 10.314161 3649.9 3.000278 3.326528 3658.8 3.002894 77.498184 3585
3.000289 3.029654 3661.8 3.000289 17.057220 3643.8 3.000289 10.314161 3649.9 3.000289 3.483451 3658.6 3.002905 76.918375 3585
3.000301 3.071212 3661.7 3.000301 16.990214 3643.9 3.000301 10.371897 3649.8 3.000301 3.425759 3658.7 3.002917 76.403246 3586
3.000313 3.071212 3661.7 3.000313 17.034098 3643.9 3.000313 10.328013 3649.9 3.000313 3.391143 3658.7 3.002928 75.733344 3586
3.000324 3.101243 3661.7 3.000324 17.015628 3643.9 3.000324 10.295656 3649.9 3.000324 3.400374 3658.7 3.002940 75.220524 3587
3.000336 3.071212 3661.7 3.000336 17.022572 3643.9 3.000336 10.297982 3649.9 3.000336 3.432682 3658.7 3.002951 74.786254 3587
3.000347 3.038889 3661.8 3.000347 16.969418 3643.9 3.000347 10.316452 3649.9 3.000347 3.451143 3658.6 3.002963 74.093246 3588
3.000359 3.096625 3661.7 3.000359 17.006393 3643.9 3.000359 10.334957 3649.9 3.000359 3.455759 3658.6 3.002974 73.559648 3588
3.000370 3.031945 3661.8 3.000370 17.020246 3643.9 3.000370 10.323396 3649.9 3.000370 3.437297 3658.7 3.002986 73.032957 3589
3.000382 3.082773 3661.7 3.000382 16.918626 3644.0 3.000382 10.274895 3649.9 3.000382 3.421143 3658.7 3.002998 72.704941 3589
3.000394 3.043507 3661.8 3.000394 17.022572 3643.9 3.000394 10.316452 3649.9 3.000394 3.425759 3658.7 3.003009 71.935711 3590
3.000405 3.085099 3661.7 3.000405 16.997158 3643.9 3.000405 10.286421 3649.9 3.000405 3.428066 3658.7 3.003021 71.480644 3591
3.000417 3.048124 3661.8 3.000417 17.008684 3643.9 3.000417 10.284130 3649.9 3.000417 3.384220 3658.7 3.003032 70.889274 3591
3.000428 3.096625 3661.7 3.000428 17.031807 3643.9 3.000428 10.302600 3649.9 3.000428 3.458066 3658.6 3.003044 70.441134 3592
3.000451 3.082773 3661.7 3.000451 17.029480 3643.9 3.000451 10.297982 3649.9 3.000451 3.432682 3658.7 3.003067 69.438598 3593
3.000486 3.034272 3661.8 3.000486 17.027189 3643.9 3.000486 10.318778 3649.9 3.000486 3.432682 3658.7 3.003102 68.024879 3594
3.000498 3.041180 3661.8 3.000498 17.041042 3643.9 3.000498 10.311835 3649.9 3.000498 3.414220 3658.7 3.003113 67.482028 3595
3.000509 3.038889 3661.8 3.000509 17.011011 3643.9 3.000509 10.286421 3649.9 3.000509 3.451143 3658.6 3.003125 67.024652 3595
3.000532 3.055068 3661.7 3.000532 16.992541 3643.9 3.000532 10.348810 3649.9 3.000532 3.441912 3658.7 3.003148 66.121445 3596
3.000544 3.034272 3661.8 3.000544 17.008684 3643.9 3.000544 10.281804 3649.9 3.000544 3.402682 3658.7 3.003160 65.712570 3596
3.000567 3.068920 3661.7 3.000567 17.057220 3643.8 3.000567 10.286421 3649.9 3.000567 3.414220 3658.7 3.003183 64.809363 3597
3.000590 3.094334 3661.7 3.000590 17.022572 3643.9 3.000590 10.261007 3649.9 3.000590 3.448836 3658.7 3.003206 64.010101 3598
3.000625 3.052742 3661.7 3.000625 17.008684 3643.9 3.000625 10.295656 3649.9 3.000625 3.356528 3658.7 3.003241 62.806583 3599
3.000660 3.087390 3661.7 3.000660 17.036424 3643.9 3.000660 10.293365 3649.9 3.000660 3.432682 3658.7 3.003276 61.730133 3600
3.000683 3.075829 3661.7 3.000683 17.022572 3643.9 3.000683 10.288747 3649.9 3.000683 3.476528 3658.6 3.003299 60.965520 3601
3.000718 3.055068 3661.7 3.000718 17.017954 3643.9 3.000718 10.425015 3649.8 3.000718 3.340374 3658.8 3.003333 59.974528 3602
3.000764 3.061977 3661.7 3.000764 16.990214 3643.9 3.000764 10.427342 3649.8 3.000764 3.354220 3658.7 3.003380 58.627797 3603
3.000799 3.048124 3661.8 3.000799 17.015628 3643.9 3.000799 10.316452 3649.9 3.000799 3.428066 3658.7 3.003415 57.664528 3604
3.000822 3.085099 3661.7 3.000822 16.999449 3643.9 3.000822 10.286421 3649.9 3.000822 3.448836 3658.7 3.003438 57.070866 3605
G:\102\00279.01\Deliverables\Reports - Specs\Hydrogeologic Testing Report\Rev1\Appendices\AppendixB-Rev1\
App C_3 Burdock Recovery Data Tables_RevTR 1 of 411/12/2008
Revised July 2010 July 2012
J-171 Appendix J

Table C.3-1:
Time and Water Level Data Values Used in Pumping Test Analysis: Burdock Test, Recovery Data
11-2 3664.8 11-14C 3660.9 11-15 3660.2 11-19 3662.1 11-11C 3662
Time (days) Drawdown (ft) Elevation (ft) Time (days) Drawdown (ft) Elevation (ft) Time (days) Drawdown (ft) Elevation (ft) Time (days) Drawdown (ft) Elevation (ft) Time (days) Drawdown (ft) Elevation (ft)
3.000857 3.041180 3661.8 3.000857 16.978688 3643.9 3.000857 10.323396 3649.9 3.000857 3.340374 3658.8 3.003472 56.197673 3606
3.000938 3.041180 3661.8 3.000938 17.029480 3643.9 3.000938 10.358045 3649.8 3.000938 3.448836 3658.7 3.003553 54.402802 3608
3.000995 3.050451 3661.7 3.000995 16.976362 3643.9 3.000995 10.277186 3649.9 3.000995 3.432682 3658.7 3.003611 53.229332 3609
3.001076 3.066594 3661.7 3.001076 17.038715 3643.9 3.001076 10.351101 3649.8 3.001076 3.354220 3658.7 3.003692 51.808687 3610
3.001134 3.055068 3661.7 3.001134 17.008684 3643.9 3.001134 10.304926 3649.9 3.001134 3.354220 3658.7 3.003751 50.990938 3611
3.001215 3.092008 3661.7 3.001215 17.038715 3643.9 3.001215 10.277186 3649.9 3.001215 3.349605 3658.8 3.003821 50.133923 3612
3.001285 3.038889 3661.8 3.001285 17.013337 3643.9 3.001285 10.346483 3649.9 3.001285 3.344989 3658.8 3.003900 49.177597 3613
3.001354 3.082773 3661.7 3.001354 17.013337 3643.9 3.001354 10.300273 3649.9 3.001354 3.328835 3658.8 3.003971 48.334434 3614
3.001423 3.094334 3661.7 3.001423 16.914009 3644.0 3.001423 10.323396 3649.9 3.001423 3.421143 3658.7 3.004039 47.567513 3614
3.001528 3.103569 3661.7 3.001528 16.987923 3643.9 3.001528 10.346483 3649.9 3.001528 3.354220 3658.7 3.004144 46.484136 3616
3.001620 3.061977 3661.7 3.001620 16.987923 3643.9 3.001620 10.385749 3649.8 3.001620 3.358835 3658.7 3.004236 45.405359 3617
3.001736 3.071212 3661.7 3.001736 16.967127 3643.9 3.001736 10.325687 3649.9 3.001736 3.384220 3658.7 3.004352 44.317348 3618
3.001840 3.075829 3661.7 3.001840 16.971745 3643.9 3.001840 10.293365 3649.9 3.001840 3.462682 3658.6 3.004457 43.307886 3619
3.001979 3.094334 3661.7 3.001979 16.976362 3643.9 3.001979 10.302600 3649.9 3.001979 3.441912 3658.7 3.004595 42.021218 3620
3.002130 3.085099 3661.7 3.002130 16.946331 3644.0 3.002130 10.334957 3649.9 3.002130 3.351912 3658.7 3.004745 40.621351 3621
3.002245 3.057359 3661.7 3.002245 16.955566 3643.9 3.002245 10.316452 3649.9 3.002245 3.363451 3658.7 3.004861 39.639594 3622
3.002396 3.031945 3661.8 3.002396 16.955566 3643.9 3.002396 10.304926 3649.9 3.002396 3.351912 3658.7 3.005012 38.581614 3623
3.002535 3.045798 3661.8 3.002535 16.946331 3644.0 3.002535 10.341866 3649.9 3.002535 3.356528 3658.7 3.005151 37.555973 3624
3.002674 3.055068 3661.7 3.002674 16.962510 3643.9 3.002674 10.337248 3649.9 3.002674 3.437297 3658.7 3.005289 36.467962 3626
3.002812 3.057359 3661.7 3.002812 16.950948 3643.9 3.002812 10.316452 3649.9 3.002812 3.437297 3658.7 3.005428 35.574007 3626
3.002986 3.048124 3661.8 3.002986 16.883978 3644.0 3.002986 10.286421 3649.9 3.002986 3.377297 3658.7 3.005602 34.502157 3627
3.003160 3.050451 3661.7 3.003160 16.918626 3644.0 3.003160 10.348810 3649.9 3.003160 3.377297 3658.7 3.005776 33.561992 3628
3.003322 3.085099 3661.7 3.003322 16.877034 3644.0 3.003322 10.364953 3649.8 3.003322 3.432682 3658.7 3.005938 32.691125 3629
3.003495 3.080446 3661.7 3.003495 16.842385 3644.1 3.003495 10.328013 3649.9 3.003495 3.425759 3658.7 3.006111 31.808696 3630
3.003727 3.064303 3661.7 3.003727 16.865472 3644.0 3.003727 10.323396 3649.9 3.003727 3.409605 3658.7 3.006343 30.702214 3631
3.003958 3.048124 3661.8 3.003958 16.840059 3644.1 3.003958 10.279512 3649.9 3.003958 3.511143 3658.6 3.006574 29.701987 3632
3.004201 3.075829 3661.7 3.004201 16.826206 3644.1 3.004201 10.328013 3649.9 3.004201 3.453451 3658.6 3.006817 28.727157 3633
3.004433 3.126656 3661.7 3.004433 16.761527 3644.1 3.004433 10.422724 3649.8 3.004433 3.358835 3658.7 3.007048 27.902481 3634
3.004664 3.048124 3661.8 3.004664 16.775379 3644.1 3.004664 10.330304 3649.9 3.004664 3.377297 3658.7 3.007280 27.126325 3635
3.004884 3.094334 3661.7 3.004884 16.724587 3644.2 3.004884 10.362662 3649.8 3.004884 3.386528 3658.7 3.007500 26.454114 3636
3.005231 3.055068 3661.7 3.005231 16.641402 3644.3 3.005231 10.302600 3649.9 3.005231 3.458066 3658.6 3.007847 25.465448 3637
3.005590 3.048124 3661.8 3.005590 16.655255 3644.2 3.005590 10.348810 3649.9 3.005590 3.393451 3658.7 3.008206 24.559915 3637
3.005926 3.186719 3661.6 3.005926 16.625259 3644.3 3.005926 10.302600 3649.9 3.005926 3.388836 3658.7 3.008542 23.811480 3638
3.006285 3.080446 3661.7 3.006285 16.549018 3644.4 3.006285 10.355718 3649.8 3.006285 3.349605 3658.8 3.008901 23.319456 3639
3.006620 3.057359 3661.7 3.006620 16.477394 3644.4 3.006620 10.302600 3649.9 3.006620 3.388836 3658.7 3.009236 22.707308 3639
3.006968 3.052742 3661.7 3.006968 16.417332 3644.5 3.006968 10.323396 3649.9 3.006968 3.368066 3658.7 3.009583 22.210649 3640
3.007315 3.048124 3661.8 3.007315 16.354979 3644.5 3.007315 10.297982 3649.9 3.007315 3.393451 3658.7 3.009931 21.700137 3640
3.007673 3.089717 3661.7 3.007673 16.301825 3644.6 3.007673 10.351101 3649.8 3.007673 3.494989 3658.6 3.010289 21.258923 3641
3.008009 3.101243 3661.7 3.008009 16.241798 3644.7 3.008009 10.358045 3649.8 3.008009 3.474220 3658.6 3.010625 20.866227 3641
3.008356 3.195954 3661.6 3.008356 16.195588 3644.7 3.008356 10.316452 3649.9 3.008356 3.508836 3658.6 3.010972 20.501254 3641
3.009062 3.034272 3661.8 3.009062 16.068520 3644.8 3.009062 10.307217 3649.9 3.009062 3.379605 3658.7 3.011678 19.852148 3642
3.009745 3.154396 3661.6 3.009745 16.054667 3644.8 3.009745 10.291038 3649.9 3.009745 3.453451 3658.6 3.012361 19.337019 3643
3.010451 3.061977 3661.7 3.010451 15.899894 3645.0 3.010451 10.316452 3649.9 3.010451 3.416528 3658.7 3.013067 18.884243 3643
3.011134 3.087390 3661.7 3.011134 15.786713 3645.1 3.011134 10.300273 3649.9 3.011134 3.361143 3658.7 3.013750 18.438429 3644
3.011840 3.112804 3661.7 3.011840 15.638884 3645.3 3.011840 10.339575 3649.9 3.011840 3.388836 3658.7 3.014456 18.108086 3644
3.012523 3.122039 3661.7 3.012523 15.544173 3645.4 3.012523 10.316452 3649.9 3.012523 3.391143 3658.7 3.015139 17.823954 3644
3.013218 3.182101 3661.6 3.013218 15.472550 3645.4 3.013218 10.314161 3649.9 3.013218 3.458066 3658.6 3.015833 17.537513 3644
3.013912 3.098952 3661.7 3.013912 15.354752 3645.5 3.013912 10.307217 3649.9 3.013912 3.379605 3658.7 3.016528 17.288046 3645
3.014954 3.025037 3661.8 3.014954 15.218448 3645.7 3.014954 10.297982 3649.9 3.014954 3.409605 3658.7 3.017570 16.902277 3645
3.015995 3.061977 3661.7 3.015995 15.045205 3645.9 3.015995 10.318778 3649.9 3.015995 3.485759 3658.6 3.018611 16.613527 3645
G:\102\00279.01\Deliverables\Reports - Specs\Hydrogeologic Testing Report\Rev1\Appendices\AppendixB-Rev1\
App C_3 Burdock Recovery Data Tables_RevTR 2 of 411/12/2008
Revised July 2010 July 2012
J-172 Appendix J

Table C.3-1:
Time and Water Level Data Values Used in Pumping Test Analysis: Burdock Test, Recovery Data
11-2 3664.8 11-14C 3660.9 11-15 3660.2 11-19 3662.1 11-11C 3662
Time (days) Drawdown (ft) Elevation (ft) Time (days) Drawdown (ft) Elevation (ft) Time (days) Drawdown (ft) Elevation (ft) Time (days) Drawdown (ft) Elevation (ft) Time (days) Drawdown (ft) Elevation (ft)
3.017048 3.006532 3661.8 3.017048 14.899667 3646.0 3.017048 10.344192 3649.9 3.017048 3.515759 3658.6 3.019664 16.340938 3646
3.018090 3.055068 3661.7 3.018090 14.763364 3646.1 3.018090 10.353427 3649.8 3.018090 3.506528 3658.6 3.020706 16.109941 3646
3.019479 3.108186 3661.7 3.019479 14.610917 3646.3 3.019479 10.332631 3649.9 3.019479 3.458066 3658.6 3.022095 15.758820 3646
3.020856 3.048124 3661.8 3.020856 14.421496 3646.5 3.020856 10.325687 3649.9 3.020856 3.414220 3658.7 3.023472 15.500101 3646
3.022245 3.022711 3661.8 3.022245 14.308315 3646.6 3.022245 10.341866 3649.9 3.022245 3.501913 3658.6 3.024861 15.246000 3647
3.023634 3.036563 3661.8 3.023634 14.038035 3646.9 3.023634 10.323396 3649.9 3.023634 3.504220 3658.6 3.026250 14.987281 3647
3.025035 3.038889 3661.8 3.025035 13.987207 3646.9 3.025035 10.267951 3649.9 3.025035 3.448836 3658.7 3.027651 14.830199 3647
3.026423 3.075829 3661.7 3.026423 13.850939 3647.0 3.026423 10.311835 3649.9 3.026423 3.529605 3658.6 3.029039 14.666191 3647
3.027812 3.094334 3661.7 3.027812 13.663809 3647.2 3.027812 10.358045 3649.8 3.027812 3.414220 3658.7 3.030428 14.379750 3648
3.029537 3.027328 3661.8 3.029537 13.550628 3647.3 3.029537 10.316452 3649.9 3.029537 3.402682 3658.7 3.032153 14.231903 3648
3.031285 3.055068 3661.7 3.031285 13.342737 3647.6 3.031285 10.316452 3649.9 3.031285 3.441912 3658.7 3.033901 13.991672 3648
3.033009 3.075829 3661.7 3.033009 13.254934 3647.6 3.033009 10.325687 3649.9 3.033009 3.430374 3658.7 3.035625 13.827664 3648
3.034745 3.061977 3661.7 3.034745 13.146371 3647.8 3.034745 10.321070 3649.9 3.034745 3.511143 3658.6 3.037361 13.647477 3648
3.037060 3.101243 3661.7 3.037060 12.896887 3648.0 3.037060 10.355718 3649.8 3.037060 3.384220 3658.7 3.039676 13.469616 3649
3.039375 3.075829 3661.7 3.039375 12.797559 3648.1 3.039375 10.328013 3649.9 3.039375 3.499605 3658.6 3.041991 13.236294 3649
3.041701 3.168249 3661.6 3.041701 12.642786 3648.3 3.041701 10.330304 3649.9 3.041701 3.471912 3658.6 3.044317 12.996062 3649
3.044005 3.064303 3661.7 3.044005 12.469543 3648.4 3.044005 10.330304 3649.9 3.044005 3.476528 3658.6 3.046620 12.827437 3649
3.046331 3.057359 3661.7 3.046331 12.388684 3648.5 3.046331 10.321070 3649.9 3.046331 3.501913 3658.6 3.048947 12.681899 3649
3.048634 3.045798 3661.8 3.048634 12.099934 3648.8 3.048634 10.297982 3649.9 3.048634 3.488066 3658.6 3.051250 12.517891 3649
3.052106 3.048124 3661.8 3.052106 12.032963 3648.9 3.052106 10.328013 3649.9 3.052106 3.444220 3658.7 3.054722 12.203727 3650
3.055590 3.034272 3661.8 3.055590 11.838924 3649.1 3.055590 10.291038 3649.9 3.055590 3.483451 3658.6 3.058206 12.018923 3650
3.059062 3.041180 3661.8 3.059062 11.656446 3649.2 3.059062 10.316452 3649.9 3.059062 3.379605 3658.7 3.061678 11.797179 3650
3.062535 3.057359 3661.7 3.062535 11.453137 3649.4 3.062535 10.311835 3649.9 3.062535 3.464989 3658.6 3.065151 11.580035 3650
3.065995 3.029654 3661.8 3.065995 11.242954 3649.7 3.065995 10.364953 3649.8 3.065995 3.374990 3658.7 3.068611 11.395230 3651
3.069468 3.057359 3661.7 3.069468 11.085855 3649.8 3.069468 10.431959 3649.8 3.069468 3.464989 3658.6 3.072083 11.210426 3651
3.072951 3.048124 3661.8 3.072951 11.011940 3649.9 3.072951 10.263334 3649.9 3.072951 3.361143 3658.7 3.075567 11.048727 3651
3.076470 3.087390 3661.7 3.076412 10.850259 3650.0 3.076505 10.302600 3649.9 3.076412 3.368066 3658.7 3.079028 10.907824 3651
3.079942 3.061977 3661.7 3.079942 10.653893 3650.2 3.079977 10.286421 3649.9 3.079896 3.370374 3658.7 3.082500 10.704532 3651
3.083530 3.006532 3661.8 3.083530 10.515299 3650.4 3.083449 10.270277 3649.9 3.083484 3.351912 3658.7 3.086100 10.554394 3651
3.090590 3.087390 3661.7 3.090590 10.221931 3650.7 3.090509 10.247155 3650.0 3.090544 3.340374 3658.8 3.093160 10.263335 3652
3.097419 3.048124 3661.8 3.097419 10.027892 3650.9 3.097338 10.205563 3650.0 3.097373 3.326528 3658.8 3.099988 10.020778 3652
3.104363 3.041180 3661.8 3.104363 9.868502 3651.0 3.104282 10.191710 3650.0 3.104317 3.342682 3658.8 3.106933 9.722793 3652
3.111308 3.001914 3661.8 3.111308 9.542777 3651.4 3.111227 10.161679 3650.0 3.111262 3.261913 3658.8 3.113877 9.533371 3652
3.118252 3.013476 3661.8 3.118252 9.351064 3651.5 3.118171 10.177858 3650.0 3.118206 3.268836 3658.8 3.120822 9.297757 3653
3.125197 3.018093 3661.8 3.125197 9.136229 3651.8 3.125116 10.170914 3650.0 3.125151 3.280374 3658.8 3.127766 9.062125 3653
3.132141 3.001914 3661.8 3.132141 8.946807 3652.0 3.132060 10.085473 3650.1 3.132095 3.261913 3658.8 3.134711 8.865778 3653
3.139086 2.997297 3661.8 3.139086 8.755059 3652.1 3.139005 10.043881 3650.2 3.139039 3.259605 3658.8 3.141655 8.678665 3653
3.149502 3.025037 3661.8 3.149502 8.542550 3652.4 3.149421 10.020794 3650.2 3.149456 3.201912 3658.9 3.152072 8.394532 3654
3.159919 3.018093 3661.8 3.159919 8.369307 3652.5 3.159838 9.988436 3650.2 3.159873 3.197297 3658.9 3.162488 8.124270 3654
3.170336 2.964975 3661.8 3.170336 8.092118 3652.8 3.170255 9.875255 3650.3 3.170289 3.178836 3658.9 3.172905 7.951027 3654
3.180752 2.953413 3661.8 3.180752 7.958106 3652.9 3.180671 9.771310 3650.4 3.180706 3.144220 3659.0 3.183322 7.696925 3654
3.194641 2.925709 3661.9 3.194641 7.593150 3653.3 3.194560 9.674272 3650.5 3.194595 3.104990 3659.0 3.197211 7.368892 3655
3.208530 2.941852 3661.9 3.208530 7.445286 3653.5 3.208449 9.611919 3650.6 3.208484 3.132682 3659.0 3.211100 7.227988 3655
3.222419 2.916438 3661.9 3.222419 7.110361 3653.8 3.222338 9.440967 3650.8 3.222373 3.102682 3659.0 3.224988 6.978505 3655
3.236308 2.877172 3661.9 3.236308 6.913996 3654.0 3.236227 9.343965 3650.9 3.236262 3.102682 3659.0 3.238877 6.726712 3655
3.250197 2.854085 3661.9 3.250197 6.789254 3654.1 3.250116 9.253872 3650.9 3.250151 3.044989 3659.1 3.252766 6.521129 3655
3.264086 2.821728 3662.0 3.264086 6.609067 3654.3 3.264005 9.133747 3651.1 3.264039 3.042682 3659.1 3.266655 6.370973 3656
3.277974 2.796349 3662.0 3.277974 6.359618 3654.5 3.277893 9.057506 3651.1 3.277928 2.998836 3659.1 3.280544 6.190804 3656
3.295336 2.805584 3662.0 3.295336 6.246402 3654.7 3.295255 8.875028 3651.3 3.295289 2.964220 3659.1 3.297905 5.945938 3656
3.312697 2.872555 3661.9 3.312697 6.077777 3654.8 3.312616 8.766465 3651.4 3.312651 2.941143 3659.2 3.315266 5.779621 3656
G:\102\00279.01\Deliverables\Reports - Specs\Hydrogeologic Testing Report\Rev1\Appendices\AppendixB-Rev1\
App C_3 Burdock Recovery Data Tables_RevTR 3 of 411/12/2008
Revised July 2010 July 2012
J-173 Appendix J

Table C.3-1:
Time and Water Level Data Values Used in Pumping Test Analysis: Burdock Test, Recovery Data
11-2 3664.8 11-14C 3660.9 11-15 3660.2 11-19 3662.1 11-11C 3662
Time (days) Drawdown (ft) Elevation (ft) Time (days) Drawdown (ft) Elevation (ft) Time (days) Drawdown (ft) Elevation (ft) Time (days) Drawdown (ft) Elevation (ft) Time (days) Drawdown (ft) Elevation (ft)
3.330058 2.810202 3662.0 3.330058 5.916095 3655.0 3.329977 8.583952 3651.6 3.330012 3.038066 3659.1 3.332627 5.627157 3656
3.347419 2.784788 3662.0 3.347419 5.733582 3655.2 3.347338 8.438414 3651.8 3.347373 2.945759 3659.2 3.349988 5.426191 3657
3.370567 2.727017 3662.1 3.370567 5.514129 3655.4 3.370486 8.295202 3651.9 3.370521 2.890374 3659.2 3.373137 5.204430 3657
3.393715 2.715491 3662.1 3.393715 5.336269 3655.6 3.393634 8.068841 3652.1 3.393669 2.844220 3659.3 3.396285 5.054274 3657
3.416863 2.634632 3662.2 3.416863 5.156082 3655.7 3.416782 7.932537 3652.3 3.416817 2.830374 3659.3 3.419433 4.848691 3657
3.440127 2.639250 3662.2 3.440127 4.957425 3655.9 3.440046 7.729263 3652.5 3.440081 2.784220 3659.3 3.442697 4.696227 3657
3.463160 2.655428 3662.1 3.463160 4.832683 3656.1 3.463079 7.556020 3652.6 3.463113 2.731143 3659.4 3.465729 4.548398 3657
3.486308 2.576896 3662.2 3.486308 4.701033 3656.2 3.486227 7.412773 3652.8 3.486262 2.682682 3659.4 3.488877 4.389007 3658
3.521030 2.537630 3662.3 3.521030 4.520846 3656.4 3.520949 7.110171 3653.1 3.520984 2.687297 3659.4 3.523600 4.261956 3658
3.555752 2.445211 3662.4 3.555752 4.262127 3656.6 3.555671 6.911514 3653.3 3.555706 2.613451 3659.5 3.558322 4.070226 3658
3.590474 2.401327 3662.4 3.590474 4.142003 3656.8 3.590393 6.645887 3653.6 3.590428 2.509605 3659.6 3.593044 3.922379 3658
3.625197 2.387475 3662.4 3.625197 3.984938 3656.9 3.625116 6.458756 3653.7 3.625151 2.541913 3659.6 3.627766 3.806872 3658
3.659919 2.320469 3662.5 3.659919 3.855544 3657.0 3.659838 6.262426 3653.9 3.659873 2.486528 3659.6 3.662488 3.647481 3658
3.694641 2.281203 3662.5 3.694641 3.696188 3657.2 3.694560 6.059117 3654.1 3.694595 2.414989 3659.7 3.697211 3.541227 3658
3.729711 2.269641 3662.5 3.729711 3.603769 3657.3 3.729630 5.839664 3654.4 3.729664 2.368835 3659.7 3.732280 3.393398 3659
3.764086 2.198053 3662.6 3.764086 3.490588 3657.4 3.764005 5.659512 3654.5 3.764039 2.350374 3659.7 3.766655 3.300995 3659
3.798808 2.174930 3662.6 3.798808 3.361229 3657.5 3.798727 5.483943 3654.7 3.798762 2.331913 3659.8 3.801377 3.134679 3659
3.833530 2.131047 3662.7 3.833530 3.296549 3657.6 3.833449 5.363819 3654.8 3.833484 2.297297 3659.8 3.836100 3.104648 3659
3.902974 2.059459 3662.7 3.902974 3.146393 3657.8 3.902893 5.033476 3655.2 3.902928 2.267297 3659.8 3.905544 2.956801 3659
3.973113 2.089490 3662.7 3.973113 3.010090 3657.9 3.973032 4.802497 3655.4 3.973067 2.179605 3659.9 3.975683 2.804336 3659
4.041863 1.948569 3662.9 4.041863 2.797581 3658.1 4.041782 4.504512 3655.7 4.041817 2.274220 3659.8 4.044433 2.663433 3659
4.111308 1.927773 3662.9 4.111308 2.605868 3658.3 4.111227 4.303529 3655.9 4.111262 2.031913 3660.1 4.113877 2.538691 3659
4.180752 1.796087 3663.0 4.180752 2.529627 3658.4 4.180671 4.035576 3656.2 4.180706 1.974220 3660.1 4.183322 2.340035 3660
4.250197 1.752204 3663.0 4.250197 2.402559 3658.5 4.250116 3.811505 3656.4 4.250151 1.928066 3660.2 4.252766 2.270737 3660
4.319641 1.708320 3663.1 4.319641 2.354058 3658.5 4.319560 3.635936 3656.6 4.319595 1.907297 3660.2 4.322211 2.125199 3660
4.389086 1.664436 3663.1 4.389086 2.250112 3658.6 4.389005 3.476545 3656.7 4.389039 1.828836 3660.3 4.391655 2.072063 3660
4.493252 1.664436 3663.1 4.493252 2.160019 3658.7 4.493171 3.296359 3656.9 4.493206 1.798836 3660.3 4.495822 1.975044 3660
4.597419 1.560491 3663.2 4.597419 2.065308 3658.8 4.597338 3.109263 3657.1 4.597373 1.734220 3660.4 4.599988 1.963500 3660
4.701586 1.535077 3663.3 4.701586 1.919770 3659.0 4.701505 2.919842 3657.3 4.701539 1.701913 3660.4 4.704155 1.820288 3660
4.805752 1.456545 3663.3 4.805752 1.910535 3659.0 4.805671 2.751216 3657.4 4.805706 1.688066 3660.4 4.808322 1.732504 3660
4.944641 1.433422 3663.4 4.944641 1.792737 3659.1 4.944560 2.612622 3657.6 4.944595 1.618836 3660.5 4.947211 1.644719 3660
5.083530 1.361834 3663.4 5.083530 1.665668 3659.2 5.083449 2.460140 3657.7 5.083368 1.549605 3660.6 5.086100 1.554625 3660
5.222419 1.347946 3663.5 5.222419 1.540926 3659.4 5.222338 2.229161 3658.0 5.222373 1.480374 3660.6 5.224988 1.439136 3661
5.361308 1.165469 3663.6 5.361308 1.370010 3659.5 5.361227 2.097475 3658.1 5.361146 1.436528 3660.7 5.363877 1.337481 3661
5.500197 1.075375 3663.7 5.500197 1.339979 3659.6 5.500116 1.917288 3658.3 5.500150 1.471143 3660.6 5.502766 1.191961 3661
5.639086 1.015313 3663.8 5.639086 1.268355 3659.6 5.639005 1.797164 3658.4 5.633947 1.401912 3660.7 5.641655 1.044114 3661
5.777974 0.971429 3663.8 5.777974 1.092786 3659.8 5.777894 1.688601 3658.5 5.777813 1.187297 3660.9 5.780544 1.030262 3661
5.909340 0.927546 3663.9 5.909340 1.182879 3659.7 5.909375 1.612395 3658.6 5.893901 1.094989 3661.0 5.911910 1.062601 3661
General Methodology: PSI, temperature, and time readings from Win-SituTM
digital data log were exported to Excel ".csv" file.
Drawdown was calculated as PSI at time after pumping minus average PSI before pumping; therefore, at small or zero changes
in PSI negative drawdowns may be calculated.
A FORTRAN program was written to read the ".csv" file and produce a second file by extracting the records at a frequency of 40
per log-time cycle (in minutes) in order achieve equal representation of data throughout the pumping and drawdown phases of the test.
Elevation (in ft above mean sea level) based on initial groundwater elevation (see Table 5.2) minus drawdown.
Note Extracted manually from digital data log.
G:\102\00279.01\Deliverables\Reports - Specs\Hydrogeologic Testing Report\Rev1\Appendices\AppendixB-Rev1\
App C_3 Burdock Recovery Data Tables_RevTR 4 of 411/12/2008
Revised July 2010 July 2012
J-174 Appendix J

Knight Piesold CON.ULTING
Appendix C-4 Additional Aquifer Parameter Determinations
July 2012 J-175 Appendix J

-:::l ~
Theis 10:\~~~== 102 [ E~d of Borehole Storage at t =50 Minutes J
101
10°
10-1
-~~( . - · -
145.378 8q ftld 2.87684e-009
1~7
0.25 ft
Tr.,amiulvtty Storage Coellicient Radial Dlat.nca
X o.tau.d A De1a Ignored
1014 ;~I ;----rl ---r-;·,-r-o;;;;----r---r---,--,-~;,;;-------,-,-,-,~~~:::;:::::;:;:;::~~~::;:~~~~~~:i::::::::~::::~--~ I I I I I I I ! I II · · , I I I 1 I I I 1 1 l I II 1i I I I I 1oS 109 1010 1012 1013 1 o,,
1/u
Client
Knight Piesold CO •• ULTI.G
Project
DEWEY ·BURDOCK HYDROGEOLOGIC TESTING
REPORT Project No: DV10200279.01
Title
Theis Drawdown Analysis at Burdock Pumping Well 11·11 C
Date: 10/16/08 Appendix C, Figure C.4-1
G:\102100279.01\A\Reports Specs\KPIAII Reports\Work in Progress\Hydrogeologic Testing Report\Appendices\Appendix C\Appendix C.4-1 Theis 11 -11C.xls 10/16/2008
July 2012J-176
Appendix J

Theis 101r--~~== 10°
-------·- ---·- --
10_,
-::::s
~
X
X X
)<' ·;.;·
'' ,.-. 10-3
X
10-4
Client
I
10-1
;! ,>f/;
I< ~xi X I
X ·,
';1
... ;;:.! , I
/ / I I
Knight Piesold c•••uLTt••
1o0 101
Project
DEWEY -BURDOCK HYDROGEOLOGIC TESTING
REPORT Project No: DV10200279.01
Title
T,.,amiaivity Storage Coefficient RadiaiDi~
1o2 1/u
X OeltaUeed
103
87.9809 8q ftld 0.00128822 243ft
A 0eta lglofed
104 1cfi
Theis Drawdown Analysis at Burdock Observation Well 11-15
Date: 10/16/08 Appendix C, Figure CA-2
G:l 1 02100279.01\A\Reports Specs\KPIAII Reports I Work in Progress\Hydrogeologic Testing Report\Appendices\Appendix C\Appendix CA-2 Theis 11-15.xls 10/16/2008
July 2012J-177
Appendix J

~ t::. / \
/::,
6
Theis 1
10 ~----------~----------~, ----------~----------~~~--------------~~i~-~--------~ -- ---~- i
•<<~~~~ I I
10° ,_ ------- - - -----..
1 o-1
1\
d';
A~b~/ t !J.A • 1\ 1\
1\
'! 6
I 10-4 I I I I I I I I I I I \ I I I I Ii i
1 o-1
Client
Knight Piesold CeMSUL'YIMD
1o0 101
Project
DEWEY -BURDOCK HYDROGEOLOGIC TESTING
REPORT Project No: DV1 0200279.01
xo•u•
I I I j I I I I I I I J I I I
1o2 1/u
Title
103
121.352 8CI ftld 6.78488e 005 2!0 ft
A 0.1a Ignored
I I I I i 1i
1o4 I I I I I
105
Theis Drawdown Analysis at Burdock Observation Well 11 -14C
Date: 10/16/08 Appendix C, Figure C.4-3
G:\102100279.01\A\Reports Specs\KPIAII Reports\Work in Progress\Hydrogeologic Testing Report\Appendices\Appendix C\Appendix C.4-3 Theis 11 -14C.xls 10/16/2008
July 2012J-178
Appendix J

Theis Recovery 18.0-r--------------------------~~----------------------------------------~
_//,
.NYII~~rstfJr:li."£.CfYiJ~~Il'1J!.~--~(t!:{JW,&'V\t\!\ 6 6 6
/
/ 14.4 /{ . -- ~- ---- ------~ -~-------
/ - ·' ~ - P•t• with tit' < .§~ ~~· < 0.01 / c:: ;
~ 0 10.8
/,/
4' // t j e 0 m :::l
"'C ·c;; Q)
a::
7.2
3.6
//
/ r/,
§'. /
//
/ /
// 'I'~·
I I ~'\ .-:: -~ §~ Observation Weii11-14C
T~ Storage Coefficient Ratio u.,.. Regreulon Slope Unear RegreMion Intercept
173.a.3 8CI ftld 1.33337 8.12038 ft -0.784742 ft
0. 0 I r / A Dllla lgron!d II I I I I
I j I I I I II I I 1 l I I I 1 I i
)( Data Lllled
1o0 101
Client
Knight Piesold C.N.ULTING
102 1o3 104 1~
Time, tit'
Project Title
DEWEY -BURDOCK HYDROGEOLOGIC TESTING
REPORT Project No: DV1 0200279.01
Theis Recovery Analysis at Burdock Observation Well 11-14C
Date: 10/16/08 Appendix C, Figure C.4-4
G:\102100279.01\A\Reports Specs\KPIAII Reports\Work in Progress\Hydrogeologic Testing Report\Appendices\Appendix C\Appendix C.4-4 Theis Recov 11-14c.xls 10/16/2008
July 2012J-179
Appendix J

Theis 10
1 - - -t
10°
-- __ , I - I ///- -r-- I ~
' I I :
10"1
-f6 10-2
1 ! 6
/ 6
10"3 -;-~
I I
10-4 I I I l I I Ii t t I , I II
10-1 100 101
Client Project
Tranamiuivity StDrege Coefficient bd ... Diat:.\ce
I I I I I I ti
1o2 1/u
Title
X DataUeed
I I t I I I li
1 o3
223A116 aqftld 0.000192033 1282 ft
A Data Ignored
I I f I I I I I I I I I 1 I I I 1
104 105
DEWEY -BURDOCK HYDROGEOLOGIC TESTING
REPORT Theis Drawdown Analysis at Burdock Observation Well 11-2
Knight Piesold C:ONaUL'TfN D Project No: DV1 0200279.01 Date: 10/16/08 Appendix c. Figure C.4-5
G:\102100279.01\A\Reports Specs\KPIAII Reports\Work in Progress\Hydrogeologic Testing Report\Appendices\Appendix C\Appendix CA-5 Theis 11-2.xls 10/16/2008
July 2012J-180
Appendix J

m-i:::: -:::;/\ ~
Hantush and Jacob ( 1955) 1~ ~
10°
10"1
10"2
i\
10"''
.• - ---·v ----- . 1 1
: I I ,-£\ ,.... _ 0 :~& bservation Well 11-2 ..;, . ...
y,.,.........., Ston.ge Coefficiwlt Radial Diatlmee
184.172 lq ftld 0.000171515 1282 ft
10"4
riB 0.57
X Datil u.ct A 0.111 Ignored ~~~~:!_ 1o2 1/u
103 10-1 100 101 104 105
Client Project Title
DEWEY -BURDOCK HYDROGEOLOGIC TESTING I Hantush-Jacob Leaky Confined Aquifer Analysis at Burdock Observation Wei
REPORT 11 -2
Date: 10/16/08 Appendix C, Figure C.4-6 Knight Piesold
C:GMaULTIMA Project No: DV10200279.01
G:\1 02100279.01\A\Reports Specs\KPIAII Reports I Work in Progress\Hydrogeologic Testing Report\Appendices\Appendix C\Appendix C.4-6 HJ 11-2 .xls 10/16/2008
July 2012J-181
Appendix J

Burdock 11-19 (Upper Lakota)
100
Example Aquifer Parameters: Maximum Drawdo 1--- r =50ft
wn
T = 260 ft2/d = 3.4 ft at 3.0 Days
10 1--- s 0.10
~
~
/
1 Drawdown Response 111111
exceeds Baseline g at -160 Minutes c at - 0.04 t.psi I
~ ,
l .i 0 .. f
0 .1 T
• I& • • Burdock 11-19 . • - Theis
• •
0 .01
'"
0.001
0.0001 0.001 0.01 0.1 1 10
Time (days)
Client Project Title
DEWEY-BURDOCK HYDROGEOLOGIC TESTING Drawdown and Analysis at Burdock Test Observation Well 11-19
Knight Piesold REPORT (Upper Lakota)
aONeU&.TINO Proied No: DV10200279.01 Date: 10/16/08 I Aooendix C Fiaure C.4-7
G:\102\00279.01\A.\Reports Specs\KPIAll Reports\Work in Progress \Hydrogeologic Testing Report\Appendices\Appendix C\Appendix C.4-7 KP Theis 11-19.xls 10/16/2008
July 2012 J-182 Appendix J

g c:
~ -a ~ I! Cl
j :sz i
Client
Observation Well11-15
12 .------------------------------------------------------,
10 ........................... iii!~XIO 0
6 Due to Time-delay in Response , no values have u' < 0.01
I Example Aquifer Parameters: R =243ft T = 100 ft2/d 6
8
I Red line indicates Data Range of u' <= 0 .1
Ha lford Kuniansky, USGS Open-file Report 02-197
Cooper-Jacob recovery analys.s of s1ngle-well aqu~er test
4
2
0 L-------------~~~--------------------~----------~
4
3.5
3
2.5
0
2
I 1.5
1
0.5
Project
10 100 1 ,000 (t+4t)l4t
10.000
Observation Well 11-19
100,000
-o.- -- .J:L .... ""' .111>. CllOO v- ..,.. . .,...... -.--o<J> o o
Due to Time-delay in Response , no values have u' < 0.01
Example Aquifer Parameters: R =50ft T" 190 ft 2/d
Red Line IndiCates Data Ramge for values with u' < 0. 15
Halford Kuniansky, USGS Open-file Report 02-197
Cooper-Jacob recovery analysiS af single-well aquifer test
10 100 1,000 (t+4t)/4t
TiUe
10,000 100,000
1 000.000
1 .000.000
Theis-Cooper-Jacob Recovery Analyses at Burdock Observation Wells 11-15 and 11-19
Knight Piesold
DEWEY-BURDOCK HYDROGEOLOGIC TESTING
REPORT OONaUt.TINe
Project No: DV10200279.01 Date: 1 0/16/08 I Appendix C Figure C.4-8
G:\102\00279.01'A'Reports Specs\KP\AII Reports\Work in Progress\Hydrogeologic Testing Report\Appendices\Appendlx CIAppendixC.4-8 KP TR 11-15, 11-19.xls 10/16/2008
J.
July 2012 J-183 Appendix J

Client
ObseNatlon We1111.Q2
3.5
3
25
~u.- SV~oo
g 1 c ~ 0
"CC ~ C!
Q
1 :2
i
2 §
I 1 5
I 05
Distance too great for u' < 0 .01 . Last 5 data points have u' <= 0 .15
Exa~ AqUifer Parameters: r ~ 1,292 ft T = 260 ft2/d
Hatford ll"''d KUI"I.,toky, UGGS ()pen-Al~ btxwt 02·19 7, 2002
Cooper·J41Cob analysis or Sin(le-wetiM:f,ilf« te-st
0 ~------~----------------~--------------~------~
20
15
0
10 100 1,000 (t+41)14t
10 .000 100.000
10
Observation We1111-14C
~ ............ ~00
Aquifer Parameters: r = 250 II
T = 160 ft 21d
Red Line Indicates Range for u· <=0.01
Late-time slope (later time to left) disregarded to due to rechargeilealcage boundary observed during d<awdown phase ol the teat
100 1,000 10,000 100.000
~ord and Kunia,.ky, USGS Open-hie Report 02-197, 2002 COOper-Jacob recovery analysis or single-well aquifer teat
1 000,000
1, ,000
-5 L---------------------------------------------------~
Pr · d Title
Knight Piesold
DEVVEY -BURDOCK HYDROGEOLOGIC TESTING
REPORT
Theis-Cooper-Jacob Recovery at Burdock Observation Wells 11-
14C and 11-02
•• lte fllt.'YI Me Pro' No: DV10200279.01 Date: 10/16108
G:\102\00279.01'A\Reports Specs\KP'AII Reports\Work in Progress\l-lydrogeologlc Testing ReportV\ppendices\Appendix C\Appendix C.4-9 KP TR 11-14C, 11-2.xls 1011612008
. J
July 2012 J-184 Appendix J

Knight Piesold CON.ULTING
Appendix D Laboratory Core Data
July 2012 J-185 Appendix J

.',
(
(
(
CONVENTIONAL PLUG ANALYSIS
Powertech USA Inc. Various samples
CL File Number: HOU-070985
Date: January 25, 2008
This report Is based entirely upon the core samples, soils, solids. liquids, or gases, tog•ether with related observational data, provided solely by the client. The conclusions, Inferences, deductions and opinions rendered herein reflect the examination, study, and testing of these Items, and represent the best judgement of Cc1ra Laboratories. Any reliance on the information contained herein concerning the profitability or productivity of any well, sand, or drilling activity Is at the sole risk of the client. and Core Laboratories, neither extends nor makes any warranty or representation whatsoever with respect to same. This report has been prepared for the exclusive and confidential use of the client and no other party.
July 2012 J-186 Appendix J

(
powertech USA Inc. ( tarious samples
Sample P[8Darat!on
CONVENTIONAL PLUG ANALYSIS PROTOCOL
CL File No.: HOU~070985 Date: January 25, 2008 Analyst(s): MS,MM,JH
1.0" diameter plugs were drilled with liquid nitrogen and trimmed into right cylinders with a diamond-blade trim saw.
The samples were encapsulated in Teflon tape and stainless steel screens. All sample trims were archived.
Core Extraction Samples soaked In methanol to remove any salt present.
SamPle Drv!ng Samples were humidity oven dried at 140° F and 40% relative humidity to weight equilibrium.
Poroa!tv Porosity was determined using Boyle's law technique by measuring grain volume at ambient conditions & pore
volume at indicated net confining stresses (NCS)
Grain Dentltv Grain density values were calculated by direct measurement of grain volume and weight on dried plug samples.
Grain volume was measured by Boyte's law technique.
( Permeabll!tv Permeability to air was measured on each sample using steady-state method at indicated NCS.
Page2 July 2012 J-187 Appendix J

(
(
PowerTech USA Various samples
Cora Sample Log (Updated 01·21!1-GB)
Smpl Depth ·~~ {;·:f •;:~~>:~J~rvo:~®'.liflB(0':t::& No. (ft) Good Fair Poor Failed
1H 252.20 )(
1V 262.35 )(
2H 480.70 )(
2V 480.80 X
3H 609.10 X
3V 609.20
4H 412.30 X
4V 412.45 X
5H 423.60 X
5V 423.35 X
6H 430.20 X
6V 430.35 X
7H 453.50 X
7V 453.45 X
BH 420.40 X
ev 420.10 X
9H 455.90 X
9V 455.45 X
10H 503.30 X
10V 503.45 X
11H 573.25 X
11V 573.40 X
·~:r~ .. ;~t 1·.;; ::r' t'iU·;·.y:-~>NJ:;•r:i.VJ~:. i1r~:~ii':'1; L<!iJ,.t.; '.''''-''·,,;::;
Page3
Vert
X
X
X
X
X
X
X
X
X
X
X
;~iWiin
Smpl Smpl End
Len Dia Trtms
1.33 1.00
0.67 1.00
1.75 1.00
1.00 1.00
2.20 1.00
1.88 1.00
2.33 1.00
1.66 1.00
2.00 1.00
1.80 1.00
0.70 1.00
1.50 1.00
1.70 1.00
0.75 1.00
1.25 1.00
1.90 1.00
1.25 1.00 '
1.50 1.00
1.50 1.00
- 1.00
1.25 1.00
1.00 1.00
l•,;t;,;;i:iNiN~ le·:·!1;~:·7: I?,?Zb;·•'.'$?
Remarks
DB 07-11-11C
DB 07-11-11C
DB 07-29-1C
DB 07-29-1C
DB 07-29-1C
DB 07-29-1C
DB 07-11-11C
DB 07-11-11C
DB 07-11-14C
DB 07-11-14C
DB 07-11-14C
DB07-11-14C
DB 07-11-14C
DB 07-11-14C
DB 07-11-16C
DB 07-11-16C
DB07-11-16C
DB 07-11-16C
DB07-11-16C
DB 07-11-16C
DB 07-32-4C
DB 07-32-4C
Start Date: 10-19-07
File No: HOU-070985
Material Weights
Teflon Screens 0.717 0.611
0.465 0.651
1.044 0.596
0.805 0.604
1.328 0.601
1.220 0.605
1.505 0.599
1.325 0.602
0.812 0.729
0.552 0.734
0.410 0.737
0.594 0.752
0.625 0.744
0.315 0.719
0.471 0.743
0.717 0.732
0.575 0.718
0.634 0.719
0.557 0.733
0.567 0.730
0.572 0.722
•.~r{;:1.':-;:J::F'',~.··~'·"''LX~' -•:;;-~:; l:•:?iF:··> i/6§:}\?1,
July 2012 J-188 Appendix J

r ....
,.._
10695 313/2008
-·· 10
51719--75
51719--25
5166()..24
51~
5166()...59
5171s.86
51719-2
51719-35
51719-62
PowertechiD
DB07-11-11C 425'5" to 427'4"
0807-29-1C 590' to 592'3"
CN-3C 130-131
IN-2C 464-465
IN-1 C 464-465
0807 -32-2C 580 - 580.5
0807-32-4C 550'0" to 551'1"
DB07-11~16C 412'1" to 414'3"
DB07-11-14C 1111/07 4367"_l()_438'7'~
------
Analyst AM
AsReceMid sample mass starting (tqJ) volume(mL}
3.92 1395
4.32 1995
1.40 2100
1.58 1300
1.02 1250
0.84 1705
2.30 1015
3.30 2100
---- 3.1~ '--- 1990
.·------
ending density time in graduated \IOiume_{_mL) ;(gtmL) d~tion ~ ... ,.;......_·(min}
3140 2.25 mushy sand 5
3880 2.29 mushy sand 5
2855 ·1.85 solid sand 40
2045 2.12 mushy sand I 51
1750 2.04 clumped, wet sand 5.
2170 1.81 clumped, wet sand 3QJ I
1925 2.53 dumped, wet sand 180
3565 2.25 clumped, wet sand 960
·-----~ __ 2~ c:frJ~. ~_sand 30
A.,~9 r --
e !- I - 2 ,;.L{
July 2012J-189
Appendix J

Powertech USA Inc.
~ CL Fife No.: HOU-070985
( Various samples Date: January 25, 2008 Analyst(s): MS,MM,JH
U! .. ltiiC~III,IfU,
CONVENTIONAL PLUG ANALYSIS
Net Confining
Sample Stress Kalr Footnote
Number I
1H 252.20 600 10.50 1.04 2.356
1V 252.35 600 10.15 .228 2.356
4H 412.30 600 9.68 .041 2.511
4V 412.45 600 9.59 .016 2.514
DB 07-29-1C
2H 480.70 600 8.90 .078 2.613
2V 480.80 600 9.30 .007 2.610
3H 609.10 600 12.26 .073 2.603
3V 609.20 600 10.84 .008 2.793
DB 07-11·14C
6H 423.60 600 29.56 3207 2.645
( 6V 423.35 600 30.34 1464 2.645
BH 430.20 600 31.90 4161 2.640
6V 430.35 600 30.16 939 2.646
7H 453.50 600 10.86 1.00 2.519
7V 453.45 600 11.82 .043 2.543
DB 07-11-16C
BH 420.40 600 30.50 2697 2.643
8V 420.10 600 30.17 1750 2.651
9H 455.90 600 6.99 .004 2.536
9V 455.45 600 7.65 .012 2.556
10H 503.30 600 12.96 .697 2.474
10V 503.46 600 (6)
D807-32-4C
11H 573.25 600 29.16 2802 2.641
11V 573.40 600 29.04 619 2.646
Footnotes:
(6) : Denotes all plug attempts failed.
(
Page 1 July 2012 J-190 Appendix J

Core Analyses for Powertach USA Inc. at Dewey-Burdock Site (
Air Intrinsic
Confining Permeabtlltyl11 Particle Sample Depth Stress Porosity ka Dens It;~ Number (ft) (pslg) (%) (mD) (g/cm3) Notes
DB 07-11-11C 1H 252.20 600 10.50 1.040 2.356 Fuson Shale 1V 252.35 600 10.15 0.228 2.356 Fuson Shale 4H 412.30 600 9.68 0.041 2.511 Fuson Shale 4V 412.45 600 9.59 0.016 2.514 Fuson Shale
DB 07-29-1C 2H 480.70 600 8.90 0.078 2.613 Skull Creek shale 2V 480.80 600 9.30 0.007 2.610 Skull Creek shale 3H 609.10 600 12.26 0.073 2.603 Fuson Shale 3V 609.10 600 10.84 0.008 2.793 Fuson Shale
DB 07-11-14C 5H 423.60 600 29.56 3,207 2.645 5V 423.35 600 30.34 1,464 2.645 6H 430.20 600 31.90 4,161 2.640 6V 430.35 600 30.16 939 2.646
( 7H 453.50 600 10.86 1.000 2.519 Morrison Shale 7V 453.45 600 11.82 0.043 2.543 Morrison Shale
DB-07-11-16C 8H 420.40 600 30.50 2,697 2.643 8V 420.10 600 30.17 1,750 2.651 9H 455.90 600 6.99 0.004 2.536 Morrison Shale 9V 455.45 600 7.65 0.012 2.556 Morrison Shale 10H 503.30 600 12.96 0.697 2.474 Morrison Shale 10V 503.45 600 No data
DB 07-32-4C 11H 573.25 600 29.15 2,802 2.641. 11V 573.40 600 29.04 619 2.645
(1) Assumed air temperature= 70°F. (2) Assumed water temperature= 52.8°F, water density= 0.999548 g/cm3, and water dynamic viscosity= 0.012E (3) Kw = ka x (Pw9IJ.Iw). and 1.0 mO = 0.987 x 10"11 cm2 (See Constants Tab).
(
July 2012 J-191 Appendix J

I
I
I I.
(
Hole No DB 07·11-14C
DB 07-11-16C DB 07-32-4C
Avg
mDarcy horizontal verlcal
perm perm 3207 1464 4161 939 2697 1750 2802 619
3217 1193
% ratio horizontal veri cal h/v porosity porosity
2.2:1 29.56 30.34 4.4:1 31.9 30.16 1.5:1 30.5 30.17 4.5:1 29.15 29.04
2.7:1 30.3 29.9
July 2012 J-192 Appendix J

Knight Piesold CONaULTING
Appendix E CD-ROM: Raw Pressure Transducer Data in WinSitu ™
Format
July 2012 J-193 Appendix J