Adult and child malaria mortality in India: a nationally representative mortality survey
Upload
independentCategory
view
2download
0
n engl j med 366;11 nejm.org march 15, 2012 1
The new england journal of medicineestablished in 1812 march 15, 2012 vol. 366 no. 11
Prostate-Cancer Mortality at 11 Years of Follow-upFritz. H. Schröder, M.D., Jonas Hugosson, M.D., Monique J. Roobol, Ph.D., Teuvo L.J. Tammela, M.D.,
Stefano Ciatto, M.D., Vera Nelen, M.D., Maciej Kwiatkowski, M.D., Marcos Lujan, M.D., Hans Lilja, M.D., Marco Zappa, Ph.D., Louis J. Denis, M.D., Franz Recker, M.D., Alvaro Páez, M.D., Liisa Määttänen, Ph.D.,
Chris H. Bangma, M.D., Gunnar Aus, M.D., Sigrid Carlsson, M.D., Arnauld Villers, M.D., Xavier Rebillard, M.D., Theodorus van der Kwast, M.D., Paula M. Kujala, M.D., Bert G. Blijenberg, Ph.D., Ulf-Hakan Stenman, M.D.,
Andreas Huber, M.D., Kimmo Taari, M.D., Matti Hakama, Ph.D., Sue M. Moss, Ph.D., Harry J. de Koning, M.D., and Anssi Auvinen, M.D., for the ERSPC Investigators*
A bs tr ac t
The authors’ affiliations are listed in the Appendix. Address reprint requests to Dr. Schröder at the Department of Urology, Erasmus University Medical Center, NH-224, Rochussenstraat 125, Rotterdam 3000 CA, the Netherlands, or at [email protected].
*Investigators in the European Random-ized Study of Screening for Prostate Cancer (ERSPC) are listed in the Sup-plementary Appendix, available at NEJM.org.
N Engl J Med 2012;366:xx-xx.Copyright © 2012 Massachusetts Medical Society.
Background
Several trials evaluating the effect of testing of prostate-specific antigen (PSA) on prostate-cancer mortality have shown conflicting results. We updated prostate-cancer mortality in the European Randomized Study of Screening for Prostate Cancer with 2 added years of follow-up.
Methods
The study involved 182,160 men between the ages of 50 and 74 years at entry, with a predefined core age group of 162,388 men 55 to 69 years of age. The trial was conducted in eight European countries. Men who were randomly assigned to the screening group were offered PSA-based screening, whereas those in the control group were not offered such screening. The primary outcome was mortality from prostate cancer.
Results
After a median follow-up of 11 years in the core age group, the relative reduction in the risk of death from prostate cancer in the screening group was 21% (rate ratio, 0.79; 95% confidence interval [CI], 0.68 to 0.91; P = 0.001) and 29% after adjustment for noncompliance. The absolute reduction in mortality in the screening group was 0.10 deaths per 1000 person-years or 1.07 deaths per 1000 men who underwent randomization. The rate ratio for death from prostate cancer during follow-up years 10 and 11 was 0.62 (95% CI, 0.45 to 0.85; P = 0.003). To prevent one death from pros-tate cancer at 11 years of follow-up, 1055 men would need to be invited for screen-ing and 37 cancers would need to be detected. There was no significant between-group difference in mortality from any cause.
Conclusions
Analyses after 2 additional years of follow-up consolidated our previous finding that PSA-based screening significantly reduced mortality from prostate cancer but did not affect mortality from any cause. (Current Controlled Trials number, ISRCTN49127736.)

T h e n e w e ngl a nd j o u r na l o f m e dic i n e
n engl j med 366;11 nejm.org march 15, 20122
Screening for prostate cancer has remained controversial, despite results show-ing a significant reduction in the rate of death
from prostate cancer (relative reduction, 20%) among men offered screening for prostate-specific antigen (PSA).1 The European Randomized Study of Screening for Prostate Cancer (ERSPC) is a multi-center trial initiated in 1991 in the Netherlands and in Belgium, with five more European countries (Sweden, Finland, Italy, Spain, and Switzerland) joining between 1994 and 1998. Recruitment was completed in these centers between 1995 and 2003. Later, France also joined, with enrollment in 2000–2005, but data from the French cohort were not in-cluded in the original analysis because of a short follow-up period (median, 4.6 years). Here we re-port mortality results from the ERSPC at 11 years of follow-up, adding 2 more years to the initial analysis.
Me thods
Study Design
The trial protocol, which has been described pre-viously,1,2 is available with the full text of this article at NEJM.org. A core age group of men between the ages of 55 and 69 years at entry was defined in the trial protocol in 1994.3 Screening was carried out at an interval of 4 years (2 years in Sweden).
The principal screening test was measurement of the serum PSA level with the use of the Tandem-R/Tandem-E/Access assay (Hybritech). A positive test result, defined as a PSA value of 3.0 ng per milliliter or higher, was an indication for biopsy in most centers. Sextant prostatic biopsies were rec-ommended for all men with positive test results; lateralized sextant biopsies4 were adopted in June 1996. Some exceptions to these procedures have been described previously.1
Primary End Points
The primary end point of the trial was prostate-cancer mortality. We evaluated deaths among men in both the screening group and the control group in whom prostate cancer was diagnosed (including cases that were first diagnosed at autopsy), regard-less of the official cause of death, as described pre-viously.1,5 Data on overall mortality were collected by linkage to the national registries. Each trial cen-ter followed the common core protocol and pro-vided key data to the joint independent data center every 6 months. The independent data monitoring committee received updates every 6 months ac-
cording to a predefined monitoring and evalua-tion plan.6
Statistical Analysis
We determined the sample size that would be re-quired to show a reduction of 25% in mortality (P<0.05) among men who actually underwent screening, with a power of 80% at 10 years of fol-low-up.7 Hence, the primary analysis was planned at the outset on the basis of follow-up of at least 10 years, which was reached with data through 2008. The current analyses include follow-up data through 2008 and follows the third interim moni-toring analysis, which showed a significant reduc-tion in mortality from prostate cancer among men undergoing PSA screening.1 We included the French data in the analysis of PSA test results but not in the analyses of the incidence of prostate cancer or mortality according to time period, since the follow-up period was short in France.
The main analyses were based on the core age group of men between the ages of 55 and 69 years at randomization. Besides the intention-to-screen analysis, we performed a hypothesis-generating secondary analysis, which was limited to men who actually underwent screening and was corrected for selection bias,8 to show the effect among screened men. We used the Nelson–Aalen method9 to calculate the cumulative hazard of death from prostate cancer or from any cause. A Forest plot and Kaplan–Meier curves of prostate cancer–spe-cific survival were constructed according to stan-dard techniques. All reported P values are two-sided, and there was no adjustment for significance on the basis of previous analyses because the pres-ent analysis was not driven by statistical signifi-cance but was protocol-based.10,11 We used Poisson regression analysis to calculate rate ratios, which were adjusted according to center.
We calculated the number of men who would need to be invited (NNI) to undergo screening in order to prevent one death from prostate cancer as the inverse of the absolute risk reduction among men who underwent randomization and for whom follow-up was restricted to 9 and 11 years. Where applicable, we calculated results with the control population for Finland weighted by 1:1.5 to ac-count for the ratio of study-group assignments. We calculated the number of prostate cancers that would needed to be detected (NND) in order to prevent one death as the inverse absolute risk reduction multiplied by excess incidence in the screening group for the same time periods, as well

Prostate-Cancer Mortality at 11 Years of Follow-up
n engl j med 366;11 nejm.org march 15, 2012 3
as for all available follow-up data.1 The terminol-ogy was changed from number needed to screen (NNS) and number needed to treat (NNT) because the definitions differed from the previous report and more correctly reflected the choice of data in-cluded in the calculations. (NNI is calculated from the intention-to-screen analysis and involves men who were invited but not screened, and NND is different from NNT in treatment trials.)
R esult s
Study Subjects
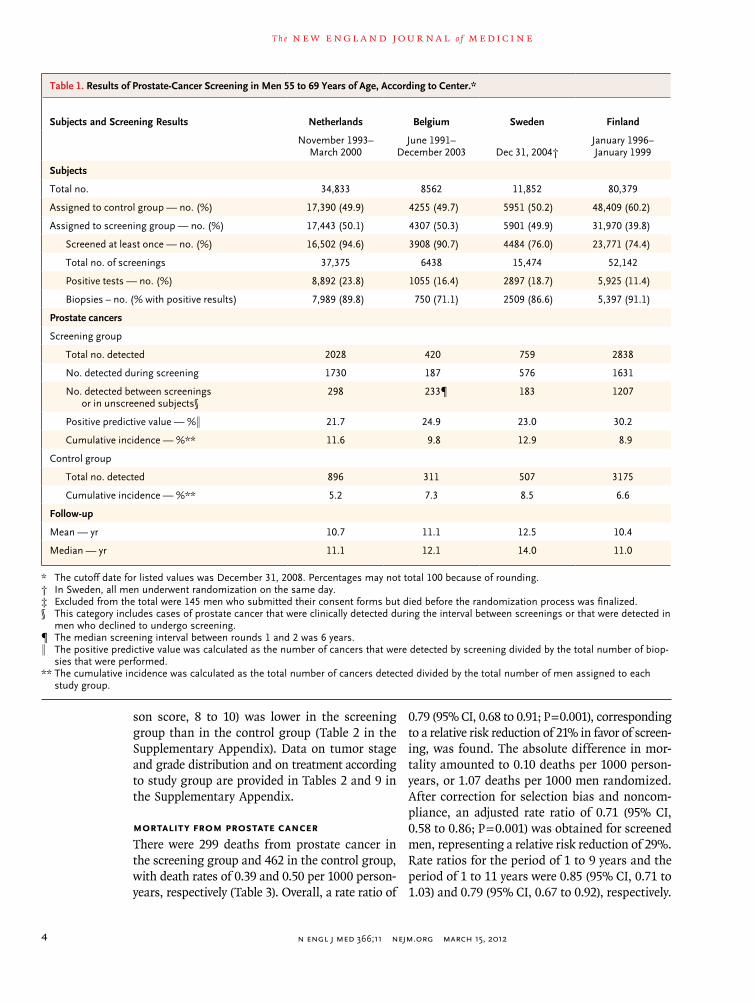
Recruitment in the ERSPC trial was completed by 2003 in the centers that were included in the mor-tality analysis, and hence, the number of subjects remained almost unchanged since the first mor-tality analysis1 (a total of 182,160 men, of whom 162,388 were in the core age group) (Fig. 1). Dur-ing the 2 additional years of follow-up, screening continued in the Netherlands, Sweden, Italy, Swit-zerland, and France but was discontinued after three screening rounds in Belgium, Finland, and Spain (Table 1, and Table 1A in the Supplementary Appendix, available at NEJM.org).
Test Results and Incidence of Prostate Cancer
In the core age group, 136,689 screening tests were performed (average, 2.27 per subject). Of these tests, 16.7% were positive, and 85.9% of the men with positive tests underwent prostate biopsy. The median screening interval was 4.02 years. A total of 6963 prostate cancers were diagnosed in the screening group (cumulative incidence, 9.6%) and 5396 in the control group (cumulative inci-dence, 6.0%), with approximately 1000 additional cases of prostate cancer in each study group, as compared with our earlier analysis.1
With follow-up through 2008, the mean and median durations of follow-up for the core age group were 10.5 and 11.0 years, respectively. The incidence of prostate cancer during the entire follow-up was 9.66 cases per 1000 person-years in the screening group and 5.95 cases per 1000 person-years in the control group (rate ratio in the screening group, 1.63; 95% confidence inter-val [CI], 1.57 to 1.69), with a rate difference of 3.71 cases per 1000 person-years (95% CI, 3.44 to 3.99) (Table 2). Data for years 0 through 9 are not identical to those in our previous report because continued follow-up in the centers with late entry contributed to the data for this period. The excess
incidence in the screening group was largely due to small, well-differentiated tumors, and the inci-dence of advanced tumors (stage T3 or T4 with distant metastasis) and aggressive cancers (Glea-
162,388 Men in core age group (55–69 yr)underwent randomization
182,160 Men of all ages underwentrandomization
145 Died during randomizationprocess
62 Were in the screening group83 Were in the control group
72,891 Were assigned to the screening group
89,352 Were assigned to thecontrol group
6963 (9.6%) Had prostate cancer6043 Had prostate cancer in yr 1–9920 Had prostate cancer in yr 10
or later
4198 (60.3%) Were at low risk1495 (21.5%) Were at intermediate
risk515 (7.4%) Were at high risk180 (2.6%) Had M1 or PSA
>100 ng/ml575 (8.3%) Had missing data
5396 (6.0%) Had prostate cancer4044 Had prostate cancer in yr 1–91352 Had prostate cancer in yr 10
or later
Risk-Group Distribution2249 (41.7%) Were at low risk1442 (26.7%) Were at intermediate
risk673 (12.5%) Were at high risk424 (7.9%) Had M1 or PSA
>100 ng/ml608 (11.3%) Had missing data
Risk-Group Distribution
Prostate Cancer Cases Prostate Cancer Cases
13,917 Died from any cause299 (0.4%) Died from prostate cancer
189 Died in yr 1–9110 Died in yr 10 or later
17,256 Died from any cause462 (0.5%) Died from prostate cancer
274 Died in yr 1–9188 Died in yr 10 or later
Figure 1. Enrollment and Outcomes.
Among subjects in whom prostate cancer was diagnosed, low risk was de-fined as a tumor stage of either T1 (tumor is present but not detectable clinically or with imaging) or T2 (tumor can be palpated on examination but has not spread outside the prostate) with a Gleason score of 6. Inter-mediate risk was defined as a tumor stage of T1, T2 with a Gleason score of 7, or T3 (tumor has spread through the prostatic capsule) with a Gleason score of 7. High risk was defined as a tumor stage of T1, T2, or T3 with a Gleason score of 8 to 10 or T4 (tumor has invaded nearby structures) with any Gleason score. The Gleason score is the sum of the scores for the two most common histologic patterns or grades in a prostate tumor, each of which is graded on a scale of 1 to 5, with 5 being the most cytologically ag-gressive. M1 denotes distant metastasis. PSA denotes prostate-specific an-tigen. Additional details regarding prognostic factors are provided in Table 2 in the Supplementary Appendix. Excluded from the total number of sub-jects were 145 men who submitted their consent forms but died before the randomization process was finalized.
T h e n e w e ngl a nd j o u r na l o f m e dic i n e
n engl j med 366;11 nejm.org march 15, 20124
son score, 8 to 10) was lower in the screening group than in the control group (Table 2 in the Supplementary Appendix). Data on tumor stage and grade distribution and on treatment according to study group are provided in Tables 2 and 9 in the Supplementary Appendix.
Mortality from Prostate Cancer
There were 299 deaths from prostate cancer in the screening group and 462 in the control group, with death rates of 0.39 and 0.50 per 1000 person-years, respectively (Table 3). Overall, a rate ratio of
0.79 (95% CI, 0.68 to 0.91; P = 0.001), corresponding to a relative risk reduction of 21% in favor of screen-ing, was found. The absolute difference in mor-tality amounted to 0.10 deaths per 1000 person-years, or 1.07 deaths per 1000 men randomized. After correction for selection bias and noncom-pliance, an adjusted rate ratio of 0.71 (95% CI, 0.58 to 0.86; P = 0.001) was obtained for screened men, representing a relative risk reduction of 29%. Rate ratios for the period of 1 to 9 years and the period of 1 to 11 years were 0.85 (95% CI, 0.71 to 1.03) and 0.79 (95% CI, 0.67 to 0.92), respectively.
Table 1. Results of Prostate-Cancer Screening in Men 55 to 69 Years of Age, According to Center.*
Subjects and Screening Results Netherlands Belgium Sweden Finland
November 1993– March 2000
June 1991– December 2003 Dec 31, 2004†
January 1996– January 1999
Subjects
Total no. 34,833 8562 11,852 80,379
Assigned to control group — no. (%) 17,390 (49.9) 4255 (49.7) 5951 (50.2) 48,409 (60.2)
Assigned to screening group — no. (%) 17,443 (50.1) 4307 (50.3) 5901 (49.9) 31,970 (39.8)
Screened at least once — no. (%) 16,502 (94.6) 3908 (90.7) 4484 (76.0) 23,771 (74.4)
Total no. of screenings 37,375 6438 15,474 52,142
Positive tests — no. (%) 8,892 (23.8) 1055 (16.4) 2897 (18.7) 5,925 (11.4)
Biopsies – no. (% with positive results) 7,989 (89.8) 750 (71.1) 2509 (86.6) 5,397 (91.1)
Prostate cancers
Screening group
Total no. detected 2028 420 759 2838
No. detected during screening 1730 187 576 1631
No. detected between screenings or in unscreened subjects§
298 233¶ 183 1207
Positive predictive value — %‖ 21.7 24.9 23.0 30.2
Cumulative incidence — %** 11.6 9.8 12.9 8.9
Control group
Total no. detected 896 311 507 3175
Cumulative incidence — %** 5.2 7.3 8.5 6.6
Follow-up
Mean — yr 10.7 11.1 12.5 10.4
Median — yr 11.1 12.1 14.0 11.0
* The cutoff date for listed values was December 31, 2008. Percentages may not total 100 because of rounding.† In Sweden, all men underwent randomization on the same day.‡ Excluded from the total were 145 men who submitted their consent forms but died before the randomization process was finalized.§ This category includes cases of prostate cancer that were clinically detected during the interval between screenings or that were detected in
men who declined to undergo screening.¶ The median screening interval between rounds 1 and 2 was 6 years.‖ The positive predictive value was calculated as the number of cancers that were detected by screening divided by the total number of biop-
sies that were performed.** The cumulative incidence was calculated as the total number of cancers detected divided by the total number of men assigned to each
study group.

Prostate-Cancer Mortality at 11 Years of Follow-up
n engl j med 366;11 nejm.org march 15, 2012 5
During the 11-year follow-up period, the ab-solute effect of screening, expressed as the NNI to prevent one death from prostate cancer, was 1055, and the NND was 37. For the nontruncated analysis (which included all available follow-up data for ≥12 years) the NNI was 936, and the NND was 33. The NNI and NND varied considerably according to the period of follow-up at all centers (NNI range, 936 to 2111; NND range, 33 to 80) and at the three largest centers (NNI range, 194 to 1825; NND range, 8 to 42) (Table 3A in the Sup-plementary Appendix). In Tables 2 and 3, the effect of weighting the control population of Finland by 1:1.5 is also shown.
The Nelson–Aalen curves for the cumulative hazard of death from prostate cancer in the two study groups separate gradually, starting approxi-mately 7 years after randomization (Fig. 2). A steadily increasing mortality with follow-up was found in the two study groups during the various
time periods (Table 3). The rate ratio for the 2 ad-ditional years of follow-up (years 10 and 11) was 0.62 (95% CI, 0.45 to 0.85), for a relative risk re-duction of 38%. The mortality results according to center are shown in a forest plot (Fig. 1A and Table 4A in the Supplementary Appendix). Kaplan–Meier analyses according to study group and Gleason score are provided in Fig. 2A in the Supplementary Appendix.
The total rate ratio for death from prostate can-cer among men in the screening group was sig-nificantly below 1.00 in the core age group and for all ages. However, in the subgroup analyses, the rate ratio for death from prostate cancer was sig-nificant only for men between the ages of 65 and 69 years. The study was powered for analysis of the core age group (Table 5A in the Supplementary Appendix). Only three centers (Finland, the Neth-erlands, and Sweden) had more than 100 deaths from prostate cancer, and the rate ratio for death
Italy Spain SwitzerlandTotal Excluding
France‡ France–Herault France–Tarn Total
October 1996– October 2000
February 1996– June 1999
September 1998– August 2003
June 2003– March 2005
December 2000– June 2004
14,517 2,197 9,903 162,243 57,658 21,356 241,257
7251 (49.9) 1141 (51.9) 4955 (50.0) 89,352 (55.1) 28,866 (50.1) 10,470 (49.0) 128,688 (53.3)
7266 (50.1) 1056 (48.1) 4948 (50.0) 72,891 (44.9) 28,792 (49.9) 10,886 (51.0) 112,569 (46.7)
5730 (78.9) 1056 (100) 4793 (96.9) 60,244 (82.6) 7,164 (24.9) 4,005 (36.8) 71,413 (63.4)
12,731 1846 10,683 136,689 7164 4005 147,858
1443 (11.3) 354 (19.2) 2299 (21.5) 22,865 (16.7) 1,091 (15.2) 614 (15.3) 24,570 (16.6)
902 (62.5) 263 (74.3) 1836 (79.9) 19,646 (85.9) 315 (28.9) 352 (57.3) 20,313 (82.7)
374 69 475 6963 885 497 8345
197 60 376 4757 163 112 5032
177 9 99 2206 722 385 3313
21.8 22.8 20.5 24.2 51.7 31.8 24.8
5.1 6.5 9.6 9.6 3.1 4.6 7.4
257 24 226 5396 782 443 6621
3.5 2.1 4.6 6.0 2.7 4.2 5.1
9.9 10.4 7.9 10.5 4.3 5.5 8.6
10.7 10.7 8.2 11.0 4.4 5.5 9.8

T h e n e w e ngl a nd j o u r na l o f m e dic i n e
n engl j med 366;11 nejm.org march 15, 20126
from prostate cancer in the core age group ranged from 0.56 in Sweden to 0.89 in Finland, with sig-nificant reductions in Sweden and the Netherlands (Table 4A in the Supplementary Appendix). Figure 3A in the Supplementary Appendix shows the dis-tribution of the 299 deaths in the screening group among men with cancers detected during screen-ing, men with cancers detected between screen-ings, and men who did not undergo screening. Nearly half the deaths in the screening group oc-curred among men with cancers detected during screening, and in 74% of these men, the diagnosis was made in the first round of screening. Approxi-mately a quarter of the deaths occurred among men with cancers detected between screenings, with a similar number among unscreened men.
We performed an analysis of the influence of the center by calculating the rate ratios for death from prostate cancer, omitting each center one at a time (Table 6A in the Supplementary Appendix). The overall rate ratios remained significant, with a point estimate of the rate ratio that was close to 0.80, regardless of the exclusion of any of the seven centers. With the omission of Finland, however, the rate ratio approached 0.70. (For details on rates of death from prostate cancer according to cen-ter and time period, see Tables 7A1 and 7A2 in the Supplementary Appendix.)
Overall mortality was similar in the two study groups (18.2 deaths per 1000 person-years in the screening group and 18.5 per 1000 person-years in the control group (rate ratio, 0.99; 95% CI, 0.97 to 1.01) (Table 5A in the Supplementary Ap-pendix). Data on death from any cause according to age group are supplied in Table 8A in the Sup-plementary Appendix.
Discussion
The controversy regarding screening for prostate cancer has been renewed by the publication of the draft report of the U.S. Preventive Services Task Force, which after a literature-based analysis of benefits and harms recommended against the use of PSA testing in asymptomatic men.12 The report has been discussed in several Perspective articles in the Journal.13-15 Clearly, the issue can be resolved only on the basis of evidence that considers both the advantages and disadvantages of screening, data that are not available at this time.
Our study shows that the absolute effect of screening on the rate of death from prostate can-Ta
ble
2. P
rost
ate-
Can
cer
Inci
denc
e in
Men
55
to 6
9 Ye
ars
of A
ge, A
ccor
ding
to S
tudy
Per
iod.
*
Stud
y Ye
ars
Scre
enin
g G
roup
(N
= 7
2,89
1)C
ontr
ol G
roup
(N
= 8
9,35
2)R
ate
Rat
io (
95%
CI)
†
Rat
e D
iffer
ence
per
10
00 P
erso
n-Yr
(95%
CI)
‡R
ate
Diff
eren
ce
per
1000
Men
‡
Pros
tate
C
ance
rsPe
rson
-Yr
Rat
e pe
r 10
00Pe
rson
-Yr
Pros
tate
C
ance
rsPe
rson
-Yr
Rat
e pe
r 10
00
Pers
on-Y
r
no.
%no
.%
1–9
6043
580,
502
10.4
140
4473
1,20
45.
531.
88 (
1.81
to 1
.96)
4.80
(4.
49 to
5.1
2)37
.6
8–9
1410
113,
850
12.3
811
7414
5,29
38.
081.
56 (
1.44
to 1
.69)
4.30
(3.
51 to
5.1
0)6.
2
10–1
154
188
,999
6.08
916
114,
462
8.00
0.78
(0.
70 to
0.8
7)−1
.92
(−2.
65 to
−1.
20)
−2.8
1–11
6584
669,
501
9.83
4960
845,
666
5.87
1.68
(1.
62 to
1.7
5)3.
97 (
3.68
to 4
.26)
34.8
≥12
379
51,1
417.
4143
661
,726
7.06
1.03
(0.
90 to
1.1
9)0.
35 (
−0.6
5 to
1.3
5)0.
3
Tota
l69
6372
0,64
39.
6653
9690
7,39
25.
951.
63 (
1.57
to 1
.69)
3.71
(3.
44 to
3.9
9)35
.1
* V
alue
s ar
e no
t in
clud
ed fo
r ce
nter
s in
Fra
nce
beca
use
of t
he s
hort
follo
w-u
p pe
riod
(m
edia
n, 4
.6 y
ears
).†
Rat
e ra
tios
have
bee
n ad
just
ed a
ccor
ding
to
cent
er.
‡ R
ate
diffe
renc
es a
re fo
r th
e sc
reen
ing
grou
p as
com
pare
d w
ith t
he c
ontr
ol g
roup
. Val
ues
for
the
cont
rol p
opul
atio
n in
Fin
land
wer
e w
eigh
ted
by 1
:1.5
to
acco
unt
for
the
ratio
in s
tudy
-gr
oup
assi
gnm
ents
. With
thi
s ad
just
men
t, th
e ra
te d
iffer
ence
s pe
r 10
00 p
erso
n-ye
ars
(95%
CI)
wer
e as
follo
ws:
4.8
9 (4
.56
to 5
.21)
for
1 to
9 y
ears
, 4.5
4 (3
.72
to 5
.36)
for
8 to
9 y
ears
, −1
.76
(−2.
52 t
o −0
.99)
for
10 t
o 11
yea
rs, 4
.10
(3.8
0 to
4.4
0) fo
r 1
to 1
1 ye
ars,
and
0.3
5 (−
0.68
to
1.39
) fo
r 12
or
mor
e ye
ars,
for
a to
tal b
etw
een-
grou
p di
ffere
nce
of 3
.84
(3.5
5 to
1.7
2).
With
thi
s ad
just
men
t, th
e ra
te d
iffer
ence
s pe
r 10
00 m
en w
ere
38.7
for
1 to
9 y
ears
, 6.7
for
8 to
9 y
ears
, −2.
5 fo
r 10
to
11 y
ears
, 36.
2 fo
r 1
to 1
1 ye
ars,
and
0.1
for
12 o
r m
ore
year
s, fo
r a
tota
l bet
wee
n-gr
oup
diffe
renc
e of
36.
3.

Prostate-Cancer Mortality at 11 Years of Follow-up
n engl j med 366;11 nejm.org march 15, 2012 7
cer increased in the intention-to-screen analysis from 0.71 to 1.07 deaths per 1000 men at a median of 11 years of follow-up, as compared with the initial results with a shorter follow-up period.1 Correspondingly, the NNI and NND to avert one death from prostate cancer decreased from 1410 to 936 and from 48 to 33, respectively. These num-bers are expected to decrease further with longer follow-up.16,17 In contrast, the relative reduction in risk remained practically unchanged, at 21%. After correction for noncompliance, there was a relative difference of 29% for screened men.
During years 10 and 11 of follow-up, there was a relative reduction in risk of 38%. However, the reduction in prostate-cancer mortality needs to be balanced against the disadvantages of early detec-tion of prostate cancer, with the proportion of overdiagnosis estimated to be approximately 50% of screening-detected cancers.18 A review by Loeb et al.19 showed that septic complications of biop-sies increased in line with increasing resistance of large-bowel bacteria to antibiotics. Another im-portant issue is the small effect of radical pros-tatectomy versus watchful waiting. In Scandina-vian Prostate Cancer Group Study Number 4,20 there was an absolute reduction in mortality of only 6 percentage points among men who under-went radical prostatectomy. In the Prostate Cancer Intervention Versus Observation Trial (PIVOT; ClinicalTrials.gov number, NCT00007644), there was no significant effect after 12 years of follow-up.21 In our study, there was no effect on the rate of death from any cause; an evaluation of the effect on quality of life is pending.
The effect of the extended follow-up is best as-sessed by comparing the data for follow-up trun-cated at 9 years with the data for 11 years of follow-up. Both the NNI and the NND were reduced by approximately half on the basis of 11 years of follow-up, as compared with 9 years. These results cannot be directly compared with our earlier analysis on the basis of all available data through 2006, which are not truncated according to follow-up calendar year. The absolute risk reduction is a concrete measure of the effect of screening but depends on the underlying risk in the population and therefore cannot be directly generalized.22
The effect of screening on prostate-cancer mor-tality was significant for the core age group and for all ages. However, there was no indication of a mortality reduction for men 70 years of age or older, though the confidence interval was wide for Ta
ble
3. M
orta
lity
from
Pro
stat
e C
ance
r am
ong
Men
55
to 6
9 Ye
ars
of A
ge, A
ccor
ding
to S
tudy
Per
iod.
*
Stud
y Ye
ars
Scre
enin
g G
roup
Con
trol
Gro
upR
ate
Rat
io (
95%
CI)
†P
Val
ue
Rat
e D
iffer
ence
n pe
r 10
00 P
erso
n-Yr
(95%
CI)
‡R
ate
Diff
eren
ce
per
1000
Men
‡
Dea
ths
from
Pr
osta
te C
ance
rPe
rson
-Yr
Rat
e pe
r 10
00
Pers
on-Y
rD
eath
s fr
om
Pros
tate
Can
cer
Pers
on-Y
rR
ate
per
1000
Pe
rson
-Yr
no.
%no
.%
1–9
189
608,
852
0.31
274
745,
912
0.37
0.85
(0.
71 to
1.0
3)0.
09−0
.06
(−0.
12 to
0.0
1)−0
.47
8–9
7112
2,86
70.
5811
815
1,31
90.
780.
74 (
0.55
to 0
.99)
0.04
−0.2
0 (−
0.40
to 0
.00)
−0.3
5
10–1
156
97,9
940.
5711
112
0,90
00.
920.
62 (
0.45
to 0
.85)
0.00
3−0
.35
(−0.
57 to
−0.
12)
−0.4
7
1–11
245
706,
846
0.35
385
866,
812
0.44
0.79
(0.
67 to
0.9
2)0.
003
−0.1
0 (−
0.16
to −
0.04
)−0
.95
≥12
5457
,387
0.94
7766
,241
1.16
0.80
(0.
56 to
1.1
3)0.
21−0
.22
(−0.
58 to
0.1
4)−0
.12
Tota
l29
976
4,23
30.
3946
293
3,05
20.
500.
79 (
0.68
to 0
.91)
0.00
1−0
.10
(−0.
17 to
−0.
04)
−1.0
7
* V
alue
s ar
e no
t in
clud
ed fo
r ce
nter
s in
Fra
nce
beca
use
of t
he s
hort
follo
w-u
p pe
riod
(m
edia
n, 4
.6 y
ears
).†
Rat
e ra
tios
have
bee
n ad
just
ed a
ccor
ding
to
cent
er.
‡ R
ate
diffe
renc
es a
re fo
r th
e sc
reen
ing
grou
p as
com
pare
d w
ith t
he c
ontr
ol g
roup
. Val
ues
for
the
cont
rol p
opul
atio
n in
Fin
land
wer
e w
eigh
ted
by 1
:1.5
to
acco
unt
for
the
ratio
in s
tudy
-gr
oup
assi
gnm
ents
. With
thi
s ad
just
men
t, th
e di
ffere
nces
in r
ates
per
100
0 pe
rson
-yea
rs w
ere
as fo
llow
s: −
0.06
(95
% C
I, −0
.12
to 0
.00)
for
1 to
9 y
ears
, −0.
20 (
95%
CI,
−0.4
0 to
0.0
0) fo
r 8
to 9
yea
rs, −
0.37
(95
% C
I, −0
.61
to −
0.12
) fo
r 10
to
11 y
ears
, −0.
10 (
95%
CI,
−0.1
7 to
−0.
03)
for
1 to
11
year
s, a
nd −
0.26
(95
% C
I, −0
.64
to 0
.12)
for
12 o
r m
ore
year
s, fo
r a
tota
l be-
twee
n-gr
oup
diffe
renc
e of
−0.
11 (
95%
CI,
−0.1
8 to
0.0
4). T
he c
orre
spon
ding
diff
eren
ces
in r
ates
per
100
0 m
en w
ere
−0.4
6, −
0.33
, −0.
48, −
0.94
, and
−0.
19, f
or a
tot
al b
etw
een-
grou
p di
f-fe
renc
e of
−1.
13.

T h e n e w e ngl a nd j o u r na l o f m e dic i n e
n engl j med 366;11 nejm.org march 15, 20128
this age group. This upper age limit and life ex-pectancy warrant careful consideration in future screening programs. The Kaplan–Meier analyses of the rate of death from prostate cancer accord-ing to study group and Gleason score (≤6 vs. ≥7) showed significant differences in the two study groups. This analysis is considered inadequate in the evaluation of randomized screening trials because of lead-time, length of trials, and over-diagnosis biases.23
The overall screening effect (in terms of a rate-ratio reduction) was not driven by any single center, as indicated by consistency in the analysis of influ-ence, despite some variation in the screening pro-tocol. Yet the rate ratio was not constant across centers, as also shown in the forest plot (Fig. 1A in the Supplementary Appendix). The screening effect depends on the frequency of cancers that were rendered curable by screening, which may differ according to center because of differences in screening procedures and in underlying risk. How-ever, the screening effect can also be attenuated by contamination (i.e., subjects in the control group who underwent screening). As compared with the entire ERSPC study, the Göteborg screening trial,24 which evaluated biennial screening during a fol-low-up period of 14 years, showed a larger mor-tality reduction and a more favorable NNI and NND, with a higher background rate of death from prostate cancer.
Some biases may have affected the mortality results of our study. Similar treatments need to be administered for similar disease to ensure that the difference between the two study groups was attributable to screening and not superior man-agement of cases detected by screening. Earlier analyses showed similar treatment approaches in the two study groups according to tumor stage.25,26 In addition, assignment of causes of death is prone to error, a challenge that is minimized by the use of standardized measures and blinded assign-ments.5 Finally, it has been estimated that in the control group, approximately 20% of men per year underwent PSA screening during the early follow-up period.27,28
The reasons why the effect of screening did not increase more during the extended follow-up re-main unclear at this time. The majority of deaths from prostate cancers that were detected by screen-ing (100 of 136, or 74%) occurred in men whose cancer was diagnosed at the first screening. Natu-ral history studies confirm the need for very long observation periods. Johansson et al.29 found a large increase in the rate of death from localized prostate cancers during follow-up of 15 to 20 years. The high proportion of prostate cancers that are detected during the intervals between screenings (25.8%) necessitates optimization of screening procedures. Despite the exclusion of men who had clinically evident prostate cancer at study entry, this high prevalence suggests that a large number of the men in our study probably had latent but aggressive disease, which turned out to be deadly even after prolonged follow-up.
In conclusion, our trial showed a relative risk reduction of 21% in favor of prostate-cancer screening in the intention-to-screen analysis and 29% among screened men after adjustment for noncompliance; the absolute risk reduction was 1.07 deaths per 1000 men at a median follow-up of 11 years. This corresponds to an NNI of 936 and an NND of 33 in order to prevent one death from prostate cancer. During years 10 and 11 of follow-up, the relative risk reduction was 32%. Screening had no effect on the rate of death from any cause. More information on the balance of benefits and adverse effects, as well as the cost-effectiveness, of prostate-cancer screening is needed before gen-eral recommendations can be made.
Dr. Schröder reports serving as a board member of European Urology, receiving consulting fees from GlaxoSmithKline and
Cum
ulat
ive
Haz
ard
of D
eath
from
Pro
stat
e C
ance
r
0.14
0.12
0.08
0.06
0.02
0.10
0.04
0.000 6 10 122 4 8 14
Years since Randomization
Control group
Screening group
Figure 2. Cumulative Hazard of Death from Prostate Cancer among Men 55 to 69 Years of Age.
Values are not included for centers in France because of the short follow-up period (median, 4.6 years). The Nelson–Aalen method was used to calculate the cumulative hazard of death from prostate cancer.

Prostate-Cancer Mortality at 11 Years of Follow-up
n engl j med 366;11 nejm.org march 15, 2012 9
Ferring, and receiving lecture fees and travel support from GlaxoSmithKline, Ferring, Société International d’Urologie, and the European Association of Urology; Dr. Tammela, serving as a board member for Astellas, Amgen, Pfizer, and GlaxoSmith-Kline, receiving consulting fees from Orion Pharma, receiving lecture fees from Astellas and Amgen, receiving payment for developing educational presentations from GlaxoSmithKline, and receiving travel support from Amgen; Dr. Kwiatkowski, re-ceiving consulting fees from GlaxoSmithKline; Drs. Lilja and Stenman, holding a patent for a PSA assay, and Dr. Stenman, receiving royalties from the patent; Dr. Aus, receiving lecture fees from AstraZeneca; Dr. Villers, receiving consulting fees
from Astellas, Ferring, and Takeda, grant support from Janssen, lecture fees from Ipsen, and payment for the development of educational presentations from Pierre Fabre Medicament; Dr. Taari, receiving consulting fees from Astellas, GlaxoSmithKline, Ferring, and Amgen, receiving grant support from Amgen, re-ceiving lecture fees from GlaxoSmithKline, being an employee of Medivation, and receiving travel support from Sanofi-Aventis, Pfizer, and Astellas; and Dr. de Koning, receiving consulting fees from Beckman Coulter. No other potential conflict of inter-est relevant to this article was reported.
Disclosure forms provided by the authors are available with the full text of this article at NEJM.org.
Appendix
The authors’ affiliations are as follows: the Departments of Urology (F.H.S., M.J.R., C.H.B.), Pathology (T.V.K.), Clinical Chemistry (B.G.B.), and Public Health (H.J.K.), Erasmus University Medical Center, Rotterdam, the Netherlands; the Department of Urology, Sahlgrenska Academy at Goteborg University (J.H., S.C.), and Urologkliniken, Capio Lundby Sjukhus (G.A.) — both in Göteborg, Sweden; the Departments of Urology (T.L.J.T.) and Pathology (P.M.K.), Tampere University Hospital; and the School of Health Sci-ences, University of Tampere (M.H., A.A.) — both in Tampere, Finland; the Department of Diagnostic Medical Imaging (S.C.) and the Unit of Clinical and Descriptive Epidemiology (M.Z.), Centro per lo Studio e la Prevenzione Oncologica, Florence, Italy; Provinciaal Instituut voor Hygiëne (V.N.) and Oncology Centre Antwerp (L.J.D.) — both in Antwerp, Belgium; the Department of Urology (M.K., F.R.) and Center of Laboratory Medicine (A.H.), Kantonsspital Aarau, Aarau, Switzerland; Unidad de Urologia, Hospital Infanta Cristina, Parla (M.L.), and Servicio de Urologia, Hospital Universitario de Fuenlabrada (A.P.) — both in Madrid; the Departments of Laboratory Medicine (H.L.), Surgery (H.L., S.C.), and Medicine (H.L.), Memorial Sloan-Kettering Cancer Center, New York; the Finnish Cancer Registry (L.M., M.H.) and the Departments of Clinical Chemistry (U.H.S.) and Urology (K.T.), Helsinki University Central Hospital Laboratory Division — both in Helsinki; the Department of Urology, Central Hospital Universitaire Lille, Lille (A.V.), and Service d’Urologie, Clinique Beau Soleil, Montpellier (X.R.) — both in France; the Center for Cancer Prevention, Queen Mary University of London, London (S.M.M.); and the Department of Laboratory Medicine, Lund University, Malmö, Sweden (H.L.).
References
1. Schröder FH, Hugosson J, Roobol MJ, et al. Screening and prostate-cancer mor-tality in a randomized European Study. N Engl J Med 2009;360:1320-8.2. Roobol MJ, Schröder FH. The Euro-pean Randomized study of Screening for Prostate Cancer (ERSPC): rationale, struc-ture and preliminary results 1994-2003. BJU Int 2003;92:Suppl 2:1-123.3. European Randomized Study of Screen-ing for Prostate Cancer: study protocol 1994, admission criteria and minimal data set. Section 4.0: definitions, 4.1 age groups (http://www.erspc.org/publist.php).4. Stamey TA. Making the most out of six systematic sextant biopsies. Urology 1995;45:2-12.5. de Koning HJ, Blom J, Merkelbach JW, et al. Determining the cause of death in randomized screening trial(s) for prostate cancer. BJU Int 2003;92:Suppl 2:71-8.6. de Koning HJ, Hakulinen T, Moss SM, Adolfsson J, Smith PH, Alexander FE. Monitoring the ERSPC trial. BJU Int 2003; 92:Suppl 2:112-4.7. de Koning HJ, Liem MK, Baan CA, Boer R, Schröder FH, Alexander FE. Pros-tate cancer mortality reduction by screen-ing: power and time frame with complete enrollment in the European Randomised Screening for Prostate Cancer (ERSPC) trial. Int J Cancer 2002;98:268-73.8. Cuzick J, Edwards R, Segnan N. Ad-justing for non-compliance and contami-
nation in randomized clinical trials. Stat Med 1997;16:1017-29.9. Peto R, Pike MC, Armitage P, et al. Design and analysis of randomized clini-cal trials requiring prolonged observation of each patient. I. Introduction and de-sign. Br J Cancer 1976;34:585-612.10. DeMets DL, Lan KK. Interim analysis: the alpha spending function approach. Stat Med 1994;13:1341-52.11. Aalen OO. Nonparametric inference for a family of counting processes. Ann Stat 1978;6:701-27.12. Screening for prostate cancer. Rock-ville, MD: U.S. Preventive Services Task Force, 2008 (http://www.uspreventiveser-vicestaskforce.org/uspstf/uspsprca.htm).13. Brett AS, Ablin RJ. Prostate-cancer screening — what the U.S. Preventive Ser-vices Task Force left out. N Engl J Med 2011;365:1949-51.14. McNaughton-Collins MF, Barry MJ. One man at a time — resolving the PSA con-troversy. N Engl J Med 2011;365:1951-3.15. Schröder FH. Stratifying risk — the U.S. Preventive Services Task Force and prostate-cancer screening. N Engl J Med 2011;365:1953-5.16. Gulati R, Mariotto AB, Chen S, Gore JL, Etzioni R. Long-term projections of the harm-benefit trade-off in prostate cancer screening are more favorable than previous short-term estimates. J Clin Epi-demiol 2011;64:1412-7.
17. Loeb S, Vonesh EF, Metter EJ, Carter HB, Gann PH, Catalona WJ. What is the true number needed to screen and treat to save a life with prostate-specific antigen testing? J Clin Oncol 2011;29:464-7.18. Draisma G, Boer R, Otto SJ, et al. Lead times and overdetection due to prostate-specific antigen screening: estimates from the European Randomized Study of Screening for Prostate Cancer. J Natl Can-cer Inst 2003;95:868-78.19. Loeb S, Carter HB, Berndt SI, Ricker W, Schaeffer EM. Complications after prostate biopsy: data from SEER-Medicare. J Urol 2011;186:1830-4.20. Bill-Axelson A, Holmberg L, Ruutu M, et al. Radical prostatectomy versus watchful waiting in early prostate cancer. N Engl J Med 2011;364:1708-17.21. 21.Wilt T. Prostate Cancer Interven-tion Versus Observation Trial (PIVOT): main results from a randomized trial comparing radical prostatectomy to watchful waiting in men with clinically localized prostate cancer. Presented at the annual meeting of the American Urologi-cal Association, Washington, DC, May 14–19, 2011. (VA/NCI/AHRQ CSP #407.)22. Rembold CM. Number needed to screen: development of a statistic for dis-ease screening. BMJ 1998;317:307-12.23. Wu GH, Auvinen A, Yen AM, Hakama M, Walter SD, Chen H. A stochastic model for survival of early prostate cancer with

n engl j med 366;11 nejm.org march 15, 201210
Prostate-Cancer Mortality at 11 Years of Follow-up
adjustments for leadtime, length bias, and overdetection. Biom J 2011 December 23 (Epub ahead of print).24. Hugosson J, Carlsson S, Aus G, et al. Mortality results from the Göteborg ran-domised population-based prostate-can-cer screening trial. Lancet Oncol 2010;11: 725-32.25. Wolters T, Roobol MJ, Steyerberg EW, et al. The effect of study arm on prostate can-cer treatment in the large screening trial ERSPC. Int J Cancer 2010;126:2387-93.
26. Boevee SJ, Venderbos LD, Tammela TL, et al. Change of tumour characteristics and treatment over time in both arms of the European Randomized Study of Screening for Prostate Cancer. Eur J Cancer 2010; 46:3082-9.27. Otto SJ, van der Cruijsen IW, Liem MK, et al. Effective PSA contamination in the Rotterdam section of the European Randomized Study of Screening for Pros-tate Cancer. Int J Cancer 2003;105:394-9.28. Ciatto S, Zappa M, Villers A, Paez A,
Otto SJ, Auvinen A. Contamination by op-portunistic screening in the European Ran-domized Study of Prostate Cancer Screen-ing. BJU Int 2003;92:Suppl 2:97-100.29. Johansson J-E, Andrén O, Andersson SO, et al. Natural history of early, local-ized prostate cancer. JAMA 2004;291: 2713-9.Copyright © 2012 Massachusetts Medical Society.
nejm 200th anniversary and social media
Follow NEJMTeam on Twitter and click “Like” on the New England Journal of Medicine page on Facebook for links to the latest articles, stories, and multimedia available
at the NEJM 200th Anniversary website, http://NEJM200.NEJM.org. Tweets incorporating the hashtag #NEJM200 also appear
in a Twitter feed at the anniversary website.
Copyright © 2022 FDOKUMEN