Properties of the mantle transition zone in northern Eurasia
12
JOURNAL OF GEOPHYSICAL RESEARCH, voL. 103,NO. B1, PAGES 811-822,JANUARY 10, 1998 Properties of the mantle transition zone in northern Eurasia T. Ryberg GeoForschungsZentrum, Potsdam, Germany F. Wenzel Geophysical Institute, University of Karlsruhe, Karlsruhe, Germany A. V. Egorkin and L. Solodi!ov Centre of Regional Geophysicaland Geoecological Research- GEON, Moscow, Russia Abstract. Short-period, three-component recordings of peaceful nuclear explosions (PNEs) in northernEurasiaare used to constrain the P wavevelocity structure of the mantle transition zone. The propertiesof the upper mantle discontinuities play an important role in understanding the nature of mantle processes. Data from severalP NE seismic sounding profilesreveal reflectionsand refractionsfrom upper mantle discontinuities at 410 and 660 kin depth. The amplitude and the sharpness of these velocity discontinuities contain important information to assess models of upper mantle phasechanges and chemical layering. The absence of strong critical and precritical reflectionsfrom the 660 km discontinuity is characteristic for all the data in northern Eurasia. By studying the P wave reflectionsand refractions from the 660 km discontinuity, several velocity models were derived. To construct a generalized model, 18 shotsobserved on seven profiles in Russia werestacked to eliminate localeffects. Synthetic seismograms werecalculated and comparedwith the Observations to test different velocity models. A comparison of the observed data with synthetic data predicted by a standard reference model (e.g. International Associationof Seisinology and Physics of the Earth's Interior 1991, (IASP91)) shows a systematic difference between the mantle phases.While the observed phases related to the 410 km discontimiity are consistent with the phases predicted by the IASP91 model, models with a smaller velocity step(-050%)across the 660 kin discontinuity or with a transitional 660 km discontinuity of several tens of kilometers thickness provide the best fit to the observed data for the 660 km phases. As long-period •data predict a sharp 660 kin discontinuity, we have to postulate that under northern Eurasia the velocity increase across the bottom of the mantle transition zone is only about 50% of the value predictedby the IASP91 model. We presenta generalized P wave velocity model, called Generalized Northern Eurasia Model (GNEM), for the uppermantlebeneath northern Eurasia basedon all availablelong-rangePNE data. Introduction Seismological models of upper mantle structurethrough the depths of the 410 km and 660 km discontinuities provide important constraints on the composition and dynamics of the mantle. There is general agreement that the 410 km discontinuity is associated with a pha- setransition fromolivine to/3 spinel [lto and Takahashi, 1989],although the amountof olivineconstituting the Copyright 1998 by the American Geophysical Union. Paper number 97JB02837. 0148-0227 / 98 / 97 J B-02837509.00 uppermantleremains unclear and may vary from 40% [Duffy and Andersou, 1989;Duffy e! at., 1995]to 60% [Irifune, 1987;Bina, 1993]. The nature of the 660 km discontinuity is even more controversial. The velocity increasemay be due to a transition from 7 spinel to perovskite and magnesiowfistite and (or) a transition from garnet to perovskite. Both components are likely to contribute to the transition. These two transitions may actually occur at slightly different depths or over different depth intervals, so that the 660 km transiti- on may be more complex than just a singlegradient or a singlediscontinuity [Iio and Takahashi, 1989; Duffy and Anderson, 1989; Irifune, 1987; Kuskov and Panfe- rov, 1991; Iia and Stixrude, 1992]. 811
Transcript of Properties of the mantle transition zone in northern Eurasia

JOURNAL OF GEOPHYSICAL RESEARCH, voL. 103, NO. B1, PAGES 811-822, JANUARY 10, 1998
Properties of the mantle transition zone in northern Eurasia
T. Ryberg GeoForschungsZentrum, Potsdam, Germany
F. Wenzel
Geophysical Institute, University of Karlsruhe, Karlsruhe, Germany
A. V. Egorkin and L. Solodi!ov Centre of Regional Geophysical and Geoecological Research - GEON, Moscow, Russia
Abstract. Short-period, three-component recordings of peaceful nuclear explosions (PNEs) in northern Eurasia are used to constrain the P wave velocity structure of the mantle transition zone. The properties of the upper mantle discontinuities play an important role in understanding the nature of mantle processes. Data from several P NE seismic sounding profiles reveal reflections and refractions from upper mantle discontinuities at 410 and 660 kin depth. The amplitude and the sharpness of these velocity discontinuities contain important information to assess models of upper mantle phase changes and chemical layering. The absence of strong critical and precritical reflections from the 660 km discontinuity is characteristic for all the data in northern Eurasia. By studying the P wave reflections and refractions from the 660 km discontinuity, several velocity models were derived. To construct a generalized model, 18 shots observed on seven profiles in Russia were stacked to eliminate local effects. Synthetic seismograms were calculated and compared with the Observations to test different velocity models. A comparison of the observed data with synthetic data predicted by a standard reference model (e.g. International Association of Seisinology and Physics of the Earth's Interior 1991, (IASP91)) shows a systematic difference between the mantle phases. While the observed phases related to the 410 km discontimiity are consistent with the phases predicted by the IASP91 model, models with a smaller velocity step (-050%) across the 660 kin discontinuity or with a transitional 660 km discontinuity of several tens of kilometers thickness provide the best fit to the observed data for the 660 km phases. As long-period • data predict a sharp 660 kin discontinuity, we have to postulate that under northern Eurasia the velocity increase across the bottom of the mantle transition zone is only about 50% of the value predicted by the IASP91 model. We present a generalized P wave velocity model, called Generalized Northern Eurasia Model (GNEM), for the upper mantle beneath northern Eurasia based on all available long-range PNE data.
Introduction
Seismological models of upper mantle structure through the depths of the 410 km and 660 km discontinuities provide important constraints on the composition and dynamics of the mantle. There is general agreement that the 410 km discontinuity is associated with a pha- se transition from olivine to/3 spinel [lto and Takahashi, 1989], although the amount of olivine constituting the
Copyright 1998 by the American Geophysical Union.
Paper number 97JB02837. 0148-0227 / 98 / 97 J B-02837509.00
upper mantle remains unclear and may vary from 40% [Duffy and Andersou, 1989; Duffy e! at., 1995] to 60% [Irifune, 1987; Bina, 1993]. The nature of the 660 km discontinuity is even more controversial. The velocity increase may be due to a transition from 7 spinel to perovskite and magnesiowfistite and (or) a transition from garnet to perovskite. Both components are likely to contribute to the transition. These two transitions
may actually occur at slightly different depths or over different depth intervals, so that the 660 km transiti- on may be more complex than just a single gradient or a single discontinuity [Iio and Takahashi, 1989; Duffy and Anderson, 1989; Irifune, 1987; Kuskov and Panfe- rov, 1991; Iia and Stixrude, 1992].
_
811

812 RYBERG ET AL.: MANTLE TRANSITION ZONE PROPERTIES
For years a debate was focused on whether the transi- tion zone separates material of different chemistry. Dif- ferent chemistries of the upper and lower mantle would indicate that mantle convection occurs as two-layer con- vection, whereas a simple phase transition would argue for whole-mantle convection. Modern tomographic stu- dies of subduction zones [Creager and Jordan, 1984, 1986; van der Hilst et al., 1991; Fukao et al., 1992; Wi- diyantoro and van der Hilst, 1996] show that at least for some subduction zones the convection process is not limited to the upper mantle. Thus one- or two-layer convection resulting in one-dimensional velocity struc- tures may not be the only alternatives.
Upper mantle structure is usually derived from pas- sive seismology. Short-period waves were used by Benz and Vidale [1993] to infer sharp discontinuities at 410 and 660 km depth from near-vertical P'P' underside re- flections at the discontinuities. Transition widths had
to be less than 5 km. P to S conversion of long-period data [Petersen et al., 1993] confirmed the sharp 410 km discontinuity but postulated a smoother transition (20 to 30 km width) for the 660 km discontinuity. More re- cently, Estabrook and Ifind [1996] (model EK1) showed that the increase in compressional velocity at a depth of 660 km is about half the value predicted by the the mo- del of the International Association of Seismology and Physics of the Earth's Interior 1991 (IASP91) [Kennett and Engdahl, 1991], whereas the shear velocity shows the same increase as IASP91. They used global ave- rages of long-period P wide-angle underside reflections and conversions at epicentral distances between 600 and 1800 . Thus, at the present state of investigations, there are at least three competing models of the 660 km dis- continuity. IASP91 [Kennett and Engdahl 1991,], EK1 [Estabrook and Kind, 1996], Benz and Vidale [1993], and Paulssen [1988] propose a sharp transition, where- as Petersen et al. [1993] claim a smooth one. The first two studies in favor of sharpness were based on global data sets, while the other ones had regional character. IASP91 and Petersen et al. [1993] suggest a large P wa- ve velocity step (0.6 km/s), Estabrook and Kind [1996] a small one (0.3 km/s), and Benz and Vidale [1993] cannot resolve this issue. The models are clearly not in mutual agreement. Petersen et al. [1993] contradict all other models because they propose a smooth tran- sition. It is worthwhile to note that all other models
postulate a sharp transition, with two of thern being from a global database. A significant body of seismo- logical literature exists on properties of the transition zone from long-period shear waves ($$ and $c$) such as impedance contrast, smoothness, and topography of the discontinuities [Shearer, 1991; Revenaugh and Jor- dan, 1991; Shearer and Masters, 1992; Shearer, 1996], but this work is only of secondary relevance to our P wave study .
In this paper we study the properties of the mantle transition zone with long-range controlled source data from Russian peaceful nuclear explosion (PNE) records. These data have dominant frequencies of 1 to 2 Hz and cover a wide range of offsets, providing high-esolution
constraints on the size of velocity jumps across the dis- continuities, depth ranges over which these velocity in- creases occur, and the velocity gradients beneath the discontinuity. With this same data set, Ryberg e! al. [1997] recently demonstrated the existence of a 520 km discontinuity beneath Eurasia. Here we focus on the properties of the 410 and the 660 km discontinuity by comparing data with predictions from the IASP91 glo- bal model. We demonstrate that our new model is con- sistent with the IASP91 model for the 410 km discon-
tinuity, with the introduction of a low-velocity channel between 210 and 275 km depth. The 660 km discon- tinuity as proposed in IASP91 is inconsistent with the PNE data.
Data
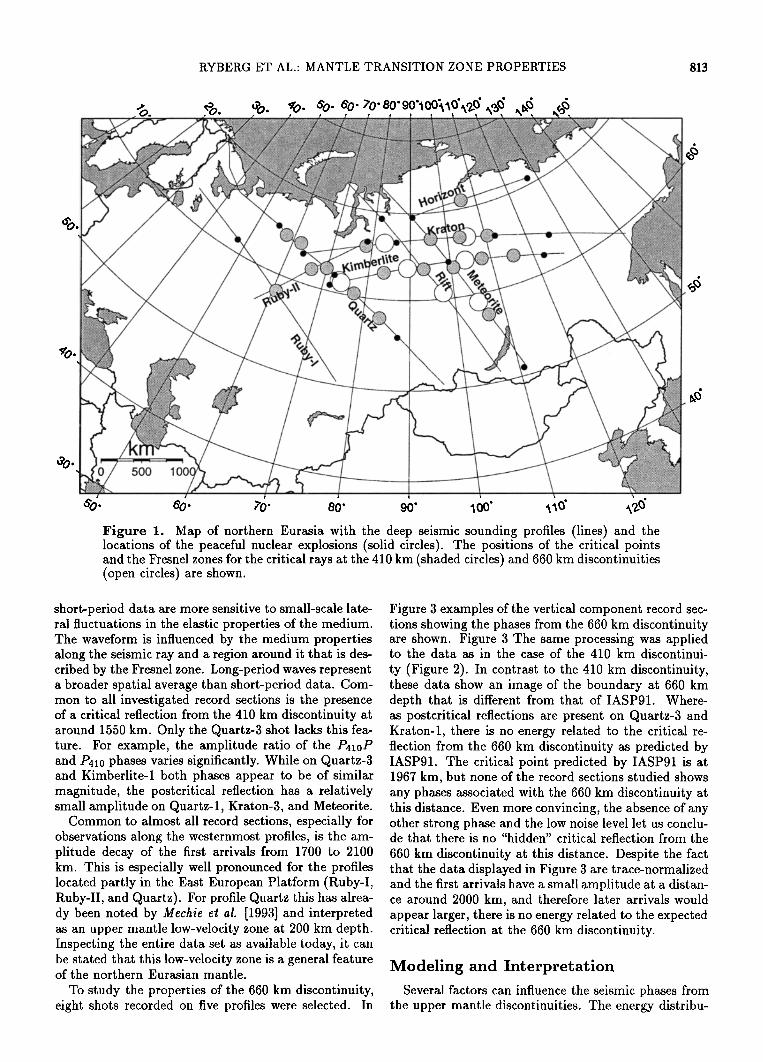
From 1971 until 1990, Russian scientists carried out an intensive program of deep seismic sounding across the territory of the former Soviet Union. The aim of these investigations was to study the crust and the up- per mantle. Numerous PNEs and chemical explosions were used as powerful sources for elastic waves. Up to 400 short-period (1-2 Hz) three-component, seismo- meters with analog recording systems were deployed to record these explosions. Individual explosions were ob- served along profiles more than 3000 km long at stations separated by about 10 km. These observations provide data density not previously available for studies of the upper mantle and its transition zone. A map of Russia (Figure l) shows the location of the profiles and shots used in this study. Figure i To investigate the proper- ties of the mantle transition zone below northern Eura-
sia, we analyzed seismic data from 18 shots recorded on seven profiles for the 410 km discontinuity. Examples of the vertical component record sections are given in Fi- gure 2. Figure 2 Simple low-pass filtering (fc=1.25 Hz) was applied to the data to reduce the high-frequency noise. Only the distance range where we expect the tri- plications from the 410 km discontinuity is displayed, and the reduction velocity was chosen so that the pha- ses related to the 410 km discontinuity appear parallel to the distance axis. These record sections demonstrate
the good signal-to-noise ratio of the data. The lower right part of Figure 2 presents the theoretical travel- time curves for the refracted and postcritically reflec- ted phases associated with the mantle transition zone based on the IASP91 model. The dominant phases in the record sections of Figure 2 are the phases reflec- ted at the 410 km discontinuity (P4•0P) and the phases refracted below that boundary (P4•0). While the tra- vel times of these phases are in good agreement with the travel times predicted by IASP91, there is signifi- cant variation of the (relative) amplitudes of the mantle phases. Two main reasons cause amplitude variations in short-period data. Local site effects are well-known from strong motion analysis and can easily change am- plitudes by a factor of 5 to 10. They can enhance a certain frequency range by resonance effects and thus considerably change the waveform. On the other hand,
RYBERG ET AL.: MANTLE TRANSITION ZONE PROPERTIES 813
00. ½0- SO- 6'0' 70' 80'90'100•'10',•?..•
500 I
SO. 6'0. 70' 80' 90' 100'
Figure 1. Map of northern Eurasia with the deep seismic sounding profiles (lines) and the locations of the peaceful nuclear explosions (solid circles). The positions of the critical points and the Fresnel zones for the critical rays at the 410 km (shaded circles) and 660 km discontinuities (open circles) are shown.
short-period data are more sensitive to small-scale late- ral fluctuations in the elastic properties of the medium. The waveform is influenced by the medium properties along the seismic ray and a region around it that is des- cribed by the Fresnel zone. Long-period waves represent a broader spatial average than short-period data. Com- mon to all investigated record sections is the presence of a critical reflection from the 410 km discontinuity at around 1550 km. Only the Quartz-3 shot lacks this fea- ture. For example, the amplitude ratio of the P4•oP and P410 phases varies significantly. While on Quartz-3 and Kimberlite-1 both phases appear to be of similar magnitude, the postcritical reflection has a relatively small amplitude on Quartz-l, Kraton-3, and Meteorite.
Common to almost all record sections, especially for observations along the westernmost profiles, is the am- plitude decay of the first arrivals from 1700 to 2100 km. This is especially well pronounced for the profiles located partly in the East European Platform (Ruby-I, Ruby-II, and Quartz). For profile Quartz this has alrea- dy been noted by Mechie et al. [1993] and interpreted as an upper mantle low-velocity zone at 200 km depth. Inspecting the entire data set as available today, it can be stated that this low-velocity zone is a general feature of the northern Eurasian mantle.
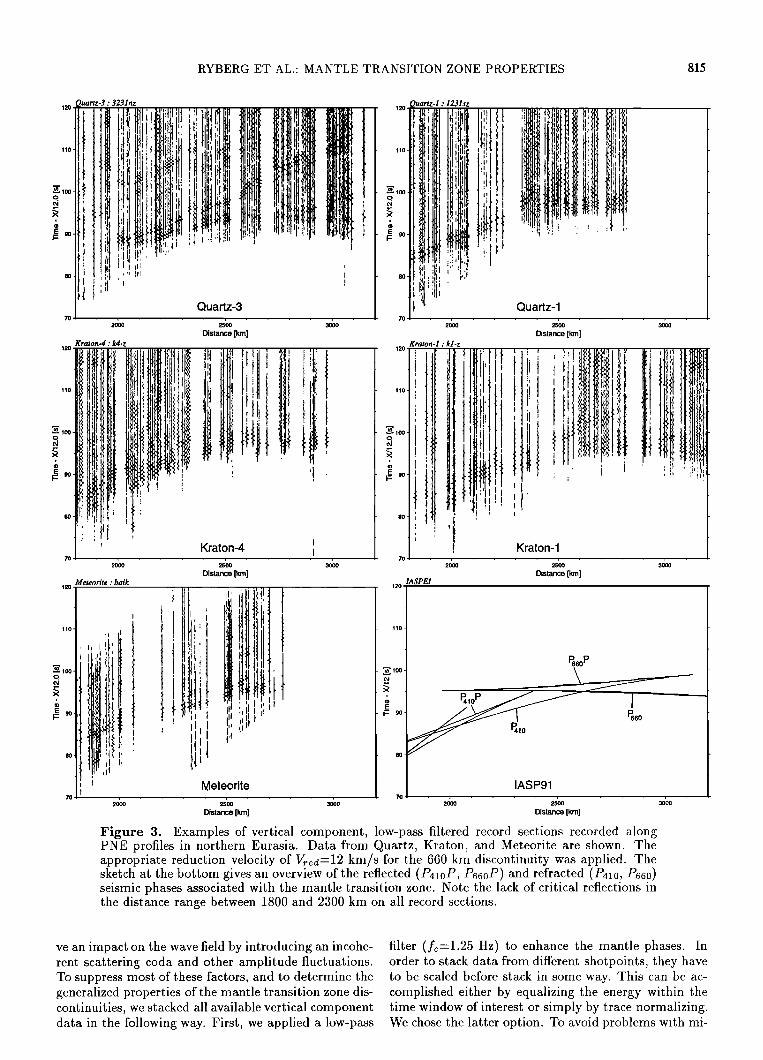
To study the properties of the 660 km discontinuity, eight shots recorded on five profiles were selected. In
Figure 3 examples of the vertical component record sec- tions showing the phases from the 660 km discontinuity are shown. Figure 3 The same processing was applied to the data as in the case of the 410 km discontinui-
ty (Figure 2). In contrast to the 410 km discontinuity, these data show an image of the boundary at 660 km depth that is different from that of IASP91. Where- as postcritical reflections are present on Quartz-3 and Kraton-1, there is no energy related to the critical re- flection from the 660 km discontinuity as predicted by IASP91. The critical point predicted by IASP91 is at 1967 km, but none of the record sections studied shows any phases associated with the 660 km discontinuity at this distance. Even more convincing, the absence of any other strong phase and the low noise level let us conclu- de that there is no "hidden" critical reflection from the
660 km discontinuity at this distance. Despite the fact that the data displayed in Figure 3 are trace-normalized and the first arrivals have a small amplitude at a distan- ce around 2000 km, and therefore later arrivals would appear larger, there is no energy related to the expected critical reflection at the 660 km discontinuity.
Modeling and Interpretation Several factors can influence the seismic phases from
the upper mantle discontinuities. The energy distribu-

814 RYBERG ET AL.- MANTLE TRANSITION ZONE PROPERTIES
Meteorite ß baik 80
70
rll • B•
,
ß •o lOOO 15.00
Distance [km]
, ,
M•t•orit•
2o•o 25'00 Distance [•m]
IASPEI
20OO
Distance [km]
• p•6o P
• IASP91 ooo ,5.oo 2• 25'00
Distance [km]
Figure 2. Example.s of vertical component, low-pass filtered (f•:1.25 Hz) record sections recor- ded along PNE profiles in northern Eurasia for two shots recorded along Quartz (top right and left), for the westernmost shot recorded along Kimberlite (middle left), for shot 3 recorded along Kraton (middle right), and for the southernmost shot along the profile Meteorite (bottom left). The appropriate reduction velocity of V,ed=10 km/s for the 410 km discontinuity was applied. Instead of wiggle lines, the area-fill presentation method was used. The sketch at the bottom right gives an overview of the reflected (P4•0P, P6eoP) and refracted (P4•0, Peso) seismic phases associated with the mantle transition zone. Note the strong critical reflections from the 410 km discontinuity on Kimberlite, Kraton, and Meteorite.
tion along the wide-angle phases, mainly the top-side reflection at the boundary and the refraction below it, depends substantially on the velocity contrast and the sharpness of the discontihuity. Also, the average depth
of a reflector and its possible topography will produce changes in the energy distribution along the phases due to caustics and focusing/defocusing effects. Scatterers in the uppermost mantle and Earth's crust will also ha-
RYBERG ET AL.' MANTLE TRANSITION ZONE PROPERTIES 815
, ,• , • 1,• • , [ ,
70
2• 25• 3•
Distance [km] ß kl-z 120 Kraton-I
_ I :' • 90
; •• Kraton-4 , . ,' ..... , ....... / 80
•o ' •' Kraton-1
: ;,,
• , Meteorite IASP91 70 ' •o• • a•o • •oo doo
Distance [km] Distance [km]
Figure 3. Examples of vertical component, low-pass filtered record sections recorded along PNE profiles in northern Eurasia. Data from Quartz, Kraton, and Meteorite are shown. The appropriate reduction velocity of V•,d:12 km/s for the 660 km discontinuity was applied. The sketch at the bottom gives an overview of the reflected (P4•0P, P66oP) and refracted (P4•0, P660) seismic phases associated with the mantle transition zone. Note the lack of critical reflections in the distance range between 1800 and 2300 km on all record sections.
ve an impact on the wave field by introducing an incohe- rent scattering coda and other amplitude fluctuations. To suppress most of these factors, and to determine the generalized properties of the mantle transition zone dis- continuities, we stacked all available vertical component data in the following way. First, we applied a low-pass
filter (f•=1.25 Hz) to enhance the mantle phases. In order to stack data from different shotpoints, they have to be scaled before stack in some way. This can be ac- complished either by equalizing the energy within the time window of interest or simply by trace normalizing. We chose the latter option. To avoid problems with mi-

816 RYBERG ET AL.- MANTLE TRANSITION ZONE PROPERTIES
stack: xstack-e-4
::::::::::::::::::::::: :•. ;•..:•:<.:.,;:,,.(,<.c.;:.•:!:.c:..::,,::.,.:.c.c:.•;::;•:. <.,.::
30' 1000 1500
::::::::::::::::::::::::::::::::: .: •:.:-:•.•:::::.•.:::: .:...-.•.:.-.-::.:.:.:-:.:-:-.--:-'..:.:,.:-:.:.:.m
!::!i'..?:!!::::•?;!::!::•i:•i:::.::• ::::::::::::::::::::::: :::::::::::::::::::::::::::::::::::::::::::
:::::::::::::::::::::::::: :k<.,.-: ,:: ,•::.. •..,,., ...::: :::i,:: :::• :•,:•. !s.-;.c:.-.':!.•:i:!::•:•:'.--:•:!:!:: •::::•;:k*.:::':-.-.::' ':..'.!:.'ci::ii:.:1<.:i::::: •;..<..: .:.:..•..... ß. ::.-.. ;, ...•:., - .x;¾. ¾ .:.• '•..:.:.........,; ..,...s, +. ...::•.•,.<;J•:..'.'..•:• '""•', '":"'"' .-*..":--. '-.,.: '.•.:'::•'•{•.i•!i:•t..•..'.(i•:.•: ..... .. ..- !.-.':!• •-'..'.•!•!:.!•:•: E
' '*:"*;' '•":' ' "• ....... .,..: i*:.'.,•:':•i.•i i*'•::ii*:*!•i:'.'ii!•:':;ii :i:i" ........ :'"' "' -:*:i .*.::'.&..":":,: :,• ::::::::::::::::::::::::: .:.*,.:, .................. .;.,. ::::::::::::::::::::: ::: ,..,..•
--%. ::
'""' stn':•i.k of observed ::,,•:. .:.:
Distance [km]
/A&r,E/
p4 n • P•6o P 1• r-
• P•ø
IASP91
Distance [km]
•o IASPEI :• ............. FASPEIfivz : mx421-e-v4 .,..-:..,,:,:::??::•i:ii•;i:??::;:;:.;i'.:.::,,? *<;•. :.:.:.?: ............ . ,,:::,::::i,::,,::>.'• ...... •%.-'..½:":::"' '-: :::::::::::::::::::::: ...... "*; ........................................................................... ** ....... '
J :::.i:-:;•:: ..... .:.;:n. qi! ..... ..::':"'. . ;:.:::: ....... . ...... )!•:.•.•<.;'*-.'"-'.'"'-':• .... -.-'."" :'t•;.•.. :_•: .-:'... . :•:.:•::-:".' . ,:'::: ............... -"::.:•*½-<'" .:: •:•::•.-n ..... •;*::•-•4:-.-'•;;' :•!'i:i:•..-:•:i!-:*-•:::::;::::::•"-'""•:::..i:::::!i•.-'..'i!': ............ !::::'::: :"'.': .............. •:• - :" ::::" :.....:• ....... ?::.:!?:.i. . ......... :.::.:.:;:::%.:. ::,i•i•:• ...... .:- ............... ... ..... -?**.,..,..,: ....... .. :*** > • •::i•:'s..'.s.-.'.':';:':';;:.-.•..<.•.'..:•:•::ii.'.<•:'.<• .... ...:::'."--:'-:-:":.:.:;' - .... .....:.::•:!':-: .:::-'- .. ...:i:.4•;: .... '"!";::•' .... :::::::":'" '"" '•:•::!$ ..... '"'::"' ..... ::%: ..... :':""•'":'<•::::;"" ' ..... I •`•*••.••::`•••••:•:•:•:•:•:•:•:•:::•:•:•:•:•::•:• .... -.-.-**' ....... ,-' -..---:'::" -.,:* ....... / .... ============================== ..... ***::'%.---;:;: ........... ::'.':• :::%:,,: .:.,:......:..:**i::*':' .................. :..- .....
..;.-.-..,.•::,::i:,...-.-..-,.::.:.:.:i,::....:::•.::......:.:.-:::i.:: ......... :.,..'! ...... . ...... - .... . ........ ,....,:, .... t ............... i:! ........ :•;;•;i::•>:?:**•::?*i*!!i!!!iii:•i!!•i?*•>•.*:*•*::•*:*•::•:•::•**:4:::•;•':•&•*!%:...;;;**.`.: ......... ;; ....... .::!.,.ii!-..::,i .. •o ..... :.-iiii!::'??'.:;:' :::::::::::::::::::::::::::::::::: .... :":•,.::.:.,:!!?:?::" .::::"::-.;•. ---::.-':* '*:!:: .......................... ":.-::'::***'-': .... '%....:i'*?"?: ......
:---- ...<::::...::!,:-...- ... ........ .:-.:.:..? -<.;:.•.::::: ....... :, :--':....-".:•:'.-'•' ;;•s•`•;•:i•:::•:•:•:•i•`•)•:•::•:•:*•::•:::•*;!•:•:•:;•:•:•::•?! ...,..?:*:::::.:::.*.-'-'.':'...:,c:s.;.-.'"' ';>....,:..':,;: :' ...... ;,:,-:****:-.-.':*::::.::..: ......... :'"'":*:*:::':': :* ..... ":::*:** "":-'*; ............. '*;*:'"'::::: ': "' *:::::;•i ........... **..,:**.,,::,iiii..::-..':.:::, .. .... ";i•::•:•::,.-:.'.•:,:.•;i•";....:::';::::.:..'.'i'."•::::':*' ..:.,:.:..'*'.-::.:%.::"" :*:Li•.•*.:.i::;:;*:::•::-...:.::.,:::•-*•::;-.:•i•i•::::::::"" :.: '*'>-'.:•:.-:::..*::•-*-:'• :::::• ........... ":":':-.
:•`•:.....;::.•.•*•!•:•*:•..:::•:::•i•i•i•!•!:•::•i•::•`• .... ..-.•<,.'-"!i!'!:!:::...:•:; ....... .....::.•::•::•:i•::•::•:;;;::•.•:•:;;;;•`•ii::•:!•:•:•.•!•:•i;:•:•:•.. ....•.•i•i:.: •:::•i•i::.:...'i•::•::•:•:•:•:•i•!•'.•*.:•.:.• ::•: .7 ...................... • ...... : .... ..•::.•,•:.;:::" " :':-:":i']:;j:•!;.;.•:':':'::•:':.•;.'.-'..• ............. ;:-''--'""•-- ß -.:----. '::•••! • ..... ,;:-:-.•:-•.,,.,.•:-•:.•;,,.: :'.:.:::•---;.:,,,. ................ .:•.:•:•:•:•:•-.-'..•:.:.:•.-'..•:::•,.-.:--';,..•...•!•:':--':::-. :,:•::-•;.*.;;,..-•:•,•,:::::::• ...... ß ............ •-::::• .................... •:•,,.•:a,•:,:•:-::.;:.-..'--:.:--'•.,;;":-•
.?•:!.t...:-::i•!!:•.,::•::::'.'-,.,.'.*.-.'.-.-'.-'.'..'.::':" =========================== .......... .'.-.:..•::!•:•:•:..'.-•;.'.s.•!•i•....:::::'"':::" ::iiii!•::::: '?..*-:::: ................... :, .......... ;-*-;.•-.•-;.-:•:i•::..•::.•'..i•;..<.-•<.•.•:-•i ............ •:*•:•:*•!•::•f:•::•;•i;•i!ii::i;i•:::•::;;;•*:•;•.•:.•`•:::•!•s•:•:::;:•:•:::•:.:.•:.:::":.'•::.!!.:j;•:%•.:;•:;.!.%.::;•:::?`•.::.::.. .. - ............ '""'" '--'..• . • .• :,:: ..... -.'..:.*.':;.;.:•}.:i'.:';..•i•.*..•ii.•-;•ii::•::::. ........................... . .:•..,:.•:.. '-"**'•'-'----'-'•' ----'•'--'•'-•- .'•-"-'•:••• ............... . .? ........ ::::;., .................... ::::::::::::::::::::::::::::::::::::::::::::::::::::::::::::::::::: ........................... •-"" '"'" *•'•'"""•'"'•'ø•••- -"-"'•••••11i.."..•:•:.:.!!:;;:•i::i!:i•i•D!•!:::::i: .... • ......... ,e•'""•'"'" '"'"'--•"'•'••••'"'••'•'"'•:•'"•':•''' ' '' '•"••:"'--• .,--•:•:'4•'-"-"-':""'. .......... .....:::::,.:½::•½*'-'"';.: :::.¾*:':".. '"--'•-- *:•-*-"-:• ............ ' ..........
ß I ":':':::'"':'":"::*:**'::":'"!:a'"'** :'""":'""" .... '7...:.• IASP$• + LVZ 3o 3o -I
Distance [krn] Distance [km]
Figure 4. Results of stacking to enhance phases from the 410 km discontinuity (top left). Vertical component data from 18 nuclear explosions were processed. Instead of wiggles, a gray scaled presentation method was used. The sketch (top right) gives an overview of the expected upper mantle phases according to the IASP91 model. The figure at bottom left shows the stacking results for synthetic data calculated on the basis of the IASP91 model. A good fit to the observed data is obtained with a model based on IASP91 but modified to include an upper mantle low-velocity zone.
nor time shifts, caused by different crustal structures, small-scale velocity inhomogeneities in the uppermost mantle, and/or instrumental timing errors, we used the envelopes, calculated on the basis of the analytic signal rather than the full signal. All traces from all shots wi- thin a bin of 20 km width around a given offset were stacked into one output trace. Figure 4 (top left) shows the stacking result. Figure 4 While single-record secti- ons are obviously influenced by scattering, noise, focu- sing and defocusing effects, etc., in the stacked image, the seismic phases appear smoothed.
For distances less than 1600 km a refracted phase oc- curs as the first arrival. It corresponds to seismic energy propagating at depths down to 200 km. The prograde and retrograde phases from the 410 km discontinuity re- present dominant features in the record section. Again, to identify the main phases, travel time curves with re- spect to the IASP91 model are given in Figure 4, top right. Beginning with 1500 km, a strong phase travels at approximately 53 s reduced time. It splits into two
phases, one being reflected at and the other being re- fracted below the 410 km discontinuity. At a distance around 2500 km, phases related to the 660 km discon- tinuity become more visible.
To compare our stacking results with the wave field predicted by the standard Earth model IASP91, syn- thetic seismograms were calculated using the reflectivity method [Fuchs and Miiller, 1971]. The one-dimensional velocity function was approximated by a steplike func- tion containing 200 constant velocity sublayers. The appropriate Earth flattening transformation was app- lied prior the calculations. A P wave point source was located at a depth of 800 m. The source time function is a relatively broadband source wavelet with a domi- nant frequency of 1 Hz. The resulting complete vertical component seismograms contain multiples and conver- ted phases. To allow for a simple comparison of the observed data with the synthetics, we applied the same stacking procedure to the synthetically calculated data and compared the wave field associated with the 410 km

RYBERG ET AL.: MANTLE TRANSITION ZONE PROPERTIES 817
discontinuity predicted by the IASP91 model (Figure 4, bottom left) with the stacked data from northern Eura- sia. The main difference between the IASP91 synthetics and the observed data consists in a different behavior of the first arrival at distances from 1600 to 2100 km.
While the IASP91 model predicts strong first arrivals, the observed data lack this phase. As Mechie et al. [1993] have shown for profile Quartz, the low amplitu- des in this distance range are caused by a low-velocity zone from 200 to 280 km depth. While the IASP91 model does not contain this feature, it seems that it is characteristic for northern Eurasia. If we introduce this
low-velocity zone into the IASP91 model, calculate the synthetics, and apply the described stacking procedu- re, we arrive at the record section shown in Figure 4, bottom right. The travel time and the amplitudes of the reflection at and the refraction below the 410 km
discontinuity of the observed data look very similar to the synthetics of the modified IASP91 model. From this we can conclude that beneath northern Eurasia, the reflective properties of the 410 km discontinuity are consistent with the IASP91 model. If we compare the postcritical P4•oP reflection for distances larger than 2450 km, we can see that the introduction of a mant- le low-velocity zone led to a better fit to the observed data than the wave field predicted by the unmodified IASP91 model.
Once we analyzed the phases of the 410 km disconti- nuity successfully, we applied the same data processing scheme to the eight shots recorded in the distance ran- ge from 1800 to 3200 km to study the properties of the 660 km discontinuity (Figure 5, top left). Figure 5 Although the lateral coherency of phases is less than that of the phases related to the 410 km discontinuity, the signal-to-noise ratio is high enough to allow quanti- tative comparisons with the IASP91 model. Although the first arrival for distances greater than 2500 km ap- pears scattered, its energy is larger than that of later arrivals. Figure 5 (top right) shows the travel time cur- ves for the main reflected (P4•0P, P66oP) and refracted (P4•0, P6e0) phases with respect to the IASP91 model. While the travel times of the phases are consistent with IASP91, the most remarkable difference was found in the amplitude behavior of the reflected and refracted mantle phases from the 660 km discontinuity. Although the signal-to-noise ratio behind the first arrival for tra- ces between 1800 and 2300 km is small, no energy re- lated to the critical and precritical reflection from the 660 km discontinuity is observed in this distance range. Individual record sections confirm the absence of this
feature as well (Figure 3). In contrast, the IASP91 mo- del predicts large amplitudes for these phases (Figure 5, middle left), with the critical point for reflections at this discontinuity located at 1967 km and thus gene- rating a strong amplitude arrival around this distance. The second discrepancy between IASP91 and our data can be observed at 3000 km distance. IASP91 predicts a strong postcritical reflection beyond this offset. The data suggest its termination at 3000 km. Two reasons may be responsible for the weak precritical energy of
the 660 km phase. First, it could be caused by a re- flection at a discontinuity with a reduced P wave velo- city step across it, which would shift the critical point to a larger distance. Alternatively, the lack of critical energy around 2000 km could be explained by a deeper located 660 km discontinuity. Calculations show that the position of the critical point is not very sensitive to depth changes of the boundary. Assuming a constant gradient above the discontinuity, a depth increase by 1 km increases the position of the critical point by on- ly 2.6 km. Maximum depth variations of the 660 km discontinuity of about 30 km as derived by by Shearer and Masters [1992], corresponding to a shift of the cri- tical point of 78 km, would be not enough to explain the absence of critical energy characteristic of our ob- servations. Second, the weak precritical energy could be caused by a velocity gradient, rather than a step, at the 660 km discontinuity. Figure 5, middle right, shows the synthetics of a model with a reduced (50%) velo- city step across that boundary (Generalized Northern Eurasia Model (GNEM)), and Figure 5, bottom right shows those of the model EK1 (modified to have an up- per mantle low-velocity zone added) by Estabrook and Kind [1996]. Figure 5, bottom left, shows the results for a model with a 50 km thick transitional 660 km dis-
continuity (GNEM'). It seems that all models (GNEM, GNEM', and EK1) sufficiently explain the absence of strong 660 km energy at distances below 2300 km. All models also have less postcritical energy from the 660 km discontinuity for distances larger than 3000 km com- pared to the IASP91 model. This is in good agreement with the observations in northern Eurasia.
A more quantitative analysis of the velocity step at 660 km depth can be made by comparing the energy in the time window that encloses the reflection and re-
fraction of the 410 km discontinuity with the energy in the time window that encloses the reflection and re-
fraction of the 660 km discontinuity (Figure 6, upper panel). Figure 6 The energy ratio changes in a cha- racteristic way between 1800 and 2500 km. Stars in the lower panel of Figure 6 are values measured from the stacked data section. Although they display a large scatter, they have consistently low values of approxi- mately 0.5 between 1800 and 2100 km, and consistently high values of approximately 1.0 beyond 2300 km. The continuous curves in the figure represent the energy ra- tios for synthetics of the IASP91 model, modified by the low-velocity zone at 200 km depth and with successively smaller velocity steps at the 660 km discontinuity. The best match to the observed amplitudes comes from a re- duction of the velocity step at the 660 km discontinuity of at least 50% with respect to IASP91.
The thickness of the 660 km transition zone is a mat- ter of considerable debate. Near-vertical incidence data
and converted phases of steeply emerging mantle waves are most sensitive to the thickness. Benz and Vida-
le [1993] studied short-period precursors to P'P' which suggest a sharp 660 discontinuity, with less than 5 km transition width; however, those precursors are not al- ways observed and may represent local features. From P

818 RYBERG ET AL.' MANTLE TRANSITION ZONE PROPERTIES
stack: xstack-e-6 ==================================================================================================== .......... ..:.:....::::::. ::::::::::::::::::::::::::::::::::::::::::::::::::::::::::::::::::: ::::::::::::::::.--•: :::..---:..::::..•.-.:.
,m •i•i::•i•.•..:i.....:•::•iii•i::!:;!:.`:i•i!•ii•::•i•i•i:.,:!i!!::•i•ii•:i•i:•.:.i•::•:.• i•!ii•i•::i •!•i•::•::•i!iii•':.:..:.ii•i'.4::•i•.'-'J;!•i!i•: i•ii!!i ::•i• ...... ' .:.'"'"'";!•--'.-'•.."..:':"'•:•'.•!!•i.•i•i•!i!!•.•; ................ !!•!!•!•::;•i•i!:::•'.•:ii:;ii '
½'""-.•:-'.....'-i.....'.. •.•.%-"..'•i½½½•.•:::.:.'!i!;{•i• !!::½:•½ i:•! .......... ...,L..::;:;!•i!::•ii::•!•(?.:•::i;• !:.! ..... ::::•½• ;•;;½--".-•'::::.. :•.•: '" ':':':.:•:i .... -'%L..,'""..;::!%½:..; • 90 ?....:.:...:•..::.i•p,.:::i$•::::::.::::s:::.. ... ============================================ -....:.:.::-...... .- ß :..::::.-.-..:.. ..... :,.:.:.:.. :..::::::::::::::'.:-.::::::::.,-::::::-::-.---.--- =============================== ;2: ::::::..::..::.-.::-.--: ............ ..•.-:.:.::
:-":::::: ...:!:•S':. :.::i:i-'.'::i i:•:i:i:!:!:i:•:.":i:i:i::i:'•:i:i::"i::.::.i
i ..::.:F-:
2000 2500 3000
Distance [km] IASPEI ' ias ei-e-v6
;'.:;?•i•i•½:;•!•"'";4A?,':!!?!::.:;';?::';':.,::•:•: ..... ::::.5::?E;:;::::::': .... : .................... :;½½ ..... ......: .......... ' .....................
,,o i:':;, •;;•,;,;,i:;!i:;;:;:;•:i "" '"'"'" .. .... : .... '... :":; ;:gi' ";..•i;i-"....' ......
•' •oo ill ; ii!i!!!111;iii•ii:•i:•11½:;:-•-.:•:,,:-'-'- ..:.,,::::•::•:;:½:'?•":*•"!!!.i!!!i!L:•::. ....................... ß .............. "'•'"'""":'"'•'-'-"-'•' '"•'--'"'-'• .E_ I.- 90
8O
70 t;:' ' IASP91
120
110
100
2000 2500
Distance [km] /ASPEl ß mxJ21-50-e-v6
GNEM'
2o'o0 doo 3o'o0 20•0 25'o0 3o'o0 Distance [kin] Distance [km]
IASPEI ' mx421-50p-e-v6 EKI, Ivz : mx+ek-e-v6 , ..
'" ,ool ........ ....... ..... ...... ...... ..... ................. .......... ..... ',:.:,i:"'-":•---:•-:-'"'"-:!::!:'"':!:!':.':?'•'"'• ".:!!!'"':'" ..:.:.i:i:i .......... .i.i.i::::::i:::""".:.:. ':-::::'::: ..... •:½i:½•.? :-"?'"'- ........ !:!:;:.:::.i ........ . ......... • ........... i-::::' ......
100 ' ......i.:½?i•; ..... =============================== ........... ' .... .:.::.::!::!::'::' ...... ii::::: .;:;:;.:::.---•-.i.,:?:!i 'y-•'" .................... i '• ...iii:i:;"":': ....:.v.'.•.•.:..'•!!i::':'::i'-.:: ' .... ....:.:.:i½i ...... . •:•:i:""..•i•i•ii:i:::':'.:.•:::-"-'" . ..... --.--.-'. ". ............ -•/.- -•:., .'....:•.•!ii!!!-."?.-•.::!.::!:!::-': ...............
7O .I •';":* .... , . :::;: ..... ' ........ . . 2000 25'00 3O'OO 2000 2500 3O'OO
Distance [km] Distance [km]
Figure 5. Results of stacking to enhance phases from the 660 km discontinuity (top left). The sketch (top right) gives an overview over the expected upper mantle phases according to the IASP91 model. Below, the observed data the calculations based on IASP91 are shown (middle left). Note the strong critical reflection from the 660 km discontinuity at around 2000 km distance for IASP91, which is absent in our observations. The record section bottom left shows the stacking result for our preferred model (Generalized Northern Eurasia Model (GNEM)). It is characterized by a reduced P wave velocity step across the 660 km discontinuity and is in good agreement with the observations. The stacking result for an alternative model with a 50 km wide transitional 660 km discontinuity (middle right, GNEM') is also in agreement with the observations, except for the large amplitudes of the P410 and P660P phases at distances larger than 2900 km. The stack at the bottom right was calculated for the model EK1 proposed by Estabrook and Kind [1996] and shows also the absence of the strong critical 660 km reflections.

RYBERG ET AL.: MANTLE TRANSITION ZONE PROPERTIES 819
, I , I ,, , I , I , I , I ,
•00- P660 P -
P4 P .............. ::::::::::::::::::::::::::::::::::::::::::::::::: "" •'"11•'iiii"iiiii!::i•!•:'•'•'::'"'":•:'
.• 85
80
1800 1900 2000 2100 2200 2300 2400 2500
Distance [km] , I , I • I , I • I , I ,
• .5 • • .5
0 •o % ß - •0,• • • • • • 1.0- - 1.0
E 0.s - - 0.s
' S0'% •o% 0.0 , ' , , , . ' , .", , , . , . ' 0.0 • 800 • g00 2000 2• 00 2200 2300 2400 2500
Distance [km]
Figure 6. Comparison of amplitude ratios of the critical reflection from the 660 km discontinuity with the phases of the 410 km discontinuity. The figure on top shows synthetic travel-time curves (b•d o. IASP91) •.d •h• •im• wi.dow• •.•lyz•d (•h•d•d ••). th• low• figu• •how• •h• amph•ude ra•ios (maximum va•ue in •he •ime windows shown above) of •he observations (s•ars) and the synthetically calculated phases (reflectivity method). The gelocity step across the 660 km discontinuity was decreased from 100% down to 10% in 10% steps. There is an obvious misfit of the amplitude ratios for the IASP91 model. The curves show clearly that a reduction of the velocity step across the 660 km discontinuity of at least 50% is necessary to explain the observed amplitude ratios.
to 3' converted phases in data with a frequency content between 2 and 20 s, P'etersen et al., [19933 postulat?d a 20 to 30 km wide transition. As the converted phase is broadened when compared to the direct P phase, they concluded that the transition could not be as sharp as predicted by the results of Benz and Vidalel [1993].
The recently derived globally averaged properties of P reflections and conversions from the 660 km discon-
tinuity [Estabrook and Kind, .1996] indicate that as a global average, this transition is sharp to long-period waves. Other seismological literature agrees that the width of the transition zone is less than 50 km. In some
data sets, there is evidence of a locally sharp (<5 km) transition [Paulssen, 1988; Benz and Vidale, 1993]. On the other hand, long-period data of 20 s period can- not distinguish between a 5 km and a 20 km transition, and thus remain inconclusive with respect to the width
ot• the transition. However, they are conclusive as far as the velocity step width (or the impedance contrast) is concerned because this parameter controls the con- version from P to 5' waves. Estabrook and Kind [1996] convincingly demonstrate that the magnitude of the P velocity step in the global average is much smaller than predicted by IASP91. Our wide-angle data do not per- mit us to distinguish between a sharp step of small mag- nitude and a gradual transition at 660 km depth. Howe- ver, Estabrook and Kind [1996] do establish an intrinsic link between. this parameter and the size of the velocity step across the discontinuity. Thus, taking Estabrook and Kind's findings, we have to conclude that the step width is rather sharp, as indicated in the generalized model. We prefer the model with a reduced velocity step of 0.3 km/s. The petrological/mineralogical evi- dence requires a sharp transition for spinel to perovski-
820 RYBERG ET AL.' MANTLE TRANSITION ZONE PROPERTIES
Table 1. Velocity Model GNEM
Depth, km Vp, km/s
0 5.84
41 5.84
41 8.15
210 8.508
210 8.4
275 8.4
410 9.O3
410 9.36
510 9.696
660 10.348
660 10.648
760 11.056
900 11.429
te and a smoother transition for garnet to perovskite. Estimates range from a few kilometers for a transition from spinel into perovskite and magnesiowiistite [Kus- kov and Panleroy, 1991] to 70 km for a phase transition in majorire [Ita and Stixrude, 1992].
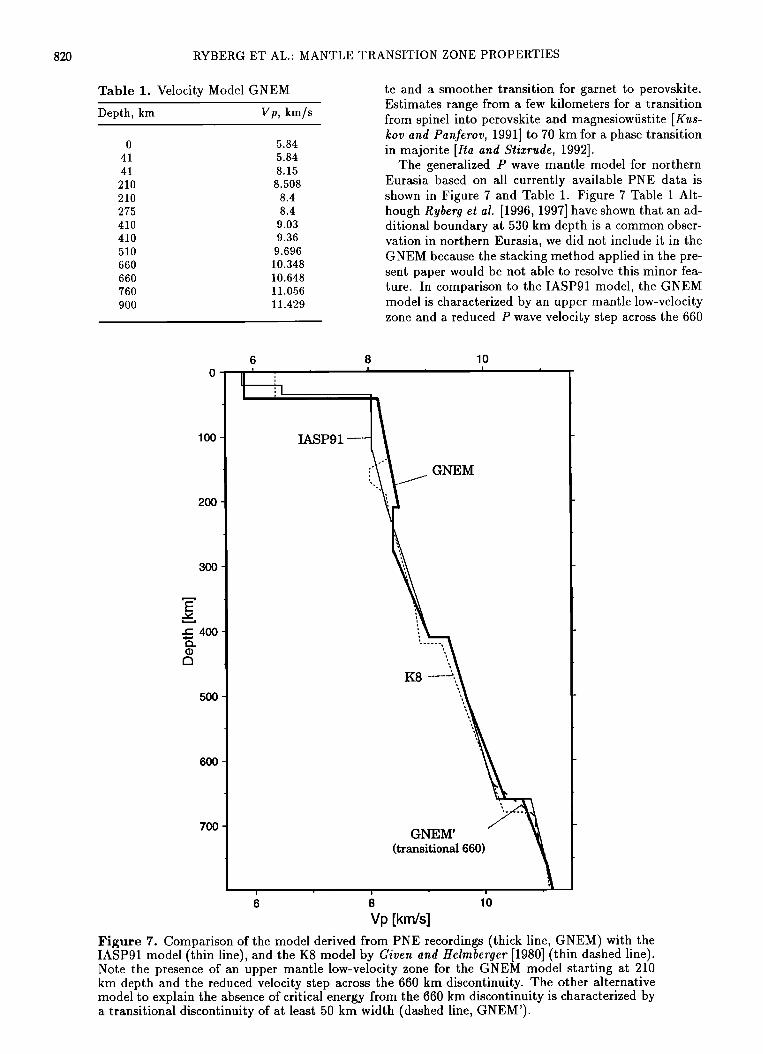
The generalized P wave mantle model for northern Eurasia based on all currently available PNE data is shown in Figure 7 and Table 1. Figure 7 Table i Alt- hough Ryberg et al. [1996, 1997] have shown that an ad- ditional boundary at 530 km depth is a common obser- vation in northern Eurasia, we did not include it in the GNEM because the stacking method applied in the pre- sent paper would be not able to resolve this minor fea- ture. In comparison to the IASP91 model, the GNEM model is characterized by an upper mantle low-velocity zone and a reduced P wave velocity step across the 660
lOO
200
300
400
500
600
700
6 8 10 I ,, • I • I
I I
' iASP91 ............. GNEM
, i
KS ......... "'"",
GNEM' (transitional 660)
,
i ' i ' i
6 8 10
Vp [km/s] Figure 7. Comparison of the model derived from PNE recordings (thick line, GNEM) with the IASP91 model (thin line), and the K8 model by Given and Helmberger [1980] (thin dashed line). Note the presence of an upper mantle low-velocity zone for the GNEM model starting at 210 km depth and the reduced velocity step across the 660 km discontinuity. The other alternative model to explain the absence of critical energy from the 660 km discontinuity is characterized by a transitional discontinuity of at least 50 km width (dashed line, GNEM').
RYBERG ET AL.: MANTLE TRANSITION ZONE PROPERTIES 821
km discontinuity. The model K8 by Given and Helmber- 9er [1980], derived from long- and short-period World- Wide Standardized Seismograph Network (WWSSN) seismograms for Soviet nuclear explosions and mostly relevant for the East European Platform, also has an upper mantle low-velocity zone and a 660 km disconti- nuity which consists of combination a reduced P wave velocity step and a transitional boundary (65 km).
In comparing the P wave velocities derived in this stu- dy with those calculated by Duffy and Anderson [1989], the upper mantle beneath Eurasia must contain a signi- ticant component of material with a velocity in excess of that of olivine. The olivine velocity ranges from 8.0 to 8.8 km/s in the depth range of 200 to 410 km, whe- reas the model requires values of 8.3 to 9.0 km/s. The transition zone itself is characterized by the two P wave velocity steps discussed in this paper and the step at 530 km depth. They are 0.4 km/s (410 km), 0.25 km/s (530 km, not included in the GNEM model), and 0.30 km/s (660 km), respectively. The step size at 660 km depth is essentially consistent with a phase transforma- tion from 7 spinel to perovskite and magnesiowiistite, provided the mantle has a predominantly olivine com- position. The step at 530 km depth has the size expec- ted from the /3 to 7 spinel transition in a pure olivine transition zone [Katsura and Ito, 1989].
Conclusions
Data from several PNE profiles reveal reflections and refractions from the upper mantle discontinuities at 410 km and 660 km depth. The absence of strong precriti- cal reflections for the 660 km discontinuity is characte- ristic for all the data in northern Eurasia, whereas the reflections from the 410 km discontinuity appear to be consistent with the phases predicted by the standard re- ference model IASP91. Consequently, we suggest a ge- neralized upper mantle P wave velocity model (GNEM) with a well-pronounced low-velocity zone in the depth range from 210 to 275 km, and either a reduced velocity step at the 660 km or a transitional 660 km discontinu- ity of approximately 50 km thickness (GNEM'). Given the findings from other short-period studies [Benz and Vidale, 1993] and long-period work with a global data- base, a sharp discontinuity is more likely. Our results for northern Eurasia are therefore fully consistent with the model proposed by Estabrook and Kind [1996] as far as the discontinuities at 410 and 660 km depth are concerned. As a regional feature, we have to include the low-velocity zone above the transition zone.
Acknowledgments. We appreciate critical remarks on this manuscript from J. Mechie and G. S. Fuis. The digi- tal data for the PNE profiles were kindly made available by the GEON/Russian Geological Committee within the EU- ROPROBE cooperation agreement. The Ministry of Re- search and Technology of Germany (BMBF) supported the digitization of the PNE data at GEON. The research has been partly funded by the Deutsche Forschungsgemeinschaft (grant WE 1394/2-1), the GeoForschungsZentrum Potsdam, and the MBMF (grant RG 9216).
References
Benz, H. M., and J. E. Vidale, The sharpness of upper mant- le discontinuities determined from high-frequency reflec- tions, Nature, 365, 147-150, 1993.
Bina, C. R., Mutually consistent estimates of upper mant- le composition from seismic velocity contrasts at 400 km depth, Pure Appl. G½ophys., 1•1, 101-109, 1993.
Creager, K. C., and T. H. Jordan, Slab penetration into the lower mantle, J. G½ophys. Res., 89, 3031-3049, 1984.
Creager, K. C., and T. H. Jordan, Slab penetration into the lower mantle beneath the Mariana and other island arcs
of the northwest Pacific, J. G½ophys. Res., 91, 3573-3589, 1986.
Duffy, T. S., and D. L. Anderson, Seismic velocities in mant- le minerals and the mineralogy of the upper mantle, J. Geophys. Res., 9d, 1895-1912, 1989.
Duffy, T. S., C. S. Zah, R. T. Downs, H. K. Mao, and R. J. Hemley, Elasticity of forsterite to 16 GPa and the compo- sition of the upper mantle, Nature, 378, 170-173, 1995.
Estabrook, C., H., and R. Kind, The nature of the 660 kilo- meter upper-mantle seismic discontinuity from precursors to the PP phase, Science, œ7d, 1179-1182, 1996.
Fuchs, K., and G. M/iller, Computation of synthetic seismo- grams with the reflectivity method and comparison with observations, Geophys. J. R. A stroh. Soc., 23, 417-433, 1971.
Fukao, Y., M. Obayashi, H. Inoue, and M. Nenbai, Sub- ducting slabs stagnant in the mantle transition zone, J. Geophys. Res., 97, 4809-4822, 1992.
Given, J. W., and D. V. Helmberger, Upper mantle structure of northwestern Eurasia, J. Geophys. Res., 85, 7183-7194, 1980.
Irifune, T., An experimental investigation of the pyroxene- garnet transformation in a pyrolite composition and its bearing on the constitution of the mantle, Phys. Earth Planet. Inter., d5, 324-336, 1987.
Ita, J., and L. Stixrude, Petrology, elasticity, and composi- tion of the mantle transition zone, J. Geophys. Res., 97, 6849-6866, 1992.
Ito, E., and E. Takahashi, Postspinel transformations in the system Mg2SiO4-Fe2SiO4 and some geophysical implica- tions, J. Geophys. Res., 9d, 10,637-10,646, 1989.
Katsura, T., and E. Ito, The system Mg2SiO4-Fe2SiO4 at high pressures and temperatures: Precise determination of stabilities of olivine, modified spinel, and spinel, J. Geo- phys. Res., 9d, 15,663-15,670, 1989.
Kennett, B. L. N., and E. R. Engdahl, Traveltimes for global earthquake location and phase identification, Geophys. J. Int., !05, 429-465, 1991.
Kuskov, O. L., and A. B. Panferov, Constitution of the mantle, 3, Density, elastic properties and the mineralogy of the 400 km discontinuity, Phys. Earth Planet. Inter., 69, 85-100, 1991.
Mechie, J., A. V. Egorkin, K. Fuchs, T. Ryberg, L. Solodi- lov, and F. Wenzel, P-wave mantle velocity structure be- neath northern Eurasia from long-range recordings along the profile Quartz, Phys. Earth Planet. Inter., 79, 269- 286, 1993.
Paulssen, H., Evidence for a sharp 670-km discontinuity as inferred from P-to-S converted waves, J. Geophys. Res., 93, 10,489-10,500, 1988.
Petersen, N., L. Vinnik, G. Kossarev, R. Kind, S. Oreshin, and K. Stammler, Sharpness of the mantle discontinuities, Geophys. Res. Lett., 20, 859-862, 1993.
Revenaugh, J., and T. H. Jordan, Mantle layering from ScS reverberations, 2, The transition zone, J. Geophys. Res., 96, 19,763-19,780, 199!.
Ryberg, T., F. Wenzel, J. Mechie, A. V. Egorkin, K. Fuchs, and L. Solodilov, 2D-Velocity structure beneath northern
822 RYBERG ET AL.: MANTLE TRANSITION ZONE PROPERTIES
Eurasia derived from the super long-range seismic profile Quartz, Bull. Seismol. Soc. Am., 86, 857-867, 1996.
Ryberg, T., F. Wenzel, A. V. Egorkin, and L. Solodilov, Short-period observation of the 520 km discontinuity in northern Eurasia, J. Geophys. Res., 102, 5413-5422, 1997.
Shearer, P.M., Constraints on upper mantle discontinuities from observations of long-period reflected and converted phases, J. Geophys. Res., 96, 18,147-18,182, 1991.
Shearer, P.M., Transition zone velocity gradients and the 520-km discontinuity, J. Geophys. Res., 101, 3053-3066, 1996.
Shearer, P.M., and T. G. Masters, Global mapping of topo- graphy on the 660-km discontinuity• Nature, 355, 791-796, 1992.
van der Hilst, R. D., E. R. Engdahl, W. Spakman, and G. Nolet, Tomographic imaging of subducted lithosphere
below northwest Pacific island arcs, Nature, 353, 37-43, 1991.
Widiyantoro, S., and R. van der Hilst, Structure and evoluti- on of lithospheric slab beneath the Sunda Arc, Indonesia, Science, 271, 1566-1570, 1996.
A. V. Egorkin and L. Solodilov, Centre of Regional Geo- physical and Geoecological Research- GEON, 119034 Mos- cow, Chisty 4, Russia. (e-mail: [email protected])
T. Ryberg, GeoForschungsZentrum, Telegrafenberg, 14473 Potsdam, Germany. (e-mail: [email protected])
F. Wenzel, Geophysical Institute University Karlsru- he, Hertz Str. 16, 76187 Karlsruhe, Germany. (e-mail: [email protected])
(Received May 22, 1997; revised September 9, 1997; accepted October 2, 1997.)