Properties of galaxy clusters: mass and correlation functions
20
arXiv:astro-ph/9810189v1 13 Oct 1998 Mon. Not. R. Astron. Soc. 000, 1–20 (1998) Printed 1 February 2008 (MN L A T E X style file v1.4) Properties of Galaxy Clusters: Mass and Correlation Functions F. Governato 1 , A. Babul 2,3 , T. Quinn 3 , P. Tozzi 4,5 , C.M. Baugh 1 , N. Katz 6 , G. Lake 3 1 Physics Department, Science Labs, South Road, Durham, DH1 3LE, UK, [email protected] 2 Dept. of Physics & Astronomy, Elliot Building, Univ. of Victoria, Victoria, BC, Canada, V8P 1A1 3 Astronomy Department, University of Washington, Seattle WA, USA 4 Space Telescope Science Institute, 3700 San Martin Drive, Baltimore, MD 21218, USA 5 II Universit´a di Roma, Tor Vergata, Roma, Italia 6 Dept. of Physics & Astronomy, 517 Lederle Graduate Research Tower, Univ. of Massachusetts, Amherst, MA 01003-4525, USA submitted to MNRAS ABSTRACT We analyse parallel N-body simulations of three Cold Dark Matter (CDM) universes to study the abundance and clustering of galaxy clusters. The simulation boxes are 500h -1 Mpc on a side and cover a volume comparable to that of the forthcoming Sloan Digital Sky Survey. The use of a treecode algorithm and 47 million particles allows us at the same time to achieve high mass and force resolution. We are thus able to make robust measurements of cluster properties with good number statistics up to a redshift larger than unity. We extract halos using two independent, public domain group find- ers designed to identify virialised objects – ‘Friends-of-Friends’ (Davis et al. 1985) and ‘HOP’ (Eisenstein & Hut 1998) – and find consistent results. The correlation function of clusters as a function of mass in the simulations is in very good agreement with a simple analytic prescription based upon a Lagrangian biasing scheme developed by Mo & White (1996) and the Press-Schechter (PS) formalism for the mass function. The correlation length of clusters as a function of their number density, the R 0 –D c relation, is in good agreement with the APM Cluster Survey in our open CDM model. The critical density CDM model (SCDM) shows much smaller correlation lengths than are observed. We also find that the correlation length does not grow as rapidly with cluster separation in any of the simulations as suggested by the analysis of very rich Abell clusters. Our SCDM simulation shows a robust deviation in the shape and evo- lution of the mass function when compared with that predicted by the PS formalism. Critical models with a low σ 8 normalization or small shape parameter Γ have an excess of massive clusters compared with the PS prediction. When cluster normalized, the SCDM universe at z = 1 contains 10 times more clusters with temperatures greater than 7keV, compared with the Press & Schechter prediction. The agreement between the analytic and N-body mass functions can be improved, for clusters hotter than 3 keV in the critical density SCDM model, if the value of δ c (the extrapolated linear theory threshold for collapse) is revised to be δ c (z )=1.685 [(0.7/σ 8 )(1 + z )] -0.125 (σ 8 is the rms density fluctuation in spheres of radius 8h -1 Mpc). Our best estimate for the amplitude of fluctuations inferred from the local cluster abundance for the SCDM model is σ 8 =0.5 ± 0.04. However, the discrepancy between the temperature func- tion predicted in a critical density universe and that observed at z =0.33 (Henry et al. 1998) is reduced by a modest amount using the modified Press-Schechter scheme. The discrepancy is still large enough to rule out Ω 0 = 1, unless there are significant differences in the relation between mass and temperature for clusters at high and low redshift. Key words: cosmology– clusters– general– large scale structure of the universe. c 1998 RAS
-
Upload
independent -
Category
Documents
-
view
0 -
download
0
Transcript of Properties of galaxy clusters: mass and correlation functions

arX
iv:a
stro
-ph/
9810
189v
1 1
3 O
ct 1
998
Mon. Not. R. Astron. Soc. 000, 1–20 (1998) Printed 1 February 2008 (MN LATEX style file v1.4)
Properties of Galaxy Clusters: Mass and Correlation
Functions
F. Governato1, A. Babul2,3, T. Quinn3, P. Tozzi4,5,
C.M. Baugh1, N. Katz6, G. Lake3
1Physics Department, Science Labs, South Road, Durham, DH1 3LE, UK, [email protected] Dept. of Physics & Astronomy, Elliot Building, Univ. of Victoria, Victoria, BC, Canada, V8P 1A13 Astronomy Department, University of Washington, Seattle WA, USA4 Space Telescope Science Institute, 3700 San Martin Drive, Baltimore, MD 21218, USA5 II Universita di Roma, Tor Vergata, Roma, Italia6 Dept. of Physics & Astronomy, 517 Lederle Graduate Research Tower, Univ. of Massachusetts, Amherst, MA 01003-4525, USA
submitted to MNRAS
ABSTRACT
We analyse parallel N-body simulations of three Cold Dark Matter (CDM) universesto study the abundance and clustering of galaxy clusters. The simulation boxes are500h−1Mpc on a side and cover a volume comparable to that of the forthcoming SloanDigital Sky Survey. The use of a treecode algorithm and 47 million particles allows usat the same time to achieve high mass and force resolution. We are thus able to makerobust measurements of cluster properties with good number statistics up to a redshiftlarger than unity. We extract halos using two independent, public domain group find-ers designed to identify virialised objects – ‘Friends-of-Friends’ (Davis et al. 1985) and‘HOP’ (Eisenstein & Hut 1998) – and find consistent results. The correlation functionof clusters as a function of mass in the simulations is in very good agreement witha simple analytic prescription based upon a Lagrangian biasing scheme developed byMo & White (1996) and the Press-Schechter (PS) formalism for the mass function.The correlation length of clusters as a function of their number density, the R0–Dc
relation, is in good agreement with the APM Cluster Survey in our open CDM model.The critical density CDM model (SCDM) shows much smaller correlation lengths thanare observed. We also find that the correlation length does not grow as rapidly withcluster separation in any of the simulations as suggested by the analysis of very richAbell clusters. Our SCDM simulation shows a robust deviation in the shape and evo-lution of the mass function when compared with that predicted by the PS formalism.Critical models with a low σ8 normalization or small shape parameter Γ have an excessof massive clusters compared with the PS prediction. When cluster normalized, theSCDM universe at z = 1 contains 10 times more clusters with temperatures greaterthan 7keV, compared with the Press & Schechter prediction. The agreement betweenthe analytic and N-body mass functions can be improved, for clusters hotter than 3keV in the critical density SCDM model, if the value of δc (the extrapolated linear
theory threshold for collapse) is revised to be δc(z) = 1.685 [(0.7/σ8)(1 + z)]−0.125
(σ8
is the rms density fluctuation in spheres of radius 8h−1Mpc). Our best estimate forthe amplitude of fluctuations inferred from the local cluster abundance for the SCDMmodel is σ8 = 0.5 ± 0.04. However, the discrepancy between the temperature func-tion predicted in a critical density universe and that observed at z = 0.33 (Henry et
al. 1998) is reduced by a modest amount using the modified Press-Schechter scheme.The discrepancy is still large enough to rule out Ω0 = 1, unless there are significantdifferences in the relation between mass and temperature for clusters at high and lowredshift.
Key words: cosmology– clusters– general– large scale structure of the universe.
c© 1998 RAS

2 F.Governato et al.
1 INTRODUCTION
Clusters of galaxies, by virtue of being both relatively rareobjects and the largest gravitationally bound systems in theUniverse, provide stringent constraints on theories of struc-ture formation. The two cluster properties that are mostcommonly discussed in this context are the abundance andthe spatial clustering. The model predictions depend sen-sitively on the cosmology and on the value of σ8, the rmsdensity fluctuations on the scale of 8 h−1 Mpc. (Here andthroughout this paper, h is the present-day Hubble constantin units of 100 km/s/Mpc.) Comparisons between observa-tions and model predictions have been used to place con-straints on cosmological parameters (Strauss et al 1995, Eke,Cole & Frenk 1996, Viana & Liddle 1996; Mo, Jing & White1996, Borgani et al 1997, De Theije, Van Kampen & Sli-jkhuis 1998, Postman 1998 ).
It has long been known that clusters of galaxies aremuch more strongly clustered than galaxies (see, for exam-ple, Hauser & Peebles 1973 and review by Bahcall 1988). Thetwo-point correlation function for the clusters is roughly apower law: ξcc(r) = (r/R0)
−1.8. Bahcall & West (1992) ar-gue that the correlation length, R0, obeys the scaling rela-tion
R0 ≈ 0.4Dc, 20h−1 Mpc < Dc < 100h−1 Mpc, (1)
where Dc ≡ n−1/3c is the mean intercluster separation and
nc, is the mean space density of clusters. The combined setof results based on the analysis of the spatial clustering ofan X-ray flux-limited sample of clusters (Lahav et al. 1989;Romer et al. 1994, Abadi, Lambas & Muriel 1998), of clus-ters containing cD galaxies (West & Van den Bergh 1991),of richness class R ≥ 0, R ≥ 1, R ≥ 2 Abell clusters (Pea-cock & West 1992; Postman, Huchra & Geller 1992), andof the cluster samples extracted from the APM Galaxy Sur-vey (Dalton et al. 1992) and Edinburgh-Durham SouthernGalaxy Catalogue (Nichol et al. 1992) all give results thatare roughly consistent with the above scaling relation.
However, on scales greater than Dc ≈ 40h−1 Mpc, theevidence in favour of the scaling relation hinges just onthe analyses of the R ≥ 1 and R ≥ 2 Abell cluster sam-ples, which give R0 ≈ 21h−1 Mpc for Dc ≈ 55h−1 Mpc andR0 ≈ 45h−1 Mpc for Dc ≈ 94h−1 Mpc, respectively. Severalauthors (e.g. Sutherland 1988; Dekel et al. 1989; Sutherland& Efstathiou 1991) have suggested that these correlationlengths have been biased upward by the inhomogeneitiesand projection effects in the Abell catalogue. However, thissuggestion has been rejected by, for example, Jing, Plionis& Valdarnini (1992) and Peacock & West (1992). More re-cently, Croft et al. (1997) have analyzed the correlationproperties of a sample of “rich” APM clusters and find thatthe cluster correlation length saturates at R0 ≈ 15h−1 Mpc(R0 ≈ 20h−1 Mpc if the analysis is done in redshift-space —see Croft et al. 1997) for Dc > 40h−1 Mpc. The controversyregarding the correlation length of rich clusters: i.e. if theR0 vs Dc flattens at large scales is as of yet still unresolved.
In an effort to resolve this issue, several authors(e.g. Bahcall & Cen 1992; Watanabe et al. 1994; Croft &Efstathiou 1994, 1997; Walter & Klypin 1996, Eke et al.1996) have turned to large numerical simulations. Bahcall& Cen (1992) investigated the cluster correlation propertiesin large N-body simulations of the standard CDM model
(SCDM) and two low-Ω0 models ( Ω0 is the density pa-rameter), one spatially flat and one open. They claim tofind a linear relation between R0 and Dc over the range30h−1 Mpc < Dc < 95h−1 Mpc in all the models but thatonly in the low-density models is the R0-Dc relation steepenough to be consistent with the suggested scaling relation(1). More recent works (Croft & Efstathiou 1994, Watan-abe et al. 1994) have confirmed that the SCDM model isincompatible with the observed degree of clustering on allscales and for all normalizations. However, no general agree-ment was reached on the clustering strength at large scalesfor the other models investigated.
In summary, apart from the general agreement that theSCDM model fails to account for the observed cluster cor-relations, results obtained from the numerical studies, dueto lack of consistency, have been singularly unhelpful in re-solving the cluster correlation controversy.
If cluster correlations are going to be used to constrainmodels of structure formation and place limits on the valuesof the fundamental cosmological parameters, it is importantto understand why these numerical studies give such dis-crepant results. This is a necessary step before a meaningfulcomparison between theoretical (numerical) predictions andobservations is possible. There are several factors that canaffect numerical results and cause the discrepancy describedabove. Among these are differences in the mass and forceresolution of the simulations as well as the overall volume ofthe simulations. Rich clusters tend to be rare objects and,therefore, simulation studies of the properties of such ob-jects must necessarily span large cosmological volumes. Of-ten, computational limitations require that such simulationstudies compromise on the resolution (mass and/or force).However, this can have serious effects on the results. Watan-abe et al. (1994), have shown that degrading the mass reso-lution tends to bias the correlation lengths downward. Con-sequently, there is a definite need for analysis of a sampleof simulated clusters extracted from a simulation with highmass and force resolution, large number of time steps, andcovering a sufficiently large cosmological volume.
In addition to differences in resolution and size, thereis the issue of how to identify clusters in the simulations.Bahcall & Cen (1992), Watanabe et al. (1994) and Croft etal. (1994; 1997) used different algorithms to identify clus-ters in their simulations. Using a Ω = 1 SCDM model Ekeet al. (1996b) explored the possibility that different algo-rithms could indeed give different results. They identifiedand ranked the clusters in their simulations in various dif-ferent ways, and found that each algorithm/selection criteriaimprints its own particular set of biases on the cluster sam-ple; for a fixed value of Dc, the clustering length can varyup to a factor of ∼ 1.5.
In this paper, we report on our analysis of cluster cor-relations in simulations of both critical density (Ω = 1) andopen (Ω0 = 0.3 and Ω0 = 0.4) CDM cosmogonies and useour results to explore the questions raised above. As de-scribed in the next section, both the force and mass reso-lution of our simulations are better than those of previousstudies. Moreover, our simulated volumes are comparablewith the Sloan Digital Sky Survey (Loveday 1998) and arelarger than the 2dF survey (Colless & Boyle 1998).
We investigate the present-day abundances and tem-poral evolution of the abundances in the three CDM mod-
c© 1998 RAS, MNRAS 000, 1–20

Properties of Galaxy Clusters: Mass and Correlation Functions 3
els. Specifically, we are interested in testing the validity ofthe widely-used analytic Press-Schechter expression for thecluster mass function. The combination of the present-dayabundance of clusters and the rate at which the abundanceevolves as a function of time place strong constraints on Ω0
and σ8. (White, Efstathiou & Frenk 1993; Viana & Liddle1996; Eke, Cole & Frenk 1996). Since real clusters of galaxiesare the product of non-linear gravitational and gas dynami-cal processes, the most direct way of constraining the rangeof Ω0 and σ8 is to carry out large-scale numerical simula-tions of different models that have the necessary dynami-cal range and include (poorly known) gas–stellar physics,then “observe” the resulting model universe and comparethe simulated observations with the real ones. Computa-tionally, this route is prohibitively expensive at present. Amore economical approach involves using the analytic Press-Schechter (PS) formalism (Press & Schechter 1974; Bond etal. 1991) to compute the cluster mass function, map themass function into an abundance distribution as a functionof the observable parameter, and then compare the latter toobservations in order to determine the appropriate values ofΩ0 and σ8. Setting aside the uncertainties in the correspon-dence between mass and an observable quantity, the validityof the analytic approach rests entirely on the assumptionthat the PS formalism yields an accurate description of thecluster mass function. The analytic expression for the clustermass function has been extensively tested against numericalsimulations in the past (see, for example, Carlberg & Couch-man 1989; Lacey & Cole 1994; Klypin et al. 1994, Cole,Weinberg, Frenk & Ratra 1997, Cen 1998) and most studieshave found a good agreement between the analytical andthe numerical results. However, there have also been someinteresting claims to the contrary. Gross et al. (1998), forexample, have drawn attention to a discrepancy between thePS predictions and numerical results at small masses, andBertschinger & Jain (1994) claim that the PS mass functionsystematically underestimates the number density of highmass halos. Estimates of parameters such as Ω0 and σ8 areusually derived from fitting the analytic cluster mass func-tion to the observed distribution. If the PS mass function isindeed failing at the high mass end and this failure is nottaken in account, it can affect the determinations of Ω0 andσ8
In this paper our aim is to determine the halo massfunction on group and cluster scales in our set of simula-tions, and use these to assess the reliability of the analyticPS mass function. Each of our volumes contains several hun-dred ‘Coma–like’ clusters at the present time. This, in con-junction with our high mass and force resolution, allows usto map out the cluster mass function to high precision outto z ∼ 1, i.e. over a larger redshift range than previouslypossible.
The lay-out of the paper is as follows: In §2, we discussour numerical simulations and the procedure for construct-ing cluster catalogs. We use these catalogs to extract thecluster mass function and to study their spatial correlationproperties. In §3, we present the results of our correlationanalyses and in §4, we discuss the cluster mass function. Inboth sections we compare our numerical results to analyt-ical approximations. Adopting a simple mapping betweenmass and X–ray temperature, we transform our numericalmass function into a temperature function and highlight the
main differences between this temperature function and theone based on the standard Press-Schechter mass function.Finally, we summarize our results and briefly discuss theirrelevance for future cosmological tests in §5.
2 NUMERICAL SIMULATIONS AND
CLUSTER SELECTION
We have simulated structure formation within a periodiccube of comoving length L = 500h−1 Mpc for two “fidu-cial” cosmological models: A critical density cold dark mat-ter models (Ω0 = 1, h = 0.5 with σ8 = 1.0 at z = 0 ( here-after we refer to the σ8 = 0.7 output as SCDM07 and tothe σ8 = 1 as SCDM10, respectively. Of course each outputof the SCDM run can be rescaled to a different z changingthe present day σ8 normalization) and an open (Ω0 = 0.3,h = 0.75, σ8 = 1.0 at z = 0 — hereafter referred to asO3CDM) cold dark matter model. The z = 0.58 outputof O3CDM simulation can, with appropriate rescaling, beidentified as an Ω0 = 0.4, h = 0.65, σ8 = 0.79 CDM simula-tion (hereafter referred to as O4CDM) of comoving lengthL = 433.3 h−1 Mpc. The same set of simulations was usedby Szapudi et al. (1998) to study the higher order corre-lation properties of galaxies. The initial conditions were setusing the Bardeen et al (1986) transfer function for CDM.The simulations were computed using PKDGRAV, a par-allel treecode that allows for periodic boundary conditionsand individual time steps (Stadel & Quinn, in preparation).These are among best studied cosmological models (Daviset al. 1985, Jenkins et al. 1997), our choices for the normal-ization (σ8) of the open models correspond roughly to thoseinferred from the present-day cluster abundance (see, e.g.,Eke et al. 1996 and references therein), while we analyzedthe SCDM simulation data on a σ8 range that goes from σ8
= 1 (roughly COBE normalized) to σ8 = 0.35 (correspond-ing to z = 1.85 for a σ8 = 1 at z = 0 model, and to z = 0.43for a cluster normalized SCDM universe with σ8 = 0.5 at z= 0) . A cubic spline force softening of 50h−1 kpc (43h−1
kpc for O4CDM) was used so that the overall structure ofclusters could be resolved. Accurate forces were maintainedby using a cell opening angle of θ < 0.8 (or better at highz) and expanding the potentials of cells to hexadecapole or-
der. Timesteps were constrained to ∆t < 0.3√
ǫ/a, whereǫ is the softening length and a is the magnitude of the ac-celeration of a given particle. See Quinn et al. (1997) for adiscussion and tests of this timestep criterion. In each run47 million particles were used, arranged on a 3603 grid. Eachrun took several hundred hours on 256 nodes of a Cray T3Esupercomputer, and about a thousand timesteps. The parti-cle mass is 7.4×10¹¹ηΩ0h
−1 M⊙, where η = 1 for SCDM andO3CDM models and η = 0.65 for O4CDM. Simulations werestarted at z = 49. The extremely large volumes simulated,coupled with a reasonable mass resolution and the very goodforce resolution made possible by the use of a treecode, allowus to study in detail the evolution of structures ranging insize from groups of galaxies, made up of several tens of par-ticles each, to very rich clusters that contain a few thousandparticles. In our analyses, we only consider halos consist-ing of 64 particles or more. This is a stricter constraint thanused in most previous work, and was imposed to ensure thatour results were not influenced by small-number effects. Fi-
c© 1998 RAS, MNRAS 000, 1–20

4 F.Governato et al.
nally, we verified that in these simulations both the initialand present–day power spectrum were in close agreementwith theoretical expectations ( see Peacock & Dodds 1996).
2.1 Cluster Identification and Selection
Theoretical treatments generally define virialized halos ata given epoch as structures with a mean density averagedover a sphere of ∼ 200 times the critical density at thatepoch (see, for example, Lacey & Cole 1994 and referencestherein). The mass contained in the sphere is taken to bethe mass of the halo and the radius of the sphere is usuallyidentified as the virial radius of the halo.
In numerical simulations, halos are identified using avariety of schemes. Of these, we have chosen to use two thatare available in the public domain: FOF⋆ (Davis et al. 1985),
and HOP† (Eisenstein & Hut 1998). These schemes are dis-cussed in the next subsection. Other halo finders that are of-ten used in literature to find virialized halos are DENMAX(Gelb & Bertschinger 1994), the “spherical overdensity al-gorithm ” or SO, that finds spherically averaged halos abovea given overdensity (Lacey & Cole 1994) and the scheme re-cently developed by Gross et al (1998). The algorithms thatwe opted to use are those in the public domain and hence,in common use. We felt that it was important to ascertainthe extent to which these schemes may bias our results.
2.2 Friend of Friends: FOF
The FOF algorithm (Davis et al. 1985) is one of the mostwidely used. It is based on a nearest neighbor search. Themain advantages of this algorithm are its simplicity and thelack of assumptions about the shape of halos. In this scheme,all particle pairs separated by less than b times the mean in-terparticle separation are linked together. Sets of mutuallylinked particles form groups that are then identified as darkmatter halos. In the present study, we adopted the linkinglength that Lacey & Cole (1994) arrived at to identify viri-alized halos with mean densities of ≃ 200 times the criticaldensity at the epoch under consideration. The linking lengthis 0.2Ω(z)−1/3 times the mean comoving interparticle sep-aration. Moreover in the low Ω models, the scaling of thelinking length as a function of redshift was further modi-fied as the mean halo density associated with virializationis a function of redshift (see for example, Kitayama & Suto1996). The resulting halos also have a mass–radius relationthat agrees reasonably well with the theoretical relation forvirialized halos (see Lacey & Cole 1994; also, Eke, Cole,Frenk & Navarro 1996). The objects identified by the FOFalgorithm are the kinds of objects that the PS formalismrefers to (apart from the lack of spherical symmetry) andtherefore, we should be able to make a meaningful compari-son between the distribution of halos in the simulations andthe PS distribution. Several authors have reported the ten-dency of FOF to link together close binary systems of similarmass especially if the two happen to be loosely connectedby a bridge of particles. This pathology can, in specific cases
⋆ http://www-hpcc.astro.washington.edu/tools/FOF/† http://www.sns.ias.edu/eisenste/hop/hop.html
(see for example Governato et al. 1997), give rise to biasedresults. We have verified that our results are largely unaf-fected by this problem.
We note that in their study, Lacey & Cole (1994) com-pared the properties of the halo population defined by FOFand with those of a sample generated using the SO algo-rithm. They found that at least over the mass range thatthey could probe using their simulations, the two algorithmsgave very similar results.
2.3 HOP
HOP is a recently introduced algorithm (Eisenstein & Hut1998) based on an hybrid approach. The local density field isfirst obtained by smoothing the density field with an SPH–like kernel using the n nearest neighbours (we used 16). Theparticles above a given threshold are linked with their high-est density neighbors until, after several “hops”, they areconnected to the one particle with the highest density withinthe region above the threshold. All particles linked to the lo-cal density maximum are identified as a group. Like FOF,HOP is well suited to identifing virialized structures once thedensity threshold is specified to be the local density at thevirial radius. Eisenstein & Hut (1998) claim good agreementwith the FOF method at masses above the smoothing scale.However, HOP can be tuned to separate binary halos—binary systems loosely connected by one–dimensional parti-cle bridges—thereby avoiding the (rare) FOF pathology.
2.4 FOF vs. HOP
In Figure 1 we show the mass functions obtained by apply-ing the two halo finders described to the O3CDM run. Theresults for SCDM runs are qualitatively similar. The FOFand HOP mass functions agree quite well over the entiremass range probed, with most massive HOP clusters show-ing a systematic offset of about 7% toward larger masses.This offset can be easily adjusted changing b or the densitythreshold for HOP. However, as discussed in the above para-graph the parameters used are the most physically meaning-ful and the small offset is a measure of the kind of biasesthat you get using different halo finders.
We have found this general agreement to hold for dif-ferent models and at all redshifts. This result, coupled withresults of Eke et al.’s (1996) comparison of the FOF andSO algorithms, strongly indicates that regardless of the ac-tual details of the scheme used to identify the halos, if theresulting halos are independent virialized entities then thestatistical properties of the halo populations will be verysimilar. Figure 1 also shows the PS prediction as a compar-ison. We defer the comparisons of the theoretical curve tothe numerical results in §4.
3 THE TWO-POINT CLUSTER
CORRELATION FUNCTION
The output of our cosmological simulations was processedusing the two halo identification algorithms (HOP & FOF)described in the preceding section. We ordered the lists ac-cording to halo mass and then generated cluster catalogs by
c© 1998 RAS, MNRAS 000, 1–20

Properties of Galaxy Clusters: Mass and Correlation Functions 5
-2
-1
0
1
2
0 1 2
-2
-1
0
1
2
0 1 2
Figure 2. Real-space correlation functions of clusters extracted from the SCDM07 output and O3CDM at z=0 using either (F)OFor (H)OP algorithms. The two left panels show the correlation functions for clusters with masses greater than the specified threshold.
The numbers in the parenthesis are the Dc ≡ n−1/3c values for the cluster samples. The two right panels show correlation functions for
samples with the cluster number density given the specified value of Dc.
applying a fixed lower mass cutoff. We also generated clus-ter catalogs based on the ordered list with a specific numberdensity of clusters (labelled by the corresponding value ofDc).
For each cluster catalog, we compute the real space two-point correlation function using the direct estimator:
ξcc(r) =Np(r)
n2cV (δV )
− 1, (2)
where Np(r) is the number of cluster pairs in the radial binof volume δV centered at r, nc is the mean space density ofthe cluster catalog and V is the volume of the simulation.We use all the clusters in our catalogs, taking advantage ofthe periodic boundary conditions.
The 1σ error bars for the correlations are estimatedusing the formula
δξcc(r) =3
2
1√
Ncc(r)(1 + ξcc(r)) , (3)
where Ncc is the number of distinct cluster pairs in the radialbin at r. We have increased the size of the Poisson errorbars by 50% because these errors do not take into accountclustering and so are likely to underestimate the true errors(Croft & Efstathiou 1994; Croft et al. 1997).
The correlation functions are not well described by asingle power-law over the entire range of pair separationssampled. To estimate the correlation length, we fit a func-tional form
ξcc(r) =(
r
R0
)−γ
(4)
over the range 4.5h−1 Mpc < r < 25h−1 Mpc, which brack-ets the point where ξcc = 1. We estimate the value of R0 byboth fixing the value of γ in the above equation to −1.8 (see
c© 1998 RAS, MNRAS 000, 1–20

6 F.Governato et al.
Figure 1. Differential mass function (number density per unitmass) of groups and clusters extracted from the z = 0 O3CDMsimulation volume using FOF (continous line) and HOP (dot–dashed line) algorithms. The dotted line shows the analytic Press-Schechter prediction for the mass function.
equation 1) and by allowing γ to be a free parameter. Since,the fit is done over a restricted range in r, both schemesyield similar values of R0.
In Figure 2, we show real-space correlation func-tions of clusters in catalogs defined by two different lowermass thresholds (Mcut = 4.6 × 10¹³h−1 M⊙ and 2.5 ×
1014h−1 M⊙) and two different cluster abundance require-ments (Dc = 15h−1 Mpc and 40h−1 Mpc). The clusters areextracted from the simulations using either the FOF or HOPalgorithms. Figure 2 shows the results for clusters extractedfrom the SCDM07 output and the O3CDM simulation atz=0; the clustering trends of O4CDM and SCDM10 clustersare the same.
At both low and high mass thresholds, the correlationfunctions of FOF and HOP clusters are virtually identical,especially in the range 4.5h−1 Mpc < r < 25h−1 Mpc. Theabundances of FOF and HOP clusters (or equivalently, theirDc value) are also the same, as expected from results shownin Figure 1. As the mass threshold increases, or the numberdensity is decreased, the clustering amplitude increases, butthe shape of the correlation function remains the same. Thisreflects the fact that massive, rare peaks tend to be morestrongly clustered in all CDM models. This result is shownin Figure 3.
Given the good match between the halo catalogs we willmainly discuss results for the FOF clusters. Unless specified,results for FOF clusters hold for the HOP clusters as well.
3.1 Cosmology and Normalization of the Mass
Power Spectrum
The real-space z = 0 correlation functions of FOF clus-ter samples from the various simulations are compared inFigure 4. Considering the SCDM10 and SCDM07 as twoz=0 outputs results in the model with the higher amplitude(SCDM10) developing structure on group and cluster scalesat an earlier epoch, having a higher density of very massivehalos and a more strongly clustered mass density field at thepresent epoch.
In spite of the above mentioned differences, the clustercorrelations for the SCDM models with different normali-sations are virtually identical in shape and amplitude forcluster samples with both high as well as low mass thresh-olds. In the case of massive clusters, this has been previouslynoted by both Croft & Efstathiou (1994) and Eke et al.(1996). Since for the SCDM models, studying the changes(or lack thereof) in the correlation functions due to varia-tions in the normalization of the amplitude of the primordialdensity fluctuations is equivalent to studying the evolutionof the clustering property as a function of time, we defer thediscussion of the above-mentioned until §3.3.
The correlations for the two open models are also verysimilar to each other, both in shape and amplitude. Thesetwo models differ not only in their values of Ω0 and h butalso in the normalization of the amplitudes of the primordialmass fluctuations as defined by σ8. The two OCDM modelsdo, however, have the same value of Ω0h
2. Since it is thisparameter that defines the position of the peak in the CDMpower spectrum characterizing the initial Gaussian randomfluctuations in density field, it is perhaps not surprising thatthe cluster correlations are similar.
In comparison to the cluster correlations in a criticaluniverse, the OCDM cluster correlation functions have a sig-nificantly higher amplitude. This occurs because the peak inthe power spectrum for the OCDM models is displaced to-wards larger scales and therefore, for a similar value of σ8,the OCDM models have more power on large scales than theSCDM models.
3.2 Redshift Evolution
In Figure 5, we plot the present-day and z = 0.43, z =0.58 cluster correlations, in comoving coordinates, for twocluster samples defined as (M > 4.6 × 10¹³h−1 M⊙ andM > 1.5 × 10¹⁴h−1 M⊙) drawn from the SCDM10 andO3CDM models respectively.
Before we discuss the results, let us consider what isexpected. Given a sample of halos with masses greater thansome threshold Mcut, the correlation function of the haloscan be related to that of the total mass distribution via thebias parameter:ξCC(r; M > Mcut) = b2
eff (Mcut)ξρρ(r). At a given epochthe bias parameter becomes larger as Mcut is raised, as wehave already shown. For a fixed Mcut and a critical universe,the bias parameter is expected to decrease asymptoticallyto unity as a function of time (Tegmark & Peebles 1998) asthe underlying mass distribution becomes more clustered.The time evolution of ξCC(r; M > Mcut) depends on thecompetition between these two trends.
Turning to Figure 5, we note that for both low and high
c© 1998 RAS, MNRAS 000, 1–20

Properties of Galaxy Clusters: Mass and Correlation Functions 7
-1
0
1
2
0 1 2
-1
0
1
2
0 1 2
Figure 3. Real-space correlation functions of clusters samples defined by either imposing different mass thresholds (top two panels)or by demanding that the sample clusters have some predefined number density (bottom two panels). The clusters have been extractedfrom the SCDM07 output and O3CDM at z=0 using the FOF algorithm.
mass thresholds, there are no significant differences betweenthe comoving correlation functions at z = 0 (σ8=1) andz = 0.43 for the SCDM clusters. This implies that over themass and redshift ranges considered here, the rate of increasein the clustering of the mass distribution is closely matchedby the rate at which the bias parameter decreases.
For the O3CDM model, the correlation function atthe earlier epoch has a slightly higher amplitude for bothlow and high threshold samples. The comoving correlationlength at z = 0.58 is a factor of 1.1–1.2 greater.
To summarize, the comoving group/cluster correlationfunctions are either constant or change very little over theredshift range 0 < z < 0.5 and in proper coordinates, thegroup/cluster correlation length decreases with increasingredshift over the redshift range studied. In the SCDM case,this decrease is given by R0 ∝ (1 + z)−1 and in the O3CDMmodel, by R0 ∝ (1 + z)−0.86.
Table 1. The bias parameter for SCDM07 cluster samples. b1is computed using the standard PS mass function. The secondcolumn gives the mass cut in units of the characteristic mass,M∗ = 4 × 10¹³h−1 M⊙. The final column gives the Lagrangianradius of the halo, which is the smallest separation where theassumtpions in the calculations are valid.
Mcuth−1 M⊙ Mcut/M∗ b1 rLh−1 Mpc
5.7e+14 16.2 3.3 7.92.8e+14 7.0 2.4 6.22.1e+14 5.2 2.2 5.77.0e+13 1.7 1.5 3.9
c© 1998 RAS, MNRAS 000, 1–20

8 F.Governato et al.
-1
0
1
2
0 1 2
-1
0
1
2
Figure 4. Real-space z = 0 cluster correlation functionsextracted from our simulations (SCDM07, SCDM10, O3CDM,O4CDM) using the FOF algorithm.
Table 2. The bias parameter for O3CDM cluster samples. as inTable 1. In this case M∗ = 1.4 × 10¹³h−1 M⊙
Mcuth−1 M⊙ Mcut/M∗ b1 rLh−1 Mpc
2.7e+14 19.3 2.7 9.21.9e+14 13.6 2.4 8.21.1e+14 7.8 2.0 6.89.0e+13 6.4 1.9 6.41.8e+13 1.3 1.2 3.7
-1
0
1
2
0 1 2
-1
0
1
2
Figure 5. Correlation functions of SCDM10 and O3CDM clus-ters computed at two different epochs and plotted in comovingcoordinates.
3.3 Comparison with analytic calculations
To date, most studies of cluster correlations have utilizednumerical simulations. Such numerical simulations are veryexpensive to generate, a constraint that renders a systematicexploration of different cosmological models impractical; italso makes it rather difficult to explore and identify the gen-eral physical mechanisms underlying the clustering proper-ties of clusters and group halos viz a viz that of the mass dis-tribution. Consequently, various authors (e.g. Kaiser 1984;Bardeen et al. 1986; Mann et al. 1993; Mo & White 1996;Mo, Jing & White 1996, Catelan et al. 1998) have devel-oped analytic schemes to compute the cluster correlationfunction.
The first method to compute cluster correlation func-tions analytically that we discuss is based on the Press-Schecter formalism and its extensions. This was originallydeveloped by Cole & Kaiser (1989) and Mo & White (1996)to derive a model for the spatial correlation of dark mat-ter halos in hierarchical models. The calculation consists ofthree steps (see Baugh et al. 1998).
• Compute the nonlinear power spectrum for the cos-mology and σ8 in question using the transformation of thelinear power spectrum suggested by Peacock and Dodds(1996).
• Calculate an effective bias parameter, beff for the
c© 1998 RAS, MNRAS 000, 1–20

Properties of Galaxy Clusters: Mass and Correlation Functions 9
dark matter halos above the specified mass cut as outlinedby Mo & White (1996).
• Fourier transform the nonlinear power spectrum to getthe nonlinear correlation function of the mass, then multiplyby the square of the halo bias factor, to get the real-space,nonlinear, cluster correlation function: ξCC(r) = b2
effξρρ(r).The cluster correlation function thus computed has
been tested, against N-body results by Mo & White (1996)and Mo, Jing & White (1996) and is found to hold evenin the mildly nonlinear regime where ξ(r) > 1 as long as
r > rL where rL = (3M/4πρ0)1/3 is the Lagrangian radius
of the dark matter halos (rL ∼ 10h−1 Mpc for rich clustersof galaxies) and ρ0 is the present mean density. RecentlyJing (1998) has shown that the Mo & White formula sys-tematically underpredicts the bias of low mass halos, but itis in good agreement with numerical simulations in the massrange considered here.
The bias parameter for a dark matter halo that con-tains a single galaxy is given by the formula derived by Mo& White (1996) and was written down for any redshift inBaugh et al. (1998):
b(M, z) = 1 +1
δc
[
(
δc
σ(M)D(z)
)2
− 1
]
(5)
Here D(z) is the linear growth factor, normalized toD(z = 0) = 1, σ(M) is the rms linear density fluctuationat z = 0 and δc is the extrapolated linear overdensity forcollapse at redshift z. This gives the bias factor for the halowhen the clustering is measured at the same epoch that thehalo is identified.
For a sample of halos with different masses, the effectivebias is given by
beff (z) =
∫
N(M, z) b(M, z) dM∫
N(M, z) dM(6)
where N(M, z) dM is the number density of halos withmass M in the sample. For the cluster samples that wehave constructed, N(M, z) can either be set equal to thePress-Schechter mass function (with δc set to the canonicalvalue defining collapse for the cosmology under considera-tion) or to the cluster mass function computed directly fromthe cluster catalogs. However the results shown here are al-most insensitive to this choice.
The effective bias parameters for samples whose corre-lation functions are plotted in Figure 6 are given in Tables1 (SCDM07) and 2 (O3CDM). The mass cuts applied corre-spond to halos of different rarity in the two cosmologies; thisis quantified by comparing the mass cut to the characteris-tic mass M∗, which is defined later in §4. All the mass cutsconsidered correspond to objects that are greater than M∗,and so these halos are biased tracers of the dark matter dis-tribution (Mo & White 1996). The cluster sample with thehighest mass cut for both O3CDM and SCDM07 is predictedto have a correlation function that is ∼ 10 times higher thanthat of the dark matter.
The PS-based analytic correlation functions are shownin Figure 6 as solid curves. There is little difference betweenthe correlation functions computed using the standard PSmass function and the numerical mass function discussedin §4. The analytic correlations are in excellent agreementwith our numerical correlation functions. The agreement be-
tween the numerical and analytic results is further confirmedby the match between the analytic and numerical R0–Dc
curves. The analytic R0–Dc curve is plotted in Figures 7and 8 as the light solid curve.
We consider next the scheme developed by Mann et al.(1993). This is based on the method devised by Couchman& Bond (1988; 1989) that combines the theory of the statis-tics of peaks in Gaussian random fields with the dynamicalevolution of the cosmological density field.
In this scheme, the time evolution of the density fieldis followed using the Zel’dovich approximation (Zeldovich1970). At the epoch of interest, a particular class of objectsis defined by the pair Rs and δc. These are, respectively, thesmoothing scale that is applied to the cosmological densityfield and the linearly extrapolated amplitude of the densityfluctuations at the time of collapse. Mann et al. (1993) setthe values of these two parameters by choosing an appro-priate value for δc (δc = 1.686, corresponds to collapse ofspherical density perturbations in an Ωo = 1 universe) andthen adjusting Rs until the number density of peaks withoverdensities greater than δc corresponds to number densityof objects under consideration. Full details can be found inMann et al. (1993).
In Figure 6, we plot the correlation functions of someof our cluster samples and show the corresponding analyticpeaks-based correlation functions computed assuming δc =1 and δc = 1.7 (dashed curves) according to Mann et al.(1993)’s prescription.
As noted by Mann et al. (1993), the correlation func-tions computed using δc = 1.7 consistently overestimate thecorrelation amplitudes on all scales of interest. The correla-tion functions for δc = 1 are in excellent agreement with thenumerical results for Dc ≤ 30h−1 Mpc (however, a value ofδc ∼ 1 is rather unphysical). For larger values of Dc, the an-alytic results tend to overestimate the correlations, with thediscrepancy first becoming obvious on small scales and thenpropagating out to larger scales as Dc continues to increase.For a given Dc, the discrepancy is more severe for SCDM07clusters than for O3CDM clusters.
The tendency for the peak scheme to overestimate thecorrelations on scales where ξCC(r) ≥ 1 by a margin thatgrows larger with increasing Dc suggests that the peaks-based method will overestimate the correlation lengths ofsamples with large values of Dc. Both Mann et al. (1993)and Watanabe et al. (1994) have computed the R0–Dc rela-tion predicted by the peaks method. Comparing their R0–Dc
curves for O3CDM-like models with our numerical resultswe find that for cluster samples with Dc ≈ 80h−1 Mpc,the correlation length predicted by the peaks-based analyticscheme is R0 ≈ 28h−1 Mpc whereas the simulation resultis R0 ≈ 22h−1 Mpc, very close to the PS based prediction.The breakdown in the peak scheme may be due to severalfactors. The simplest possibility is that that the method usesthe number density of clusters in a sample as a constraintrather than some physical properties of the clusters such astheir masses. Other possible causes of the breakdown are:the manner in which the different filtering scales are chosen,the simplistic nature of the prescription defining the relationbetween peaks in the smoothed density field and “clusters”,and the requirement that the large–separation asymptoticlimit of the statistical contribution to the cluster correla-tion function matches the statistical peak–to–peak corre-
c© 1998 RAS, MNRAS 000, 1–20

10 F.Governato et al.
0 0.5 1 1.5 2 2.5
-2
-1
0
1
SCDM07
0 0.5 1 1.5 2 2.5
-2
-1
0
1
SCDM07
0 0.5 1 1.5 2 2.5
-2
-1
0
1
SCDM07
0 0.5 1 1.5 2 2.5
-2
-1
0
1
O3CDM
0 0.5 1 1.5 2 2.5
-2
-1
0
1
O3CDM
0 0.5 1 1.5 2 2.5
-2
-1
0
1
O3CDM
Figure 6. Analytic correlation functions compared against our numerical results. The two dashed curves are the peaks-based correlationfunctions computed according to the prescription of Mann et al. (1993). The curve with the higher correlation amplitudes on smallscales corresponds to δc = 1.7. The other curve corresponds to δc = 1.. The two solid curves are the PS-based correlation functionscomputed as described in §3.5. The correlation functions are computed assuming either the standard PS mass function or the numericalcluster mass function (see §4). The two are very similar.
lation function (Mann 1998, private communications). Thelatter two tend to magnify any minor discrepancy caused byany of the other factors.
3.4 Correlation Length and the Cluster
Abundance
In Figures 7 and 8, we plot correlation length (R0) as a func-tion of cluster abundance in terms of Dc, the mean clusterseparation, for the FOF clusters in the SCDM07 output andO3CDM model at z=0. For comparison, we also show thescaling relation (Equation 1); the numerical results of Bah-call & Cen (1992) and Croft & Efstathiou (1994) the obser-vational data for R≥ 0, R≥ 1, R≥ 2 Abell clusters (opentriangles) from Bahcall & Soneira (1983) and Peacock &West (1992) and the data for the APM clusters (open cir-
cles) given by Dalton et al. (1992) and Croft et al. (1997).In neither of the SCM07 nor O3CDM models is the R0–Dc relation for clusters consistent with the scaling relationR0 = 0.4Dc.
However, it should be noted that the numerical resultsshow the R0–Dc relation for the real-space correlation func-tion whereas the correlation lengths for the observed clus-ters are derived from redshift-space correlation functions.Redshift–space correlation lenghts are generally larger thantheir real-space correlation length counterparts. For exam-ple, in the case of their low-density spatially flat CDMmodel, Croft & Efstathiou found that their real-space R0-Dc
relation saturates at R0 ≈ 15h−1 Mpc for large values of Dc,whereas the redshift-space R0-Dc saturates at R0 ≈ 21h−1
Mpc. An increase of this kind, however, is not sufficient to
c© 1998 RAS, MNRAS 000, 1–20

Properties of Galaxy Clusters: Mass and Correlation Functions 11
0 20 40 60 800
10
20
30
40
Figure 7. Cluster correlation length as a function of Dc, the mean cluster separation, for clusters extracted from the SCDM07 outputusing FOF (heavy solid curve). The error bars show the 1σ errors in R0 derived from fitting the correlation functions with a −1.8power-law as described in the text. The solid line corresponds to the scaling relation between R0 and Dc (equation 1) advocated byBahcall & West (1992). The dot–dashed line shows the R0–Dc that Bahcall & Cen (1992) derived from their numerical study. Theshort-dashed curve corresponds to the numerical results of Croft & Efstathiou (1994). In addition, the open triangles show the resultsfor R≥ 0, R≥ 1 and R≥ 2 Abell clusters (Bahcall & Soneira 1983; Peacock & West 1992) and the open circles show the results for APMclusters (Dalton et al. 1992; Croft et al. 1997). The light solid curve is the R0–Dc relation derived from analytic PS-based correlationfunctions computed according to the prescription in Baugh et al. (1998) — see §3.5.
bring our numerical R0–Dc relation into agreement with thescaling relation of equation 1.
Consistently with all previous findings, the R0-Dc curvefor clusters extracted from the SCDM universe (Figure 7)does not match either the APM or Abell results. On theother hand, the results of our O3CDM model are in goodagreement with the APM and richness R> 0, R> 1 Abellcluster data, even if the effect of redshift distorsions increas-ing the length scale R0 a few Mpc were included.
The seriously discrepant datapoint is for R> 2 Abellclusters. If this measurement is correct, it suggests thatclustering on very large scales may have been modulatedby non-Gaussian processes (see Mann et al. 1993; Croft &Efstathiou 1994) as it is very difficult to conceive of a Gaus-sian model that can produce the requisite clustering at thesescales. It would also imply that the very rich APM clus-ters with their comparitively large correlation lengths arenot really rich or massive systems but rather are systemscomparable to R> 1 Abell clusters whose number densitieshave been biased downward by the cluster identification al-gorithm. The agreement between our analytic results and
our numerical results for clusters in the O3CDM model andthe APM results leads us to believe that it is the R> 2 Abellresult that is most likely incorrect, biased upward by the in-homogeneities and contamination due to projection effectsin the Abell catalog as argued by Sutherland (1988) andSutherland & Efstathiou (1991).
In comparing our numerical results for SCDM07 tothose of Bahcall & Cen (1992), we find that for 25h−1 Mpc< Dc < 40h−1 Mpc, our R0-Dc results are consistent withtheirs. For Dc > 40h−1 Mpc, our curve rises less steeplythan that of Bahcall & Cen and appears to saturate forDc > 50h−1 Mpc. From analytic results (light solid curve),which we discuss further in the next subsection, we expectthe R0-Dc curve to continue to rise but much more gentlythan the Bahcall-Cen result. Since both we and Bahcall &Cen (1992) used the FOF algorithm to identify clusters inthe simulations, the cluster selection algorithm cannot beresponsible for the differences. Furthermore, our correlationlengths were determined in the same way as Bahcall & Cen(1992).
Comparing our O3CDM results to those of Bahcall &
c© 1998 RAS, MNRAS 000, 1–20

12 F.Governato et al.
0 20 40 60 800
10
20
30
40
Figure 8. Same as Fig. 7 but for O3CDM model.
Cen’s (1992) low-Ω models, we find that the two are in goodagreement for Dc < 35h−1 Mpc and also in a rough agree-ment with the scaling relation. However as the cluster abun-dance decreases and Dc increases, the correlation lengths ofour cluster samples do not increase as quickly. Our numeri-cal results at large values of Dc are in good agreement withthose derived analytically to the scales probed by our simu-lations. (see §3.3)
In comparing our σ8 = 0.7 result to Croft & Efstathiou’s(1994) rc = 1.5h−1 Mpc σ8 = 0.59 SCDM model, we onceagain find smaller correlation lengths for Dc < 30h−1 Mpc.For higher values of Dc, the Croft & Efstathiou (1994)’s re-sults are consistent with ours in spite of the fact that wehave used FOF to identify the clusters and Croft & Efs-tathiou (1994) results are based on a very different scheme.Comparing our O3CDM results to those of Croft & Efs-tathiou’s (1994) 1.5h−1 Mpc, σ8 = 1.0 low-Ω spatially flatCDM model, we find that within the uncertainties in the twocurves, they are in excellent agreement with each other. Theflattening in Croft & Efstathiou’s curve for Dc > 50h−1 Mpc(at R0 ≈ 15h−1 Mpc) is not real. As indicated by both ournumerical and analytic results, the correlation continues torise, albeit gently, reaching R0 ≈ 22h−1 Mpc at Dc = 80h−1
Mpc and is still rising. The flattening trend is likely anartifact of the finite simulation volume or even the poormass/force resolution.
4 THE CLUSTER MASS FUNCTION
According to the analytic PS formalism, the comoving num-ber density of dark matter halos of mass M in the intervaldM is
N(M) =
√
2
π
ρ
M2
δcD−1
σ
∣
∣
∣
d ln σ
d ln M
∣
∣
∣exp
[
−δ2
cD−2
2σ2
]
, (7)
where ρ is the comoving density of the Universe and σ(M)is the linearly extrapolated present-day rms density fluctu-ation in spheres containing a mean mass M . The redshiftevolution of N(M) is controlled by the density thresholdfor collapse, δc/D(z), where D(z) is the linear growth fac-tor normalized to unity at z = 0 (Peebles 1993) and δc isthe linearly evolved density contrast of fluctuations that arevirializing at z = 0. The growth factor, D(z), depends on Ω0
and Λ whereas δc has only a weak dependence on Ω0. Forspherical density fluctuations, δc = 1.686 for Ω0 = 1 and1.65 for Ω0 = 0.3.
The PS description of structure formation in the Uni-verse leads naturally to the definition of a characteristicmass M∗(z) such that
σ(M∗)D(z) = δc . (8)
M∗(z) is then the characteristic mass of halos that are virial-izing at redshift z. Its evolution tracks the manner in whichstructure forms. In bottom-up hierarchical clustering mod-els, such as CDM models, M∗(z) increases as a function of
c© 1998 RAS, MNRAS 000, 1–20

Properties of Galaxy Clusters: Mass and Correlation Functions 13
time as lower mass structures are incorporated into progres-sively more massive halos. In a critical universe, the growthfactor evolves as D(z) = (1 + z)−1 and to first order, thisimplies a strong evolution in M∗. In an open or a flat, low-Ω0
universe, D(z) ceases to evolve as strongly, and the evolu-tion of the characteristic mass is greatly suppressed, onceΩ(z) deviates significantly from unity. Hence, the evolutionof the dark halo mass distribution is also greatly suppressed.A clear detection of the presence or absence of strong dy-namical evolution in the cluster population can be used toput stringent limits on the underlying cosmology.
The actual value and the details of the evolution ofM∗, and therefore of the mass distribution especially forM > M∗, depends sensitively on δc. The standard practiceis to use the value of δc for collapse of spherical perturba-tions. Typical perturbations in CDM models, however, arenot spherical and therefore, the actual value of δc will dif-fer from the spherical value. Moreover, Heavens & Peacock(1986), argue that δc is likely to be lower (1 ≤ δc ≤ 1.68)because typical proto-structures in a Gaussian random fieldtend to be triaxial. A lower (higher) value of δc results inmore (fewer) high mass objects. A detailed discussion of δc
and the asphericity of the density perturbations is given byMonaco (1995, 1998), who finds that when the assumptionof spherical collapse is relaxed, δc becomes a function of thelocal shape of the perturbation spectrum. In most cosmo-logical models, the power spectrum of the primordial per-turbations over the scales of interest deviates, albeit gently,from a simple power law shape and it becomes debatablewhether a constant value of δc is a fair description of theevolving cosmic mass function at all masses and redshifts.Here we allow the collapse threshold to be a free parameterdepending on redshift, calibrating at each epoch using thehigh mass end of the mass distribution. As discussed in §1and §2.3, the halo mass function derived using the PS for-malism is a measure of the abundance of collapsed, distinct,halos characterized by their virial radius and mass. Conse-quently, it is appropriate to use catalogs generated using theFOF and HOP cluster finding algorithms.
4.1 Computing the halo mass function
We construct the differential mass function by sorting thehalos according to their masses in bins of size ∆log(M) =0.1. We have verified that our results are insensitive to thischoice of bin size. Due to the large size of our simulations, weare able to study also the differential cluster mass functioninstead of the cumulative distribution, as is usually done.This means that the individual bins are independent andthe results more robust. We estimate the uncertainty in thenumber of objects in each bin using Poisson statistics. Itis useful to remember that the SCDM run can be rescaledfreely to a different σ8 normalization, The redshift of eachgiven output is then rescaled to a redshift z’: 1 + z′ = (1 +z)/σ8.
4.2 Effects of numerical resolution and cosmic
variance
To study the effects of degrading the numerical resolution,we examined a lower resolution run of our SCDM07 volume.
This run used the same phases, 3 million particles, a soften-ing length of 160h−1 kpc and a third of the timesteps used inour fiducial run. Both force and spatial resolution are there-fore significantly poorer. Halos represented by 128 particlesin our fiducial run have only 8 particles in the low resolu-tion simulation. While there is good agreement at the highmass end, the low mass end of the mass function is severelyaffected by the poorer resolution, showing a significant de-crease in the number density of halos below 3×10¹⁴h−1M⊙.This test indicates that at least 30 particles are needed tocorrectly assign a mass to individual halos. Our choice toinclude in our analyses only halos with N> 64 is then aconservative one.
Finally, we also explored the effects of cosmic vari-ance on the cluster number density. We divided our z = 0SCDM07 volume into several subvolumes and measured thelocal δc over the same mass range as we did for the wholevolume. As expected, cosmic variance produces a scatter inδc when measured in smaller volumes. However the scatteris not significant for volumes as little as 1/8-th of the origi-nal simulation volume (i.e. cubes with 250h−1Mpc per side):we find δc = 1.68 ± 0.02. This is close to the error associ-ated with a single measurement and similar to the value weget from the whole volume, suggesting that the value of δc
for a given halo finder has (almost) converged when the fullvolume of the simulation is considered.
4.3 Press-Schechter Predictions vs Numerical
Results
In Figures 9 and 10, we show the differential mass func-tions from the SCDM and O3CDM simulations, respectively.The corresponding PS curves, computed using the canonicalvalue of δc for spherical perturbations, are also shown. Weonly show the FOF results. Generally, the HOP and FOFresults are very similar, with HOP having a slightly largernumber of massive clusters.
In the case of the SCDM model, we find that the shapeof the differential PS mass function is roughly consistentwith the shape of the numerical mass function only at σ8 = 1At lower σ8 (or alternatively, higher z) the PS mass func-tion underestimates the number density of rich clusters inthe simulation. The excess at the high mass end is about afactor of a few in number density per mass bin. At σ8 0.7 orlarger the PS approach overestimates the number of smallhalos (M < 1014h−1 M⊙). The deficit of low mass halos(which we will only touch upon briefly here) has been well-documented in numerical works by Carlberg & Couchman(1988) and more recently, by Lacey & Cole (1994), Gross etal. (1998) and Somerville et al. (1998). This deficit arisesindependently of the choice of algorithm used to define thehalos in the simulations (see Figure 1) and has been as-sociated with merger events not accounted for by the PSformalism (see Cavaliere & Menci 1997 and Monaco 1997).The fact that the two halo finders agree extremely well inthis regime makes the result very robust.
Apart from the above-mentioned deficit, most otherstudies that have tested the analytic PS mass functionagainst numerical results have reported a good agreementbetween the two (e.g. Eke et al. 1996) with the notable ex-ceptions of Bertschinger & Jain (1994) and Sommerville etal. (1998), who found a systematic excess of massive halos
c© 1998 RAS, MNRAS 000, 1–20

14 F.Governato et al.
Figure 9. The N-body mass distribution for the SCDM run — shown as points — at four different outputs as well as the standard PSmass function (computed using δc = 1.686) — shown as lines — for the same four outputs: σ8 = 1 (filled circles, solid line), σ8 = 0.7(circles, dotted line),σ8 = 0.47 (squares, dashed line), σ8 = 0.35 ( triangles, long dashed line). The error bars correspond to 1σ Poissonerrors.
Figure 10. The same as Figure 9 but for O3CDM model at z=0,0.58,1.
c© 1998 RAS, MNRAS 000, 1–20

Properties of Galaxy Clusters: Mass and Correlation Functions 15
in numerical simulations as compared to the PS prediction.These numerical results, however, are derived from simula-tions that have lower resolution and probe smaller cosmolog-ical volumes than our simulations. These simulations, con-sequently, contain only a small number of massive clustersand this, in conjunction with cosmic variance, has resultedin numerical mass functions with large uncertainties at thehigh mass end. Eke et al. (1996), found a good agreementwith the PS mass function on the scale of 5 × 10¹⁴h−1M⊙
but with a large error bar.The large volumes used in our work allow us to confirm
the good agreement between the numerical and the analyt-ical mass function found for high values of σ8. The excessof massive clusters at lower σ8/higher redshifts suggest thatthe cluster mass function for the SCDM model evolves moreslowly than the PS mass function. At σ8=0.35, the numberdensity of Coma–like clusters exceeds the standard PS pre-diction by almost an order of magnitude. Allowing δc to bea free parameter at each epoch, we perform a χ2 fit of thePS formula to the numerical results assuming Poisson errorsfor each bin. Since observations tend to be biased towardsthe high-mass end, we include in our fit only clusters withtemperature T>3keV, (the M–T relation is defined in §4.4)to allow the use of this formula in theoretical predictions forX-ray clusters. This formula will underestimate slighlty thenumber of very (T>7keV) hot clusters for high σ8 models.
For the SCDM cluster mass function at σ8=0.7 , thebest–fit δc coincides with the canonical value of 1.686 ! Forz > 0 and for our FOF selected halos, the best-fit value ofδc as a function of redshift and σ8 is :
δc(z) = 1.686[(
0.7
σ8
)
(1 + z)]−0.125
(9)
as shown in Figure 11, whereas the canonical value ofδc is a constant. (in Figure 11 errorbars are 3 σ errors). ForHOP selected halos δc is offset toward even lower values,i.e. toward a larger cluster excess: δc = 1.6 at z=0. (for theSCDM model at σ8 = 0.7). However, a similar evolution ofδc(z) is found, with a (1 + z)−0.1 dependence. In principlethe fitting procedure should keep into account that the massassociated with a given temperature depends on z and thatthe same output can be associated with different z dependingon σ8. However the fitting formula is not affected by this forvalues of present day σ8 between 1 and 0.5 and eq. 9 can beused safely.
In the O3CDM model case , the PS mass function is infair agreement with the numerical mass function, especiallyat low redshifts. At z = 0, the high mass end of the numer-ical halo mass function agrees within 2σ with the analyticalcurve computed using the canonical (spherical) value of δc
= 1.651. The uncertainties in the number densities of mas-sive clusters are slightly larger in the O3CDM case becauseof the smaller physical volume/h igher H0 of the simulation.As shown in Figure 11, the best-fit δc(z) for FOF halos canbe well-approximated as
δc(z) = 1.775(1 + z)−0.07 (10)
HOP results shows an even weaker evolution in z. As theresult is more significant in the SCDM case we will mainlyfocus on the analysis of results for the critical case.
From these results however, it is not clear if the devia-
Figure 11. The points show best fit values of δc(z) requiredto match the numerical mass function for clusters with T> 3keV at different redshifts. The squares show the results for theSCDM07 model and the triangles show the results for O3CDMmodel. The horizontal light solid curve and the nearly horizontaldashed lines show the canonical values of δc(z) for the SCDM07and the O3CDM models respectively. The lines across the pointsare the power-law interpolation to the points (see text). Bars are3 σ errors.
Figure 12. The points show the best-fit values δc(z) for SCDM07(continuous) and O3CDM (dashed) at z=0 (black dots) and z=1(i.e σ8 = 0.35 for SCDM) (open squares) as the mass range overwhich the PS functional form is fitted to the numerical FOF massfunction is varied. The abscissa corresponds to the lower massthreshold of the mass range over which the fit is demanded.
c© 1998 RAS, MNRAS 000, 1–20

16 F.Governato et al.
tion from the standard PS mass function is due to just oneor rather both of the following effects:
• at lower σ8 and for a fixed temperature T we studymore extreme clusters i.e. we look at a different region ofthe mass function, which maybe still be self similar, albeitdifferent from the canonical PS.
• the shape of the mass function evolves with timeand/or depends on the power spectrum
As discussed above, the best-fit δc(z) were determinedby fitting the functional form of the PS mass function to thenumerical results for clusters with T> 3 keV, i.e. on massscales M ≫ M∗, where M∗ corresponds to 4 × 10¹³ h−1M⊙
for SCDM07 and 1.5 × 10¹³ h−1M⊙ for O3CDM. It is ofinterest to relax this constraint and explore how the δc variesas the minimum mass of the halos included in the fit islowered and approaches the mass of the smallest halos (64particles) in our catalog. We carried out the above exerciseat two different epochs/normalization and the results areshown in Figure 12. The value of δc changes dramatically asthe mass range over which the fit is carried out moves towardsmaller masses (the fit is dominated by the smaller massbins as they contain most of the halos used in the fitting).The trend for both SCDM and O3CDM is for δc to becomelarger as the mass threshold is lowered. This is preciselywhat one expects given the deficit of low-mass halos in thesimulations. This shows that the shape of the N–body massfunction differs from the PS prediction, and the exact valueof δc is a function of the mass interval considered.
This plot shows also that, at a given mass, δc is a func-tion of redshift. To prove that the shape of the mass func-tion evolves with time we take advantage of the fact thatwithin the PS framework the cumulative fraction of mass incollapsed halos is invariant when plotted vs the variance ofthe density field at a given mass/lenght scale. I.e. at a givenvalue of σ (which corresponds to different mass/lenght scalesdepending on cosmology and z) the fraction of mass in col-lapsed objects is always the same. This is shown in Figure13.
It is interesting to interpret this change in terms of dif-ferent power spectra. SCDM models can be rescaled to mod-els with different Γ′ (or τCDM models) rescaling the box byΓ/Γ′ and choosing as the final output the one with the cor-rect present–day normalization at the scale correspondingto the 8h−1Mpc scale. The sequence of outputs with de-creasing σ8 and increasing excess of massive objects can bereinterpreted as a sequence of models with smaller Γ param-eter and the same normalization, revealing the dependenceof the shape of the mass function from the power spectrum.An excess of massive halos for a more negative local spec-tral index (as the case with larger Γ) had been predicted byMonaco (1995).
This rescaling allowed to compare our mass functionswith that obtained from the so called “Hubble Volume Sim-ulation” (HVS) (Colberg et al. 1998), a τCDM with Γ=0.21and normalization of σ8 = 0.6 Their final output can berescaled to a SCDM model with a σ8 = 0.285. The HVSmass function lies nicely along our sequence of mass func-tions (Cole & Jenkins 1998, private communication) showinga slightly larger excess of halos compared to our σ8 = 0.35output (our output with the lowest σ8).
The two simulations used completely independent soft-ware to generate the initial conditions, evolve the density
field and analyze the data. The agreement found is quitesatysfying and shows that the results of both simulationsare free of hidden systematic effects.
We can conclude that for critical CDM models the nu-merical mass function compared to the PS analytical predic-tion has an excess of halos for M≫ M∗ and a deficiencyfor masses M ≪ M∗. The excess at large masses is largerfor models with smaller Γ (or more negative local spectralindex).
These deviations for the canonical predictions are sig-nificant and cosmological tests based on the number densityof a particular class of objects need to use the appropriatevalue of δc to make robust predictions. Our fitting formulaeq. 9 can easily be modified for other critical models with adifferent shape parameter.
4.4 Effects on the Cluster Temperature
distribution
X-ray observations allow one to directly determine the clus-ter temperature or the cluster luminosity function. Of thetwo, the temperature of the intracluster gas is thought tobe the more robust measure of the depth of the cluster po-tential well and to a good approximation, is expected tobe very strongly correlated with the cluster mass. In thissection, we examine the impact on the cluster temperaturefunction of the excess of massive clusters found in the simu-lation as compared with the predictions of the standard PSmass function.
We follow Eke, Cole & Frenk (1996) and adopt the fol-lowing simple relation for estimating the temperature of theintracluster medium of a cluster of mass M :
kT = 7.75M2/315 (1 + z)
(
Ωo∆c
Ω(z)178
)1/3
. (11)
∆c is the average density contrast at virialization with re-spect to the critical background density. This relation as-sumes that the intracluster medium is isothermal. M15 ismass in units of 1015M⊙h−1
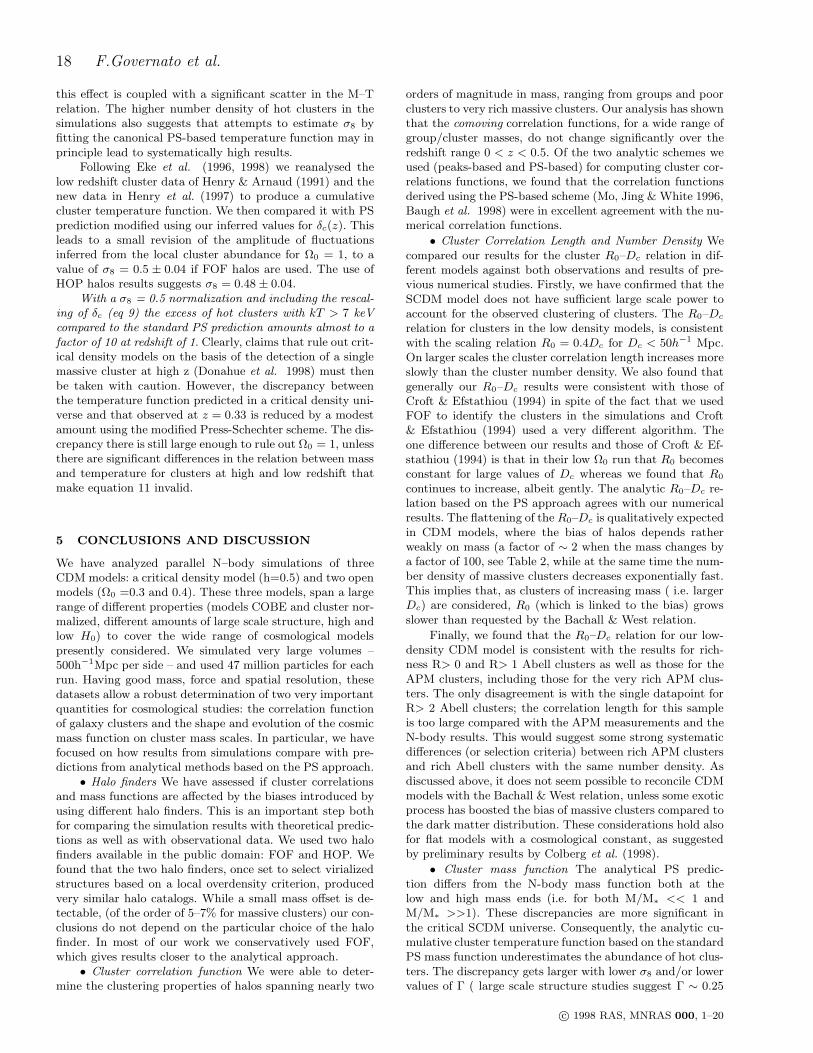
The cumulative temperature function N(> T ) consid-ering the SCDM07 model as the present time is shown inFigure 14. The corresponding cumulative temperature func-tion based on the standard PS mass function is shown bythe dashed lines. The bottom panel shows the ratio betweenthese two mass functions. At z = 0, the two are very similar.At z ∼ 1, however, the number density of clusters with tem-peratures kT > 7 keV (the temperature of rich, Coma-likeclusters) is more than a factor of 3 greater than the canonicalPS prediction and in the case of exceptionally hot clusters(kT > 10 keV), the discrepancy is an order of magnitude.This discrepancy increases for a universe with a lower, morerealistic normalization.
One implication of this is that the cumulative temper-ature function obtained from the simulation evolves moreslowly over the redshift range 0 < z < 1 than PS theory pre-dicts. Since we choose a fixed temperature range, at higher zwe are observing more extreme (massive) clusters, i.e. a re-gion of the mass function with a stronger excess comparedwith the anlytical formula. In principle it may be more dif-ficult to challenge a high Ω model on the basis that theobserved cluster temperature function does not vary signif-icantly over the redshift range 0 < z < 0.3, especially if
c© 1998 RAS, MNRAS 000, 1–20

Properties of Galaxy Clusters: Mass and Correlation Functions 17
0.4 0.6 0.8 1 1.2 1.4-5
-4
-3
-2
-1
Figure 13. The plot shows the cumulative fraction of mass in collapsed halos as a function of the variance of the density field. The PSprediction (invariant with redshift and cosmology) is the thick continuous line. The SCDM results are shown at diffferent outputs: σ8 = 1:dot–long dashed; σ8 = 0.7: dot–short dashed; σ8 = 0.47: dottted line; σ8 = 0.35: dashed. The numerical mass function is obviously notinvariant and shows evidence of evolution.
Figure 14. Upper panel: PS (thick lines) vs numerical (thin lines) cumulative temperature function N(>T) for the SCDM07 model atz = 0 (continuous line), z = 0.5 (dotted), and z = 1.0 (dashed). Bottom panel: shows the ratio of clusters above a given temperaturebetween the numerically-based temperature function and the PS-based temperature function at z = 0.5 (dotted), and z = 1.0 (dashed).
c© 1998 RAS, MNRAS 000, 1–20
18 F.Governato et al.
this effect is coupled with a significant scatter in the M–Trelation. The higher number density of hot clusters in thesimulations also suggests that attempts to estimate σ8 byfitting the canonical PS-based temperature function may inprinciple lead to systematically high results.
Following Eke et al. (1996, 1998) we reanalysed thelow redshift cluster data of Henry & Arnaud (1991) and thenew data in Henry et al. (1997) to produce a cumulativecluster temperature function. We then compared it with PSprediction modified using our inferred values for δc(z). Thisleads to a small revision of the amplitude of fluctuationsinferred from the local cluster abundance for Ω0 = 1, to avalue of σ8 = 0.5 ± 0.04 if FOF halos are used. The use ofHOP halos results suggests σ8 = 0.48 ± 0.04.
With a σ8 = 0.5 normalization and including the rescal-ing of δc (eq 9) the excess of hot clusters with kT > 7 keVcompared to the standard PS prediction amounts almost to afactor of 10 at redshift of 1. Clearly, claims that rule out crit-ical density models on the basis of the detection of a singlemassive cluster at high z (Donahue et al. 1998) must thenbe taken with caution. However, the discrepancy betweenthe temperature function predicted in a critical density uni-verse and that observed at z = 0.33 is reduced by a modestamount using the modified Press-Schechter scheme. The dis-crepancy there is still large enough to rule out Ω0 = 1, unlessthere are significant differences in the relation between massand temperature for clusters at high and low redshift thatmake equation 11 invalid.
5 CONCLUSIONS AND DISCUSSION
We have analyzed parallel N–body simulations of threeCDM models: a critical density model (h=0.5) and two openmodels (Ω0 =0.3 and 0.4). These three models, span a largerange of different properties (models COBE and cluster nor-malized, different amounts of large scale structure, high andlow H0) to cover the wide range of cosmological modelspresently considered. We simulated very large volumes –500h−1Mpc per side – and used 47 million particles for eachrun. Having good mass, force and spatial resolution, thesedatasets allow a robust determination of two very importantquantities for cosmological studies: the correlation functionof galaxy clusters and the shape and evolution of the cosmicmass function on cluster mass scales. In particular, we havefocused on how results from simulations compare with pre-dictions from analytical methods based on the PS approach.
• Halo finders We have assessed if cluster correlationsand mass functions are affected by the biases introduced byusing different halo finders. This is an important step bothfor comparing the simulation results with theoretical predic-tions as well as with observational data. We used two halofinders available in the public domain: FOF and HOP. Wefound that the two halo finders, once set to select virializedstructures based on a local overdensity criterion, producedvery similar halo catalogs. While a small mass offset is de-tectable, (of the order of 5–7% for massive clusters) our con-clusions do not depend on the particular choice of the halofinder. In most of our work we conservatively used FOF,which gives results closer to the analytical approach.
• Cluster correlation function We were able to deter-mine the clustering properties of halos spanning nearly two
orders of magnitude in mass, ranging from groups and poorclusters to very rich massive clusters. Our analysis has shownthat the comoving correlation functions, for a wide range ofgroup/cluster masses, do not change significantly over theredshift range 0 < z < 0.5. Of the two analytic schemes weused (peaks-based and PS-based) for computing cluster cor-relations functions, we found that the correlation functionsderived using the PS-based scheme (Mo, Jing & White 1996,Baugh et al. 1998) were in excellent agreement with the nu-merical correlation functions.
• Cluster Correlation Length and Number Density Wecompared our results for the cluster R0–Dc relation in dif-ferent models against both observations and results of pre-vious numerical studies. Firstly, we have confirmed that theSCDM model does not have sufficient large scale power toaccount for the observed clustering of clusters. The R0–Dc
relation for clusters in the low density models, is consistentwith the scaling relation R0 = 0.4Dc for Dc < 50h−1 Mpc.On larger scales the cluster correlation length increases moreslowly than the cluster number density. We also found thatgenerally our R0–Dc results were consistent with those ofCroft & Efstathiou (1994) in spite of the fact that we usedFOF to identify the clusters in the simulations and Croft& Efstathiou (1994) used a very different algorithm. Theone difference between our results and those of Croft & Ef-stathiou (1994) is that in their low Ω0 run that R0 becomesconstant for large values of Dc whereas we found that R0
continues to increase, albeit gently. The analytic R0–Dc re-lation based on the PS approach agrees with our numericalresults. The flattening of the R0–Dc is qualitatively expectedin CDM models, where the bias of halos depends ratherweakly on mass (a factor of ∼ 2 when the mass changes bya factor of 100, see Table 2, while at the same time the num-ber density of massive clusters decreases exponentially fast.This implies that, as clusters of increasing mass ( i.e. largerDc) are considered, R0 (which is linked to the bias) growsslower than requested by the Bachall & West relation.
Finally, we found that the R0–Dc relation for our low-density CDM model is consistent with the results for rich-ness R> 0 and R> 1 Abell clusters as well as those for theAPM clusters, including those for the very rich APM clus-ters. The only disagreement is with the single datapoint forR> 2 Abell clusters; the correlation length for this sampleis too large compared with the APM measurements and theN-body results. This would suggest some strong systematicdifferences (or selection criteria) between rich APM clustersand rich Abell clusters with the same number density. Asdiscussed above, it does not seem possible to reconcile CDMmodels with the Bachall & West relation, unless some exoticprocess has boosted the bias of massive clusters compared tothe dark matter distribution. These considerations hold alsofor flat models with a cosmological constant, as suggestedby preliminary results by Colberg et al. (1998).
• Cluster mass function The analytical PS predic-tion differs from the N-body mass function both at thelow and high mass ends (i.e. for both M/M∗ << 1 andM/M∗ >>1). These discrepancies are more significant inthe critical SCDM universe. Consequently, the analytic cu-mulative cluster temperature function based on the standardPS mass function underestimates the abundance of hot clus-ters. The discrepancy gets larger with lower σ8 and/or lowervalues of Γ ( large scale structure studies suggest Γ ∼ 0.25
c© 1998 RAS, MNRAS 000, 1–20

Properties of Galaxy Clusters: Mass and Correlation Functions 19
(Maddox et al. 1990)). At z = 1 (assuming a SCDM clus-ter normalized model with σ8 = 0.5) the number of clusterswith kT> 7 keV is underestimated by almost a factor of ten.Claims that rule out critical density models on the basis ofthe detection of massive clusters at high z (Donahue et al.1998) should then be taken with some caution. The temper-ature function obtained from our simulations evolves moreslowly than the standard PS temperature function. Theseresults however, are not sufficient to bring the cluster tem-perature function for Ω0 = 1, CDM models in agreementwith that observed at z = 0.33 by Henry et al. 1998).
Our results show there is no evidence to support thenotion of a universal value for δc in a given cosmology fordifferent power spectra. Our results strongly support theidea that δc(z) is a function of cosmology, and also of redshiftand of the mass range under consideration. It is then harderto attach a simple physical meaning to the value of δc(z). Wegive a fitting formula for δc(z), valid for groups and clustersthat improves the agreement between the PS and numericalmass functions. It is tempting to interpret the excess of highmass objects found in the SCDM simulation as a deviationof the gravitational collapse from the idealized sphericallyhomogeneous collapse model (Monaco 1995).
One important, general consideration that can be ex-tracted from our analysis is the primary importance ofcomparing results on homogeneous grounds. In particular,it is crucial to define cluster samples on the basis of thesame, physically motivated quantity. If clusters are definedin terms of the mass within the virial radius, then both an-alytical and numerical results can be directly compared andthe resulting differences understood. This makes theoreticalpredictions much more robust and easier to compare withobservational results.
It appears that collisionless large scale structure simula-tions are now in their maturity. Simulations even larger thanours are currently being analyzed (see Colberg et al. 1998).The statistical results appear to be robust and stable, allow-ing a fruitful comparison with observational data, which atthe same time, are about to experience a manifold growth.We are optimistic that a close interplay between theoreti-cal and observational results about the internal physics ofgalaxy clusters and their large scale distribution will help toimprove our knowledge of the physical state of our Universe.
ACKNOWLEDGMENTS
We thank Shaun Cole and Adrian Jenkins for helpful dis-cussions that greatly improved our understanding of the re-sults in §4. We are grateful to Joachim Stadel, one of thefathers of PKDGRAV. We thank A.Cavaliere and P.Monacofor many useful discussions. We thank Bob Mann for his helpin computing analytic peaks-based cluster correlation func-tions. We thank Rupert Croft and Renyue Cen from pro-viding us with their numerical results from their respectivestudies. F.G acknowledges support from the TMR Networkfor the Formation and Evolution of Galaxies. A.B. wouldlike to thank the Department of Astronomy at University ofWashington for hospitality shown to him during the sum-mer of 1998 and gratefully acknowledges financial supportfrom University of Victoria and through an operating grantfrom NSERC. P.T. acknowledges hospitality from the Astro-
physics Department of the University of Durham and sup-port from a NASA ATP–NAG5–4236. CMB and FG wouldlike to thank the organisers of the Guillermo Haro work-shop on the Formation and Evolution of Galaxies, held atINAOE, Mexico for their hospitality whilst this paper wasfinished.
REFERENCES
Abadi, M.,G. Lambas, D.G, Muriel H. 1998, ApJ in pressBahcall, N.A., 1988, ARA&A, 26, 631Bahcall, N.A., West, M.J., 1992, ApJ, 392, 41
Bahcall, N.A., Cen, R., 1992, ApJL, 398, L81Bahcall, N.A., Soneira, R.M., 1983, ApJ, 270, 20
Bardeen, J.M., Bond, J.R., Kaiser, N., Szalay, A.S. 1986, ApJ,305, 15
Baugh, C.M., Cole, S., Frenk, C.S., Lacey, C.G., 1998, ApJ, 498,504
Bertschinger, E., Jain, B., 1994, ApJ, 431, 495
Bond, J.R., Cole, S., Efstathiou, G., Kaiser, N. 1991, ApJ, 379,440
Borgani, S., Gardini, A., Girardi, M., Gottlober, S. 1997 NewAstronomy, 2, 119
Carlberg, R.G., Couchman, H.M.P. 1989 ApJ 340, 47Catelan, P., Lucchin, F., Matarrese, S. & Porciani, C. 1998, MN-
RAS, 297, 692Cavaliere, A., Menci, N. 1997, ApJ, 480, 132
Cavaliere, A., Menci, N., Tozzi, P., 1997, ApJL, 484, L21Cen, R. 1998 ApJ in press [astro–ph/9806704]
Colberg, J.M.,White, S.D.M., MacFarland, T.J., Jenkins, A.,Frenk, C.S., Pearce, F.R., Evrard, A.E., Couchman, H.M.P.,Efstathiou, G., Peacock, J.A., & Thomas, P.A. To appear inproceedings of The 14th IAP Colloquium: Wide Field Surveysin Cosmology, held in Paris, 1998 May 26-30, eds. S.Colombi,Y.Mellier [astro–ph/9808257]
Cole, S. & Kaiser, N., 1989, MNRAS, 237, 1127
Cole, S., Weinberg, D.H., Frenk, C.S., Ratra, B. 1997, MNRAS,289, 37
Colless, M., Boyle B., 1998 in Highlights of Astronomy, Vol.11.Croft, R.A.C., Efstathiou, G., 1994, MNRAS, 267, 390
Croft, R.A.C., Dalton, G.B., Efstathiou, G., Sutherland, W.,J.,1997, MNRAS, 291, 305
Couchman, H.M.P. & Bond, J.R. in: The post recombinationUniverse; Proceedings of the NATO Advanced Study Insti-tute, Cambridge, England. Kluwer Academic Publisher 1988,p. 263
Couchman, H.M.P. & Bond, J.R. in proceedings of: Large ScaleStructure and Motions in the Universe. Eds M.Mezzetti, G.Giuricin, F. Mardirossian, M. Ramella. 1988
Dalton, G.B., Efstathiou, G., Maddox, S.J., Sutherland, W.J.,1992, ApJL, 390, L1
Davis, M., Efstathiou, G., Frenk, C.S., White S.D.M 1985, ApJ,292, 371
Dekel, A., Blumenthal, G.R., Primack, J.R., Olivier, S., 1989,ApJL, 338, L5
De Theije, P.A.M., Van Kampen, E. & Slijkhuis, R.G. 1998, MN-RAS, 297, 195
Donahue, M., Voit, G.M, Gioia, I, Luppino,G. Hughes, J.P.,Stocke J.T., 1998, ApJ, in press
Eisenstein, D.J., Hut, P. 1998, ApJ, 498, 137
Eke, V.R., Cole, S., Frenk, C.S., 1996, MNRAS, 282, 263Eke, V.R., Cole, S., Frenk, C.S., Navarro, J.F., 1996b, MNRAS,
281, 703Eke, V.R., Cole, S., Frenk, C.S., Henry, J.P., 1998, submitted to
MNRAS [astro–ph/9802350]
Gelb, J.M., Bertschinger, E. 1994, ApJ, 436, 467
c© 1998 RAS, MNRAS 000, 1–20

20 F.Governato et al.
Governato, F., Moore, B., Cen, R., Stadel, J., Lake, G., Quinn,
T., 1997, New Astronomy, 2, 91Gross, M.A.K, Sommerville, R.S., Primack, J.R., Holtzman, J.,
Klypin, A., 1998, in pressHauser, M.G., Peebles, P.J.E., 1973, ApJ, 185, 757Henry, J.P., Arnaud, K.A., 1991, ApJ, 372, 410Henry, J.P., 1997, ApJ, 489, L1Jenkins, A, Frenk C.S., Pearce F.R., Thomas P.A., Colberg J.M.,
White S.D.M., Couchman, H.M.P. Peacock, J.A., EfstathiouG., Nelson, A.H. 1998, ApJ 499, 20
Jing, Y.P. 1998, ApJ, 503L, 9Jing, Y.P, Plionis, M., Valdarnini, R., 1992, ApJ, 389, 499Kaiser, N., 1984, ApJ, 284, L9Klypin A., Borgani S., Holtzman J. & Primack J., 1995 ApJ 444,1Kitayama, T., Suto, Y., 1996 ApJ, 469, 480Lacey, C., Cole, S. 1993, MNRAS, 262, 627Lacey, C., Cole, S. 1994, MNRAS, 271, 676Lahav, O., Fabian, A.C., Edge, A.C., Putney, A., 1989, MNRAS,
238, 881Loveday, J. 1998, To appear in proceedings of the Second In-
ternational Workshop on Dark Matter in Astro and Parti-cle Physics, eds. H.V. Klapdor-Kleingrothaus and L. BaudisFrance. (astro-ph/9810130)
Maddox S.J., Efstathiou G., Sutherland W.J. & Loveday J., MN-RAS 242, 43P
Mann, R.G., Heavens, A.F., Peacock, J.A., 1993, MNRAS, 263,798
Mo, H.J., Jing, Y.P., White, S.D.M., 1996, MNRAS, 282, 1096Mo, H.J. & White, S.D.M., 1996, MNRAS, 282, 347Monaco, P., 1995, ApJ, 447, 23Monaco, P., 1997, MNRAS, 287, 753Monaco, P., 1997b, MNRAS, 290, 439Monaco, P., 1998 , Fund. Cosm. Phys. 19, 153More, J.G., Heavens, A.F. & Peacock, J.A 1986, MNRAS, 220,
189Nichol, R.C., Collins, C.A., Guzzo, L., Lumsden, S.L, 1992, MN-
RAS, 255, 21PPeacock, J.A., Dodds, J. 1996, MNRAS, 280L, 19Peacock, J.A., West, M.J., 1992, MNRAS, 259, 494Peebles, P.J.E. 1993, Principles of Physical Cosmology (Prince-
ton: Princeton Univ. Press)Postman, M., Huchra, J.P., Geller, M.J., 1992, ApJ, 384, 404Postman, M. 1998 astro-ph 9810088 To appear in the proceedings
of ”Evolution of Large Scale Structure: From Recombinationto Garching”
Press, W.H., Schechter, P. 1974, ApJ, 187, 425Quinn, T., Katz, N., Stadel, J., Lake, G. 1997 astro-ph 9710043
Romer, A.K., Collins, C., MacGillivray, H., Cruddace, R.G., Ebel-ing, H., Bohringer, H., 1994, Nature, 372, 75
Somerville, R.S., Lemson, G., Kolatt, T.S. & Dekel, A. 1998,[astro–ph/9807277]
Stadel, J., Quinn, T. 1997 in preparationStadel, J., 1998, in preparationStrauss,M., A., Cen, R., Ostriker, J.P., Laurer, T.R., Postman,
M., 1995, ApJ 444, 507Sutherland, W.J., 1988, MNRAS, 234, 159Sutherland, W.J., Efstathiou, G., 1991, MNRAS, 248, 159Szapudi I., Quinn T., Stadel J. & Lake G. 1998, submitted to
ApJTegmark, M., Peebles, P.J.E., 1998, ApJ 500L, 79Walter C, Klypin A., 1996 ApJ, 462, 13Watanabe, T., Matsubara, T., Suto, Y., 1994, ApJ, 432, 17West, M.J., Van den Bergh, S., 1991, ApJ, 373, 1White, S.D.M., Efstathiou, G., Frenk, C.S., 1993, MNRAS, 262,
1023Viana, P.T.P., Liddle, A.R., 1996, MNRAS, 281, 323Zeldovich, Y.B. 1970, A&A 5,84
c© 1998 RAS, MNRAS 000, 1–20