Leaving the Heliosphere: A Nuclear Powered Interstellar Probe
Upload
manoa-hawaiiCategory
view
1download
0
arX
iv:0
802.
3716
v1 [
astr
o-ph
] 2
5 Fe
b 20
08
Measurement of the electron-pressure profile of galaxy clusters in
Wilkinson Microwave Anisotropy Probe (WMAP) 3-year data.
F. Atrio-Barandela1,5, A. Kashlinsky2 D. Kocevski3, H. Ebeling4
ABSTRACT
Using WMAP 3-year data at the locations of close to ∼ 700 X-ray selected
clusters we have detected the amplitude of the thermal Sunyaev-Zeldovich (TSZ)
effect at the 15σ level, the highest statistical significance reported so far. Owing
to the large size of our cluster sample, we are able to detect the corresponding
CMB distortions out to large cluster-centric radii. The region over which the
TSZ signal is detected is, on average, four times larger in radius than the X-ray
emitting region, extending to ∼ 3h−170 Mpc. We show that an isothermal β model
does not fit the electron pressure at large radii; instead, the baryon profile is
consistent with the Navarro-Frenk-White profile, expected for dark matter in the
concordance ΛCDM model. The X-ray temperature at the virial radius of the
clusters falls by a factor ∼ 3− 4 from the central value, depending on the cluster
concentration parameter. Our results suggest that cluster dynamics at large radii
is dominated by dark matter and is well described by Newtonian gravity.
Subject headings: Cosmic Microwave Background. Cosmology: theory. Cosmol-
ogy: observations.
1. Introduction.
The hot intergalactic X-ray emitting gas distorts the Cosmic Microwave Background
(CMB) spectrum of those photons crossing the cluster. The CMB distortions are independent
1Fısica Teorica, Universidad de Salamanca, 37008 Salamanca, Spain
2SSAI and Observational Cosmology Laboratory, Code 665, Goddard Space Flight Center, Greenbelt MD
20771
3Department of Physics, University of California at Davis, 1 Shields Avenue, Davis, CA 95616
4Institute of Astronomy, University of Hawaii, 2680 Woodlan Dr, Honolulu, HI 96822
5e–mail: [email protected]

of redshift and arise from Thompson scattering; when electrons are non-relativistic, they are
caused by two different effects: (1) the Thermal Sunyaev-Zel’dovich effect (TSZ, Sunyaev
& Zel’dovich 1972) is due to the thermal motions of electrons in the cluster potential well,
whereas (2) the Kinematic Sunyaev-Zel’dovich effect (KSZ) is due to the motion of the
cluster as a whole. Both effects contribute to the CMB radiation power spectrum, but their
contribution is significant at ℓ > 103 (Atrio-Barandela & Mucket 1999, Molnar & Birkinshaw
2000). For the most luminous clusters, relativistic corrections could become important,
giving rise to the relativistic SZ effect (Wright, 1979). The TSZ spectral signature appears
as a temperature decrement in the WMAP frequency range. It has been measured for
∼ 100 individual clusters (Birkinshaw 1998, Carlstrom, Holder & Reese 2002, LaRoque et
al 2007), while the KSZ effect, being of much smaller amplitude, has not yet been detected
for individual systems. It can, however, be detected statistically with large cluster samples
(Kashlinsky & Atrio-Barandela, 2000) using a method recently applied by us to measure the
bulk motion of clusters on scales out to ∼ 300h−1Mpc (Kashlinsky et al 2007).
Currently planned ground- and space-borne CMB experiments like the South Pole Tele-
scope, the Atacama Cosmology Telescope and the PLANCK mission are expected to de-
tect clusters via their TSZ signature in the near future. In the meantime, first efforts to
determine the TSZ contribution to the CMB fluctuations observed by WMAP across the
entire sky (Spergel et al 2007) were made by cross-correlating templates constructed from
galaxy and cluster catalogs using 1st-year data (Hernandez-Monteagudo & Rubino Martın
2004, Hernandez-Monteagudo, Genova-Santos & Atrio-Barandela 2004, Myers et al 2004,
Afshordi, Lin & Sanderson 2005) and, more recently, 3rd-year data (Afshordi et al 2007).
These studies report 2-8σ detections of an anti-correlation with various galaxies and cluster
surveys, consistent with the expected TSZ signature at WMAP frequencies.
A more efficient detection of the SZ effect is possible by examining the WMAP data at
the location of X-ray detected clusters since both the SZ and the X-ray data probe the same
hot ICM. In this letter, we use the largest to-date all-sky cluster catalog, containing 782
clusters with well measured X-ray parameters from ROSAT All-Sky Survey data (RASS,
Voges et al 1999), to determine the TSZ amplitude present in the WMAP 3yr data and
to evaluate the properties of the cluster SZ signal. We describe in Sec. 2 the catalog and
WMAP data, present our results in Sec. 3, and discuss their implications in Sec. 4.
2. X-ray catalog and CMB data
Our analysis uses an all-sky cluster sample created by combining the ROSAT-ESO Flux
Limited X-ray catalog (REFLEX, Bohringer et al 2004) in the southern hemisphere, the
2

extended Brightest Cluster Sample (eBCS, Ebeling et al 1998, Ebeling et al 2000) in the
north, and the Clusters in the Zone of Avoidance (CIZA, Ebeling, Mullis & Tully 2002,
Kocevski et al 2007) sample along the Galactic plane. All three surveys are X-ray selected
and X-ray flux limited using RASS data. A detailed description of the creation of the merged
catalog is provided by Kocevski & Ebeling (2006).
For each cluster, the catalog lists position, flux, and luminosity measured directly from
RASS data; X-ray electron temperature, derived from the LX −TX relation of White, Jones
& Forman (1997), redshifts, and angular and physical extent of the region containing the
measured X-ray flux. We determine the X-ray extent of each cluster directly from the RASS
imaging data using a growth-curve analysis. The cumulative profile of the net count rate is
constructed for each system by measuring the counts in successively larger circular apertures
centered on the X-ray emission and subtracting an appropriately scaled X-ray background.
The latter is determined in an annulus from 2 to 3 h−150 Mpc around the cluster centroid.
The extent of each system is then defined as the radius at which the increase in the source
signal is less than the 1σ Poissonian noise of the net count rate.
To obtain an analytic parametrization of the spatial profile of the X-ray emitting gas
and, ultimately, the central electron density we fit a β model (Cavaliere & Fusco-Femiano
1976) convolved with the RASS point-spread function to the RASS data for each cluster
in our sample: S(r) = S0 [1 + (r/rc)2]
−3β+1/2where S(r) is the projected surface-brightness
distribution and S0, rc, and β are the central surface brightness, the core radius, and the
β parameter characterising the profile at large radii. Using the results from this model
fit to determine the gas-density profile assumes the gas to be isothermal and spherically
symmetric. In practice, additional uncertainties are introduced by the correlation between
rc and β which makes the results for both parameters sensitive to the choice of radius over
which the model is fit, and the fact that for all but the most nearby clusters the angular
resolution of the RASS allows only a very poor sampling of the surface-brightness profile
(at z > 0.2 the X-ray signal from a typical cluster is only detected in perhaps a dozen
RASS image pixels). In recognition of these limitations, we hold β fixed at the canonical
value of 2/3 (Jones & Forman, 1984). The resulting values for rc are reassuringly robust
in the sense that we find broad agreement with the empirical relationship between X-ray
luminosity and rc determined by Reiprich & Bohringer (1999). Our best-fit parameters, the
cluster luminosity and electron temperature, are used to determine central electron densities
for each cluster using Eq. (6) of Henry & Henriksen (1986) with the ICM temperature
estimated from the LX − TX relationship (White et al 1997). Other sources of error of this
parametrization, namely the deviation from a β profile at small radii due to cooling cores as
well as the steepening of the profile often observed at large radii (Vikhlinin, Forman & Jones,
1999) are unlikely to affect our results due to the poor resolution and low signal-to-noise of
3

the RASS data. Conversions between angular extents and the physical dimensions of clusters
are made using the ΛCDM concordance cosmology (ΩΛ = 0.7, h = 0.7).
In our analysis of the CMB data, we use maps from eight differencing assemblies (DA)
corresponding to the Q, V and W bands of the “foreground-cleaned” WMAP 3-year data: Q1,
Q2, V1, V2, W1,.., W4 available from the Lambda archive (http://lambda.gsfc.nasa.gov).
We do not use the K and Ka bands since foreground contamination is important at those
frequencies (Bennett et al 2003). The maps are written in the HEALPix (Gorski et al
2005) nested format with resolution Nside = 512, corresponding to pixels of 7′ on the side,
significantly larger than the 0.75′ pixels of the X-ray data, which makes our results insensitive
to deviations from spherical symmetry of the clusters in our sample. These bands correspond
to frequencies 41, 61, and 94 GHz and angular resolutions θFWHM ≃ 0.5, 0.3, and 0.2 degrees.
All maps are multiplied by the Kp0 mask to remove microwave emission from the Galactic
plane and foreground sources. The masking eliminates 120 clusters, leaving 674 clusters for
our SZ analysis. Of those, 13 clusters did not have sufficient S/N in the ROSAT data to to
define an extent and were excluded from this analysis leaving a total of 661 clusters.
3. Results.
To compute the TSZ signal from the WMAP 3-year data we evaluate the mean temper-
ature anisotropy at the cluster locations. The TSZ distortion scales as the electron density,
ne, integrated along the line-of-sight, whereas the cluster X-ray emission is ∝ n2e. Thus,
the clusters’ SZ signal should extend over an area significantly larger than the region within
which X-ray emission is detectable. We probe the SZ extent by measuring the signal in
regions of increasing radius θSZ, from 1 to 6θX, where θX is the angular extent of the re-
spective cluster in the RASS data. The results from the individual DA’s were averaged with
weights inversely proportional to the pixel noise and the frequency-dependent amplitude of
the SZ effect, and without weights. The difference between the results obtained with the
different weighting schemes are smaller than 5% and we quote results obtained using noise
and frequency-weighted averages. Error bars are calculated assigning 1,000 random pseudo-
cluster positions to the WMAP sky and computing the mean temperature anisotropy for
each cluster template. The random positions are always placed outside the Kp0 mask and
away from any of the cluster pixels.
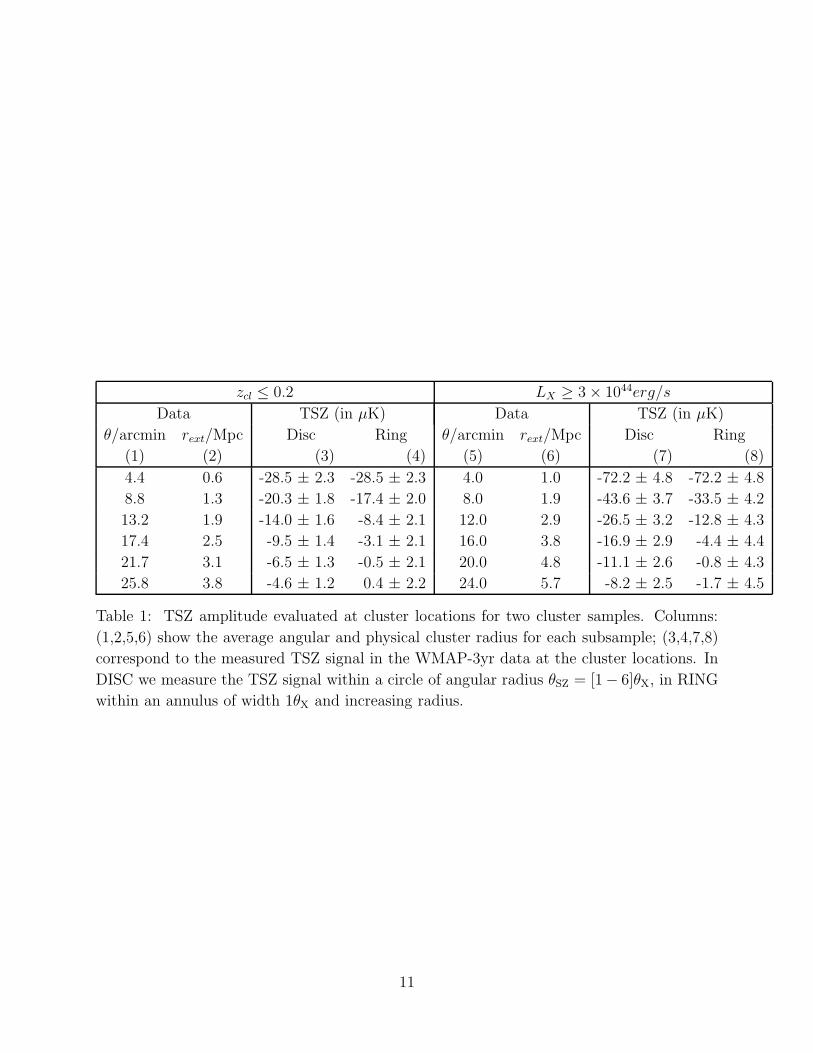
In Table 1 we present our results for two subsamples: clusters with redshift z ≤ 0.2
and clusters with luminosity LX([0.1 − 2.4]keV) ≥ 3 × 1044erg/s. The limit of z = 0.2
was chosen since this is the largest redshift out to which our cluster catalog is reasonably
complete. We use the average values of the core radii and radial cluster extent for each
4

subsample. The TSZ signal is measured within (a) a disc of angular radius θ, and (b) a
ring or annulus delimited by two consecutive discs, to differentiate the contribution coming
from regions increasingly farther away from the cluster core. By design, the first DISC and
RING regions are identical. We measure a temperature decrement at the cluster pixels at
the ∼ 15σ level for the most X-ray luminous clusters. The region from 3-4 times the X-
ray extent still shows a non-negligible contribution, while outside this region no statistically
significant signal is detected. The average radius of the regions contributing to the signal
is ≃ 2 − 3h−170 Mpc, depending on the cluster sample. The fact that clusters appear more
extended at microwave than at X-ray frequencies was used by us (Kashlinsky et al 2008) to
isolate the KSZ component arising from the cluster bulk motion; as we demonstrate below
the cluster X-ray temperature decreases towards cluster outskirts making the KSZ dipole
appear still more extended than the TSZ contributions.
In Fig. 1 we show the TSZ amplitude for different cluster subsamples and regions of
different radius. In Fig. 1a, we plot the results for clusters within a progressively increas-
ing upper redshift limit; the last data point includes all clusters. Except for the lowest
redshift bins the measured amplitude is roughly independent of the number of clusters. In
Fig. 1b we show the frequency dependence of the measured TSZ signal for all clusters with
redshift z ≤ 0.2 by comparing the result for the three bands considered: Q, V, and W.
Solid lines denote the frequency dependence of the TSZ effect with the curves normalized
by least squares regression. Note that for the smallest angular extent the TSZ signal shows
frequency spectrum which differs significantly from the TSZ expectation. Earlier analysis by
Hernandez-Monteagudo et al (2004) also did not find a clear TSZ scaling in WMAP 1st-year
data. This difference could originate due to the different angular resolution and noise levels
between the Q, V and W bands. Due to its smaller resolution, the Q channel probes the SZ
decrement to a larger extent and dilutes the central SZ amplitude more than in the V or W
bands. As we include the contribution from progressively larger radii the effect of noise and
resolution is reduced; by the time we reach θSZ = 4 − 6θX, the change in frequency at the 3
bands agrees very well with the spectral dependence of the TSZ effect. Other components
have negligible contribution. A bulk flow motion will give rise to a dipole pattern but does
not change the monopole evaluated at cluster locations. In the Rayleigh-Jeans regime, the
first correction to the TSZ frequency scaling due to the relativistic effect is 1.7(kBTX/mec2)
(see Itoh, Kohyama & Nozawa, 1998). The average temperature of all clusters in our cat-
alog is kBTX ∼ 4KeV, so the relativistic correction represents less than a 1.4% variation.
Dashed and dot-dashed lines in Fig. 1b represent the frequency dependence of the KSZ and
relativistic SZ effect, the latter computed using the approximate solution of Itoh et al (1998)
for a cluster of kBTX = 10KeV, arbitrarily normalized to the amplitude of the V-band.
The radial emission profiles derived from SZ and X-ray observations of clusters do
5

not necessarily follow the same β model. Only a handful of clusters have measured radial
SZ profiles and the parameters obtained from X-ray data are often used in SZ analysis.
Using numerical simulations, Hallman et al (2007) showed that this approach leads to biased
estimates of the integrated Compton y-parameter in the inner part of clusters. Since we
measure the TSZ contribution outside the inner cluster region, we can test for a similar bias
in the outskirts of clusters and assess the accuracy of the β model. In Fig. 2 a comparison
is made between our measured radial SZ profile (full circles, see also Table 1) and β model
predictions (diamonds). Predictions are computed with the same pipeline as the data from
the eight DA maps generated by placing clusters on the sky with their measured angular
size. To each pixel within a cluster we assign CMB temperature derived from the β model
TSZ profile, convolved with the WMAP beam for each DA. The angular scale θSZ is the area
weighted average extent of cluster.
The discrepancy between data and the β = 2/3 prediction is less than a few µK or
10−30% in the cluster centers, but increases with radius and reaches a factor of 2−3 at the
largest radius probed in our study. It could be argued that a model with β = 1 would fit the
data in the cluster outskirts. Such a high β value would not only invalidate the values of rc
and nc derived directly from the RASS X-ray data, it would in fact be inconsistent with the
shape of the X-ray surface brightness profile in the central region of essentially every cluster
ever observed. Jones and Forman (1999) found that the average cluster surface-brightness
profile is well described by a β model with rc ∼ 200Kpc and β ∼ 0.6. Out of 96 clusters
analyzed in detail, they did not find a single one for which a β value outside the range of
0.4–0.8 would provide an acceptable fit to the X-ray data.
Numerical hydrodynamic simulations suggest that the dark-matter distribution in galaxy
clusters is described by a universal density profile (Navarro, Frenk & White 1997, NFW),
ρdm(x) = ρs/[x(1 + x)2], where x = r/rs, rs and ρs are a characteristic scale radius and
density. Usually rs is given in terms of the concentration parameter c = rv/rs where rv is
the halo virial radius. This parameter depends only weakly on mass, with less massive sys-
tems being more concentrated, having larger c. While the electron density for the β = 2/3
model scales as r−2 at large radii, the NFW is much steeper, scaling as r−3. If the gas
distribution were to follow that of the dark matter, one would thus expect its radial profile
to decline much more steeply, as observed and shown in Fig. 2. Solid lines represent the
electron pressure profile of a single cluster computed using a β (upper) and a NFW model
(lower solid line), convolved with the WMAP 3-year beam. Our fits (β and NFW model
alike) assume a representative cluster redshift of z = 0.12, a value close to the mean red-
shift of both cluster subsamples. The best-fit values for the core radius of the β model are
θc = 1.5′, 0.5′ (a and b, respectively). We checked that no value of rc ∈ [0.5, 5]arcmin can
make the β model fit the measured pressure profile. To generate the NFW profile, we follow
6
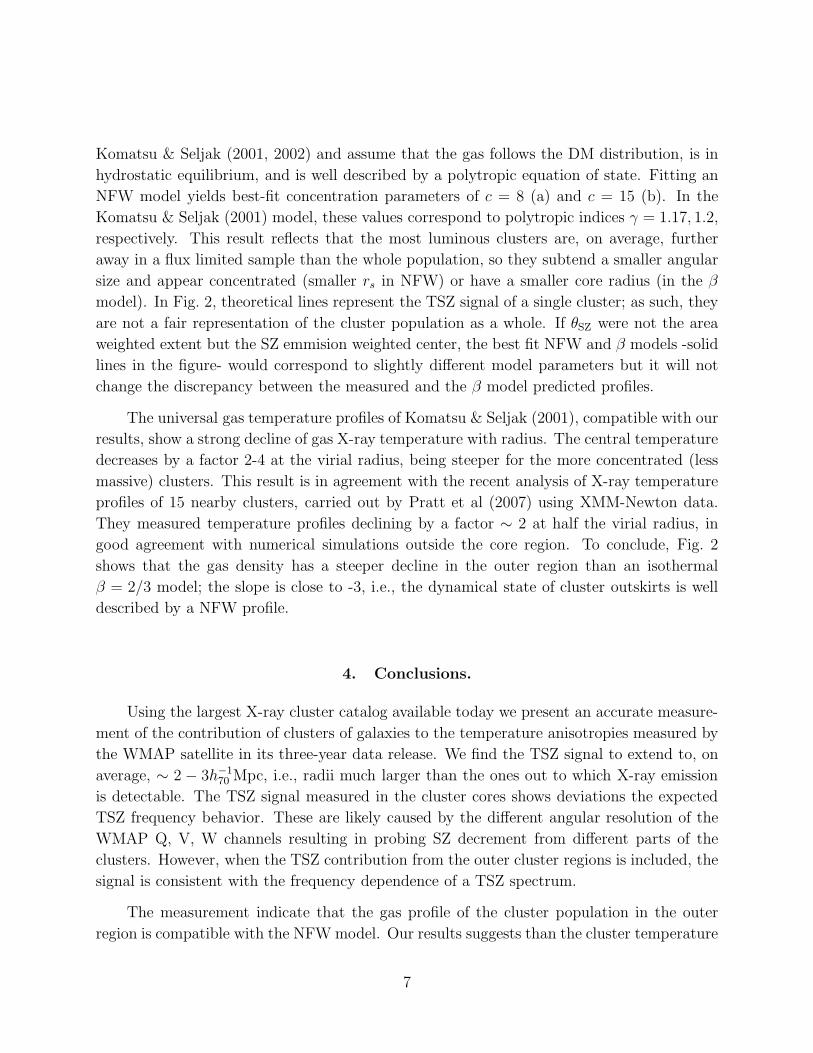
Komatsu & Seljak (2001, 2002) and assume that the gas follows the DM distribution, is in
hydrostatic equilibrium, and is well described by a polytropic equation of state. Fitting an
NFW model yields best-fit concentration parameters of c = 8 (a) and c = 15 (b). In the
Komatsu & Seljak (2001) model, these values correspond to polytropic indices γ = 1.17, 1.2,
respectively. This result reflects that the most luminous clusters are, on average, further
away in a flux limited sample than the whole population, so they subtend a smaller angular
size and appear concentrated (smaller rs in NFW) or have a smaller core radius (in the β
model). In Fig. 2, theoretical lines represent the TSZ signal of a single cluster; as such, they
are not a fair representation of the cluster population as a whole. If θSZ were not the area
weighted extent but the SZ emmision weighted center, the best fit NFW and β models -solid
lines in the figure- would correspond to slightly different model parameters but it will not
change the discrepancy between the measured and the β model predicted profiles.
The universal gas temperature profiles of Komatsu & Seljak (2001), compatible with our
results, show a strong decline of gas X-ray temperature with radius. The central temperature
decreases by a factor 2-4 at the virial radius, being steeper for the more concentrated (less
massive) clusters. This result is in agreement with the recent analysis of X-ray temperature
profiles of 15 nearby clusters, carried out by Pratt et al (2007) using XMM-Newton data.
They measured temperature profiles declining by a factor ∼ 2 at half the virial radius, in
good agreement with numerical simulations outside the core region. To conclude, Fig. 2
shows that the gas density has a steeper decline in the outer region than an isothermal
β = 2/3 model; the slope is close to -3, i.e., the dynamical state of cluster outskirts is well
described by a NFW profile.
4. Conclusions.
Using the largest X-ray cluster catalog available today we present an accurate measure-
ment of the contribution of clusters of galaxies to the temperature anisotropies measured by
the WMAP satellite in its three-year data release. We find the TSZ signal to extend to, on
average, ∼ 2 − 3h−170 Mpc, i.e., radii much larger than the ones out to which X-ray emission
is detectable. The TSZ signal measured in the cluster cores shows deviations the expected
TSZ frequency behavior. These are likely caused by the different angular resolution of the
WMAP Q, V, W channels resulting in probing SZ decrement from different parts of the
clusters. However, when the TSZ contribution from the outer cluster regions is included, the
signal is consistent with the frequency dependence of a TSZ spectrum.
The measurement indicate that the gas profile of the cluster population in the outer
region is compatible with the NFW model. Our results suggests than the cluster temperature
7

profile declines with radius, in agreement with numerical simulations of clusters and recent
XMM data. We are currently rederiving the NFW data parameters from the X-ray images to
compare the TSZ predicted for the cluster population using X-ray derived quantities with the
signal at WMAP frequencies. The radial profile of the measured TSZ signal suggests that, all
the way to the cluster outskirts, baryons are settled in hydrostatic equilibrium within the DM
potential well and follow the same density distribution. As shown by numerical simulations,
the profile of collapsed dark matter haloes is a direct consequence of the Newtonian gravity
with a suitably chosen initial density field (corresponding to the concordance ΛCDM model).
Hence our results also provide further, albeit indirect, evidence for the existence of dark
matter and the validity of the Newtonian dynamics.
This work is supported by the Ministerio de Educacion y Ciencia and the ”Junta de
Castilla y Leon” in Spain (FIS2006-05319, PR2005-0359 and SA010C05) and by NASA ADP
grant NNG04G089G. We thank Gary Hinshaw for useful information regarding the WMAP
data specifics. FAB thanks the University of Pennsylvania for its hospitality when part of
this work was carried out.
REFERENCES
Afshordi, N., Lin, Y.-T. & Sanderson, A.J.R. (2005), ApJ, 629, 1
Afshordi, N., Lin, Y.-T., Nagai, D. & Sanderson, A.J.R. (2007) MNRAS, 378, 293
Atrio-Barandela, F. & Mucket, J. (1999) ApJ 515, 465
Bennett, C. et al (2003) Ap.J. Suppl., 148,1
Birkinshaw, M. (1998) Physics Reports, 310, 97
Bohringer, H. et al. (2004) A&A, 425, 367
Carlstrom, J.E., Holder, G.P., Reese, E.D. (2002) ARAA, 40, 643
Cavaliere, A. & Fusco-Femiano, R. (1976) A&A, 49, 137
Ebeling, H., Edge, A.C., Bohringer, H., Allen, S.W., Crawford, C.S., Fabian, A.C., Voges,
W. & Huchra, J.P. (1998) MNRAS, 301, 881
Ebeling, H., Edge, A.C., Allen, S.W., Crawford, C.S., Fabian, A.C. & Huchra, J.P. (2000)
MNRAS, 318, 333
8

Ebeling, H., Mullis, C.R. & Tully, R.B. (2002) ApJ, 580, 774
Hallman, E.J., Burns, J.O., Motl, P.M., Norman, M.L. (2007). Preprint arXiv:075.0531
Gorski, K. et al 2005, Ap.J., 622, 759
Henry & Henriksen (1986) ApJ 301, 689
Hernandez-Monteagudo, C. & Rubino-Martın, J.A. (2004) MNRAS, 347, 403
Hernandez-Monteagudo, C., Genova-Santos, R., Atrio-Barandela, F. (2004) 613, L89
Itoh, N., Kohyama, Y. & Nozawa, S. (1998) ApJ, 502, 7
Jones, C., Forman, W. (1984) ApJ 276, 38
Jones, C., Forman, W. (1999) ApJ 511, 65
Kashlinsky, A. & Atrio-Barandela, F. 2000, Ap.J., 536, L67
Kashlinsky, A., Atrio-Barandela, F., Kocevski, D. & Ebeling, H. (2007) Nature, submitted.
Kocevski, D.D. & Ebeling, H. (2006) ApJ, 645, 1043
Kocevski, D.D., Ebeling, H., Mullis, C.R. & Tully, R.B. (2007) ApJ 662, 224
Komatsu, E. & Seljak, U. (2001) MNRAS, 327, 1353
Komatsu, E. & Seljak, U. (2002) MNRAS, 336, 1256
LaRoque, S.J., Bonamente, M., Carlstrom, J.E., Joy, M.K., Nagai, D., Reese, E.D., Dawson,
K.S. (2006)(2006) ApJ, 652, 917
Monlar, S.M. & Birkinshaw, M. (2000) ApJ 537, 542
Myers, A.D., Shanks, T., Outram, P.J., Frith, W.J. & Wolfendale, A.W. (2004) MNRAS
347, L67
Navarro, J.F., Frenk, C.S. & White, S.D.M. (1997) ApJ, 490, 493
Pratt,G.W., Boehringer, H., Croston, J.H., Arnaud, M., Borgani, S., Finoguenov, A., Tem-
ple, R.F. (20079 A& A, 461, 71
Reiprich, T.H. & Bohringer, H. (1999) AN, 320, 296
Spergel, D. et al (2007) ApJS 170, 377
9

Sunyaev, R.A. & Zel’dovich, Ya. B. 1972, Comments Astrophys. Space Phys., 4, 173
Vikhlinin, A., Forman, W. & Jones, C. (1999) ApJ, 525, 47
Voges, W. et al. (1999) A&AS, 349, 389
White, D.A., Jones, C., Forman, W. (1997) MNRAS, 292, 419
Wright, E.L. (1979) ApJ, 232, 348
This preprint was prepared with the AAS LATEX macros v5.2.
10
zcl ≤ 0.2 LX ≥ 3 × 1044erg/s
Data TSZ (in µK) Data TSZ (in µK)
θ/arcmin rext/Mpc Disc Ring θ/arcmin rext/Mpc Disc Ring
(1) (2) (3) (4) (5) (6) (7) (8)
4.4 0.6 -28.5 ± 2.3 -28.5 ± 2.3 4.0 1.0 -72.2 ± 4.8 -72.2 ± 4.8
8.8 1.3 -20.3 ± 1.8 -17.4 ± 2.0 8.0 1.9 -43.6 ± 3.7 -33.5 ± 4.2
13.2 1.9 -14.0 ± 1.6 -8.4 ± 2.1 12.0 2.9 -26.5 ± 3.2 -12.8 ± 4.3
17.4 2.5 -9.5 ± 1.4 -3.1 ± 2.1 16.0 3.8 -16.9 ± 2.9 -4.4 ± 4.4
21.7 3.1 -6.5 ± 1.3 -0.5 ± 2.1 20.0 4.8 -11.1 ± 2.6 -0.8 ± 4.3
25.8 3.8 -4.6 ± 1.2 0.4 ± 2.2 24.0 5.7 -8.2 ± 2.5 -1.7 ± 4.5
Table 1: TSZ amplitude evaluated at cluster locations for two cluster samples. Columns:
(1,2,5,6) show the average angular and physical cluster radius for each subsample; (3,4,7,8)
correspond to the measured TSZ signal in the WMAP-3yr data at the cluster locations. In
DISC we measure the TSZ signal within a circle of angular radius θSZ = [1− 6]θX, in RING
within an annulus of width 1θX and increasing radius.
11

Fig. 1.— (a) TSZ signal in WMAP 3-year data for cluster subsamples with redshift z ≤
[0.04, 0.08, 0.12, 0.16, 0.2, 0.3]. Close and open circles, squares and diamonds correspond to
clusters with different angular extent. From top to bottom, the average was taken from
clusters with total extent θSZ = (1 − 4) × θX. (b) TSZ emission vs frequency is shown
for different θSZ for: Q (squares), V (circles) and W (diamonds) bands and clusters with
z ≤ 0.2. Solid lines show the frequency dependence of the TSZ effect. From top to bottom
θSZ = (1, 2, 4, 6)×θX. In all cases, vertical bars indicate the 1σ errors. Curves were normalized
by least squares regression. Dashed and dot-dashed lines show the frequency dependence of
the KSZ and Relativistic SZ effects, respectively, normalized to the amplitude measured at
the V-band.
12

Fig. 2.— Measured and predicted electron pressure profile vs angular cluster-centric radius.
Full circles and open diamonds correspond to the measured profile and the profile predicted
for isothermal β = 2/3 model, respectively. Solid lines correspond to the β model (upper)
and the NFW model fit (lower) assuming a single cluster at z = 0.12. We show results for
two cluster subsamples: (a) z ≤ 0.2, (b) Lx[0.1− 2.4KeV ] ≥ 3× 1044 ergs−1. In (a) the best
fit corresponds to c = 8 and rs = 350h−1kpc and in (b) to c = 15 and rs = 250h−1kpc.
13
Copyright © 2022 FDOKUMEN