Proliferation-dependent and cell cycle-regulated transcription of mouse pericentric heterochromatin
12
THE JOURNAL OF CELL BIOLOGY JCB JCB: CORRECTION Proliferation-dependent and cell cycle–regulated transcription of mouse pericentric heterochromatin Junjie Lu and David M. Gilbert Vol. 179 No. 3, November 5, 2007. Pages 411–421. After publication of this manuscript, an error was found in Fig 2 D. The DAPI photos for patterns III and IV are switched in the published version. A corrected Fig. 2 D is provided here. The authors thank J. Huberman for notifying us of this error. We apologize for this oversight. (D) Six spatial patterns of DNA synthesis can be distinguished in mouse fibroblasts representing different stages of S phase, as previously described in detail (Wu et al., 2005). DNA is stained with DAPI, and sites of DNA synthesis are visualized by indirect immunofluorescence with an antibody specific to BrdU-substituted DNA. Images have been deconvolved and a merge of the BrdU and DAPI staining patterns is shown to illustrate the two stages during which cells are engaged in the replication of chromocenters, used to score satellite replication in C and Fig. 3. A schematic of the length of time that C127 cells spend in each stage of S phase is given at the bottom (adapted from Wu et al., 2006a). Experiments were repeated for three independent synchronizations. At least 150 cells were counted for each time point. Bars, 5 μm. on June 4, 2016 jcb.rupress.org Downloaded from Published November 5, 2007 on June 4, 2016 jcb.rupress.org Downloaded from Published November 5, 2007 on June 4, 2016 jcb.rupress.org Downloaded from Published November 5, 2007 on June 4, 2016 jcb.rupress.org Downloaded from Published November 5, 2007 on June 4, 2016 jcb.rupress.org Downloaded from Published November 5, 2007 on June 4, 2016 jcb.rupress.org Downloaded from Published November 5, 2007 on June 4, 2016 jcb.rupress.org Downloaded from Published November 5, 2007 on June 4, 2016 jcb.rupress.org Downloaded from Published November 5, 2007 on June 4, 2016 jcb.rupress.org Downloaded from Published November 5, 2007 on June 4, 2016 jcb.rupress.org Downloaded from Published November 5, 2007 on June 4, 2016 jcb.rupress.org Downloaded from Published November 5, 2007 on June 4, 2016 jcb.rupress.org Downloaded from Published November 5, 2007 on June 4, 2016 jcb.rupress.org Downloaded from Published November 5, 2007
-
Upload
independent -
Category
Documents
-
view
2 -
download
0
Transcript of Proliferation-dependent and cell cycle-regulated transcription of mouse pericentric heterochromatin

TH
EJ
OU
RN
AL
OF
CE
LL
BIO
LO
GY
JCB
JCB: CORRECTION
Proliferation-dependent and cell cycle–regulated transcription of mouse pericentric heterochromatin
Junjie Lu and David M. Gilbert
Vol. 179 No. 3, November 5, 2007. Pages 411–421 .
After publication of this manuscript, an error was found in Fig 2 D. The DAPI photos for patterns III and IV are
switched in the published version. A corrected Fig. 2 D is provided here. The authors thank J. Huberman for notifying
us of this error. We apologize for this oversight.
(D) Six spatial patterns of DNA synthesis can be distinguished in mouse fi broblasts representing different stages of S phase, as previously described in detail (Wu et al., 2005). DNA is stained with DAPI, and sites of DNA synthesis are visualized by indirect immunofl uorescence with an antibody specifi c to BrdU-substituted DNA. Images have been deconvolved and a merge of the BrdU and DAPI staining patterns is shown to illustrate the two stages during which cells are engaged in the replication of chromocenters, used to score � satellite replication in C and Fig. 3. A schematic of the length of time that C127 cells spend in each stage of S phase is given at the bottom (adapted from Wu et al., 2006a). Experiments were repeated for three independent synchronizations. At least 150 cells were counted for each time point. Bars, 5 μm.
on June 4, 2016jcb.rupress.org
Dow
nloaded from
Published November 5, 2007 on June 4, 2016
jcb.rupress.orgD
ownloaded from
Published November 5, 2007
on June 4, 2016jcb.rupress.org
Dow
nloaded from
Published November 5, 2007 on June 4, 2016
jcb.rupress.orgD
ownloaded from
Published November 5, 2007
on June 4, 2016jcb.rupress.org
Dow
nloaded from
Published November 5, 2007 on June 4, 2016
jcb.rupress.orgD
ownloaded from
Published November 5, 2007
on June 4, 2016jcb.rupress.org
Dow
nloaded from
Published November 5, 2007 on June 4, 2016
jcb.rupress.orgD
ownloaded from
Published November 5, 2007
on June 4, 2016jcb.rupress.org
Dow
nloaded from
Published November 5, 2007 on June 4, 2016
jcb.rupress.orgD
ownloaded from
Published November 5, 2007
on June 4, 2016jcb.rupress.org
Dow
nloaded from
Published November 5, 2007 on June 4, 2016
jcb.rupress.orgD
ownloaded from
Published November 5, 2007
on June 4, 2016jcb.rupress.org
Dow
nloaded from
Published November 5, 2007

TH
EJ
OU
RN
AL
OF
CE
LL
BIO
LO
GY
JCB: ARTICLE
© The Rockefeller University Press $30.00The Journal of Cell Biology, Vol. 179, No. 3, November 5, 2007 411–421http://www.jcb.org/cgi/doi/10.1083/jcb.200706176
JCB 411
IntroductionThe centromeres of eukaryotic chromosomes are fl anked by
pericentric heterochromatin that is highly variable between spe-
cies in size and repetitive DNA sequence composition but
remarkably conserved in chromatin protein composition and
structure from fi ssion yeast to humans (Huisinga et al., 2006).
Pericentric heterochromatin structure is essential for accurate
chromosome segregation during mitosis (Peters et al., 2001;
Pidoux and Allshire, 2004) and is similar in composition to con-
stitutive heterochromatin found at other chromosome regions
that also contain repetitive sequences and transposable ele-
ments, where it functions to silence transcription, reduce the
frequency of recombination, and promote long-range chromatin
interactions (Jia et al., 2004; Grewal and Elgin, 2007). Hetero-
chromatin is composed of regular tightly packed arrays of hypo-
acetylated nucleosomes that are methylated at lysine 9 of
histone H3 (MeK9H3), mediated by the Su(VAR)3-9 histone
methyltransferases (Clr4 in fission yeast and Suv39h1,2 in
mammals). MeK9H3 recruits the heterochromatin protein 1
(HP1) family of proteins (Swi6 in fi ssion yeast), which in turn
recruit Su(VAR)3-9 as part of a complex self-reinforcing
network of proteins that are enriched at heterochromatic loci
(Huisinga et al., 2006; Grewal and Elgin, 2007; Grewal and Jia,
2007). Although species-specifi c differences exist for some
components of this network, the overall conservation of hetero-
chromatin structure and function suggests that detailed mecha-
nistic insights gained from experiments in fi ssion yeast and fl ies
will also apply to mammals.
Paradoxically, although constitutive heterochromatin fun-
ctions to silence transcription, in fi ssion yeast it has been shown
that transcription from within pericentric heterochromatin is
required for the formation and maintenance of heterochromatin
and for sister chromatid cohesion (Kato et al., 2005; Grewal
and Jia, 2007). Transcripts generated by RNA polymerase II
are processed into siRNA that is in turn recognized by
an RNAi-induced transcriptional silencing complex that is
recruited to and required for heterochromatin assembly and
gene silencing (Huisinga et al., 2006; Grewal and Elgin, 2007;
Grewal and Jia, 2007). The RNAi pathway is also required for
the formation of heterochromatin and silencing of repetitive se-
quences in Drosophila melanogaster (Grewal and Elgin, 2007).
In mammalian cells, an unidentifi ed RNA component is re-
quired for the association of HP1 with pericentric heterochro-
matin (Maison et al., 2002; Muchardt et al., 2002). However,
mammalian homologues to certain key components of the fi s-
sion yeast transcription–mediated gene silencing network have
Proliferation-dependent and cell cycle–regulated transcription of mouse pericentric heterochromatin
Junjie Lu and David M. Gilbert
Department of Biological Science, Florida State University, Tallahassee, FL 32306
Pericentric heterochromatin transcription has been
implicated in Schizosaccharomyces pombe hetero-
chromatin assembly and maintenance. However, in
mammalian systems, evidence for such transcription is
inconsistent. We identify two populations of RNA poly-
merase II –dependent mouse γ satellite repeat sequence–
derived transcripts from pericentric heterochromatin that
accumulate at different times during the cell cycle. A small
RNA species was synthesized exclusively during mitosis
and rapidly eliminated during mitotic exit. A more abun-
dant population of large, heterogeneous transcripts was
induced late in G1 phase and their synthesis decreased
during mid S phase, which is coincident with pericentric
heterochromatin replication. In cells that lack the Suv39h1,2
methyltransferases responsible for H3K9 trimethylation,
transcription occurs from more sites but is still cell cycle
regulated. Transcription is not detected in quiescent cells
and induction during G1 phase is sensitive to serum
deprivation or the cyclin-dependent kinase inhibitor
roscovatine. We demonstrate that mammalian peri-
centric heterochromatin transcription is linked to cellular
proliferation. Our data also provide an explanation for
inconsistencies in the detection of such transcripts in dif-
ferent systems.
Correspondence to D.M. Gilbert: [email protected]
Abbreviations used in this paper: DRB, 5,6-dichloro-1-β-D-ribofuranosylbenz-imidazole; HP, heterochromatin protein; MEF, mouse embryonic fi broblast; PCNA, proliferating cell nuclear antigen; WT, wild type.

JCB • VOLUME 179 • NUMBER 3 • 2007 412
not been identifi ed (Huisinga et al., 2006; Zaratiegui et al.,
2007). Moreover, attempts to detect transcription from mam-
malian pericentric heterochromatin have met with varied levels
of success, with discrepancies found both in the ability to detect
such transcripts and the sizes of any transcripts detected (Harel
et al., 1968; Flamm et al., 1969; Cohen et al., 1973; Maio and
Kurnit, 1974; Gaubatz and Cutler, 1990; Rudert et al., 1995;
Lehnertz et al., 2003; Rizzi et al., 2004; Cobb et al., 2005;
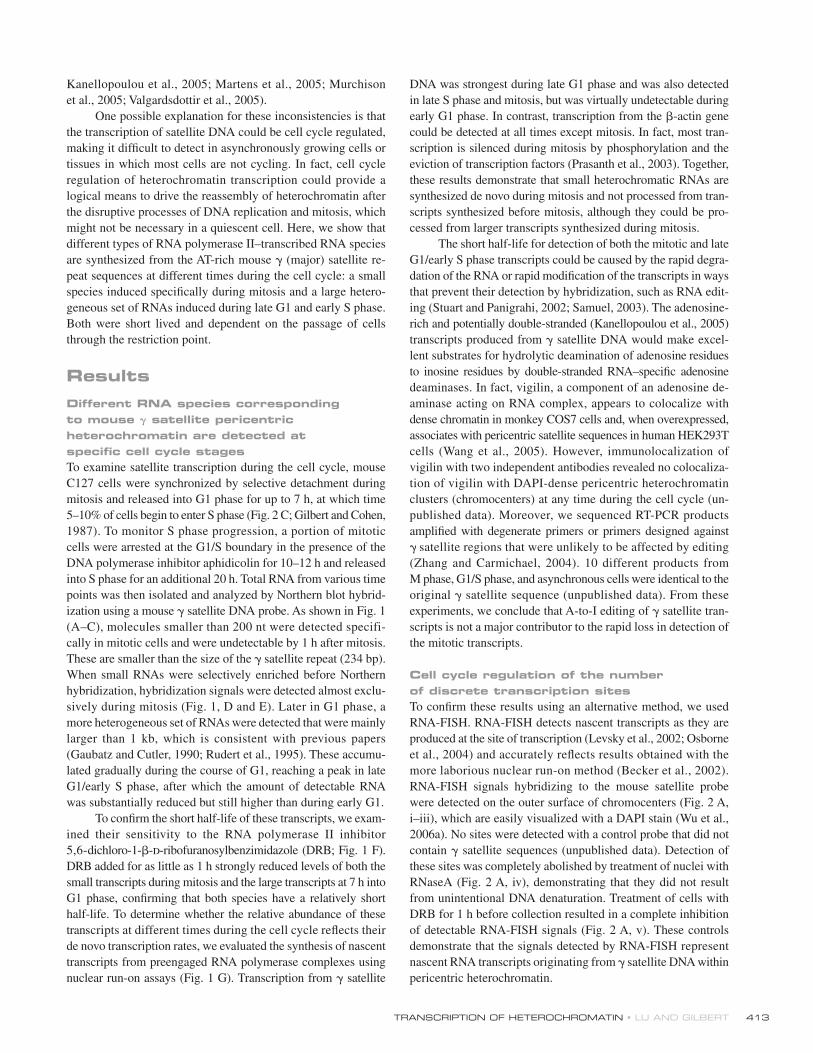
Figure 1. Northern analysis of 𝛄 sat-ellite transcripts during the cell cycle. (A) Mouse C127 cells were synchro-nized by mitotic selection and released into G1 phase. One group of cells was collected at hourly intervals thereafter, and a second group was treated with 10 μg/ml aphidicolin at G1-5 h for 10–12 h and released into S phase for 20 h. Cells were collected at the indicated time points. Total RNA was isolated and subjected to Northern hy-bridization using a γ satellite probe (see Materials and methods). 18S ribo-somal RNA is shown at the bottom as loading control. (B) Densitometric traces of signal intensities for each lane in A after background subtraction. The positions of 18 and 28S ribosomal RNA are shown in the G1-5 lane. (C) Quantifi cation of the total inten-sity of hybridization signal per lane for each sample in A. Similar results were obtained in three independent synchronization experiments. (D) Small RNA (<200 nt) was isolated from aliquots of the same cell populations and subjected to PAGE and Northern analysis using the same probe as in A. (E) Quantifi cation of the total hybridiza-tion of the small RNA signals, as in C. Similar results were obtained in two in-dependent experiments. (F) M phase (M) or G1-7 h cells were collected with or without prior DRB treatment (1 h), and Northern hybridization was performed as in A. (G) Nuclear run-on analysis of transcription. Labeled nascent RNA from nuclear run-on reactions with per-meabilized cells synchronized at mito-sis, G1-3 h, G1-7 h, and S-7 h were hybridized to the same major satellite plasmid (γ-sat.) used as a probe in A–F. The corresponding empty plasmid vector (vect.) was used as a negative control. Plasmids were immobilized on nylon fi lters using a slot blot at quanti-ties of 1, 2, 4, and 8 μg per slot as in-dicated. As a positive control, 2 μg of a purifi ed PCR product corresponding to the mouse β-actin gene was also hy-bridized with the same labeled nascent RNA. Similar results were obtained in two independent experiments.
TRANSCRIPTION OF HETEROCHROMATIN • LU AND GILBERT 413
Kanellopoulou et al., 2005; Martens et al., 2005; Murchison
et al., 2005; Valgardsdottir et al., 2005).
One possible explanation for these inconsistencies is that
the transcription of satellite DNA could be cell cycle regulated,
making it diffi cult to detect in asynchronously growing cells or
tissues in which most cells are not cycling. In fact, cell cycle
regulation of heterochromatin transcription could provide a
logical means to drive the reassembly of heterochromatin after
the disruptive processes of DNA replication and mitosis, which
might not be necessary in a quiescent cell. Here, we show that
different types of RNA polymerase II–transcribed RNA species
are synthesized from the AT-rich mouse γ (major) satellite re-
peat sequences at different times during the cell cycle: a small
species induced specifi cally during mitosis and a large hetero-
geneous set of RNAs induced during late G1 and early S phase.
Both were short lived and dependent on the passage of cells
through the restriction point.
ResultsDifferent RNA species corresponding to mouse 𝛄 satellite pericentric heterochromatin are detected at specifi c cell cycle stagesTo examine satellite transcription during the cell cycle, mouse
C127 cells were synchronized by selective detachment during
mitosis and released into G1 phase for up to 7 h, at which time
5–10% of cells begin to enter S phase (Fig. 2 C; Gilbert and Cohen,
1987). To monitor S phase progression, a portion of mitotic
cells were arrested at the G1/S boundary in the presence of the
DNA polymerase inhibitor aphidicolin for 10–12 h and released
into S phase for an additional 20 h. Total RNA from various time
points was then isolated and analyzed by Northern blot hybrid-
ization using a mouse γ satellite DNA probe. As shown in Fig. 1
(A–C), molecules smaller than 200 nt were detected specifi-
cally in mitotic cells and were undetectable by 1 h after mitosis.
These are smaller than the size of the γ satellite repeat (234 bp).
When small RNAs were selectively enriched before Northern
hybridization, hybridization signals were detected almost exclu-
sively during mitosis (Fig. 1, D and E). Later in G1 phase, a
more heterogeneous set of RNAs were detected that were mainly
larger than 1 kb, which is consistent with previous papers
(Gaubatz and Cutler, 1990; Rudert et al., 1995). These accumu-
lated gradually during the course of G1, reaching a peak in late
G1/early S phase, after which the amount of detectable RNA
was substantially reduced but still higher than during early G1.
To confi rm the short half-life of these transcripts, we exam-
ined their sensitivity to the RNA polymerase II inhibitor
5,6-dichloro-1-β-d-ribofuranosylbenzimidazole (DRB; Fig. 1 F).
DRB added for as little as 1 h strongly reduced levels of both the
small transcripts during mitosis and the large transcripts at 7 h into
G1 phase, confi rming that both species have a relatively short
half-life. To determine whether the relative abundance of these
transcripts at different times during the cell cycle refl ects their
de novo transcription rates, we evaluated the synthesis of nascent
transcripts from preengaged RNA polymerase complexes using
nuclear run-on assays (Fig. 1 G). Transcription from γ satellite
DNA was strongest during late G1 phase and was also detected
in late S phase and mitosis, but was virtually undetectable during
early G1 phase. In contrast, transcription from the β-actin gene
could be detected at all times except mitosis. In fact, most tran-
scription is silenced during mitosis by phosphorylation and the
eviction of transcription factors (Prasanth et al., 2003). Together,
these results demonstrate that small heterochromatic RNAs are
synthesized de novo during mitosis and not processed from tran-
scripts synthesized before mitosis, although they could be pro-
cessed from larger transcripts synthesized during mitosis.
The short half-life for detection of both the mitotic and late
G1/early S phase transcripts could be caused by the rapid degra-
dation of the RNA or rapid modifi cation of the transcripts in ways
that prevent their detection by hybridization, such as RNA edit-
ing (Stuart and Panigrahi, 2002; Samuel, 2003). The adenosine-
rich and potentially double-stranded (Kanellopoulou et al., 2005)
transcripts produced from γ satellite DNA would make excel-
lent substrates for hydrolytic deamination of adeno sine residues
to inosine residues by double-stranded RNA–specifi c adenosine
deaminases. In fact, vigilin, a component of an adenosine de-
aminase acting on RNA complex, appears to colocalize with
dense chromatin in monkey COS7 cells and, when overexpressed,
associates with pericentric satellite sequences in human HEK293T
cells (Wang et al., 2005). However, immunolocalization of
vigilin with two independent antibodies revealed no colocaliza-
tion of vigilin with DAPI-dense pericentric heterochromatin
clusters (chromocenters) at any time during the cell cycle (un-
published data). Moreover, we sequenced RT-PCR products
amplifi ed with degenerate primers or primers designed against
γ satellite regions that were unlikely to be affected by editing
(Zhang and Carmichael, 2004). 10 different products from
M phase, G1/S phase, and asynchronous cells were identical to the
original γ satellite sequence (unpublished data). From these
experiments, we conclude that A-to-I editing of γ satellite tran-
scripts is not a major contributor to the rapid loss in detection of
the mitotic transcripts.
Cell cycle regulation of the number of discrete transcription sitesTo confi rm these results using an alternative method, we used
RNA-FISH. RNA-FISH detects nascent transcripts as they are
produced at the site of transcription (Levsky et al., 2002; Osborne
et al., 2004) and accurately refl ects results obtained with the
more laborious nuclear run-on method (Becker et al., 2002).
RNA-FISH signals hybridizing to the mouse satellite probe
were detected on the outer surface of chromocenters (Fig. 2 A,
i–iii), which are easily visualized with a DAPI stain (Wu et al.,
2006a). No sites were detected with a control probe that did not
contain γ satellite sequences (unpublished data). Detection of
these sites was completely abolished by treatment of nuclei with
RNaseA (Fig. 2 A, iv), demonstrating that they did not result
from unintentional DNA denaturation. Treatment of cells with
DRB for 1 h before collection resulted in a complete inhibition
of detectable RNA-FISH signals (Fig. 2 A, v). These controls
demonstrate that the signals detected by RNA-FISH represent
nascent RNA transcripts originating from γ satellite DNA within
pericentric heterochromatin.

JCB • VOLUME 179 • NUMBER 3 • 2007 414
The number of transcription sites detected per cell was
highly heterogeneous, ranging from 0 to >15. Hence, we quan-
tifi ed both the percentage of positive cells as well as the number
of transcription sites per cell at each cell cycle stage (Fig. 2 B).
During mitosis (Fig. 2 B; M, metaphase; P/M, prophase and
metaphase), �90% of cells had one to three sites of transcrip-
tion. This could be an underestimate because the signal intensity
per site was weaker in mitotic cells (relative to later times in the
cell cycle), possibly caused by the small size of the RNA during
mitosis (Fig. 1). The percentage of positive cells dropped con-
siderably during mitotic exit (Fig. 2 B; A/T, anaphase and telo-
phase), and by early G1 phase, <10% of cells displayed one to
four intermediate intensity transcription sites, which is consis-
tent with the lack of detectable transcripts by Northern analysis
(Fig. 1). The percentage of positive cells, the number of tran-
scription sites per cell, and the intensity of each site all increased
in late G1 and early S phase, followed by a dramatic drop by 4 h
in S phase, with only �15% cells showing a strong FISH signal.
As cells progressed toward the end of S phase, the number of
positive cells began to increase again, but with fewer numbers
of sites per cell, indicating that a low level of de novo transcrip-
tion continues into late S phase. The variable increase in detect-
able sites per cell at 20 h may represent entry of cells into the
subsequent cell cycle.
To simplify the distinction between high and low levels of
transcription, we estimated the number of cells carrying out the
late G1/early S phase mode of satellite DNA transcription by
quantifying cells that have an early S phase number of detect-
able transcription foci (fi ve or greater). This plot (Fig. 2 C, pink)
resembles the Northern quantifi cation shown in Fig. 1 C. To moni-
tor the progression of these cells through S phase, cells were
labeled with BrdU just before collection for RNA-FISH, and
aliquots were stained with anti-BrdU antibodies (and DAPI).
These results revealed that transcriptional induction clearly
occurred before the onset of S phase and was down-regulated
during mid S phase (Fig. 2 C, yellow).
We have previously shown that replication of mouse
chromo centers takes place during mid S phase (Wu et al., 2006a),
close to the time at which satellite DNA transcription decreases.
Cells engaged in chromocenter replication can be easily scored
because of the prominent intranuclear appearance of the DAPI-
stained chromocenters (Fig. 2 D). Replication begins at the
periphery of the chromocenters (Fig. 2 D, III) followed by a period
during which virtually all DNA synthesis in the cell consists of
chromocenter replication (IV; Guenatri et al., 2004; Wu et al.,
2006a). When the percentage of BrdU-positive cells engaged in
the replication of chromocenters (Fig. 2 D, III and IV) was
quantifi ed in the same cell populations used for Fig. 2 C (yellow),
a sharp increase in their number was seen within the same 4-h
period as the decrease in transcription of γ satellite DNA within
the chromocenters (Fig. 2 C, blue).
Down-regulation of 𝛄 satellite transcription is coincident with replication of pericentric heterochromatinThe results in Fig. 2 C suggest that γ satellite transcription may
be down-regulated upon chromocenter replication. To investigate
this possibility, we repeated the experiments shown in Fig. 2
with more precise S phase time points, starting from the G1/S
border through 7 h into S phase. These results (Fig. 3, A and B)
revealed a sharp decrease in the percentage of cells positive for
transcription between 3 and 4 h, which coincides with a sharp
increase in cells replicating chromocenters. However, there were
two concerns with these BrdU/RNA-FISH experiments. First,
because the denaturation step necessary to reveal BrdU incorpora-
tion is incompatible with RNA-FISH detection, it was necessary
to quantify each property in separate cell samples. Second, we
wanted to rule out the possibility that the cell-synchronizing
agent aphidicolin may have affected the results. Hence, to
visualize replication of pericentric heterochromatin and tran -
s cription of satellite RNA simultaneously within individual
asynchronously growing cells, we combined RNA-FISH with
immunolocalization of the replication fork protein proliferating
cell nuclear antigen (PCNA). After elimination of the soluble pool
of PCNA that is not engaged in DNA synthesis (Dimitrova and
Gilbert, 2000), PCNA staining patterns resembled BrdU pat-
terns throughout S phase (Fig. 3 C), as was expected (Leonhardt
et al., 2000). Hence, cells in G1 phase could be identifi ed by
their small, PCNA-negative nuclei, cells at different stages of
S phase could be identifi ed by their PCNA staining pattern
(Fig. 3 C, I–VI), and cells in G2 phase could be identifi ed as
large PCNA-negative cells. PCNA and RNA-FISH signals did
not colocalize throughout almost the entire duration of S phase
(Fig. 3 C), with the exception of 16% of cells in very late S phase
(VI), for reasons that are not understood.
As shown in Fig. 3 (D and E), transcription of γ satellite
is considerably higher in early S phase and decreases starting
with the onset of chromocenter replication (III). Moreover, the
percentage of cells with more than fi ve sites of γ satellite tran-
scription increases from G1 to early S phase and then decreases
at the time of chromocenter replication. These results confi rm a
general incompatibility between γ satellite transcription and
replication during S phase, similar to what has been observed
for individual sites of replication and transcription throughout
S phase (Wei et al., 1998). It is possible that the reduction in tran-
scription is exclusively caused by interference of replication
with transcription. However, only a subset of pericentric regions
are engaged in replication at any particular moment in time
(Wu et al., 2006a), so it is unlikely that replication is simultane-
ously interfering with transcription of all pericentric regions.
Cell cycle regulation of 𝛄 satellite RNA is independent of Suv39h1,2-dependent epigenetic modifi cationsSuv39h1,2 is responsible for the trimethylation of lysine 9 of
histone H3 (Me3K9H3) at pericentric heterochromatin in mice
(Peters et al., 2001). In Suv39h1,2 double knockout mouse
embryonic fi broblast (MEF) cells, Me3K9H3 is lost, HP1 dissoci-
ates, DNA methylation is drastically reduced, and the trimethyl-
ation of histone H4 lysine 20 (Me3K20H4) is lost (Peters et al.,
2001; Lehnertz et al., 2003; Schotta et al., 2004; Kourmouli et al.,
2005). These cells show karyotypic instability and elevated steady-
state levels of γ satellite transcripts (Peters et al., 2001). Because
these prior experiments were performed on asynchronously

TRANSCRIPTION OF HETEROCHROMATIN • LU AND GILBERT 415
growing cells, the accumulation of γ satellite transcripts could have
resulted either from elevated transcription rates or a disruption
of cell cycle regulation resulting in transcription throughout the
entire cell cycle.
To distinguish between these possibilities, we performed
PCNA/RNA-FISH staining in wild-type (WT) versus Suv39h1,2
double knockout (D15) MEFs, as described in Fig. 3. Although
D15 had a substantially higher percentage of cells transcribing
γ satellite DNA from considerably more sites than WT cells,
both cell lines showed an increase in transcription transitioning
from G1 to early S phase and a decline in transcription upon
replication of chromocenters (Fig. 4 A), which is similar to
Figure 2. RNA-FISH analysis of 𝛄 satellite transcription during the cell cycle. Aliquots of cells from Fig. 1 were subjected to RNA-FISH analysis with a γ sat-ellite probe as described in Materials and methods. (A) Single z-section images of hybridized nuclei (spots that do not appear to overlap DAPI are above or below chromocenters in another plane). DNA (DAPI), blue; RNA-FISH, green. Control hybridizations were performed after treatment of early S phase nu-clei with RNase A (iv) or treatment of cells for 1 h with DRB (v). No FISH signals were detected in any cells from either of these controls. (B) Quantifi cation of the percentage of cells with any detectable RNA-FISH signal and the range (lowest to highest) in the number of transcription sites (RNA-FISH foci) per nu-cleus. Because M phase cells had been briefl y treated (4 h) with nocodazole before mitotic shakeoff, we separately evaluated the presence of RNA-FISH foci during mitosis in asynchronously growing cell populations and quantifi ed their presence in cells that were clearly in prophase or metaphase (P/M) ver-sus anaphase or telophase (A/T). (C) The percentage of cells from B with at least fi ve RNA-FISH foci per cell is plotted. Aliquots of these same cells were pulse labeled with BrdU and stained with anti-BrdU antibodies (and DAPI) to determine the percentage of cells in S phase (BrdU positive). Using the spatial patterns of BrdU labeling from these cells, as shown in D, we calculated the percentage of S phase (BrdU positive) cells that are engaged in replicating chromocenters, which contain γ satellite DNA. (D) Six spatial patterns of DNA synthesis can be distinguished in mouse fi broblasts representing different stages of S phase, as previously described in detail (Wu et al., 2005). DNA is stained with DAPI, and sites of DNA synthesis are visualized by indirect immunofl uorescence with an antibody specifi c to BrdU-substituted DNA. Images have been deconvolved and a merge of the BrdU and DAPI staining pat-terns is shown to illustrate the two stages during which cells are engaged in the replication of chromocenters, used to score γ satellite replication in C and Fig. 3. A schematic of the length of time that C127 cells spend in each stage of S phase is given at the bottom (adapted from Wu et al., 2006a). Experi-ments were repeated for three independent synchronizations. At least 150 cells were counted for each time point. Bars, 5 μm.
JCB • VOLUME 179 • NUMBER 3 • 2007 416
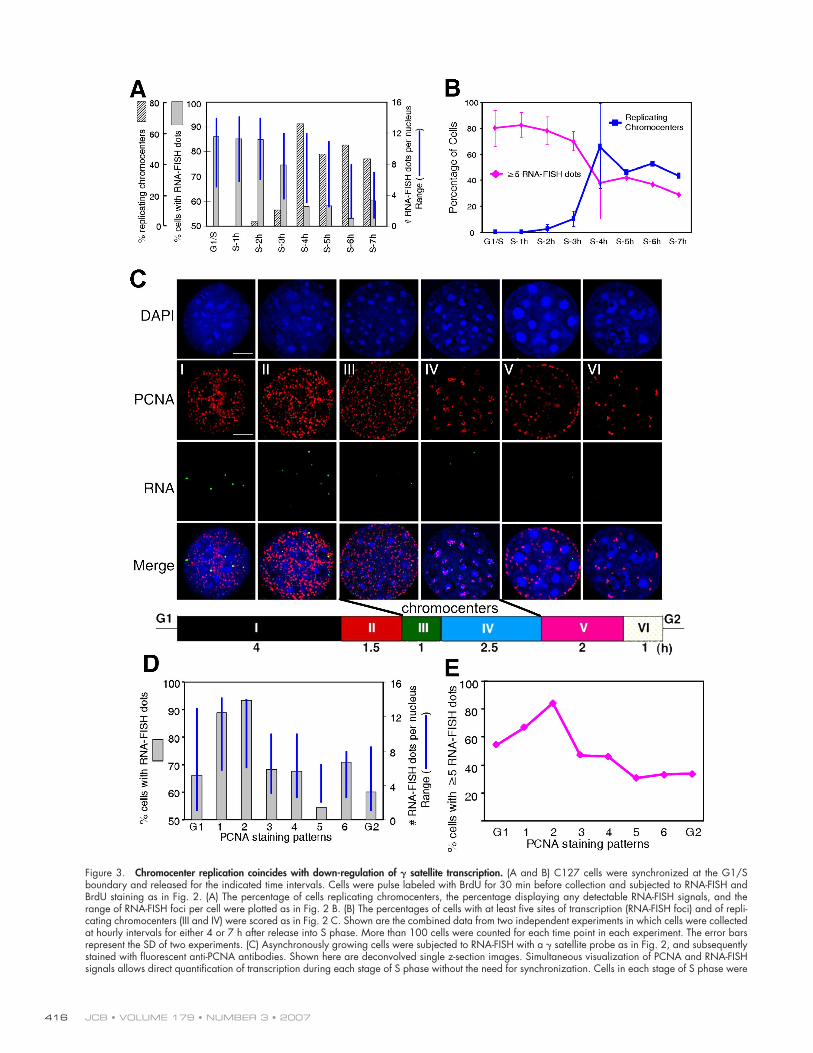
Figure 3. Chromocenter replication coincides with down-regulation of 𝛄 satellite transcription. (A and B) C127 cells were synchronized at the G1/S boundary and released for the indicated time intervals. Cells were pulse labeled with BrdU for 30 min before collection and subjected to RNA-FISH and BrdU staining as in Fig. 2. (A) The percentage of cells replicating chromocenters, the percentage displaying any detectable RNA-FISH signals, and the range of RNA-FISH foci per cell were plotted as in Fig. 2 B. (B) The percentages of cells with at least fi ve sites of transcription (RNA-FISH foci) and of repli-cating chromocenters (III and IV) were scored as in Fig. 2 C. Shown are the combined data from two independent experiments in which cells were collected at hourly intervals for either 4 or 7 h after release into S phase. More than 100 cells were counted for each time point in each experiment. The error bars represent the SD of two experiments. (C) Asynchronously growing cells were subjected to RNA-FISH with a γ satellite probe as in Fig. 2, and subsequently stained with fl uorescent anti-PCNA antibodies. Shown here are deconvolved single z-section images. Simultaneous visualization of PCNA and RNA-FISH signals allows direct quantifi cation of transcription during each stage of S phase without the need for synchronization. Cells in each stage of S phase were

TRANSCRIPTION OF HETEROCHROMATIN • LU AND GILBERT 417
C127 cells (Fig. 3 D). Mitotic transcription was also elevated in
D15 (Fig. 4 C). To compare the percentage of cells transcribing
γ satellite transcripts at late G1/early S phase levels, as was
done for C127 cells in Fig. 3 E, we adjusted our criteria for the
number of RNA-FISH foci per cell to refl ect the relatively low
level of transcription in WT MEFs (more than one site per
nucleus) and the higher level of transcription in the Suv39dn1,2,
double knockout cells (more than seven sites per nucleus).
When the percentage of cells meeting these criteria was scored,
it revealed a clear reduction in the number of highly transcrib-
ing cells upon chromocenter replication (Fig. 4 B).
We conclude that the elevated γ satellite transcript levels
detected in D15 result from transcription taking place simul-
taneously at an increased number of sites on mouse chromo-
centers, rather than from elevated transcription from a similar
number of sites or a disruption of cell cycle regulation. More-
over, the increased number of sites did not appear to result
from a disruption of centromere clustering because the size
and number of chromocenters was similar in WT versus D15
(unpublished data). Hence, cell cycle regulation of γ satellite
transcription is independent of the Suv39h1,2-related features
of heterochromatin.
Transcription of 𝛄 satellite requires activation of Cdk and passage through the restriction pointThe very low levels of transcription during early G1 phase
raised the intriguing possibility that transcription of pericentric
heterochromatin might require passage through the restriction
point and commitment to cell division. Hence, we examined
cells that were arrested in G0 by contact inhibition. For all cell
lines (C127, WT, and D15), very little transcription could be
detected in arrested cells (Fig. 5 A). To distinguish whether
long-term arrest in quiescence resulted in transcription down-
regulation or if transcription was not induced because cells were
prevented from passing through the restriction point, C127 cells
were synchronized in mitosis as in Fig. 1 and released into G1
phase in the presence of various concentrations of serum in the
medium or into a complete medium to which the Cdk inhibitor
roscovatine was added 2 h after release into G1 phase. All cell
populations were then allowed to proceed to 7 h after mitosis,
when substantial up-regulation of γ satellite transcription was
observed in control cells (Fig. 5 B). Both serum deprivation and
roscovitine treatment severely inhibited γ satellite transcription.
We conclude from this experiment that transcription of mouse
pericentric heterochromatin is dependent on passage through
the restriction point.
DiscussionWe show that at least two different populations of RNA mole-
cules are expressed from mouse pericentric heterochromatin at
different times during the cell cycle. Transcription was Cdk de-
pendent, indicating that cells do not synthesize these transcripts
until after they commit to proliferation. Moreover, the transcripts
were short-lived. Together, our results provide a satisfying expla-
nation for why such transcripts were not detected in many studies
that examined quiescent or slowly growing tissue but were found
Figure 4. Cell cycle regulation of 𝛄 satellite transcription in WT and Suv39h1,2 double knockout MEFs. Asynchronously growing WT and Suv39h1,2 double null cell line (D15) MEFs were subjected to PCNA and γ satellite RNA-FISH analysis as in Fig. 3. (A) The percentage of cells with RNA-FISH signals and the range of signals per cell were scored and plotted as in Fig. 3. (B) The percentage of cells with at least one (WT) or seven (D15) sites of γ satellite tran-scription revealed as RNA-FISH foci were scored as in Fig. 3. (C) RNA-FISH foci were scored in prophase/metaphase (P/M) and ana-phase/telophase (A/T) cells as in Fig. 2 B.
clearly identifi ed, with PCNA patterns defi ned as BrdU patterns were in Fig. 2 D. G1 or G2 cells could be identifi ed as smaller or larger PCNA-negative nu-clei, respectively. A schematic of the length of time that C127 cells spend in each stage of S phase is shown at the bottom (adapted from Wu et al., 2006a). Bar, 5 μm. (D) The percentage of cells from C with any number of RNA-FISH signals and the range in number of signals per cell were scored and plotted as in Figs. 2 B and 3 A. Triton extraction removed most mitotic cells from the slide. (E) The percentage of cells with at least fi ve RNA-FISH foci for each was scored as in Figs. 2 C and 3 B. At least 100 cells were counted for each stage, except PCNA patterns III and VI, which are the shortest periods, for which at least 50 cells were scored. Three independent repeats gave similar results.

JCB • VOLUME 179 • NUMBER 3 • 2007 418
in tissues that contain proliferating cells. Moreover, they provide
evidence for provocative links between heterochromatin and
cellular proliferation that warrant further investigation.
Genesis and functions of pericentric transcriptsAlthough we cannot rule out the possibility that these hetero-
chromatic transcripts result from cryptic transcription, possibly
because of a cell cycle–specifi c change in chromatin structure,
an alternative possibility is that there are specific functional
promoters within the γ satellite repeats. In fact, specifi c 300-bp,
GC-rich non–γ satellite DNA sequence motifs are peppered
within the mouse γ satellite repeats (Kuznetsova et al., 2006).
Moreover, transcription factors YY1 (Shestakova et al., 2004)
and C/EBPα (Liu et al., 2007) appear to bind to DNA sequences
within the mouse major satellite, and in the case of YY1, this
interaction is proliferation dependent. Such promoters need not
be abundant. Indeed, relatively few sites of transcription occur
within pericentric heterochromatin at any moment in time, and
given the large fraction of genomic DNA that corresponds to
γ satellite DNA (�5%; Waring and Britten, 1966; Prashad and
Cutler, 1976), even the induced levels of transcription are not
robust (Fig. 1 G).
Cell cycle regulation of both late G1/S phase and mitosis-
specifi c transcripts was independent of Suv39h1,2. Hence, al-
though our results do not address the role of these RNAs, they
suggest that transcription is upstream of Suv39h1,2 and has the
potential to drive heterochromatin formation during the cell cycle.
It is tempting to speculate that transcription during S phase
and mitosis might assist with the reassembly of some structural
components of heterochromatin that are disrupted during these
phases of the cell cycle. Mammalian heterochromatin replicates
late during S phase of the cell cycle, and late replication seeds
the assembly of hypoacetylated chromatin (Zhang et al., 2002).
The events occurring at the replication fork likely contribute to
the propagation of heterochromatin structure, which in turn
may dictate late replication in the following cell cycle, thus
forming a self-reinforcing loop (Wu et al., 2006a). It is possible
that transcription after cells commit to DNA replication is
somehow involved in preparing heterochromatin for reassembly
at the replication fork. Although fi ssion yeast pericentromeric
heterochromatin is replicated early in the cell cycle (Kim et al.,
2003), there is no a priori reason why a similar mechanism
couldn’t be operating at a different time during S phase.
The vast majority of transcription is shut down in mitosis
because of the eviction of transcription factors (Prasanth et al.,
2003), making the mitotic transcription of heterochromatin a
particularly intriguing fi nding. What role if any such transcripts
might play during mitosis is diffi cult to imagine; however, there
may be a renewed requirement to reinforce heterochromatin
structure during the late stages of mitosis when most cohesin
has been removed (Dai et al., 2006). It is also possible that the
eviction of one or more factors from heterochromatin allows for
its transcription. In fact, HP1 is evicted from heterochromatin
during mitosis (Fischle et al., 2005; Wu et al., 2006a), and an
RNA component is required to tether HP1 to pericentric hetero-
chromatin (Maison et al., 2002), so it is possible that mitotic
heterochromatin transcription is induced by HP1 loss and/or
assists in the reloading of HP1, which occurs during anaphase
(Wu et al., 2006a). Mitotic transcription may also assist in the
maintenance of centromere structure, as it has recently been
shown that interactions with a single-stranded RNA are required
for the integrity of kinetochore structure during mitosis in hu-
man cells (Wong et al., 2007). Finally, a more speculative pos-
sibility is that these RNAs may be components of the RNA
helicase p68 and CENP-B–containing interchromosomal con-
nections during mitosis (Kuznetsova et al., 2007).
In short, it is now of considerable importance to identify
the promoter elements involved in regulating the transcription
of both the S phase and mitotic transcripts and the functional
consequences of perturbing this regulation.
Fission yeast and mammals: similarities and differencesDespite the conservation of most heterochromatin structural
components from fi ssion yeast to mammals, a requirement for
Figure 5 . Transcription from pericentric heterochro-matin is proliferation dependent. (A) C127 cells, MEFs, and Suv39h1,2 double null MEFs (D15) were rendered quiescent by contact inhibition and sub-jected to PCNA immunofl uorescence and RNA-FISH with a γ satellite probe, along with asynchronously growing control cells. Because there was variability in the response of the different cells to contact inhibition, we focused on cells that were negative for PCNA in all populations (including asynchronous cells). The per-centage of PCNA-negative cells with any number of RNA-FISH signals for contact-inhibited (gray) or con-trol cells and the range of signals per cell were scored and plotted as in Fig. 3. (B) C127 cells were synchro-nized in mitosis by shakeoff as in Fig. 1 and released into G1 phase for 7 h with the indicated concentra-tions of serum or in 10% serum with roscovitine added at 2 h after release. RNA-FISH was quantifi ed as in Fig. 2 C and shows the percentage positive and number of transcription sites per nucleus. For both A and B, the percentage of PCNA-positive cells are indi-cated above each graph. Two independent experi-ments gave the same results.

TRANSCRIPTION OF HETEROCHROMATIN • LU AND GILBERT 419
transcription in the assembly of mammalian heterochromatin
has been diffi cult to ascertain. In addition to inconsistent detec-
tion of γ satellite transcription, key components of the fi ssion
yeast posttranscriptional silencing machinery have not been de-
tected (Huisinga et al., 2006). Although Dicer mutants in mice
exhibit elevated levels of γ satellite transcripts (Fukagawa et al.,
2004; Kanellopoulou et al., 2005), this has no consequence on
histone or DNA methylation in heterochromatin (Murchison
et al., 2005). Elevated levels of γ satellite transcripts detected in
Suv39h1,2 knockouts could be interpreted as resulting from the
disruption of repressive heterochromatin. However, we also see
intermediate levels of these transcripts in C127 cells that have
apparently normal pericentric heterochromatin (Wu et al.,
2005). The elevated transcription in C127 cells may be a conse-
quence of the more rapidly proliferating state of C127 cells, but
this could also refl ect transient changes in heterochromatin
structure that might occur during the cell cycle.
Transcription of both species of RNA described here is
mediated by RNA polymerase II, which is similar to heterochro-
matin transcription in fi ssion yeast. However, we do not fi nd evi-
dence for siRNA-sized molecules at any time during the cell
cycle, suggesting that if the RNA species we discuss here are in-
volved in heterochromatin structure, important differences with
the fi ssion yeast system must exist. One notable difference is the
apparent lack of an RNA-dependent RNA polymerase in mam-
mals (Huisinga et al., 2006) that could amplify and maintain
heterochromatic RNA after transcription, as in fi ssion yeast.
Because the mammalian transcripts have a short half-life and we
fi nd no evidence for their editing to undetectable forms, either
there is some transcription throughout the cell cycle that has
gone undetected in our experiments or, unlike fi ssion yeast, these
transcripts are only required transiently, perhaps to initiate rather
than to maintain heterochromatin. It is now of considerable in-
terest to know if fi ssion yeast heterochromatin transcription me-
diated by RNA polymerase II is under cell cycle control, which
could provide a novel direction with which to investigate paral-
lels between fi ssion yeast and mammalian heterochromatin.
Materials and methodsCell synchronizationMouse C127 cells were synchronized in mitosis by mechanical shakeoff after a brief and fully reversible nocodazole treatment (Sigma-Aldrich) as described previously (Wu et al., 1997). Similar results were obtained in experiments repeated without the use of nocodazole. For G1/S synchroni-zation, 10 μg/ml aphidicolin (Calbiochem) was added 5 h after release from mitosis for an additional 10–12 h. Where roscovitine (Calbiochem) was used, 40 μM was added at 2 h after mitosis. For serum deprivation, mitotic cells were plated directly into a medium containing either 0.1% or no serum. For contact inhibition, cells were further cultured for 7 d after reaching confl uence with fresh media every day. For BrdU pulse labeling, 15 μg/ml BrdU (Sigma-Aldrich) was added to medium for 30 min be-fore fi xation.
Northern hybridization and nuclear run-onTotal RNA was prepared using an mirVana microRNA isolation kit (Ambion) and treated with DNase (Promega). In parallel, <200 nt RNA (small) frac-tions were separated from total RNA using the same kit. To rule out any possibility of DNA contamination in our samples, we performed RT-PCR analysis using γ satellite–specifi c primers. Only reverse transcribed sam-ples gave ladderlike PCR bands, and RNase A (Sigma-Aldrich) treatment completely eliminated the product. Total RNA was resolved via electrophoresis
with a denaturing agarose gel, whereas <200 nt fractions were resolved with a denaturing 15% polyacrylamide gel. RNAs were then transferred to a nylon membrane. The γ satellite probe was plasmid pγSat (Lundgren et al., 2000) containing eight copies of the 234-bp repeat as a template (provided by N. Dillon, Imperial College London, London, UK), which was labeled with α-[32P]dATP using a random labeling kit (Invitrogen). Total and small RNA hybridization was done at 60 and 25°C, respectively. Nuclear run-on with equal numbers of cells (10 million) was performed as described previously (Sasaki et al., 2006), except that cells were permeabilized with digitonin (Sigma-Aldrich) as described previously (Wu et al., 1997) to maintain the integrity of mitotic chromosomes and allow detection of tran-scription during mitosis.
RNA-FISH and immuno–RNA-FISHThe RNA-FISH procedure was performed as described previously (Tam et al., 2002), using cells that were either grown on coverslips or centri-fuged from suspension onto coverslips using a cytocentrifuge (Cytospin 2; Shandon). In brief, cells were washed with CSK buffer (100 mM NaCl, 300 mM sucrose, 3 mM MgCl2, and 10 mM Pipes, pH 6.8), followed by CSK + 0.5% Triton X-100 (Sigma-Aldrich) permeablization for 5 min and 4% PFA fi xation for 10 min on ice, and then stored in 70% ethanol at −20°C for no longer than 2 d. Slides were hybridized with a digoxigenin (Roche Applied Science) nick-translated γ satellite probe overnight at 37°C followed by fl uorescent antibody detection as described previously (Li et al., 2001). In the case of immuno–RNA-FISH, PCNA staining, and RNA-FISH, PCNA immunostaining was performed using a monoclonal PCNA antibody (Oncogene Research Products) after RNA-FISH detection. For RNase A treatment, cells were treated with RNase A after permeabili-zation and before fi xation.
MicroscopyImages were captured with an image restoration microscope system (Delta-Vision; Applied Precision) attached to a fl uorescence microscope (IX-71; Olympus) equipped with an oil objective lens (PlanApo 60×, 1.42 NA; Olympus) using a charge-coupled device camera (Coolsnap HQ; Photo-metrics) at RT. Approximately 40 optical sections (with 0.2-μm spacing) were taken and enhanced using the SoftWorx (Applied Precision) con-strained iterative deconvolution process.
ImmunostainingBrdU staining was performed as described previously (Wu et al., 2006b). For vigilin staining, cells grown on coverslips were fi xed with cold 70% ethanol. After blocking with 10% normal goat serum in phosphate buffer for 30 min, cells were then incubated with polyclonal antibodies against N and C termini of vigilin (gift of G. Neu-yilik, University of Heidelberg, Heidelberg, Germany) for 1 h at RT, followed by incubation with FITC-conjugated secondary antibodies.
RT-PCRFor conventional RT-PCR, RNA samples were reverse transcribed using either poly-dT, major satellite-specifi c, or random primer and subjected to PCR with γ satellite primers (5′-C A T A T T C C A G G T C C T T C A G T G T G C -3′ and 5′-G A C G A C T T G A A A A A T G A C G A A A T C -3′). For the attempt to detect A-to-I–edited RNA, we used a degenerate primer (5′-C G G A A T T C G A A A A Y [A/C]GAGAAAC-3′) or primers from unlikely-to-be-edited regions (5′-G G A -A A A T G A G A A A C A T C C A C -3′) for reverse transcription and secondary prim-ers (5′-C G G G A T C C G T T T T C T C G C C -3′ or 5′-T T T T C A G T T T T C T C G C C -3′) for amplifi cation.
We thank N. Dillon for providing the γ satellite DNA plasmid (p𝛄Sat), G. Neu-yilik for providing vigilin antibodies, P. Fraser for help with RNA-FISH, M. Davidson, G. Almouzni, and A. Probst for helpful discussions, and S. Jia for critical reading of the manuscript.
This work was supported by National Institutes of Health grant GM57233 to D.M. Gilbert.
Submitted: 25 June 2007Accepted: 2 October 2007
ReferencesBecker, M., C. Baumann, S. John, D.A. Walker, M. Vigneron, J.G. McNally, and
G.L. Hager. 2002. Dynamic behavior of transcription factors on a natural promoter in living cells. EMBO Rep. 3:1188–1194.

JCB • VOLUME 179 • NUMBER 3 • 2007 420
Cobb, B.S., T.B. Nesterova, E. Thompson, A. Hertweck, E. O’Connor, J. Godwin, C.B. Wilson, N. Brockdorff, A.G. Fisher, S.T. Smale, and M. Merkenschlager. 2005. T cell lineage choice and differentiation in the absence of the RNase III enzyme Dicer. J. Exp. Med. 201:1367–1373.
Cohen, A.K., T.Y. Huh, and C.W. Helleiner. 1973. Transcription of satellite DNA in mouse L-cells. Can. J. Biochem. 51:529–532.
Dai, J., B.A. Sullivan, and J.M. Higgins. 2006. Regulation of mitotic chromo-some cohesion by Haspin and Aurora B. Dev. Cell. 11:741–750.
Dimitrova, D.S., and D.M. Gilbert. 2000. Stability and nuclear distribution of mammalian replication protein A heterotrimeric complex. Exp. Cell Res. 254:321–327.
Fischle, W., B.S. Tseng, H.L. Dormann, B.M. Ueberheide, B.A. Garcia, J. Shabanowitz, D.F. Hunt, H. Funabiki, and C.D. Allis. 2005. Regulation of HP1-chromatin binding by histone H3 methylation and phosphorylation. Nature. 438:1116–1122.
Flamm, W.G., P.M. Walker, and M. McCallum. 1969. Some properties of the single strands isolated from the DNA of the nuclear satellite of the mouse (Mus musculus). J. Mol. Biol. 40:423–443.
Fukagawa, T., M. Nogami, M. Yoshikawa, M. Ikeno, T. Okazaki, Y. Takami, T. Nakayama, and M. Oshimura. 2004. Dicer is essential for formation of the heterochromatin structure in vertebrate cells. Nat. Cell Biol. 6:784–791.
Gaubatz, J.W., and R.G. Cutler. 1990. Mouse satellite DNA is transcribed in senescent cardiac muscle. J. Biol. Chem. 265:17753–17758.
Gilbert, D.M., and S.N. Cohen. 1987. Bovine papilloma virus plasmids replicate randomly in mouse fi broblasts throughout S phase of the cell cycle. Cell. 50:59–68.
Grewal, S.I., and S.C. Elgin. 2007. Transcription and RNA interference in the formation of heterochromatin. Nature. 447:399–406.
Grewal, S.I., and S. Jia. 2007. Heterochromatin revisited. Nat. Rev. Genet. 8:35–46.
Guenatri, M., D. Bailly, C. Maison, and G. Almouzni. 2004. Mouse centric and pericentric satellite repeats form distinct functional heterochromatin. J. Cell Biol. 166:493–505.
Harel, J., N. Hanania, H. Tapiero, and L. Harel. 1968. RNA replication by nuclear satellite DNA in different mouse cells. Biochem. Biophys. Res. Commun. 33:696–701.
Huisinga, K.L., B. Brower-Toland, and S.C. Elgin. 2006. The contradictory def-initions of heterochromatin: transcription and silencing. Chromosoma. 115:110–122.
Jia, S., T. Yamada, and S.I. Grewal. 2004. Heterochromatin regulates cell type-specifi c long-range chromatin interactions essential for directed recombi-nation. Cell. 119:469–480.
Kanellopoulou, C., S.A. Muljo, A.L. Kung, S. Ganesan, R. Drapkin, T. Jenuwein, D.M. Livingston, and K. Rajewsky. 2005. Dicer-defi cient mouse embry-onic stem cells are defective in differentiation and centromeric silencing. Genes Dev. 19:489–501.
Kato, H., D.B. Goto, R.A. Martienssen, T. Urano, K. Furukawa, and Y. Murakami. 2005. RNA polymerase II is required for RNAi-dependent heterochroma-tin assembly. Science. 309:467–469.
Kim, S.M., D.D. Dubey, and J.A. Huberman. 2003. Early-replicating heterochro-matin. Genes Dev. 17:330–335.
Kourmouli, N., Y.M. Sun, S. van der Sar, P.B. Singh, and J.P. Brown. 2005. Epigenetic regulation of mammalian pericentric heterochromatin in vivo by HP1. Biochem. Biophys. Res. Commun. 337:901–907.
Kuznetsova, I., O.I. Podgornaya, and M.A. Ferguson-Smith. 2006. High-resolution organization of mouse centromeric and pericentromeric DNA. Cytogenet. Genome Res. 112:248–255.
Kuznetsova, I.S., N.I. Enukashvily, E.M. Noniashvili, A.N. Shatrova, N.D. Aksenov, V.V. Zenin, A.P. Dyban, and O.I. Podgornaya. 2007. Evidence for the existence of satellite DNA-containing connection between meta-phase chromosomes. J. Cell. Biochem. 101:1046–1061.
Lehnertz, B., Y. Ueda, A.A. Derijck, U. Braunschweig, L. Perez-Burgos, S. Kubicek, T. Chen, E. Li, T. Jenuwein, and A.H. Peters. 2003. Suv39h-mediated histone H3 lysine 9 methylation directs DNA methylation to major satellite repeats at pericentric heterochromatin. Curr. Biol. 13:1192–1200.
Leonhardt, H., H.P. Rahn, P. Weinzierl, A. Sporbert, T. Cremer, D. Zink, and M.C. Cardoso. 2000. Dynamics of DNA replication factories in living cells. J. Cell Biol. 149:271–280.
Levsky, J.M., S.M. Shenoy, R.C. Pezo, and R.H. Singer. 2002. Single-cell gene expression profi ling. Science. 297:836–840.
Li, F., J. Chen, M. Izumi, M.C. Butler, S.M. Keezer, and D.M. Gilbert. 2001. The replication timing program of the Chinese hamster β-globin locus is established coincident with its repositioning near peripheral heterochro-matin in early G1 phase. J. Cell Biol. 154:283–292.
Liu, X., B. Wu, J. Szary, E.M. Kofoed, and F. Schaufele. 2007. Functional sequestration of transcription factor activity by repetitive DNA. J. Biol. Chem. 282:20868–20876.
Lundgren, M., C.M. Chow, P. Sabbattini, A. Georgiou, S. Minaee, and N. Dillon. 2000. Transcription factor dosage affects changes in higher order chro-matin structure associated with activation of a heterochromatic gene. Cell. 103:733–743.
Maio, J.J., and D.M. Kurnit. 1974. Transcription of mammalian satellite DNAs by homologous DNA-dependent RNA polymerases. Biochim. Biophys. Acta. 349:305–319.
Maison, C., D. Bailly, A.H. Peters, J.P. Quivy, D. Roche, A. Taddei, M. Lachner, T. Jenuwein, and G. Almouzni. 2002. Higher-order structure in pericen-tric heterochromatin involves a distinct pattern of histone modifi cation and an RNA component. Nat. Genet. 30:329–334.
Martens, J.H., R.J. O’Sullivan, U. Braunschweig, S. Opravil, M. Radolf, P. Steinlein, and T. Jenuwein. 2005. The profi le of repeat-associated his-tone lysine methylation states in the mouse epigenome. EMBO J. 24:800–812.
Muchardt, C., M. Guilleme, J.S. Seeler, D. Trouche, A. Dejean, and M. Yaniv. 2002. Coordinated methyl and RNA binding is required for heterochro-matin localization of mammalian HP1alpha. EMBO Rep. 3:975–981.
Murchison, E.P., J.F. Partridge, O.H. Tam, S. Cheloufi , and G.J. Hannon. 2005. Characterization of Dicer-defi cient murine embryonic stem cells. Proc. Natl. Acad. Sci. USA. 102:12135–12140.
Osborne, C.S., L. Chakalova, K.E. Brown, D. Carter, A. Horton, E. Debrand, B. Goyenechea, J.A. Mitchell, S. Lopes, W. Reik, and P. Fraser. 2004. Active genes dynamically colocalize to shared sites of ongoing transcrip-tion. Nat. Genet. 36:1065–1071.
Peters, A.H., D. O’Carroll, H. Scherthan, K. Mechtler, S. Sauer, C. Schofer, K. Weipoltshammer, M. Pagani, M. Lachner, A. Kohlmaier, et al. 2001. Loss of the Suv39h histone methyltransferases impairs mammalian hetero-chromatin and genome stability. Cell. 107:323–337.
Pidoux, A.L., and R.C. Allshire. 2004. Kinetochore and heterochromatin do-mains of the fi ssion yeast centromere. Chromosome Res. 12:521–534.
Prasanth, K.V., P.A. Sacco-Bubulya, S.G. Prasanth, and D.L. Spector. 2003. Sequential entry of components of the gene expression machinery into daughter nuclei. Mol. Biol. Cell. 14:1043–1057.
Prashad, N., and R.G. Cutler. 1976. Percent satellite DNA as a function of tissue and age of mice. Biochim. Biophys. Acta. 418:1–23.
Rizzi, N., M. Denegri, I. Chiodi, M. Corioni, R. Valgardsdottir, F. Cobianchi, S. Riva, and G. Biamonti. 2004. Transcriptional activation of a constitutive heterochromatic domain of the human genome in response to heat shock. Mol. Biol. Cell. 15:543–551.
Rudert, F., S. Bronner, J.M. Garnier, and P. Dolle. 1995. Transcripts from op-posite strands of gamma satellite DNA are differentially expressed during mouse development. Mamm. Genome. 6:76–83.
Samuel, C.E. 2003. RNA editing minireview series. J. Biol. Chem. 278:1389–1390.
Sasaki, T., S. Ramanathan, Y. Okuno, C. Kumagai, S.S. Shaikh, and D.M. Gilbert. 2006. The Chinese hamster dihydrofolate reductase replication origin de-cision point follows activation of transcription and suppresses initiation of replication within transcription units. Mol. Cell. Biol. 26:1051–1062.
Schotta, G., M. Lachner, K. Sarma, A. Ebert, R. Sengupta, G. Reuter, D. Reinberg, and T. Jenuwein. 2004. A silencing pathway to induce H3-K9 and H4-K20 trimethylation at constitutive heterochromatin. Genes Dev. 18:1251–1262.
Shestakova, E.A., Z. Mansuroglu, H. Mokrani, N. Ghinea, and E. Bonnefoy. 2004. Transcription factor YY1 associates with pericentromeric {gamma}-sat-ellite DNA in cycling but not in quiescent (G0) cells. Nucleic Acids Res. 32:4390–4399.
Stuart, K., and A.K. Panigrahi. 2002. RNA editing: complexity and complica-tions. Mol. Microbiol. 45:591–596.
Tam, R., C. Johnson, L. Shopland, J. McNeil, and J.B. Lawrence. 2002. Applications of RNA FISH for visualizing gene expression and nuclear architecture. In FISH (Fluorescence In Situ Hybridization). B.G. Beatty, S. Mai, and J.A. Squire, editors. Oxford University Press, Oxford. 93–110.
Valgardsdottir, R., I. Chiodi, M. Giordano, F. Cobianchi, S. Riva, and G. Biamonti. 2005. Structural and functional characterization of noncod-ing repetitive RNAs transcribed in stressed human cells. Mol. Biol. Cell. 16:2597–2604.
Wang, Q., Z. Zhang, K. Blackwell, and G.G. Carmichael. 2005. Vigilins bind to promiscuously A-to-I-edited RNAs and are involved in the formation of heterochromatin. Curr. Biol. 15:384–391.
Waring, M., and R.J. Britten. 1966. Nucleotide sequence repetition: a rapidly reassociating fraction of mouse DNA. Science. 154:791–794.
Wei, X., J. Samarabandu, R.S. Devdhar, A.J. Siegel, R. Acharya, and R. Berezney. 1998. Segregation of transcription and replication sites into higher order domains. Science. 281:1502–1506.
Wong, L.H., K.H. Brettingham-Moore, L. Chan, J.M. Quach, M.A. Anderson, E.L. Northrop, R. Hannan, R. Saffery, M.L. Shaw, E. Williams, and
TRANSCRIPTION OF HETEROCHROMATIN • LU AND GILBERT 421
K.H. Choo. 2007. Centromere RNA is a key component for the assem-bly of nucleoproteins at the nucleolus and centromere. Genome Res. 17:1146–1160.
Wu, J.R., G. Yu, and D.M. Gilbert. 1997. Origin-specifi c initiation of mamma-lian nuclear DNA replication in a Xenopus cell-free system. Methods. 13:313–324.
Wu, R., A.V. Terry, P.B. Singh, and D.M. Gilbert. 2005. Differential subnuclear localization and replication timing of histone h3 lysine 9 methylation States. Mol. Biol. Cell. 16:2872–2881.
Wu, R., P.B. Singh, and D.M. Gilbert. 2006a. Uncoupling global and fi ne-tuning replication timing determinants for mouse pericentric heterochromatin. J. Cell Biol. 174:185–194.
Wu, R., A.V. Terry, and D.M. Gilbert. 2006b. Observing S-phase dynamics of histone modifi cations with fl uorescently labeled antibodies. Methods Mol. Biol. 325:139–148.
Zaratiegui, M., D.V. Irvine, and R.A. Martienssen. 2007. Noncoding RNAs and gene silencing. Cell. 128:763–776.
Zhang, J., F. Xu, T. Hashimshony, I. Keshet, and H. Cedar. 2002. Establishment of transcriptional competence in early and late S phase. Nature. 420:198–202.
Zhang, Z., and G.G. Carmichael. 2004. Methods for the analysis of adenosine-to-inosine editing in RNA. Methods Mol. Biol. 257:75–84.