Project Dissertation A Study on Consumer Perception towards ...
37
Project Dissertation A Study on Consumer Perception towards Online Food Ordering Services in India Submitted by: Sajin S 2K14/MBA/67 Under the Guidance of Mr. Abhinav Chaudhary Assistant Professor DELHI SCHOOL OF MANAGEMENT Delhi Technological University Bawana Road Delhi 110042 Jan -May 2016
-
Upload
khangminh22 -
Category
Documents
-
view
0 -
download
0
Transcript of Project Dissertation A Study on Consumer Perception towards ...
Project Dissertation
A Study on Consumer Perception towards Online
Food Ordering Services in India
Submitted by:
Sajin S
2K14/MBA/67
Under the Guidance of
Mr. Abhinav Chaudhary
Assistant Professor
DELHI SCHOOL OF MANAGEMENT
Delhi Technological University
Bawana Road Delhi 110042
Jan -May 2016
ii
CERTIFICATE FROM THE INSTITUTE
This is to certify that the Project Dissertation titled A Study on Consumer Perception towards
Online Food Ordering Services in India is a bonafide work carried out by Mr. Sajin S of
MBA 2014-16 and submitted to Delhi School of Management, Delhi Technological University,
Bawana Road, Delhi-42 in partial fulfillment of the requirement for the award of the Degree of
Masters of Business Administration.
Signature of Guide Signature of Head (DSM)
Mr. Abhinav Chaudhary Seal of HOD
Mr. Anurag Tiruwa
Place:
Date:
iii
DECLARATION
I, Sajin S, student of MBA 2014-16 of Delhi School of Management, Delhi Technological
University, Bawana Road, Delhi-42 declare that Project Dissertation on A Study on Consumer
Perception towards Online Food Ordering Services in India submitted in partial fulfillment
of Degree of Masters of Business Administration is the original work conducted by me.
The information and data given in the report is authentic to the best of my knowledge.
This Report is not being submitted to any other University for award of any other Degree,
Diploma and Fellowship.
Place: Sajin S
Date: (2K14/MBA/67)

iv
ACKNOWLEDGEMENT
I would like to extend my heartfelt thanks to Mr. Abhinav Chaudhary for his valuable guidance,
interest and suggestions throughout the course of the project. I am thankful to him for providing
me with useful references and information, which were of significant importance for the
completion of my project. I feel honoured and privileged to work under him. He shared his vast
pool of knowledge with me that helped me steer through all the difficulties with ease. This
project file would not have been possible without his guidance and I would like to thank him
for everything he has done for me. I perceive this opportunity as a big milestone in my career
development. I will strive to use skills and knowledge gained here in the best possible way, and
I will continue to work on their further improvement, in order to attain my desired career
objectives.
v
EXECUTIVE SUMMARY
The online food ordering startups has been growing faster in recent years with the help of fast
growing technology, the service level has increased with the options of fast delivery, easy
returns, payment wallets etc. This has resulted in a very competitive environment in this sphere
of the industry.
The project undertaken, involved the understanding of the online food ordering platforms as a
marketplace. The primary aim was to understand the consumer perception towards the online
food ordering services, as well as the important factors that helps in getting positive response
of online food startups.
The study tries to understand the trust level of customers in such platforms as there still exists
certain parameters which cause a shadow of doubt in the mind of the customers while using
such platforms. The project tries to understand such parameters as well.
1
CHAPTER – 1
INTRODUCTION
The Indian food industry is poised for huge growth, increasing its contribution to world
food trade every year. In India, the food sector has emerged as a high-growth and high-
profit sector due to its immense potential for value addition, particularly within the food
processing industry.
Accounting for about 32 per cent of the country’s total food market, the food processing
industry is one of the largest industries in India and is ranked fifth in terms of production,
consumption, export and expected growth. The total food production in India is likely to
double in the next 10 years with the country’s domestic food market estimated to reach
US$ 258 billion by 2015.
The Government of India has been instrumental in the growth and development of the
food processing industry. The government through the Ministry of Food Processing
Industries (MoFPI) is making all efforts to encourage investments in the business. It has
approved proposals for joint ventures (JV), foreign collaborations, industrial licenses and
100 per cent export oriented units.
1.1 Market Size
The Indian food and grocery market is the world’s sixth largest, with retail contributing
70 per cent of the sales. It is projected to grow at the rate of 104 per cent, touching US$
482 billion by 2020.
The Indian food processing industry accounts for 32 per cent of the country’s total food
market, 14 per cent of manufacturing Gross Domestic Product (GDP), 13 per cent of
India’s exports and six per cent of total industrial investment. Indian food service industry
is expected to reach US$ 78 billion by 2018.The Indian gourmet food market is currently
valued at US$ 1.3 billion and is growing at a Compound Annual Growth Rate (CAGR) of
20 per cent. It is expected to cross US$ 2.8 billion by 2015.
2
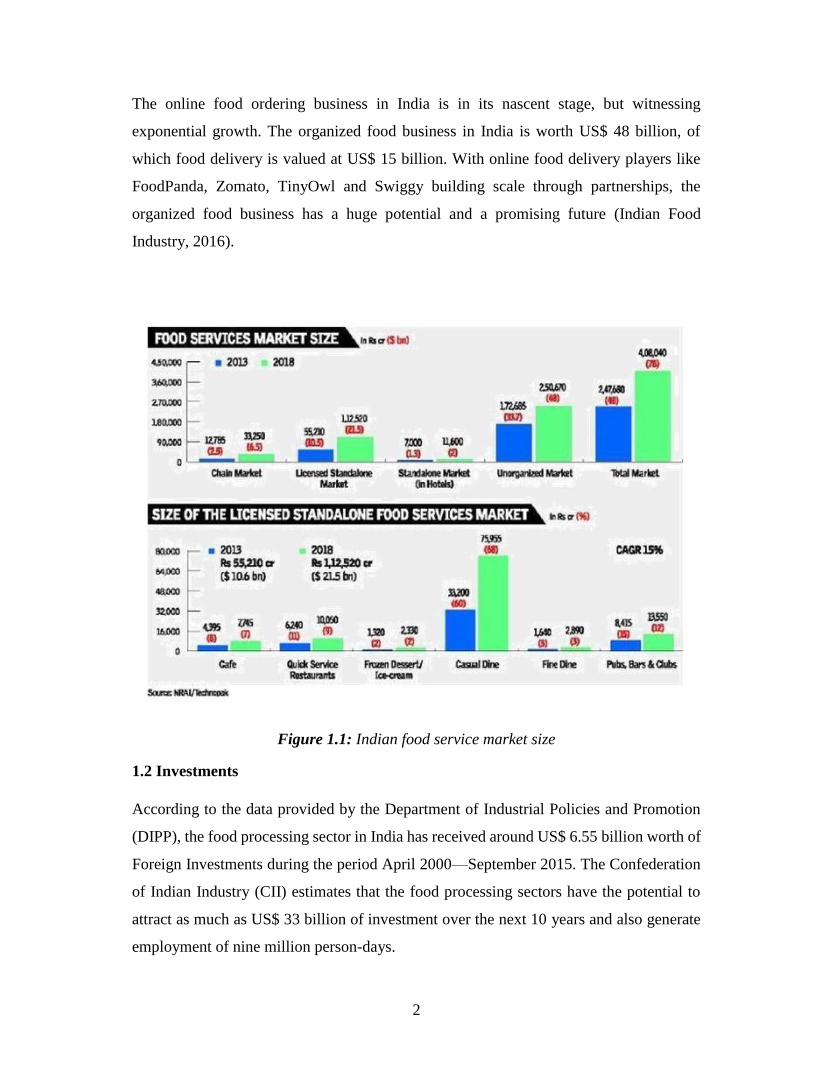
The online food ordering business in India is in its nascent stage, but witnessing
exponential growth. The organized food business in India is worth US$ 48 billion, of
which food delivery is valued at US$ 15 billion. With online food delivery players like
FoodPanda, Zomato, TinyOwl and Swiggy building scale through partnerships, the
organized food business has a huge potential and a promising future (Indian Food
Industry, 2016).
Figure 1.1: Indian food service market size
1.2 Investments
According to the data provided by the Department of Industrial Policies and Promotion
(DIPP), the food processing sector in India has received around US$ 6.55 billion worth of
Foreign Investments during the period April 2000—September 2015. The Confederation
of Indian Industry (CII) estimates that the food processing sectors have the potential to
attract as much as US$ 33 billion of investment over the next 10 years and also generate
employment of nine million person-days.
3
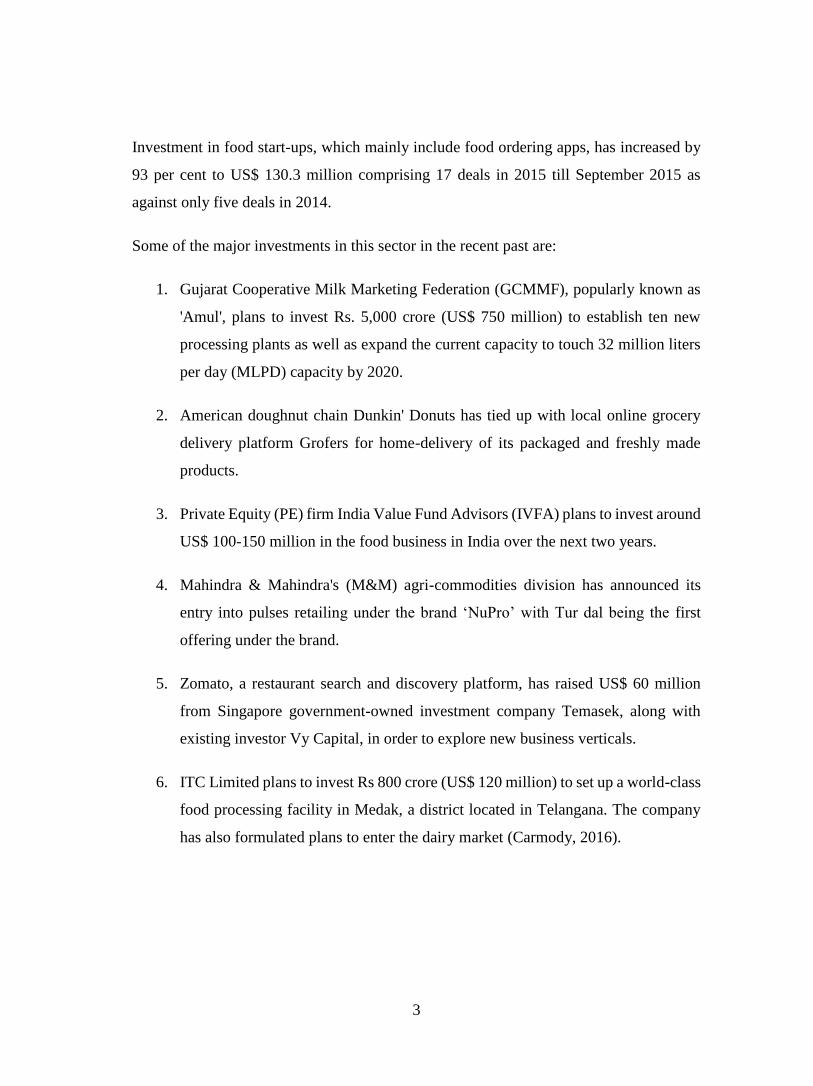
Investment in food start-ups, which mainly include food ordering apps, has increased by
93 per cent to US$ 130.3 million comprising 17 deals in 2015 till September 2015 as
against only five deals in 2014.
Some of the major investments in this sector in the recent past are:
1. Gujarat Cooperative Milk Marketing Federation (GCMMF), popularly known as
'Amul', plans to invest Rs. 5,000 crore (US$ 750 million) to establish ten new
processing plants as well as expand the current capacity to touch 32 million liters
per day (MLPD) capacity by 2020.
2. American doughnut chain Dunkin' Donuts has tied up with local online grocery
delivery platform Grofers for home-delivery of its packaged and freshly made
products.
3. Private Equity (PE) firm India Value Fund Advisors (IVFA) plans to invest around
US$ 100-150 million in the food business in India over the next two years.
4. Mahindra & Mahindra's (M&M) agri-commodities division has announced its
entry into pulses retailing under the brand ‘NuPro’ with Tur dal being the first
offering under the brand.
5. Zomato, a restaurant search and discovery platform, has raised US$ 60 million
from Singapore government-owned investment company Temasek, along with
existing investor Vy Capital, in order to explore new business verticals.
6. ITC Limited plans to invest Rs 800 crore (US$ 120 million) to set up a world-class
food processing facility in Medak, a district located in Telangana. The company
has also formulated plans to enter the dairy market (Carmody, 2016).
4
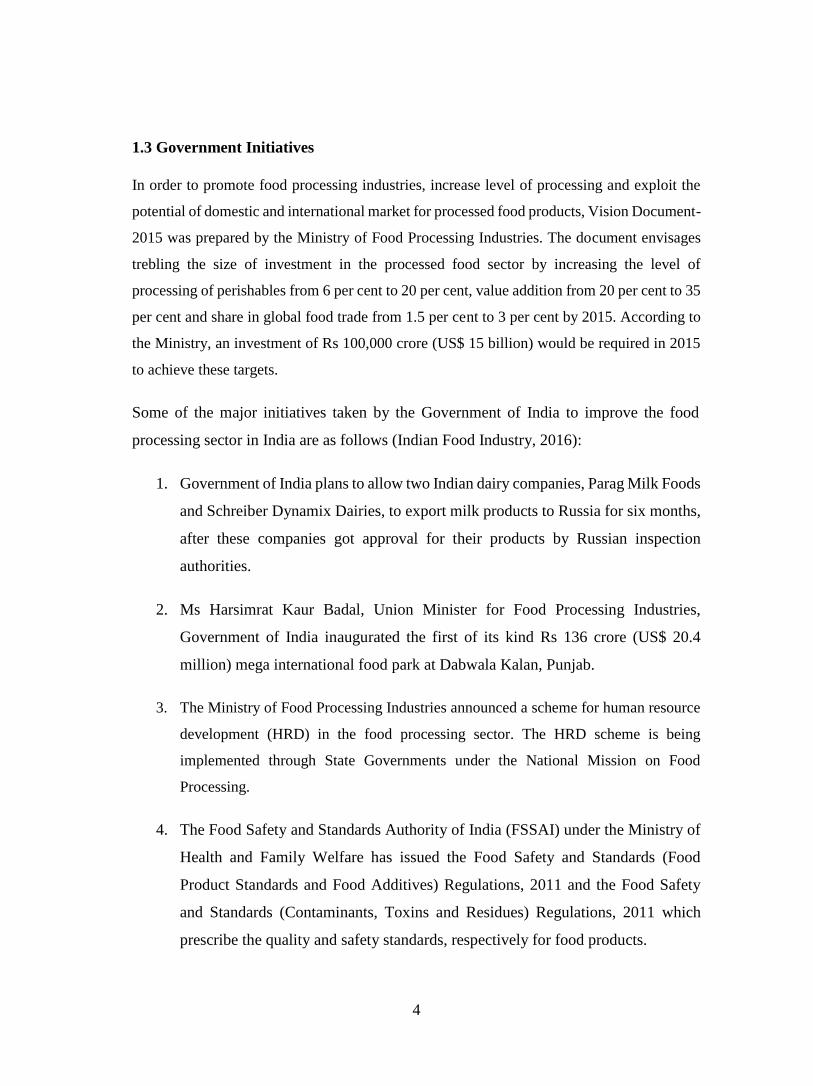
1.3 Government Initiatives
In order to promote food processing industries, increase level of processing and exploit the
potential of domestic and international market for processed food products, Vision Document-
2015 was prepared by the Ministry of Food Processing Industries. The document envisages
trebling the size of investment in the processed food sector by increasing the level of
processing of perishables from 6 per cent to 20 per cent, value addition from 20 per cent to 35
per cent and share in global food trade from 1.5 per cent to 3 per cent by 2015. According to
the Ministry, an investment of Rs 100,000 crore (US$ 15 billion) would be required in 2015
to achieve these targets.
Some of the major initiatives taken by the Government of India to improve the food
processing sector in India are as follows (Indian Food Industry, 2016):
1. Government of India plans to allow two Indian dairy companies, Parag Milk Foods
and Schreiber Dynamix Dairies, to export milk products to Russia for six months,
after these companies got approval for their products by Russian inspection
authorities.
2. Ms Harsimrat Kaur Badal, Union Minister for Food Processing Industries,
Government of India inaugurated the first of its kind Rs 136 crore (US$ 20.4
million) mega international food park at Dabwala Kalan, Punjab.
3. The Ministry of Food Processing Industries announced a scheme for human resource
development (HRD) in the food processing sector. The HRD scheme is being
implemented through State Governments under the National Mission on Food
Processing.
4. The Food Safety and Standards Authority of India (FSSAI) under the Ministry of
Health and Family Welfare has issued the Food Safety and Standards (Food
Product Standards and Food Additives) Regulations, 2011 and the Food Safety
and Standards (Contaminants, Toxins and Residues) Regulations, 2011 which
prescribe the quality and safety standards, respectively for food products.
5
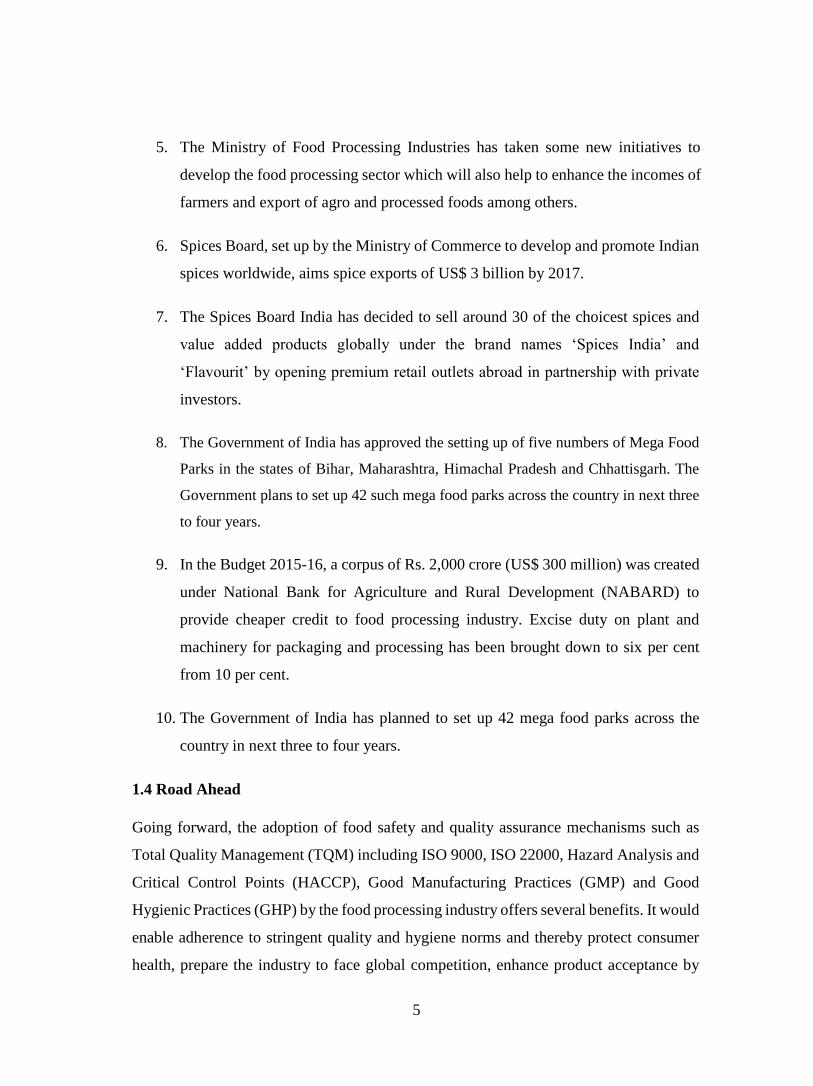
5. The Ministry of Food Processing Industries has taken some new initiatives to
develop the food processing sector which will also help to enhance the incomes of
farmers and export of agro and processed foods among others.
6. Spices Board, set up by the Ministry of Commerce to develop and promote Indian
spices worldwide, aims spice exports of US$ 3 billion by 2017.
7. The Spices Board India has decided to sell around 30 of the choicest spices and
value added products globally under the brand names ‘Spices India’ and
‘Flavourit’ by opening premium retail outlets abroad in partnership with private
investors.
8. The Government of India has approved the setting up of five numbers of Mega Food
Parks in the states of Bihar, Maharashtra, Himachal Pradesh and Chhattisgarh. The
Government plans to set up 42 such mega food parks across the country in next three
to four years.
9. In the Budget 2015-16, a corpus of Rs. 2,000 crore (US$ 300 million) was created
under National Bank for Agriculture and Rural Development (NABARD) to
provide cheaper credit to food processing industry. Excise duty on plant and
machinery for packaging and processing has been brought down to six per cent
from 10 per cent.
10. The Government of India has planned to set up 42 mega food parks across the
country in next three to four years.
1.4 Road Ahead
Going forward, the adoption of food safety and quality assurance mechanisms such as
Total Quality Management (TQM) including ISO 9000, ISO 22000, Hazard Analysis and
Critical Control Points (HACCP), Good Manufacturing Practices (GMP) and Good
Hygienic Practices (GHP) by the food processing industry offers several benefits. It would
enable adherence to stringent quality and hygiene norms and thereby protect consumer
health, prepare the industry to face global competition, enhance product acceptance by
6
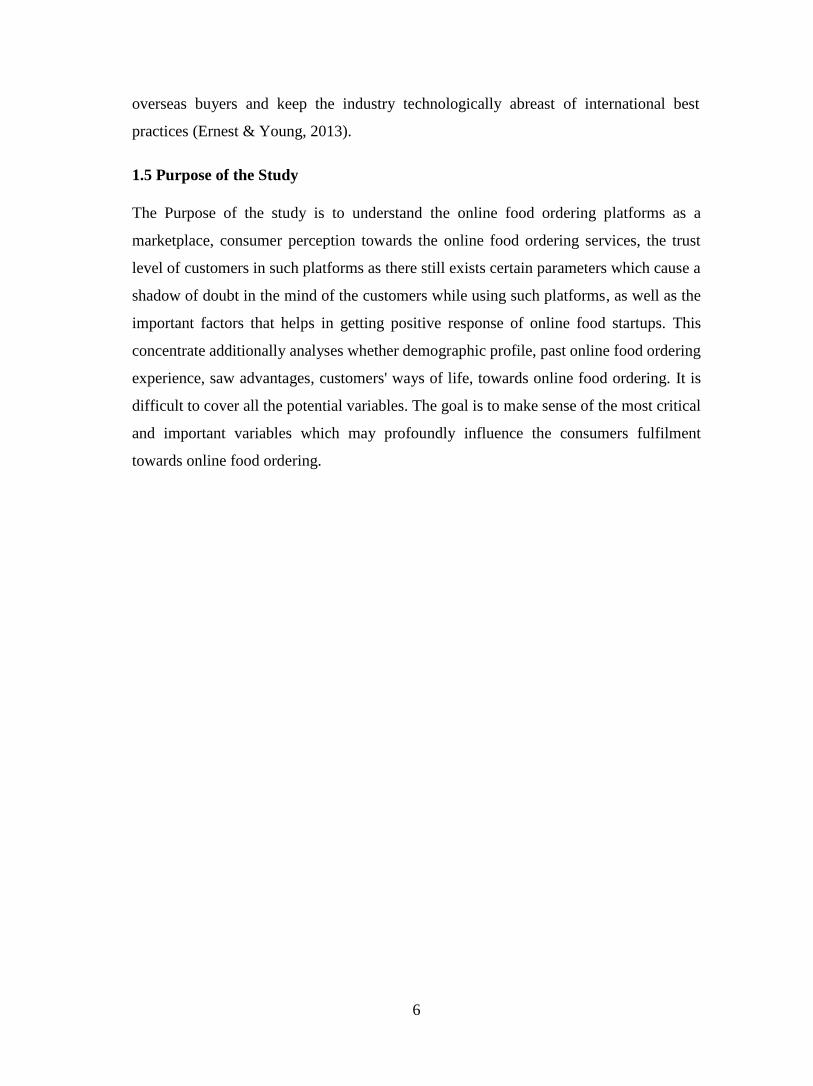
overseas buyers and keep the industry technologically abreast of international best
practices (Ernest & Young, 2013).
1.5 Purpose of the Study
The Purpose of the study is to understand the online food ordering platforms as a
marketplace, consumer perception towards the online food ordering services, the trust
level of customers in such platforms as there still exists certain parameters which cause a
shadow of doubt in the mind of the customers while using such platforms, as well as the
important factors that helps in getting positive response of online food startups. This
concentrate additionally analyses whether demographic profile, past online food ordering
experience, saw advantages, customers' ways of life, towards online food ordering. It is
difficult to cover all the potential variables. The goal is to make sense of the most critical
and important variables which may profoundly influence the consumers fulfilment
towards online food ordering.
7
CHAPTER – 2
LITERATURE REVIEW
India Food Services Update – Maple Capital Advisors
The size and transformation is substantially driven by the youth (90% of whom are
below 40 years). Consumption is driven by convenience, aspiration, cultural shifts,
changing retail landscape and unparalleled access to information backed by some
innovative marketing and product revitalization. The sector is supported by a 100%
Foreign Direct Investment(FDI) which has been helped build supply chain and is driving
quality and increased organized play in the sector. Social Media, Mobile connectivity and
focused marketing are changing the way. The sector is reaching its customers.
Rise of Online Food Ordering Start-ups in India: Opportunities, Challenges and
Innovations – iamWire
“India is not simply emerging, it has emerged,” said US President Barack Obama. The
entire startup ecosystem in India has changed tremendously over the past ten years. People
now opt for the road not taken; they have shunned the conventional jobs by pursuing out
of the box ideas as their career choices.
Off late, the trend of food startups and online grocery has been catching the spotlight.
India seems to be having a growing appetite for such startups. While online grocery
vertical is garnering its own share of ventures, food ordering and delivery is not far behind.
Overall, the food start-ups are catering to the changing taste of modern India through its
innovative concepts. However, the real challenge lies in the right mix of innovation with
strong business sense in order to attain long term sustainability and scalability.
India Food Services Market Forecast and Opportunities, 2020
India is exhibiting high growth potential for food services, with continuously surging income
and consumption levels. With increase in the number of double income households, the
8
lifestyle of people, including their food habits, is changing. A large base of the population of
the country is getting busier, with lesser time to get involved in household activities or to
indulge in cooking, further driving the market for food services in the country. Further, due to
improved standard of living, people in the country are witnessing a paradigm shift in their
tastes & preferences, wherein, they are foregoing conventional food like dal and rice in favor
of foreign cuisines, thus creating growth opportunities for international brands operating in
the country. Moreover, with changing lifestyle of people, the country has witnessed an
increase in the number and frequency of social gatherings outside of work, which is also
driving the demand for food services in India.
Expansion of brands into tier II and tier III cities, is also a major factor which is expected to
drive growth in food services market of the country over the next five years. In 2013, the
market was dominated by unorganized and non-branded players, however, with growth of
various foreign and domestic brands, these players are expected to lose their market to
organized branded players. Segment-wise, dining food services segment was the largest
contributor in India food services market in 2014, on account of the large number of dining
restaurants in the country. The segment is expected to retain its dominance in the market over
the forecast period as well.
Will food throw up the next Flipkart? – Business Standard
Convenience and value are the two key factors that have led to the exponential growth in
online commerce. After electronics and fashion, the next retail segment to go online is the
food business. Typically, 30-40 per cent of revenue of any food business is spent on
marketing, but with these platforms, the cost of customer acquisition drops down.
But this also means that the market leaders can no longer take their position for granted
because competition is set to explode and rivals can reach more places than before with
these platforms. Saurabh Kochhar, CEO of FoodPanda, says: "The reason behind the
excitement is that as a space it is untouched. As a category, food is an essential item and
there is a repeat business potential. Everybody is trying to grab a piece of the pie of the
food business. Food delivery is a big business in India and the next Flipkart can come out
of this category" (Calkins et al., 2007).
9
2.1 Online Food Ordering Startups in India
“India is not simply emerging, it has emerged,” said US President Barack Obama. The
entire startup ecosystem in India has changed tremendously over the past ten years. People
now opt for the road not taken; they have shunned the conventional jobs by pursuing out
of the box ideas as their career choices.
Off late, the trend of food startups and online grocery has been catching the spotlight.
India seems to be having a growing appetite for such startups. While online grocery
vertical is garnering its own share of ventures, food ordering and delivery is not far behind.
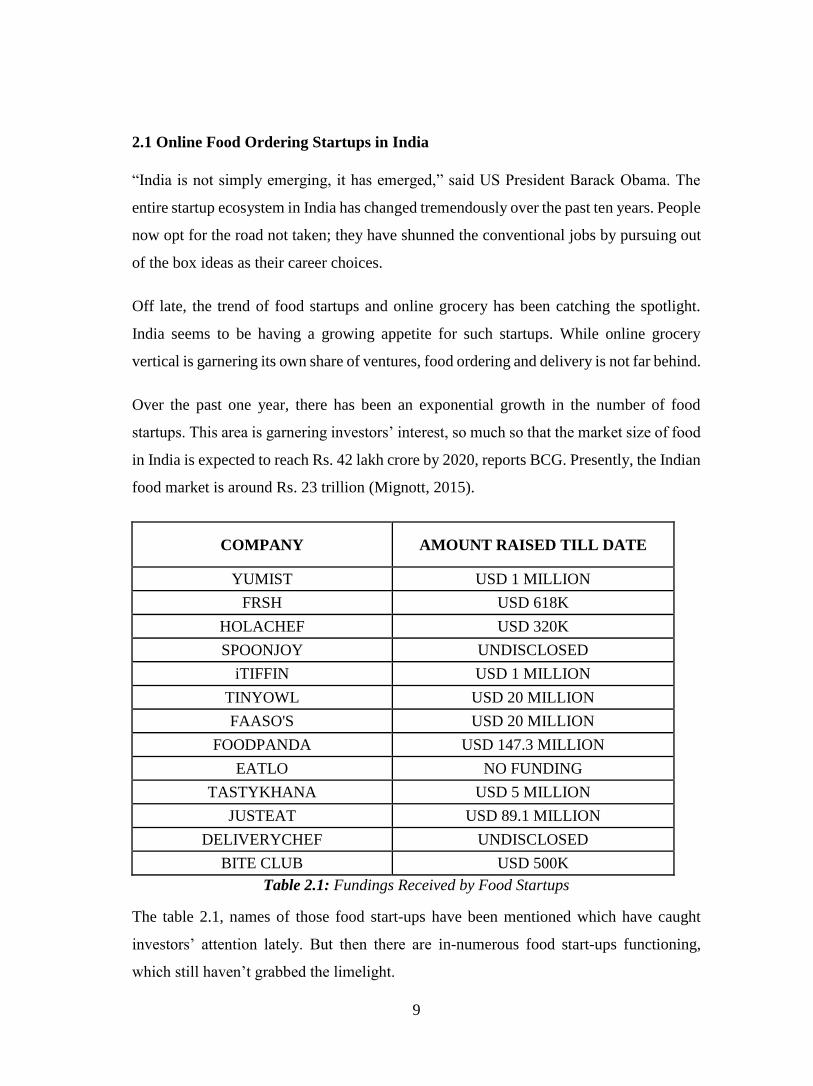
Over the past one year, there has been an exponential growth in the number of food
startups. This area is garnering investors’ interest, so much so that the market size of food
in India is expected to reach Rs. 42 lakh crore by 2020, reports BCG. Presently, the Indian
food market is around Rs. 23 trillion (Mignott, 2015).
COMPANY AMOUNT RAISED TILL DATE
YUMIST USD 1 MILLION
FRSH USD 618K
HOLACHEF USD 320K
SPOONJOY UNDISCLOSED
iTIFFIN USD 1 MILLION
TINYOWL USD 20 MILLION
FAASO'S USD 20 MILLION
FOODPANDA USD 147.3 MILLION
EATLO NO FUNDING
TASTYKHANA USD 5 MILLION
JUSTEAT USD 89.1 MILLION
DELIVERYCHEF UNDISCLOSED
BITE CLUB USD 500K
Table 2.1: Fundings Received by Food Startups
The table 2.1, names of those food start-ups have been mentioned which have caught
investors’ attention lately. But then there are in-numerous food start-ups functioning,
which still haven’t grabbed the limelight.
10
While these are only the newbies in the online food delivery industry who have raised
investments, off late, the already established ones have started carving out a bigger piece
of the pie for themselves. It started with FoodPanda gobbling up its biggest rivals in the
country, Tastykhana and JustEat. And now Zomato too ventured into food ordering and
delivery services.
Additionally, in an interesting twist of events, businesses from different niche have also
decided to experiment in this lucrative business. JustDial made its way into online food
ordering service and cab aggregator Ola has entered this segment with the launch of its
food delivery service in 4 cities (Singh, 2015).
2.2 Innovations and Future Plans
Ex- Flipkart employee led iTiffin plans to launch new products across India, like ‘Munch
Box’ to take care of day snacks and diabetic control ready to cook chapati flour. Also, it
is launching salad (only in Bangalore). With current manpower of 60, the company plans
to gradually expand and grow, starting from Bangalore and then reaching out to other
metropolitan cities.
As for Bhojanshala, their priority domain includes ‘Technology, Service and Customers’,
and in ‘Customers’, the most important thing is, to retain them.
TinyOwl’s future plan is to expand across 50 cities by the end of 2015. Holachef, Eatonomist
and Yumist share similar future plans i.e. to expand and grow fast. Faasos’ plan is to
expand on the entire Asia Pacific platform.
Holachef and Eatonomist are looking to raise an investment in future. Eatonomist has
adopted an innovation in its packaging style. Their package, as claimed by the company
is microwave safe, hygienic and environment friendly.
Snackosaur, who are in talks to raise an investment, recently introduced snack subscription
service, which gets replenished automatically for the customer with variety and a box full
of surprises every time. They have plans of introducing new munchies and snacks in
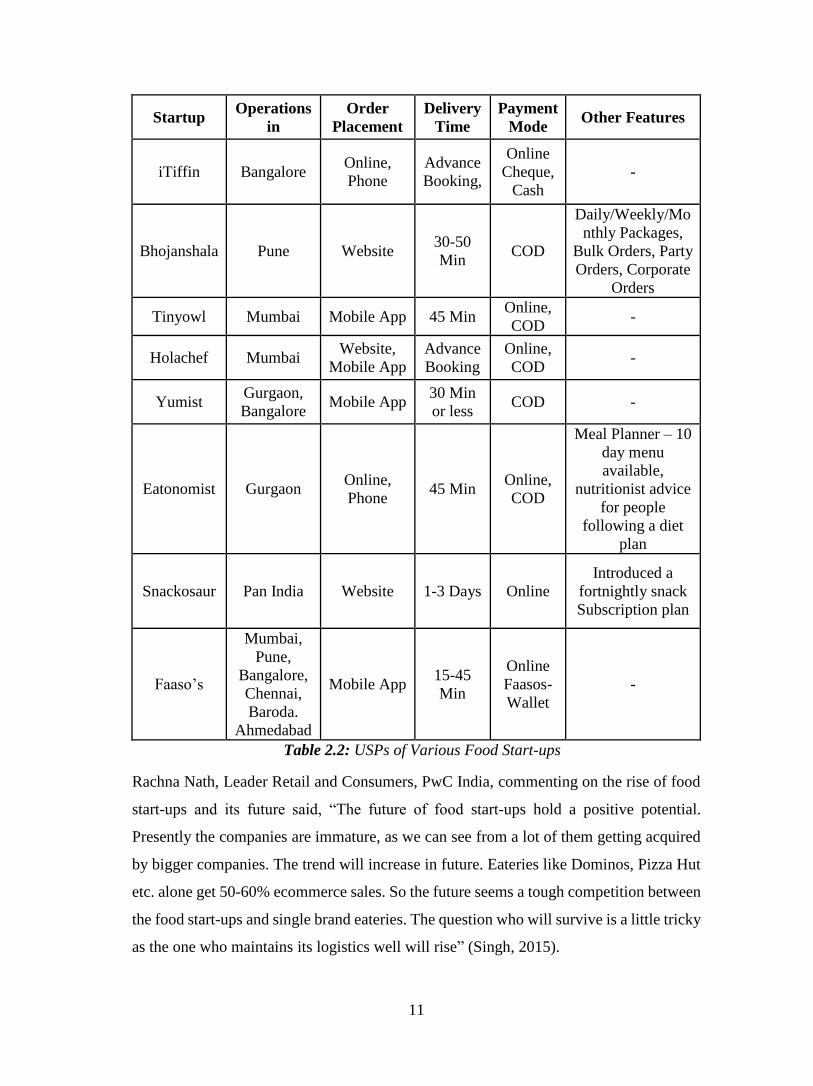
future. While most offer free delivery, owing to their respective USPs they differ in
minimum order and order placement time, have a look at the table 2.2
11
Startup Operations
in
Order
Placement
Delivery
Time
Payment
Mode Other Features
iTiffin Bangalore Online,
Phone
Advance
Booking,
Online
Cheque,
Cash
-
Bhojanshala Pune Website 30-50
Min COD
Daily/Weekly/Mo
nthly Packages,
Bulk Orders, Party
Orders, Corporate
Orders
Tinyowl Mumbai Mobile App 45 Min Online,
COD -
Holachef Mumbai Website,
Mobile App
Advance
Booking
Online,
COD -
Yumist Gurgaon,
Bangalore Mobile App
30 Min
or less COD -
Eatonomist Gurgaon Online,
Phone 45 Min
Online,
COD
Meal Planner – 10
day menu
available,
nutritionist advice
for people
following a diet
plan
Snackosaur Pan India Website 1-3 Days Online
Introduced a
fortnightly snack
Subscription plan
Faaso’s
Mumbai,
Pune,
Bangalore,
Chennai,
Baroda.
Ahmedabad
Mobile App 15-45
Min
Online
Faasos-
Wallet
-
Table 2.2: USPs of Various Food Start-ups
Rachna Nath, Leader Retail and Consumers, PwC India, commenting on the rise of food
start-ups and its future said, “The future of food start-ups hold a positive potential.
Presently the companies are immature, as we can see from a lot of them getting acquired
by bigger companies. The trend will increase in future. Eateries like Dominos, Pizza Hut
etc. alone get 50-60% ecommerce sales. So the future seems a tough competition between
the food start-ups and single brand eateries. The question who will survive is a little tricky
as the one who maintains its logistics well will rise” (Singh, 2015).

12
CHAPTER – 3
RESEARCH METHODOLOGY
3.1. Significance and Scope of the study
This study attempts to identify factors which are likely to affect your online buying
decision of foods and also focus on understanding consumers’ perception towards online
food ordering. The study aims to empirically investigate the relationship between
perceived taste, price, discounts, reviews, advertisements, timely delivery, packaging in
online food ordering services. The scope of this paper is however limited to the residents
of India, chosen for their responses, on the principle of convenience sampling. And within
India, the top players in the online food ordering services segment in India were chosen
based on their popularity.
3.2. Objectives
The following objectives will be covered under this project:
1. To study the various online food ordering services in India.
2. To study the impact of online food ordering services in India and the opportunities
and challenges for the segment in India.
3. To identify the important factors that affect the buying behaviour of
consumer with respect to online food ordering.
4. To analyse Consumer perception towards online food ordering services.
3.3. Hypotheses
Following are the proposed hypotheses for the study:
HA1: Price has significant relationship with quality
HA2: Availability has significant relationship with quality
HA3: Discounts has significant relationship with quality
HA4: Timely Delivery has significant relationship with quality
HA5: Packaging has significant relationship with quality
HA6: Advertisements have significant relationship with quality
13
HA7: Online Review has significant relationship with quality
3.4. Research Design
The research method used is a descriptive research using quantitative analysis. The main
purpose of the study is to find out the relationship between variables, i.e. quality of food
versus online food ordering behaviour, chosen factors (demographic, perceived benefits,
previous online food ordering experiences, consumers’ lifestyles, and perceived online
food ordering platforms’ trustworthiness). It also attempts to determine the relationship
between two or more variables using statistical data and analysis.
3.5. Research Instrument
Research instrument is concerned with how sampling units be approached for obtaining
the desired information. Here research instrument is questionnaire. Questionnaire is a set
of questions with or without blank spaces for recording the answers. Here both open and
closed ended questions are used.
3.6. Population
This paper targets a sample population drawn from consumers who have experienced
online food ordering from urban and rural areas. The number of Internet users in India
was expected to reach 402 million by December 2015, registering a growth of 49 percent
over last year.
3.7. Sample Size
The sample size for this study is 200
3.8. Sampling technique
Non-Probability Sampling - Convenience Sampling. Although this sampling method
adopted has limitations, it is assumed that the sample may be able to represents the
population of Internet users in India. This is on the grounds that the testing system that
has been utilized as a part of this study was likewise a purposive testing as this study has
picked respondents who are web clients.
14
3.9. Sources of Data
There are basically two types of data used for project study:
1. Primary Data: Primary data are those which are collected afresh and for the first
time, and thus they are original data. Primary data are mainly collected through
questionnaire method, which is filled by respondents.
2. Secondary Data: Secondary data means which is readily available from
television, newspaper, magazines etc. Various secondary data which are used for
the study are:-
a) Websites
b) Magazines
3.10. Tool for Data Analysis:
1. IBM SPSS STATISTICS was utilized for implementing Regression and
correlation analysis on the data collected to check and analyze the various factors
which affect the consumers’ online buying decision of food.
2. Pie Charts, Bar Diagrams, Tables, mathematical calculations, Pivot Tables etc.
15
CHAPTER 4
ANALYSIS AND RESULTS
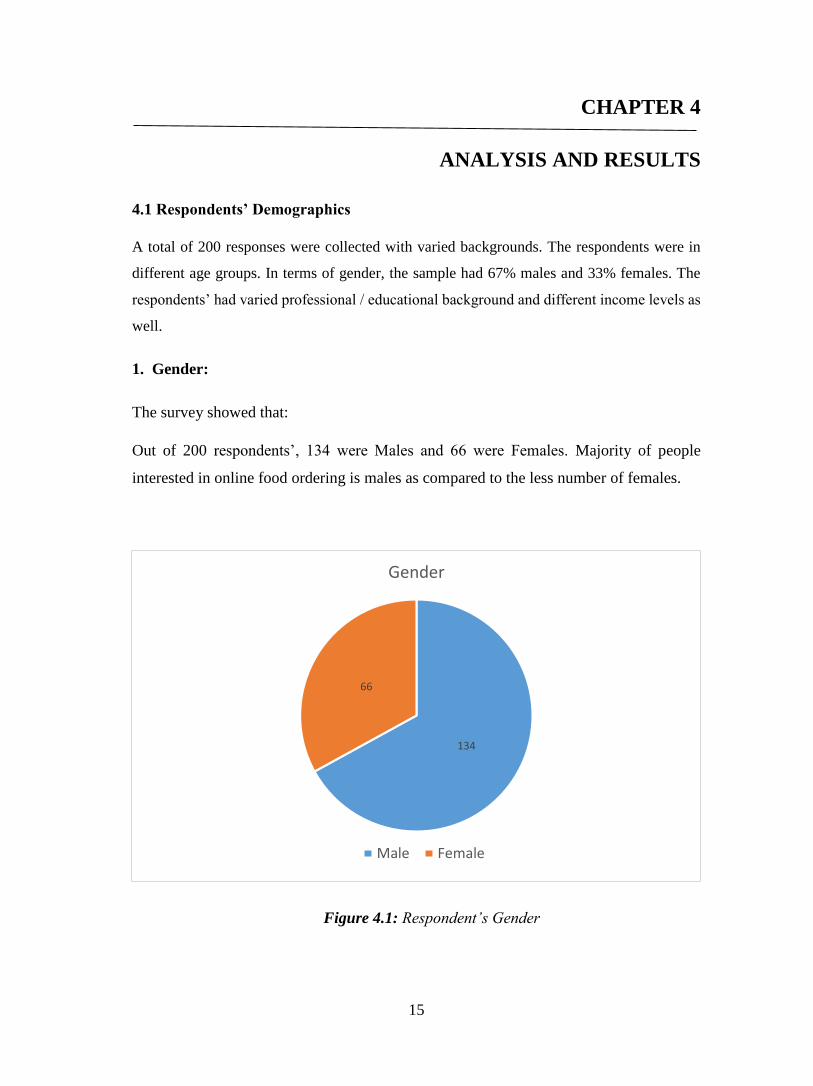
4.1 Respondents’ Demographics
A total of 200 responses were collected with varied backgrounds. The respondents were in
different age groups. In terms of gender, the sample had 67% males and 33% females. The
respondents’ had varied professional / educational background and different income levels as
well.
1. Gender:
The survey showed that:
Out of 200 respondents’, 134 were Males and 66 were Females. Majority of people
interested in online food ordering is males as compared to the less number of females.
Figure 4.1: Respondent’s Gender
134
66
Gender
Male Female
16
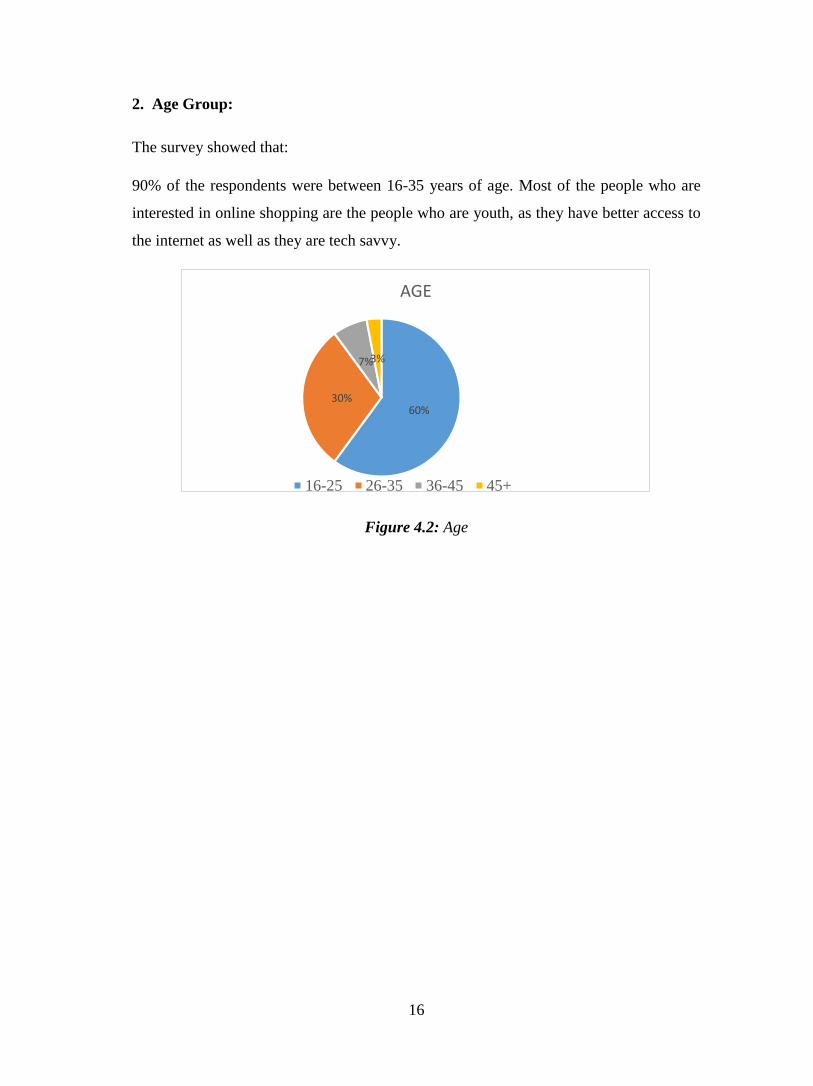
2. Age Group:
The survey showed that:
90% of the respondents were between 16-35 years of age. Most of the people who are
interested in online shopping are the people who are youth, as they have better access to
the internet as well as they are tech savvy.
Figure 4.2: Age
60%30%
7%3%
AGE
16-25 26-35 36-45 45+
17
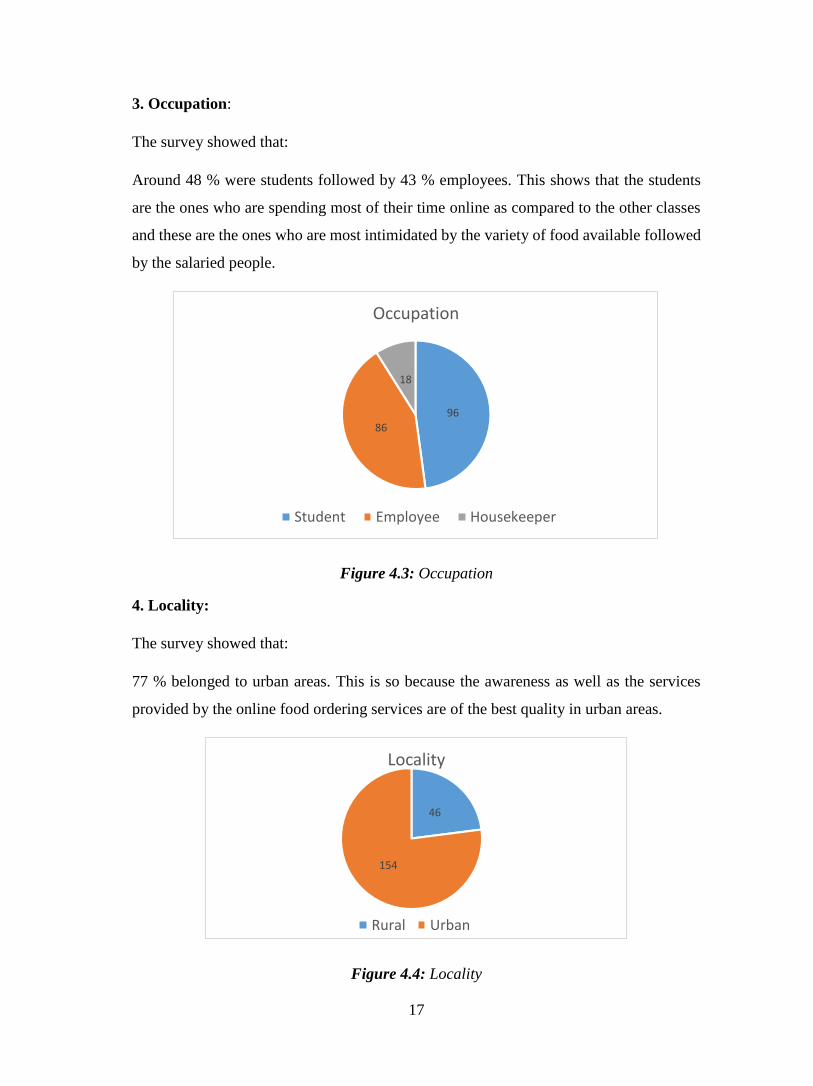
3. Occupation:
The survey showed that:
Around 48 % were students followed by 43 % employees. This shows that the students
are the ones who are spending most of their time online as compared to the other classes
and these are the ones who are most intimidated by the variety of food available followed
by the salaried people.
Figure 4.3: Occupation
4. Locality:
The survey showed that:
77 % belonged to urban areas. This is so because the awareness as well as the services
provided by the online food ordering services are of the best quality in urban areas.
Figure 4.4: Locality
9686
18
Occupation
Student Employee Housekeeper
46
154
Locality
Rural Urban
18
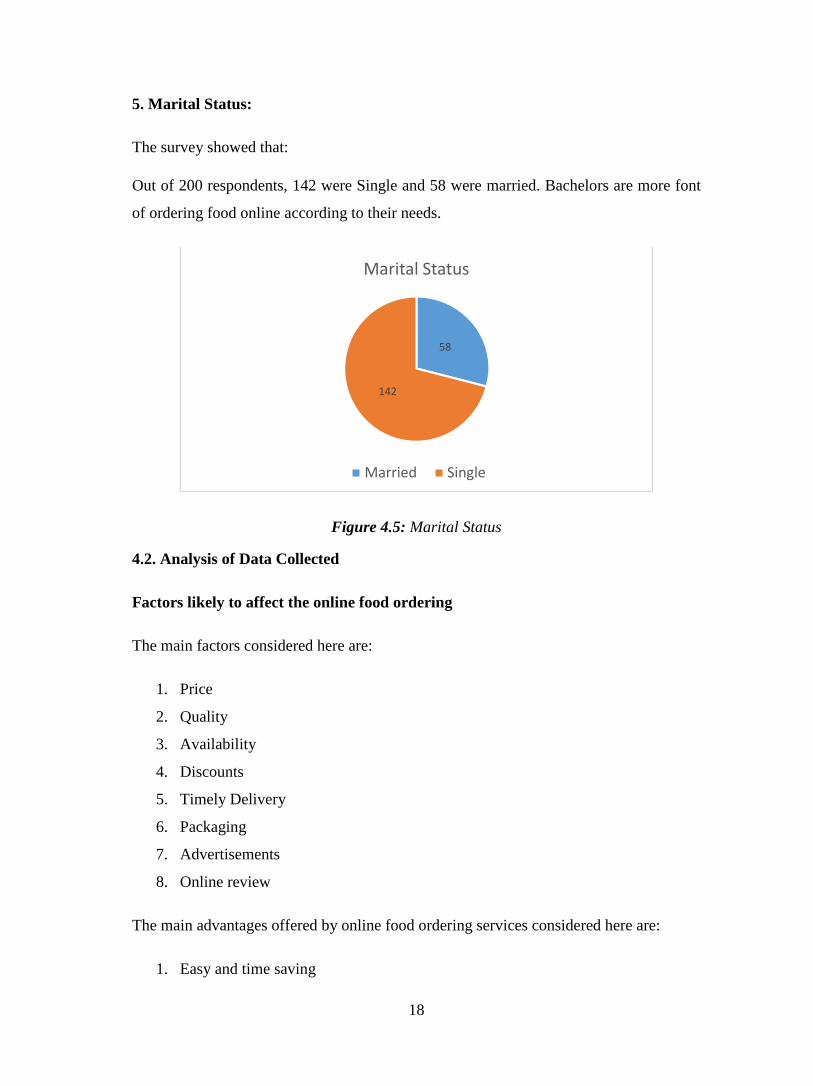
5. Marital Status:
The survey showed that:
Out of 200 respondents, 142 were Single and 58 were married. Bachelors are more font
of ordering food online according to their needs.
Figure 4.5: Marital Status
4.2. Analysis of Data Collected
Factors likely to affect the online food ordering
The main factors considered here are:
1. Price
2. Quality
3. Availability
4. Discounts
5. Timely Delivery
6. Packaging
7. Advertisements
8. Online review
The main advantages offered by online food ordering services considered here are:
1. Easy and time saving
58
142
Marital Status
Married Single
19
2. Convenience
3. Variety of food
4. High discounts
5. Reviews & Recommendations
6. Payment options
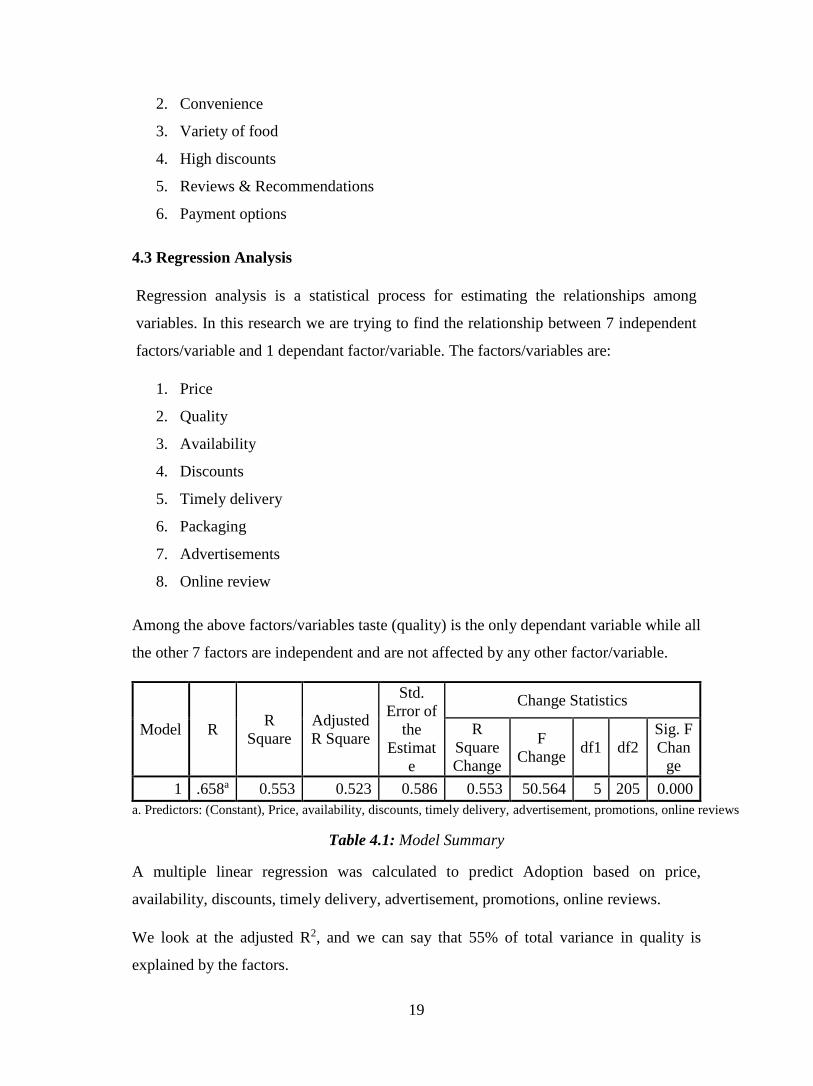
4.3 Regression Analysis
Regression analysis is a statistical process for estimating the relationships among
variables. In this research we are trying to find the relationship between 7 independent
factors/variable and 1 dependant factor/variable. The factors/variables are:
1. Price
2. Quality
3. Availability
4. Discounts
5. Timely delivery
6. Packaging
7. Advertisements
8. Online review
Among the above factors/variables taste (quality) is the only dependant variable while all
the other 7 factors are independent and are not affected by any other factor/variable.
Model R R
Square
Adjusted
R Square
Std.
Error of
the
Estimat
e
Change Statistics
R
Square
Change
F
Change df1 df2
Sig. F
Chan
ge
1 .658a 0.553 0.523 0.586 0.553 50.564 5 205 0.000
a. Predictors: (Constant), Price, availability, discounts, timely delivery, advertisement, promotions, online reviews
Table 4.1: Model Summary
A multiple linear regression was calculated to predict Adoption based on price,
availability, discounts, timely delivery, advertisement, promotions, online reviews.
We look at the adjusted R2, and we can say that 55% of total variance in quality is
explained by the factors.
20
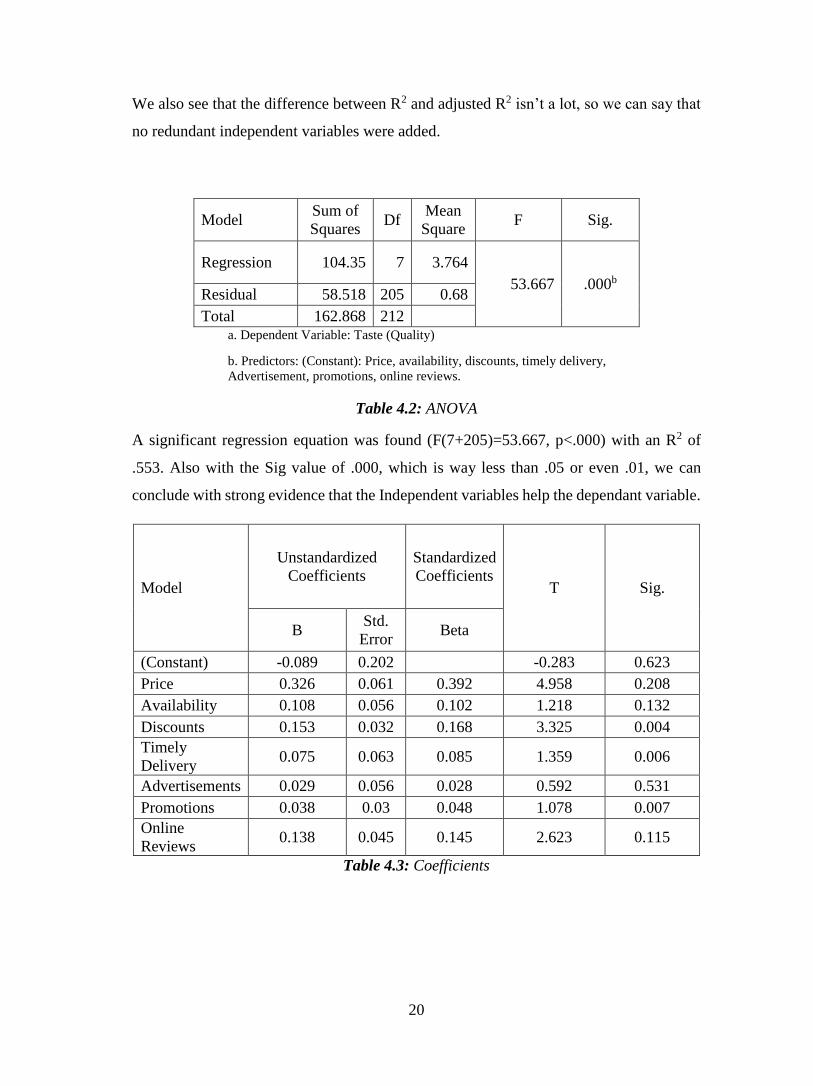
We also see that the difference between R2 and adjusted R2 isn’t a lot, so we can say that
no redundant independent variables were added.
Model Sum of
Squares Df
Mean
Square F Sig.
Regression 104.35 7 3.764
53.667 .000b Residual 58.518 205 0.68
Total 162.868 212 a. Dependent Variable: Taste (Quality)
b. Predictors: (Constant): Price, availability, discounts, timely delivery,
Advertisement, promotions, online reviews.
Table 4.2: ANOVA
A significant regression equation was found (F(7+205)=53.667, p<.000) with an R2 of
.553. Also with the Sig value of .000, which is way less than .05 or even .01, we can
conclude with strong evidence that the Independent variables help the dependant variable.
Model
Unstandardized
Coefficients
Standardized
Coefficients T Sig.
B Std.
Error Beta
(Constant) -0.089 0.202 -0.283 0.623
Price 0.326 0.061 0.392 4.958 0.208
Availability 0.108 0.056 0.102 1.218 0.132
Discounts 0.153 0.032 0.168 3.325 0.004
Timely
Delivery 0.075 0.063 0.085 1.359 0.006
Advertisements 0.029 0.056 0.028 0.592 0.531
Promotions 0.038 0.03 0.048 1.078 0.007
Online
Reviews 0.138 0.045 0.145 2.623 0.115
Table 4.3: Coefficients

21
Taste (quality) is equal to
-0.089 + 0.326 (Price) + .108 (Availability) + .153 (Discounts) + 0.075 (Timely Delivery)
+ 0.029 (Advertisements) + 0.038 (Promotions) + 0.138 (Online Reviews), where the
factors are coded as
1- Extremely Likely
2- Likely
3- Neutral
4- Unlikely
5- Extremely Unlikely
Among the factors, it was seen that Discounts (0.004), Timely Delivery (0.006) and
Promotions (0.007) were significant predictors of Adoption, while Price (0.208),
Availability (0.132), Advertisements (0.531) and Online Reviews (0.115) weren’t.
4.4 Correlation Analysis
Correlation and regression analysis are related in the sense that both deal with
relationships among variables. The correlation coefficient is a measure of linear
association between two variables. Correlation coefficients are always between +1 and -
1. +1 means perfect positive and -1 means perfect negative correlation, which means they
are exactly on a straight line.
4.4.1 Price and Quality
Quality Price
Price Pearson Correlation
1 .413**
Sig. (2-tailed)
.000
N 197 196
Quality Pearson Correlation
.413** 1
Sig. (2-tailed)
.000
N 196 196
**. Correlation is significant at the 0.05 level (2-tailed).
Table 4.4: Correlation with Price
We can see that Price has a correlation of .413 with Quality, which shows a positive and
strong linear relationship between the two variables.
22
Also, the level of significance chosen was 0.05. And studying the table it can be seen
that the significance value (Sig) is below 0.05. So the correlation is statistically
significant.
There is enough evidence to suggest that the correlation we observed does exist in the
population and they did not occur by chance.
HA1 is supported thus showing a significant relationship between these two.
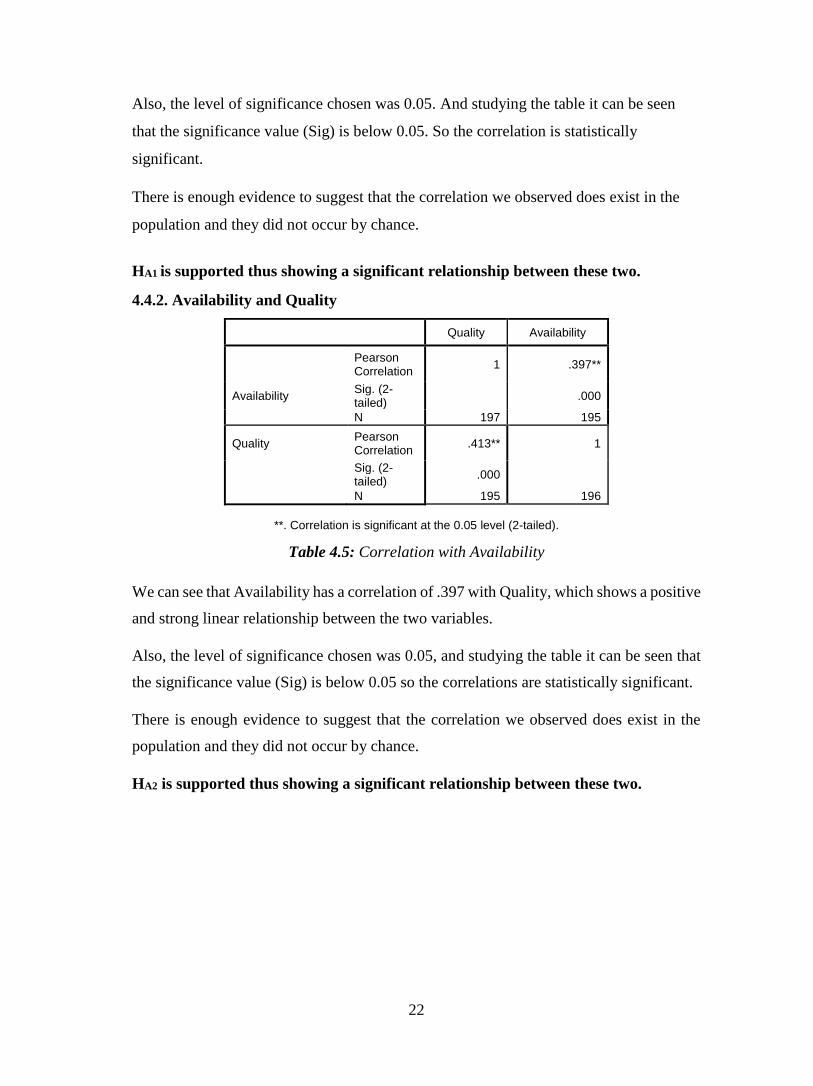
4.4.2. Availability and Quality
Quality Availability
Pearson Correlation
1 .397**
Availability Sig. (2-tailed)
.000
N 197 195
Quality Pearson Correlation
.413** 1
Sig. (2-tailed)
.000
N 195 196
**. Correlation is significant at the 0.05 level (2-tailed).
Table 4.5: Correlation with Availability
We can see that Availability has a correlation of .397 with Quality, which shows a positive
and strong linear relationship between the two variables.
Also, the level of significance chosen was 0.05, and studying the table it can be seen that
the significance value (Sig) is below 0.05 so the correlations are statistically significant.
There is enough evidence to suggest that the correlation we observed does exist in the
population and they did not occur by chance.
HA2 is supported thus showing a significant relationship between these two.
23
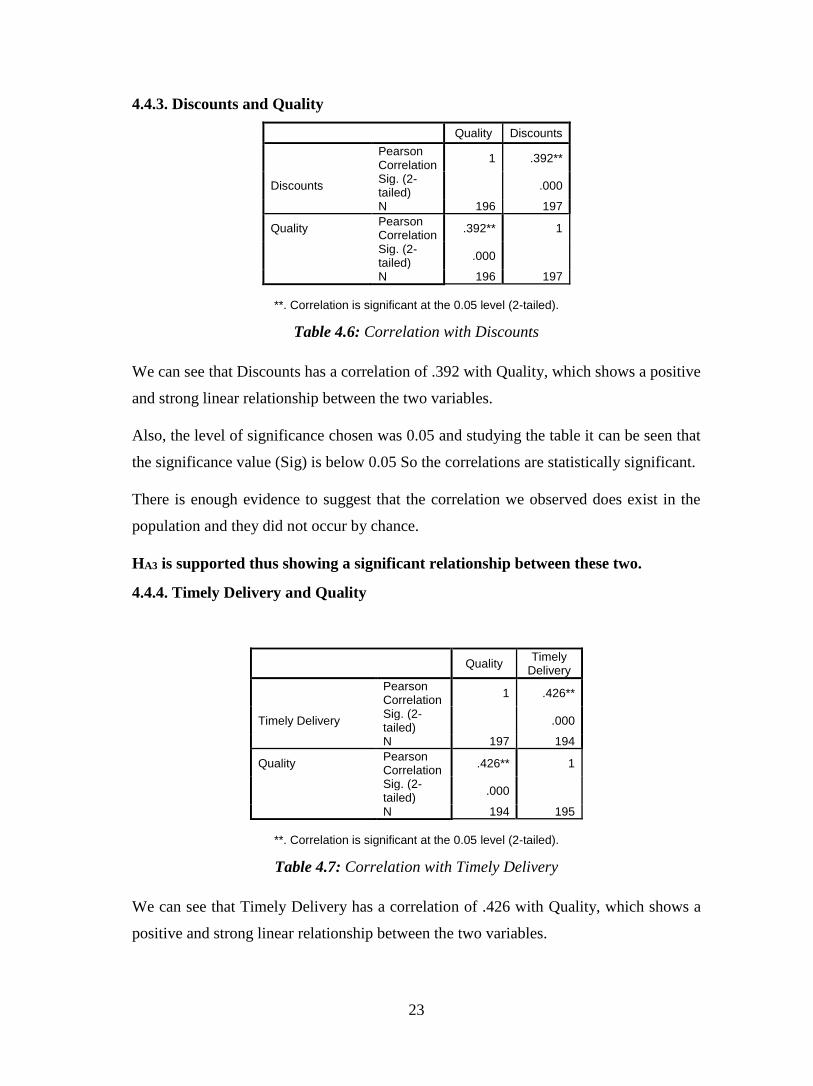
4.4.3. Discounts and Quality
Quality Discounts
Pearson Correlation
1 .392**
Discounts Sig. (2-tailed)
.000
N 196 197
Quality Pearson Correlation
.392** 1
Sig. (2-tailed)
.000
N 196 197
**. Correlation is significant at the 0.05 level (2-tailed).
Table 4.6: Correlation with Discounts
We can see that Discounts has a correlation of .392 with Quality, which shows a positive
and strong linear relationship between the two variables.
Also, the level of significance chosen was 0.05 and studying the table it can be seen that
the significance value (Sig) is below 0.05 So the correlations are statistically significant.
There is enough evidence to suggest that the correlation we observed does exist in the
population and they did not occur by chance.
HA3 is supported thus showing a significant relationship between these two.
4.4.4. Timely Delivery and Quality
Quality Timely
Delivery
Pearson Correlation
1 .426**
Timely Delivery Sig. (2-tailed)
.000
N 197 194
Quality Pearson Correlation
.426** 1
Sig. (2-tailed)
.000
N 194 195
**. Correlation is significant at the 0.05 level (2-tailed).
Table 4.7: Correlation with Timely Delivery
We can see that Timely Delivery has a correlation of .426 with Quality, which shows a
positive and strong linear relationship between the two variables.
24
Also, the level of significance chosen was 0.05, and studying the table it can be seen that
the significance value (Sig) is below 0.05.So the correlations are statistically significant.
There is enough evidence to suggest that the correlation we observed does exist in the
population and they did not occur by chance.
HA4 is supported thus showing a significant relationship between these two.
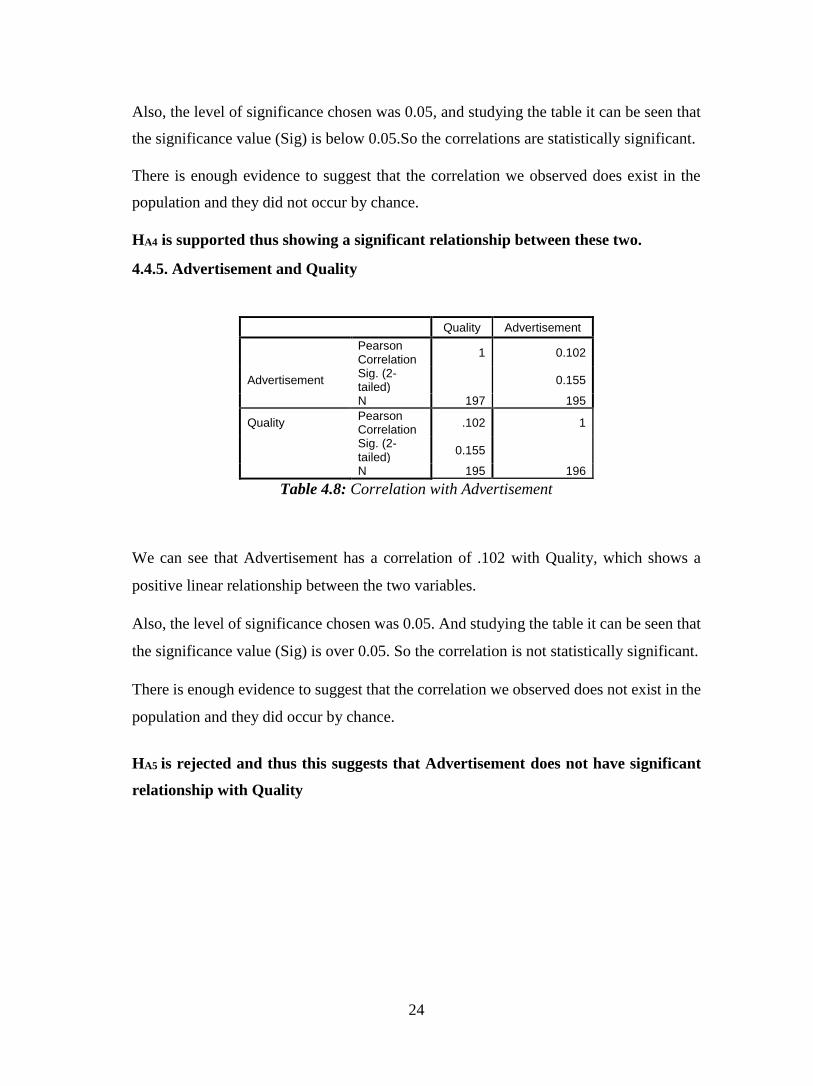
4.4.5. Advertisement and Quality
Table 4.8: Correlation with Advertisement
We can see that Advertisement has a correlation of .102 with Quality, which shows a
positive linear relationship between the two variables.
Also, the level of significance chosen was 0.05. And studying the table it can be seen that
the significance value (Sig) is over 0.05. So the correlation is not statistically significant.
There is enough evidence to suggest that the correlation we observed does not exist in the
population and they did occur by chance.
HA5 is rejected and thus this suggests that Advertisement does not have significant
relationship with Quality
Quality Advertisement
Pearson Correlation
1 0.102
Advertisement Sig. (2-tailed)
0.155
N 197 195
Quality Pearson Correlation
.102 1
Sig. (2-tailed)
0.155
N 195 196
25
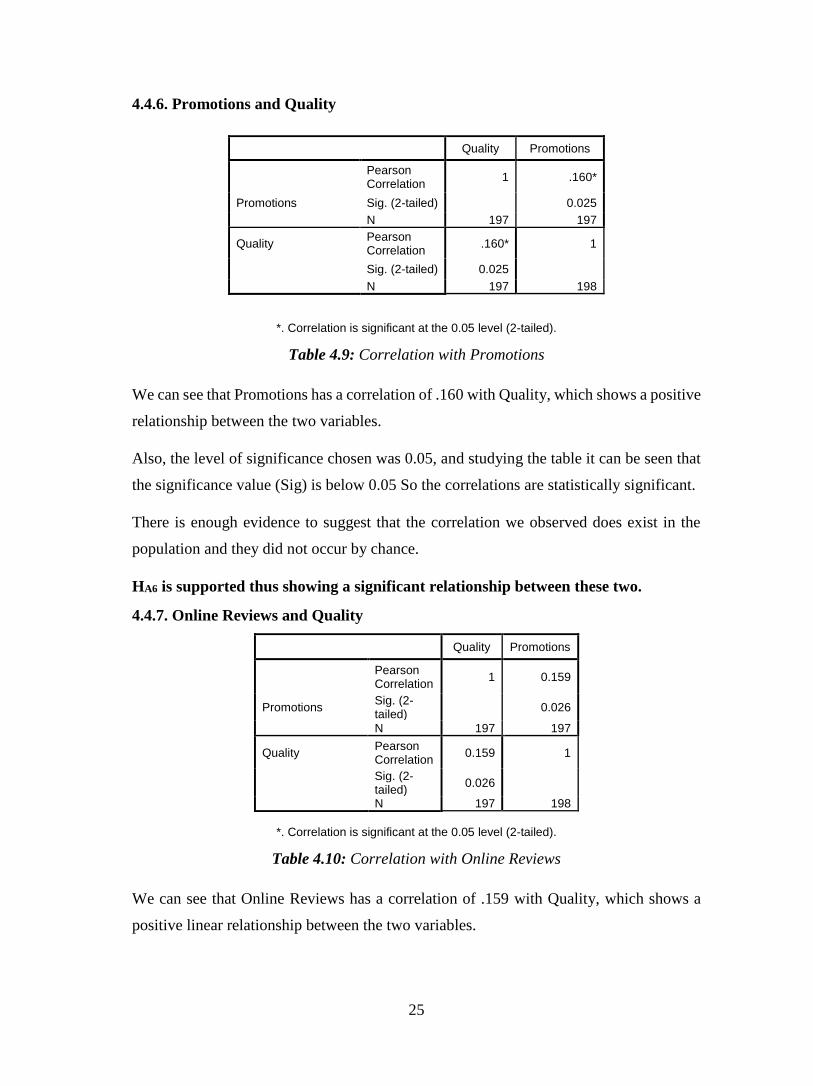
4.4.6. Promotions and Quality
*. Correlation is significant at the 0.05 level (2-tailed).
Table 4.9: Correlation with Promotions
We can see that Promotions has a correlation of .160 with Quality, which shows a positive
relationship between the two variables.
Also, the level of significance chosen was 0.05, and studying the table it can be seen that
the significance value (Sig) is below 0.05 So the correlations are statistically significant.
There is enough evidence to suggest that the correlation we observed does exist in the
population and they did not occur by chance.
HA6 is supported thus showing a significant relationship between these two.
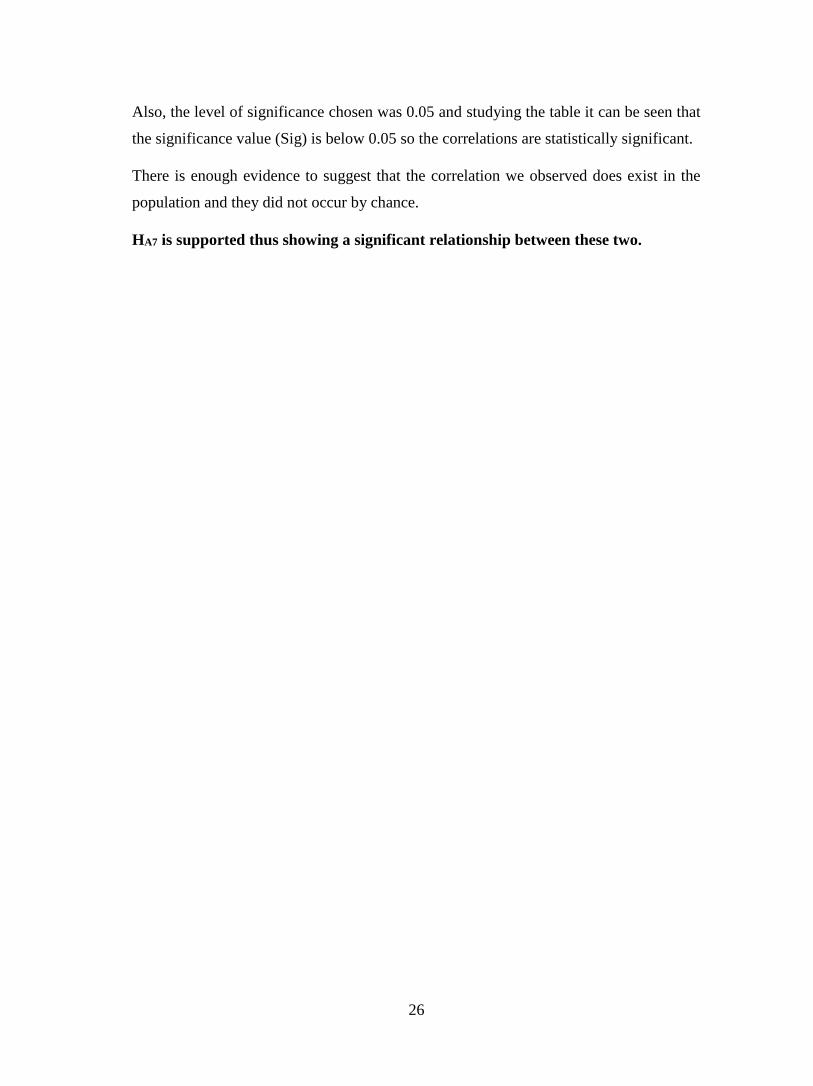
4.4.7. Online Reviews and Quality
Quality Promotions
Pearson Correlation
1 0.159
Promotions Sig. (2-tailed)
0.026
N 197 197
Quality Pearson Correlation
0.159 1
Sig. (2-tailed)
0.026
N 197 198
*. Correlation is significant at the 0.05 level (2-tailed).
Table 4.10: Correlation with Online Reviews
We can see that Online Reviews has a correlation of .159 with Quality, which shows a
positive linear relationship between the two variables.
Quality Promotions
Pearson Correlation
1 .160*
Promotions Sig. (2-tailed) 0.025
N 197 197
Quality Pearson Correlation
.160* 1
Sig. (2-tailed) 0.025 N 197 198
26
Also, the level of significance chosen was 0.05 and studying the table it can be seen that
the significance value (Sig) is below 0.05 so the correlations are statistically significant.
There is enough evidence to suggest that the correlation we observed does exist in the
population and they did not occur by chance.
HA7 is supported thus showing a significant relationship between these two.
27
CHAPTER 5
LIMITATIONS AND RECOMMENDATIONS
5.1. Limitations:
1. The sample was not random due to the self- response nature of the specific online
panel survey
2. There was a time limit for this research that was close to 3 months.
3. This research has used a questionnaire survey. There could be the possibility that
the respondents did not understand the question or answered incorrectly. This
could have affected the results.
4. The questionnaire filled by the respondents may be filled with a casual approach
and not taken seriously.
5. Sample size can be one of the limitations of the study.
6. There may be biasness by the respondent to keep his good image and he/she may
have filled the answers which are most likely to represent his good image.
7. This research is limited to the audience of India, and it may yield different results
with consumers outside India
5.2 Recommendations:
To retain the customers, a mix of marketing tools such as public relations, advertising,
promotions, direct marketing and Internet advertising should be used. Customer loyalty
programs should be initiated. In addition to this, the food startups in India must attract a
growing segment of customers who are technologically competent, place a high emphasis
on convenience, and are willing to pay a premium price if they find the product they are
looking for. Therefore, they need to improve convenience and value for consumers and
assist them in overcoming their fears around security.
28
They must also provide reluctant consumers with compelling reasons for accepting the
Internet as a new way to shop. Some of these reasons might include the use of consumer
assurance brands and enhanced levels of convenience, customization, selections, service
and pricing. While skills like speed, differentiation, and branding are very more important
in the digital world, it is the ability to transform core operations and practices to this new
medium which might make the difference between success and failure.
In a nutshell, the main recommendations and suggestions for online food startups in India
are:
1. Focus on technology. Differentiating and value providing technology will be
easily accepted by the customers and will increase brand loyalty.
2. The food startups compete highly on delivery times. Tie up with logistic partners
can help in giving a competitive delivery time.
3. A strong correlation was found between quality and price. It can be said that
organizations should target on price and quality.
4. Using the correlation between quality and availability it can be recommended that
more focus on timely delivery, discounts, and promotions.
5. Organizations need not devote a lot of resources into making advertisements. The
relation between quality and advertisement isn’t marginal and can be set aside on
a low priority.
6. With a long term strategy, I feel startups should decrease their reliance on giving
huge discounts as it will backfire in the future. Rather than giving huge discounts,
focus on providing satisfying service and create brand advocates.
29
CHAPTER 6
CONCLUSION
This research tries to understand the factors that influence the online food ordering and
the consumer perception towards the online food ordering service.
The report suggests that the frequency of urban population, purchasing food online has
been quite high.
The major factors that plays an important role in leading to online food purchase are price,
taste, availability, timely delivery, discounts, reviews, packaging and advertisements.
In India, the trend of ordering food online is picking up. For the study of the variables,
questionnaire was used.. A total of 200 questionnaires were used for analysis and SPSS
was used for finding out result of data analysis.
The study utilized a descriptive research method with a 9 question survey to gain in depth
knowledge regarding the factors chosen. Such an in depth approach gives a thorough base
for future exploration supporting the quality of the food. The findings give helpful
knowledge to online food ordering services to create proper business techniques to
enhance the online food ordering sector.
From the correlation, it is clear that all the factors have strong correlation with quality of
food. Also from the study it is safer to say that, there is a significant relationship between
factor likely to affect online food ordering services and quality of food. Hence, we can
infer that quality of food is influenced by the factors that have been considered in the
study.

30
REFERENCES
Calkins, J. D., Farello, M. J. and Shi, C. S. (2007). From retailing to E-tailing, The
Mckinsey Quarterly, PP. 140-147.
Schiffman, et al (2015), Consumer Behavior : Pearson, 11th Edition, NY
Indian Food Industry, (2016). Available at: http://www.ibef.org/industry/indian-food-
industry.aspx (Accessed on 5th April, 2016)
India Food Services Story, (2011). Available at: http://maple-advisors.com/India Food
Services Story Maple Capital Advisors (Accessed on 5th April, 2016)
Singh, B. (2015). Rise of Online Food Ordering Startups in India: Opportunities,
Challenges and Innovations. Available at: http://www.iamwire.com/2015/03/rise-online-
food-ordering-startups-india-opportunities-challenges-innovations/113052 (Accessed on
6th April, 2016).
Mignott, M. (2015), The Billion Dollar Food Delivery Wars, Available at:
http://techcrunch.com/2015/07/11/the-billion-dollar-food-delivery-wars/ (Accessed on
6th April 2016)
Carmody, B. (2016), The rise of restaurant delivery platforms: Should your business get
on board?, Available at: http://www.smartcompany.com.au/growth/64525-the-rise-of-
restaurant-delivery-services-should-your-business-get-onboard/ (Accessed on 6th April
2016)
Ernst & Young, (2013). Re-birth of e-commerce in India. Available at :
http://www.ey.com/Publication/vwLUAssets/Rebirth_of_e-
Commerce_in_India/$FILE/EY_RE-BIRTH_OF_ECOMMERCE.pdf (Accessed on 6th
April 2016)
31
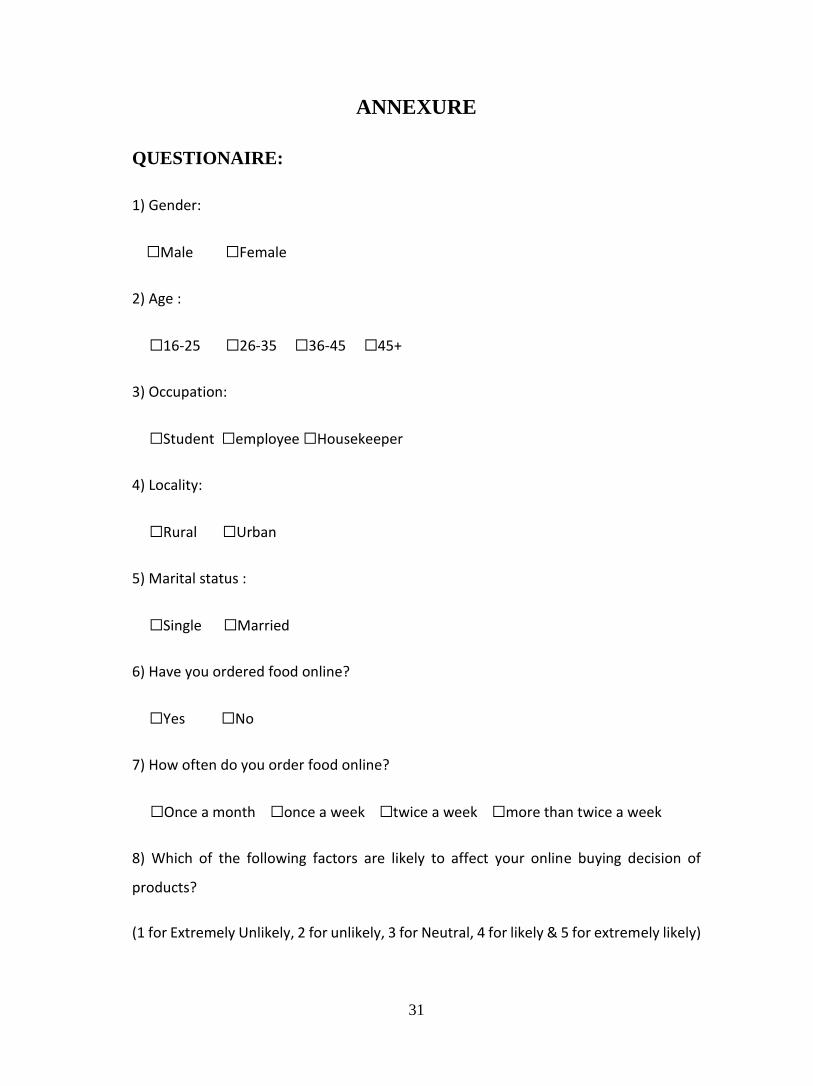
ANNEXURE
QUESTIONAIRE:
1) Gender:
☐Male ☐Female
2) Age :
☐16-25 ☐26-35 ☐36-45 ☐45+
3) Occupation:
☐Student ☐employee ☐Housekeeper
4) Locality:
☐Rural ☐Urban
5) Marital status :
☐Single ☐Married
6) Have you ordered food online?
☐Yes ☐No
7) How often do you order food online?
☐Once a month ☐once a week ☐twice a week ☐more than twice a week
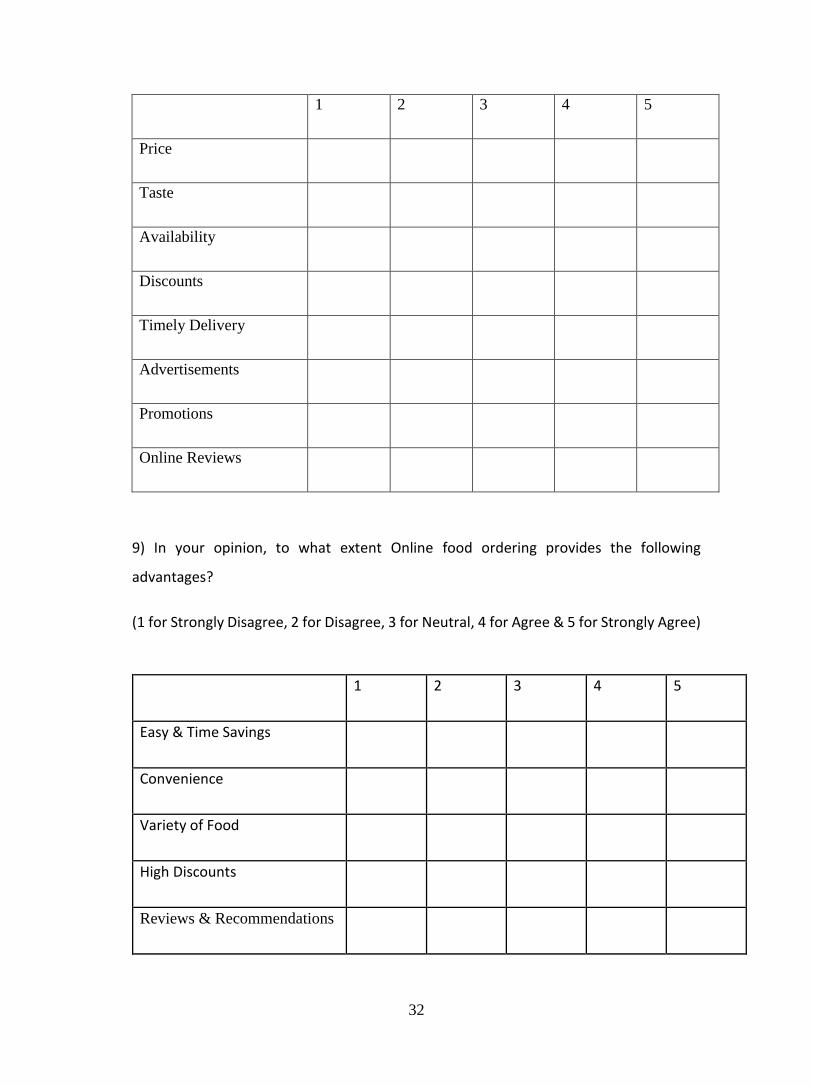
8) Which of the following factors are likely to affect your online buying decision of
products?
(1 for Extremely Unlikely, 2 for unlikely, 3 for Neutral, 4 for likely & 5 for extremely likely)
32
1 2 3 4 5
Price
Taste
Availability
Discounts
Timely Delivery
Advertisements
Promotions
Online Reviews
9) In your opinion, to what extent Online food ordering provides the following
advantages?
(1 for Strongly Disagree, 2 for Disagree, 3 for Neutral, 4 for Agree & 5 for Strongly Agree)
1 2 3 4 5
Easy & Time Savings
Convenience
Variety of Food
High Discounts
Reviews & Recommendations