factors affecting consumer perception towards
62
i | Page FACTORS AFFECTING CONSUMER PERCEPTION TOWARDS BOTTLED WATER IN A.A. THE CASE OF AQUADDIS A THESIS SUBMITTED TO THE SCHOOL OF GRADUATE STUDIES OF ADDIS ABABA UNIVERSITY SCHOOL OF COMMERCE FOR PARTIAL FULFILLMENT OF THE DEGREE OF MASTERS OF ARTS IN MARKETING MANAGEMENT BY: JEMAL KEDIR ADDIS ABABA UNIVERSITY JUNE, 2019 ADDIS ABABA, ETHIOPIA
-
Upload
khangminh22 -
Category
Documents
-
view
4 -
download
0
Transcript of factors affecting consumer perception towards

i | P a g e
FACTORS AFFECTING CONSUMER PERCEPTION TOWARDS
BOTTLED WATER IN A.A. THE CASE OF AQUADDIS
A THESIS SUBMITTED TO THE SCHOOL OF GRADUATE STUDIES OF
ADDIS ABABA UNIVERSITY SCHOOL OF COMMERCE FOR PARTIAL
FULFILLMENT OF THE DEGREE OF MASTERS OF ARTS IN
MARKETING MANAGEMENT
BY:
JEMAL KEDIR
ADDIS ABABA UNIVERSITY
JUNE, 2019
ADDIS ABABA, ETHIOPIA
ii | P a g e
A THESIS OF FACTORS AFFECTING CONSUMER PERCEPTION
TOWARDS BOTTLED WATER IN A.A, THE CASE OF AQUADDIS
A THESIS SUBMITTED TO THE DEPARTMENT OF
MARKETING MANAGEMENT PROGRAM
COLLEGE OF COMMERCE
ADDIS ABABA UNIVERSITY
IN PARTIAL FULFILLMENT OF THE REQUIREMENTS FOR THE
DEGREE OF MASTERS OF ARTS IN MARKETING MANAGEMENT
BY:
JEMAL KEDIR
JUNE, 2019
ADDIS ABABA UNIVERSITY
ADDIS ABABA
iii | P a g e
ADDIS ABABA UNIVERSITY
COLLEGE OF COMMERCE
DEPARTMENT OF MARKETING MANAGEMENT
SUPPORTED DISTANCE EDUCATION PROGRAM
FACTORS AFFECTING CONSUMER PERCEPTION TOWARDS
BOTTLED WATER IN A.A, THE CASE OF AQUADDIS
BY: JEMAL KEDIR
APPROVED BY THE COMMITTEE OF EXAMINERS
ADVISOR: SIGNATURE: DATE:
________________________ ________________ __________
INTERNAL EXAMINER: SIGNATURE: DATE:
________________________ _________________ __________
EXTERNAL EXAMINER: SIGNATURE: DATE:
________________________ ________________ __________
iv | P a g e
DECLARATION
I hereby declare that this write-up is the output of my own work as a requirement on the behalf
of the fulfillment of Masters of Marketing Management in Addis Ababa University College of
commerce and I declare sincerely that, it is not a duplication of any previous work of any person
of this institution or another. All extracts from other published materials have been duly
acknowledged.
STUDENT: SIGNATURE:
JEMAL KEDIR ____________________
v | P a g e
ABSTRACT
There has been a high influx of many brands of bottled water in the Ethiopian market over the
decade but a few have been competitive. This work was carried out to determine the factors that
affect the perception of consumers on the performance of bottled Water Companies. The study
takes both qualitative and quantitative approaches were employed. A sample size of 279
respondents was selected from different cafeterias and restaurants using a non-probability
convenient sampling as it is relatively quick, convenient, and less expensive for collecting data
(Sekaran and Bougie, 2009). The work was analyzed using descriptive statistics, correlation
analysis and regression analysis.
The factors, brand image, taste of the bottled water, perceived price, promotional activity and
packaging attribute; taken as the factors which influences the perception of the consumers’. In
general all the five variables have a positive impact on consumers’ perception as per the study
however, Price, is the least factor to influence on customer choice of bottled water, when
comparing with the remaining factors, beside this taste of the water was the strongest factor on
consumer perception to choose a specific brand.
Consumer perceived price as over rating therefore taking price as one of the competitive
strategy, despite of the least correlated with consumer perception, regarding handling of
packaging, the shape is one of the influential attribute in consumers’ perception. Consumers’, the
taste of bottled water also the influential factor of perceptual process for most of the respondents;
The outcome of the study also registered clearly that the electronic media advertisement,
influences the choice of many consumers as to what brand to purchase. This evidently applied to
those who are not strictly adapted with a particular brand. A few consumers of bottle water are
strong patrons of the brand; so it is a more influential on the demand side of the market.
Promotional activity of AQUADDIS also used as a tool to attract the consumers, but it is not
presented timely and in attractive way as most of the respondents feedback. Therefore the
company has to work on the promotion intensively to be more addressable and attractively.
One of the aims of the study was to assess the effect of brand image of bottle water on customer
loyalty. It was therefore realized that branding is the complex collection of everything the
consumer will want in bottled water. In view of this, AQUADDIS bottle Water Company has to
adopt a holistic management approach of ensuring that both the content, the packaging of their
products as well as their customer service are excellently pursued. It was also revealed in the
vi | P a g e
study that consumer response or feedback after using consuming the water product is very vital
to brand performance. The perception of the consumer on the brand of any product cannot be
taken for granted if a company is to achieve competitiveness.
As per the finding, AQUADDIS is the second most preferable water following YES water, as
both are a forerunner on packaged water industry and being a forerunner and availability also a
factor for purchasing a bottle water.
Key words: AQUADDIS, Packaged water, price, taste of bottled water, promotion,
packaging attribute, brand image and consumer perception.
vii | P a g e
ACKNOWLEDGEMENT
My deepest appreciation goes to the Almighty, who has made this work possible out of His
abundance of grace, after him my compliment is goes to my family for all of the support to stand
with me especially my sister. A special gratitude I will give to my internship advisor Dr.
Hailemariam Kebede whose contribution in stimulating suggestions and encouragement helped
me to coordinate my research work especially in writing this paper. I would also like to show my
gratitude towards all my colleagues and friends, for creating a supportive and interactive work
environment. I would like to thank all those who took their time to fill in my survey
questionnaires and provide insightful feedback. Along with that, all my appreciation deserves to
the supervisor of Zone cafeteria, the owner of Selam café, Qawa restaurant, Chemba coffee,
Down town restaurant and Royal College for helping me out.
viii | P a g e
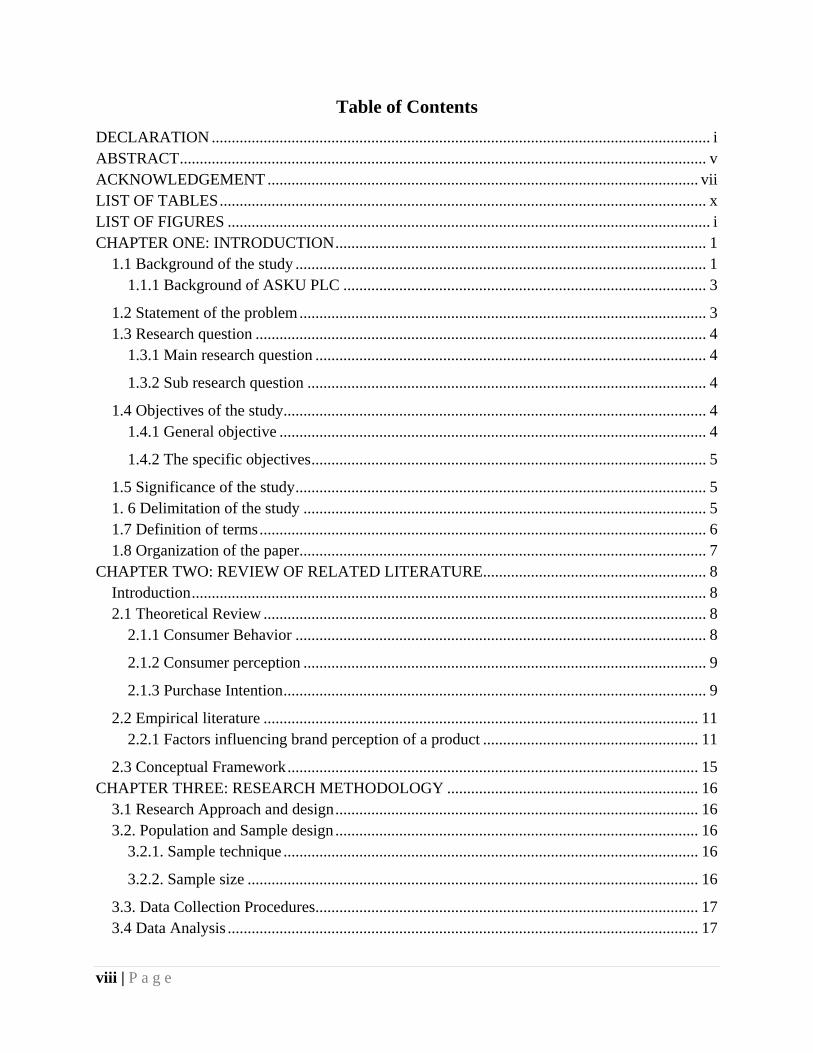
Table of Contents
DECLARATION ............................................................................................................................. i
ABSTRACT .................................................................................................................................... v
ACKNOWLEDGEMENT ............................................................................................................ vii
LIST OF TABLES .......................................................................................................................... x
LIST OF FIGURES ......................................................................................................................... i
CHAPTER ONE: INTRODUCTION ............................................................................................. 1
1.1 Background of the study ....................................................................................................... 1
1.1.1 Background of ASKU PLC ........................................................................................... 3
1.2 Statement of the problem ...................................................................................................... 3
1.3 Research question ................................................................................................................. 4
1.3.1 Main research question .................................................................................................. 4
1.3.2 Sub research question .................................................................................................... 4
1.4 Objectives of the study.......................................................................................................... 4
1.4.1 General objective ........................................................................................................... 4
1.4.2 The specific objectives ................................................................................................... 5
1.5 Significance of the study ....................................................................................................... 5
1. 6 Delimitation of the study ..................................................................................................... 5
1.7 Definition of terms ................................................................................................................ 6
1.8 Organization of the paper ...................................................................................................... 7
CHAPTER TWO: REVIEW OF RELATED LITERATURE ........................................................ 8
Introduction ................................................................................................................................. 8
2.1 Theoretical Review ............................................................................................................... 8
2.1.1 Consumer Behavior ....................................................................................................... 8
2.1.2 Consumer perception ..................................................................................................... 9
2.1.3 Purchase Intention .......................................................................................................... 9
2.2 Empirical literature ............................................................................................................. 11
2.2.1 Factors influencing brand perception of a product ...................................................... 11
2.3 Conceptual Framework ....................................................................................................... 15
CHAPTER THREE: RESEARCH METHODOLOGY ............................................................... 16
3.1 Research Approach and design ........................................................................................... 16
3.2. Population and Sample design ........................................................................................... 16
3.2.1. Sample technique ........................................................................................................ 16
3.2.2. Sample size ................................................................................................................. 16
3.3. Data Collection Procedures ................................................................................................ 17
3.4 Data Analysis ...................................................................................................................... 17
ix | P a g e
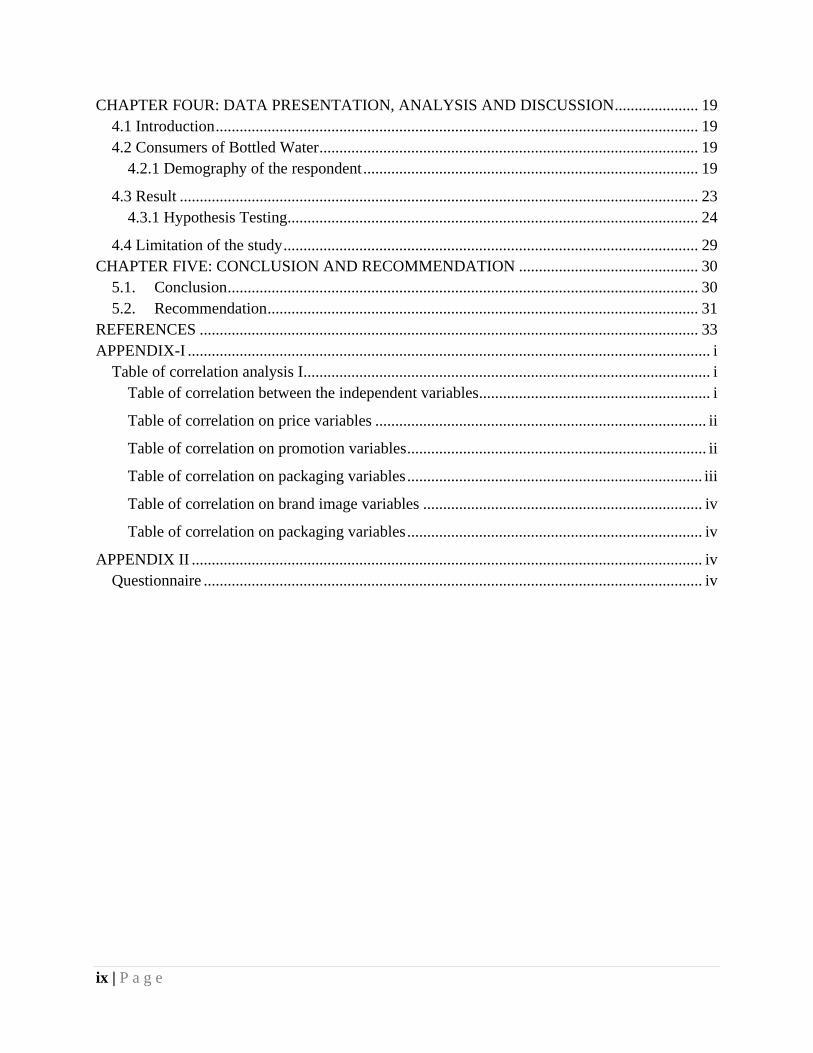
CHAPTER FOUR: DATA PRESENTATION, ANALYSIS AND DISCUSSION ..................... 19
4.1 Introduction ......................................................................................................................... 19
4.2 Consumers of Bottled Water ............................................................................................... 19
4.2.1 Demography of the respondent .................................................................................... 19
4.3 Result .................................................................................................................................. 23
4.3.1 Hypothesis Testing....................................................................................................... 24
4.4 Limitation of the study ........................................................................................................ 29
CHAPTER FIVE: CONCLUSION AND RECOMMENDATION ............................................. 30
5.1. Conclusion ...................................................................................................................... 30
5.2. Recommendation ............................................................................................................ 31
REFERENCES ............................................................................................................................. 33
APPENDIX-I ................................................................................................................................... i
Table of correlation analysis I ...................................................................................................... i
Table of correlation between the independent variables .......................................................... i
Table of correlation on price variables ................................................................................... ii
Table of correlation on promotion variables ........................................................................... ii
Table of correlation on packaging variables .......................................................................... iii
Table of correlation on brand image variables ...................................................................... iv
Table of correlation on packaging variables .......................................................................... iv
APPENDIX II ................................................................................................................................ iv
Questionnaire ............................................................................................................................. iv
x | P a g e
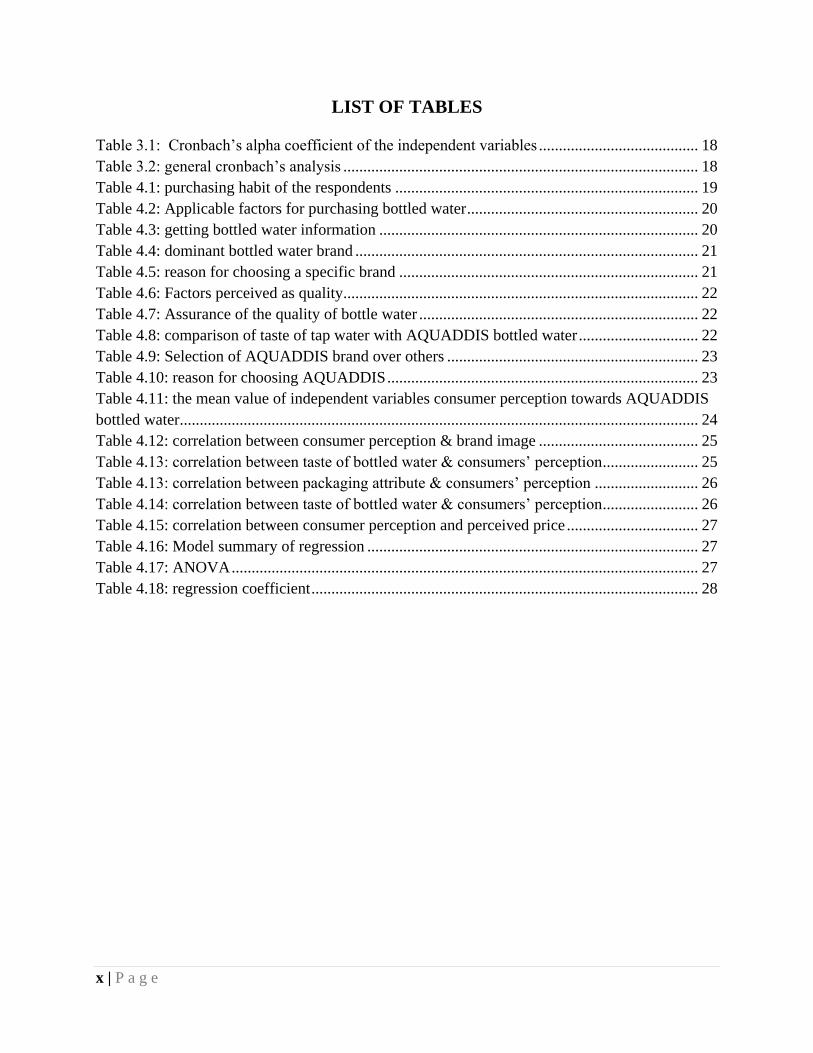
LIST OF TABLES
Table 3.1: Cronbach’s alpha coefficient of the independent variables ........................................ 18
Table 3.2: general cronbach’s analysis ......................................................................................... 18
Table 4.1: purchasing habit of the respondents ............................................................................ 19
Table 4.2: Applicable factors for purchasing bottled water .......................................................... 20
Table 4.3: getting bottled water information ................................................................................ 20
Table 4.4: dominant bottled water brand ...................................................................................... 21
Table 4.5: reason for choosing a specific brand ........................................................................... 21
Table 4.6: Factors perceived as quality ......................................................................................... 22
Table 4.7: Assurance of the quality of bottle water ...................................................................... 22
Table 4.8: comparison of taste of tap water with AQUADDIS bottled water .............................. 22
Table 4.9: Selection of AQUADDIS brand over others ............................................................... 23
Table 4.10: reason for choosing AQUADDIS .............................................................................. 23
Table 4.11: the mean value of independent variables consumer perception towards AQUADDIS
bottled water.................................................................................................................................. 24
Table 4.12: correlation between consumer perception & brand image ........................................ 25
Table 4.13: correlation between taste of bottled water & consumers’ perception ........................ 25
Table 4.13: correlation between packaging attribute & consumers’ perception .......................... 26
Table 4.14: correlation between taste of bottled water & consumers’ perception ........................ 26
Table 4.15: correlation between consumer perception and perceived price ................................. 27
Table 4.16: Model summary of regression ................................................................................... 27
Table 4.17: ANOVA ..................................................................................................................... 27
Table 4.18: regression coefficient ................................................................................................. 28

i | P a g e
LIST OF FIGURES
Fig 2.1: A conceptual frame work adapted for this research based on black box model ………15

0 | P a g e
1 | P a g e
CHAPTER ONE: INTRODUCTION
1.1 Background of the study
Water is without any doubt an essential for human life. Rapid growth of population, limited
water supply and changing in lifestyle has leveraged the consumption of bottled drinking water.
Families have changed their lifestyle, preferences, and consumption of water in the past several
years (Huff and Cotte, 2015). Drinking the best quality water is one of the critical issues in the
world. Scarcity of the available drinking water is also a major issue in developing countries.
Urbanization and different projects leads to ground water pollution which is a serious threat to
human population. Therefore, people adopt different strategies to fulfill their needs on drinking
water especially focusing on their health. Health concerns, individual preferences on aesthetic
conditions and consumer distrust of persons responsible for the quality of public drinking water
are some of the main possible reasons why certain people believe it is necessary to drink bottle
water. The increase in sales of bottled water and home drinking water treatment devices shows
further evidence of growing concern in bottled water market (Curry, 1988).
Bottled water industry is growing rapidly in the recent years as healthy supernumerary (Doria,
2006). Furthermore, the bottled water market is success to attract consumers to consume more
bottled water (Feliciano, 2014). Since bottled water market is crowded and it is difficult to
penetrate the noise and visually appeal to the consumer from the store shelves (Clement, 2007).
As per the Water Resource Based View (WRBV) approach, there is increasing trend in the
number of bottled water manufacturing companies in Ethiopia engaged in the production and
sale of potable water in the form of packaged/bottled water for safe drinking by branding water
as a commercial product through labeled plastic packages. Because of consumers’ life style
towards safe and quality potable water, there is increasing trend of preference of bottled water to
the traditional one (tap water) in the metropolitan cities like Addis Ababa of Ethiopia with large
population size and diplomatic city of Africa enhances the commercialization and profitability of
water as a product in the national and international market for Ethiopian bottled water
manufacturers. (Matiwos Ensermu, 2012).
The success of any product in the market depends on the demand created by the customers,
which is possible through the positive mindset of the public. The positivity of the product in the
2 | P a g e
market is based on customer perception and satisfaction towards the product offered especially,
when it comes to influencing consumers to purchase a product, their perception of the brand
must be taken into account. Customer perception can be developed from a variety of factors,
such as their own personal experience or how they have heard other people experienced the
product. Perception is unique to each individual and it is not just objective reality. Different
persons may have their own version of brand description based on their perception (Kumar,
2008). Deep dives into the consumer mind and psychology to determine how we choose and why
we choose what we choose are popular topics of investigation (Kotler and Armstrong, 2010;
Solomon et al. 2010).
A study conducted by Ferrier (2001) and Doria (2006) found that there is a relationship between
bottled water consumption and perception of tap water quality including both safety and taste.
The increased consumption trend of bottled water is an indication of a change in ways of life. It
also indicates that the tremendous development of urbanization and the growing standard of
living enables people to bring home heavy and expensive bottled water (Ferrier, 2001).
Furthermore, demographic factors such as race, income and gender have association with
consumption of bottled water. In contrast, education and income were found to be inversely
associated with the risk perception of drinking water (Doria, 2010).
The beverage industry works hard to market a product whose characteristics for the most part are
hard to distinguish from one brand to another. However, still consumers choose one brand over
another, (Fleming, 2006). Doria (2006) also points out that there are two main factors indicated
by consumers to explain their use of bottled water are often odor and color and tap water health
risk concerns.
To meet people needs in daily life for drinking water; many companies engaged to provide
bottled drinking water. As this industry growing and there is more competition, the companies
should have to know the things that influence people to buy the products of bottled drinking
water. There are various types of bottled drinking water in Ethiopia market. However there has
been no previous research into consumer perceptions regarding bottled water.
This paper seeks to address the factors that influence the perceptions of consumers on a
specific brand.

3 | P a g e
As it is with any other consumer product, bottled water demands thorough research with respect
to consumer brand perception to serve as a guide to which present and future marketing activities
should follow.
1.1.1 Background of ASKU PLC
ASKU PLC Food and Beverages Group strives to become the leading Food and Beverage
Company in Ethiopia by making different products the preferred people’s choice. Established in
1999 by Ethiopian shareholders, ASKU PLC is a company engaged in the manufacturing sector
with the aims to build a high performing organization which will play a key role in making
Ethiopia a growing food and beverage exporting nation. Currently, the company is producing
Bottled Water under the brand name - Aqua Addis; Carbonated Soft Drinks (CSD) in five
different flavors namely RC Edge, RC Cola, RC Orange, Royal Tonic and RC Lemonade and
Juices under the brand name Ethiopicana.
In addition, having been engaged in this sector for the past two decades, the Group has long
learned the local and regional consumer need for high quality food and beverage products and is
in the process of setting up an edible oil company under the name Yid Edible Oil Industry PLC.
In spite of these, not enough studies are conducted on what specific factors are more important
on customer preference of on branded bottled water on the other. Previous studies in Ethiopia
more focuses on what factors of intrinsic and extrinsic cues do leads to purchase intention of
bottled water and the branding practice of some bottling companies.
However conducting a research like consumer perceptual process on selecting a specific brand
will fills the gap of the study and in addition it will be an input for AQUADDIS.
1.2 Statement of the problem
Initial readings of the literature indicated that there was not enough research could be found on
why consumers bought branded bottled water and their personal brand preferences. In water
resource based view finding on consumer perception of bottled water preference indicates that,
water package, environmental friendliness and convenience are the better attributes that appear
to have been rated whereas, cleanliness and price are the least ranked attribute where the bottled
water product failed to meet the expectation of the consumers in Addis Ababa.
4 | P a g e
However, other than the above factors, the author believes that there is a gap on this finding
hence, packaging attribute, taste & odor, price, promotion, brand image and perceived value have
their own impact to influence the consumer perception. Other researches focused on trying to
determine why people bought bottled water and their purchase intention to buy one brand of
bottled water over another, branding practice on package waters and influence of bottled water
packaging. Within this context, the main goal of the study is to advance the current knowledge of
the factors that underlie bottled water consumption in Addis Ababa, including the preference for
specific bottled water (AQUADDIS).
1.3 Research question
1.3.1 Main research question
This study attempted to assess the factors to determine the perception of consumers on the
preference of specific bottled water.
1.3.2 Sub research question
The study also intended to address the following sub questions:
Do packaging attribute, taste of bottled water; promotion strategy; brand name and
perceived price of bottled water affects consumer perception?
How strong the brand of AQUADDIS is in the mind of customers’ as compared to
others competing spring waters?
Which factors are perceived to be more important in consumer mind?
1.4 Objectives of the study
1.4.1 General objective
The general objective of the study is to identify the influential factors on consumers’ perception
of bottled water in the city of Addis Ababa.
5 | P a g e
1.4.2 The specific objectives
To identify how packaging attributes; taste of bottled water; promotional strategy; name
of bottled water and perceived price of bottled water affects on consumer perception.
To identify how strong the brand of AQUADDIS is in the mind of its customer as
compared to competing spring water.
To suggest a good branding activity in order to build and sustain a strong brand image of
customer.
1.5 Significance of the study
Undertaking this study will help to make an informed decision on the company branding activity.
In general, the main benefit that could be drawn from this study includes the following:
This study will help to intended to close the gap on the literature of consumer perception
on bottled water.
This study has first hand benefit to AQUADDIS and others competitive spring water
companies through identifying the influence of their brand and level of preference.
This study also gives hints and information’s for other researcher related consumer
perception, branding and related activity.
The study aid companies which are less competitive due to their unpopular brands in the
bottled water market to keenly compete with the market leaders through effective and
sustainable brand building and development strategies.
This will help close the relative market share gap that exists between the market leader
and the other brands.
1. 6 Delimitation of the study
As per the market richness of bottle water product and, the geographical limitation of this
research delimited on the capital city of Ethiopia, Addis Ababa.
Due to exposure of information and globalization, people give emphasis to think of their health;
moreover bottled water is perceived as healthier than tap water. Therefore, this study focuses and
find out on the perception of consumers on bottle water over tap water.
6 | P a g e
After identifying the mentioned basic question, this research restricted to AQUADDIS spring
water only, as the company has lots of products like, Carbonated Soft Drinks (CSD) in five
different flavors namely RC Edge, RC Cola, RC Orange, Royal Tonic and RC Lemonade and
Juices.
1.7 Definition of terms
Bottled water: According to Quality and Standard Authority of Ethiopia (QSAE), industrially
processed and bottled water can be classified into two major groups: bottled drinking water (ES
597:2001) and mineral water (ES 621:2001). The former is further classified into carbonated
“sparkling” natural water and non-carbonated “still” natural water. If water has been made after
possible treatment, effervescent by addition of carbon dioxide then it is called carbonated natural
water. Non-carbonated water is by nature and after possible treatment does not contain free CO2,
in excess of the amount necessary to keep dissolved the hydrogen carbonates salts that are
present in the water.
Consumer perception: A motivation is influenced by his or her perception of the situation based
on a perceived condition. All of us experience a stimulus by the flow of information through our
five senses: sight, hearing, smell, touch, and taste. However, each of us receives, organizes and
interprets this sensory information in an individual way (Philip Kotler – Gary Armstrong, 15th
edition, pp 172).
Brand: according to American Marketing Association, “A brand is a name, term, design,
symbol, or any other feature that identifies one seller’s good or service as distinct from those of
other sellers”. Anderson and Vincz (2000) brand name is the most important aspect of
packaging, serving as a unique identifier. A brand can be a name, term, design, symbol or other
feature that identifier one firm’s product or service as different from all other goods and service.
Kotler also defines brand is more than just a name and symbol. Brands represent consumers’
perception and feeling about a product and performance everything that the products or service
means to consumer. In the final analysis, brand exists in the mind of customer. Thus the real
value of a strong brand its power of capture consumer performance and loyalty. Brands varying
the amount of value they have in the market place, Kotler (2006).
7 | P a g e
1.8 Organization of the paper
The research organized with five chapters: Chapter one contains the introduction part dealing
with research problems, questions & objectives, significance, delimitation of the study and
definition of terms.
The second chapter discusses the review of related literatures about the subject matter. Chapter
three focuses on research methodologies; research approach & design, population &sample
design, data type & resource, collection procedures & data analysis and followed by chapter four
which is analysis of the subject matter to investigate and evaluate the problem.
And finally, chapter five contains the conclusions of the findings and forwarding
recommendation.
8 | P a g e
CHAPTER TWO: REVIEW OF RELATED LITERATURE
Introduction
This section provides the research with necessary theoretical background and discussion in order
to develop valid and accurate tested hypothesis. The theory provided essentially the backbone in
this thesis as it breaks down the intricate issues raised in the research question. Furthermore, it
provides a wholesome understanding of the many factors that can influence the outcome of this
research. The section starts by covering the main issue of consumer perception on AQUADDIS
brand.
2.1 Theoretical Review
2.1.1 Consumer Behavior
According to Hoyer & Maclnnis, (2010), the reflection of consumer behavior is seen on the
totality of consumers’ decisions with respect to the acquisition, consumption, and disposition of
goods, services, activities, experiences, people, and ideas by (human) decision-making units.
Furthermore, the amount of consumer search activity leverages as the consumer moves from a
decision of few problems solving to those that involves extensive problem solving (Kotler, et al.
1999). The competition for the consumer’s attention is growing more intricate and complex since
consumer behavior and consumption have changed over the past decade and consequently (Ko et
al. 2002; Parker, 2005; Solomon et al. 2010). Consumption has largely moved beyond focusing
on the first two stages of Maslow’s hierarchy of needs. They are no longer motivated by
biological, physiological and safety needs (Kim et al., 2002). In other words, the consumer will
not by just any type of food because of hunger rather they will purchase something that is
enjoyable or perhaps provides them with certain nutritional benefits if they have the choice.
Moreover, a thirsty consumer would buy a bottle of water fundamentally based on level one.
However, and more importantly, given the choice between different water bottles the consumers
will select the one that is most perceived appealing. The appeal might for instance be in terms of
price, flavor, function, brand, country of origin, or bottle design.
Hence, consumers are perhaps more focused on belonging and esteem needs through than
biological and safety.
9 | P a g e
2.1.2 Consumer perception
"To perceive means to immobilize... we seize, in the act of perception, something which outruns
perception itself." - Henri L. Bergson.
"If the doors of perception were cleansed everything would appear to man as it is, infinite. For
man has closed himself up, till he sees all things thru chinks of his cavern". - William Blake.
"Nothing exists until or unless it is observed. An artist is making something exist by observing it.
And his hope for other people is that they will also make it exist by observing it. I call it creative
observation, creative viewing". - William S. Burroughs.
Perception is the spontaneous association which brands, human beings and companies trigger
when individuals encounter specific images related to them. Perception is unique to each
individual and it is not just objective reality. Different persons may have their own version of
brand description based on their perception (Kumar, 2008).
Perception is a process whereby stimuli are received and interpreted by the individual and
translated into a response (output). Perception begins when stimuli are detected by the five
senses; the result of this detection is referred to as sensation. Perception begins when patterns of
energy known as stimulus inputs reach the sensory receptors. Each receptor then transform the
energy so that it is received by the brain in the form of nerve impulses resulting in sensations of
sight, hearing, smell, touch and taste (Engel,Kollat,Blackwell,1968). Human personality
perceptions are the basis of individual`s behavior, attitudes and beliefs, physical characteristics
and demographic characteristics.
2.1.3 Purchase Intention
Purchase intention is one of the important factors that predict how consumer will behave
(Fishbein & Ajzen, 1975). It is an indicator of the possibility of purchase decision and the
willingness to search, evaluate the available options (Schiffman & Kanuk, 2000). To address the
mental reasoning which enhances the purchase decision studies found that the perceived value is
a good sign used by consumers to influence their intention to purchase to solve the problem of
incomplete information (Nam et al., 2017). Furthermore, if consumers perceive the expected
value of a product they are be more likely to purchase it (Chen et al., 2017; Monroe and
Krishnan (1985).
10 | P a g e
2.1.4 Brand Image
Brands are arguably one of the major symbols of postmodern societies and economies. They are
present in our everyday life and penetrate, and influence several of its spheres: economic, social,
cultural, sports, even religious (Kapferer, 2008).
The American Marketing Association (AMA) defines brand as “a name, term, sign, symbol, or
design, or a combination of them, intended to identify the goods or services of one seller or
group of sellers and to differentiate them from those of competitors”. Van Gelder (2003: 16)
highlights its managerial impact: “a brand is the translation of the business strategy into a
consumer experience that brings about specific consumer behaviour”. From another perspective,
it is a direct consequence of market segmentation and product differentiation, while in the mind
of consumers it is a trigger with the power to influence purchasing behaviour (Kapferer, 2008).
Thus regardless of the definition proposed, it is consensual that it is possible to identify
numerous advantages in building a strong brand. From the point of view of consumers, it is an
instrumental variable of consumer behaviour, that functions as a risk reducer and a shortcut
device which simplifies product choice (Keller and Lehmann, 2006; Ambroise and Valette-
Florence, 2010). While for organizations, it is an essential element to identify and differentiate
products or services, a vehicle to communicate with current and potential customers, a legal
protection of unique features, and a valuable intangible asset which enhances earnings and the
financial value of firms. Consequently, it has a significant impact on the long-term sustainability
of a company (Keller, 2003b; Keller and Lehmann, 2006; Ambroise and Valette-Florence, 2010;
Dolatabadi, Kazemi and Rad, 2012; Kotler and Keller, 2012).
In spite of companies’ efforts to create brands trough marketing programs, ultimately, a brand is
something that resides in the minds of consumers (e.g. Keller, 1993; Fournier, 1998; Kotler and
Keller, 2012). For them, a brand represents a sum of attributes, benefits, beliefs and values,
aggregated by past experiences, associations, and future expectations (Kotler and Pfoertsch,
2006) and therefore, the same brand can have different meanings for different people (De
Chernatony and McDonald, 2006).
Image is a form of belief held by consumers for the goods to be bought (Lau & Phau, 2007).
Brand Image is the consumer perception and beliefs about a specific product (Lau & Phau, 2007;
Rubio et al., 2014). It is embedded in the memory of consumers and will be reflected in
consumer’s buying behavior (Diallo et al., 2013).

11 | P a g e
Diallo et al. (2013) puts brand image as consumer understanding based on the type of a particular
brand. When it is increasingly embedded in the memory of consumers, a brand will become
more close to the consumer’s choice. Therefore, a good brand image should be introduced to
consumers continuously so as to form a memory attached to them (Lau & Phau, 2007).
The emerging brand impression in consumer’s memory increases along with the increasing
number of consumers to experience the brand (Rubio et al., 2014). Furthermore, when brand
association is interconnected strongly, the brand image that is formed will also become more
powerful (Lau & Phau, 2007).
On the other hand, brand image refers to the ideas, feelings, and attitudes that consumers create
about a brand (Maurya and Mishra, 2012) as a result of their interpretation of a brand’s identity
(Geuens, Weijters and Wulf, 2009), and is therefore an individual and subjective mental
representation (Davies, Chun, Da Silva, and Roper, 2001; Geuens, Weijters and Wulf, 2009).
2.2 Empirical literature
2.2.1 Factors influencing brand perception of a product
2.2.1.1 The brand image and consumer perception
The company’s brand name is a fundamental indicator of the success of the water processing
companies. Brand image is a set of human characteristics associated with a brand. According to
Keller, a brand name sometimes captures the central theme or key association of a product in a
very condensed and reasonable manner therefore it is a very significant choice (Keller 1993).
Some authors (Aker 1991; Keller 1993) argue that there is an association of both user imagery
and psychological benefits with a brand image and that is an important component of brand
equity. Many consumer researchers (Escalas & Bettman 2003; Setterlund & M.Niedenthal 1993)
have found that people choose situations including products and brands by imagining the
prototypical users for each item in the choice set and choosing the item that maximizes their
similarity to a desired prototypical user. Furthermore, research has indicated that brand is in fact
the strongest cue of influencing consumers’ perception of quality (Dodds et al. 1991; Gabrielsen,
et al. 2008). Yet, it is also known that the extent of a brand’s strength in inducing the consumer
will to a large extent vary with product category (Dodds et al. 1991).
H1: Brand image of bottled water positively influence consumer perception
12 | P a g e
2.2.1.2 Taste and consumer perception
Another important factor for bottled water is its taste; many people prefer bottled water simply
because of its taste and odor (Foote 2011). Bottled water, packed in a dedicated source or plant,
may have a more consistent taste than tap water, which comes from surface sources and must
travel through pipes to reach homes (EPA 2005). Brand loyalty is very high as all the products
differ in taste. So they can buy product which is on the shelf. Taste is a pivotal variable that goes
into a substance that is orally consumed. Quality water should be devoid of any unfavorable
taste. The better the taste has better the quality of water (Eric Kwabena Osei, 2015). Therefore,
the perception of water quality is an important factor when choosing the bottled water to drink.
H2: Taste of bottled water positively influence consumer perception
2.2.1.3 Packaging and consumer perception
Another factor noted by several authors is the packaging of the product, with its different
functionalities to ease and to communicate with consumers. There is no doubt about increasing
importance of packaging as a strategic tool to attract consumers’ attention and their perception of
the product quality (Deliya & Parmar 2012). Furthermore according to Vieira, (Vieira 2015)
packaging materials and shapes are found to attract attention; particularly when consumers are
not very familiar with the brands, pictures on packages are emphasized to attract attention.
Authors like Silayoi and Speece (Silayoi 2007) argue that packaging innovations should be
designed in such a way that the product can be handled without damaging the quality of the
contents. Agariya, Johari, Sharma, Chandraul, & Singh (2012), support this idea and define
packaging as a container for a product- encompassing the physical appearance of the container
and including the design, color, shape, labeling and material used; besides, Deliya & Parmar
(2012) add that packaging should be designed to promote product sales and if packaging meets a
consumer need, such as portion control, recyclability; tamper proofing, child-proofing, easy-
open, easy-store, easy-carry and non-breakability, innovative packaging may add value to the
product. As argued by (Nikitaeva 2012), in today’s highly competitive business environment, an
attractive, valuable package may be the last chance for the seller to influence the buyers’
purchasing decisions.
H3: Bottled water packaging has a positive influence on consumer perception.
13 | P a g e
2.2.1.4 Promotion and consumer perception
Research on price and promotion has shown that product and package appearance will influence
the decision process when buying FMCG such as bottled water (Schoormans and Robben, 1996).
Advertising is also an important marketing element in the bottled water industry and everyone
should realize the role that advertising plays in modern life (Kotler 2012). In today’s dynamic
world, it is almost impossible for advertisers to deliver an advertising message and information
to buyers without the use of advertising. Certainly, this may be because of the globalization and
accessibility of hundreds of channels for the viewers of this modern era. Today, people mostly
rely on advertisements rather than other sources (Zhang 2015). Creating a marketing message of
a brand promotion would be more likely able to attract the attention and, thus, trust of the target
market on that brand (Marketeers Editor, 2012).
H4: Promotional activities of bottled water positively influence consumer perception.
2.2.1.5 Perceived price and consumer perception
The influence of the price factor on the customer’s choice of bottled water brand is the key
rational factor influencing the brand choice and building trust in customers through fair pricing
has a positive long-term effect. In fact, for some customers, the price is the main factor when
choosing the bottled water brand. For most, however, there is a direct trade-off between price
and quality. According to Mullarkey (2001), if the brand is of sufficient quality, customers will
pay a higher price, some customers’ sense value if the price is low, whereas others perceive
value if there is a balance between quality and price. Moreover, According to Du Plessis &
Rousseau, (2007); Monroe, (2012) consumers evaluate the price with the expected value from
the product to enhance the intention to purchasing decision process (Du Plessis & Rousseau,
2007; Monroe, 2012). The level of the perceived price is varying between customers because it
based on social and economic factors (Maxwell, 1995).
H5: The Perceived price of bottled water positively influence on consumer perception.
2.2.1.6 Perceived value
The ultimate goal of each activity is to gain a value, in business language value a collection of
benefits of a product at the certain point of time according to available information, thus the
consistency of product attributes/characteristics will enhance the customer values (Blythe, 2013).
Perceived value is the consumer’s overall assessment of the utility of a product (or service) based
14 | P a g e
on perceptions of what is received and what is given (Zeithaml, 1988). Dodds and Monroe
(1985) pointed that the perceived value is highly important in consumers’ purchasing decision.
Therefore, for each individual consumer the level of perception of the advantages and
disadvantages for the product is vary and influence the purchasing decision (Oluwafemi and
Dastane, 2017). To marketers and marketing scholars, perceived value is significant primarily
because it has the power to alter the direction (satisfied/dissatisfied) and the degree or intensity
of satisfaction/dissatisfaction experienced (Spreng, Harell, Mackoy1995). From behavioral
perspective, experience and learning can change consumers’ behavior.
2.2.1.7 Consumer perception
Marketing stimuli that influence consumer’s perception such as nature of the product, physical
attributes, the package design, the advertisements and commercial (including copy claims, choice
and sex of model, positioning of model, size of the print advertisement, position of the
advertisements, typography, symbolic representation), use of color and the editorial environment
(Keachie and Doyle, 1966).
Motive is a tendency to think and behave so as to attain a favored or positive generic goal.
Motives influence perception (Atkinson and Walker, 1956). People tend to perceive the things
they need or want.
As constant exposure to stimulus induces a level of adaptation, at times novelty and contrast
finds widespread use in advertising to make a message stand out from those of its competitors.
Research on increasing the size has revealed that doubling the size of the print advertising or
poster does not double the attention attracting power of the advertisement (Barton 1964).
Visual impressions can be retained in the memory of consumer and these results in greater
message recall by the individual (Engel, Wales and Warshaw, 1967). Colors can also be used to
create moods and emotions amongst consumers. Package designers are aware that an average
package on the super market shelf has about 1/10 the of a second to make an impression on the
consumer thus every aspect of package ,the name ,shape, color, label and copy and material
provide sufficient sensory stimulation to be noticed and remembered by the consumer.
Marketers through marketing research determines what consumers consider to be ideal attributes
of the product category or what consumers perceive their needs to be in relation to the product
category. The marketer can then segment the market on the basis of those needs and vary the
15 | P a g e
product advertising so that consumers in each segment will perceive the product as meeting their
own special needs, wants and interests.
The most effective branding entails a memorable name and a ubiquitous slogan combined with
an instantly recognizable and unique logo. It recommended a simple and straight forward logo or
potentially, an elaborate design of a simple idea, such as a silhouette of a person or an object. It
further identified the brand name as another crucial element of branding which should be both
simply memorable and is particular to a firm or product (Beyond Marketing Thought, 2007).
If the brand is of sufficient quality, customers will pay a higher price, some customers’ sense
value if the price is low, whereas others perceive value if there is a balance between quality and
price Mullarkey (2001).
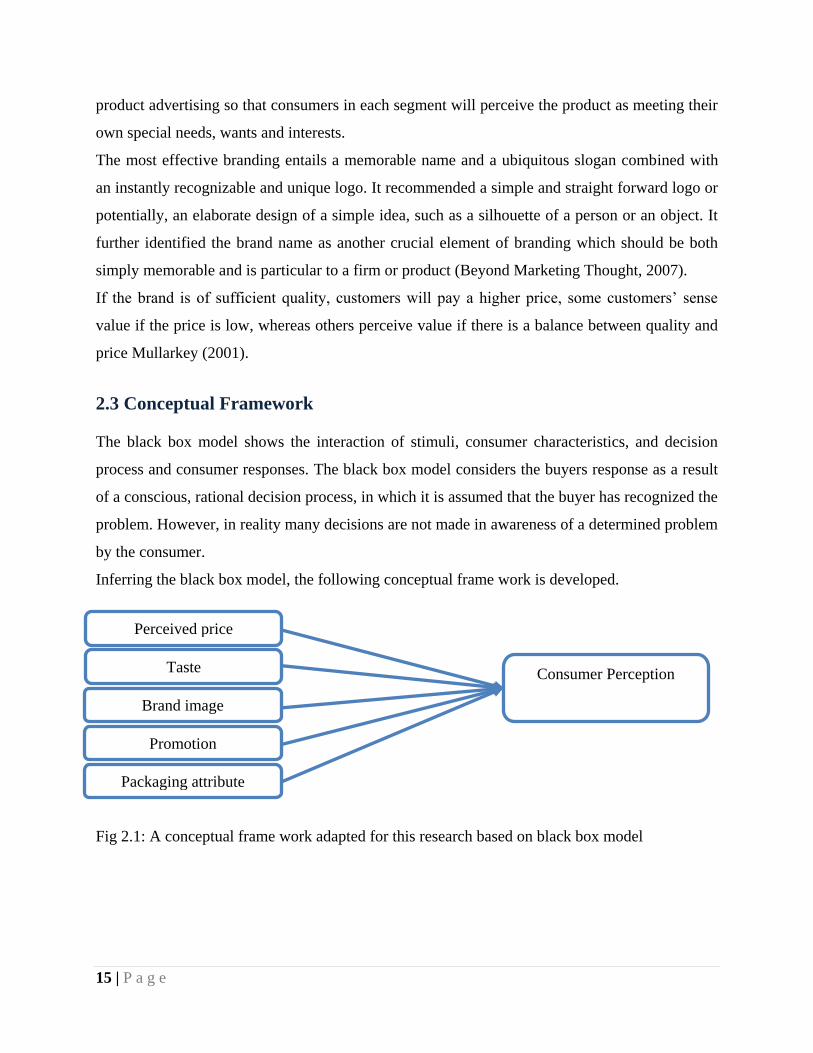
2.3 Conceptual Framework
The black box model shows the interaction of stimuli, consumer characteristics, and decision
process and consumer responses. The black box model considers the buyers response as a result
of a conscious, rational decision process, in which it is assumed that the buyer has recognized the
problem. However, in reality many decisions are not made in awareness of a determined problem
by the consumer.
Inferring the black box model, the following conceptual frame work is developed.
Fig 2.1: A conceptual frame work adapted for this research based on black box model
Perceived price
Taste
Brand image
Promotion
Packaging attribute
Consumer Perception
16 | P a g e
CHAPTER THREE: RESEARCH METHODOLOGY
3.1 Research Approach and design
As Creswell (2003) explains that in quantitative studies, one uses theory deductively and places
it toward the beginning of the plan for a study. With the objective of testing or verifying a theory
rather than developing it, the researcher advances a theory, collects data to test it, and reflects on
the confirmation or disconfirmation of the theory by the results.
Therefore quantitative study is selected to do this study as to gather as many responses as
possible from bottled water drinkers to answer the research questionnaire and it is more
appropriate for large scale issues and cost effective.
The main purpose of this study to identify the main factors that consumer perceived more
towards AQUADDIS bottled water on their mind.
The study employed a descriptive method research design which embodied both qualitative and
quantitative phases. The quantitative phase took care of the survey by administering of
questionnaires as data collection technique to collect some numeric values. The qualitative phase
which is an interpretive philosophy adopted a case study approach to determine some findings
from subjective issues bothering on the study.
3.2. Population and Sample design
3.2.1. Sample technique
The target population included all packaged water users specifically located from respondents of
Addis Ababa. The sample focuses on respondents from specific cafeterias with a technique used
non probability convenient sampling, as it is relatively quick, convenient, and less expensive for
collecting data (Sekaran and Bougie, 2009).
3.2.2. Sample size
Regarding the size of the sample (Tabachnick & Fidell 2007), advise that 50 cases are very poor,
100 is poor, 200 is fair, 300 is good, 500 is very good and 1 000 or more is excellent. Therefore
500 questionnaires are selected to have a convenient data. Therefore, the sample size for the
study is assigned to be 279.
17 | P a g e
3.3. Data Collection Procedures
For collecting the data, all the 279 questionnaires distributed manually, where a print form
handed over to a respondent to be completed and the questionnaire is self-administered. The
study used primary data obtained through the questionnaire and it is designed for selected Addis
Ababa residents about bottled water usage as their drinking life style. Its reliability was piloted in
one cafeteria before using the questionnaire. First permissions received from the concerned
owners or managers before distributed to the selected respondents.
The questionnaire divided in to three parts: Part one inquires about Socio – economic status of
the respondents and part two addresses users’ perception on their agreement on the bottled water
& usage profile of the respondents of packaged drinking water followed by part three, which
addresses questions related to satisfaction of consumers towards AQUADDIS drinking water.
3.4 Data Analysis
The data collected being analyzed and interpreted by using both qualitative and quantitative
techniques in order to produce the study’s main research questions and objectives. The data
collected from the questionnaires is summarized and analyzed by using SPSS (version 25.0).
Frequencies and descriptive statistics were carried out to summarize main data of respondents to
get an overview and to conduct further analysis. Regression analysis and correlative statistics
were carried out among dependent and independent variables to identify the significance.
After the execution of the analysis, to decide about whether we should keep all the variables in
our model or eliminate any, first we have studied the variables to identify the ones that are poorly
correlated with all the other variables.
The correlation coefficient takes values from -1.00 to 1.00 and calculates whether there is a
relationship between variables and what level (refer Table).
3.4.1. Validity and Reliability Tests
The reliability test shows that the smallest Cronbach alpha value is 0.688, while the highest value
is 0.879. Referring to the stipulation that the value of Cronbach alpha should be higher than 0.60,
it can be concluded that all concepts of the measurement of each variable of the questionnaire are
18 | P a g e
reliable. Therefore, the items in each of the variable concepts were declared feasible and could
be used as a measuring instrument.
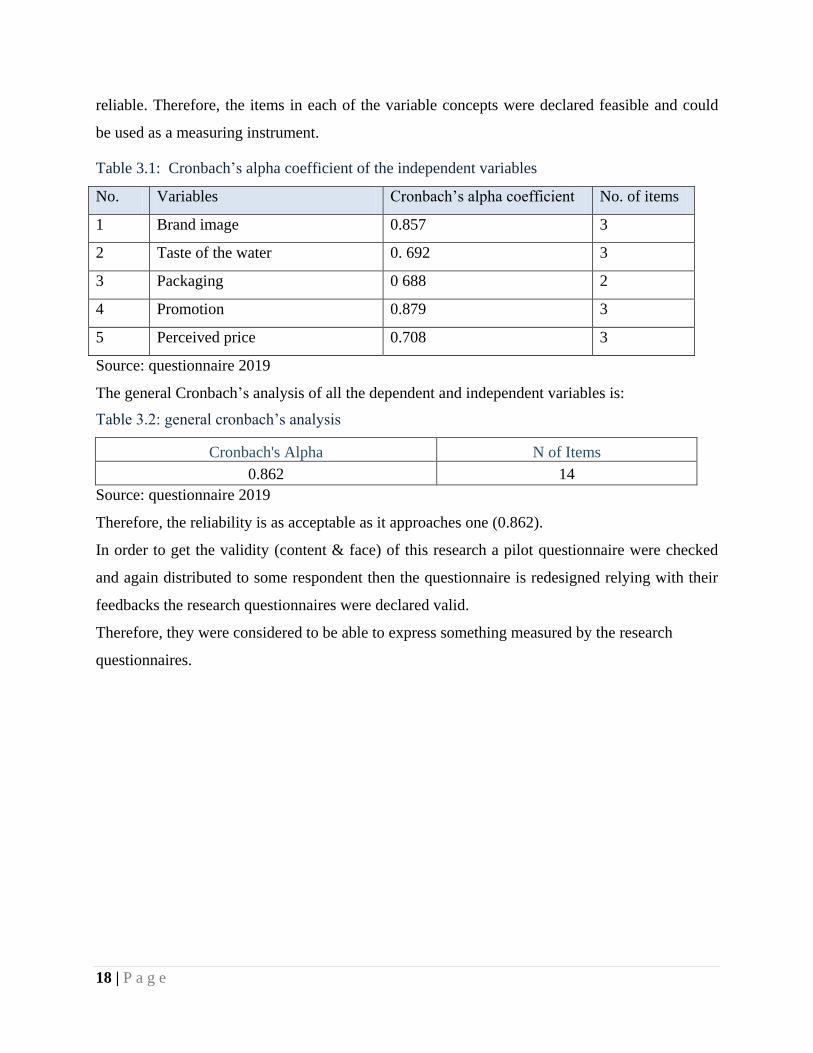
Table 3.1: Cronbach’s alpha coefficient of the independent variables
No. Variables Cronbach’s alpha coefficient No. of items
1 Brand image 0.857 3
2 Taste of the water 0. 692 3
3 Packaging 0 688 2
4 Promotion 0.879 3
5 Perceived price 0.708 3
Source: questionnaire 2019
The general Cronbach’s analysis of all the dependent and independent variables is:
Table 3.2: general cronbach’s analysis
Cronbach's Alpha N of Items
0.862 14
Source: questionnaire 2019
Therefore, the reliability is as acceptable as it approaches one (0.862).
In order to get the validity (content & face) of this research a pilot questionnaire were checked
and again distributed to some respondent then the questionnaire is redesigned relying with their
feedbacks the research questionnaires were declared valid.
Therefore, they were considered to be able to express something measured by the research
questionnaires.
19 | P a g e
CHAPTER FOUR: DATA PRESENTATION, ANALYSIS AND
DISCUSSION
4.1 Introduction
This chapter presents results of the study and provides descriptive analysis, correlation and
multiple regressions of the findings.
The findings of the study are measured against the objectives and questions of the study. The
demographic of results are represented in frequency tables and chart interpreted. Pearson
correlation and multiple regressions analysis applied in the analyses of the key determinants of
the objectives. The Response rate is 92.11 %, which are 257 from total of 279 respondents.
4.2 Consumers of Bottled Water
4.2.1 Demography of the respondent
From the 257 respondents 161 were males which comprises 63.4 percent and female respondents
were 93 which covers the remaining 36.6 percent; regarding age category, the main respondents,
which is 127 are from 25 to 45 age groups followed by the age group from 18 to 25, which has
109 respondents, 13 respondents are included in the third age group which is from 45 to 65 and
finally only 03 respondents are above 65.
The literacy of the respondents are mainly laying on diploma or certificate and bachelor degree
holders with each covers the same 31.3 percents then less than grade 12 covers 21.7 percent, 14.9
percent are masters degree holders and 0.8 percent of PhD holders. Regarding the occupation,
the main participants are professionals which are 94, private and government employees
incorporate 79 followed by students, 60 with 13 unemployed and 2 retired.
Purchasing habit
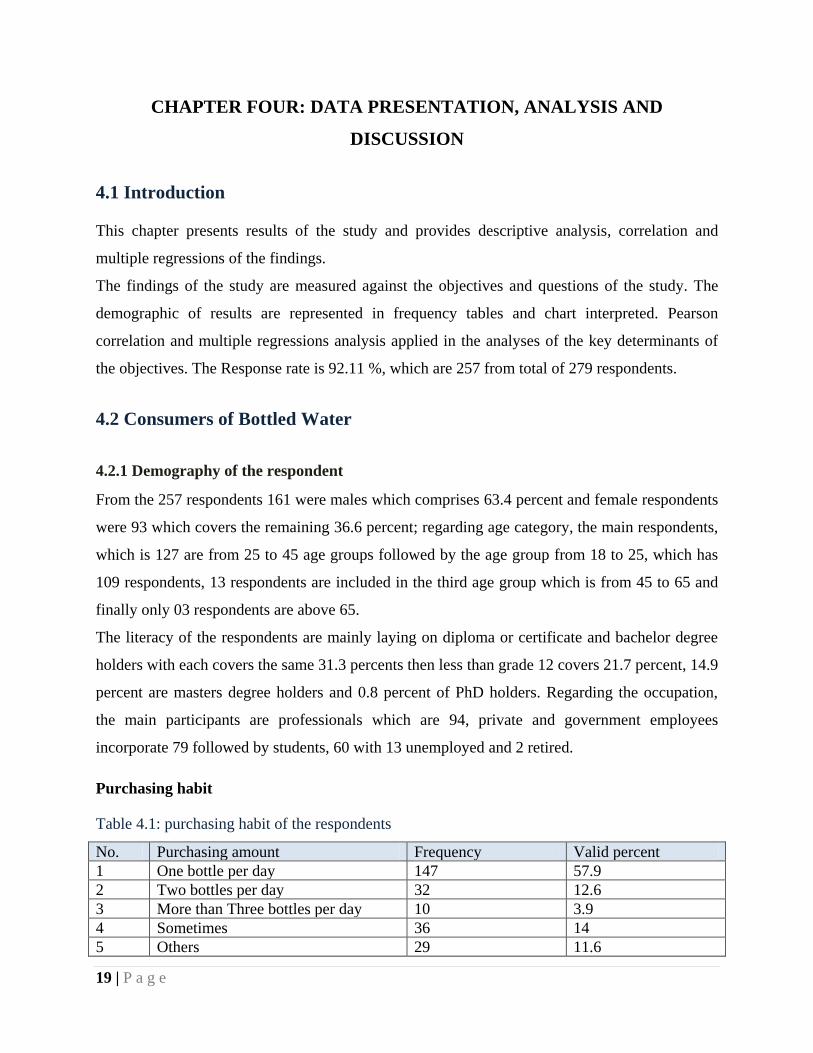
Table 4.1: purchasing habit of the respondents
No. Purchasing amount Frequency Valid percent
1 One bottle per day 147 57.9
2 Two bottles per day 32 12.6
3 More than Three bottles per day 10 3.9
4 Sometimes 36 14
5 Others 29 11.6
20 | P a g e
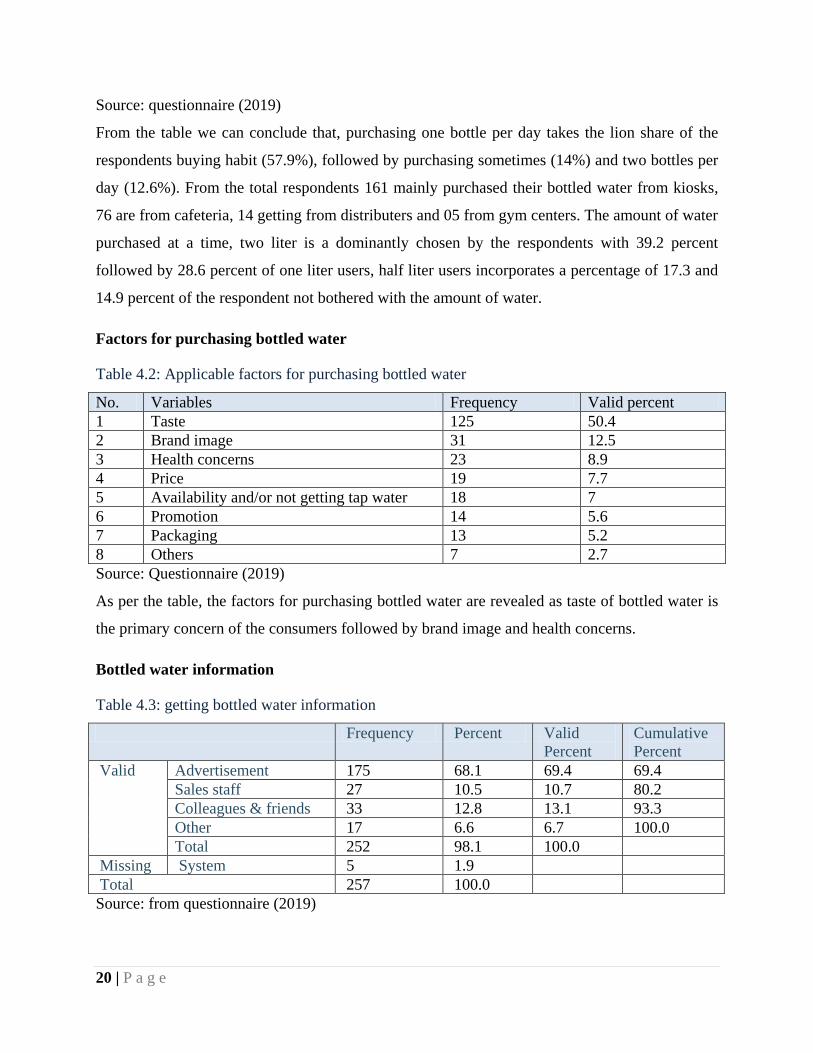
Source: questionnaire (2019)
From the table we can conclude that, purchasing one bottle per day takes the lion share of the
respondents buying habit (57.9%), followed by purchasing sometimes (14%) and two bottles per
day (12.6%). From the total respondents 161 mainly purchased their bottled water from kiosks,
76 are from cafeteria, 14 getting from distributers and 05 from gym centers. The amount of water
purchased at a time, two liter is a dominantly chosen by the respondents with 39.2 percent
followed by 28.6 percent of one liter users, half liter users incorporates a percentage of 17.3 and
14.9 percent of the respondent not bothered with the amount of water.
Factors for purchasing bottled water
Table 4.2: Applicable factors for purchasing bottled water
No. Variables Frequency Valid percent
1 Taste 125 50.4
2 Brand image 31 12.5
3 Health concerns 23 8.9
4 Price 19 7.7
5 Availability and/or not getting tap water 18 7
6 Promotion 14 5.6
7 Packaging 13 5.2
8 Others 7 2.7
Source: Questionnaire (2019)
As per the table, the factors for purchasing bottled water are revealed as taste of bottled water is
the primary concern of the consumers followed by brand image and health concerns.
Bottled water information
Table 4.3: getting bottled water information
Frequency Percent Valid
Percent
Cumulative
Percent
Valid Advertisement 175 68.1 69.4 69.4
Sales staff 27 10.5 10.7 80.2
Colleagues & friends 33 12.8 13.1 93.3
Other 17 6.6 6.7 100.0
Total 252 98.1 100.0
Missing System 5 1.9
Total 257 100.0
Source: from questionnaire (2019)
21 | P a g e
Therefore as per the above table the survey told us, advertisement plays a key role for addressing
the information to the respondents through the media.
Dominant bottled water brand
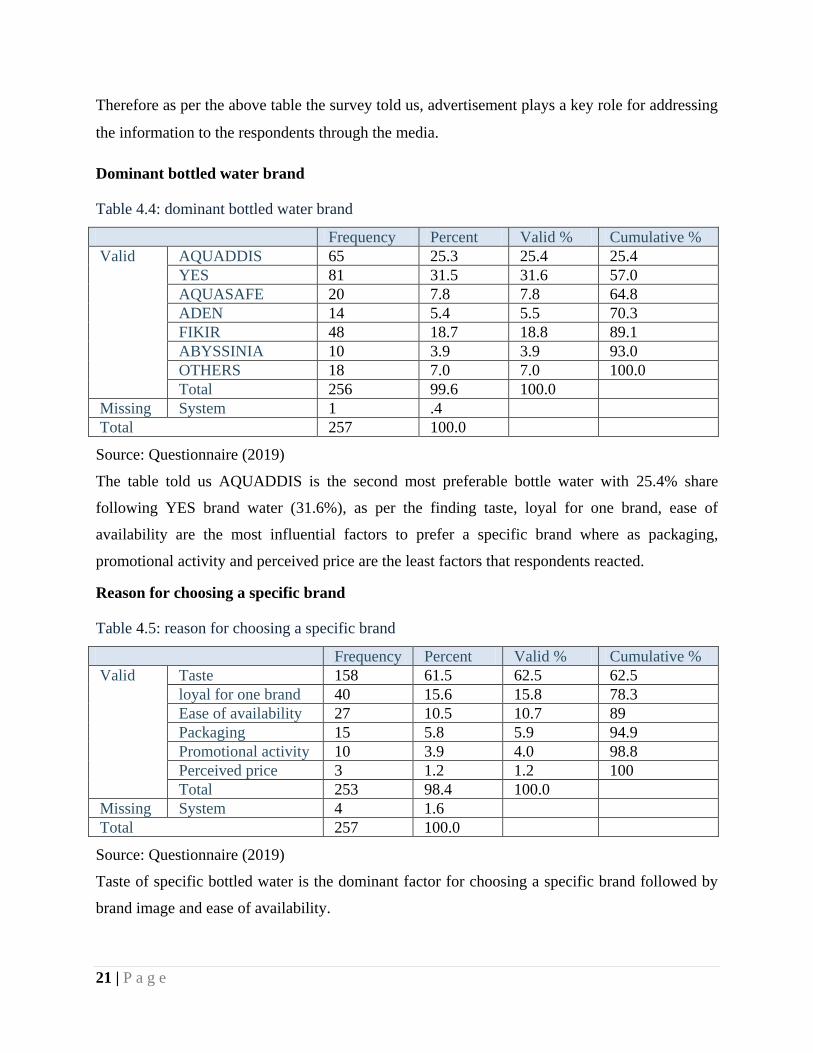
Table 4.4: dominant bottled water brand
Frequency Percent Valid % Cumulative %
Valid AQUADDIS 65 25.3 25.4 25.4
YES 81 31.5 31.6 57.0
AQUASAFE 20 7.8 7.8 64.8
ADEN 14 5.4 5.5 70.3
FIKIR 48 18.7 18.8 89.1
ABYSSINIA 10 3.9 3.9 93.0
OTHERS 18 7.0 7.0 100.0
Total 256 99.6 100.0
Missing System 1 .4
Total 257 100.0
Source: Questionnaire (2019)
The table told us AQUADDIS is the second most preferable bottle water with 25.4% share
following YES brand water (31.6%), as per the finding taste, loyal for one brand, ease of
availability are the most influential factors to prefer a specific brand where as packaging,
promotional activity and perceived price are the least factors that respondents reacted.
Reason for choosing a specific brand
Table 4.5: reason for choosing a specific brand
Frequency Percent Valid % Cumulative %
Valid Taste 158 61.5 62.5 62.5
loyal for one brand 40 15.6 15.8 78.3
Ease of availability 27 10.5 10.7 89
Packaging 15 5.8 5.9 94.9
Promotional activity 10 3.9 4.0 98.8
Perceived price 3 1.2 1.2 100
Total 253 98.4 100.0
Missing System 4 1.6
Total 257 100.0
Source: Questionnaire (2019)
Taste of specific bottled water is the dominant factor for choosing a specific brand followed by
brand image and ease of availability.
22 | P a g e
Factors for perceived quality
Table 4.6: Factors perceived as quality
Frequency Percent Valid % Cumulative %
Valid Brand image 65 25.3 25.9 25.9
Taste 130 50.6 51.8 77.7
Perceived price 25 9.7 10.0 87.6
Attractiveness 15 5.8 6.0 93.6
Promotion 16 6.2 6.4 100.0
Total 251 97.7 100.0
Missing System 6 2.3
Total 257 100.0
Source: Questionnaire (2019)
Again taste is perceived as quality of bottled water; brand image and price also have their own
impact on the consumers mind as it is perceive as quality.
Assurance of quality of bottled water
Table 4.7: Assurance of the quality of bottle water
Frequency Percent Valid % Cumulative %
Valid Try different bottles until
I find the best one
67 26.1 27.0 27.0
Look for a familiar brand 107 41.6 43.1 70.2
Look for minerals &
ingredients on the label
52 20.2 21.0 91.1
I think most package
waters have better quality
22 8.6 8.9 100.0
Total 248 96.5 100.0
Missing System 9 3.5
Total 257 100.0
Source: Questionnaire (2019)
Most of the respondents’ perceived taste of water is better associated with quality however they
mostly rely on a specific brand to assure it and then on the second level, they try different brand
until they find the best one followed look for minerals & ingredients.
Comparison of AQUADDIS taste with tap water
Table 4.8: comparison of taste of tap water with AQUADDIS bottled water
N Mean Std. Deviation
Comparison of AQUADDIS bottled water with
domestic tap water
247 4.02 .876
23 | P a g e
Source: Questionnaire (2019)
This question is designed with a five likert scale; the mean score is 4.02, which indicates most of
the respondents have a better perception over tap water regarding taste.
AQUADDIS preference over others
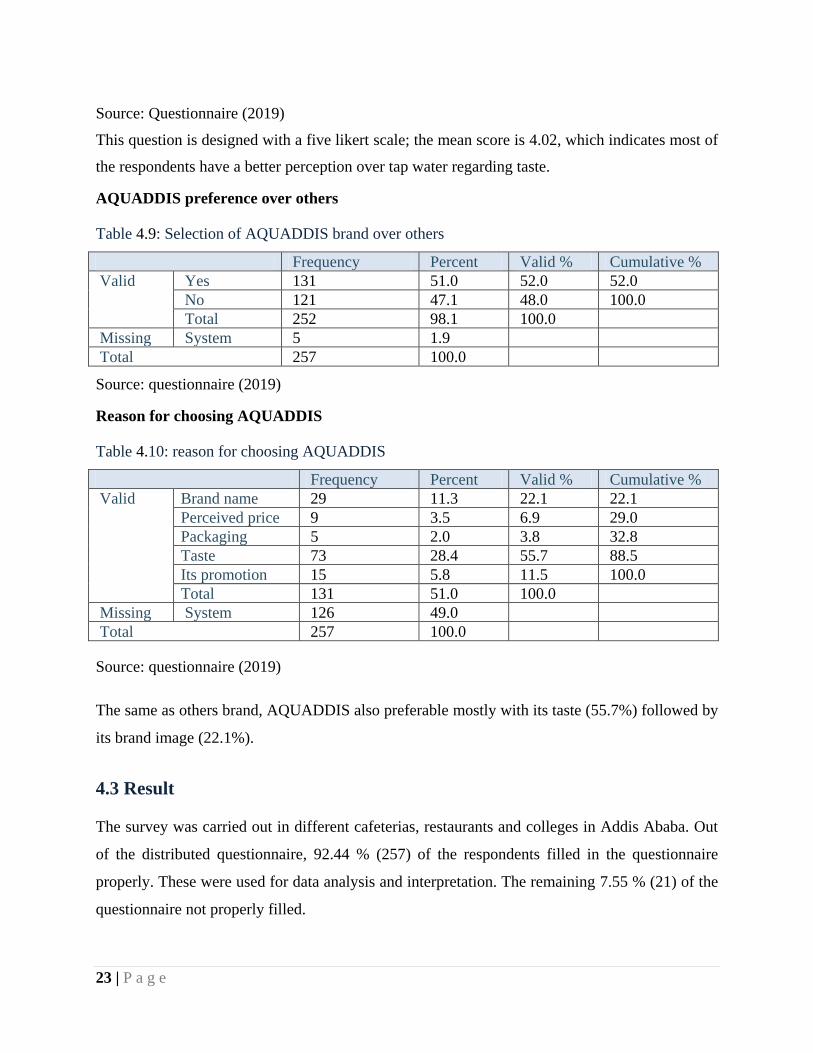
Table 4.9: Selection of AQUADDIS brand over others
Frequency Percent Valid % Cumulative %
Valid Yes 131 51.0 52.0 52.0
No 121 47.1 48.0 100.0
Total 252 98.1 100.0
Missing System 5 1.9
Total 257 100.0
Source: questionnaire (2019)
Reason for choosing AQUADDIS
Table 4.10: reason for choosing AQUADDIS
Frequency Percent Valid % Cumulative %
Valid Brand name 29 11.3 22.1 22.1
Perceived price 9 3.5 6.9 29.0
Packaging 5 2.0 3.8 32.8
Taste 73 28.4 55.7 88.5
Its promotion 15 5.8 11.5 100.0
Total 131 51.0 100.0
Missing System 126 49.0
Total 257 100.0
Source: questionnaire (2019)
The same as others brand, AQUADDIS also preferable mostly with its taste (55.7%) followed by
its brand image (22.1%).
4.3 Result
The survey was carried out in different cafeterias, restaurants and colleges in Addis Ababa. Out
of the distributed questionnaire, 92.44 % (257) of the respondents filled in the questionnaire
properly. These were used for data analysis and interpretation. The remaining 7.55 % (21) of the
questionnaire not properly filled.
24 | P a g e
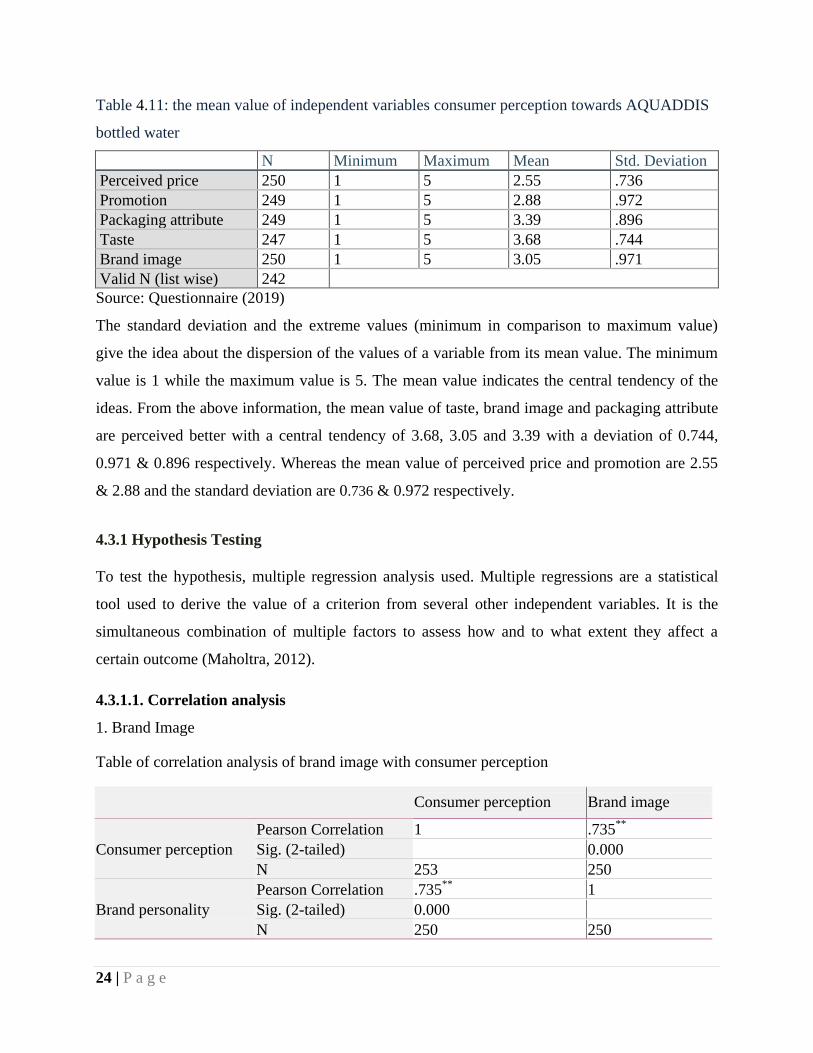
Table 4.11: the mean value of independent variables consumer perception towards AQUADDIS
bottled water
N Minimum Maximum Mean Std. Deviation
Perceived price 250 1 5 2.55 .736
Promotion 249 1 5 2.88 .972
Packaging attribute 249 1 5 3.39 .896
Taste 247 1 5 3.68 .744
Brand image 250 1 5 3.05 .971
Valid N (list wise) 242
Source: Questionnaire (2019)
The standard deviation and the extreme values (minimum in comparison to maximum value)
give the idea about the dispersion of the values of a variable from its mean value. The minimum
value is 1 while the maximum value is 5. The mean value indicates the central tendency of the
ideas. From the above information, the mean value of taste, brand image and packaging attribute
are perceived better with a central tendency of 3.68, 3.05 and 3.39 with a deviation of 0.744,
0.971 & 0.896 respectively. Whereas the mean value of perceived price and promotion are 2.55
& 2.88 and the standard deviation are 0.736 & 0.972 respectively.
4.3.1 Hypothesis Testing
To test the hypothesis, multiple regression analysis used. Multiple regressions are a statistical
tool used to derive the value of a criterion from several other independent variables. It is the
simultaneous combination of multiple factors to assess how and to what extent they affect a
certain outcome (Maholtra, 2012).
4.3.1.1. Correlation analysis
1. Brand Image
Table of correlation analysis of brand image with consumer perception
Consumer perception Brand image
Consumer perception
Pearson Correlation 1 .735**
Sig. (2-tailed) 0.000
N 253 250
Brand personality
Pearson Correlation .735**
1
Sig. (2-tailed) 0.000
N 250 250
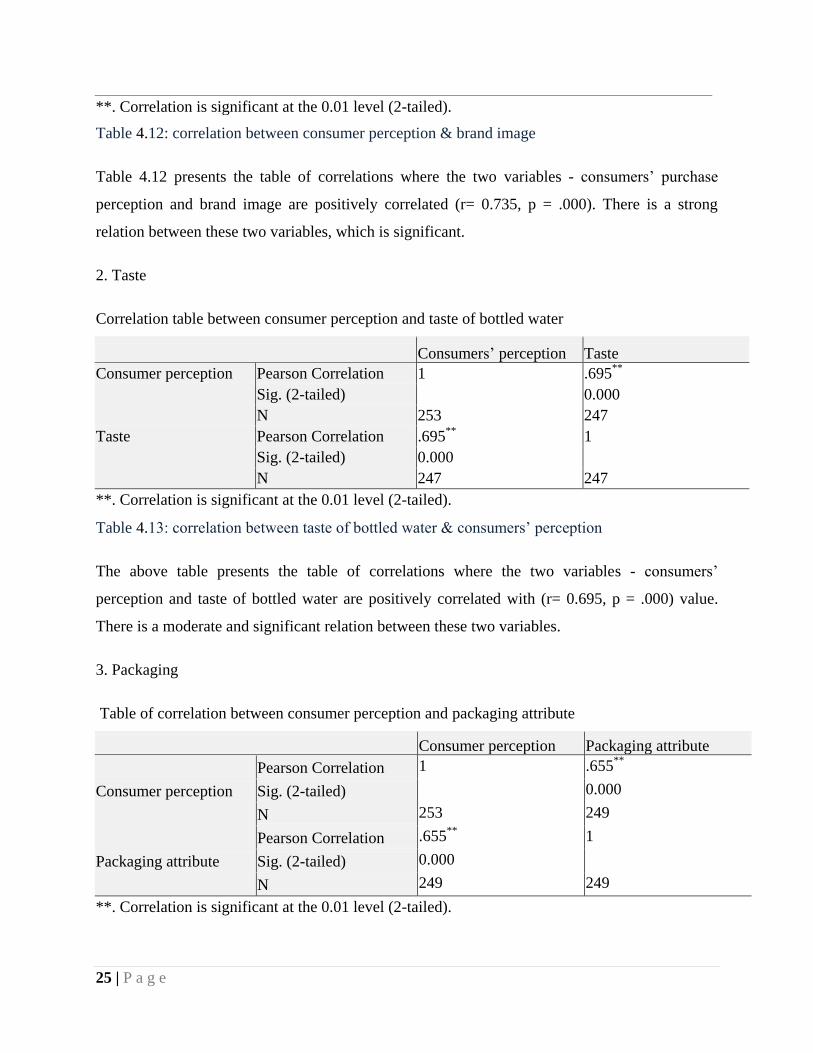
25 | P a g e
**. Correlation is significant at the 0.01 level (2-tailed).
Table 4.12: correlation between consumer perception & brand image
Table 4.12 presents the table of correlations where the two variables - consumers’ purchase
perception and brand image are positively correlated (r= 0.735, p = .000). There is a strong
relation between these two variables, which is significant.
2. Taste
Correlation table between consumer perception and taste of bottled water
Consumers’ perception Taste
Consumer perception Pearson Correlation 1 .695**
Sig. (2-tailed) 0.000
N 253 247
Taste Pearson Correlation .695**
1
Sig. (2-tailed) 0.000
N 247 247
**. Correlation is significant at the 0.01 level (2-tailed).
Table 4.13: correlation between taste of bottled water & consumers’ perception
The above table presents the table of correlations where the two variables - consumers’
perception and taste of bottled water are positively correlated with (r= 0.695, p = .000) value.
There is a moderate and significant relation between these two variables.
3. Packaging
Table of correlation between consumer perception and packaging attribute
Consumer perception Packaging attribute
Consumer perception
Pearson Correlation 1 .655**
Sig. (2-tailed) 0.000
N 253 249
Packaging attribute
Pearson Correlation .655**
1
Sig. (2-tailed) 0.000
N 249 249
**. Correlation is significant at the 0.01 level (2-tailed).
26 | P a g e
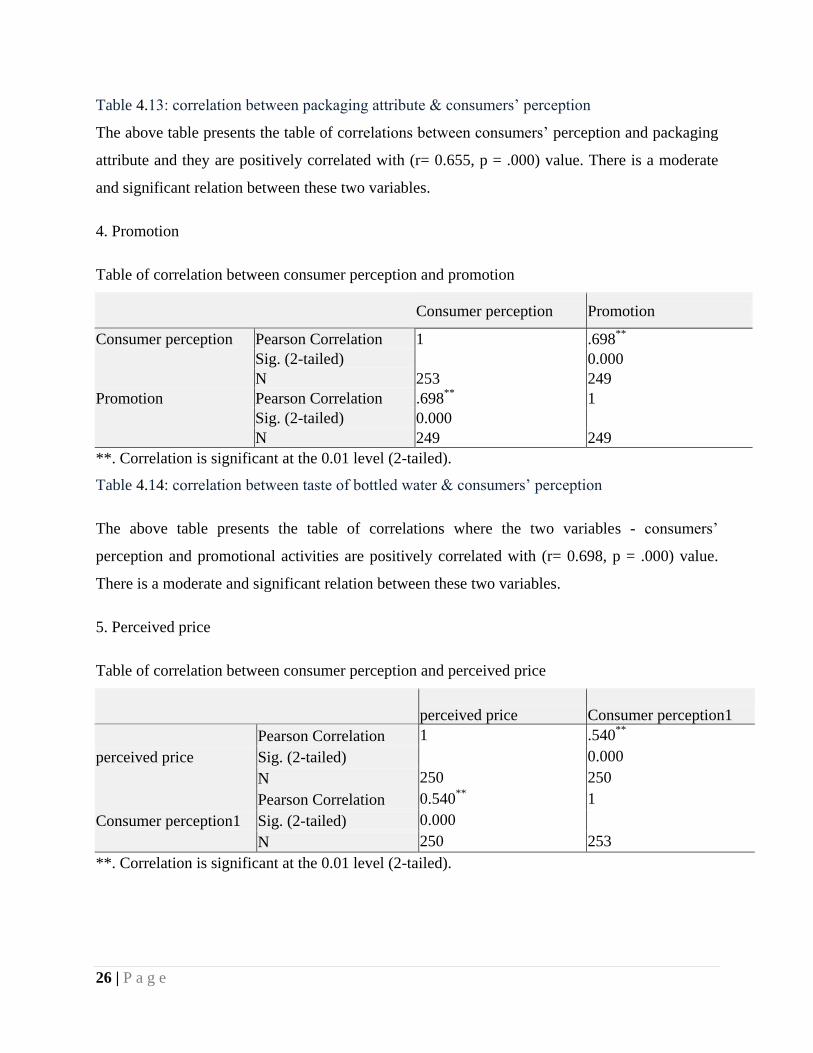
Table 4.13: correlation between packaging attribute & consumers’ perception
The above table presents the table of correlations between consumers’ perception and packaging
attribute and they are positively correlated with (r= 0.655, p = .000) value. There is a moderate
and significant relation between these two variables.
4. Promotion
Table of correlation between consumer perception and promotion
Consumer perception Promotion
Consumer perception Pearson Correlation 1 .698**
Sig. (2-tailed) 0.000
N 253 249
Promotion Pearson Correlation .698**
1
Sig. (2-tailed) 0.000
N 249 249
**. Correlation is significant at the 0.01 level (2-tailed).
Table 4.14: correlation between taste of bottled water & consumers’ perception
The above table presents the table of correlations where the two variables - consumers’
perception and promotional activities are positively correlated with (r= 0.698, p = .000) value.
There is a moderate and significant relation between these two variables.
5. Perceived price
Table of correlation between consumer perception and perceived price
perceived price Consumer perception1
perceived price
Pearson Correlation 1 .540**
Sig. (2-tailed) 0.000
N 250 250
Consumer perception1
Pearson Correlation 0.540**
1
Sig. (2-tailed) 0.000
N 250 253
**. Correlation is significant at the 0.01 level (2-tailed).
27 | P a g e
Table 4.15: correlation between consumer perception and perceived price
The above table presents the table of correlations where the two variables - consumers’
perception and promotional activities are positively correlated with (r= 0.540, p = .000) value.
That is the least correlated value from all the variables besides this there is a moderate and
significant relation between these two variables.
4.3.1.2. Regression Analysis
This study examines six variables; one is dependent variable, consumer perception and five
others are independent variables, namely perceived price, packaging attribute, taste, brand image,
and promotion. Based on this variability, multiple regression data analysis method is a suitable
method to examine the simultaneous combination of five independent factors in order to identify
their influence on the dependent variable.
Table 4.16: Model summary of regression
Model R R Square Adjusted R Square
Std. Error of the
Estimate
1 0.934a 0.873 0.870 0.263
a. Predictors: (Constant), Brand image, perceived price, Promotion, Packaging attribute, Taste
Source: questionnaire (2019)
As shown on the above model summary table, the amount of R2 is 0.873, this means that 87.3% of
the total variation in consumer perception can be explained by the linear relationship with perceived
price, taste, packaging attribute, promotion & Brand image, while the remaining 12.7% is rendered
inconclusive. Further, there is a strong association between the dependent & independent variables.
Table 4.17: ANOVA
ANOVAa
Model Sum of Squares Df Mean Square F Sig.
1 Regression 111.995 5 22.399 324.677 .000b
Residual 16.281 236 .069
Total 128.276 241
a. Dependent Variable: Consumer perception
b. Predictors: (Constant), Brand image, perceived price, Promotion, Packaging attribute, Taste
Source: questionnaire (2019)
28 | P a g e
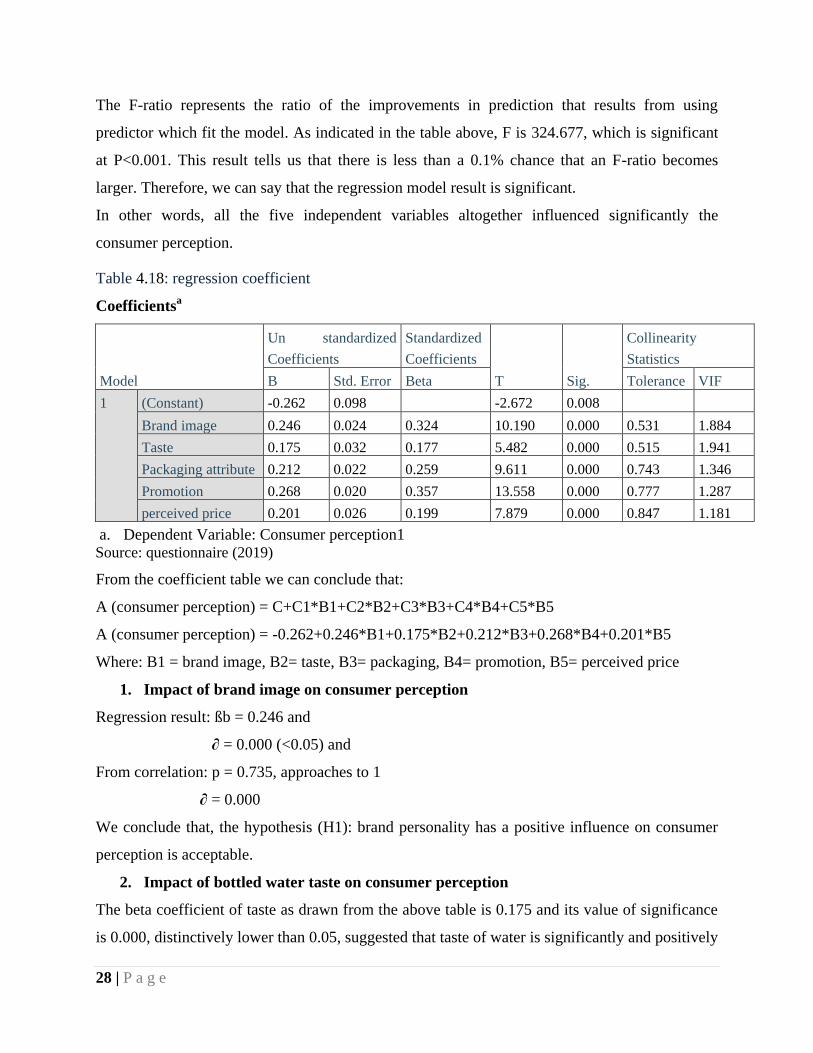
The F-ratio represents the ratio of the improvements in prediction that results from using
predictor which fit the model. As indicated in the table above, F is 324.677, which is significant
at P<0.001. This result tells us that there is less than a 0.1% chance that an F-ratio becomes
larger. Therefore, we can say that the regression model result is significant.
In other words, all the five independent variables altogether influenced significantly the
consumer perception.
Table 4.18: regression coefficient
Coefficientsa
Model
Un standardized
Coefficients
Standardized
Coefficients
T Sig.
Collinearity
Statistics
B Std. Error Beta Tolerance VIF
1 (Constant) -0.262 0.098 -2.672 0.008
Brand image 0.246 0.024 0.324 10.190 0.000 0.531 1.884
Taste 0.175 0.032 0.177 5.482 0.000 0.515 1.941
Packaging attribute 0.212 0.022 0.259 9.611 0.000 0.743 1.346
Promotion 0.268 0.020 0.357 13.558 0.000 0.777 1.287
perceived price 0.201 0.026 0.199 7.879 0.000 0.847 1.181
a. Dependent Variable: Consumer perception1 Source: questionnaire (2019)
From the coefficient table we can conclude that:
A (consumer perception) = C+C1*B1+C2*B2+C3*B3+C4*B4+C5*B5
A (consumer perception) = -0.262+0.246*B1+0.175*B2+0.212*B3+0.268*B4+0.201*B5
Where: B1 = brand image, B2= taste, B3= packaging, B4= promotion, B5= perceived price
1. Impact of brand image on consumer perception
Regression result: ßb = 0.246 and
∂ = 0.000 (<0.05) and
From correlation: p = 0.735, approaches to 1
∂ = 0.000
We conclude that, the hypothesis (H1): brand personality has a positive influence on consumer
perception is acceptable.
2. Impact of bottled water taste on consumer perception
The beta coefficient of taste as drawn from the above table is 0.175 and its value of significance
is 0.000, distinctively lower than 0.05, suggested that taste of water is significantly and positively
29 | P a g e
affected the consumer perception. Therefore, the hypothesis Taste of the bottled water positively
influence consumer perception is accepted.
3. Impact of Packaging attribute on consumer perception
The table shows that the significance value is 0.000, with Beta Coefficient of 0.212. The
significance value of this variable is clearly lower than 0.05, similarly as the relationship of two
previous independent to the dependent variables, Packaging attribute also asserted a significant
and positive influence on purchase decisions. Therefore, Bottled water packaging has a positive
influence on consumer perception.
4. Impact of Promotion on consumer perception
For this variable, the significance value is 0.000, with the Beta Coefficient of 0.268. The
significance value is 0.000, distinctively lower than 0.05, postulate that brand loyalty
significantly and positively affected purchase decisions. Therefore, the hypothesis promotion
positively influences consumer perception is accepted.
5. Impact of perceived price on consumer perception
The Beta Coefficient is 0.283. The significance value of this variable towards the dependent
variable is 0.000; lower than 0.05, this means that perceived price significantly influenced and
positively affected consumer perception. Thus, perceived price have significant impact on
consumer perception is accepted hypothesis.
From all the results drawn above, it can be concluded that the hypothesis drawn initially (brand
image, Taste of the bottled water, Packaging attribute, promotion, and perceived price have a
positive influence on consumer perception) is accepted.
4.4 Limitation of the study
The delimitation of the study: it is conducted only in Addis Ababa city of and it is specifically
focused to AQUADDIS brand. The sample is only focused on primary data with 257 sample size
moreover the variables tried to see in this research is limited on taste, brand image, perceived
price, packaging attribute and promotional activities.
30 | P a g e
CHAPTER FIVE: CONCLUSION AND RECOMMENDATION
This study has been made to find out the consumers’ perception on packaged drinking water
specifically AQUADDIS brand at the capital city of Addis Ababa. The various factors which
influence the purchase decisions are taste, packaging of product, promotional activities,
perceived price and brand reputation. Consumer’s perception and the researcher’s suggestions
may be considered in practice for the development of AQUADDIS packaged drinking water and
also to ensure customer satisfaction.
5.1. Conclusion
Based on the respondents opinion whether bottled water commercialization in Addis Ababa the
following conclusions are drawn.
All the five independent variables; brand image, taste of the bottled water, packaging attribute,
promotion and price have a positive influence on consumer perception as per the regression
finding. Moreover the correlation analysis also revealed this result.
Consumers’ justification for preference of bottled water use at home, work or restaurant is
healthier, convenient packaging with lower price.
Bottled water pricing is overpriced like any other commodity in Addis Ababa, but users are
willing and to prefer to pay and use bottled water at home, work and restaurants, however as per
the questionnaire any increment on price might decrease or shift consumer bottle water
consumption.
Specifically, most of the respondents are not convenient on the new design of AQUADDIS
packaging regarding handling however they have a positive perception on the content and design
of labeling.
Regarding the taste and convenience of AQUADDIS bottled water products in Addis Ababa is
the main factor for choosing it and can be concluded as success factors for the commercialization
of bottled water in Addis Ababa in general.
Brand reputation is one of the success factor of AQUADDIS brand, as per the study most of the
respondents are trusted the company even if it is not their first choice.
The respondents are more attracted with the promotional content of the company but they are not
convinced as much on the timely of the company’s advertisements.
31 | P a g e
5.2. Recommendation
With reference to the research objectives and questions, the findings of this study is employed as
the basis for the following recommendation necessary for improving the performance of bottled
water companies,
Consumer perceived price as over rating therefore taking price as one of the competitive
strategy, despite of the least correlated with consumer perception, it will help the company to
grasp the hidden demand.
Regarding handling of packaging, the shape is one of the influential attribute in consumers’
perception. Consumers’ give high attention to the shape of the package when they purchase
bottled water. In 2004, Silayoi and Speece conducted research on packaging and purchase
decisions. Their finding shows that package shapes help to make products more appealing. The
finding of this research also shows that it has a positive relation with consumer perception and
also the new package design of AQUADDIS is not convenient for some respondents. Therefore
the company has to collect feedbacks and give more emphasis on the new design.
The taste of bottled water is the most influential factor of perceptual process for most of the
respondents; therefore the companies have to have used the taste of bottled water as one of the
competitive tool.
The outcome of the study also registered clearly that the electronic media advertisement,
influences the choice of many consumers as to what brand to purchase. This evidently applied to
those who are not strictly acclimatized with a particular brand. A few consumers of bottle water
are “die hard” patrons of the brand; so it is a more influential on the demand side of the market.
Promotional activity of AQUADDIS also used as a tool to attract the consumers, but it is not
presented timely and in attractive way as most of the respondents feedback. Therefore the
company has to work on the promotion intensively to be more addressable and attractive.
One of the aims of the study was to assess the effect of brand image of bottle water on customer
loyalty. It was therefore realized that branding is the complex collection of everything the
consumer will want in bottled water. In view of this, AQUADDIS bottle Water Company has to
adopt a holistic management approach of ensuring that both the content, the packaging of their
products as well as their customer service are excellently pursued. It was also revealed in the
study that consumer response or feedback after using consuming the water product is very vital

32 | P a g e
to brand performance. The perception of the consumer on the brand of any product cannot be
taken for granted if a company is to achieve competitiveness.
As per the finding, AQUADDIS is the second most preferable water following YES water, as
both are a forerunner on packaged water industry and being a forerunner and availability also a
factor for purchasing a bottle water.
33 | P a g e
REFERENCES
Saranda Kajtazi, Nail Reshidi, (2018): Consumer-Side Decision Factors on their selection of
bottled water brands: Statistical Method Study In A Kosovo Sample, University Of
Prishtina “Hasan Prishtina”, Kosovo;
Hayley Collins and Dr. Angela Wright, March 2014: Still Sparkling: The Phenomenon of
Bottled Water—An Irish Context, Journal of Marketing Management; pp. 15-31.
Josiane T. Matos de Queiroz, Miguel de França Doria, Mark W. Rosenberg, Léo Heller and
Andréa Zhouri, 2013: Perceptions of bottled water consumers in three Brazilian
municipalities, IWA Publishing;
Zhihua Hu 1,*, Lois Wright Morton and Robert L. Mahler, February 2011:Bottled Water:
United States Consumers and Their Perceptions of Water Quality, International Journal of
Environmental Research and Public Health;
Ensermu, Matiwos. , 2012: Trends in Bottled water Use Survey in Addis Ababa: Implication on
Reverse Logistics of Bottled Water Manufacturing in Ethiopia, International Journal of
Science and Research (IJSR);
Delina, P. J. E1. Dasinaa, S1, , December 2016: consumer perception and factors influencing in
adapting of bottled water consumption in batticaloa district, sri lanka, UK: European
Centre for Research Training and Development;
Abdullah M. Alhidari and Soad Abdullah Almeshal, February 2018: Changing Familial Food
Consumption Ritual and Practice: An Empirical Study among Saudi Arabia. International
Journal of Research in Management, Economics and Commerce; Pp. 151-158
Anette Veidung, November 2011: An Analysis of a Bottled Water’s Design, Source and Brand
and its Influence on Perceived Quality and Purchase Intention. Cand. Merc. International
Marketing and Management Copenhagen Business School;
Dr. K Vijaya Venkateswari, P Jeevitha, A Jacquelin Mercy, September 2016; A Study on
Consumer Perception towards Packaged Drinking Mineral Water with Special Reference to
Coimbatore City. International Journal of Multidisciplinary Research and Development;
Pp. 184-186
Fidelis Quansah, Abednego Okoe & Benjamin Angenu, September 2015; Factors Affecting
Ghanaian Consumers’ Purchasing Decision of Bottled Water. International Journal of
Marketing Studies;
34 | P a g e
Patrick, K., A. Ladipo and *Solomon A. Agada, April 2016; the Effects of Brand Perception in
the Purchase of “Made in Italy” and “Made in China” Fashion Products in Nigeria.
Economics and Management Research Projects: An International Journal;
Sharon L. Forbes, David Dean, June 2013; Consumer Perceptions of Wine Brand Names. 7th
AWBR International Conference
Dr. V. Hemanth Kumar, Dr. P. Premchand Babu, August 2016; customer perception towards
private label brands of bottled drinking water - a study with reference to Chennai. GE-
International Journal of Management Research; Vol. 4
Imran Khana, Zillur Rahman, (2015); A review and future directions of brand experience
research. International strategic management review 3; Pp. 1–14
Ogbuji, Chinedu N. Anyanwu, Aham V. Onah, Julius O., June 2011; An Empirical Study of the
Impact of Branding on Consumer Choice for Regulated Bottled Water in Southeast,
Nigeria. International Journal of Business and Management; Vol. 6, No. 6
Amron Amron, May 2018; The Influence of Brand Image, Brand Trust, Product Quality, and
Price on the Consumer’s Buying Decision of MPV Cars. European Scientific Journal
edition Vol.14, No.13

35 | P a g e
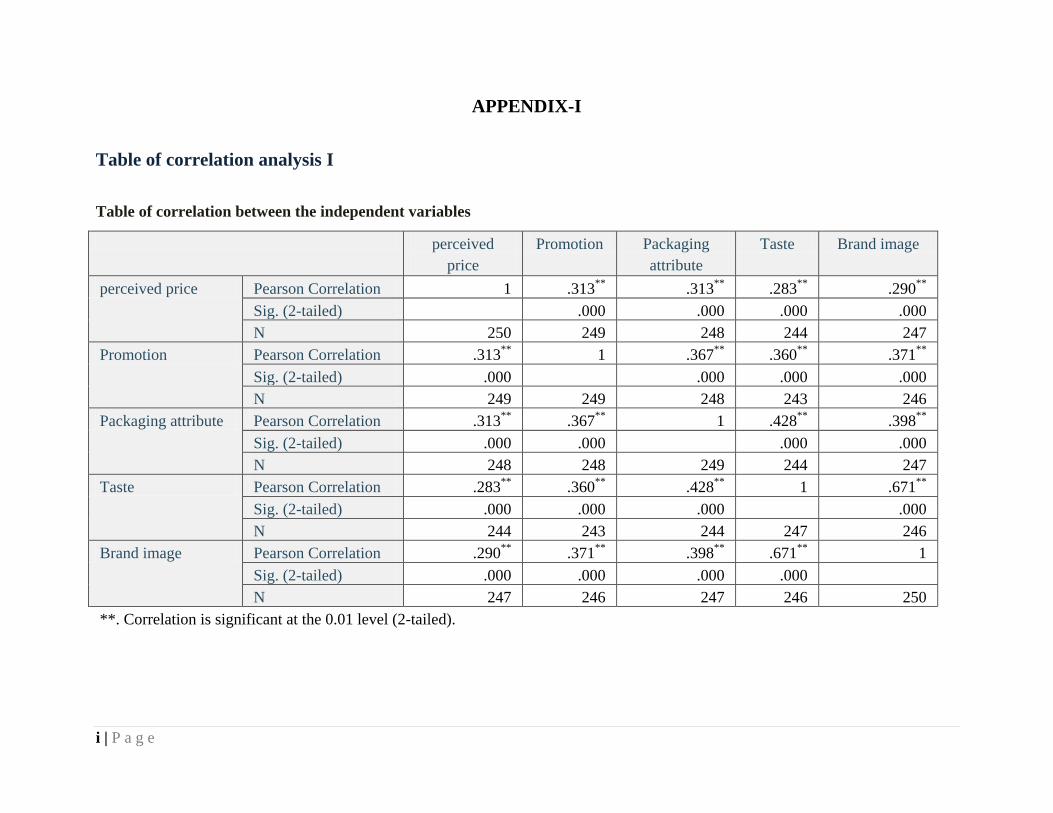
i | P a g e
APPENDIX-I
Table of correlation analysis I
Table of correlation between the independent variables
perceived
price
Promotion Packaging
attribute
Taste Brand image
perceived price Pearson Correlation 1 .313**
.313**
.283**
.290**
Sig. (2-tailed) .000 .000 .000 .000
N 250 249 248 244 247
Promotion Pearson Correlation .313**
1 .367**
.360**
.371**
Sig. (2-tailed) .000 .000 .000 .000
N 249 249 248 243 246
Packaging attribute Pearson Correlation .313**
.367**
1 .428**
.398**
Sig. (2-tailed) .000 .000 .000 .000
N 248 248 249 244 247
Taste Pearson Correlation .283**
.360**
.428**
1 .671**
Sig. (2-tailed) .000 .000 .000 .000
N 244 243 244 247 246
Brand image Pearson Correlation .290**
.371**
.398**
.671**
1
Sig. (2-tailed) .000 .000 .000 .000
N 247 246 247 246 250
**. Correlation is significant at the 0.01 level (2-tailed).
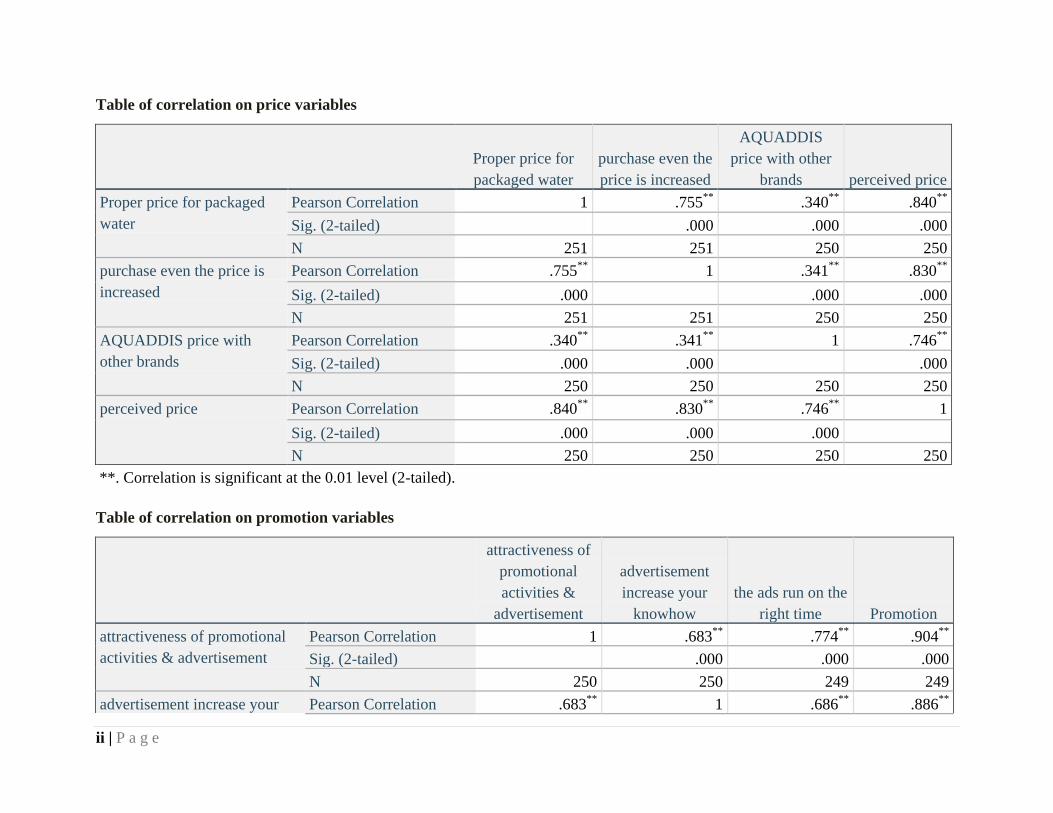
ii | P a g e
Table of correlation on price variables
Proper price for
packaged water
purchase even the
price is increased
AQUADDIS
price with other
brands perceived price
Proper price for packaged
water
Pearson Correlation 1 .755**
.340**
.840**
Sig. (2-tailed) .000 .000 .000
N 251 251 250 250
purchase even the price is
increased
Pearson Correlation .755**
1 .341**
.830**
Sig. (2-tailed) .000 .000 .000
N 251 251 250 250
AQUADDIS price with
other brands
Pearson Correlation .340**
.341**
1 .746**
Sig. (2-tailed) .000 .000 .000
N 250 250 250 250
perceived price Pearson Correlation .840**
.830**
.746**
1
Sig. (2-tailed) .000 .000 .000
N 250 250 250 250
**. Correlation is significant at the 0.01 level (2-tailed).
Table of correlation on promotion variables
attractiveness of
promotional
activities &
advertisement
advertisement
increase your
knowhow
the ads run on the
right time Promotion
attractiveness of promotional
activities & advertisement
Pearson Correlation 1 .683**
.774**
.904**
Sig. (2-tailed) .000 .000 .000
N 250 250 249 249
advertisement increase your Pearson Correlation .683**
1 .686**
.886**
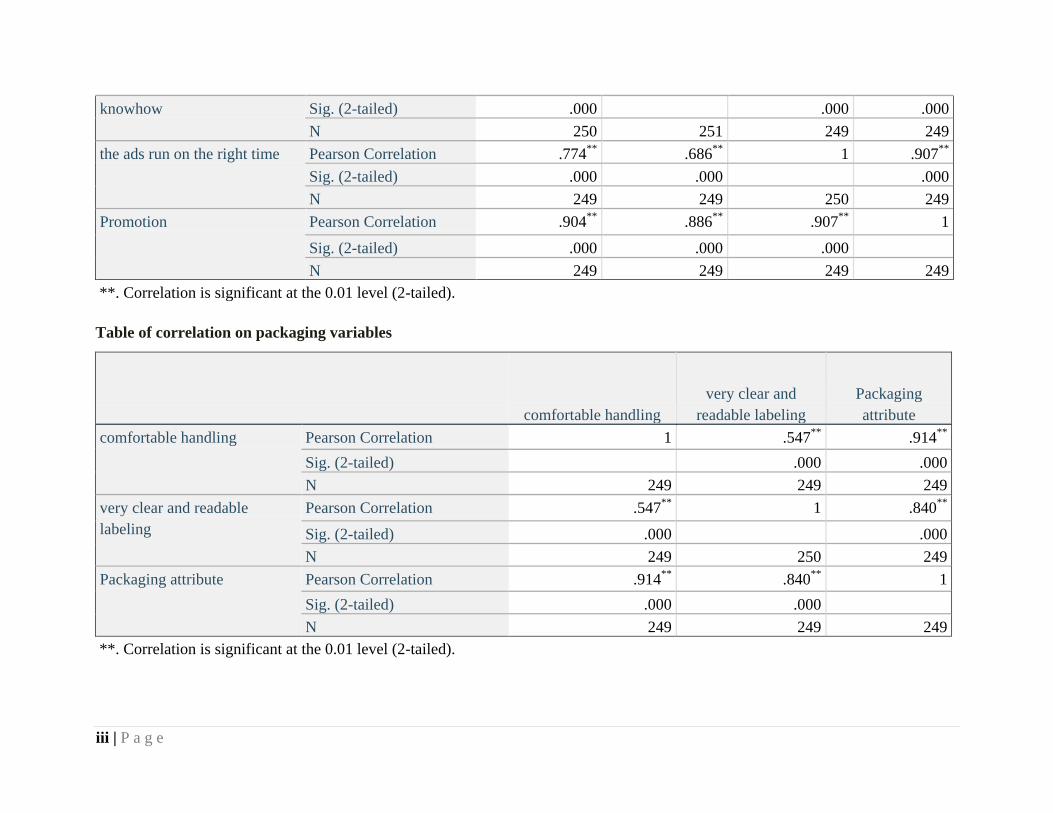
iii | P a g e
knowhow Sig. (2-tailed) .000 .000 .000
N 250 251 249 249
the ads run on the right time Pearson Correlation .774**
.686**
1 .907**
Sig. (2-tailed) .000 .000 .000
N 249 249 250 249
Promotion Pearson Correlation .904**
.886**
.907**
1
Sig. (2-tailed) .000 .000 .000
N 249 249 249 249
**. Correlation is significant at the 0.01 level (2-tailed).
Table of correlation on packaging variables
comfortable handling
very clear and
readable labeling
Packaging
attribute
comfortable handling Pearson Correlation 1 .547**
.914**
Sig. (2-tailed) .000 .000
N 249 249 249
very clear and readable
labeling
Pearson Correlation .547**
1 .840**
Sig. (2-tailed) .000 .000
N 249 250 249
Packaging attribute Pearson Correlation .914**
.840**
1
Sig. (2-tailed) .000 .000
N 249 249 249
**. Correlation is significant at the 0.01 level (2-tailed).
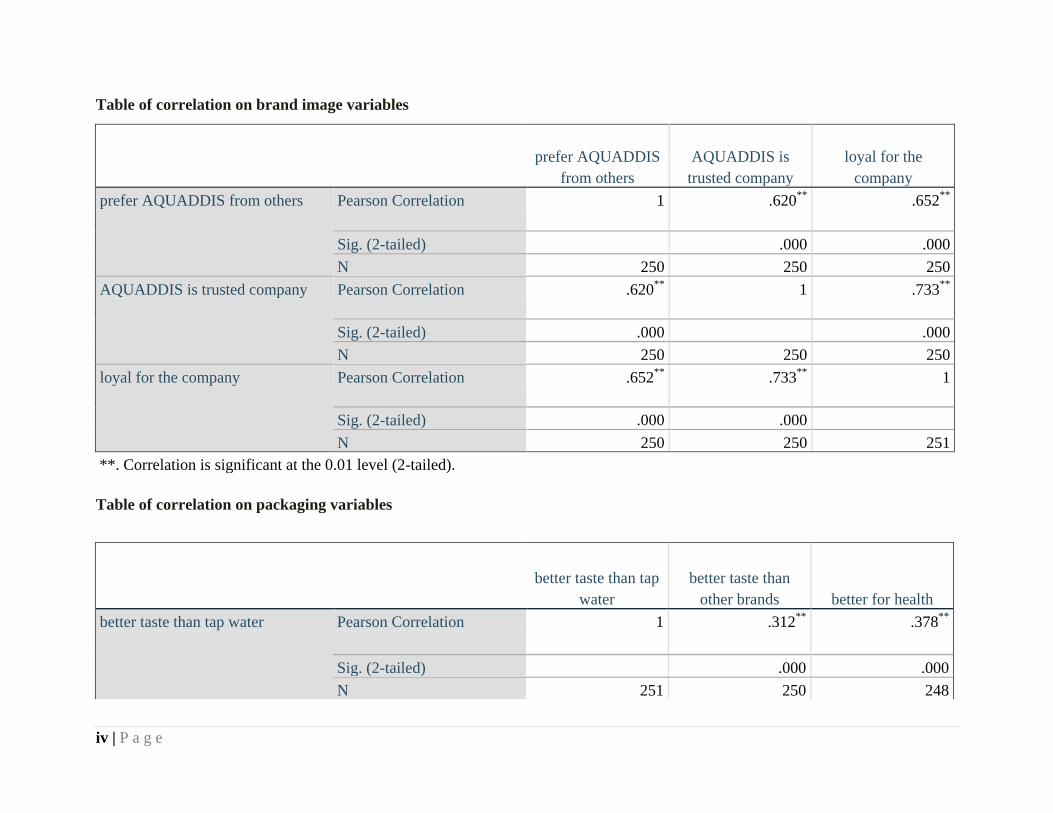
iv | P a g e
Table of correlation on brand image variables
prefer AQUADDIS
from others
AQUADDIS is
trusted company
loyal for the
company
prefer AQUADDIS from others Pearson Correlation 1 .620**
.652**
Sig. (2-tailed) .000 .000
N 250 250 250
AQUADDIS is trusted company Pearson Correlation .620**
1 .733**
Sig. (2-tailed) .000 .000
N 250 250 250
loyal for the company Pearson Correlation .652**
.733**
1
Sig. (2-tailed) .000 .000
N 250 250 251
**. Correlation is significant at the 0.01 level (2-tailed).
Table of correlation on packaging variables
better taste than tap
water
better taste than
other brands better for health
better taste than tap water Pearson Correlation 1 .312**
.378**
Sig. (2-tailed) .000 .000
N 251 250 248
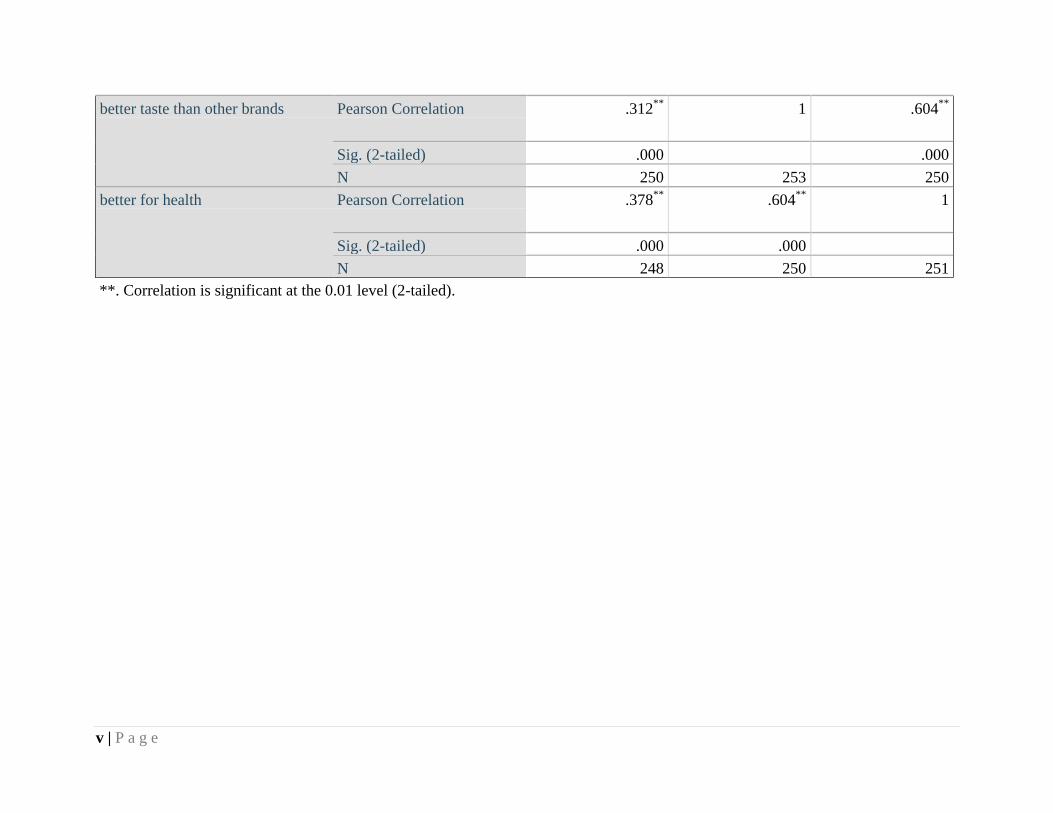
v | P a g e
better taste than other brands Pearson Correlation .312**
1 .604**
Sig. (2-tailed) .000 .000
N 250 253 250
better for health Pearson Correlation .378**
.604**
1
Sig. (2-tailed) .000 .000
N 248 250 251
**. Correlation is significant at the 0.01 level (2-tailed).
iv | P a g e
APPENDIX II
Questionnaire
Self administered questionnaire
I. English version
This questionnaire is designed to gather data regarding the contribution factors of consumer
perception on packaging water of AQUADDIS brand. The objective of this thesis is as a partial
fulfillment of master’s degree on marketing management in Addis Ababa University, college of
commerce under the topic ‘consumer perception towards bottled water the case of AQUADDIS
bottled water industry, ASKU PLC’.
As part of my thesis I need to gather some data on consumer perception on AQUADDIS bottled
water.
I would greatly appreciate you for taking the time to answer a few questions.
It will take about 5 minutes.
Thank you so much in advance for helping me out!
Questionnaire
Part 1: Socio – Economic Status of the Respondents
1.1. Please select your gender
Male Female
1.2. Please provide your age
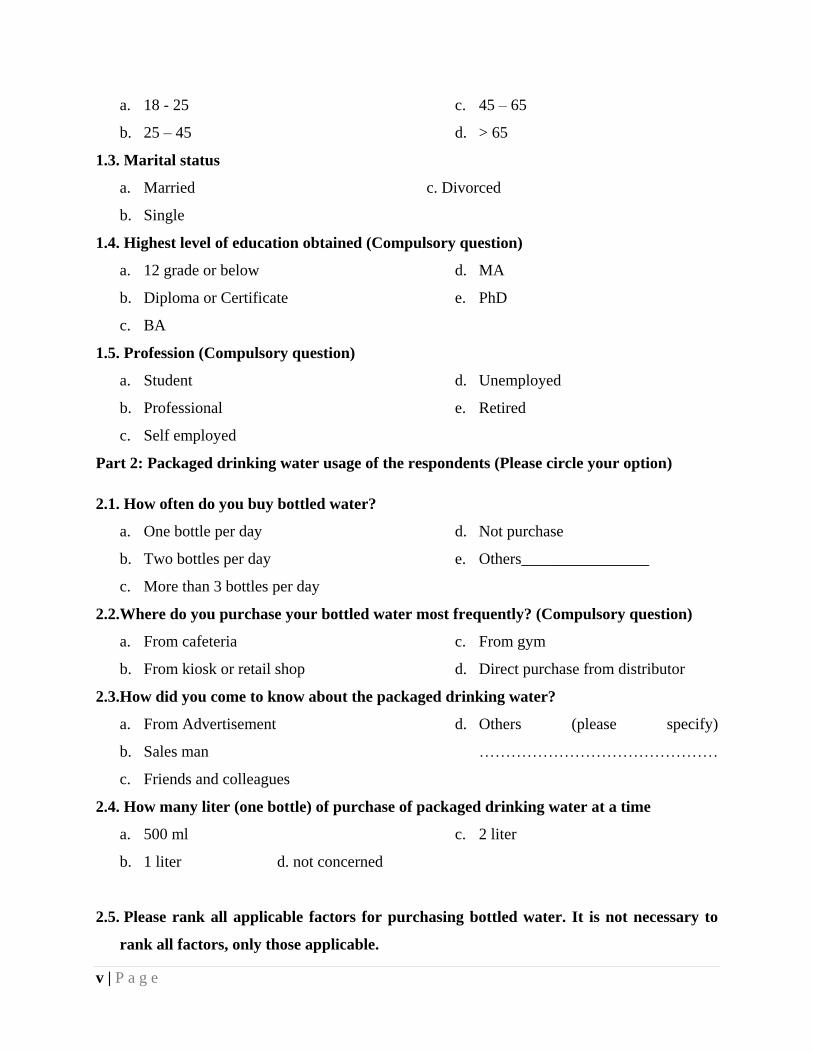
v | P a g e
a. 18 - 25
b. 25 – 45
c. 45 – 65
d. > 65
1.3. Marital status
a. Married c. Divorced
b. Single
1.4. Highest level of education obtained (Compulsory question)
a. 12 grade or below
b. Diploma or Certificate
c. BA
d. MA
e. PhD
1.5. Profession (Compulsory question)
a. Student
b. Professional
c. Self employed
d. Unemployed
e. Retired
Part 2: Packaged drinking water usage of the respondents (Please circle your option)
2.1. How often do you buy bottled water?
a. One bottle per day
b. Two bottles per day
c. More than 3 bottles per day
d. Not purchase
e. Others________________
2.2.Where do you purchase your bottled water most frequently? (Compulsory question)
a. From cafeteria
b. From kiosk or retail shop
c. From gym
d. Direct purchase from distributor
2.3.How did you come to know about the packaged drinking water?
a. From Advertisement
b. Sales man
c. Friends and colleagues
d. Others (please specify)
………………………………………
2.4. How many liter (one bottle) of purchase of packaged drinking water at a time
a. 500 ml
b. 1 liter d. not concerned
c. 2 liter
2.5. Please rank all applicable factors for purchasing bottled water. It is not necessary to
rank all factors, only those applicable.
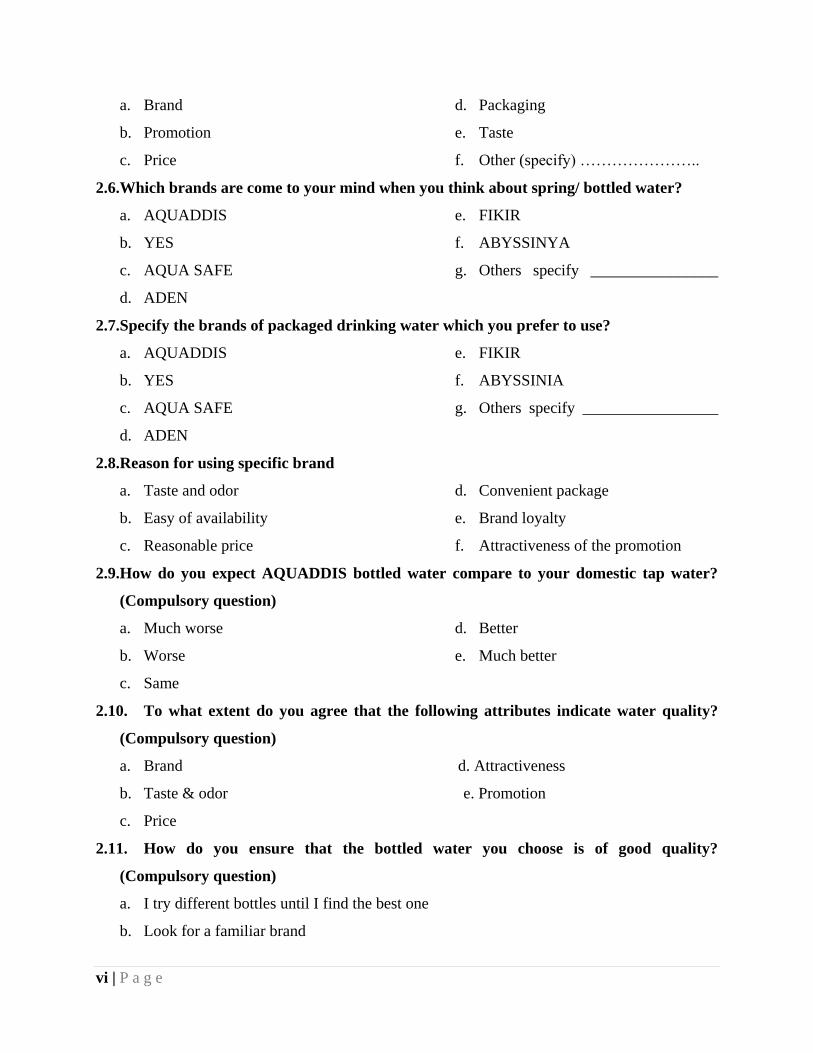
vi | P a g e
a. Brand
b. Promotion
c. Price
d. Packaging
e. Taste
f. Other (specify) …………………..
2.6.Which brands are come to your mind when you think about spring/ bottled water?
a. AQUADDIS
b. YES
c. AQUA SAFE
d. ADEN
e. FIKIR
f. ABYSSINYA
g. Others specify ________________
2.7.Specify the brands of packaged drinking water which you prefer to use?
a. AQUADDIS
b. YES
c. AQUA SAFE
d. ADEN
e. FIKIR
f. ABYSSINIA
g. Others specify _________________
2.8.Reason for using specific brand
a. Taste and odor
b. Easy of availability
c. Reasonable price
d. Convenient package
e. Brand loyalty
f. Attractiveness of the promotion
2.9.How do you expect AQUADDIS bottled water compare to your domestic tap water?
(Compulsory question)
a. Much worse
b. Worse
c. Same
d. Better
e. Much better
2.10. To what extent do you agree that the following attributes indicate water quality?
(Compulsory question)
a. Brand d. Attractiveness
b. Taste & odor e. Promotion
c. Price
2.11. How do you ensure that the bottled water you choose is of good quality?
(Compulsory question)
a. I try different bottles until I find the best one
b. Look for a familiar brand
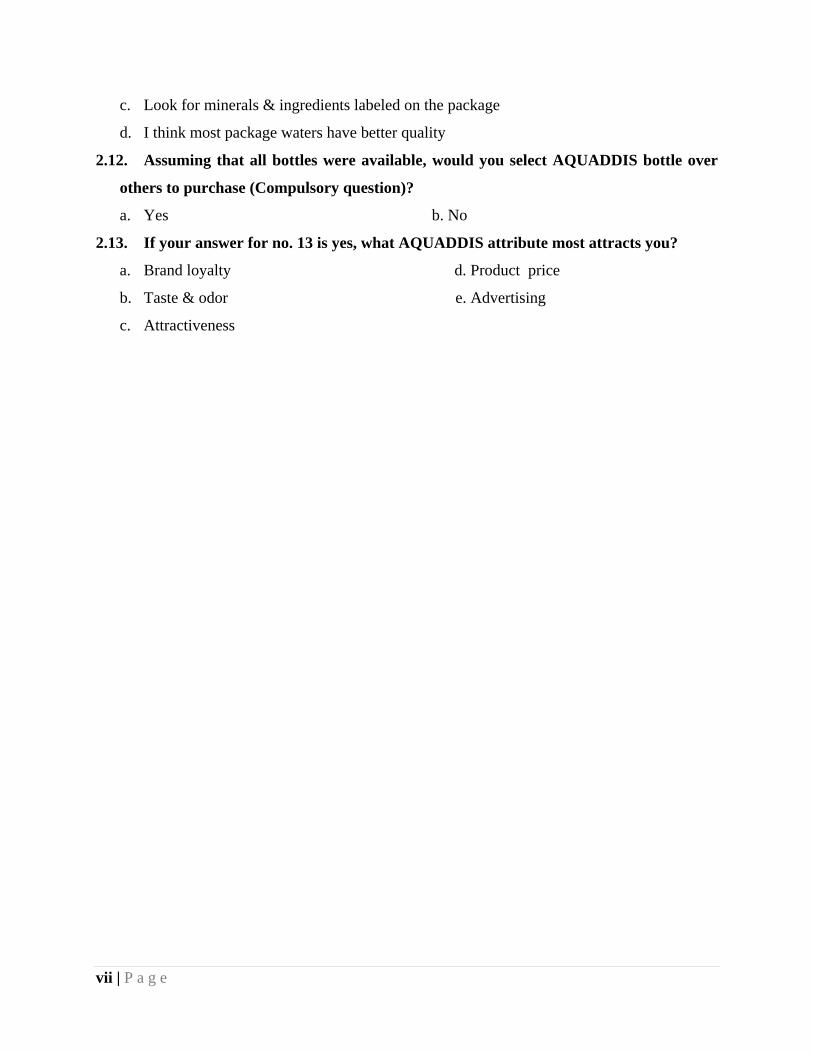
vii | P a g e
c. Look for minerals & ingredients labeled on the package
d. I think most package waters have better quality
2.12. Assuming that all bottles were available, would you select AQUADDIS bottle over
others to purchase (Compulsory question)?
a. Yes b. No
2.13. If your answer for no. 13 is yes, what AQUADDIS attribute most attracts you?
a. Brand loyalty d. Product price
b. Taste & odor e. Advertising
c. Attractiveness
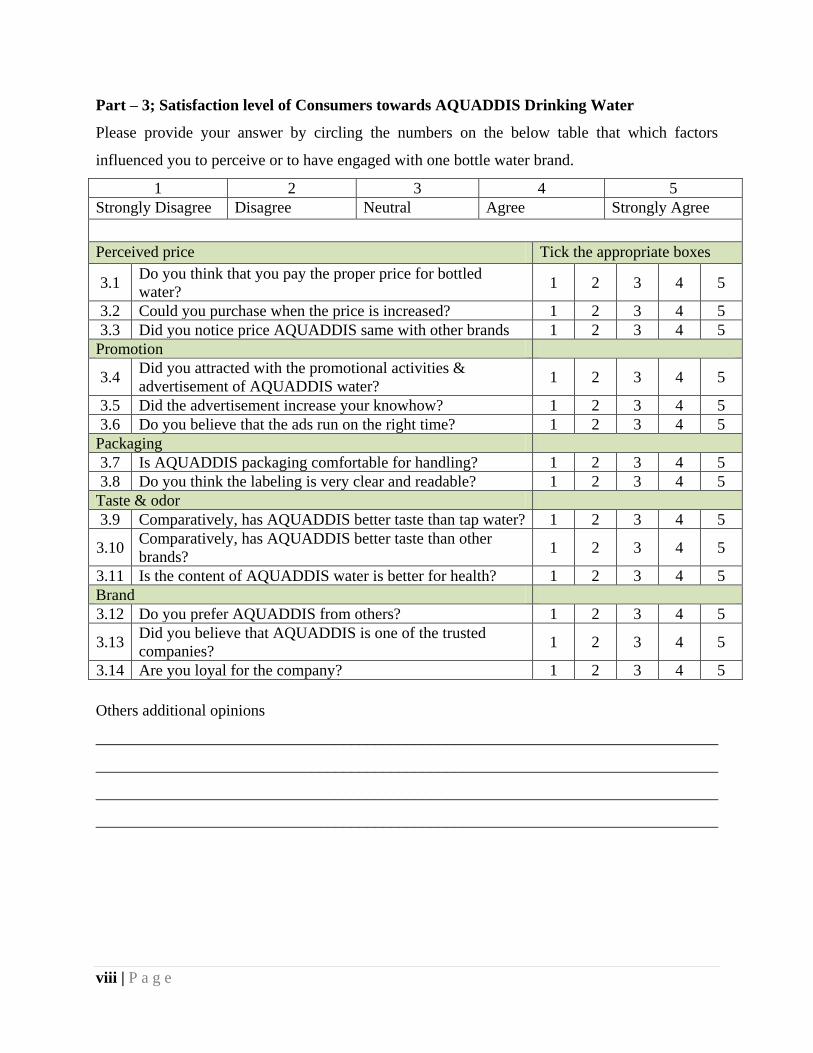
viii | P a g e
Part – 3; Satisfaction level of Consumers towards AQUADDIS Drinking Water
Please provide your answer by circling the numbers on the below table that which factors
influenced you to perceive or to have engaged with one bottle water brand.
1 2 3 4 5
Strongly Disagree Disagree Neutral Agree Strongly Agree
Perceived price Tick the appropriate boxes
3.1 Do you think that you pay the proper price for bottled
water? 1 2 3 4 5
3.2 Could you purchase when the price is increased? 1 2 3 4 5
3.3 Did you notice price AQUADDIS same with other brands 1 2 3 4 5
Promotion
3.4 Did you attracted with the promotional activities &
advertisement of AQUADDIS water? 1 2 3 4 5
3.5 Did the advertisement increase your knowhow? 1 2 3 4 5
3.6 Do you believe that the ads run on the right time? 1 2 3 4 5
Packaging
3.7 Is AQUADDIS packaging comfortable for handling? 1 2 3 4 5
3.8 Do you think the labeling is very clear and readable? 1 2 3 4 5
Taste & odor
3.9 Comparatively, has AQUADDIS better taste than tap water? 1 2 3 4 5
3.10 Comparatively, has AQUADDIS better taste than other
brands? 1 2 3 4 5
3.11 Is the content of AQUADDIS water is better for health? 1 2 3 4 5
Brand
3.12 Do you prefer AQUADDIS from others? 1 2 3 4 5
3.13 Did you believe that AQUADDIS is one of the trusted
companies? 1 2 3 4 5
3.14 Are you loyal for the company? 1 2 3 4 5
Others additional opinions
______________________________________________________________________________
______________________________________________________________________________
______________________________________________________________________________
______________________________________________________________________________
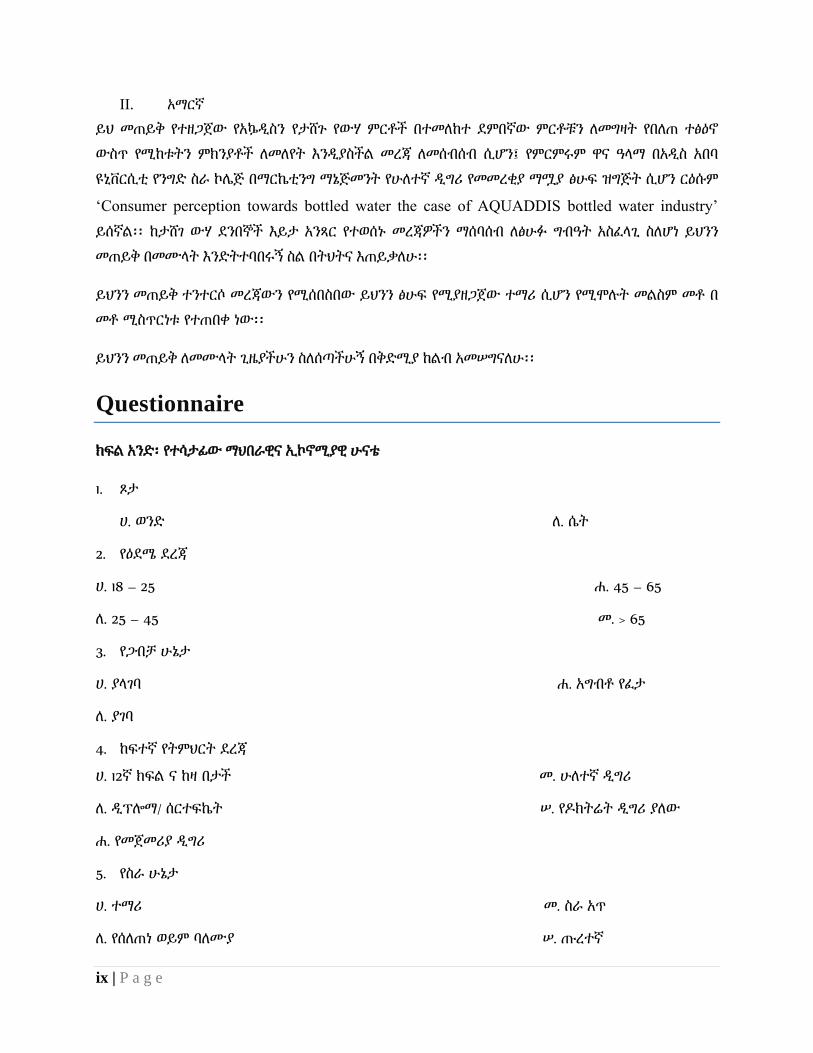
ix | P a g e
II. አማርኛ
ይህ መጠይቅ የተዘጋጀው የአኴዲስን የታሸጉ የውሃ ምርቶች በተመለከተ ደምበኛው ምርቶቹን ለመግዛት የበለጠ ተፅዕኖ
ውስጥ የሚከቱትን ምክንያቶች ለመለየት እንዲያስችል መረጃ ለመሰብሰብ ሲሆን፤ የምርምሩም ዋና ዓላማ በአዲስ አበባ
ዩኒቨርሲቲ የንግድ ስራ ኮሌጅ በማርኬቲንግ ማኔጅመንት የሁለተኛ ዲግሪ የመመረቂያ ማሟያ ፅሁፍ ዝግጅት ሲሆን ርዕሱም
‘Consumer perception towards bottled water the case of AQUADDIS bottled water industry’
ይሰኛል፡፡ ከታሸገ ውሃ ደንበኞች እይታ አንጻር የተወሰኑ መረጃዎችን ማሰባሰብ ለፅሁፉ ግብዓት አስፈላጊ ስለሆነ ይህንን
መጠይቅ በመሙላት እንድትተባበሩኝ ስል በትህትና እጠይቃለሁ፡፡
ይህንን መጠይቅ ተንተርሶ መረጃውን የሚሰበስበው ይህንን ፅሁፍ የሚያዘጋጀው ተማሪ ሲሆን የሚሞሉት መልስም መቶ በ
መቶ ሚስጥርነቱ የተጠበቀ ነው፡፡
ይህንን መጠይቅ ለመሙላት ጊዜያችሁን ስለሰጣችሁኝ በቅድሚያ ከልብ አመሠግናለሁ፡፡
Questionnaire
ክፍል አንድ፡ የተሳታፊው ማህበራዊና ኢኮኖሚያዊ ሁናቴ
1. ጾታ
ሀ. ወንድ ለ. ሴት
2. የዕደሜ ደረጃ
ሀ. 18 – 25 ሐ. 45 – 65
ለ. 25 – 45 መ. > 65
3. የጋብቻ ሁኔታ
ሀ. ያላገባ ሐ. አግብቶ የፈታ
ለ. ያገባ
4. ከፍተኛ የትምህርት ደረጃ
ሀ. 12ኛ ክፍል ና ከዛ በታች መ. ሁለተኛ ዲግሪ
ለ. ዲፕሎማ/ ሰርተፍኬት ሠ. የዶክትሬት ዲግሪ ያለው
ሐ. የመጀመሪያ ዲግሪ
5. የስራ ሁኔታ
ሀ. ተማሪ መ. ስራ አጥ
ለ. የሰለጠነ ወይም ባለሙያ ሠ. ጡረተኛ
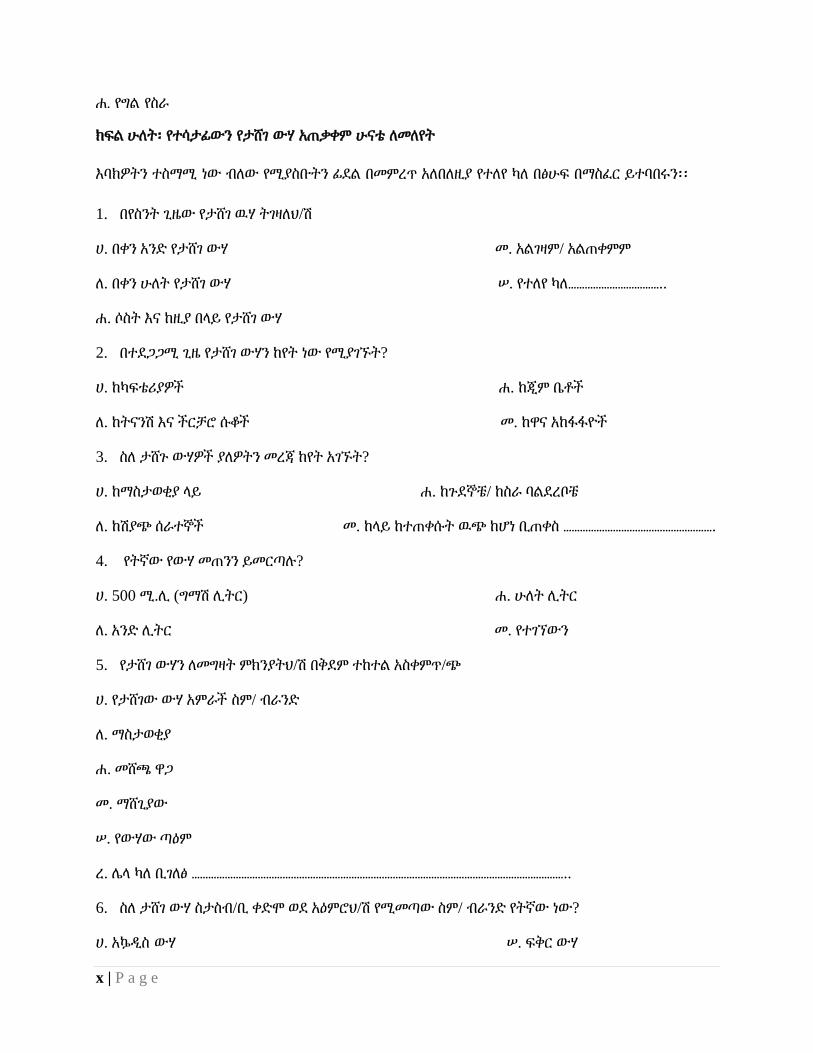
x | P a g e
ሐ. የግል የስራ
ክፍል ሁለት፡ የተሳታፊውን የታሸገ ውሃ አጠቃቀም ሁናቴ ለመለየት
እባክዎትን ተስማሚ ነው ብለው የሚያስቡትን ፊደል በመምረጥ አለበለዚያ የተለየ ካለ በፅሁፍ በማስፈር ይተባበሩን፡፡
1. በየስንት ጊዜው የታሸገ ዉሃ ትገዛለህ/ሽ
ሀ. በቀን አንድ የታሸገ ውሃ መ. አልገዛም/ አልጠቀምም
ለ. በቀን ሁለት የታሸገ ውሃ ሠ. የተለየ ካለ……………………………..
ሐ. ሶስት እና ከዚያ በላይ የታሸገ ውሃ
2. በተደጋጋሚ ጊዜ የታሸገ ውሃን ከየት ነው የሚያገኙት?
ሀ. ከካፍቴሪያዎች ሐ. ከጂም ቤቶች
ለ. ከትናንሽ እና ችርቻሮ ሱቆች መ. ከዋና አከፋፋዮች
3. ስለ ታሸጉ ውሃዎች ያለዎትን መረጃ ከየት አገኙት?
ሀ. ከማስታወቂያ ላይ ሐ. ከጉደኞቼ/ ከስራ ባልደረቦቼ
ለ. ከሽያጭ ሰራተኞች መ. ከላይ ከተጠቀሱት ዉጭ ከሆነ ቢጠቀስ ……………………………………………….
4. የትኛው የውሃ መጠንን ይመርጣሉ?
ሀ. 500 ሚ.ሊ (ግማሽ ሊትር) ሐ. ሁለት ሊትር
ለ. አንድ ሊትር መ. የተገኘውን
5. የታሸገ ውሃን ለመግዛት ምክንያትህ/ሽ በቅደም ተከተል አስቀምጥ/ጭ
ሀ. የታሸገው ውሃ አምራች ስም/ ብራንድ
ለ. ማስታወቂያ
ሐ. መሸጫ ዋጋ
መ. ማሸጊያው
ሠ. የውሃው ጣዕም
ረ. ሌላ ካለ ቢገለፅ ………………………………………………………………………………………………………………………..
6. ስለ ታሸገ ውሃ ስታስብ/ቢ ቀድሞ ወደ አዕምሮህ/ሽ የሚመጣው ስም/ ብራንድ የትኛው ነው?
ሀ. አኴዲስ ውሃ ሠ. ፍቅር ውሃ
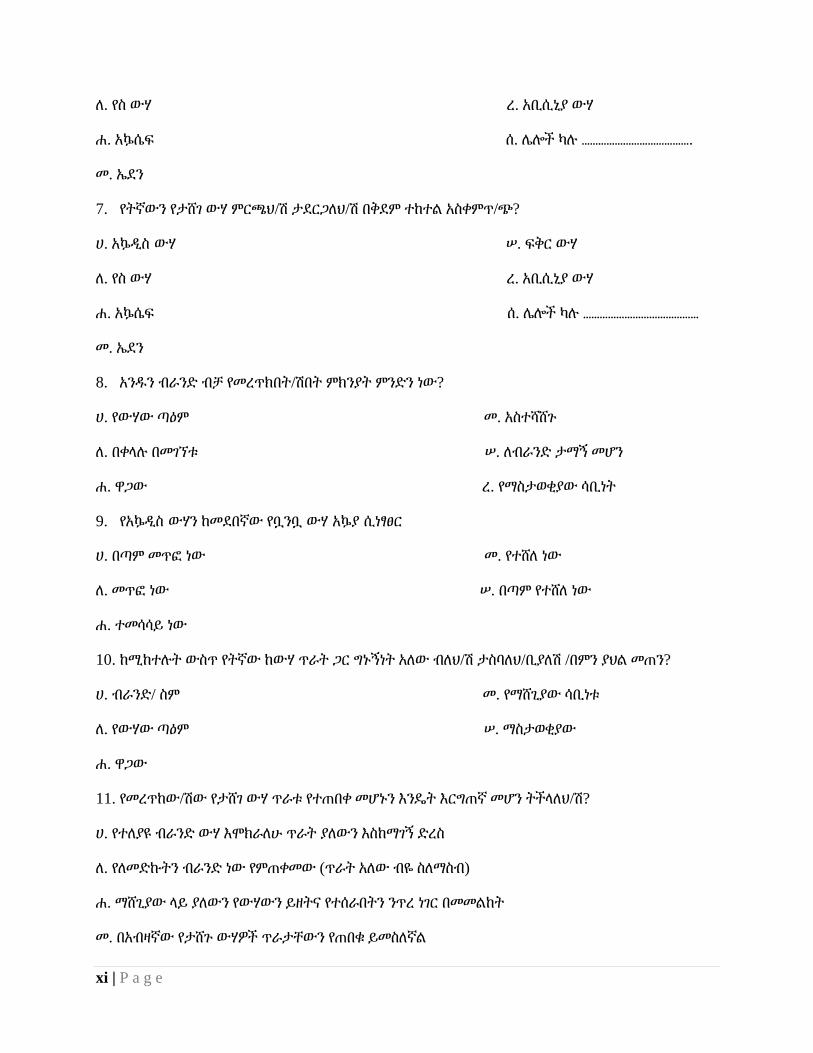
xi | P a g e
ለ. የስ ውሃ ረ. አቢሲኒያ ውሃ
ሐ. አኴሴፍ ሰ. ሌሎች ካሉ ………………………………….
መ. ኤደን
7. የትኛውን የታሸገ ውሃ ምርጫህ/ሽ ታደርጋለህ/ሽ በቅደም ተከተል አስቀምጥ/ጭ?
ሀ. አኴዲስ ውሃ ሠ. ፍቅር ውሃ
ለ. የስ ውሃ ረ. አቢሲኒያ ውሃ
ሐ. አኴሴፍ ሰ. ሌሎች ካሉ ……………………………………
መ. ኤደን
8. አንዱን ብራንድ ብቻ የመረጥክበት/ሽበት ምክንያት ምንድን ነው?
ሀ. የውሃው ጣዕም መ. አስተሻሸጉ
ለ. በቀላሉ በመገኘቱ ሠ. ለብራንድ ታማኝ መሆን
ሐ. ዋጋው ረ. የማስታወቂያው ሳቢነት
9. የአኴዲስ ውሃን ከመደበኛው የቧንቧ ውሃ አኴያ ሲነፃፀር
ሀ. በጣም መጥፎ ነው መ. የተሸለ ነው
ለ. መጥፎ ነው ሠ. በጣም የተሸለ ነው
ሐ. ተመሳሳይ ነው
10. ከሚከተሉት ውስጥ የትኛው ከውሃ ጥራት ጋር ግኑኝነት አለው ብለህ/ሽ ታስባለህ/ቢያለሽ /በምን ያህል መጠን?
ሀ. ብራንድ/ ስም መ. የማሸጊያው ሳቢነቱ
ለ. የውሃው ጣዕም ሠ. ማስታወቂያው
ሐ. ዋጋው
11. የመረጥከው/ሽው የታሸገ ውሃ ጥራቱ የተጠበቀ መሆኑን እንዴት እርግጠኛ መሆን ትችላለህ/ሽ?
ሀ. የተለያዩ ብራንድ ውሃ እሞክራለሁ ጥራት ያለውን እስከማገኝ ድረስ
ለ. የለመድኩትን ብራንድ ነው የምጠቀመው (ጥራት አለው ብዬ ስለማስብ)
ሐ. ማሸጊያው ላይ ያለውን የውሃውን ይዘትና የተሰራበትን ንጥረ ነገር በመመልከት
መ. በአብዛኛው የታሸጉ ውሃዎች ጥራታቸውን የጠበቁ ይመስለኛል
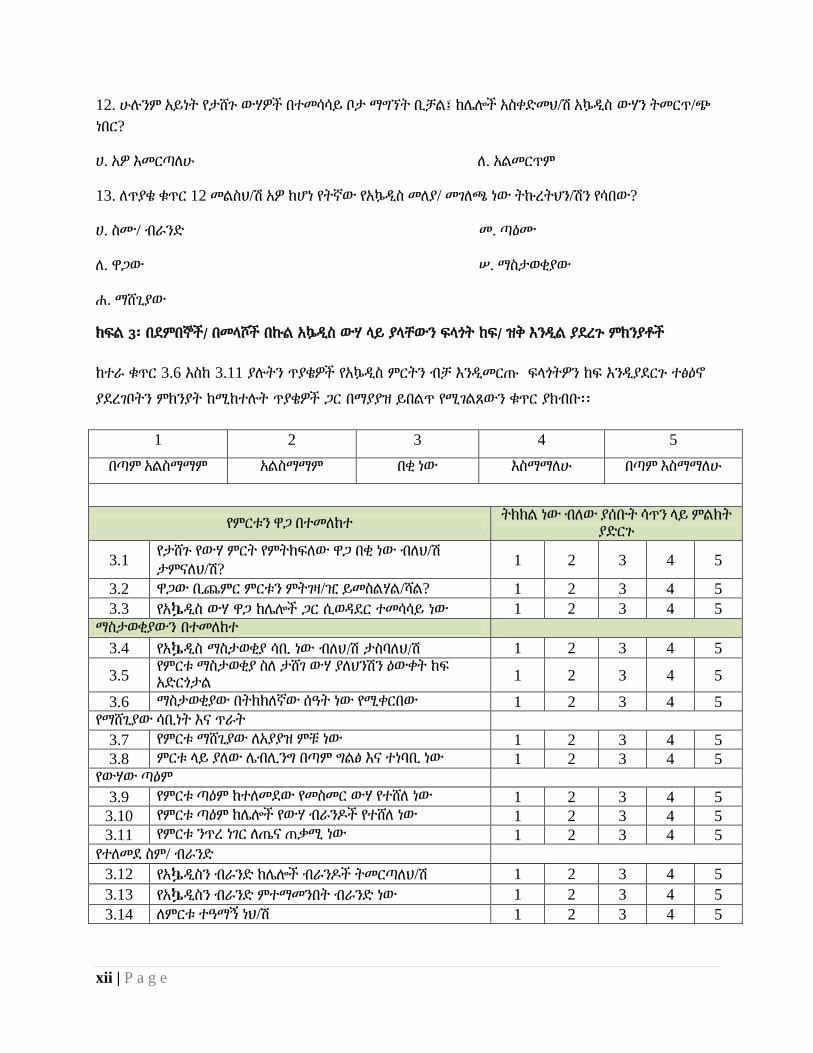
xii | P a g e
12. ሁሉንም አይነት የታሸጉ ውሃዎች በተመሳሳይ ቦታ ማግኘት ቢቻል፤ ከሌሎች አስቀድመህ/ሽ አኴዲስ ውሃን ትመርጥ/ጭ
ነበር?
ሀ. አዎ እመርጣለሁ ለ. አልመርጥም
13. ለጥያቄ ቁጥር 12 መልስህ/ሽ አዎ ከሆነ የትኛው የአኴዲስ መለያ/ መገለጫ ነው ትኩረትህን/ሽን የሳበው?
ሀ. ስሙ/ ብራንድ መ. ጣዕሙ
ለ. ዋጋው ሠ. ማስታወቂያው
ሐ. ማሸጊያው
ክፍል 3፡ በደምበኞች/ በመላሾች በኩል አኴዲስ ውሃ ላይ ያላቸውን ፍላጎት ከፍ/ ዝቅ እንዲል ያደረጉ ምክንያቶች
ከተራ ቁጥር 3.6 እስከ 3.11 ያሉትን ጥያቄዎች የአኴዲስ ምርትን ብቻ እንዲመርጡ ፍላጎትዎን ከፍ እንዲያደርጉ ተፅዕኖ
ያደረገቦትን ምክንያት ከሚከተሉት ጥያቄዎች ጋር በማያያዝ ይበልጥ የሚገልጸውን ቁጥር ያክብቡ፡፡
1 2 3 4 5
በጣም አልስማማም አልስማማም በቂ ነው እስማማለሁ በጣም እስማማለሁ
የምርቱን ዋጋ በተመለከተ ትክክል ነው ብለው ያሰቡት ሳጥን ላይ ምልክት
ያድርጉ
3.1 የታሸጉ የውሃ ምርት የምትክፍለው ዋጋ በቂ ነው ብለህ/ሽ
ታምናለህ/ሽ? 1 2 3 4 5
3.2 ዋጋው ቢጨምር ምርቱን ምትገዛ/ዢ ይመስልሃል/ሻል? 1 2 3 4 5
3.3 የአኴዲስ ውሃ ዋጋ ከሌሎች ጋር ሲወዳደር ተመሳሳይ ነው 1 2 3 4 5
ማስታወቂያውን በተመለከተ
3.4 የአኴዲስ ማስታወቂያ ሳቢ ነው ብለህ/ሽ ታስባለህ/ሽ 1 2 3 4 5
3.5 የምርቱ ማስታወቂያ ስለ ታሸገ ውሃ ያለህንሽን ዕውቀት ከፍ አድርጎታል 1 2 3 4 5
3.6 ማስታወቂያው በትክክለኛው ሰዓት ነው የሚቀርበው 1 2 3 4 5 የማሸጊያው ሳቢነት እና ጥራት
3.7 የምርቱ ማሸጊያው ለአያያዝ ምቹ ነው 1 2 3 4 5
3.8 ምርቱ ላይ ያለው ሌብሊንግ በጣም ግልፅ እና ተነባቢ ነው 1 2 3 4 5 የውሃው ጣዕም
3.9 የምርቱ ጣዕም ከተለመደው የመስመር ውሃ የተሸለ ነው 1 2 3 4 5
3.10 የምርቱ ጣዕም ከሌሎች የውሃ ብራንዶች የተሸለ ነው 1 2 3 4 5
3.11 የምርቱ ንጥረ ነገር ለጤና ጠቃሚ ነው 1 2 3 4 5
የተለመደ ስም/ ብራንድ
3.12 የአኴዲስን ብራንድ ከሌሎች ብራንዶች ትመርጣለህ/ሽ 1 2 3 4 5
3.13 የአኴዲስን ብራንድ ምተማመንበት ብራንድ ነው 1 2 3 4 5
3.14 ለምርቱ ተዓማኝ ነህ/ሽ 1 2 3 4 5
xiii | P a g e
ሌላ ተጨማሪ ምክንያቶች ካሉ ቢገለፁ፡
_____________________________________________________________________________________________________________________________________
_____________________________________________________________________________________________________________________________________
_____________________________________________________________________________________________________________________________________
_____________________________________________________________________________________________________________________________________
_____________________________________________________________________________________________________________________________________
________________________________________________________