THE CONSUMER SENSORY PERCEPTION OF PASSION-FRUIT JUICE USING FREE-CHOICE PROFILING
11
Journal of Sensory Studies 20 (2005) 17–27. All Rights Reserved. © Copyright 2005, Blackwell Publishing 17 THE CONSUMER SENSORY PERCEPTION OF PASSION-FRUIT JUICE USING FREE-CHOICE PROFILING ROSIRES DELIZA 1,4 , HAL MacFIE 2 and DUNCAN HEDDERLEY 3 1 EMBRAPA Food Technology Avenida das Américas, 29,501 CEP 23.020-470 Rio de Janeiro Brazil 2 Hal MacFie Training Services 43 Manor Road, Keynsham Bristol, BS31 1RB UK 3 Crop & Food Research Palmerston North, New Zealand Accepted for Publication September 24, 2004 ABSTRACT Free-choice profiling (FCP) was carried out in order to investigate how naive consumers (who had never tried the product before) described and perceived passion-fruit juice. This method allows participants to use their own attributes to describe and quantify food products and beverages. The study used four different samples of passion-fruit juice, analyzed by 10 consumers in three replicates. The data were analyzed by using generalized Procrustes analysis. The first and second dimension accounted for 78.7% of the variance. The product consensus configuration revealed that assessors were able to reproduce samples’ description, and also to differentiate samples. Free-choice profiling is a useful method for describing consumer perception of passion- fruit juice. INTRODUCTION Passion fruit is found in many tropical and subtropical countries. It is an ovoid shaped fruit that gives a juice with a very strong exotic flavor and a Blackwell Science, LtdOxford, UKJSSJournal of Sensory Studies0887-8250Copyright 2004 by Food & Nutrition Press, Inc., Trumbull, Connecticut.2011727Original ArticlePASSION-FRUIT JUICE AND FREE-CHOICE PROFILER. DELIZA, H. MacFIE and D. HEDDERLEY 4 Corresponding author. TEL: +55 21 2410 9566; FAX: +55 21 2410 1090; EMAIL: [email protected]
-
Upload
independent -
Category
Documents
-
view
1 -
download
0
Transcript of THE CONSUMER SENSORY PERCEPTION OF PASSION-FRUIT JUICE USING FREE-CHOICE PROFILING
Journal of Sensory Studies
20
(2005) 17–27.
All Rights Reserved.
©
Copyright 2005, Blackwell Publishing
17
THE CONSUMER SENSORY PERCEPTION OF PASSION-FRUIT JUICE USING FREE-CHOICE PROFILING
ROSIRES DELIZA
1,4
, HAL MacFIE
2
and DUNCAN HEDDERLEY
3
1
EMBRAPA Food TechnologyAvenida das Américas, 29,501
CEP 23.020-470 Rio de JaneiroBrazil
2
Hal MacFie Training Services43 Manor Road, Keynsham
Bristol, BS31 1RBUK
3
Crop & Food ResearchPalmerston North, New Zealand
Accepted for Publication September 24, 2004
ABSTRACT
Free-choice profiling (FCP) was carried out in order to investigate hownaive consumers (who had never tried the product before) described andperceived passion-fruit juice. This method allows participants to use their ownattributes to describe and quantify food products and beverages. The studyused four different samples of passion-fruit juice, analyzed by 10 consumersin three replicates. The data were analyzed by using generalized Procrustesanalysis. The first and second dimension accounted for 78.7% of the variance.The product consensus configuration revealed that assessors were able toreproduce samples’ description, and also to differentiate samples. Free-choiceprofiling is a useful method for describing consumer perception of passion-fruit juice.
INTRODUCTION
Passion fruit is found in many tropical and subtropical countries. It is anovoid shaped fruit that gives a juice with a very strong exotic flavor and a
Blackwell Science, LtdOxford, UKJSSJournal of Sensory Studies0887-8250Copyright 2004 by Food & Nutrition Press, Inc., Trumbull, Connecticut.2011727Original Article
PASSION-FRUIT JUICE AND FREE-CHOICE PROFILER. DELIZA, H.
MacFIE and D. HEDDERLEY
4
Corresponding author. TEL:
+
55 21 2410 9566; FAX:
+
55 21 2410 1090; EMAIL:[email protected]
18 R. DELIZA, H. MacFIE and D. HEDDERLEY
bright orange color (ITDG 2004). There are two important commercial vari-eties: purple passion fruit (
Passiflora edulis
), which is sweeter and consumedas a fruit, and yellow passion fruit (
Passiflora edulis
var.
flavicarpa
). The latterhas larger fruits, is more acidic and is mainly used for juice preparation. Itsflavor is extremely sensitive to heat processing. The evaluation of its sensoryquality is essential to facilitate its use in juice and blend formulations. Despitepassion fruit being marketed worldwide, its sensory properties have not beeninvestigated, and only few articles on this fruit have been reported in theliterature. Those studies focused mainly on the effects of processing (thermal,microfiltration, osmotic evaporation) on the passion-fruit juice sensory prop-erties (Vaillant
et al.
2001; Sandi
et al.
2003; Vera
et al.
2003). However, mostof the studies used either difference tests to compare the products or prefer-ence tests to investigate the juice acceptability.
The influence of harvest season on the characteristics of purple passionfruit (
Passiflora edulis
) and its juice was investigated by Saenz
et al.
(1998).The results have shown that the quality of passion-fruit juice was affected byseason, but the product was acceptable in both summer and winter. Sandi
et al.
(2003) worked on the correlation between some physical-chemistry and sen-sory characteristics of pasteurized passion-fruit juice (
Passiflora edulis
var.
flavicarpa
) during 120 days of storage. The study discussed several correla-tions between the evaluated parameters, but the sensory profile of the passion-fruit juice was not presented. Only more recently, Della Modesta
et al.
(2004)presented the quantitative descriptive analysis (QDA) of pasteurized passion-fruit juice, which was developed by using a selected and trained sensory panelcomposed by eight people. The authors used a comprehensive 4-month selec-tion and training program.
Sensory evaluation of foods and beverages is carried out by using severalconventional profiling techniques such as QDA. Free-choice profiling (FCP)is a sensory methodology developed to avoid two major conventional flavorprofiling disadvantages: the necessity of having a common vocabulary ofattributes to describe the samples, and a pre-established measure of agreementamong the panelists on their interpretation and meaning of the terms they willemploy. The main difference between FCP and conventional descriptive pro-filing is that in FCP, products are evaluated by members of a panel whodescribe perceived qualities for that product using their own individual list ofterms, rather than a common scorecard. The terms used by panelists vary,based on individual experience and familiarity with the product. FCP is similarto traditional profiling in that assessors must be able to detect differencesbetween the samples, verbally describe the perceived attributes and quantifythem (Oreskovich
et al.
1991).Free-choice profiling has similar steps with conventional profiling. Sub-
jects in FCP are recruited and selected based on several criteria, such as ability
PASSION-FRUIT JUICE AND FREE-CHOICE PROFILE 19
to discriminate between products, product usage, task comprehension, healthand so on. Assessors are trained mainly in scale usage, and there are no fixedtraining procedures. There is no standardized scaling method or scorecard inFCP. Normally, either category or unstructured line scales are used, whichmay vary in size, from 6.5 to 15 cm long. The number of participants, repli-cation and the number of evaluated samples for each session depend on thecomplexity of the product and follow the rules applied for any sensory testing.
This relatively new methodology has been successfully used by sensoryanalysts in order to get sample information on one or more characteristics, aswell as on panelists and attributes information. Free-choice profiling wasdeveloped to assist the demands of marketing and product development teams,who required information on target consumers’ perceptions of product ratherthan a more technical description of the product typically produced by trainedsensory panels (Elmore and Heymann 1999; Murray
et al.
2001). The datacollected from FCP cannot be analyzed by using the traditional univariate ormultivariate analysis because of the lack of uniformity in scorecards amongpanelists (each assessor has his or her own set of attributes). The data have tobe interpreted by Procrustes analysis (Gower 1975).
The novelty of this study is characterized by the participation of consum-ers who had never tried the product (passion-fruit juice). The hypothesis isthat even when subjects do not know the sensory characteristics of a product,they are able to describe and express differences of the products in a repeatedassessment. Besides, the product would be characterized with terms used byconsumers, which would greatly contribute to R&D and marketing.
MATERIAL AND METHODS
Material
Aseptic packs of passion-fruit juice puree imported from the Netherlandswere used in this study. When the juice arrived at the laboratory, part was keptin the refrigerator at 3C, to be used in the following day, and part wasdistributed into 1-liter bottles and kept at
-
20C in the freezer. The passion-fruit puree had the following characteristics: 9.75
∞
Brix, determined with anAbbe “60” refractometer (Bellingham and Stanley Ltd., London, England)and expressed as
∞
Brix using the AOAC (1984) tables; pH
=
2.90, determinedwith a Beckman pH meter model 3500 (Beckman RIIC Ltd., Glenrhodes Fife,Scotland, UK). Three different samples of passion-fruit juice (named SampleA, B and C) were prepared by varying the dilution and the juice sweetness ofthe imported passion-fruit puree and, together with two commercial products(named Sample D and E), presented to consumers, who were asked to develop

20 R. DELIZA, H. MacFIE and D. HEDDERLEY
a list of descriptive terms to characterize the products. The five passion-fruitjuices used to develop the descriptive terms are shown in Table 1.
Consumers
Ten females aged between 22 and 46 years old were invited to take partin the FCP study. The women were selected on the basis of their being fruit-juice purchasers and also on their commitment and motivation. Some of theparticipants had previous experience with sensory evaluation, but none hadtried passion-fruit juice before. All were fruit-juice users and had no cold, hayfever or any other disease that might alter their senses of taste or smell. Theywere paid US$18 for their participation.
Sensory Evaluation
The FCP was carried out in two sessions. At the first session, consumerswere briefed about the concept of the methodology and an outline of theprocedure. Afterwards, they were presented to the five passion-fruit juicesshown in Table 1 and asked to list the sensory characteristics that describedthe products. Each assessor received 100 mL of each sample presented in145 mL coded, clear glasses (British Standards Institution 1985) at 8C, in adaylight-illuminated separated sensory booth. To make their task easier, theywere instructed to group terms for appearance, odor, flavor and mouthfeelseparately. They were instructed to include only objective attributes and notto use hedonic terms. At the vocabulary development session, the subjectswere first asked to describe the appearance and the odor of the presentedsample in their own words, after which they were requested to drink thesample normally and describe the flavor and mouthfeel characteristics. Theattributes were written on a score sheet for each assessor. At the secondsession, consumers rated only four out of the five passion-fruit juices pre-
TABLE 1.THE FIVE PASSION-FRUIT JUICES USED TO DEVELOP THE DESCRIPTIVE TERMS
Code Sample description
Ratio water : puree Added sugar (g/100 g juice)
A 6.8 : 1* 8.0*B 9.5 : 1 13.0C 4.0 : 1 4.0D Commercial passion-fruit juice 1 noneE Commercial passion-fruit juice 2 none
* According to Deliza (2001).
PASSION-FRUIT JUICE AND FREE-CHOICE PROFILE 21
sented in Table 1 and named as A, B, C and D. The samples were evaluatedmonadically by using an unstructured 10-cm line scale anchored with thewords “not at all” and “extremely” at the ends. The mouth-clearing procedurewas recommended. Each assessor evaluated the samples based on her own setof attributes. The same sample was presented three times following a balanceddesign (MacFie
et al.
1989).
Statistical Analysis
The data from the FCP were submitted to generalized Procrustes analy-sis, and a consensus matrix was obtained by mathematical data operations(translation, rotation/reflection and scaling analysis, according to Arnold andWilliams 1986). The optimum consensus is the average of all transformedconfigurations that show minimum overall deviation. It summarizes the infor-mation about the samples and replaces the panel mean (Langron
et al.
1984).The main perceptual dimensions of the spaces can be better interpreted by thecorrelation between the sample score for each attribute and the correspondingsample scores on each principal component. These correlations provide a wayto decide which attributes are important.
RESULTS
The FCP procedure elicited between 8 and 17 attributes for each assessor,with an average of 12. From the PCA on the consensus matrix obtained aftergeneralized procrustes analysis (GPA) of the data, the variance accounted for47.8%, 30.9%, 5.9% and 4.3% for the first four components, respectively(total of 89%). The assessors used many common words to describe the fourpassion-fruit juices.
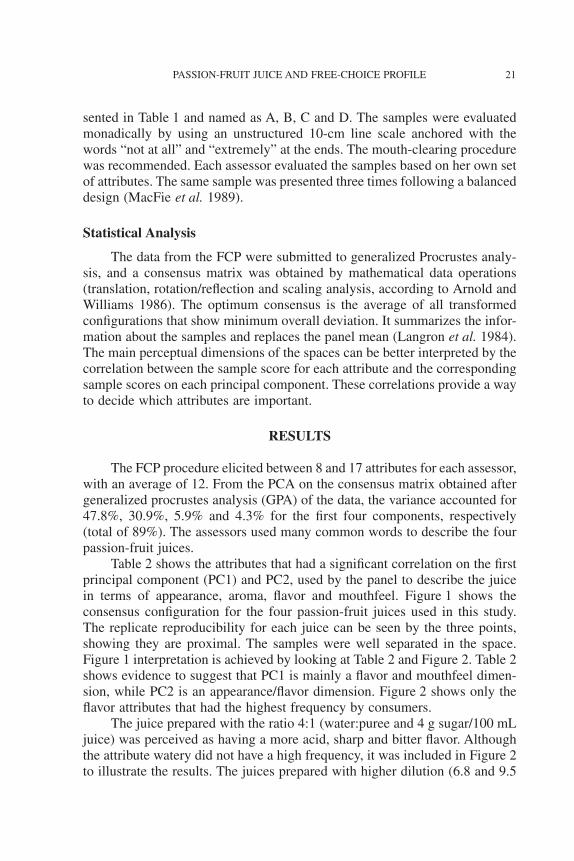
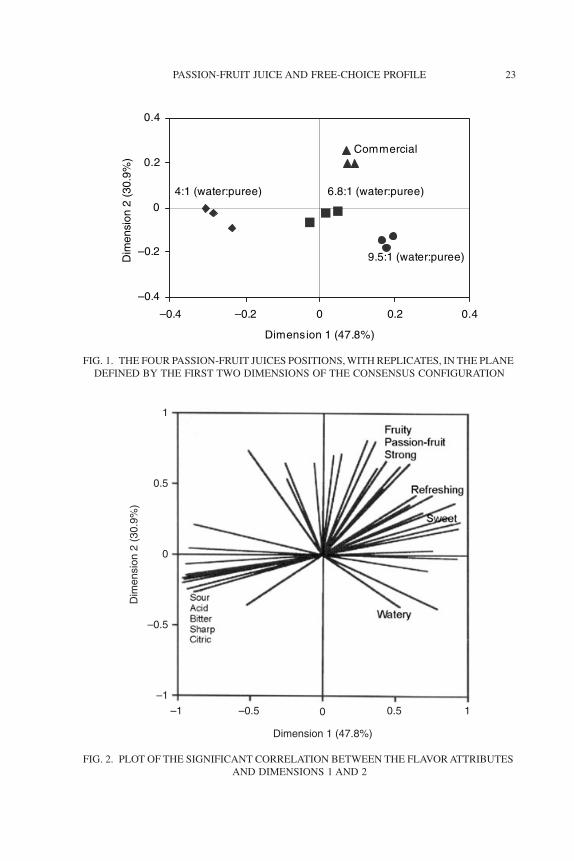
Table 2 shows the attributes that had a significant correlation on the firstprincipal component (PC1) and PC2, used by the panel to describe the juicein terms of appearance, aroma, flavor and mouthfeel. Figure 1 shows theconsensus configuration for the four passion-fruit juices used in this study.The replicate reproducibility for each juice can be seen by the three points,showing they are proximal. The samples were well separated in the space.Figure 1 interpretation is achieved by looking at Table 2 and Figure 2. Table 2shows evidence to suggest that PC1 is mainly a flavor and mouthfeel dimen-sion, while PC2 is an appearance/flavor dimension. Figure 2 shows only theflavor attributes that had the highest frequency by consumers.
The juice prepared with the ratio 4:1 (water:puree and 4 g sugar/100 mLjuice) was perceived as having a more acid, sharp and bitter flavor. Althoughthe attribute watery did not have a high frequency, it was included in Figure 2to illustrate the results. The juices prepared with higher dilution (6.8 and 9.5

22 R. DELIZA, H. MacFIE and D. HEDDERLEY
water:puree, 8 and 13 g sugar/100 mL juice, respectively) were perceived ashaving a more watery appearance and sweet flavor. The commercial passion-fruit juice was considered as having a fruity/passion-fruit/strong, sweet flavorand refreshing mouthfeel. From the above results, we can suggest the descrip-tors sweet and sharp – although very common descriptors for fruit juices – asimportant attributes for the description of the product. They are related to thejuice quality and are important parameters considered by the passion-fruit
TABLE 2.FREQUENCY OF EACH PASSION-FRUIT JUICE ATTRIBUTE WITH SIGNIFICANT
CORRELATION BETWEEN ATTRIBUTES AND CONSENSUS ON THE DIMENSIONS 1 AND 2
Attribute Total Dimension 1(47.8%)
Dimension 2(30.9%)
Appearance
Yellow color 5 3 2Orange color 6 1 5Clear 2 1 1Watery/diluting/pale/clear/light 9 2 7Fruity 4 1 3Bitty 1 1 0Dull 1 0 1Bright 1 0 1Thick 1 0 1Fruit squash 1 0 1Strong 1 0 1
Odor
Strong 2 1 1Fruity 4 0 4Sweet 2 0 2Passion-fruit 2 0 2
Flavor
Sweet 7 7 0Sour/acid/sharp/bitter/citric 12 12 0Fruty/passion-fruit/strong 14 6 8Watery 2 1 1Bland 1 1 0
Mouthfeel
Smooth 4 3 1Cold feeling 1 1 0Thick 1 1 0Fresh 1 1 0Strong 1 1 0Salty 1 1 0Refreshing 2 1 1Thin/watery 2 0 2Fruity 2 1 1Bit 1 0 1Sickly 1 0 1
PASSION-FRUIT JUICE AND FREE-CHOICE PROFILE 23
FIG. 1. THE FOUR PASSION-FRUIT JUICES POSITIONS, WITH REPLICATES, IN THE PLANE DEFINED BY THE FIRST TWO DIMENSIONS OF THE CONSENSUS CONFIGURATION
–0.4
–0.2
0
0.2
0.4
–0.4 –0.2 0 0.2 0.4
Dimension 1 (47.8%)
Dim
ensi
on 2
(30
.9%
)
4:1 (water:puree) 6.8:1 (water:puree)
9.5:1 (water:puree)
Commercial
FIG. 2. PLOT OF THE SIGNIFICANT CORRELATION BETWEEN THE FLAVOR ATTRIBUTES AND DIMENSIONS 1 AND 2
1
0.5
0
–0.5
–1
–1 –0.5 0.50 1
Dimension 1 (47.8%)
Dim
ensi
on 2
(30
.9%
)

24 R. DELIZA, H. MacFIE and D. HEDDERLEY
juice industry (Sandi
et al.
2003; Vera
et al.
2003). Despite the small fre-quency of the attribute refreshing, it is worth mentioning that it was consis-tently used by participants, who perceived this characteristic sensory attributefor passion-fruit juice. Figure 3 shows the plot of the 10 assessors in the planedefined by the first two principal components on the consensus configuration.Generalized Procrustes analysis on the FCP data suggested that a two-dimen-sional solution described most of the variation.
Table 3 shows the percentage variation accounted for in the first 10principal components for each assessor and the consensus. The first twoprincipal components explained over 50% of the total variation in the data.For three assessors the first dimension was dominant, while others requiredtwo or three dimensions to describe differences in the samples.
The FCP experiment provided the description of the passion-fruit juiceby a group of British consumers. The untrained assessors (consumers) usedelementary words to describe their perceptions of the products. It reflects theirlack of training and naiveness. The results may be more useful to relateconsumer acceptability data to other profiles and also to allow the develop-ment of a consensus vocabulary, which can be applied to a similar largeconsumer population. McEwan
et al.
(1989) presented similar results workingon chocolate and Gains and Thomson (1990) working on lagers. The latteremphasized that the training merely improves reproducibility of results andleads to the use of more specific sensory terms by assessors. Thus, if the sameexperiment had been performed by trained and experienced sensory assessors,certainly both the number and depth of terms would be greater than with the
FIG. 3. TEN ASSESSORS’ PLOT IN THE PLANE DEFINED BY THE FIRST TWO DIMENSIONS OF THE CONSENSUS CONFIGURATION
–1
–0.5
0
0.5
1
–1 –0.5 0 0.5 1
Dimension 1 (47.8%)
Dim
ensi
on 2
(30
.9%
) 7
4
10
2
8
15
9
3
6

PASSION-FRUIT JUICE AND FREE-CHOICE PROFILE 25
untrained subjects. However, the elicited terms could not be used in thisexperiment with consumers, because the sensory attributes they would elicitwould be less likely to be consumer-relevant than those which emerged froman untrained panel. Besides, there is no need to develop precisely definedvocabularies for describing products in order to reveal relationships and dif-ferences between samples.
The behavior of the assessors apparently was not the same in evaluatingthe samples. However, the axes reflected differences between individual sub-jects’ evaluation in the first two dimensions, and the separation betweensubjects was not necessarily related to the main dimension principal compo-nents from the GPA. Theoretically, the greater the distance between any twosubjects, the greater the difference between their product configurations(McEwan
et al.
1989). As the first two dimensions of the juice consensusconfiguration were similar (Fig. 2), the difference may have been due to thesmall number of assessors, compared to the number normally used in theliterature. If the number had been greater, probably they would have beenspread around Figure 3, filling the spaces in and yielding a better plot. Pig-gott and Watson (1992), McEwan
et al.
(1989) and González
et al.
(2001)reported similar outcomes, working with 26, 20 and 14 subjects,respectively.
Different words were used by consumers to describe passion-fruit juicesourness (e.g., acid, acidic, citric, sour, sharp). It is interesting to note thatsome consumers used the term bitter. The rotation/reflection of each assessor’sperceptual space allowed the investigator to examine whether or not attributes
TABLE 3.PERCENTAGE VARIATION EXPLAINED BY THE FIRST 10 DIMENSIONS FOR
EACH ASSESSOR AND THE CONSENSUS AFTER GENERALIZED PROCRUSTES ANALYSIS ON DATA
Dimension Assessor
1 2 3 4 5 6 7 8 9 10
1 33.2 63.1 63.7 33.8 40.1 46.3 26.9 14.4 47.8 58.22 26.6 16.0 13.5 47.9 35.9 34.0 35.9 44.2 25.0 37.03 10.0 6.8 10.4 3.9 7.9 6.5 6.8 6.5 8.3 4.04 8.7 3.6 3.1 4.5 5.1 3.2 5.8 8.3 7.1 2.25 6.1 2.3 4.5 5.2 2.2 3.3 6.0 14.1 1.7 1.56 5.0 1.4 1.9 1.1 2.0 1.9 3.7 2.3 2.4 2.97 4.6 2.9 0.9 2.2 1.4 1.7 4.2 3.8 3.4 0.68 3.1 2.4 0.3 0.7 1.0 1.5 4.0 2.0 1.5 1.59 0.9 0.5 0.9 0.3 2.8 0.9 3.0 1.9 1.0 1.0
10 0.4 0.5 0.5 0.1 0.8 0.2 1.8 0.5 0.9 0.7Consensus 47.8 30.9 5.6 4.4 3.5 2.1 1.9 1.4 1.0 0.5

26 R. DELIZA, H. MacFIE and D. HEDDERLEY
used by different subjects provided similar information about the product. Byanalyzing Figure 2 it is possible to infer that acid/acidic/citric/sour/sharp andbitter had similar meaning, and according to Amerine
et al.
(1965), sournessis often confounded with bitterness. Examination of other flavor descriptorsindicated that consumers used the words fruity, strong and passion-fruit todescribe the same attribute perception. It could be explained by the fact thatthe product was unusual for the participants, making it difficult for them tocome up with the exact description of the product, i.e., passion-fruit. Thecommercial juice had flavoring in it, which may have enhanced the flavor andodor, explaining why it was perceived as having a more strong/fruity/passion-fruit perception.
The present study indicated the usefulness of the FCP for describingpassion-fruit juice, considering the target consumers’ perceptions, revealingthe terms that might be used by British consumers to describe the passion-fruit juice, an unusual product in the UK.
REFERENCES
AMERINE, M.A., PANGBORN, R.M. and ROESSLER, E.B. 1965.
Princi-ples of Sensory Evaluation of Food
. Academic Press, New York.AOAC (Association of Official Analytical Chemists). 1984.
Official Methodsof Analysis
, 14th Ed. Sidney Williams, Arlington, VA.ARNOLD, G.M. and WILLIAMS, A.A. 1986. The use of generalized Pro-
crustes techniques in sensory analysis. In
Statistical Procedures in FoodResearch
(J.R. Piggott, ed.) pp. 233–253. Elsevier, London.British Standard Institution. 1985. BS 5586: Part 1: 1978 (1985) Specification
for wine-tasting glass (ISSO 3591).DELIZA, R. 2001. The use of «ideal point» scale to determine the best sugar
and dilution levels of passion fruit juice by consumers. Alimentaria
38
(324), 109–113.DELLA MODESTA, R.C., GONÇALVES, E.B., ROSENTHAL, A., SILVA,
A.L.S. and FERREIRA, J.C.S. 2004. Sensory profile development andinstrumental evaluation of passion fruit juice. Braz. Soc. Food Sci. Tech-nol. Bull. submitted.
ELMORE, J.R. and HEYMANN, H. 1999. Perceptual maps of photographsof carbonated beverages created by traditional and free-choice profiling.Food Qual. Prefer.
10
, 219–227.GAINS, N. and THOMSON, D.M.H. 1990. Contextual evaluation of canned
lagers using repertory grid method. Int. J. Food Sci. Technol.
25
, 699–705.
GONZÁLEZ VIÑAS, M.A., GARRIDO, N., WITTING DE PENNA, E. 2001.Free choice profiling of Chilean goat cheese. J. Sens. Stud.
16
, 239–248.

PASSION-FRUIT JUICE AND FREE-CHOICE PROFILE 27
GOWER, J.C. 1975. Generalised Procrustes analysis. Psychometrika
40
, 33–51.
ITDG. 2004. Intermediate Technology Development Group. Available onhttp://www.itdg.org (Searched on August 2004).
LANGRON, S.P., WILLIAMS, A.A. and COLLINS, A.K. 1984. A compar-ison of the consensus configuration from a generalised Procrustes anal-ysis with the untransformed panel mean in sensory profile analysis.Lebensm.-Wiss. Technol.
17
, 296–298.MACFIE, H.J.H., BRATCHEL, N., GREENHOFF, K. and VALLIS, L.V.
1989. Designs to balance the effect of order of presentation and first-order carry-over effects in hall tests. J. Sens. Stud.
4
, 129–148.McEWAN, J.A., COLWILL, J.S. and THOMSON, D.M.H. 1989. The appli-
cation of two free-choice profile methods to investigate the sensorycharacteristics of chocolate. J. Sens. Stud.
3
, 271–286.MURRAY, J.M., DELAHUNTY, C.M. and BAXTER, I.A. 2001. Descriptive
sensory analysis: Past, present and future. Food Res. Int.
34
, 461–471.ORESKOVICH, D.C., KLEIN, B.P. and SUTHERLAND, J.W. 1991. Pro-
crustes analysis and its application to free choice and other sensoryprofiling. In
Sensory Science Theory and Application in Foods
(H.T.Lawless and B.P. Klein, eds.) pp. 353–394. Marcel Dekker, New York.
PIGGOTT, J.R. and WATSON, M.P. 1992. A comparison of free-choiceprofiling and the repertory grid method in the flavour profiling of cider.J. Sens. Stud.
7
, 133–145.SAENZ, C., SEPULVEDA, E., NAVARRETE, A. and RUSTOM, A. 1998.
Influence of harvest season on the characteristics of purple passion fruit(
Passiflora edulis Sims
) and its juice. Food Sci. Technol. Int.
4
(1), 45–51.SANDI, D., CHAVES, J.B.P., SOUZA, A.C.G., SILVA, M.T.C. and PARREI-
RAS, J.F.M. 2003. Sensory quality of yellow passion fruit juice (
Passi-flora edulis
var.
flavicarpa
) under pasteurization and storage. Food Res.Proc. Centre Bull.
21
(1), 141–158.VAILLANT, F., JEANTON, E., DORNIER, M., O’BRIEN, G.M., REYNES,
M. and DECLOUX, M. 2001. Concentration of passion fruit juice on anindustrial pilot scale using osmotic evaporation. J. Food Eng.
47
, 195–202.VERA, E., RUALES, J., DORNIER, M., SANDEAUX, J., PERSIN, F.,
POURCELLY, G., VAILLANT, F. and REYNES, M. 2003. Comparisonof different methods for deacidification of clarified passion fruit juice. J.Food Eng.
59
, 361–367.