Characteristics and dynamics of surfzone transverse finger bars
Upload
khangminh22Category
view
0download
0
7 | P a g e
2ndInternational Workshop on GFRP bars for Concrete Structures
Project Case Studies on GFRP Reinforcing Bars
1. Application of GFRP Bars to Ultra-High Performance Concrete (Jun Wang and Yail J. Kim)
2. Quality Control of continuous processes (Xavier Seynave)
3. Application of GFRP rods in bridge railway masonry arches (Gabriele Balconi)
4. FDOT GFRP-RC Market Size Estimate for Cast-In-Place Concrete by 2020 (Steven Nolan)
5. The Correlation between Moisture Absorption and Mechanical Strength Properties of GFRP Rebars (Raphael Kampmann and Jan Suhrheinrich)
6. GFRP Mesh Used for Column Repairs (Borna Miragha)
7. Skyway South Rest Area Seawall Rehabilitation (Lowry Denty, Steven Nolan, and Lisa Propps)
___________________________________________________________________________________________________
Page 1 of 5
2ndInternational Workshop on GFRP bars for Concrete Structures
Application of GFRP Bars to Ultra‐High Performance Concrete
By: Jun Wang and Yail J. Kim (University of Colorado Denver)
1. Introduction The durability of existing concrete structures is a salient requirement. Almost 3% of the nation’s gross domestic product is spent due to corrosion [1]. Although transportation agencies employ epoxy‐coated reinforcing steel to extend the serviceable life of concrete members, corrosion problems are not fully addressed in bridge decks [2]. Glass fiber reinforced polymer (GFRP) bars are an alternative material with a number of advantages (e.g., corrosion‐free service, light weight, and reduced maintenance costs [3]). Accordingly, GFRP‐reinforced concrete has been used in practice around the world [4]. Another non‐conventional construction material is ultra‐high performance concrete (UHPC). Unlike ordinary concrete, UHPC does not include coarse aggregate to improve compressive strength and density. Several field demonstration projects have been reported previously [5]. Synergies may be found in GFRP and UHPC to address the performance durability of concrete members subjected to aggressive environments. Previous research examined the behavior of GFRP‐reinforced UHPC with an emphasis on flexural and shear responses [6,7]; however, there still is a lack of knowledge on bond that controls the load‐carrying mechanism of concrete members. This paper presents a preliminary investigation into the interface between GFRP bars and UHPC with an emphasis on bond capacity and failure characteristics.
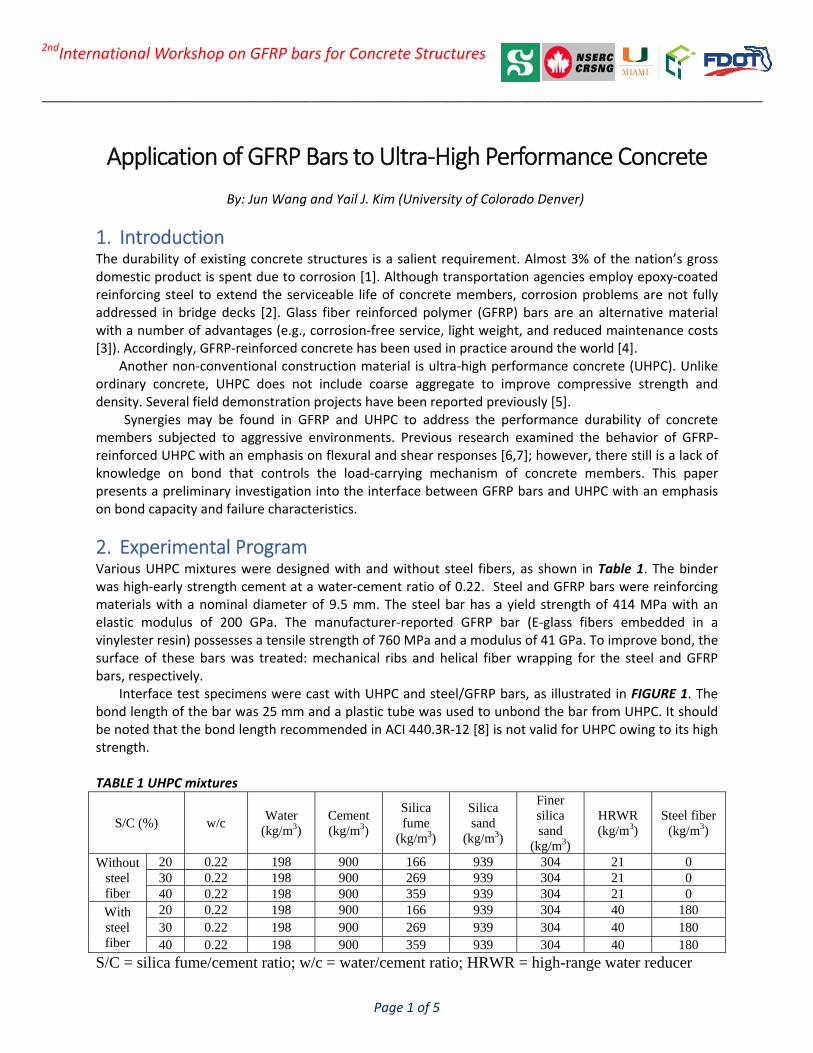
2. Experimental Program Various UHPC mixtures were designed with and without steel fibers, as shown in Table 1. The binder was high‐early strength cement at a water‐cement ratio of 0.22. Steel and GFRP bars were reinforcing materials with a nominal diameter of 9.5 mm. The steel bar has a yield strength of 414 MPa with an elastic modulus of 200 GPa. The manufacturer‐reported GFRP bar (E‐glass fibers embedded in a vinylester resin) possesses a tensile strength of 760 MPa and a modulus of 41 GPa. To improve bond, the surface of these bars was treated: mechanical ribs and helical fiber wrapping for the steel and GFRP bars, respectively. Interface test specimens were cast with UHPC and steel/GFRP bars, as illustrated in FIGURE 1. The bond length of the bar was 25 mm and a plastic tube was used to unbond the bar from UHPC. It should be noted that the bond length recommended in ACI 440.3R‐12 [8] is not valid for UHPC owing to its high strength. TABLE 1 UHPC mixtures
S/C (%) w/c Water
(kg/m3) Cement (kg/m3)
Silica fume
(kg/m3)
Silica sand
(kg/m3)
Finer silica sand
(kg/m3)
HRWR (kg/m3)
Steel fiber (kg/m3)
Without steel fiber
20 0.22 198 900 166 939 304 21 0 30 0.22 198 900 269 939 304 21 0 40 0.22 198 900 359 939 304 21 0
With steel fiber
20 0.22 198 900 166 939 304 40 180 30 0.22 198 900 269 939 304 40 180 40 0.22 198 900 359 939 304 40 180
S/C = silica fume/cement ratio; w/c = water/cement ratio; HRWR = high-range water reducer
___________________________________________________________________________________________________
Page 2 of 5
2ndInternational Workshop on GFRP bars for Concrete Structures
No. 3 bar
200
200
200
150
25
Pla
stic
tube
(unb
o nde
d zo
ne)
No.
3 b
ar
Reaction
Moveup loading
UHPCUHPC
(a) (b)
FIGURE 1. Interface specimen: (a) schematic; (b) test The interface test was conducted at a loading rate of 1 mm/min. Instrumentation included a load cell and a linear potentiometer to monitor the applied load and the interfacial displacement, respectively.
3. Experimental Results a. Compressive strength of UHPC
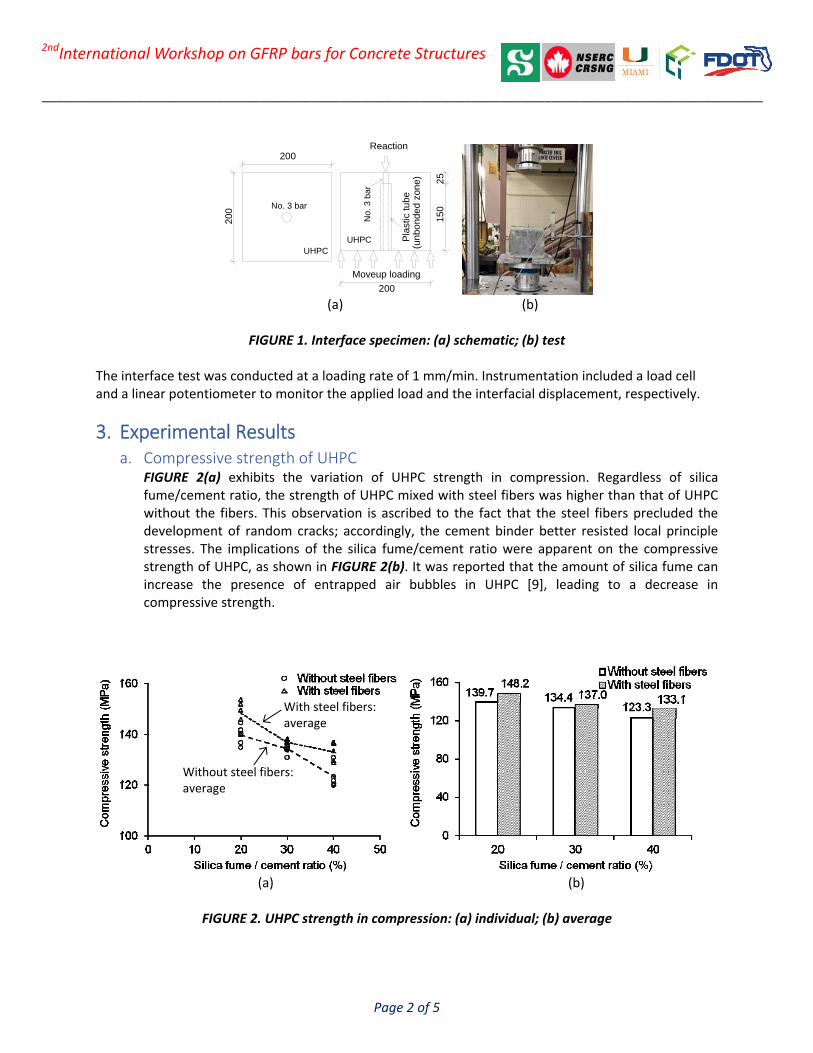
FIGURE 2(a) exhibits the variation of UHPC strength in compression. Regardless of silica fume/cement ratio, the strength of UHPC mixed with steel fibers was higher than that of UHPC without the fibers. This observation is ascribed to the fact that the steel fibers precluded the development of random cracks; accordingly, the cement binder better resisted local principle stresses. The implications of the silica fume/cement ratio were apparent on the compressive strength of UHPC, as shown in FIGURE 2(b). It was reported that the amount of silica fume can increase the presence of entrapped air bubbles in UHPC [9], leading to a decrease in compressive strength.
(a) (b)
FIGURE 2. UHPC strength in compression: (a) individual; (b) average
Without steel fibers: average
With steel fibers: average
___________________________________________________________________________________________________
Page 3 of 5
2ndInternational Workshop on GFRP bars for Concrete Structures
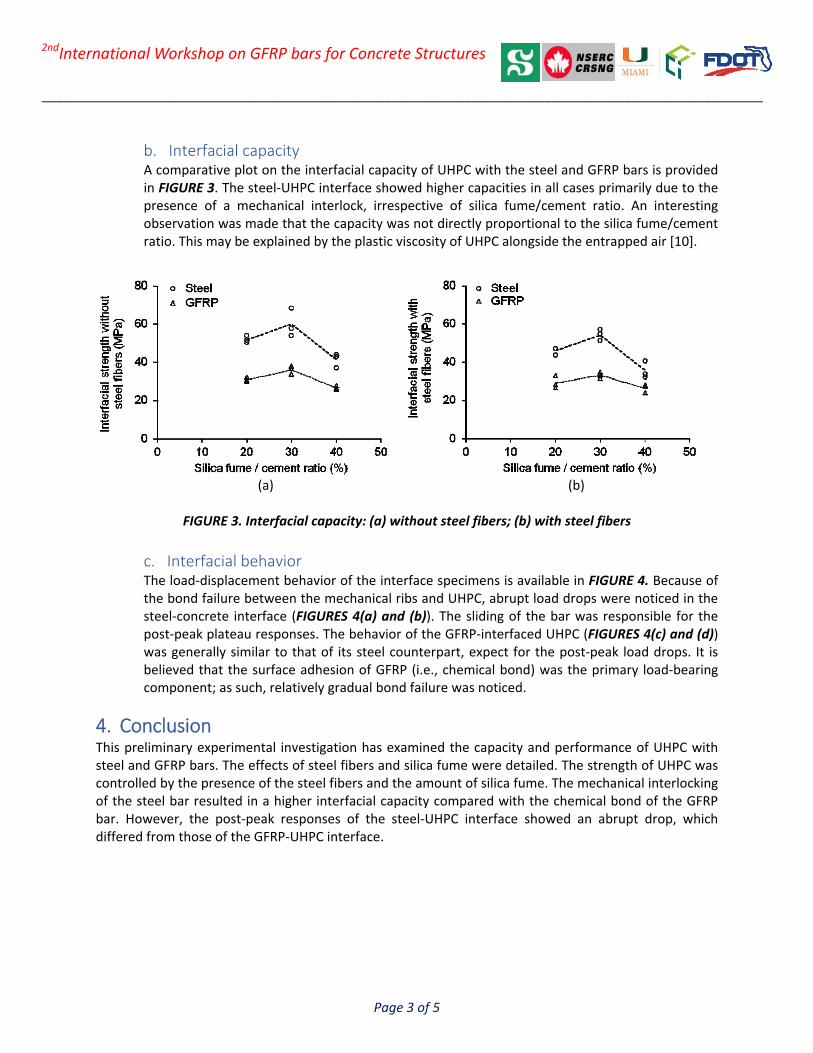
b. Interfacial capacity A comparative plot on the interfacial capacity of UHPC with the steel and GFRP bars is provided in FIGURE 3. The steel‐UHPC interface showed higher capacities in all cases primarily due to the presence of a mechanical interlock, irrespective of silica fume/cement ratio. An interesting observation was made that the capacity was not directly proportional to the silica fume/cement ratio. This may be explained by the plastic viscosity of UHPC alongside the entrapped air [10].
(a) (b)
FIGURE 3. Interfacial capacity: (a) without steel fibers; (b) with steel fibers
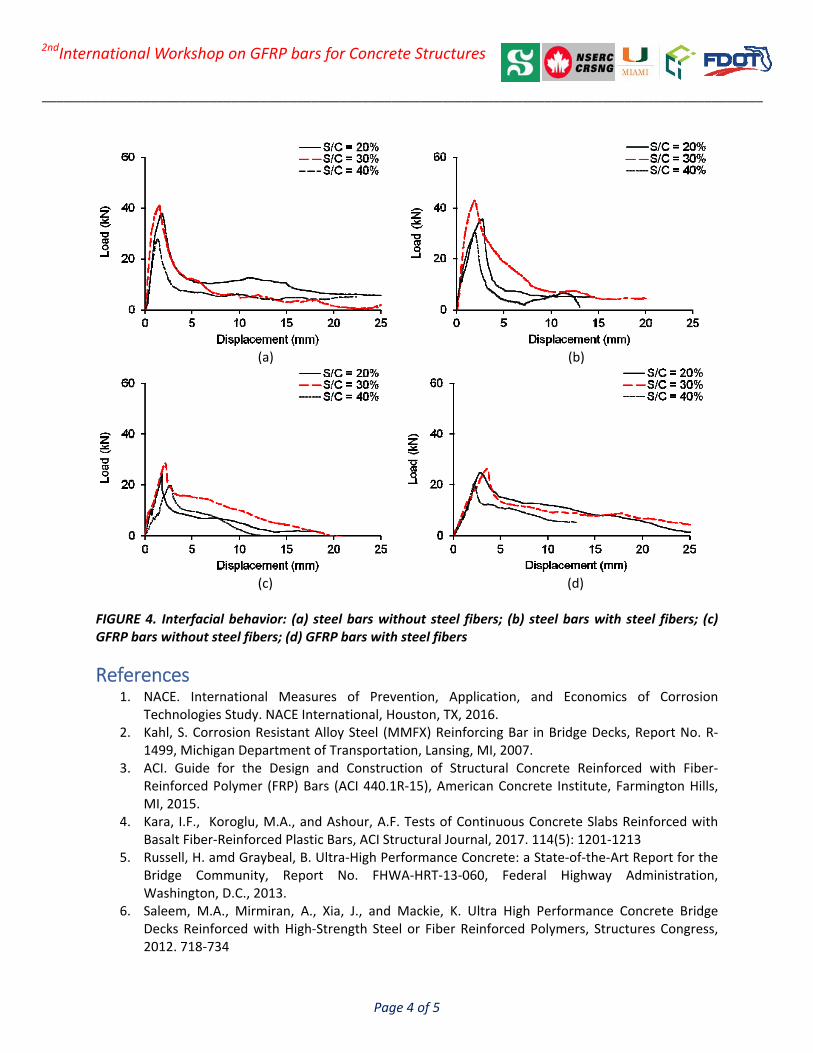
c. Interfacial behavior The load‐displacement behavior of the interface specimens is available in FIGURE 4. Because of the bond failure between the mechanical ribs and UHPC, abrupt load drops were noticed in the steel‐concrete interface (FIGURES 4(a) and (b)). The sliding of the bar was responsible for the post‐peak plateau responses. The behavior of the GFRP‐interfaced UHPC (FIGURES 4(c) and (d)) was generally similar to that of its steel counterpart, expect for the post‐peak load drops. It is believed that the surface adhesion of GFRP (i.e., chemical bond) was the primary load‐bearing component; as such, relatively gradual bond failure was noticed.
4. Conclusion This preliminary experimental investigation has examined the capacity and performance of UHPC with steel and GFRP bars. The effects of steel fibers and silica fume were detailed. The strength of UHPC was controlled by the presence of the steel fibers and the amount of silica fume. The mechanical interlocking of the steel bar resulted in a higher interfacial capacity compared with the chemical bond of the GFRP bar. However, the post‐peak responses of the steel‐UHPC interface showed an abrupt drop, which differed from those of the GFRP‐UHPC interface.
___________________________________________________________________________________________________
Page 4 of 5
2ndInternational Workshop on GFRP bars for Concrete Structures
(a) (b)
(c) (d) FIGURE 4. Interfacial behavior: (a) steel bars without steel fibers; (b) steel bars with steel fibers; (c) GFRP bars without steel fibers; (d) GFRP bars with steel fibers
References 1. NACE. International Measures of Prevention, Application, and Economics of Corrosion
Technologies Study. NACE International, Houston, TX, 2016. 2. Kahl, S. Corrosion Resistant Alloy Steel (MMFX) Reinforcing Bar in Bridge Decks, Report No. R‐
1499, Michigan Department of Transportation, Lansing, MI, 2007. 3. ACI. Guide for the Design and Construction of Structural Concrete Reinforced with Fiber‐
Reinforced Polymer (FRP) Bars (ACI 440.1R‐15), American Concrete Institute, Farmington Hills, MI, 2015.
4. Kara, I.F., Koroglu, M.A., and Ashour, A.F. Tests of Continuous Concrete Slabs Reinforced with Basalt Fiber‐Reinforced Plastic Bars, ACI Structural Journal, 2017. 114(5): 1201‐1213
5. Russell, H. amd Graybeal, B. Ultra‐High Performance Concrete: a State‐of‐the‐Art Report for the Bridge Community, Report No. FHWA‐HRT‐13‐060, Federal Highway Administration, Washington, D.C., 2013.
6. Saleem, M.A., Mirmiran, A., Xia, J., and Mackie, K. Ultra High Performance Concrete Bridge Decks Reinforced with High‐Strength Steel or Fiber Reinforced Polymers, Structures Congress, 2012. 718‐734

___________________________________________________________________________________________________
Page 5 of 5
2ndInternational Workshop on GFRP bars for Concrete Structures
7. Ferrier, E., Conferer, A., Michel, L., Chanvillard, G., and Bernardi, S. Shear Behaviour of New Beams Made of UHPC Concrete and FRP Rebar, Composites Part B, 2016. 90: 1‐13
8. ACI. Guide Test Methods for Fiber‐Reinforced Polymer (FRP) Composites for Reinforcing or Strengthening Concrete and Masonry Structures (ACI 440.3R‐12), American Concrete Institute, Farmington Hills, MI, 2012.
9. Vikam, H. and Justnes. H. Rheology of Cementitious Paste with Silica Fume of Limestone, Cement and Concrete Research, 2007. 37(11): 1512‐1517
10. Wu, Z., Shi, C., and Khayat, K.H. Influence of Silica Fume Content on Microstructure Development and Bond to Steel Fiber in Ultra‐High Strength Cement‐Based Materials, Cement and Concrete Composites, 2016. 71: 97‐109
___________________________________________________________________________________________________
Page 1 of 4
2ndInternational Workshop on GFRP bars for Concrete Structures (Case Study Papers)
Case Study Title: Quality Control of continuous processes
By: X. Seynave, Eng. (Pultrall inc.)
1. Introduction One of the main challenges of recent or growing technologies is to establish and maintain the stakeholders' confidence in them. Pilot projects and proofs of concept tend to be done under favorable conditions to optimize results but sooner or later focus is shifted towards scaling up prototypes to production standards. When production efficiency and returns on investment meet the demands of the market, the former must adapt to the latter and producers must analyze, understand and translate material specifications, customers' requirements and process constraints within the scope of their quality management system. Continuous processes are virtually never-ending. There is no notion of cycle, so they are not designed with pauses or interruptions that can be helpful when monitoring a production run. Consequently, process and product are intimately related and the failure of either one results in (or is the result of) the failure of the other. Fortunately, several tools and methods issued from the automotive industry help producers take control of their processes and guarantee the consistency of the performances of their bars.
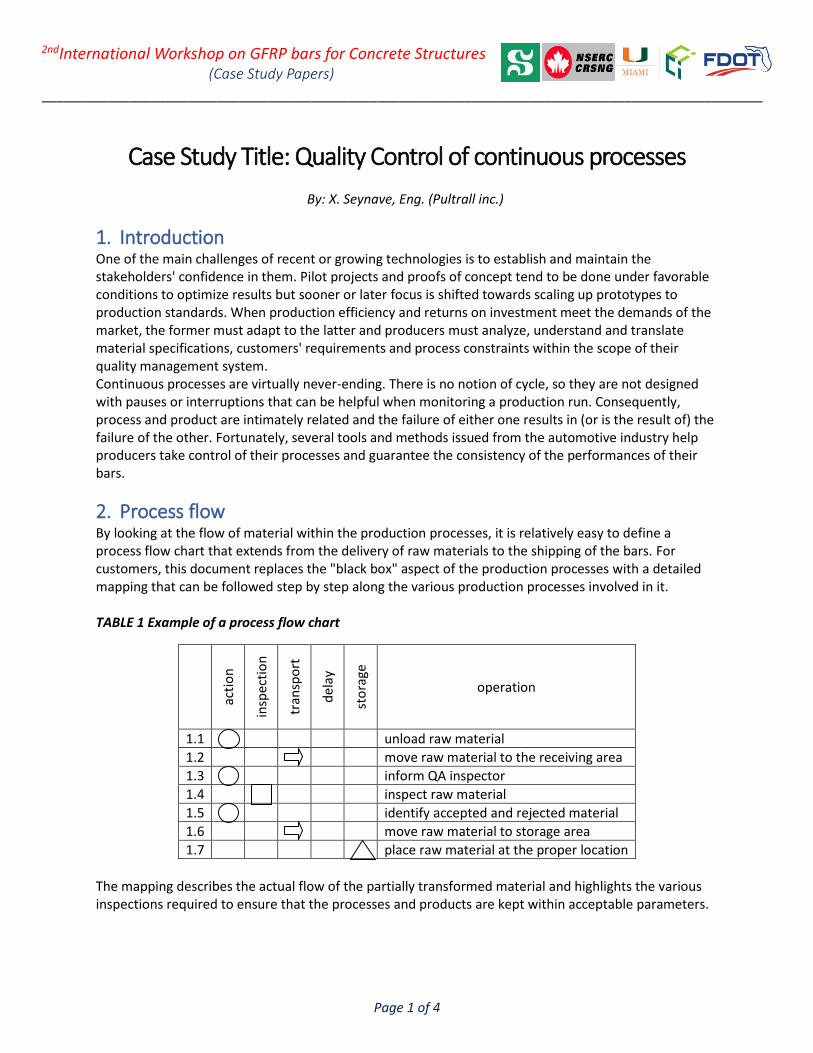
2. Process flow By looking at the flow of material within the production processes, it is relatively easy to define a process flow chart that extends from the delivery of raw materials to the shipping of the bars. For customers, this document replaces the "black box" aspect of the production processes with a detailed mapping that can be followed step by step along the various production processes involved in it. TABLE 1 Example of a process flow chart
acti
on
insp
ecti
on
tran
spo
rt
del
ay
sto
rage
operation
1.1 unload raw material
1.2 move raw material to the receiving area
1.3 inform QA inspector
1.4 inspect raw material
1.5 identify accepted and rejected material
1.6 move raw material to storage area
1.7 place raw material at the proper location
The mapping describes the actual flow of the partially transformed material and highlights the various inspections required to ensure that the processes and products are kept within acceptable parameters.
___________________________________________________________________________________________________
Page 2 of 4
2ndInternational Workshop on GFRP bars for Concrete Structures (Case Study Papers)
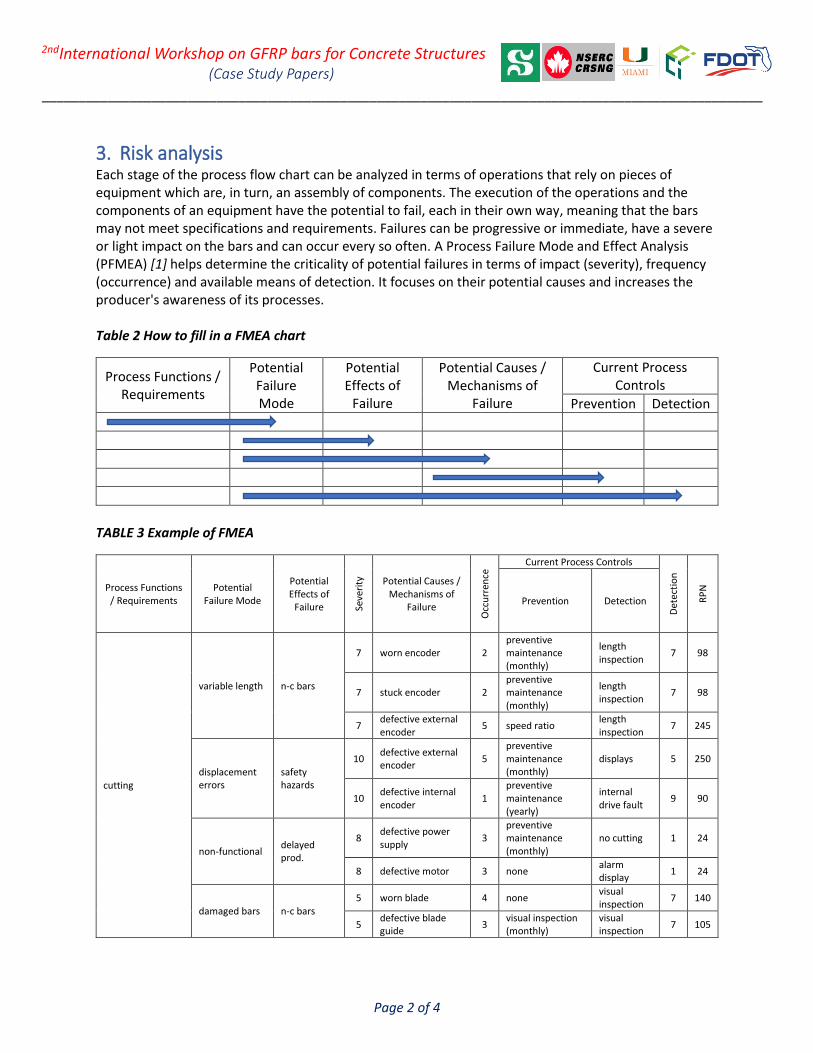
3. Risk analysis Each stage of the process flow chart can be analyzed in terms of operations that rely on pieces of equipment which are, in turn, an assembly of components. The execution of the operations and the components of an equipment have the potential to fail, each in their own way, meaning that the bars may not meet specifications and requirements. Failures can be progressive or immediate, have a severe or light impact on the bars and can occur every so often. A Process Failure Mode and Effect Analysis (PFMEA) [1] helps determine the criticality of potential failures in terms of impact (severity), frequency (occurrence) and available means of detection. It focuses on their potential causes and increases the producer's awareness of its processes. Table 2 How to fill in a FMEA chart
Process Functions / Requirements
Potential Failure Mode
Potential Effects of
Failure
Potential Causes / Mechanisms of
Failure
Current Process Controls
Prevention Detection
TABLE 3 Example of FMEA
Process Functions / Requirements
Potential Failure Mode
Potential Effects of
Failure Seve
rity
Potential Causes / Mechanisms of
Failure
Occ
urr
ence
Current Process Controls
Det
ecti
on
RP
N
Prevention Detection
cutting
variable length n-c bars
7 worn encoder 2 preventive maintenance (monthly)
length inspection
7 98
7 stuck encoder 2 preventive maintenance (monthly)
length inspection
7 98
7 defective external encoder
5 speed ratio length inspection
7 245
displacement errors
safety hazards
10 defective external encoder
5 preventive maintenance (monthly)
displays 5 250
10 defective internal encoder
1 preventive maintenance (yearly)
internal drive fault
9 90
non-functional delayed prod.
8 defective power supply
3 preventive maintenance (monthly)
no cutting 1 24
8 defective motor 3 none alarm display
1 24
damaged bars n-c bars 5 worn blade 4 none
visual inspection
7 140
5 defective blade guide
3 visual inspection (monthly)
visual inspection
7 105

___________________________________________________________________________________________________
Page 3 of 4
2ndInternational Workshop on GFRP bars for Concrete Structures (Case Study Papers)
Thanks to a FMEA, the producer should be able to plan the maintenance of the production equipment, challenge the way operations are done and implement monitoring and inspections. It is a tool geared towards the continuous improvement of the processes. It justifies why some inspections are done more often than others.
4. Control plan The degree of criticality of failures should be reflected through the process and product monitoring. For example, logic would have failures with heavy consequences or difficult to detect be checked more often or at deeper levels into the process. Inspection can take different forms: as simple as the visual reading of dials or more complex like physical tests of the bars. Some failures are detected through indirect means, some target the processes and others target the product. A control plan is the result of the FMEA. It translates the producer's risk assessment into inspections with a frequency and sampling size in accordance with the criticality of the risks. It describes how the inspection is to be done (instrument, test method, target values, authorized operators) [2]. The control plan bridges the production processes and the expectations on the bars. If an inspection shows that performances are not met, then the process failed at or before the stage where that inspection takes place. The FMEA can then be used to target the exact cause of the failure and correct it. TABLE 4 Example of control plan for one inspection
Operation
Characteristics Method
Records Corr. Action Product Process Spec./Tol. Instr.
Sample Method of Ctrl.
Size Freq.
production cure ratio (stability) ≥95% DSC 1 1/shift ASTM E2160 computer scrap bars
adjust process parameters Tg (stability) ≥100°C DSC 1 1/shift ASTM E1356 computer
Process and products are tied together but proof of the performance of the product is only found by testing the product itself. Inspection of the process alone is not enough to guarantee the performance of the bars, while inspection of the product can give valuable information about the process stability. However, with continuous processes, inspection of the process is unavoidable to validate that it is stable and gives consistent performances over time.
5. Process review The FMEA is used to anticipate failures and the control plan is used to detect them. In an ideal situation, a thorough risk analysis leads to a self-diagnosing and self-correcting production process, but technical limitations usually paint reality in a darker shade. Failures are bound to happen and the producers should use them as an opportunity for improvement. An unexpected failure means that the risk analysis was not accurate enough or deep enough, or that inspections are not frequent enough for the criticality of its effects, or both. A process failure should be the signal to review the FMEA in order to increase the reliability of the processes. Some causes of failure may be removed thanks to better technology, some may occur less often thanks to better spare parts or a better maintenance plan, or some can become easier to detect and prevent. If the process can be reliably improved and if the occurrence of failures decreases, then there is a justification to decrease the inspections for those failures. On the other hand, if the process cannot be improved or if the corrections have no impact on its reliability, then the inspections must increase to improve at least the detection of failures.
___________________________________________________________________________________________________
Page 4 of 4
2ndInternational Workshop on GFRP bars for Concrete Structures (Case Study Papers)
6. Other useful tools a. SPC
Statistical process control (SPC [3]) can be implemented at keys stages of production and can target either process outputs or product characteristics. The goal is to illustrate variations and tendencies over time, up to determining process capability of maintaining those outputs or characteristics. SPC can help trigger maintenance or external interventions to keep everything under control.
b. MSA Measurement system analysis (MSA [4]) is used to evaluate how measures can be impacted by factors such as variations of the product or of the operators. The goal of any measurement is to be repeated and reproduced at any time, on any product, with any operator. An MSA done on instruments referred to in the control plan can lead to their replacement or repair, to deeper training, can increase the reliability of measures and SPCs, and help determine if a given instrument is the right one.
7. Conclusion Continuous production processes offer a great flexibility and an interesting output potential, but they can be complex, and their consistency can be a source of concern. Quality planning tools like FMEAs and control plans decompose the processes in smaller elements easy to understand and analyze. They propose an approach to implement clever process controls in the right amount, at the right place, thus avoiding either insufficient or excessive quality control. They help describe the processes and facilitate audits. They cast light on how product properties are tied to process parameters, help enforce process stability and help maintain the level of performance expected from FRP bars. The construction and automotive industries share the care for safety, durability and repeatability. It is natural for automotive quality control tools to be easily adapted and implemented in the production of bars.
References
[1] AIAG, Potential Failure Mode and Effects Analysis, Fourth Edition, 2008.
[2] AIAG, Advanced Product Quality Planning and Control Plan, Second Edition, 2008.
[3] AIAG, Statistical Process Control, Second Edition, 2005.
[4] AIAG, Measurement System Analysis, Fourth Edition, 2010.
___________________________________________________________________________________________________
Page 1 of 7
2ndInternational Workshop on GFRP bars for Concrete Structures (Case Study Papers)
Case Study Title: Application of GFRP rods in bridge infrastructure masonry arches
By: M. Arduini (CoForce s.r.l.), A. Nicoletti ( Basf CC), G. Balconi (Sireg)
In recent years the use of glass fiber-reinforced polymer bars has allowed to increase corrosion resistance of structures by increasing their durability, thereby ensuring greater life of service. In this paper the application of GFRP rods and CFRP chords is performed on 5 arches of an historical infrastructure arch bridge done recently in Italy. Reinforcement has provided for the application of diameter 12.5 mm GFRP rods in the tensile zone of 5 masonry arches in both directions together with CFRP chords for transversal tensile forces and shear action. Masonry piers were also reinforced with the same technique against horizontal action that produces tensile forces in the external piers surface.
1. Introduction In the construction field it is well know that masonry has a very low tensile strength. In order to avoid this weakness, in the XIX century masonry was used in arch geometry to build numerous bridges for the Italian infrastructure system. This configuration, if it is loaded uniformly, is subjected essentially to compression stress. However, tensile stress can appear on the arch: differential movements in the foundation, concentrated loads travelling along the line or seismic actions may give rise of this stress (that masonry cannot support) and induce the collapse of masonry bridges. This type of construction is also severely exposed to corrosion from the water penetrating through the gaps between the bricks. In recent years the use of glass fiber-reinforced polymer bars and CFRP rods has allowed to increase strength and corrosion resistance of structures by increasing their durability, thereby ensuring greater life of service [1 ] [2]. Near Surface Mounted (NSM) technique using FRP rods is now emerging as a promising technique to increase flexural and shear strength of structural members. De Lorenzis et al. [3] carried out flexural tests where GFRP or CFRP rods were used to reinforce masonry beams. The results showed that a remarkable increase in the flexural capacity of masonry block walls can be achieved. Specimens strengthened with one and two GFRP rods failed at 7 times and 15.7 times the load of the control specimen, respectively. Moreover, Gao et al. [4] studied the efficiency of NSM for stone beams reinforced with CFRP and special steel rebars. He found out that cross section and perfect adhesion can be considered a valid approach for the simulation of the ideal behavior and a good load increment can be observed with the reinforcement. Near Surface Mounted can also represent a valid technique for restoration, due to the fact that the reinforcement can be introduced in small pockets and then can be hide with paint or partial reconstruction using the historical material. In this paper a reinforcement of 5 masonry arches of an historical infrastructure bridge carried out in Italy during the 2018 using GFRP rods for bending and CFRP chords for shear and transversal bending is presented.
___________________________________________________________________________________________________
Page 2 of 7
2ndInternational Workshop on GFRP bars for Concrete Structures (Case Study Papers)
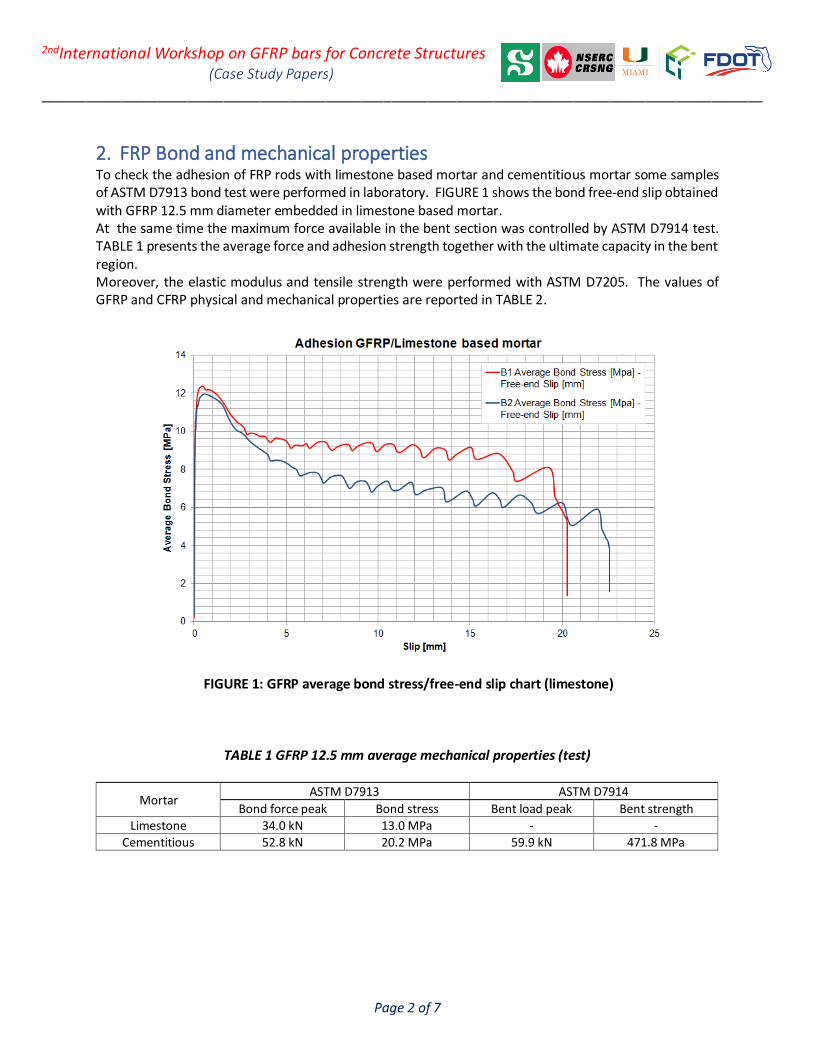
2. FRP Bond and mechanical properties To check the adhesion of FRP rods with limestone based mortar and cementitious mortar some samples of ASTM D7913 bond test were performed in laboratory. FIGURE 1 shows the bond free-end slip obtained with GFRP 12.5 mm diameter embedded in limestone based mortar. At the same time the maximum force available in the bent section was controlled by ASTM D7914 test. TABLE 1 presents the average force and adhesion strength together with the ultimate capacity in the bent region. Moreover, the elastic modulus and tensile strength were performed with ASTM D7205. The values of GFRP and CFRP physical and mechanical properties are reported in TABLE 2.
FIGURE 1: GFRP average bond stress/free-end slip chart (limestone)
TABLE 1 GFRP 12.5 mm average mechanical properties (test)
Mortar ASTM D7913 ASTM D7914
Bond force peak Bond stress Bent load peak Bent strength Limestone 34.0 kN 13.0 MPa - -
Cementitious 52.8 kN 20.2 MPa 59.9 kN 471.8 MPa

___________________________________________________________________________________________________
Page 3 of 7
2ndInternational Workshop on GFRP bars for Concrete Structures (Case Study Papers)
3. Case of application The arch bridge was built in XIX century and it includes 11 arches of 12 m spans. Each span has 12.5 m length and 4.9 m width. The external surface of the masonry was deteriorated by the penetration of water, especially in the medium strength limestone based mortar. Each arch consists of 80 cm thick of solid bricks of 6x12x25 cm installed with a limestone based mortar with a compressive strength of around 3.5 MPa. Upon the arch a mix of gravel and stone blocks is casted together with a few amount of limestone matrix. The external faces of the bridge are built with solid bricks with a thickness of 45 cm. This very heavy structure was designed to have always compression in any section of the arch for the weight of the standard ancient vehicles. Actually the increment in the axle load, in the speed of the latest vehicles and the new classification of Italian seismic zone introduce a modification in the stress configuration inside the arch and inside the piers showing now tensile forces in the bottom zone of the middle cross section for the arch and tensile zone in both faces of the piers. The reinforcement operation was carried out using NSM technique applying U-shaped GFRP rods. These rods were pre-bent in the manufactory plant and shipped to the job site.
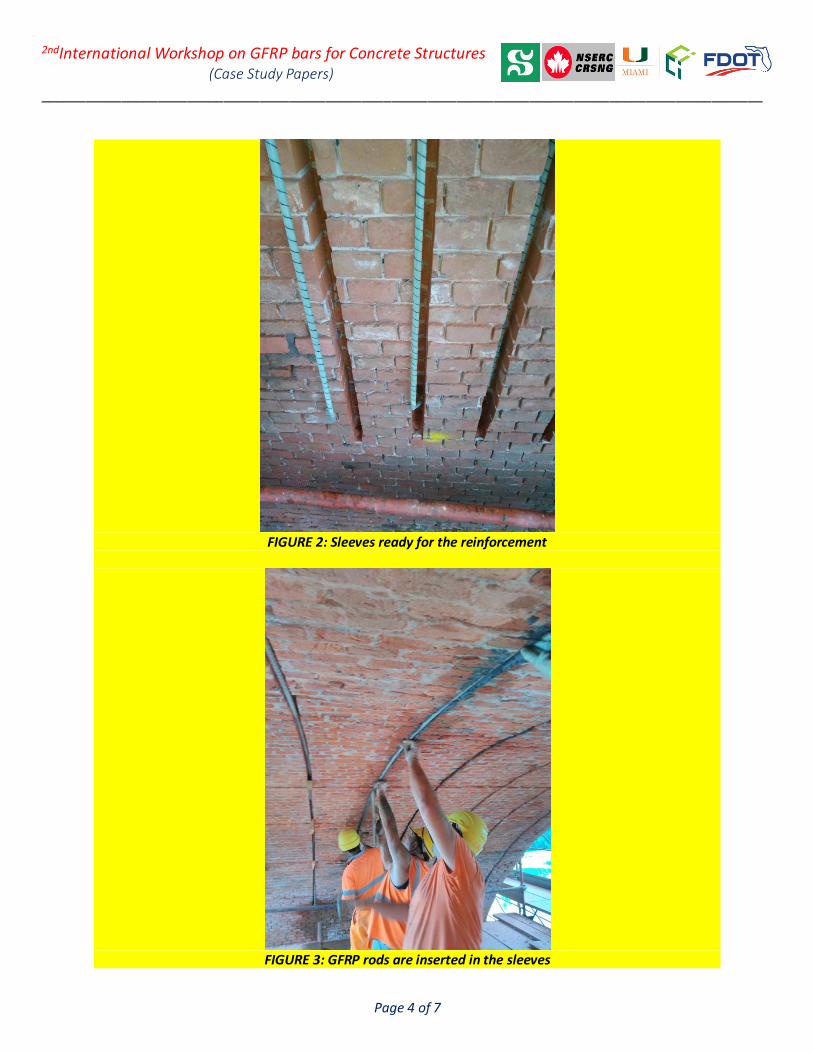
FIGURE 2, 3 and 4 present some pictures of the application phases. Initially, sleeves of 4x4 cm were realized under the central zone of the arches. In a second phase, mortar joints were sand blasted all over the entire surface of the bridge; mortar partially detached from the support was removed and all the surface was polished. In the third phase, sleeves were filled with special high strength polymer modified cementitious mortar and, immediately after this operation, one sample of GFRP rod 12 mm diameter (nominal) was inserted in each sleeve and fixed at the end with epoxy mortar.
To enhance the pier shear strength CFRP chords were wrapped all around; chords were hidden inside the horizontal mortar joint.
Piers are subjected to vertical and horizontal load. Increasing the vehicles speed we have an increment on the horizontal break load, moreover with a new design Italian code the Italian country was re-classified against earthquakes with a general increment in the ground acceleration. All this situations caused the increment in the horizontal actions and bending as well. The main part of the tensile action can be balanced with self weight, but in the ultimate limit state piers can be exposed to the cross section partialization, so tensile action needs to be covered with an external reinforcement.
In this case the NSM technique has been extended to piers, see FIGURE 5, and CFRP chords were wrapped all around inside horizontal mortars joints to enhance shear performance.
___________________________________________________________________________________________________
Page 4 of 7
2ndInternational Workshop on GFRP bars for Concrete Structures (Case Study Papers)
FIGURE 2: Sleeves ready for the reinforcement
FIGURE 3: GFRP rods are inserted in the sleeves
___________________________________________________________________________________________________
Page 5 of 7
2ndInternational Workshop on GFRP bars for Concrete Structures (Case Study Papers)
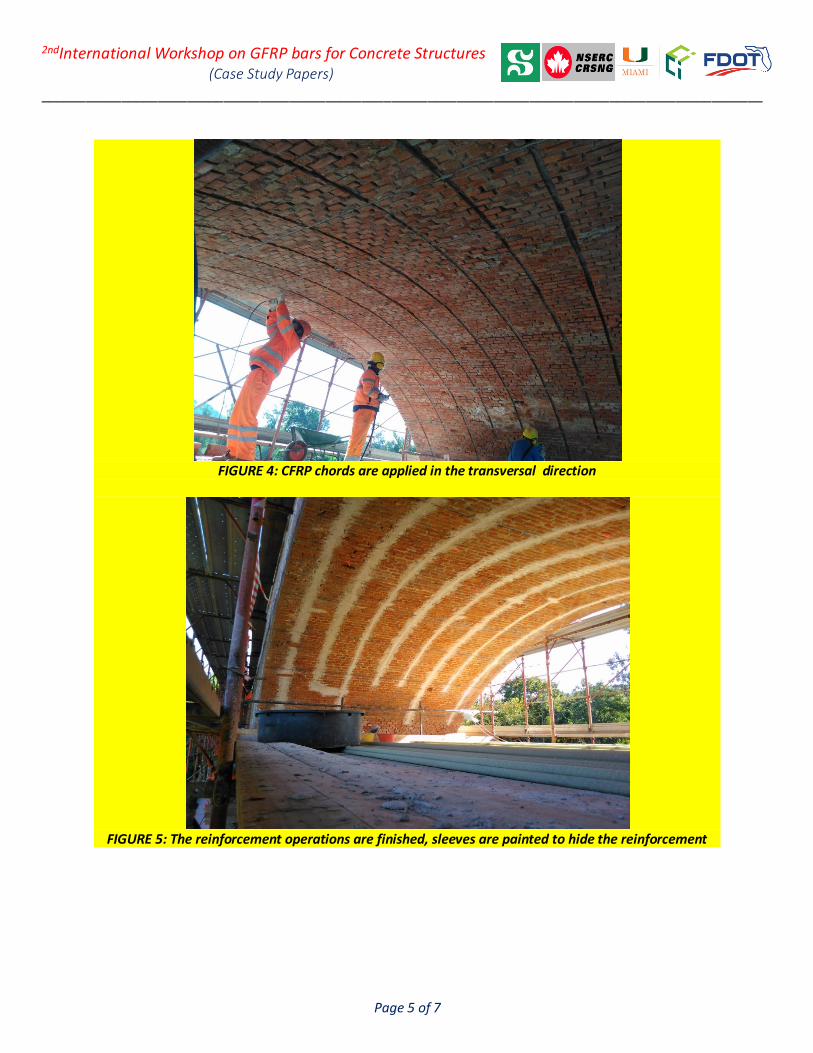
FIGURE 4: CFRP chords are applied in the transversal direction
FIGURE 5: The reinforcement operations are finished, sleeves are painted to hide the reinforcement

___________________________________________________________________________________________________
Page 6 of 7
2ndInternational Workshop on GFRP bars for Concrete Structures (Case Study Papers)
FIGURE 6: CFRP chords are travelling all around the piers
FIGURE 7: Piers were reinforced for bending using GFRP rods for out of plane and in plane bending
___________________________________________________________________________________________________
Page 7 of 7
2ndInternational Workshop on GFRP bars for Concrete Structures (Case Study Papers)
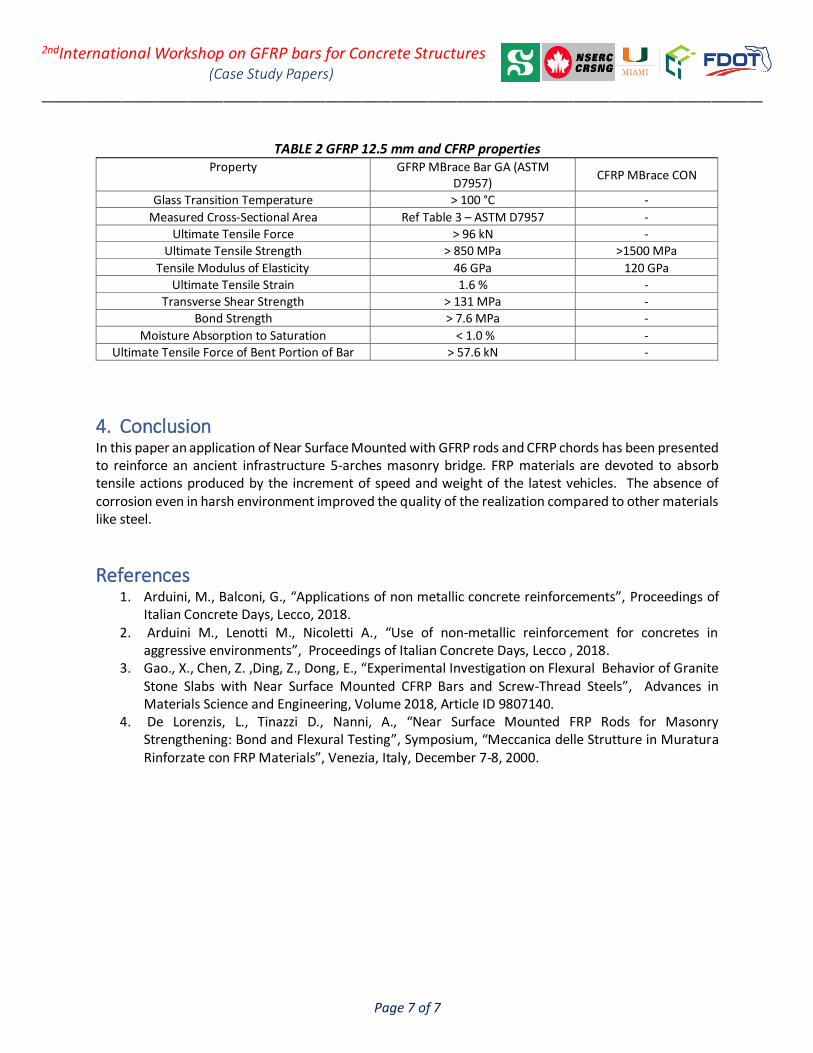
TABLE 2 GFRP 12.5 mm and CFRP properties
Property GFRP MBrace Bar GA (ASTM D7957)
CFRP MBrace CON
Glass Transition Temperature > 100 °C -
Measured Cross-Sectional Area Ref Table 3 – ASTM D7957 -
Ultimate Tensile Force > 96 kN - Ultimate Tensile Strength > 850 MPa >1500 MPa
Tensile Modulus of Elasticity 46 GPa 120 GPa Ultimate Tensile Strain 1.6 % -
Transverse Shear Strength > 131 MPa -
Bond Strength > 7.6 MPa -
Moisture Absorption to Saturation < 1.0 % -
Ultimate Tensile Force of Bent Portion of Bar > 57.6 kN -
4. Conclusion In this paper an application of Near Surface Mounted with GFRP rods and CFRP chords has been presented to reinforce an ancient infrastructure 5-arches masonry bridge. FRP materials are devoted to absorb tensile actions produced by the increment of speed and weight of the latest vehicles. The absence of corrosion even in harsh environment improved the quality of the realization compared to other materials like steel.
References 1. Arduini, M., Balconi, G., “Applications of non metallic concrete reinforcements”, Proceedings of
Italian Concrete Days, Lecco, 2018. 2. Arduini M., Lenotti M., Nicoletti A., “Use of non-metallic reinforcement for concretes in
aggressive environments”, Proceedings of Italian Concrete Days, Lecco , 2018. 3. Gao., X., Chen, Z. ,Ding, Z., Dong, E., “Experimental Investigation on Flexural Behavior of Granite
Stone Slabs with Near Surface Mounted CFRP Bars and Screw-Thread Steels”, Advances in Materials Science and Engineering, Volume 2018, Article ID 9807140.
4. De Lorenzis, L., Tinazzi D., Nanni, A., “Near Surface Mounted FRP Rods for Masonry Strengthening: Bond and Flexural Testing”, Symposium, “Meccanica delle Strutture in Muratura Rinforzate con FRP Materials”, Venezia, Italy, December 7-8, 2000.
___________________________________________________________________________________________________
Page 1 of 6
2ndInternational Workshop on GFRP bars for Concrete Structures (Case Study Papers)
FDOT GFRP-RC Market Size Estimate for Cast-In-Place Concrete by 2020
By: Steven Nolan, P.E. (FDOT State Structures Design Office)
1. Introduction Using the published Florida Department of Transportation (FDOT) standard pay items cost history [1] and other relevant design criteria, a reasonable estimate of the potential quantity of Fiber-Reinforced Polymer (FRP) reinforcing bar (rebar) can be made using some broad assumptions. These assumptions will be refined over the next few years as the deployment of GFRP-RC designs broadens within the FDOT Work Program. One limitation on this strategy, is that Design-Build and Public-Private-Partnership (P3) project quantities are not represented in the Historical Cost Information published reports. Special cost history reports can be requested from the FDOT Estimates Office for Design-Build, Lump Sum, and P3 projects, but the data has much less fidelity and reliability. Some general assumptions could be made base on the proportion of the new construction work program for both conventional Design-Bid-Build (BB) projects, compared to Design-Build (DB) contract values. For this study, a 25% increase is applied to the final FRP rebar estimates to account for the DB contact component. Currently in aggressive environments (chloride, sulfate, or acidic), Class IV concrete is required as a durability enhancement in lieu of the typical Class II concrete. This can be used as a surrogate measure for estimating the potential FRP rebar market at FDOT which is primarily focused on high corrosion durability applications. Assuming that most RC elements in aggressive environments will substantially benefit from substitution of carbon-steel for FRP rebar, estimates of the potential market size can be calculated. An added complication for bridge substructures, which are potentially the largest FRP rebar market sector for FDOT RC elements, is that Class IV concrete could be specified for other structural (mechanical demand) reasons, regardless of the environment. Therefore, for this paper a conservatively estimate using 50% of the Class IV quantity is assumed as potential candidates for durability enhancement by FRP rebar substitution. Since FDOT does not separate rebar quantities based on the Class of concrete, further assumptions need to be made to establish the distribution between RC elements containing Class IV concrete (a significant proportion of which will be in chloride affected environments) and Class II or III concrete. A simple proportional ratio is used in this analysis. Box culverts present another challenge, since the reinforcing is aggregated under the "Roadway" reinforcing steel quantities. For this estimate, an assumption of 1.5% steel rebar weight/concrete volume ratio can be used to provide a preliminary estimated quantity. Finally, there are many RC elements that are not paid for on a volumetric (CY) or weight basis (LB), but rather linear foot (LF) or area of product (SY). For these elements, there is no direct breakdown of reinforcing or distinguishable data tags to determine for which environment they were used. These elements include traffic railings, pedestrian parapets, noise walls, MSE wall panels and copings, piles, drilled shafts and sheet piles. The most relevant of and pressing need of these element for potential FRP rebar applications, are the concrete sheet piles used in seawall-bulkheads. A separate analysis on seawall-bulkheads was undertaken by Rossini et al. 2018 [2], which may be used to estimate the additional quantity of FRP rebar for those precast components.
___________________________________________________________________________________________________
Page 2 of 6
2ndInternational Workshop on GFRP bars for Concrete Structures (Case Study Papers)
It was assumed by the author that approach slabs, bridge decks, traffic railings, or noise walls will not benefit significantly from FRP rebar use, since these elements are typically more remote from chloride attack in Florida and therefore are not included in the current estimates. Pile and prestressed beam confinement spirals or stirrups are another potential future application for FRP rebar which is still being investigated by FDOT [4], as such these applications are also not included in the current estimate either.
2. Historical Cost Estimate Quantities Sources from 2015 to May 2018 sources
2013:
http://www.fdot.gov/programmanagement/estimates/historicalcostinformation/AnnualSWAve/AnnualStatewideAverage13.pdf
2014: http://www.fdot.gov/programmanagement/estimates/historicalcostinformation/AnnualSWAve/AnnualStatewideAverage14.pdf
2015: http://www.fdot.gov/programmanagement/estimates/historicalcostinformation/AnnualSWAve/AnnualStatewideAverage15.pdf
2016: http://www.fdot.gov/programmanagement/estimates/historicalcostinformation/AnnualSWAve/AnnualStatewideAverage16.pdf
2017/18: http://www.fdot.gov/programmanagement/estimates/historicalcostinformation/Files/12MonthMovingDec2017thruMay2018.pdf
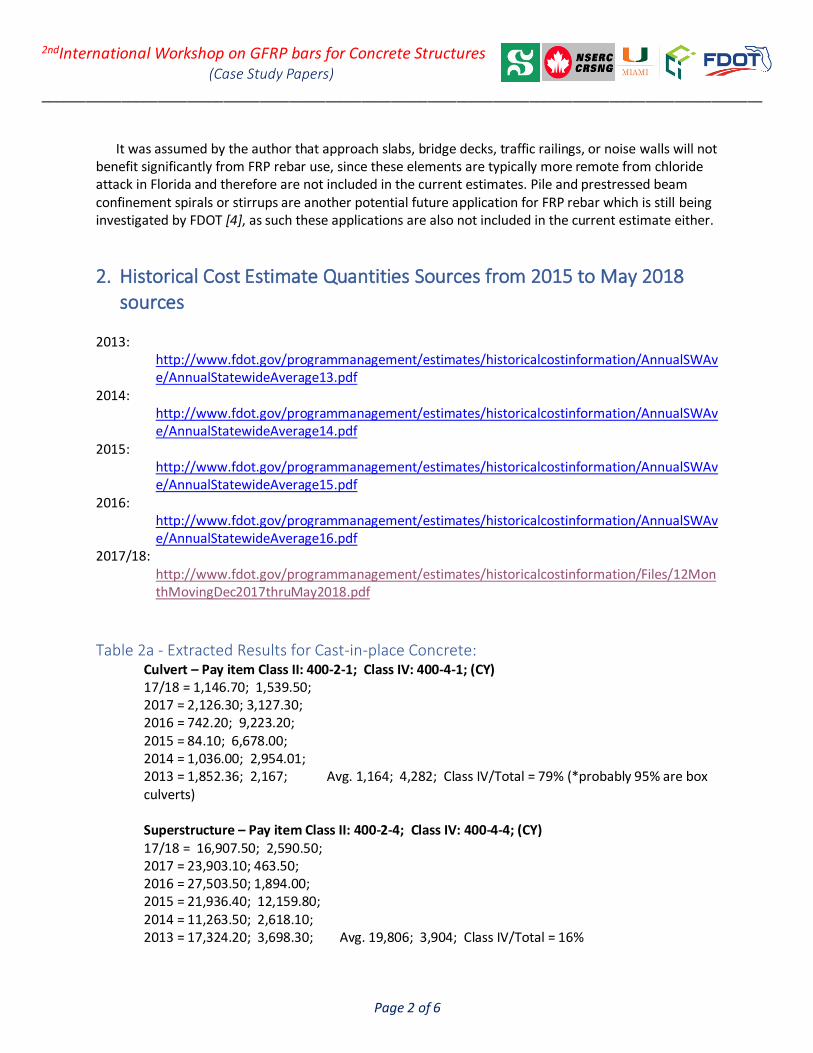
Table 2a - Extracted Results for Cast-in-place Concrete: Culvert – Pay item Class II: 400-2-1; Class IV: 400-4-1; (CY) 17/18 = 1,146.70; 1,539.50; 2017 = 2,126.30; 3,127.30; 2016 = 742.20; 9,223.20; 2015 = 84.10; 6,678.00; 2014 = 1,036.00; 2,954.01; 2013 = 1,852.36; 2,167; Avg. 1,164; 4,282; Class IV/Total = 79% (*probably 95% are box culverts) Superstructure – Pay item Class II: 400-2-4; Class IV: 400-4-4; (CY) 17/18 = 16,907.50; 2,590.50; 2017 = 23,903.10; 463.50; 2016 = 27,503.50; 1,894.00; 2015 = 21,936.40; 12,159.80; 2014 = 11,263.50; 2,618.10; 2013 = 17,324.20; 3,698.30; Avg. 19,806; 3,904; Class IV/Total = 16%
___________________________________________________________________________________________________
Page 3 of 6
2ndInternational Workshop on GFRP bars for Concrete Structures (Case Study Papers)
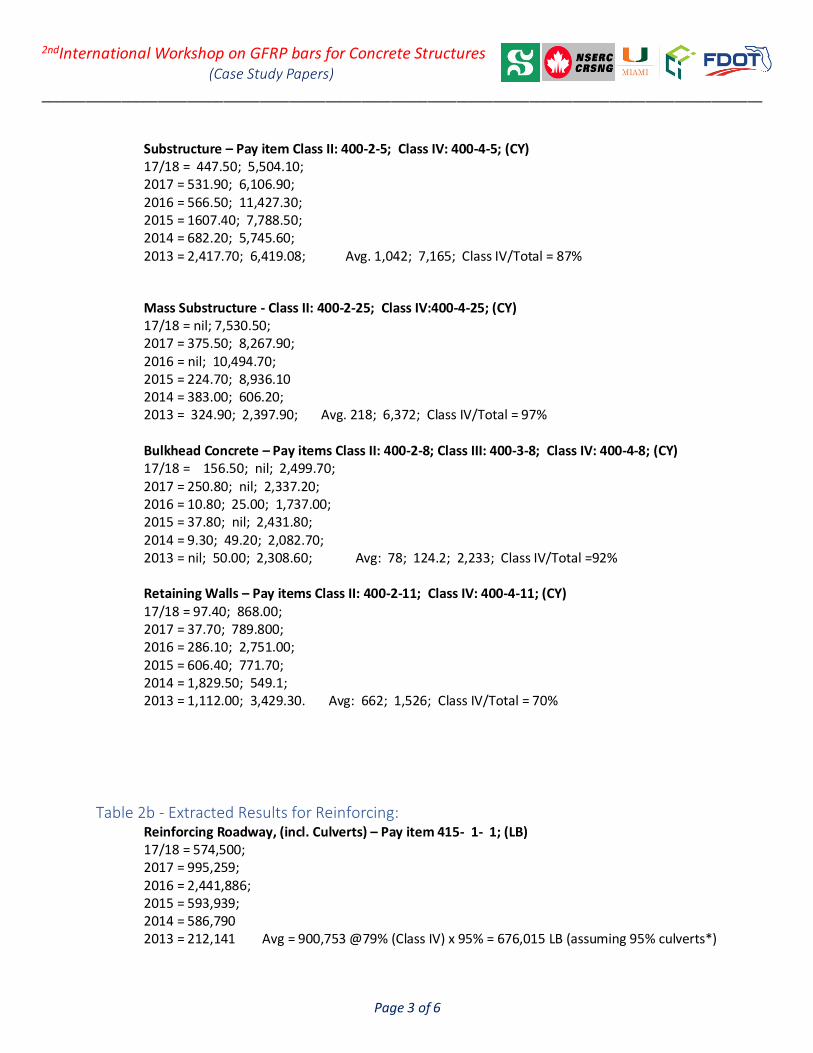
Substructure – Pay item Class II: 400-2-5; Class IV: 400-4-5; (CY) 17/18 = 447.50; 5,504.10; 2017 = 531.90; 6,106.90; 2016 = 566.50; 11,427.30; 2015 = 1607.40; 7,788.50; 2014 = 682.20; 5,745.60; 2013 = 2,417.70; 6,419.08; Avg. 1,042; 7,165; Class IV/Total = 87%
Mass Substructure - Class II: 400-2-25; Class IV:400-4-25; (CY) 17/18 = nil; 7,530.50; 2017 = 375.50; 8,267.90; 2016 = nil; 10,494.70; 2015 = 224.70; 8,936.10 2014 = 383.00; 606.20; 2013 = 324.90; 2,397.90; Avg. 218; 6,372; Class IV/Total = 97% Bulkhead Concrete – Pay items Class II: 400-2-8; Class III: 400-3-8; Class IV: 400-4-8; (CY) 17/18 = 156.50; nil; 2,499.70; 2017 = 250.80; nil; 2,337.20; 2016 = 10.80; 25.00; 1,737.00; 2015 = 37.80; nil; 2,431.80; 2014 = 9.30; 49.20; 2,082.70; 2013 = nil; 50.00; 2,308.60; Avg: 78; 124.2; 2,233; Class IV/Total =92% Retaining Walls – Pay items Class II: 400-2-11; Class IV: 400-4-11; (CY) 17/18 = 97.40; 868.00; 2017 = 37.70; 789.800; 2016 = 286.10; 2,751.00; 2015 = 606.40; 771.70; 2014 = 1,829.50; 549.1; 2013 = 1,112.00; 3,429.30. Avg: 662; 1,526; Class IV/Total = 70%
Table 2b - Extracted Results for Reinforcing: Reinforcing Roadway, (incl. Culverts) – Pay item 415- 1- 1; (LB) 17/18 = 574,500; 2017 = 995,259; 2016 = 2,441,886; 2015 = 593,939; 2014 = 586,790 2013 = 212,141 Avg = 900,753 @79% (Class IV) x 95% = 676,015 LB (assuming 95% culverts*)
___________________________________________________________________________________________________
Page 4 of 6
2ndInternational Workshop on GFRP bars for Concrete Structures (Case Study Papers)
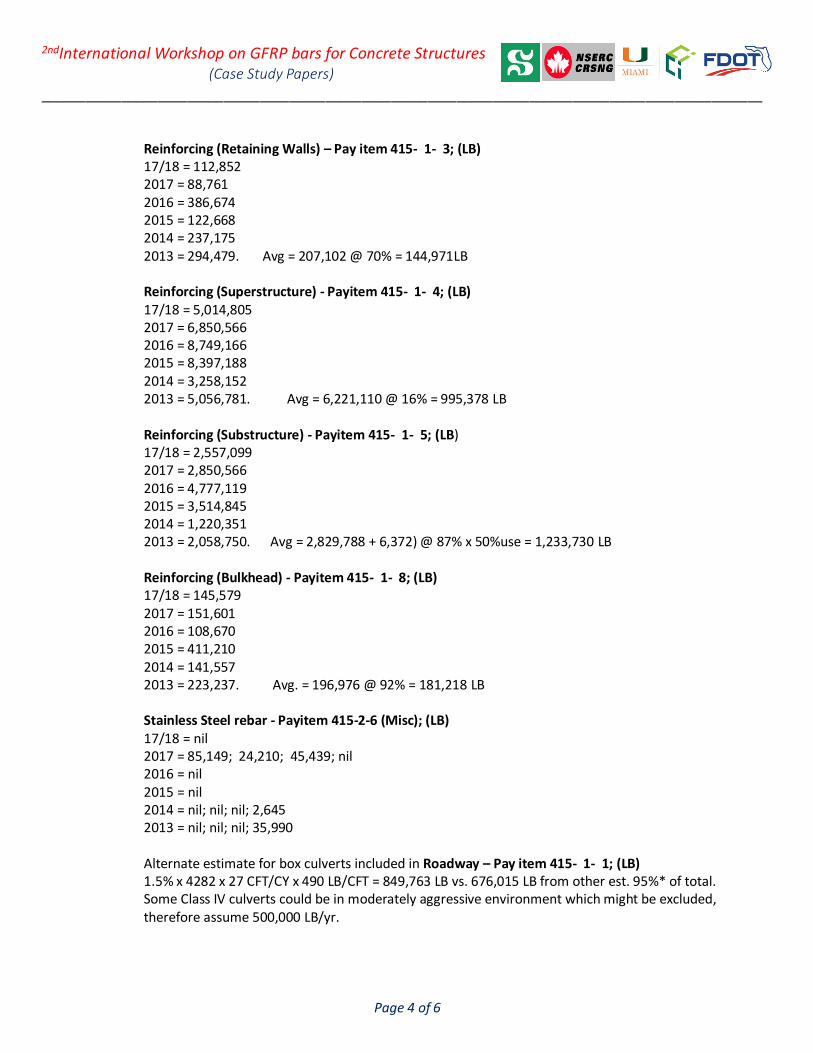
Reinforcing (Retaining Walls) – Pay item 415- 1- 3; (LB) 17/18 = 112,852 2017 = 88,761 2016 = 386,674 2015 = 122,668 2014 = 237,175 2013 = 294,479. Avg = 207,102 @ 70% = 144,971LB Reinforcing (Superstructure) - Payitem 415- 1- 4; (LB) 17/18 = 5,014,805 2017 = 6,850,566 2016 = 8,749,166 2015 = 8,397,188 2014 = 3,258,152 2013 = 5,056,781. Avg = 6,221,110 @ 16% = 995,378 LB Reinforcing (Substructure) - Payitem 415- 1- 5; (LB) 17/18 = 2,557,099 2017 = 2,850,566 2016 = 4,777,119 2015 = 3,514,845 2014 = 1,220,351 2013 = 2,058,750. Avg = 2,829,788 + 6,372) @ 87% x 50%use = 1,233,730 LB Reinforcing (Bulkhead) - Payitem 415- 1- 8; (LB) 17/18 = 145,579 2017 = 151,601 2016 = 108,670 2015 = 411,210 2014 = 141,557 2013 = 223,237. Avg. = 196,976 @ 92% = 181,218 LB Stainless Steel rebar - Payitem 415-2-6 (Misc); (LB) 17/18 = nil 2017 = 85,149; 24,210; 45,439; nil 2016 = nil 2015 = nil 2014 = nil; nil; nil; 2,645 2013 = nil; nil; nil; 35,990 Alternate estimate for box culverts included in Roadway – Pay item 415- 1- 1; (LB) 1.5% x 4282 x 27 CFT/CY x 490 LB/CFT = 849,763 LB vs. 676,015 LB from other est. 95%* of total. Some Class IV culverts could be in moderately aggressive environment which might be excluded, therefore assume 500,000 LB/yr.
___________________________________________________________________________________________________
Page 5 of 6
2ndInternational Workshop on GFRP bars for Concrete Structures (Case Study Papers)
3. Future FRP Rebar Quantity Estimate Based on the historical cost quantity averages, the estimated potential market of GFRP rebar for BB Projects extrapolating equivalent carbon-steel rebar weight data is:
a. Elements: Culverts = 500,000 LB (small bars) CIP Retaining Walls = 144,971 LB (small bars) Bridge Superstructure = 995,378 LB (50% small bars for decks; 50% medium bars for Flat-Slabs) Bridge Substructure = 1,233,730 LB (large bars) Bulkhead Caps = 181,218 LB (small bars) Sum-Total = 3,055,297 LB equivalent steel rebar weight.
b. Estimated Bar Size Breakout: Small Bars = No. 3, 4, 5 or 6. (1,323,889 LB @ ~ 1 LB equivalent/LF = 1,300,000 LF) Medium Bars = No. 7, 8 & 9. (497,700 @ ~ 2.7 LB equivalent/ft. = 185,000 LF) Large Bars = No. 10, 11, 12? (1,233,730 @ ~ 5 LB equivalent/ft. = 250,000 LF)
4. Discussion These estimated bar quantities ignore Design-Build projects that may account for another 25% market share. Additional it is anticipated that a greater quantity of GFRP will be required to satisfy the equivalent designs of carbon-steel reinforcement. An approximate estimate based on Rossini et al. 2018 & 2019 [2][3] ranges from 10% to 40%. This additional volume equates to another project cost increase which may hamper the selection of GFRP-RC as a cost-effective alternative probably dependent on whether life-cycle cost (LCC) analysis methods are applied. A 25% increase in volume is included in the final estimates below. As previously noted, there are also additional precast elements that could benefit from GFRP rebar that are not considered in the previous quantities. These bar sizes are expected to be of smaller sizes, with a significant proportion being bent bars or spirals. As such it is the author's opinion that the following quantities are a reasonable estimate for initial planning purposes for FDOT projects:
2,000,000 LF/year of small bars 290,000 LF/year of medium bars 390,000 LF/year of large bars
References 1. Davis, G. (2018). FDOT Historical Cost and Other Information, Florida Department of
Transportation, State Estimates Division website: http://www.fdot.gov/programmanagement/Estimates/HistoricalCostInformation/HistoricalCost.shtm (accessed 8/6/2018).
2. Rossini, M., A. Nanni, F. Matta, S. Nolan, W. Potter and D. Hess, (2019). SEACON and Resilient FRP-RC/PC Solutions: The Halls River Bridge, Italian Concrete Days, AICAP and CTE, Lecco, Italy, June 2018.
3. Rossini, M., A. Nanni, F. Matta, S. Nolan, W. Potter and D. Hess, (2019). Overview of AASHTO Design Specifications for GFRP-RC Bridges 2nd Edition: Toledo Bridge as Case Study, IABSE Symposium 2019, Guimarães, Portugal, March 2019.

___________________________________________________________________________________________________
Page 6 of 6
2ndInternational Workshop on GFRP bars for Concrete Structures (Case Study Papers)
4. Jung, S. (2018-2021). Evaluation of GFRP Spirals in Corrosion-Resistant Concrete Piles, FAMU-FSU School of Engineering for FDOT Structures Research Center.
___________________________________________________________________________________________________
Page 1 of 11
2ndInternational Workshop on GFRP bars for Concrete Structures
The Correlation Between Moisture Absorption and Tensile Strength Retention of Glass Fiber Reinforced Polymer Rebars
By: Raphael Kampmann1, Alvaro Ruiz Emparanza2, Srichand Telikapalli1, Jan Suhrheinrich3, Francisco De Caso2
1 FAMU-FSU College of Engineering, United States of America
2 University of Miami, United States of America 3 Fachhochschule Muenster, Germany
Abstract Fiber reinforced polymers (FRP) have gained importance as reinforcement bars (rebars) for the concrete construction industry because — in comparison to traditional black steel rebars — they possess favorable durability properties. Due to an increased need for durable reinforced concrete elements, the long-term performance and the resiliency of FRP rebars is currently a relevant research topic. For the study presented in this paper, the long- term behavior of glass FRP rebars was evaluated based on the moisture absorption properties of the composite material. It is assumed that reinforcement bars with a higher porosity or made from more absorbing components suffer a significant strength loss when exposed to attacks from saline solutions. Accordingly, different physical and mechanical properties of three dissimilar GFRP rebar types were tested both in their virgin state (to provide benchmark values) and after aging in saltwater at elevated temperatures. Specifically, the cross-sectional area, moisture absorption properties, microstructure damages, and tensile properties were classified for three different # 3 rebar types which were exposed to saline solutions at 23 ◦C, 40 ◦C, and 60 ◦C (73 ◦F, 104 ◦F, and 140 ◦F) for 60 days, 120 days, 210 days, 365 days to simulate rebar aging in seawater. To evaluate if the absorption is indicative of the vulnerability to environmental attacks, the moisture absorption properties were quantified and correlated to tensile strength properties. The test data revealed a significant difference between all rebar types. While the moisture absorption rates were acceptable for two rebar types, one product exceeded the acceptance criteria outlined in ICCES AC454. Accordingly, the mechanical strength was analyzed with a focus on the differences in the moisture absorption behavior. The tensile strength retention was significantly reduced for the material with high moisture absorption, and the strength loss generally increased with increasing exposure temperatures. It was concluded that the saline solution impacts the fiber dominated tensile failure mechanism.
1. Introduction Glass fiber reinforced polymers (GFRP) are composite materials made from fibers embedded in a resin matrix of various shapes and forms with a broad spectrum of applications. The fibers may be made from various glass types but E-CR Glass appears to be most common, the matrix consists of chemically-synthesized resins like epoxy or vinyl ester. In civil engineering, FRPs are used as facade elements or for sophisticated constructions as well as concrete reinforcement. Traditional steel reinforcement is a problematic material in aggressive environments such as seawater because metals are extremely vulnerable to corrosion when in contact with chlorides. Though not free from corrosion, GFRP rebars can withstand saltwater attacks better than their steel counterparts if the resin matrix properly protects the fibers (low porosity). For that reason, these reinforcement alternatives are becoming more common for construction projects in coastal areas. Because the material and its use as concrete
___________________________________________________________________________________________________
Page 2 of 11
2ndInternational Workshop on GFRP bars for Concrete Structures
reinforcement are a rather new technology, concerns about the long-term properties still exist. In a research cooperative between the Florida Department of Transportation (FDOT), the University of Miami (UM) and the FAMU-FSU College of Engineering, the long-term properties of three different GFRP rebar products were evaluated with a central focus on the durability properties. This paper presents partial finding from this study and provides evidence for the correlation between the moisture absorption properties according to ASTM D5229 (ASTM-International, 1992), microstructure damages, and the long-term strength retention properties of GFRP rebars.
2. Background The durability assessment of GFRP rebars is an important aspect for an effective implementation of this alternative technology because it is the main benefit and key feature that outshines traditional black steel for internal concrete reinforcement — specifically in aggressive environments. Accordingly, many researchers have attempted to quantify the resilience of GFRP rebars by subjecting them to accelerated conditioning protocols (ACP), in which the rebars are exposed to different solutions (high pH, saline, acid, etc.) at different temperatures, for dissimilar time periods (Chen et al., 2006; Dejke and Tepfers, 2001; Dong et al., 2016; Robert et al., 2009; Robert and Benmokrane, 2013; Wang et al., 2017; Yan and Lin, 2017; Wu et al., 2014). Exposure temperatures commonly range from 25 ◦C to 60 ◦C (77 ◦F to 140 ◦F), and the duration of the aging process varies between 60 days and 365 days. Most research projects assessed the durability by testing the retention of mechanical properties over time (Chen et al., 2006; Dejke and Tepfers, 2001; Robert et al., 2009; Robert and Benmokrane, 2013; Wu et al., 2014). However, it appears that physical properties such as the moisture absorption characteristics may have a direct impact on the durability of GFRP rebars as well (Nogueira et al., 2001; Surathi and Karbhari, 2006). The moisture absorption behavior is determined by the constituents (fibers, sizing, and resin) of the composite material. Fibers are usually made from silica (SiO2) with varying amounts of oxides of calcium, magnesium and boron (Wallenberger et al., 2001). Accordingly, the untreated glass fibers would be vulnerable to environmental attacks if they were not coated for protection via seizing and resin. Although the commercially used glass fibers are similar among different producers, the sizing that is applied during the production process vary significantly. Generally, the coupling agent provides adhesion between the glass surface and the resin, forms a film for protection, and lubricants the fibers during processing (Peters, 2018, p. 21). Resins for GFRP rebars are predominately vinyl ester based, and therefore, they are organic materials, which are mostly insoluble with both hydrophilic and hydrophobic functional groups. While glass is known to absorb little to no water, the water uptake of the resin matrix is, in comparison, significant — depending on the porosity of the microstructure. Adamson (1980, pp. 1736) postulated that moisture absorption is a three-stage process. First, the water fills free volume within the matrix by diffusion and capillary flow, which is due to voids, pores, and other imperfections within the material. Then the invaded water forms hydrogenous bonds to the hydrophilic functional groups of the resin. This causes swelling and a volumetric change, which leads to micro-cracking. More water is absorbed through new cracks by capillary flow. Finally, the water enters the densely cross-linked regions. According to Carter and Kibler (1978) the water molecules distribute uniformly across the specimen, long before saturation with hydrogenous bond water. Besides swelling, the hydrogen bond of water also causes plasticization and may lower the glass transition temperature, TG (Nogueira et al., 2001). Depending on the state of the resin, the moisture absorption can be described as Fickian, Non-Fickian or anomalous. Fick’s first law states that the diffusive flux is proportional to the concentration with the flux going from regions of higher concentrations to regions of lower concentration. The pure polymer matrix
___________________________________________________________________________________________________
Page 3 of 11
2ndInternational Workshop on GFRP bars for Concrete Structures
system of neat resins usually shows Fickian moisture absorption behavior (Surathi and Karbhari, 2006). However, extreme conditions such as elevated temperature or extended exposure times can lead to deviations from the classical Fickian model (Weitsman, 2006) but it can be related to the three-step process described above (Morii et al., 1993).
3. Research Significance Though construction projects have been realized with GFRP as internal reinforcement for concrete, the long-term durability and strength retention properties are still not fully understood. One key factor, that significantly affects the rebar durability, is the moisture absorption behavior (Nogueira et al., 2001) of the composite material, which is dependent on the microstructure of the rebar (Surathi and Karbhari, 2006). This in turn is dependent on the manufacturing quality of an individual rebar product. The quantification of durability affecting parameters is an important research topic that will support the improvement of future products, which can be used to build more durable structures. In addition, the presented results will aid rebar manufacturers in the production process because they emphasize the importance of specific rebar parameters that must be considered for a proper implementation of GFRP rebar technology. Accordingly, it appeared beneficial to evaluate the moisture absorption characteristic and specifically its influence on the long-term strength retention.
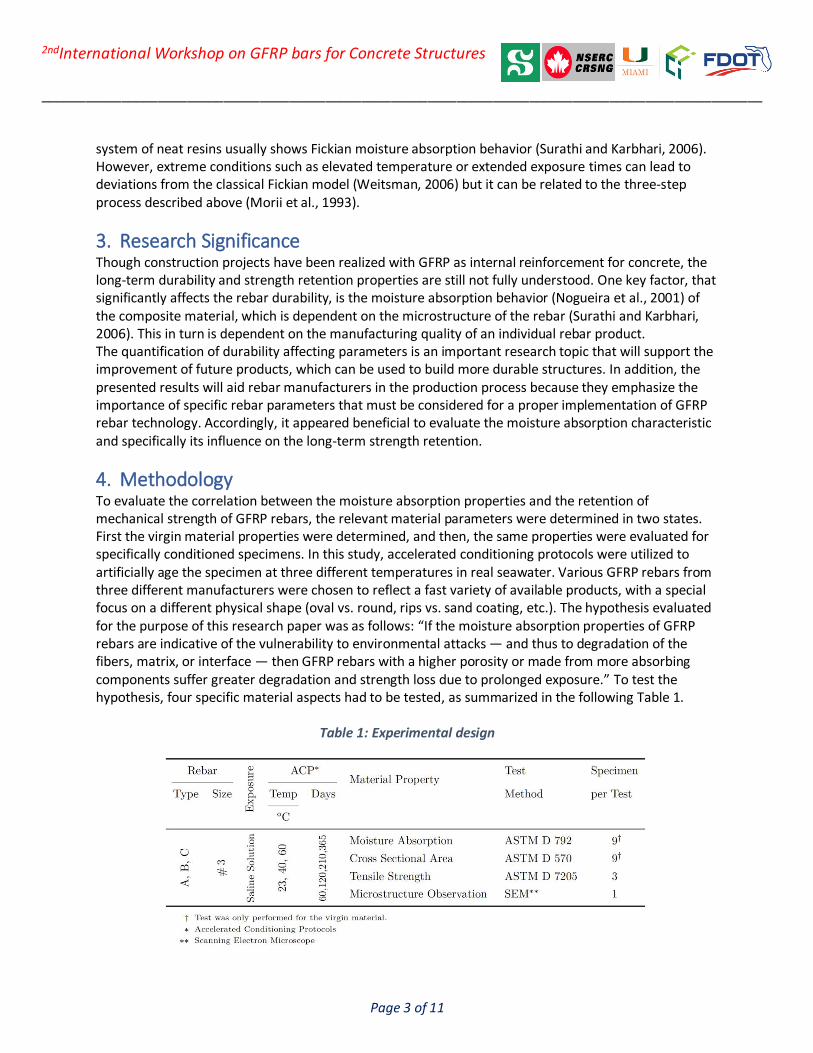
4. Methodology To evaluate the correlation between the moisture absorption properties and the retention of mechanical strength of GFRP rebars, the relevant material parameters were determined in two states. First the virgin material properties were determined, and then, the same properties were evaluated for specifically conditioned specimens. In this study, accelerated conditioning protocols were utilized to artificially age the specimen at three different temperatures in real seawater. Various GFRP rebars from three different manufacturers were chosen to reflect a fast variety of available products, with a special focus on a different physical shape (oval vs. round, rips vs. sand coating, etc.). The hypothesis evaluated for the purpose of this research paper was as follows: “If the moisture absorption properties of GFRP rebars are indicative of the vulnerability to environmental attacks — and thus to degradation of the fibers, matrix, or interface — then GFRP rebars with a higher porosity or made from more absorbing components suffer greater degradation and strength loss due to prolonged exposure.” To test the hypothesis, four specific material aspects had to be tested, as summarized in the following Table 1.
Table 1: Experimental design
___________________________________________________________________________________________________
Page 4 of 11
2ndInternational Workshop on GFRP bars for Concrete Structures
1) the cross-sectional area via specimen density according to ASTM D792 (ASTM International, 2013), 2) the moisture absorption properties in line with ASTM D5229 (ASTM-International, 1992), 3) the microstructure via scanning electron microscopy (SEM), and 4) the mechanical tensile properties per ASTM D7205 (ASTM International, 2011) were characterized. While all properties were determined in the virgin state for benchmark values, only the tensile tests and SEM analysis were conducted at regular intervals for all tested conditioning temperatures. The exposure duration included 60 days, 120 days, 210 days and 365 days and the condition temperatures ranged from 23 ◦C, to 40 ◦C, and 60 ◦C (74 ◦F, to 104 ◦F, and 140 ◦F).
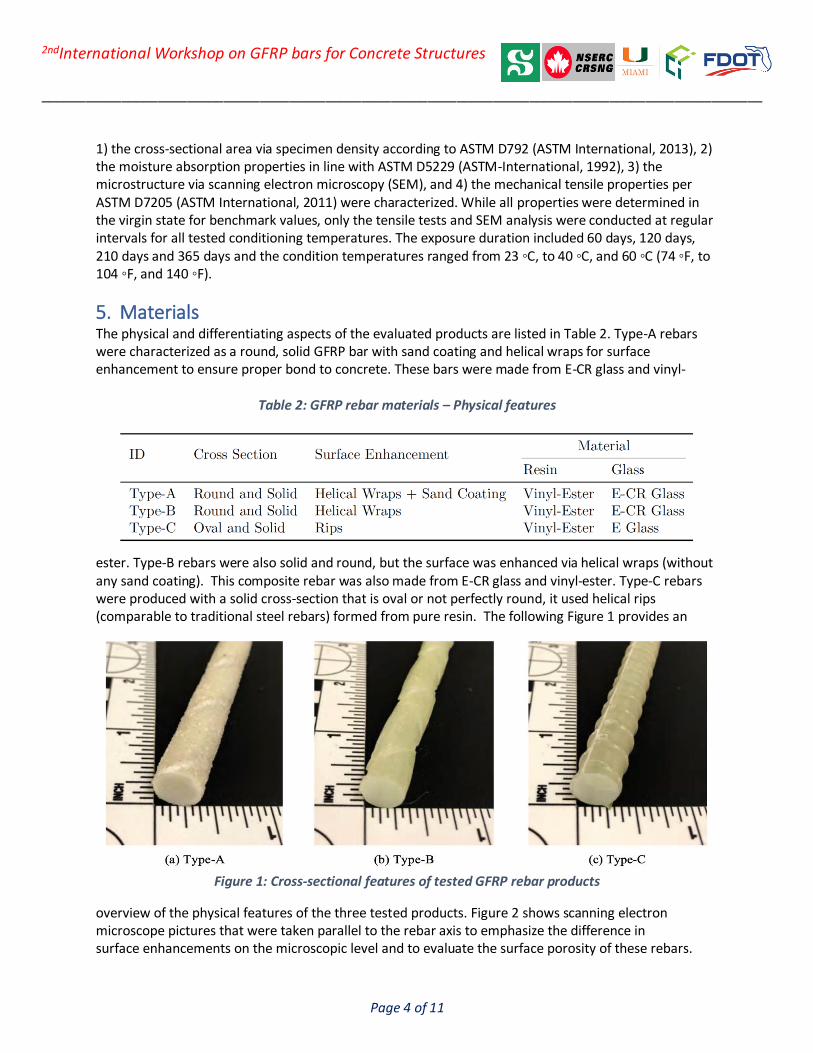
5. Materials The physical and differentiating aspects of the evaluated products are listed in Table 2. Type-A rebars were characterized as a round, solid GFRP bar with sand coating and helical wraps for surface enhancement to ensure proper bond to concrete. These bars were made from E-CR glass and vinyl-
Table 2: GFRP rebar materials – Physical features
ester. Type-B rebars were also solid and round, but the surface was enhanced via helical wraps (without any sand coating). This composite rebar was also made from E-CR glass and vinyl-ester. Type-C rebars were produced with a solid cross-section that is oval or not perfectly round, it used helical rips (comparable to traditional steel rebars) formed from pure resin. The following Figure 1 provides an
Figure 1: Cross-sectional features of tested GFRP rebar products
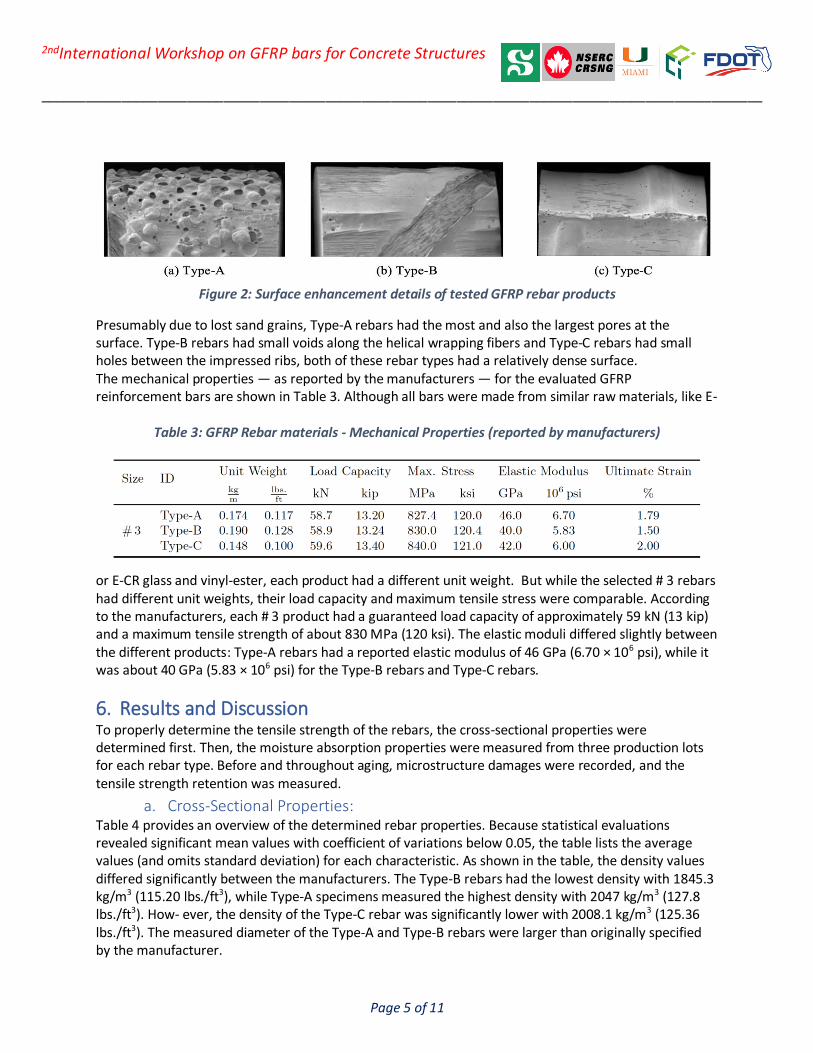
overview of the physical features of the three tested products. Figure 2 shows scanning electron microscope pictures that were taken parallel to the rebar axis to emphasize the difference in surface enhancements on the microscopic level and to evaluate the surface porosity of these rebars.
___________________________________________________________________________________________________
Page 5 of 11
2ndInternational Workshop on GFRP bars for Concrete Structures
Figure 2: Surface enhancement details of tested GFRP rebar products
Presumably due to lost sand grains, Type-A rebars had the most and also the largest pores at the surface. Type-B rebars had small voids along the helical wrapping fibers and Type-C rebars had small holes between the impressed ribs, both of these rebar types had a relatively dense surface. The mechanical properties — as reported by the manufacturers — for the evaluated GFRP reinforcement bars are shown in Table 3. Although all bars were made from similar raw materials, like E-
Table 3: GFRP Rebar materials - Mechanical Properties (reported by manufacturers)
or E-CR glass and vinyl-ester, each product had a different unit weight. But while the selected # 3 rebars had different unit weights, their load capacity and maximum tensile stress were comparable. According to the manufacturers, each # 3 product had a guaranteed load capacity of approximately 59 kN (13 kip) and a maximum tensile strength of about 830 MPa (120 ksi). The elastic moduli differed slightly between the different products: Type-A rebars had a reported elastic modulus of 46 GPa (6.70 × 10⁶ psi), while it was about 40 GPa (5.83 × 10⁶ psi) for the Type-B rebars and Type-C rebars.
6. Results and Discussion To properly determine the tensile strength of the rebars, the cross-sectional properties were determined first. Then, the moisture absorption properties were measured from three production lots for each rebar type. Before and throughout aging, microstructure damages were recorded, and the tensile strength retention was measured.
a. Cross-Sectional Properties: Table 4 provides an overview of the determined rebar properties. Because statistical evaluations revealed significant mean values with coefficient of variations below 0.05, the table lists the average values (and omits standard deviation) for each characteristic. As shown in the table, the density values differed significantly between the manufacturers. The Type-B rebars had the lowest density with 1845.3 kg/m3 (115.20 lbs./ft3), while Type-A specimens measured the highest density with 2047 kg/m3 (127.8 lbs./ft3). How- ever, the density of the Type-C rebar was significantly lower with 2008.1 kg/m3 (125.36 lbs./ft3). The measured diameter of the Type-A and Type-B rebars were larger than originally specified by the manufacturer.
___________________________________________________________________________________________________
Page 6 of 11
2ndInternational Workshop on GFRP bars for Concrete Structures
Table 4: Average measured cross-sectional properties
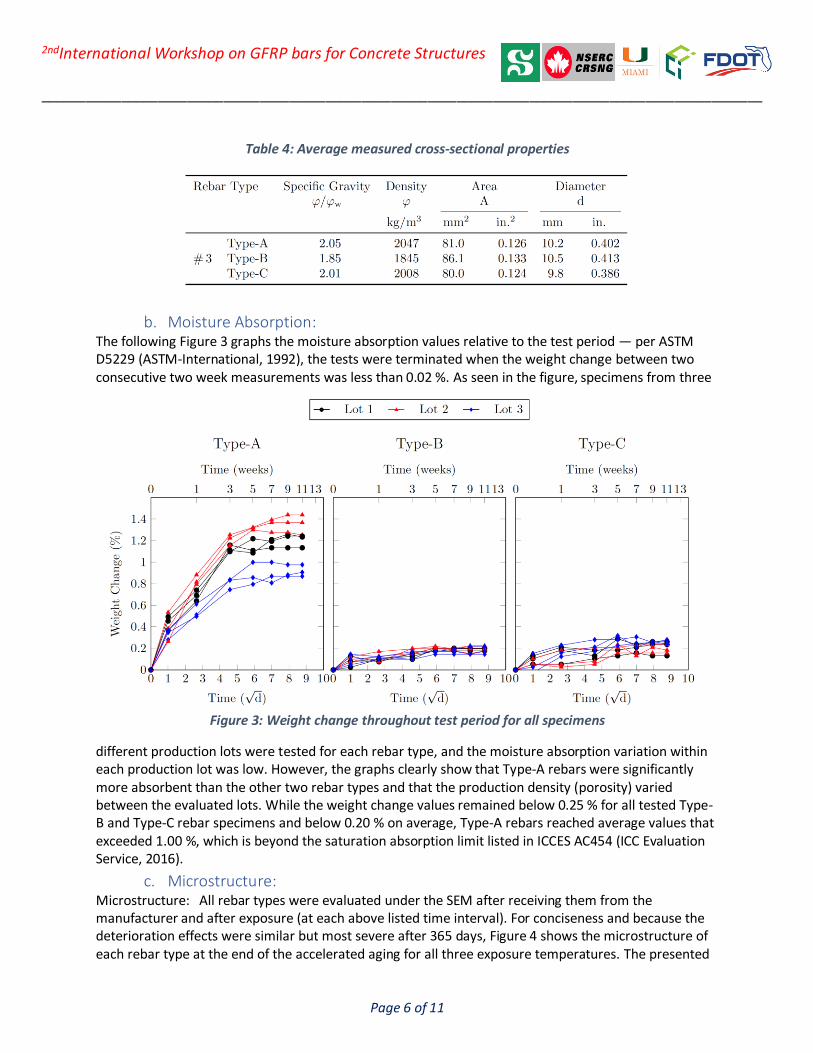
b. Moisture Absorption: The following Figure 3 graphs the moisture absorption values relative to the test period — per ASTM D5229 (ASTM-International, 1992), the tests were terminated when the weight change between two consecutive two week measurements was less than 0.02 %. As seen in the figure, specimens from three
Figure 3: Weight change throughout test period for all specimens
different production lots were tested for each rebar type, and the moisture absorption variation within each production lot was low. However, the graphs clearly show that Type-A rebars were significantly more absorbent than the other two rebar types and that the production density (porosity) varied between the evaluated lots. While the weight change values remained below 0.25 % for all tested Type-B and Type-C rebar specimens and below 0.20 % on average, Type-A rebars reached average values that exceeded 1.00 %, which is beyond the saturation absorption limit listed in ICCES AC454 (ICC Evaluation Service, 2016).
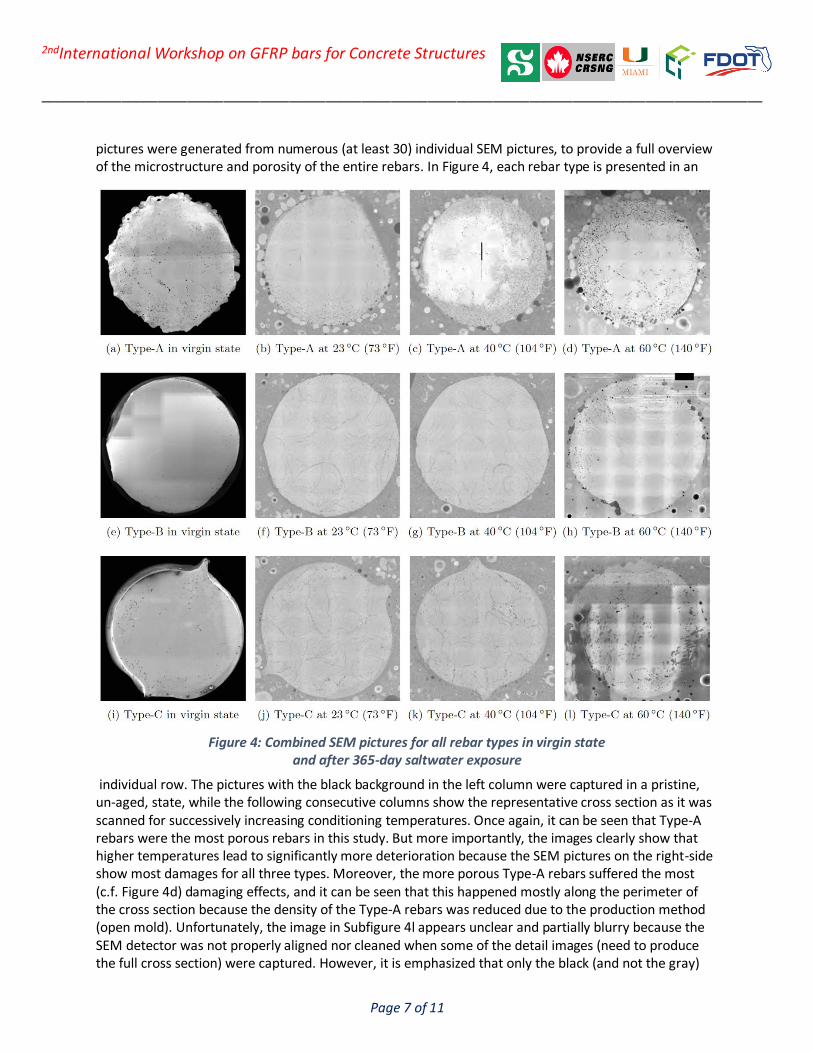
c. Microstructure: Microstructure: All rebar types were evaluated under the SEM after receiving them from the manufacturer and after exposure (at each above listed time interval). For conciseness and because the deterioration effects were similar but most severe after 365 days, Figure 4 shows the microstructure of each rebar type at the end of the accelerated aging for all three exposure temperatures. The presented
___________________________________________________________________________________________________
Page 7 of 11
2ndInternational Workshop on GFRP bars for Concrete Structures
pictures were generated from numerous (at least 30) individual SEM pictures, to provide a full overview of the microstructure and porosity of the entire rebars. In Figure 4, each rebar type is presented in an
Figure 4: Combined SEM pictures for all rebar types in virgin state
and after 365-day saltwater exposure
individual row. The pictures with the black background in the left column were captured in a pristine, un-aged, state, while the following consecutive columns show the representative cross section as it was scanned for successively increasing conditioning temperatures. Once again, it can be seen that Type-A rebars were the most porous rebars in this study. But more importantly, the images clearly show that higher temperatures lead to significantly more deterioration because the SEM pictures on the right-side show most damages for all three types. Moreover, the more porous Type-A rebars suffered the most (c.f. Figure 4d) damaging effects, and it can be seen that this happened mostly along the perimeter of the cross section because the density of the Type-A rebars was reduced due to the production method (open mold). Unfortunately, the image in Subfigure 4l appears unclear and partially blurry because the SEM detector was not properly aligned nor cleaned when some of the detail images (need to produce the full cross section) were captured. However, it is emphasized that only the black (and not the gray)
___________________________________________________________________________________________________
Page 8 of 11
2ndInternational Workshop on GFRP bars for Concrete Structures
areas are representative of voids or microstructure defects. Accordingly, Type-C rebars were well produced with proper fiber and resin distribution, in which the small spaces between the fibers were mostly filled with resin. While the elevated temperatures lead to more damages for all rebar types, Type-B and Type-C rebars were insignificantly damaged in comparison to Type-A rebars. From the observation of the microstructure, it can be deduced that the production density plays an imperative role for the durability of GFRP rebars.
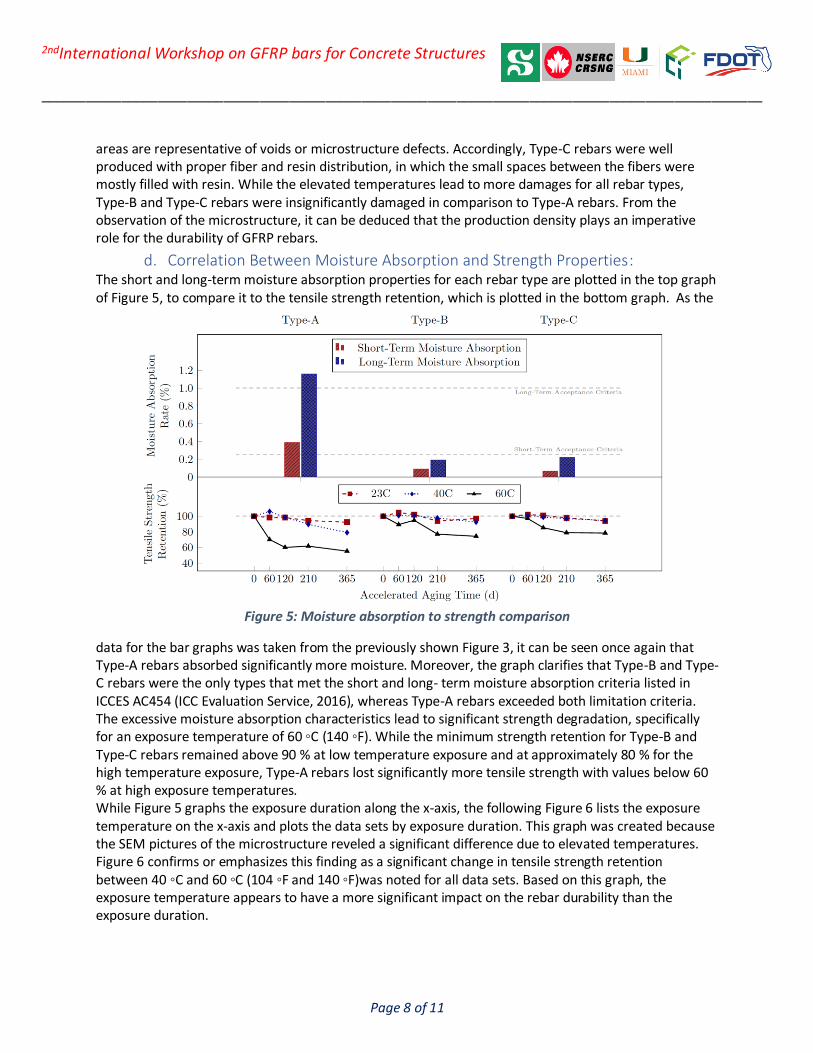
d. Correlation Between Moisture Absorption and Strength Properties: The short and long-term moisture absorption properties for each rebar type are plotted in the top graph of Figure 5, to compare it to the tensile strength retention, which is plotted in the bottom graph. As the
Figure 5: Moisture absorption to strength comparison
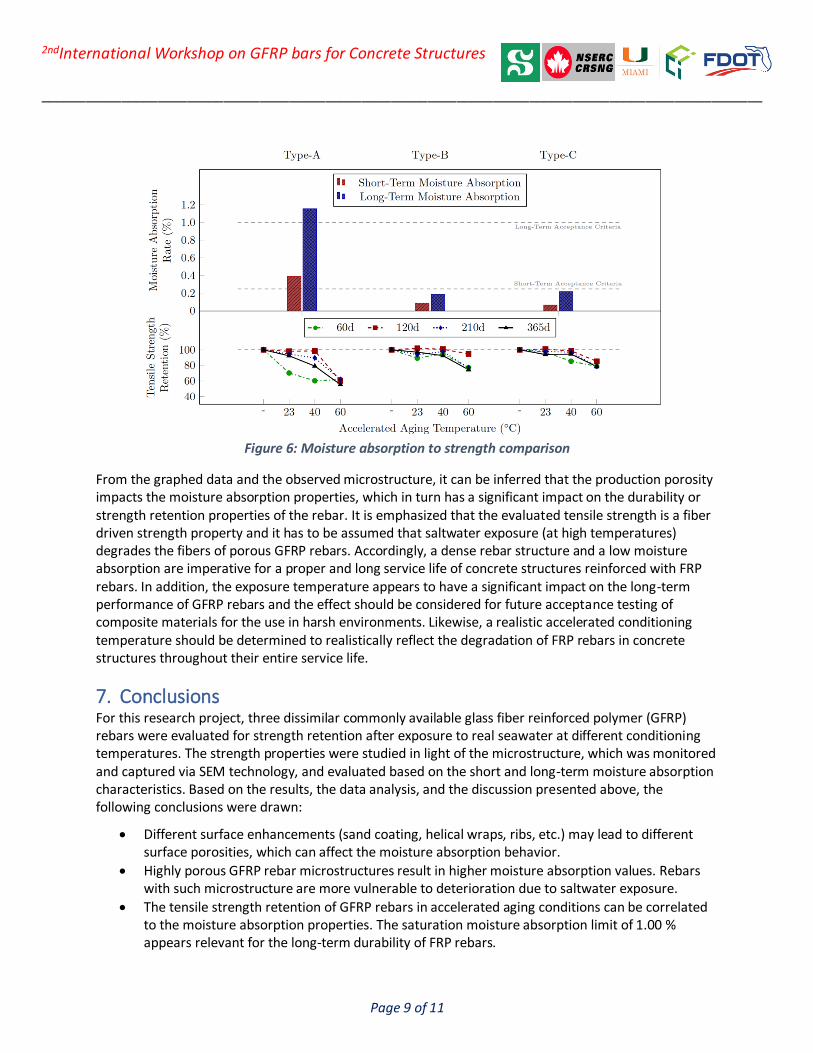
data for the bar graphs was taken from the previously shown Figure 3, it can be seen once again that Type-A rebars absorbed significantly more moisture. Moreover, the graph clarifies that Type-B and Type-C rebars were the only types that met the short and long- term moisture absorption criteria listed in ICCES AC454 (ICC Evaluation Service, 2016), whereas Type-A rebars exceeded both limitation criteria. The excessive moisture absorption characteristics lead to significant strength degradation, specifically for an exposure temperature of 60 ◦C (140 ◦F). While the minimum strength retention for Type-B and Type-C rebars remained above 90 % at low temperature exposure and at approximately 80 % for the high temperature exposure, Type-A rebars lost significantly more tensile strength with values below 60 % at high exposure temperatures. While Figure 5 graphs the exposure duration along the x-axis, the following Figure 6 lists the exposure temperature on the x-axis and plots the data sets by exposure duration. This graph was created because the SEM pictures of the microstructure reveled a significant difference due to elevated temperatures. Figure 6 confirms or emphasizes this finding as a significant change in tensile strength retention between 40 ◦C and 60 ◦C (104 ◦F and 140 ◦F)was noted for all data sets. Based on this graph, the exposure temperature appears to have a more significant impact on the rebar durability than the exposure duration.
___________________________________________________________________________________________________
Page 9 of 11
2ndInternational Workshop on GFRP bars for Concrete Structures
Figure 6: Moisture absorption to strength comparison
From the graphed data and the observed microstructure, it can be inferred that the production porosity impacts the moisture absorption properties, which in turn has a significant impact on the durability or strength retention properties of the rebar. It is emphasized that the evaluated tensile strength is a fiber driven strength property and it has to be assumed that saltwater exposure (at high temperatures) degrades the fibers of porous GFRP rebars. Accordingly, a dense rebar structure and a low moisture absorption are imperative for a proper and long service life of concrete structures reinforced with FRP rebars. In addition, the exposure temperature appears to have a significant impact on the long-term performance of GFRP rebars and the effect should be considered for future acceptance testing of composite materials for the use in harsh environments. Likewise, a realistic accelerated conditioning temperature should be determined to realistically reflect the degradation of FRP rebars in concrete structures throughout their entire service life.
7. Conclusions For this research project, three dissimilar commonly available glass fiber reinforced polymer (GFRP) rebars were evaluated for strength retention after exposure to real seawater at different conditioning temperatures. The strength properties were studied in light of the microstructure, which was monitored and captured via SEM technology, and evaluated based on the short and long-term moisture absorption characteristics. Based on the results, the data analysis, and the discussion presented above, the following conclusions were drawn:
• Different surface enhancements (sand coating, helical wraps, ribs, etc.) may lead to different surface porosities, which can affect the moisture absorption behavior.
• Highly porous GFRP rebar microstructures result in higher moisture absorption values. Rebars with such microstructure are more vulnerable to deterioration due to saltwater exposure.
• The tensile strength retention of GFRP rebars in accelerated aging conditions can be correlated to the moisture absorption properties. The saturation moisture absorption limit of 1.00 % appears relevant for the long-term durability of FRP rebars.
___________________________________________________________________________________________________
Page 10 of 11
2ndInternational Workshop on GFRP bars for Concrete Structures
• Intensified exposure temperatures degrade GFRP rebars more severely. While degradation was noticed between 23 ◦C (73 ◦F) and 40 ◦C (104 ◦F), the strength reduction between 40 ◦C and 60 ◦C (104 ◦F and 140 ◦F) was more significant.
8. Acknowledgements The authors would like to thank the Florida Department of Transportation (FDOT) for financial support and for a progressive implementation of FRP rebars. Special thanks go to Steven Nolan and Chase Knight for technical and engineering support.
9. References • Adamson, M. J. (1980). “Thermal expansion and swelling of cured epoxy resin used in
graphite/epoxy composite materials.” Journal of Materials Science, 15(7), 1736–1745.
• ASTM-International (1992). Standard test method for moisture absorption properties and equilibrium conditioning of polymer matrix composite materials, (D5229). ASTM International, West Conshohocken, PA.
• ASTM International (2011). Standard Test Method for Tensile Properties of Fiber Reinforced Polymer Matrix Composite Bars, (D7205). ASTM International, West Conshohocken, PA.
• ASTM International (2013). Standard Test Methods for Density and Specific Gravity (Relative Density) of Plastics by Displacement, (D792). ASTM International, West Conshohocken, PA.
• Carter, H. G. and Kibler, K. G. (1978). “Langmuir-Type Model for Anomalous Moisture Diffusion In Composite Resins.” Journal of Composite Materials, 12(2), 118–131.
• Chen, Y., Davalos, J. F., and Ray, I. (2006). “Durability prediction for GFRP reinforcing bars using short-term data of accelerated aging tests.” Journal of Composites for Construction, 10(4), 279–286.
• Dejke, V. and Tepfers, R. (2001). “Durability and service life prediction of GFRP for concrete reinforcement.” Proc., 5th Int. Conf. on Fiber-Reinforced Plastics for Reinforced Concrete Structures (FRPRCS-5), Vol. 1. Thomas Telford London, 505–516.
• Dong, Z., Wu, G., Xu, B., Wang, X., and Taerwe, L. (2016). “Bond durability of BFRP bars embedded in concrete under seawater conditions and the long-term bond strength prediction.” Materials and Design, 92, 552–562.
• ICC Evaluation Service (2016). AC454 - Acceptance Criteria for Fiber-Reinforced Polymer (FRP) Bars for Internal Reinforcement of Concrete Members.
• Morii, T., Tanimoto, T., Hamada, H., ichiro Maekawa, Z., Hirano, T., and Kiyosumi, K. (1993). “Weight changes of a randomly orientated GRP panel in hot water.” Composites Science and Technology, 49(3), 209–216.
• Nogueira, P., Ramirez, C., Torres, A., Abad, M. J., Cano, J., Lopez, J., Lopez–Bueno, I., and Barral, L. (2001). “Effect of water sorption on the structure and mechanical properties of an epoxy resin system.” Journal of Applied Polymer Science, 80(1), 71–80.
• Peters, L. (2018). Durability of Composites in a Marine Environment 2, chapter Influence of Glass Fibre Sizing and Storage Conditions on Composite Properties, 19–31. Peter Davis and Yapa D. S. Rajapakse.
• Robert, M. and Benmokrane, B. (2013). “Combined effects of saline solution and moist concrete on long-term durability of GFRP reinforcing bars.” Construction and Building Materials, 38.
• Robert, M., Cousin, P., and Benmokrane, B. (2009). “Durability of GFRP reinforcing bars embedded in moist concrete.” Journal of Composites for Construction, 13(2), 66–73.
___________________________________________________________________________________________________
Page 11 of 11
2ndInternational Workshop on GFRP bars for Concrete Structures
• Surathi, P. and Karbhari, V. M. (2006). “Hygrothermal Effects on Durability and Moisture Absorption Kinetics of Fiber-Reinforced Polymer Composites”, University of California, Department of Structural Engineering.
• Wallenberger, F. T., Watson, J. C., and Li, H. (2001). “Glass Fibers.” ASM Handbook, 21.
• Wang, Z., Zhao, X. L., Xian, G., Wu, G., Singh Raman, R. K., and Al-Saadi, S. (2017). “Durability study on interlaminar shear behaviour of basalt-, glass- and carbon-fibre reinforced polymer (B/G/CFRP) bars in seawater sea sand concrete environment.” Construction and Building Materials, 156, 985–1004.
• Weitsman, Y. J. (2006). “Anomalous fluid sorption in polymeric composites and its relation to fluid-induced damage.” Composites Part A: Applied Science and Manufacturing, 37(4), 617–623.
• Wu, G., Dong, Z., Wang, X., Zhu, Y., and Wu, Z. (2014). “Prediction of Long-Term Performance and Durability of BFRP Bars under the Combined Effect of Sustained Load and Corrosive Solutions.” Journal of Composites for Construction, 19(3), 4014058.
• Yan, F. and Lin, Z. (2017). “Bond durability assessment and long-term degradation prediction for GFRP bars to fiber-reinforced concrete under saline solutions.” Composite Structures, 161, 393–406.
___________________________________________________________________________________________________
Page 1 of 10
2ndInternational Workshop on GFRP bars for Concrete Structures
Case Study Title: South Corridor in Panama City, Panama
By: Borna Hajmiragha CEO B&B FRP MFG. A. Avendaño, PhD, P.E. (Engineering Director, ICONSA)
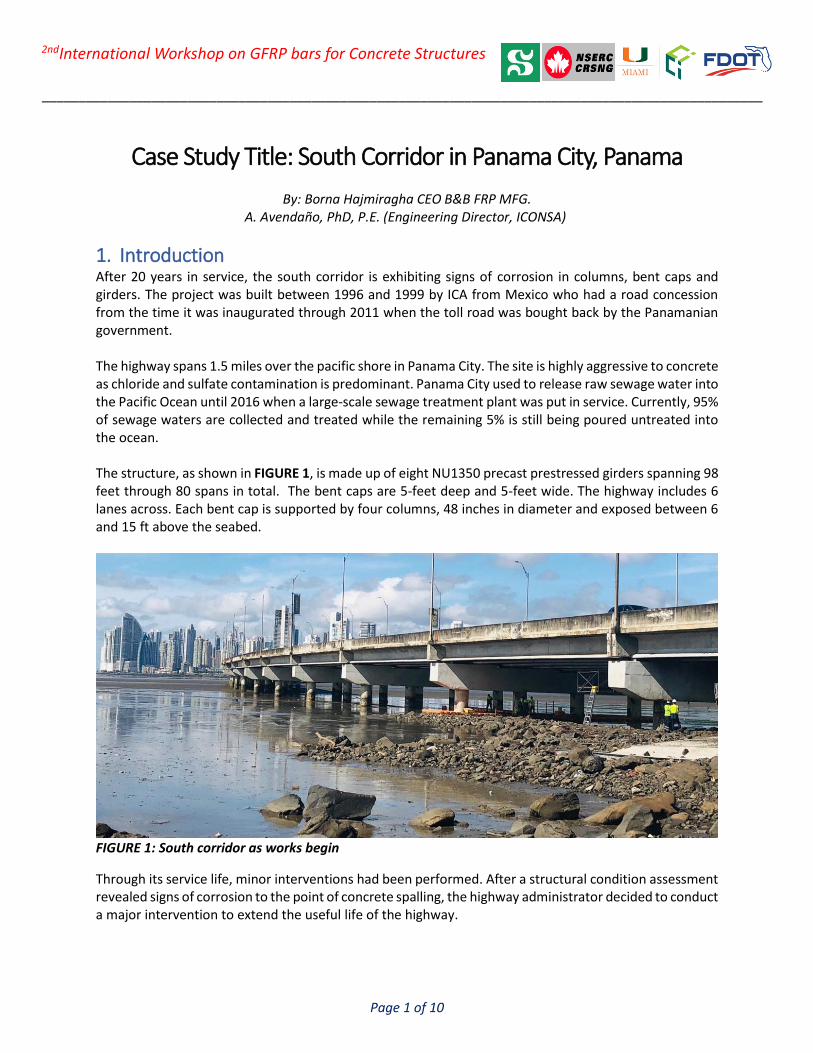
1. Introduction After 20 years in service, the south corridor is exhibiting signs of corrosion in columns, bent caps and girders. The project was built between 1996 and 1999 by ICA from Mexico who had a road concession from the time it was inaugurated through 2011 when the toll road was bought back by the Panamanian government. The highway spans 1.5 miles over the pacific shore in Panama City. The site is highly aggressive to concrete as chloride and sulfate contamination is predominant. Panama City used to release raw sewage water into the Pacific Ocean until 2016 when a large-scale sewage treatment plant was put in service. Currently, 95% of sewage waters are collected and treated while the remaining 5% is still being poured untreated into the ocean. The structure, as shown in FIGURE 1, is made up of eight NU1350 precast prestressed girders spanning 98 feet through 80 spans in total. The bent caps are 5-feet deep and 5-feet wide. The highway includes 6 lanes across. Each bent cap is supported by four columns, 48 inches in diameter and exposed between 6 and 15 ft above the seabed.
FIGURE 1: South corridor as works begin
Through its service life, minor interventions had been performed. After a structural condition assessment revealed signs of corrosion to the point of concrete spalling, the highway administrator decided to conduct a major intervention to extend the useful life of the highway.
___________________________________________________________________________________________________
Page 2 of 10
2ndInternational Workshop on GFRP bars for Concrete Structures
After a public bid contest, A consortium formed by ICONSA and PCS, two local companies, was awarded the project. The project was presented as a design & build project. The contractor was responsible for designing the rehabilitation measures and executing them. Guidelines were given by the highway administrator along with a detailed report of the assessment conducted a year earlier. GFRP bars were chosen by the designers mainly as structural and shrinkage reinforcement placed within new concrete cover to be cast in place. This paper presents how GFRP is used in this project.
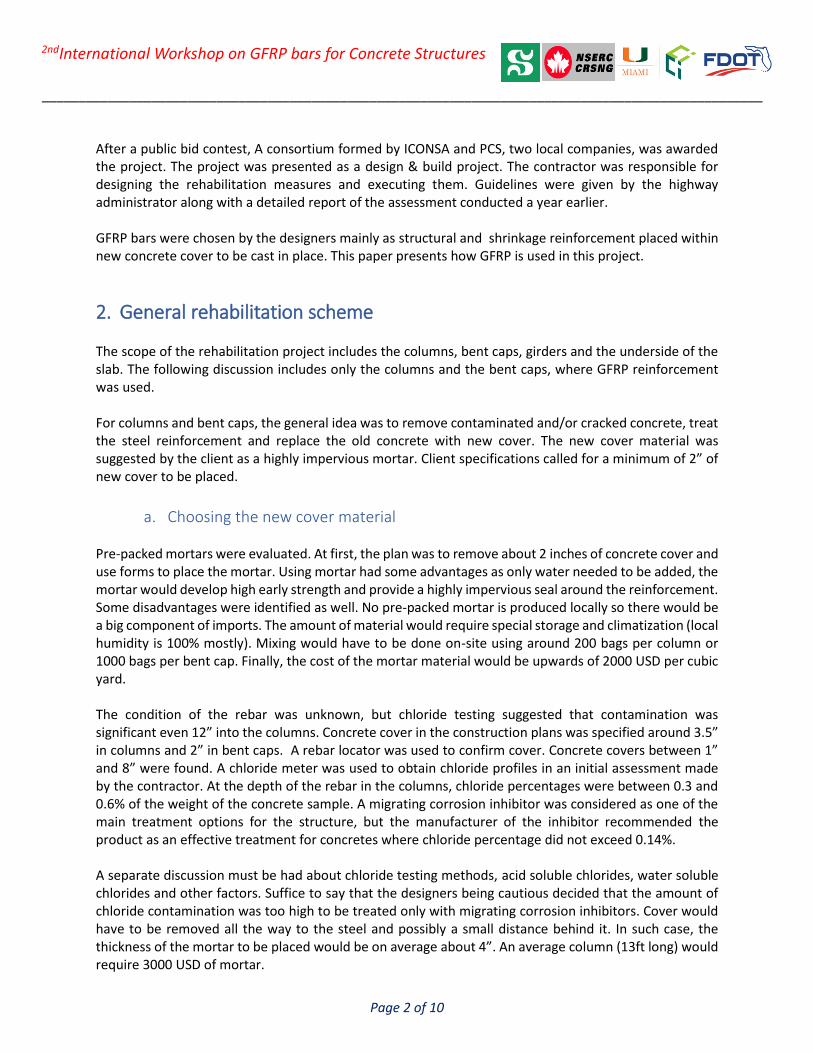
2. General rehabilitation scheme The scope of the rehabilitation project includes the columns, bent caps, girders and the underside of the slab. The following discussion includes only the columns and the bent caps, where GFRP reinforcement was used. For columns and bent caps, the general idea was to remove contaminated and/or cracked concrete, treat the steel reinforcement and replace the old concrete with new cover. The new cover material was suggested by the client as a highly impervious mortar. Client specifications called for a minimum of 2” of new cover to be placed.
a. Choosing the new cover material Pre-packed mortars were evaluated. At first, the plan was to remove about 2 inches of concrete cover and use forms to place the mortar. Using mortar had some advantages as only water needed to be added, the mortar would develop high early strength and provide a highly impervious seal around the reinforcement. Some disadvantages were identified as well. No pre-packed mortar is produced locally so there would be a big component of imports. The amount of material would require special storage and climatization (local humidity is 100% mostly). Mixing would have to be done on-site using around 200 bags per column or 1000 bags per bent cap. Finally, the cost of the mortar material would be upwards of 2000 USD per cubic yard. The condition of the rebar was unknown, but chloride testing suggested that contamination was significant even 12” into the columns. Concrete cover in the construction plans was specified around 3.5” in columns and 2” in bent caps. A rebar locator was used to confirm cover. Concrete covers between 1” and 8” were found. A chloride meter was used to obtain chloride profiles in an initial assessment made by the contractor. At the depth of the rebar in the columns, chloride percentages were between 0.3 and 0.6% of the weight of the concrete sample. A migrating corrosion inhibitor was considered as one of the main treatment options for the structure, but the manufacturer of the inhibitor recommended the product as an effective treatment for concretes where chloride percentage did not exceed 0.14%. A separate discussion must be had about chloride testing methods, acid soluble chlorides, water soluble chlorides and other factors. Suffice to say that the designers being cautious decided that the amount of chloride contamination was too high to be treated only with migrating corrosion inhibitors. Cover would have to be removed all the way to the steel and possibly a small distance behind it. In such case, the thickness of the mortar to be placed would be on average about 4”. An average column (13ft long) would require 3000 USD of mortar.
___________________________________________________________________________________________________
Page 3 of 10
2ndInternational Workshop on GFRP bars for Concrete Structures
Mortar can be cost effective when the thickness to be applied is relatively small. In this case, self-consolidating concrete (SCC) was chosen as a more suitable option. The only concern was shrinkage. The SCC mix would have about 740 pounds of cement per cubic yard, silica fume equivalent to 8% of the weight of cement, a water-cement ratio of 0.38 and a high dosage of a corrosion inhibitor. Type I cement was chosen instead of type III to reduce heat. Super plasticizer was added for workability and a retarder admixture was added to sustain the workability through 3 hours. The surface resistivity was on average 40 KOHm-cm. The cost of the SCC mix was approximately 200 USD per cubic yard.
b. Shrinkage Control through GFRP To mitigate any possible shrinkage problem associated with the use of SCC instead of a pre-packed mortar, GFRP skin reinforcement was chosen. As for the reinforcement percentage, the following rationale was used. Following ACI 318 guidelines, an initial ratio of 0.0018 was set. GFRP has a much higher yield stress than conventional steel (145 ksi compared to 60 ksi) but controlling shrinkage is an exercise of controlling strains rather than strength. Despite the higher strength, GFRP was a lower young’s modulus than steel (8935 ksi compared to 29000 ksi). To account for this, the ratio recommended by ACI was adjusted by the ratios of the young modulus of the materials, resulting in a ratio of 0.0051. For a 4” concrete cover placement, a mesh of #3 bars spaced at 150mm was selected. The additional cost of using GFRP instead of conventional steel reinforcement for shrinkage control was small for the project and was clearly justified considering the aggressive site conditions.
c. Pre-bent GFRP Pre-bent GFRP was incorporated into the rehabilitation scheme of the columns. Two half cylinder meshes were to be placed around the columns to reinforce the new cover material. This option was only to be used if the hydrodemolition did not reach the spirals. If cover was removed all the way to (and a small distance behind) the spirals, the designers considered that the new cover was embedded with the steel spiral which would control shrinkage as it usually does. Pre-bent GFRP was also chosen for reinforcing the initial base of the column rehabilitation as will be explained in the following section.
FIGURE 2: Pre-bent GFRP reinforcement for column bases
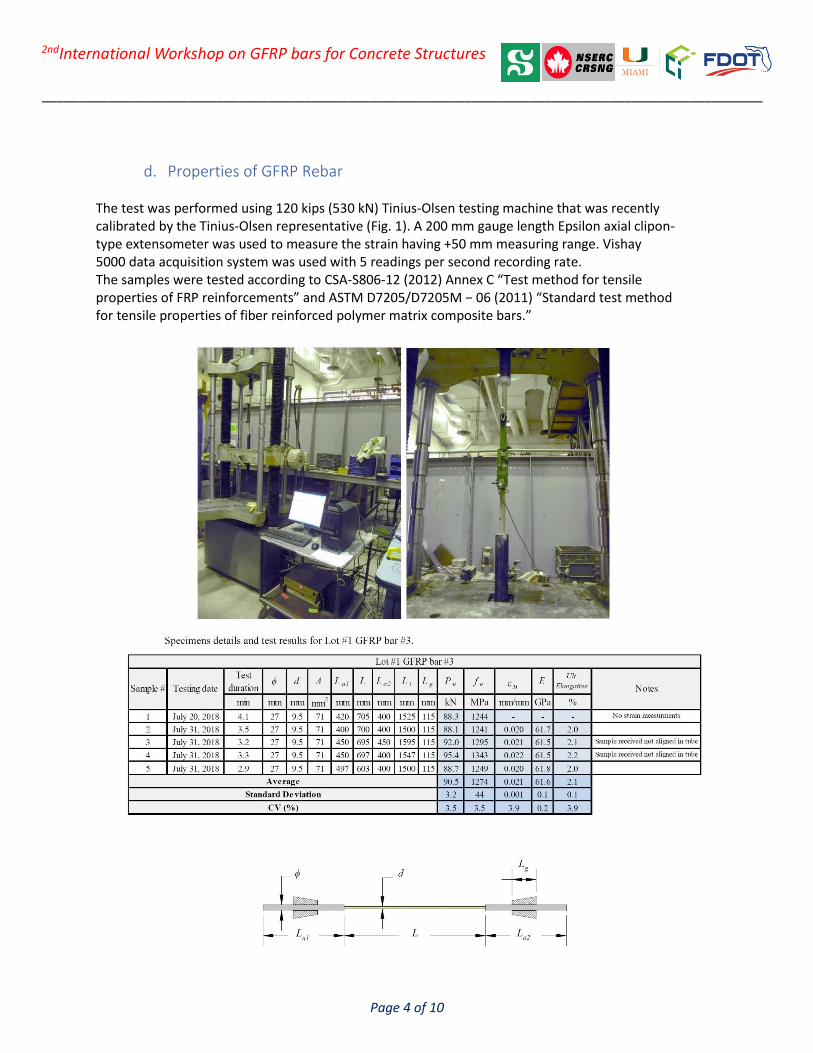
___________________________________________________________________________________________________
Page 4 of 10
2ndInternational Workshop on GFRP bars for Concrete Structures
d. Properties of GFRP Rebar The test was performed using 120 kips (530 kN) Tinius-Olsen testing machine that was recently calibrated by the Tinius-Olsen representative (Fig. 1). A 200 mm gauge length Epsilon axial clipon- type extensometer was used to measure the strain having +50 mm measuring range. Vishay 5000 data acquisition system was used with 5 readings per second recording rate. The samples were tested according to CSA-S806-12 (2012) Annex C “Test method for tensile properties of FRP reinforcements” and ASTM D7205/D7205M − 06 (2011) “Standard test method for tensile properties of fiber reinforced polymer matrix composite bars.”
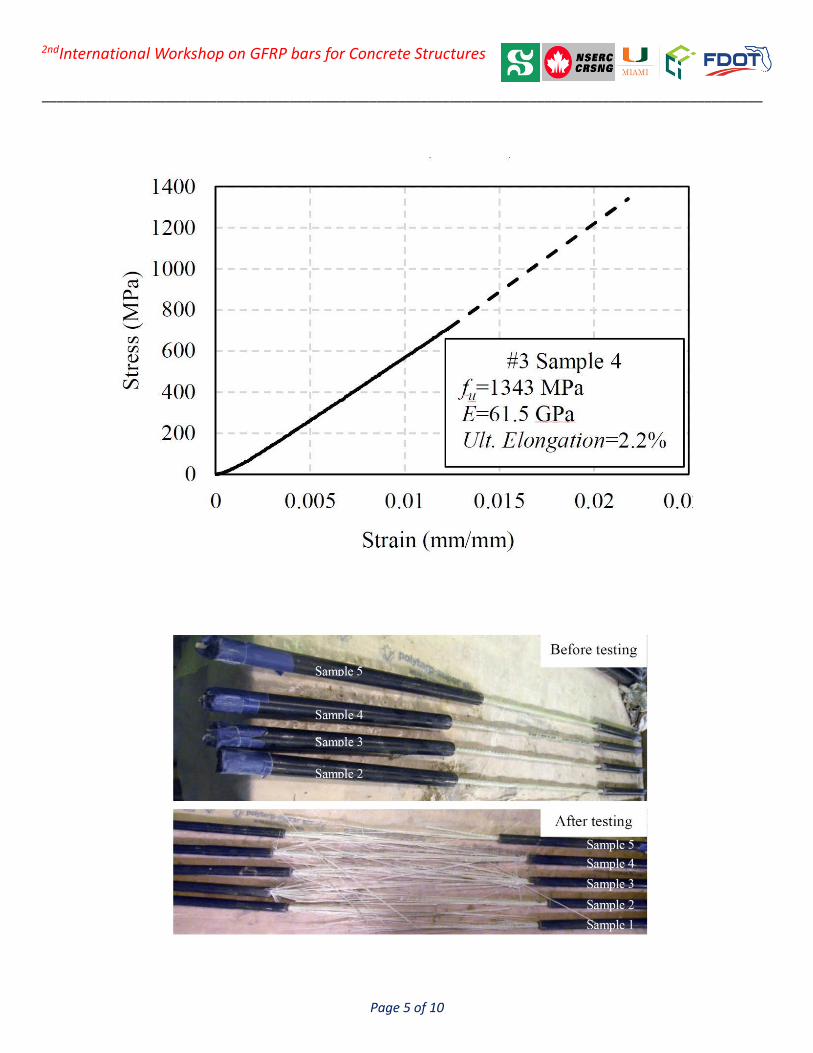
___________________________________________________________________________________________________
Page 5 of 10
2ndInternational Workshop on GFRP bars for Concrete Structures

___________________________________________________________________________________________________
Page 6 of 10
2ndInternational Workshop on GFRP bars for Concrete Structures
3. Column rehabilitation
a. Initial Condition Columns for the most part only showed vertical cracks. Either one as shown in FIGURE 3 or two diametrically opposed. Although not visible nor expected at first, the spirals were highly corroded as can be seen in the right side of FIGURE 3. Concrete strengths as low as 2000 psi were measured from cores. Although we are referring to these members as columns, one could make the argument to call them drilled piers. Sacrificial sleeves have been found at the site near seabed. Evidence suggests that the exposed length of the column is made from the same concrete as the rest of the pier Usually, the piers need to be overflowed with concrete in order to clear any contaminated concrete. It appears this was not done properly in this case.
FIGURE 3: Left: Initial condition of columns, Right: Column after cover removal through
hydrodemolition
b. Construction of Base The rebar cage was found to be off-center with respect to the concrete surface. Cover was too little on one side and too much on the opposite side. An even and sufficient concrete cover was desired. A base was fabricated extending from the seabed 20” down. The base was 8” larger in diameter than the original column. The idea was to provide support for the jacket and new cover to be placed later. The base was reinforced with pre-bent GFRP reinforcement as shown in FIGURE 2. L-shaped anchors were installed with epoxy into the base of the column to maintain the mesh in place and to serve as dowels for the weight of the fresh concrete to be placed above. The base, and the main length of the exposed column later, were formed with FRP jackets. See FIGURE 4. Each base remains dry for 6 hours on each tide. The entire base operation needs to be performed in under 4 hours in order to allow the concrete to set before the tide reaches the structure.
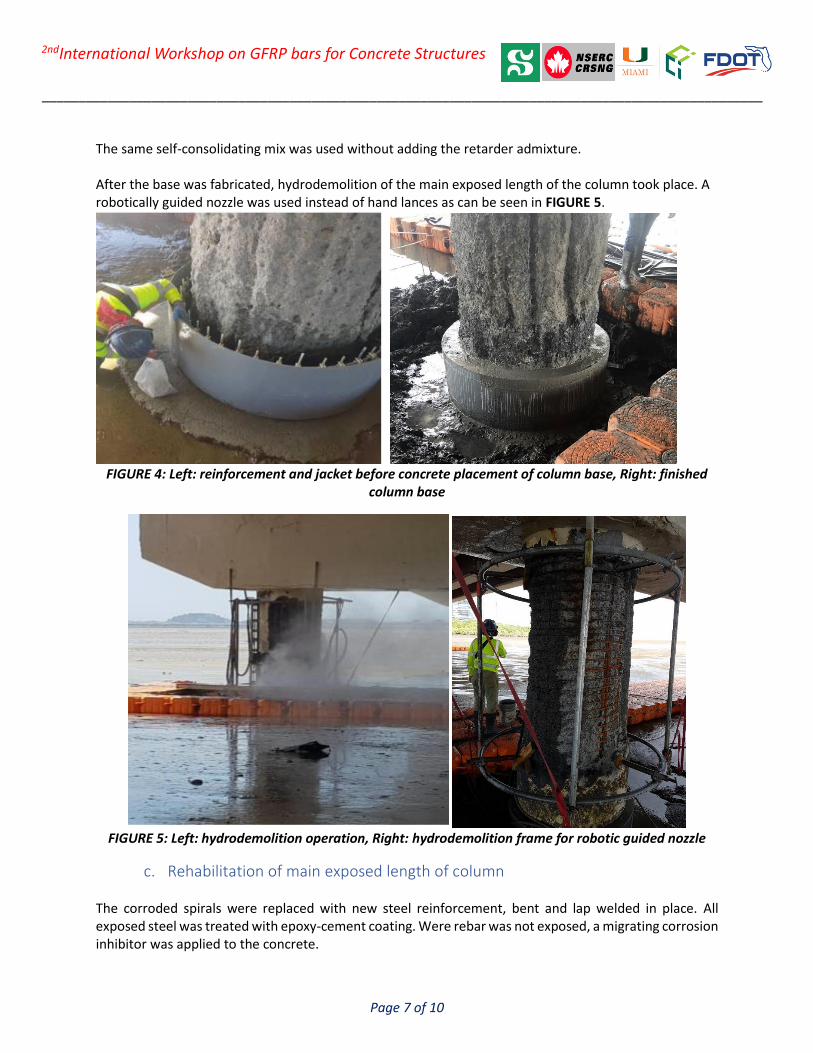
___________________________________________________________________________________________________
Page 7 of 10
2ndInternational Workshop on GFRP bars for Concrete Structures
The same self-consolidating mix was used without adding the retarder admixture. After the base was fabricated, hydrodemolition of the main exposed length of the column took place. A robotically guided nozzle was used instead of hand lances as can be seen in FIGURE 5.
FIGURE 4: Left: reinforcement and jacket before concrete placement of column base, Right: finished
column base
FIGURE 5: Left: hydrodemolition operation, Right: hydrodemolition frame for robotic guided nozzle
c. Rehabilitation of main exposed length of column The corroded spirals were replaced with new steel reinforcement, bent and lap welded in place. All exposed steel was treated with epoxy-cement coating. Were rebar was not exposed, a migrating corrosion inhibitor was applied to the concrete.
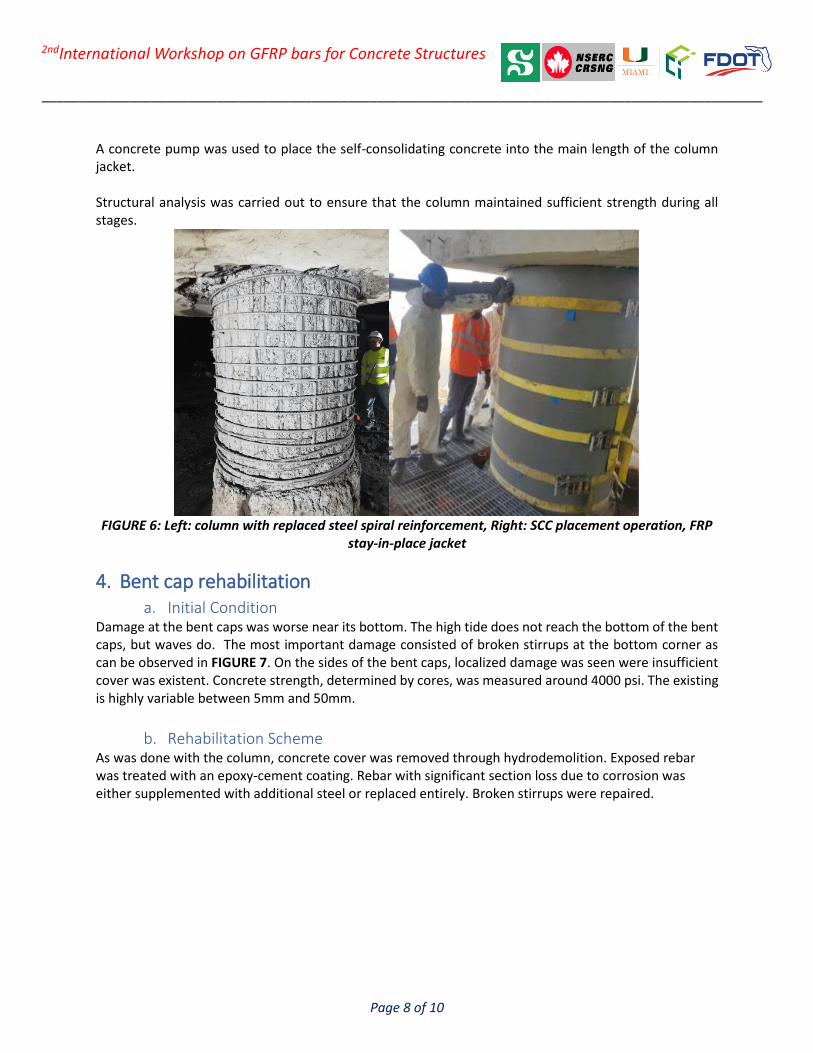
___________________________________________________________________________________________________
Page 8 of 10
2ndInternational Workshop on GFRP bars for Concrete Structures
A concrete pump was used to place the self-consolidating concrete into the main length of the column jacket. Structural analysis was carried out to ensure that the column maintained sufficient strength during all stages.
FIGURE 6: Left: column with replaced steel spiral reinforcement, Right: SCC placement operation, FRP
stay-in-place jacket
4. Bent cap rehabilitation a. Initial Condition
Damage at the bent caps was worse near its bottom. The high tide does not reach the bottom of the bent caps, but waves do. The most important damage consisted of broken stirrups at the bottom corner as can be observed in FIGURE 7. On the sides of the bent caps, localized damage was seen were insufficient cover was existent. Concrete strength, determined by cores, was measured around 4000 psi. The existing is highly variable between 5mm and 50mm.
b. Rehabilitation Scheme As was done with the column, concrete cover was removed through hydrodemolition. Exposed rebar was treated with an epoxy-cement coating. Rebar with significant section loss due to corrosion was either supplemented with additional steel or replaced entirely. Broken stirrups were repaired.
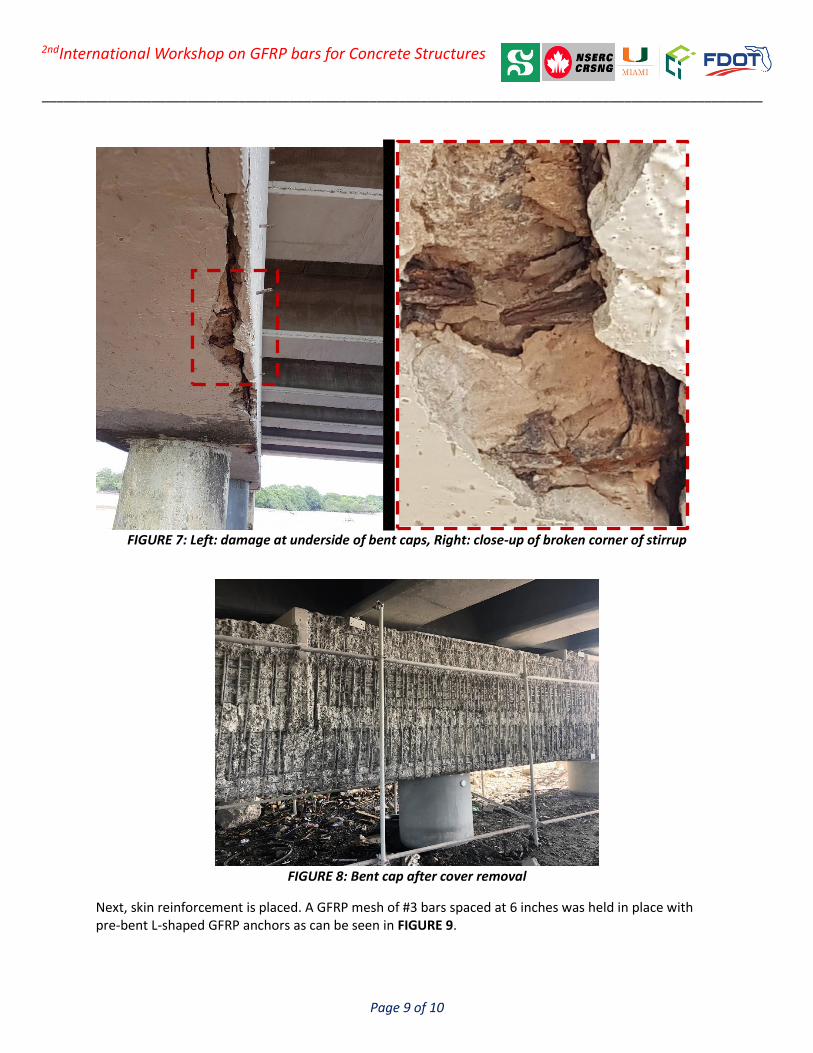
___________________________________________________________________________________________________
Page 9 of 10
2ndInternational Workshop on GFRP bars for Concrete Structures
FIGURE 7: Left: damage at underside of bent caps, Right: close-up of broken corner of stirrup
FIGURE 8: Bent cap after cover removal
Next, skin reinforcement is placed. A GFRP mesh of #3 bars spaced at 6 inches was held in place with pre-bent L-shaped GFRP anchors as can be seen in FIGURE 9.
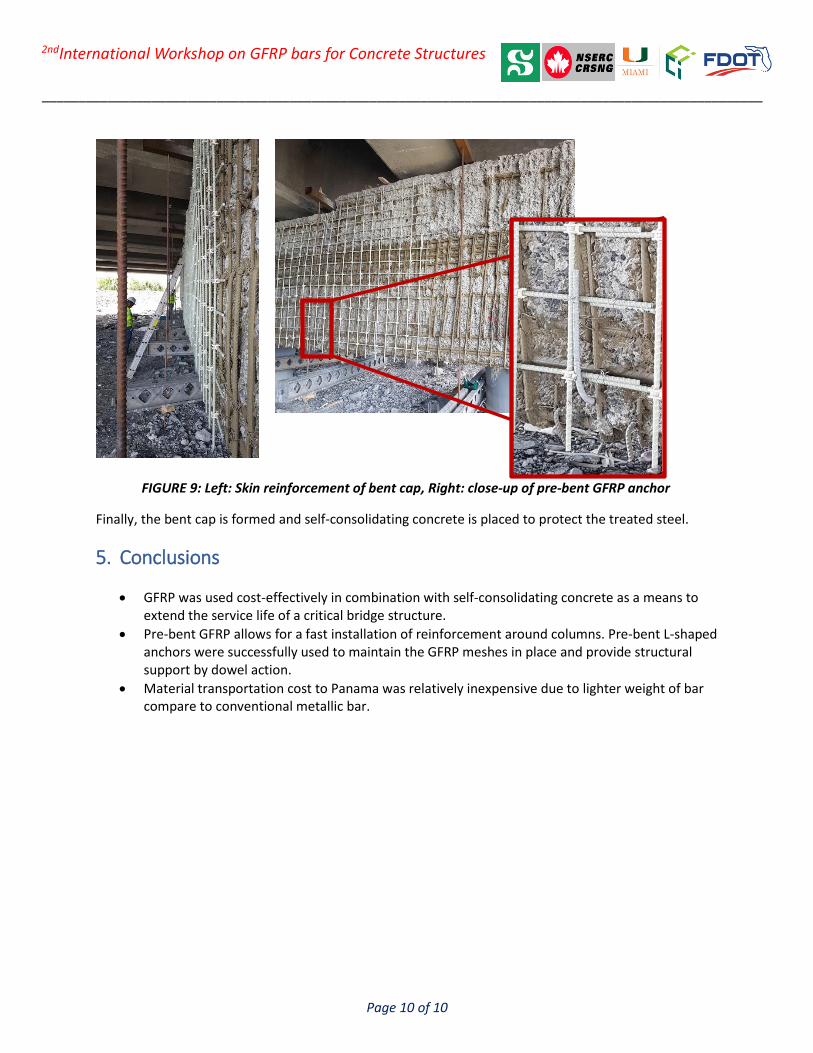
___________________________________________________________________________________________________
Page 10 of 10
2ndInternational Workshop on GFRP bars for Concrete Structures
FIGURE 9: Left: Skin reinforcement of bent cap, Right: close-up of pre-bent GFRP anchor
Finally, the bent cap is formed and self-consolidating concrete is placed to protect the treated steel.
5. Conclusions
• GFRP was used cost-effectively in combination with self-consolidating concrete as a means to extend the service life of a critical bridge structure.
• Pre-bent GFRP allows for a fast installation of reinforcement around columns. Pre-bent L-shaped anchors were successfully used to maintain the GFRP meshes in place and provide structural support by dowel action.
• Material transportation cost to Panama was relatively inexpensive due to lighter weight of bar compare to conventional metallic bar.
___________________________________________________________________________________________________
Page 1 of 4
2ndInternational Workshop on GFRP bars for Concrete Structures (Case Study Papers)
CS-7: Skyway South Rest Area Seawall Rehabilitation
By: Lowry Denty, Steven Nolan, Lisa Propps
1. Introduction This Design-Build project involved rehabilitation of south end bulkhead-seawall, access roads and parking lot, and replacement of rest area buildings and vehicle barriers. Severe corrosion damage of existing concrete bulkhead caps and guardrail sections requiring replacement with more corrosion-resistant solutions. The project team determined GFRP reinforced concrete to be the optimal solution for the replacement of the seawall-bulkhead cap. There was also several hundred feet of extension and raising of the seawall bulkhead utilizing FDOT’s new CFRP/GFRP concrete sheet pile wall standards. Additional work not addressed in this case study includes replacement and updating of adjacent Rest Area buildings does not involved GFRP reinforcing.
2. Project Overview At the South Rest Area Site, the existing seawall cap and handrail was raised between 1 to 2 feet by extending the concrete cap upward. The seawall was also extended southward 285’ from the end of the existing seawall using cantilever precast concrete sheet piles and concrete cap. The total seawall improvements and extension at this site is approximately 1125 feet. At the Fishing Pier Road and ITS sites, approximately 3650 ft of concrete cap was removed and replaced with a new concrete cap on the existing seawall. Another 1680 ft of concrete cap was repaired and sealed for a total of 5330 ft of improvements. Metallic reinforcement was not permitted for this project per the Request for Proposal contract procurement documents. Non-metallic reinforcement was used for the new caps, extension and precast concrete sheet piles meeting the design criteria and specification requirements of the Fiber Reinforced Polymer Guidelines (FRPG) in Volume 4 of the FDOT Structures Manual.
3. Condition of Existing Structures The existing seawall cap along fishing pier road was constructed at various times. The oldest portion was constructed in the 1950s and the newer portion was constructed in the 1980s. Different conditions exist for the different aged caps. The older cap has severe corrosion and spall conditions (see FIGURE 1) and the newer cap has minor cracks and spalls. An Alternative Technical Concept (ATC) was submitted and accepted to replace and/or repair based on the condition of the cap. Based on the assessment the 1950s portion of cap was to be completely replaced and the 1980s portion of cap to be repaired. The repairs consist of patching all spalled concrete, pressure injection of epoxy into the cracks 0.02-inches and greater, then applying a penetrant sealer to the entire cap.
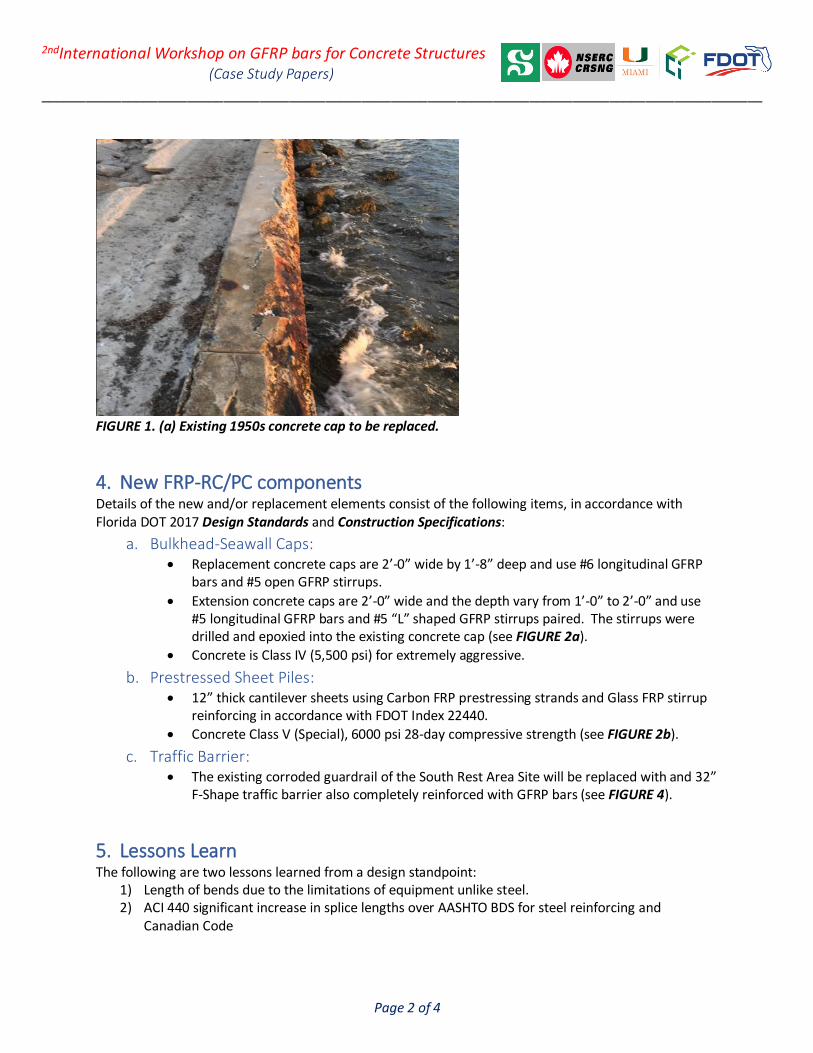
___________________________________________________________________________________________________
Page 2 of 4
2ndInternational Workshop on GFRP bars for Concrete Structures (Case Study Papers)
FIGURE 1. (a) Existing 1950s concrete cap to be replaced.
4. New FRP-RC/PC components Details of the new and/or replacement elements consist of the following items, in accordance with Florida DOT 2017 Design Standards and Construction Specifications:
a. Bulkhead-Seawall Caps: • Replacement concrete caps are 2’-0” wide by 1’-8” deep and use #6 longitudinal GFRP
bars and #5 open GFRP stirrups.
• Extension concrete caps are 2’-0” wide and the depth vary from 1’-0” to 2’-0” and use #5 longitudinal GFRP bars and #5 “L” shaped GFRP stirrups paired. The stirrups were drilled and epoxied into the existing concrete cap (see FIGURE 2a).
• Concrete is Class IV (5,500 psi) for extremely aggressive.
b. Prestressed Sheet Piles: • 12” thick cantilever sheets using Carbon FRP prestressing strands and Glass FRP stirrup
reinforcing in accordance with FDOT Index 22440.
• Concrete Class V (Special), 6000 psi 28-day compressive strength (see FIGURE 2b).
c. Traffic Barrier: • The existing corroded guardrail of the South Rest Area Site will be replaced with and 32”
F-Shape traffic barrier also completely reinforced with GFRP bars (see FIGURE 4).
5. Lessons Learn The following are two lessons learned from a design standpoint:
1) Length of bends due to the limitations of equipment unlike steel. 2) ACI 440 significant increase in splice lengths over AASHTO BDS for steel reinforcing and
Canadian Code
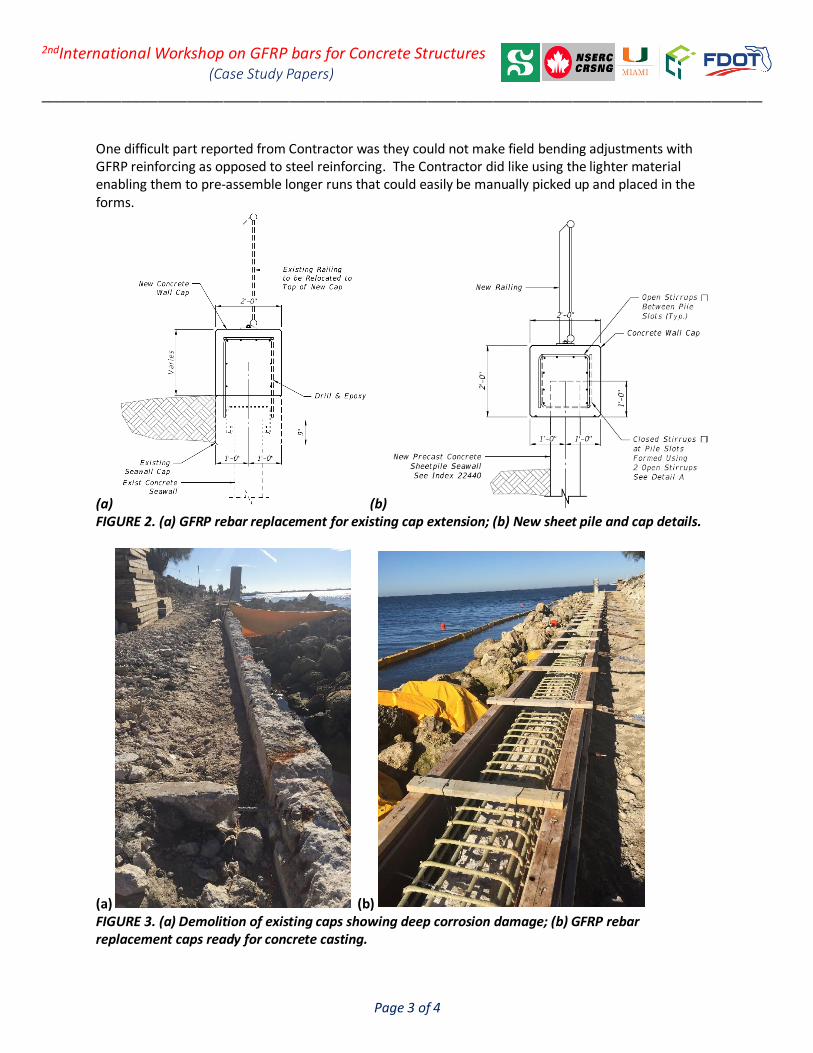
___________________________________________________________________________________________________
Page 3 of 4
2ndInternational Workshop on GFRP bars for Concrete Structures (Case Study Papers)
One difficult part reported from Contractor was they could not make field bending adjustments with GFRP reinforcing as opposed to steel reinforcing. The Contractor did like using the lighter material enabling them to pre-assemble longer runs that could easily be manually picked up and placed in the forms.
(a) (b) FIGURE 2. (a) GFRP rebar replacement for existing cap extension; (b) New sheet pile and cap details.
(a) (b) FIGURE 3. (a) Demolition of existing caps showing deep corrosion damage; (b) GFRP rebar replacement caps ready for concrete casting.

___________________________________________________________________________________________________
Page 4 of 4
2ndInternational Workshop on GFRP bars for Concrete Structures (Case Study Papers)
FIGURE 4. GFRP-RC traffic barrier to replace existing guardrail and provide additional wave splash protection to the Fishing Pier access road.
FIGURE 5. (a) Completed GFRP-RC cap on existing sheet piles
Copyright © 2022 FDOKUMEN