
Project 1-5 combined
71
1 CHAPTER ONE INTRODUCTION 1.1 BACKGROUND TO THE STUDY According to Adeyemi (2006), the banking sector of any country is the engine of growth given its function of financial intermediation. Through this function, the banks facilitate capital formation, lubricate the production engine turbines and promote economic growth. The banking sector is also considered important as it is one of the few sectors in which the shareholders fund is only a small proportion of the liabilities of the enterprise. The volatile nature of this sector makes it a high risk environment which demands close monitoring to be able to perform effectively and efficiently (Owojori, Akintoye & Adidu, 2011). Credit Management can be viewed as written guidelines that set the terms and conditions for supplying goods on credit, customer qualification criteria, procedure for making collections, and steps to be taken in case of customer delinquency. Pandey (2004) submitted that credit is a marketing tool for expanding sales. Credit sales to customers however, must be well monitored because regardless of an organizations share of the market and demand for its products, if there are no measures put in place to regulate sales made to customers on credit, there could be problems especially those related to liquidity. Liquidity is cash, it is the ability of company to meet its financial obligations as when due. Liquidity ratios are used for liquidity management in every organization in the form of current ratio, quick ratio and Acid test ratio that greatly affect on performance of organization. Liquidity and its management determines to a great extent the growth and profitability of a firm. This is because either inadequate liquidity or excess liquidity may be harmful to the smooth running of the organization. This seeming controversy has attracted a lot of interest in the subject
-
Upload
independent -
Category
Documents
-
view
2 -
download
0
Transcript of Project 1-5 combined

1
CHAPTER ONE
INTRODUCTION
1.1 BACKGROUND TO THE STUDY
According to Adeyemi (2006), the banking sector of any country is the engine of growth given
its function of financial intermediation. Through this function, the banks facilitate capital
formation, lubricate the production engine turbines and promote economic growth. The banking
sector is also considered important as it is one of the few sectors in which the shareholders fund
is only a small proportion of the liabilities of the enterprise. The volatile nature of this sector
makes it a high risk environment which demands close monitoring to be able to perform
effectively and efficiently (Owojori, Akintoye & Adidu, 2011).
Credit Management can be viewed as written guidelines that set the terms and
conditions for supplying goods on credit, customer qualification criteria, procedure for
making collections, and steps to be taken in case of customer delinquency. Pandey (2004)
submitted that credit is a marketing tool for expanding sales. Credit sales to customers however,
must be well monitored because regardless of an organizations share of the market and
demand for its products, if there are no measures put in place to regulate sales made to
customers on credit, there could be problems especially those related to liquidity.
Liquidity is cash, it is the ability of company to meet its financial obligations as when
due. Liquidity ratios are used for liquidity management in every organization in the form of
current ratio, quick ratio and Acid test ratio that greatly affect on performance of organization.
Liquidity and its management determines to a great extent the growth and profitability of a firm.
This is because either inadequate liquidity or excess liquidity may be harmful to the smooth
running of the organization. This seeming controversy has attracted a lot of interest in the subject

2
of liquidity management.(Egbide, Olubukunola & Uwalomwa, 2013).A company rich in fixed
assets may still be short of cash and therefore have difficulty in meeting current
obligations. Liquidity is the ability of the firm to convert assets into cash. It is also called
marketability or short-term solvency. The liquidity of a business firm is usually of particular
interest to its short-term creditors since the liquidity of the firm measures its ability to pay
those creditors. Several financial ratio measure the liquidity of the firm. Those ratios are the
current ratios, the quick ratio or acid test, net working capital, and the interval measure or
the burn rate. The impact of liquidity position in management of financial institution and other
economic unit have remained fascinating and intriguing, though very elusive in the process of in
investment analysis visa- visa bank port folio management.
The objective of this study is to empirically examine the impact of credit management and
liquidity position for Nigerian banking sector on its performance.
1.2 STATEMENT OF RESEARCH PROBLEM
The banking sector plays an important role in the economy of any nation. Every bank should be
able to keep an appropriate level of working capital. If the bank does not keep this level, it
affects performance (Bhunia & Brahma, 2011).Without cash, the bank will be in trouble and its
going concern will be in doubt.
Business analysts report that poor management is the main reason for business failure. It can be
argued that many banks in Nigeria went into liquidation because of poor credit management.
The inability of bank management to effectively address and manage credit has contributed to
the problem of bank failure.

3
This research aims at ascertaining the effect of credit management and liquidity position on bank
performance studying the credit management system of Nigerian banks and the various ways in
which they can be managed.
1.3 OBJECTIVES OF STUDY
The major aim of this research work is to evaluate the effect of credit management and liquidity
position on bank performance. The following are the specific objectives:
1.) To find out if credit management system allows for effective bank performance.
2.) To find out if there is a significant relationship between the liquidity and performance of
banks in Nigeria.
1.4 RESEARCH QUESTIONS
This research aims to provide answers to the following questions:
1.) Does credit management allow for effective bank performance?
2.) Is there a relationship between liquidity and performance?
1.5 RESEARCH HYPOTHESES
For this purpose of this study, the following hypothesis will be tested
Hypothesis 1
Ho - Credit management does not affect the performance of banks in Nigeria.
H1 – Credit management affects the performance of banks in Nigeria.

4
Hypothesis 2
H0 – There is no relationship between liquidity and bank performance.
H1 – There is a relationship between liquidity and bank performance.
1.6 SIGNIFICANCE OF STUDY
The significance of this study cannot be over emphasized especially now that the banking sector
is facing heat of Emefiele‟s banking reforms. Its significance among others is to add to the
general body of knowledge, enlighten the general public and shareholders on the effect of credit
management and liquidity position on performance of banks in Nigeria.
This study also seeks to explain to bank officials, what is involved in adoption of an efficient and
effective credit management.
This research work will be of great benefits to all stakeholders in the society. These people are:
Financial Analysts: This research will provide them with relevant areas from which liquidity of
firms can be analyzed. It will enlighten them on benefits of liquidity management ,its constraints
and limitations.
Bank Managers and Officials: This research will help enlighten bank performance about the
role and importance of credit management and help them understand how to effectively manage
credit.
Accountants and Auditors: This research could help provide accountants and auditors with
added knowledge on credit management as it could it be helpful when auditing and preparing
final accounts.
Researchers: This research work could be used by other people who wish to embark upon a
further research on the topic and related topics.

5
Investors: This research will provide them with what to look out for in companies financial
statements before deciding whether to invest or not. It will enlighten them on appropriate
financial ratios to use in detecting the liquidity level of companies.
Students: This research will help educate students on the concept of credit management and
liquidity and its components.
The General Public: This research could help educate the general public on credit management,
liquidity and bank performance.
1.7 SCOPE OF STUDY
The study will focus on the general impact of credit management and liquidity position on bank
performance, that is, how can credit management and liquidity position improve or reduce the
performance of banks.
Due to the amount of banks in Nigerian Stock Exchange, the research work was limited to the
fifteen listed banks in Nigeria. The above listed banks were chosen on the Nigerian Stock
Exchange due to ease of access of information.
1.8 LIMITATIONS OF STUDY
Time: Time constraints were one of the limitations encountered in the case of the study. The
time given for this research was too short due to the research work carried out during an
academic session, and the researcher did not have enough time to properly concentrate on this
particular study.
Finance: Finance was yet another problem that put a hold on the research work.

6
Lack of Facilities: Research facilities such as transportation make research easy and interesting.
But the researcher was not able to utilise this factor due to his distance from home and school.
Finally there was the problem of inadequate information and unavailable material or information
for the study.
1.9 SUMMARY OF RESEARCH METHODOLOGY
According to Business Dictionary (2012), it defined research methodology as the process used
to collect information and data for the purpose of making business decision. The methodology
may consist of publications, research works, journals and other online articles, and could
include both present and historical information that would be considered relevant to this study.
The research design of this strictly is strictly focused on the importance of credit management
and liquidity position on the Nigerian bank performance.
1.10 SOURCES OF DATA
There are two basic sources of data; primary and secondary data (Ojo 2005).Primary data refer
to data collected explicitly for a specific purpose .They are collected through the distribution of
questionnaires, coordination of interviews and direct observation and experiments.
Secondary data on the other hand, include government publications, syndicated services and
publications of international government (Ojo 2005). Others include articles, journals,
newspapers, magazines, internet and other published research works.
However, for the purpose of this research, the researcher made use of secondary data.

7
1.11 DEFINITION OF TERMS
For the purpose of this research the following words should be taken in order to enhance
understanding:
Credit Management: According to investorsword.com, credit management is a function
formed within a company to improve and control credit policies that will lead to an increase in
revenue and lower risk related to lending, reducing credit costs, extending more credit to
customers who they have assumed to have the capacity to repay back loans or grants to him, and
developing competitive credit terms and it is also called credit control.
Credit: According to mapsofworld.com, a credit is a legal contract where one party receives
wealth or resource from another party and promises to repay him on a future date along with
interest. In other words, a credit is an agreement of postponed or delayed payment of goods
bought or loan obtained and with the issuance of a credit, a debt is formed or created.
Liquidity Position: The liquidity position of a company is an ability to convert an asset into
cash quickly. The degree to which an asset or security can be bought or sold in the market
without affecting its price.
Liquidity Management: Liquidity management is the efficient control of current assets such as
stocks and converting it to cash in order to meet and pay current obligations of business, include
operating and financial expenses that are short term but maturing long term debt.
Bank: Bank can be defined as a financial house or a business responsible for keeping money for
individuals, make loans and offer other financial services or advice.
Credit Analysis: Credit analysis is concerned with the determination of the ability and
willingness of a borrower to repay a requested loan in accordance with the terms of the loan.
Credit Policy: It is a set of principles that a financial organization or business uses in deciding

8
who it will loan money to or give credit.
Risk: According to businessdictionary.com, it defined as risk a probability or threat for damage
to occur, injury, liability, loss or any other negative occurrence that is caused by external or
internal circumstances, and that may be avoided through intended action.
Credit Risk: Is the risk of loss due to a debtor‟s non-payment of a loan or other line of
credit (either the principal or interest).
Debt: According to investorswords.com, it defined debt as amount owed to a person or
organization for funds borrowed. Debt can be represented by a loan note, bond, mortgage
or other form stating repayment terms and, if applicable, interest requirements.
Profitability: This refers to the measure of returns on investment.
Financial Performance : Financial performance is the company‟s ability to generate new
resources from day to day operations over a given period of time.
Non–Performing loans: A sum of borrowed money upon which the debtor has not made
his or her scheduled payments for at least 90 days. A nonperforming loan is either in
default or close to being in default.
Performing loans: Loan on which payments of interests and principal are less than 90
days past due.
Obligor: A person or entity who is legally or contractually obliged to provide some
benefit or payment to another.

9
CHAPTER TWO
LITERATURE REVIEW
2.0 INTRODUCTION
In pursuance of this study “Credit Management and Liquidity Position on the performance of
banks”. This chapter aims at gathering some of the available information on this matter in order
to have an insight into what Credit management and Liquidity Position on the performance of
banks is all about.
Credit Management can be viewed as written guidelines that set the terms and conditions for
supplying goods on credit, customer qualification criteria, procedure for making collections, and
steps to be taken in case of customer delinquency. Pandey (2004) submitted that credit is a
marketing tool for expanding sales. Credit sales to customers however, must be well monitored
because regardless of an organizations share of the market and demand for its products, if there
are no measures put in place to regulate sales made to customers on credit, there could be
problems especially those related to liquidity. However, Liquidity is cash, it is the ability of
company to meet it financial obligations as when due. A company rich in fixed assets may still
be short of cash and therefore have difficulty in meeting current obligations. Liquidity is the
ability of the firm to convert assets into cash. It is also called marketability or short-term
solvency. The liquidity of a business firm is usually of particular interest to its short-term
creditors since the liquidity of the firm measures its ability to pay those creditors. Several
financial ratio measure the liquidity of the firm. Those ratios are the current ratios, the quick
ratio or acid test, net working capital, and the interval measure or the burn rate. The objective of

10
this study is to empirically examine the impact of credit management and liquidity position fo
Nigerian banking sector on its performance.
Pandy (2002) saw trade credit as a short term source of finance. He also said that, it is the credit
that a customer gets from a supplier of goods in the normal course of a business. Therefore, it is
mostly an informal arrangement between the supplier and the buyer as no legal documents are
signed. Pandy (2002), pointed out that trade credit may also take the form of bills payable. This
happens when the buyer signs a bill – a negotiable instrument to obtain trade credit of which in
his balance sheet, it appears as bills payable and it is said to be formal since a bill is a formal
acknowledgement of an obligation to repay an outstanding amount.
To supplier, any trade credit granted to a customer appears as account receivable, sundry debtors,
bills receivable depending on the one that is applicable.
The position of a company is an ability to convert an asset into cash quickly. The degree to
which an asset or security can be bought or sold in the market without affecting its price.
According to Anyanwu (1993) liquidity simply means the ability to convert an asset to cash with
minimum delay and minimum loss/cost. In the portfolio of listed banks, liquidity assets play a
very crucial role because banks operate largely with the funds borrowed from depositors in form
of demand and time deposits. These liquidity assets are the essential balance sheet items which
have the capacity to maintain the confidence of depositors which is the most valuable intangible
asset of the listed banking business (Spindt, 1980).
According to Nwankwo (1991), adequate liquidity enables a bank to meet three risks. First is the
funding risk – the ability to replace net outflows either through withdrawals of retail deposits or
nonrenewal of wholesale funds. Secondly, adequate liquidity is needed to enable the bank to

11
compensate for the non-receipt of inflow of funds if the borrower or borrowers fail to meet their
commitments. The third risk arises from calls to honour maturity obligations or from request for
funds from important customers.
Adequate enables the bank to find new funds to honour the maturity obligations such as a sudden
upsurge in borrowing under atomic or agreed lines of credit or to be able to undertake new
lending when desirable. For instance a request from a highly valued customer.
Adequate liquidity is also needed to avoid forced sale of asset at unfavourable market conditions
and at heavy loss. Adequate liquidity serves as vehicle for profitable operations especially to
sustain confidence of depositors in meeting short run obligations. Finally, adequate liquidity
guides against involuntary or non-voluntary borrowing from the regulatory authorities where
there is a serious liquidity crisis, the bank is placed at the mercy of the Central Bank, and hence
the control of its destiny may be handed over.
Having adequate or sufficient liquidity to meet all commitments at all times at normal market
rates of interest is indispensable for both large and small banks (Nwankwo, 1991). Liquidity is
the life blood of a banking setup. The ability of banks to meet their financial obligation is usually
measured by examining their balance sheet and relating same to its current assets to some or all
of their current liabilities. Fundamentally, a firm‟s liquidity rests not so much on its balance
sheet as on whether or not it is doing well and earning money. A strong balance sheet with a
large current ratio simply postpones liquidity problems for a short while if the firm is losing
money. Therefore, the complexity of devising an appropriate measure arises from the
uncertainties surrounding both size of the prospective needs for liquidity at any given time, and
the availability of sources of liquidity sufficient to meet them. There is also the impact of active
asset and liability management on liquidity management.

12
An accurate measurement of liquidity therefore requires going beyond the technical liquidity
indicated by the stock flow approach to an assessment of the stock of circumstances under which
a bank could come under pressure likely to affect worthiness in the market place. Liquidity can
be measured either as a stock at a point in time or as a flow over time. The most widely used is
the stock approach. One of these is the loan/deposit ratio which is the most popular and
commonly used measure in commercial banking.
According to Nwankwo (1991), under this measure, all bank loans are lumped together on the
basis that they are the most liquid of all bank assets. These are then compared with the total
deposit as a proxy for the liquidities that banks could be called upon honour. An increase in the
ratio indicates a less liquid position and vice versa.
2.1 CONCEPTUAL FRAMEWORK
Practically almost everything which has been written in the vast macro-economic literature has
some direct or remote connection with liquidity, this reflect its importance as a factor investment
decision and the concomitant effect on economic growth. A review of relevant literature is
ranged on the examination of related factors such as the conceptual framework review of
variable, current model and theories of the subject matter as incorporated into the wider scope of
banking.
Consequently the relationship between different parameters influencing the role liquidity
management is also examined under the conceptual framework. A review of related valuable
affecting the subject matters is looked into with eventual determination of which ones are more
relevant.

13
2.1.1 The Concept of Liquidity and Liquidity Management
Liquidity is the ability of a company to meet the short term obligations. It is the ability of the
company to convert its assets into cash. Short term, generally, signifies obligations which mature
within one accounting year. Short term also reflects the operating cycle: buying, manufacturing,
selling, and collecting.
Liquidity is a financial term that means the amount of capital that is available for investment.
Today, most of this capital is credit, not cash. Bank Liquidity simply means the ability of the
bank to maintain sufficient funds to pay for its maturing obligations. It is the bank‟s ability to
immediately meet cash, cheques, other withdrawals obligations and legitimate new loan demand
while abiding by existing reserve requirements. Nwaezeaku (2008) defined liquidity as the
degree of convertibility to cash or the ease with which any asset can be converted to cash (sold at
a fair market price).
Liquidity management therefore involves the strategic supply or withdrawal from the market or
circulation the amount of liquidity consistent with a desired level of short-term reserve money
without distorting the profit making ability and operations of the bank. It relies on the daily
assessment of the liquidity conditions in the banking system, so as to determine its liquidity
needs and thus the volume of liquidity to allot or withdraw from the market. The liquidity needs
of the banking system are usually defined by the sum of reserve requirements imposed on banks
by a monetary authority (CBN, 2012).
2.1.2 Liquidity and Business Decisions
Liquidity position could be understood by analysing the financial statements of a company.
Following financial items are required to understand the liquidity position of a company:

14
Current Assets
Current Liabilities
Liquidity position of a company can examined through financing decisions or investment
decisions. A company can finance its investment by different combination of current and long
term sources. In other words, a company can invest the money, raised through short term source
or long term sources, in the current assets or non-current assts. Some of the relevant business
strategies are as follows:
Financing the current assets by current sources
Financing the current assets by the long term sources
Financing non-current assets by the short term sources
Financing non-current assets by long term sources
2.1.3 Liquidity Position Indicators
There are several benefits from having an effective liquidity management strategy but there are
also some severe implications of misjudging the firms liquidity needs such as risk of bankruptcy
(Richards & Laughlin, 1980).
Generally current ratio, liquid ratio, absolute liquid ratio, debt-equity ratio, age of inventory, age
of debtors, age of creditors, cash to average daily cost of sales (in days),operating cash flow to
sales are very useful in ascertaining the short term debt paying ability or liquidity of a firm.
For measuring liquidity position, appropriate level of short term liquidity is required with whom
comparison can be made :
Liquidity position based on current ratios
Current Ratio

15
One of the most common and also the oldest measure of corporate liquidity is current ratio. It
was developed at the end of the 19th century in order to evaluate the credit-worthiness of the
companies (Beaver, 1966:71). In its simplicity it expresses the liquid resources available when
current liabilities are met and is calculated as follows:
Current Ratio = Current assets
Current liabilities
Maness & Zietlow (2005:27) has expressed that historically a current ratio of 2.0 has been a
norm, meaning that company has approximately twice as much current assets as coverage for
short term creditors. As the critique towards this measure often goes, it simplifies the protection
available for short-term creditors as not all the current assets are easily liquidated but can be tied
in the inventory.
Liquidity position based on quick ratio
Quick Ratio
Quick ratio or acid-test ratio is very similar to current ratio and solves the liquidation issues
mentioned above by excluding inventories from calculation:
Quick ratio (or acid-test ratio) = (Current assets-Inventory)
Current Liabilities
Usefulness of current and quick ratios for measuring working capital has been questioned
because of their static nature. As a balance sheet is a statement of stock instead of flows with the
result that ratios calculated from balance sheet accounts are liquidity stock measures at a certain
point in time. (Penman, 2007:725)

16
Liquidity position based on inventory to net working capital
Inventory to net working capital = Inventory
(Current assets - Current Liabilities)
A measure of the extent to which the firm's working capital is tied up in inventory.
Liquidity position based on working capital
Working capital plays an important role in firm‟s growth and profitability and is tightly
interlinked with the concept of liquidity. In its simplest and probably the most common form
working capital can be expressed as a difference between firm‟s current assets and current
liabilities. ( Larsson & Hammarlund, 2005:14).
Net Working Capital = Current Assets – Current Liabilities
Shin and Soenen have defined working capital as a “time lag between the expenditure for the
purchase of materials and the collection for the sale of the finished products” (Shin & Soenen,
1998). Working capital management (WCM) refers to a wider concept that covers both inventory
and work in progress and thereby combining elements of operations, production and financial
management.
Up to date several other measures are used in addition to current ratio and quick ratios. On the
other hand, even the importance of ratio analysis has been questioned and considered as a weak
tool for monitoring liquidity. According to Campbell, Johnson and Savoie‟s study (in Maness &
Zietlow 2005:32), monitoring of accounts receivables and good bank relations are valued over
the traditional ratio analysis among the financial managers. A common practice is to combine
several methods and use ratios as a part of liquidity management, but not rely solely on them.
(Maness & Zietlow, 2005:32)

17
There are several factors that need to be taken into consideration when doing ratio analysis.
Among the first conditions for ratio analysis is the good quality of accounting data which is a
natural premise since the analysis relies exclusively on financial statements (Beaver, 1966:99).
One of the earliest critiques towards ratios was concerned with the comparison among different
industries and groups of companies. As a response for that, several industry averages and means
have been developed ever since (Patricia, Harper & Eikner, 1999:96). Discussion around the
ratio analysis has been vivid and still ongoing and the latest studies remind the danger of using
benchmark values across the industries.
Huff, et al. (1999:104) found evidence of differences in liquidity ratios when different size of
companies compared. They put forward an argument that companies with little or no inventory
tend to have lower current ratios since their current assets are smaller. Another finding suggested
that current liabilities exceeded current assets, i.e. negative working capital balance, more often
among the small than larger companies (Huff et al. 1999:100-101). Smaller companies have
more extreme current ratio values (both very low and very high) than larger companies and
therefore the comparison of current ratios among larger companies is more meaningful since
there is likely to be less variation.
Also very common use of the ratios is the prediction of failure or financial distress. One of the
first studies about the bankruptcy prediction based on ratio analysis was conducted by Beaver in
1966 and his findings are still considered valid. He compared financial ratios of the companies
that went bankrupt with those that did not and found evidence that carefully conducted ratio
analysis can be a useful predictor of financial failure even five years prior to failure. As the
bankruptcy became more evident, the difference in ratios became also clearer, comparing to
surviving counterparts. (Beaver, 1966:102) The extent that Beaver used ratios in his analysis was

18
much higher than the aim of the current study. Focus is neither in the bankruptcy prediction but
on the differences in liquidity strategies and that is partly done by examining the use of liquidity
ratios. However, Beaver‟s findings hold 40 years later and well conducted ratio analysis is
considered a guiding tool to monitor liquidity and also financial performance and therefore ratio
analysis is very essential.
In summary, current and quick ratios have been traditionally most widely used tools monitoring
corporate liquidity. External users such as credit issuers have used them as measure for
evaluation companies credit-worthiness, whereas internal users have monitored how working
capital policy is executed inside the company. Usefulness of ratio analysis is questioned time to
time and one has to be careful when comparing companies across industries.
2.1.4 Concept of Credit Management
Credit (from Latin credere translation. "to believe") is the trust which allows one party to
provide resources to another party where that second party does not reimburse the first party
immediately (thereby generating a debt), but instead arranges either to repay or return those
resources (or other materials of equal value) at a later date. The resources provided may be
financial (e.g. granting a loan), or they may consist of goods or services (e.g. consumer credit).
Credit encompasses any form of deferred payment. Credit is extended by a creditor, also known
as a lender, to a debtor, also known as a borrower.
Credit does not necessarily require money. The credit concept can be applied in barter economies
as well, based on the direct exchange of goods and services. However, in modern societies, credit
is usually denominated by a unit of account. Unlike money, credit itself cannot act as a unit of

19
account. firms grant credit to their credit worthy customers, invariably we have accepted the
existence of debtors. In other words, granting of credit leads to creation of trade debts in business
which can be further classified into good debts, doubtful and bad debts. Management of debtors
is crucial in the management of working capital because poor management of trade debt can lead
to the provision of large sum of funds for bad and doubtful debts.
According to Pandey (2004), bad debt losses arise when the firm is unable to collect its accounts
receivable. The size of bad debt losses depends on the quality of accounts accepted by the firm.
In the words of Uchegbu (2001), it is wise to discourage bad debts and efforts should be made to
encourage discount more importantly cash discount. This is contrary under competitive business
environment were survival depends on the volume of turnover (sales) which in turn leads to trade
debt accumulation. Here debtors cannot be completely avoided it is therefore the work of the
management to initiate policies concerning credit sales so that they will survive in the business
environment they find themselves.
In the words of Donald and Penne (1987: 110), debtors or accounts receivable in a firm are
claims held against others in the operating circle. Trade debtors are further classified into trade
debtors and non-trade debtors. The amount which is owed by customers for goods and services
sold in the course of carrying on a business is termed trade debtors while on the other hand any
amount owed by customers arising from a variety of transitions that are oral or written promises
to pay other than goods at a later date is called non-trade debtors. Studies have shown that in the
period of boom (economic boom) customers tend to make cash purchases, pay their debts on
time and minimize the incidence of bad debts. On the other hand, the period of economic
recession is another situation. The uncertainty, which befalls the repayment of such debts, has

20
made the transactions to be based on customers‟ integrity, trust worthiness and his or her ability
to satisfy other conditionalities as placed by the selling organization.
2.1.5 Reasons for Granting Credit
Competition
Generally the higher the degree of competition, the more the credit granted by a firm (Pandey,
2004).
Company's bargaining power
If a company has a higher bargaining power vis-a-vis its buyers, it may grant no or less credit.
Marketing tool
Credit is used as a marketing tool, particularly when a new product is launched or which a
company wants to push its weak product.
Buyers requirements
In a number of business sectors buyers/dealers are "not able to operate without extending credit.
This is particularly so in the case of industrial products.
Buyers status
Large buyers demand easy credit terms because of buck purchases and higher bargaining power.
Some companies follow a policy of not giving much credit to small retailers since it is quite
difficult collect dues from them.

21
Relationship with dealers
According to Pandey (2004) companies sometimes extend credit to dealers to build long-term
relationship with them or to reward them for their loyalty.
Efficient credit sales management is necessary for achieving liquidity and profitability of a
company (Reddy and Kameswarri, 2004).
2.1.6 Efficient and Effective Credit Policy
According to Pandey (1993: 726), he opined that a firm's investments in receivables are effected
by some external factors such as the general economic conditions: - Industry norms, competitive
activities, political regulations and Technological change. But for effective management of trade
debt, firms should lay down guidelines and procedures for granting credit to individual‟s
customers and collecting the individual accounts.
Management naturally want to make efficient use of the available capital in the business and is
also interested in rapid turnover of accounts. Given the circumstance, a firm should formulate a
policy suitable for the firm and the commercial environment upon which credit sales will be
based. There are three major credit policy variables (factors) Rama Moorthy (1976:183) V12:
Credit Standards
According to Pandey (1993.726), credit standards are the criteria, which a firm follows in
selecting customers for the purpose of credit extension. He further reiterated that a firm may
have light
credit standards, that is, it may sell mostly on cash basis as may extend credit only to the most
reliable and financially strong customers. The implication of the above policy are many, for

22
instance, it will result to less bad debt losses and cost of credit administration. But such a firm
adopting the policy may not be able to expend sales. That is, the profit sacrificed on lost sales
may be more than the cost saved by the firm on the contrary, if credit standards are loose, the
firm may have large sales volume. But the firm will have to carry large receivables (debtors).
The cost of administering credit and bad debts losses will also increase, thus, the choice of
optimum credit standards involves a trade-off between incremental return and incremental cost.
Weston and Brigham (1986: 251), they enumerated the different types of cost associated with
credit sales. Such as:
(i) Cost of capital tied up in receivables (debtors),
(ii) Bad debts,
(iii) Higher investigation,
(iv) Collection cost.
According to Solomon and Pringle (1977: 201), they state that, the firm's credit policy will be
determined by the trade-off between opportunity cost and credit administration cost including
bad debts losses. In the words of Brain (1981), the objective of credit control is to strike a correct
balance between incremental return and incremental cost.
Credit Terms
These are stipulations under which the firm sells on credit to customers. They include: credit
period and cash discount.
Credit period refers to the length of time for which credit is extended to customers. Cash
Discount is a reduction in payment offered to customers to induce them to repay credit

23
obligations within a specified period of time, which will be less than the normal credit period. It
is usually expressed as a percentage of sales.
Collection Policy and Procedures
Collection policy is necessary for effective and efficient management of credit sales because
customers usually default in paying their debt as at when due, that is with reference to the terms
of credit. The collection policy aims at accelerating collection from slow-payers and thus
reducing incidence of Bad debts losses. Credit limit is the maximum amount of credit which the
firm will extend at a point of firm. Once the firm has taken a decision to extend credit to the
applicant, the amount and duration of the credit have to be decided. A collection policy should
ensure prompt and regular collection. Prompt collection is needed for fast turnover of working
capital, keeping collection costs and bad debts within limits and maintaining collection
efficiency. Regularity in collections keeps debtors alert, and they tend to pay their dues
promptly.
Some firms usually adopt a clear-sequence to collect the debt after the expiration of the normal
credit period granted to the customers; Firms may send a polite letter to the customers (as
reminder). A more severe letter will follow this afterwards. Other strategies may be the use of
telephones and personal visit by a company's representative. If all the above strategies fail, the
firm may resort to the use of collection agency and others such as legal action, etc. The result
will be a shift of loyalty and patronage to competitors and huge sales may be lost. However, a
situation where soft collection procedure is adopted, debtors may increase with profitability
being reduced. Hence, a fast and hard collection procedure is not desirable for a good firm to
survive.

24
2.1.7 Types of credit
There are many types of credit like trade credit , consumer credit, bank credit, commerce credit,
consumer credit, investment credit, international credit, public credit and estate. For the purpose
of this study, we shall be dealing with trade credit and consumer credit.
Trade credit
For companies in need of additional working capital, a trade credit can serve as a liquidity
reserve. This is a credit which is connected to one of the company‟s account. Usually the
company pays a yearly fee for the use of a trade credit and interest can be charged quarterly
(Larsson & Hammarlund 2005:130). What should be considered is that when interest is charged
quarterly it gives an interest on interest effect which can become very expensive for the
company.
Consumer credit
Consumer debt can be defined as „money, goods or services provided to an individual in lieu of
payment.‟ Common forms of consumer credit include credit cards, store cards, motor (auto)
finance, personal loans (installment loans), consumer lines of credit, retail loans (retail
installment loans) and mortgages. This is a broad definition of consumer credit and corresponds
with the Bank of England's definition of "Lending to individuals". Given the size and nature of
the mortgage market, many observers classify mortgage lending as a separate category of
personal borrowing, and consequently residential mortgages are excluded from some definitions
of consumer credit - such as the one adopted by the Federal Reserve in the US. Reference.

25
The cost of credit is the additional amount, over and above the amount borrowed, that the
borrower has to pay. It includes interest, arrangement fees and any other charges. Some costs are
mandatory, required by the lender as an integral part of the credit agreement. Other costs, such as
those for credit insurance, may be optional. The borrower chooses whether or not they are
included as part of the agreement.
Interest and other charges are presented in a variety of different ways, but under many legislative
regimes lenders are required to quote all mandatory charges in the form of an annual percentage
rate (APR). The goal of the APR calculation is to promote „truth in lending‟, to give potential
borrowers a clear measure of the true cost of borrowing and to allow a comparison to be made
between competing products. The APR is derived from the pattern of advances and repayments
made during the agreement. Optional charges are not included in the APR calculation. So if there
is a tick box on an application form asking if the consumer would like to take out payment
insurance, then insurance costs will not be included in the APR calculation.
2.1.8 The Five C's of Credit Management
In order to ensure effective credit management for bank performance Keplan (1998) noted the
use of “five C‟s of credit” to estimate the profitability of default in a formula known as the five
C's of credit when evaluating a credit application.
Character

26
The customer‟s willingness to settle his obligations when they are due has to be put into
consideration because it determines default rate.
Capacity
This is the ability of the customer to settle his financial obligations when they fall due. This is
determined by analyzing the firms operating cash flows.
Collateral
Most times, a firm may pledge an asset in the case of default. Such an asset has to be evaluated
to know its worth in case there was a default.
Conditions
A credit or financial manager should be able to assess the extent to which a customer‟s ability to
pay is likely to be affected by the prevailing economic decisions.
Capital
The financial reserve of a customer goes a long way to tell if he is able to meet his credit
obligation when they become due.

27
2.2 THEORITICAL FRAMEWORK
2.2.1 Theories of Liquidity and Liquidity Management
Liquid Asset Theory
This focuses on the asset side of the balance sheet and argues that banks must hold large amount
of liquid assets against possible demand or payment cushion of readily marketable short term
liquid assets against unforeseen circumstances. This approach is however very expensive in a
current world of dynamic money market (Ngwu, 2006:58)
Anticipated Income Theory
This theory holds that a bank‟s liquidity can be managed through the proper phasing and
structuring of the loan commitments made by a bank to the customers. Here the liquidity can be
planned if the scheduled loan payments by a customer are based on the future of the borrower.
According to Nzotta (2004) the theory emphasizes the earning potential and the credit worthiness
of a borrower as the ultimate guarantee for ensuring adequate liquidity. Nwankwo (1991) posits
that the theory points to the movement towards self-liquidating commitments by banks.
This theory has encouraged many listed banks to adopt a ladder effects in investment portfolio.
Shiftability Theory
This theory posits that a bank‟s liquidity is maintained if it holds assets that could be shifted or
sold to other lenders or investors for cash. This point of view contends that a bank‟s liquidity
could be enhanced if it always has assets to sell and provided the Central Bank and the discount
Market stands ready to purchase the asset offered for discount. Thus this theory recognizes and

28
contends that shiftability, marketability or transferability of a bank's assets is a basis for ensuring
liquidity. This theory further contends that highly marketable security held by a bank is an
excellent source of liquidity. Dodds (1982) contends that to ensure convertibility without delay
and appreciable loss, such assets must meet three requisites. Liability Management Theory
Liquidity management theory according to Dodds (1982) consists of the activities involved in
obtaining funds from depositors and other creditors (from the market especially) and determining
the appropriate mix of funds for a particularly bank. This point of view contends that liability
management must seek t answer the following questions:
- How do we obtain funds from depositors?
- How do we obtain funds from other creditors?
- What is the appropriate mix of the funds for any bank?
Management examines the activities involved in supplementing the liquidity needs of the bank
through the use of borrowed funds.
The liquidity management theory focuses on the liability side of bank balance sheet. This theory
contends that supplementary liquidity could be derived from the liabilities of a bank. According
to Nwankwo (1991) the theory argues that since banks can buy all the funds they need, there is
no need to store liquidity on the asset side (liquidity asset) of the balance sheet.
Liquidity theory has been subjected to critical review by various authors. The general consensus
is that during the period of distress, a bank may find it difficult to obtain the desired liquidity
since the confidence of the market may have seriously affected and credit worthiness would
invariably be lacking.
However, for a healthy bank, the liabilities (deposits, market funds and other creditors) constitute
an important source of liquidity.

29
Commercial Loan Theory
This theory has been subjected to various criticisms by Dodds (1982) and Nwankwo (1992).
From the various points of view, the major limitation is that the theory is inconsistent with the
demands of economic development especially for developing countries since it excludes long
term loans which are the engine of growth. The theory also emphasizes the maturity structure of
bank assets (loan and investments) and not necessarily the marketability or the shiftability of the
assets.
Also, the theory assumes that repayment from the self-liquidating assets of the bank would be
sufficient to provide for liquidity. This ignores the fact that seasonal deposit withdrawals and
meeting credit request could affect the liquidity position adversely. Moreover, the theory fails to
reflect in the normal stability of demand deposits in the liquidity consideration.
This obvious view may eventually impact on the liquidity position of the bank. Also the theory
assumes that repayment from the self-liquidating assets of a bank would be sufficient to provide
for liquidity.
This ignores the fact that seasonal deposit withdrawals and meeting credit request could affect
the liquidity position adversely.
Liability Management Theory
Advocate of liability management theory of liquidity of listed bank maintain that banks can meet
liquidity requirement by biding the marked for additional funds. This approach originally found
its strongest advocates in the large money market centers, the banks, and later develops the
negotiable type of certificate of deposit (CD) as a major money market instrument.

30
2.2.2 Theory of Credit
The word “credit” comes from the Latin word “credo” which means “I believe”. Hence, credit
is based upon belief, confidence, trust and faith. The loan is based upon the confidence of
borrower‟s future solvency and repayment. Hence, credit means ability to command the other‟s
capital in return for a promise to re-pay at some specified time in future. Besides, credit is the
combination of “ability to borrow” and “willingness to borrow”. Infact, credit is an
individual‟s borrowing capacity, often being considered as an “economic good” to be produced,
managed and marketed.
According to Vet (2012), he talked about the 3R principle of credit management which is:
Returns from an investment: The first R of credit
The returns from an investment, the first test of credit, have great significance to both creditor
and borrower. It requires that both borrower and lender are satisfied about the returns from credit
which cover the principal and interest. Furthermore, the basic question pertaining to returns
analysis is whether or not the use of credit generates adequate income and is most profitable use.
Thus, even though the use of credit may be profitable it should also be examined whether or not
it is the most profitable. Similarly, the examination of returns from an investment in terms of
generating adequate incomes to compensate for the contribution of family labour and
management as well as building owner‟s equity is also essential. Hence, overall profitability of a
farm business must be evaluated to assess the possibility of earning income from most profitable
enterprise to compensate the loss from another.

31
Thus, the problem of determining the most profitable use of capital is a part of decision making
and involves, (a) the selection of most profitable enterprises (product-product relationship), (b)
determining the most economical production techniques(factor-factor relationship), and (c)
determining the size of each enterprise (factor-product relationship).
Repayment capacity: The second R of credit
It should also be taken into consideration while extending/borrowing a loan. In fact, it is not only
sufficient for a loan to be productive rather it should also generate adequate returns so that loan
instalments can be repaid. It is quite possible that a loan may be productive but may not generate
adequate income after meeting the expenses to regularly pay the loan instalments.
The repaying capacity is the amount of money that a business would be able to spare from their
total earnings so as to repay the loan after meeting organization expenses. Ability to repay a loan
is influenced by the income generating capacity of the organization, off organization earnings,
the liquidity of the organization as reflected by the balance sheet and the cash flows on the
organization. Furthermore, the ability to repay may be influenced by numerous factors but
willingness to repay a loan is quite essential. In short run, the current assets must be able to repay
the current liabilities.
Risk bearing ability: The third R of credit
Risk bearing ability, the third R of credit, determines the quantum of credit which can be safely
used by the organization. It means the ability of borrower to withstand the unexpected low
incomes, unpredictable losses and expenses and to continue operations. It provides the “last line
of defence” in the use of credit. It is quite possible that a loan may be productive and may also

32
generate adequate repaying capacity but borrower may not be able to afford the shocks of
probable financial losses due to poor/inadequate risk-bearing ability. The assessment of risk
bearing ability is, therefore, essential since both returns and repayment capacity are based on
average estimates of production, prices and costs, which seldom hold true.
2.3 Financial Performance and Financial Institutions
Financial soundness is a situation where depositor‟s funds are safe in a stable banking system.
The financial soundness of a financial institution may be strong or unsatisfactory varying from
one bank to another (Bank of Uganda,2002).External factors such as deregulation, lack of
information among bank customers, homogeneity of the bank business and connections among
banks do cause bank failure.
Some useful measures of financial performance which is the alternative term as financial
soundness are Return on Equity (ROE) and Return on Assets(ROA).
2.3.2 RETURN ON EQUITY AND RETURN ON ASSETS
RETURN ON EQUITY
The amount of net income returned as a percentage of shareholders equity. Return on equity
measures a corporation's profitability by revealing how much profit a company generates with
the money shareholders have invested.
ROE is expressed as a percentage and calculated as:
Return on Equity = Net Income/Shareholder's Equity.

33
RETURN ON ASSETS
An indicator of how profitable a company is relative to its total assets. ROA gives an idea as to
how efficient management is at using its assets to generate earnings. It is calculated by dividing a
company's annual earnings by its total assets, sometimes this is referred to as "return on
investment". The higher the ROA number, the better, because the company is earning more
money on less investment.
ROA is expressed as a percentage and calculated as:
Return on Assets = Net Profit /Average Total Assets

34
CHAPTER THREE
RESEARCH METHODOLOGY
3.1 Introduction
This chapter presents the research design, method of study, subjects and instruments used the
procedure for the administration of the instrument and the data collection. It also discusses the
method of analysis, showing the various steps taken to ensure reliability and validity. This
chapter discloses the research methodology adopted for the project and contains the following
subheads: Research Design, Population of the study, Sample size and sampling technique, Data
gathering method, Actual field work or location of study, Data analysis method.
3.2 Research Design
Research design refers to the plan, structure and strategy used for the investigation in order to
obtain answer to research question (Blaikie, 2009). The research design used is cross sectional
design, it is appropriate when data are to be collected about a phenomenon at one or more points
in time to explore, describe or explain the interaction among variables (Asika, 1991)
Creswell (2014) also defined research design as types of inquiry within qualitative, quantitative
and mixed method approaches that provide specific directions for procedures in a research. This
research makes use of panel data methodology because it combines longitudinal and cross
sectional data. To analyze the panel data, the research uses Pearson‟s Product Moment
Correlation Coefficient and Regression analysis to test and prove the relevant hypothesis.

35
3.3 Population of Study
Asika (1991) described population as a census of all items or subjects that possess the
characteristics or that have knowledge of the phenomenon being studied. It is described as a set of
all participants that are eligible for the study. The population of the study in this research is the
entire listed banks in Nigerian Bank Industry.
Presently, on the Nigerian stock market, there are 15 banks listed under this category as at 28th
March, 2015 (Listed Banks: www.nse.com.ng, 2015). These will serve as the total population for
this study.
3.4 Sample Size and Sampling Technique
A sample is a part of the population and sampling is a procedure of drawing samples from a
population. This research work looked at the financial reports in banks listed on the Nigerian
Stock Exchange whose activities are going to have relevant impact on the economy due to their
method of operation.
Consequently, all the 15 banks listed on the Nigerian Stock Exchange were selected.
3.5 Data Gathering Method
This section answers the question to how data was collected. It outlines the: sources of data,
instruments of data collection, validity and reliability of instruments, and administration of
instruments.

36
3.5.1 Sources of Data
The data used in this research were obtained from sources the secondary sources. This data where
annual report from electronic database like www.nse.com.ng and africanfinancials.com
3.5.2 Instrument of Data Collection
This research made use of annual report from year 2010 to 2013 which will be employed to
gather necessary and relevant data. The technique will be used in order to reduce the problem
associated with data collection and to ensure that results from this are available. Apart from the
annual reports, data will also be collected from the following sources; financial summaries,
Journals and articles, Fact books, Internet sources.
3.5.3 Validity and Reliability of Instruments
(Izedonmi, 2005)Defines validity “as an indication of the extent to which a measure provides an
accurate representation of what one is trying to measure”. In testing the validity of the research
study, the researcher has ensured that the Static Regression Analysis (Panel Least Square
method) is used to run analysis to evaluate secondary data obtained from the bank‟s financial
statement.
Reliability tests aims at finding out if the measuring instrument will produce the same results or
outcomes when repeated over and over again. The use of only published audit annual reports of
the listed banks for this research justifies the validity of the source of data. These reports, so as to

37
ensure their reliability, are published so as to comply with statutory requirement, which carries
with penalty if information contained therein is found to be materially misleading for use.
3.6 Actual Field Work/ Location of Study
This research explores the link between credit management, liquidity position and bank
performance using secondary data. The data is collected from the Annual financial Statements of
the selected listed banks for the period of analysis 2010-2013. This research employs 15 banks
that geographically operate in Nigeria and are listed on the Nigeria stock exchange. The financial
statements provides information on the total asset, total equity, current assets, current liabilities,
profit after tax and other components used in this research.
This study concerns six variables: current ratio, non-performing loans, return on assets, return on
equity, total assets and total equity.
3.7 Method of Data Presentation
The analyzed results were presented based on the questions raised in the hypotheses formulated.
3.7.1 Methods of Data Analysis
The Pearson‟s Product Moment Correlation:
Correlation deals with the degree of relationship between two or more variables. Therefore, this
method was used to measure the degree of relationship between credit management, liquidity
position and performance.

38
Formula =
The Regression Analysis:
Regression analysis models are used to help us predict the value of one variable from one or
more other variables whose values can be predetermined. Therefore, regression analysis was
used to establish the relationship which exists between performance, liquidity and other variables
tested.
Formula = Y = f (x1, x2, x3 ...xn) + ( c1, c2)
This relationship is usually expressed as : y = mx + c
WHERE:
i. The dependent variable is denoted as y
ii. The independent variable is denoted as x1,x2,x3
iii. The control variable is denoted as c1, c2
Accounting ratios were also used in carrying out this research for effective comparison of the
variables.
All data collected were analyzed using SPSS 15.0 and E-views 5.0
3.8 Variable Description
3.8.1 Dependent Variable
For the purpose of this research, the dependent will be return on assets and return on equity.

39
RETURN ON EQUITY
The amount of net income returned as a percentage of shareholders equity. Return on equity
measures a corporation's profitability by revealing how much profit a company generates with
the money shareholders have invested.
ROE is expressed as a percentage and calculated as:
Return on Equity = Net Income/Shareholder's Equity.
RETURN ON ASSETS
An indicator of how profitable a company is relative to its total assets. ROA gives an idea as to
how efficient management is at using its assets to generate earnings. It is calculated by dividing a
company's annual earnings by its total assets, sometimes this is referred to as "return on
investment". The higher the ROA number, the better, because the company is earning more
money on less investment.
ROA is expressed as a percentage and calculated as:
Return on Assets = Net Profit /Average Total Assets
3.8.2 Independent Variables
For the purpose of this research, the independent variable will be current ratios and non
performing loans.

40
3.8.3 Control Variable
The control variable that will be used is the total assets and total equity.
3.8.4 Model Specification
As adapted from(W.Wongthatsanekorn, 2010). The research model for this research will be as
follows:
LROA = β0 + β1LNPL + β2LCR + β3LTA+ εit
LROE= β0 + β1LNPL + β2 LCR + β3LTE + εit
Where:
LROA measures the logged return on assets
LROE is measures the logged return on equity
LNPL is the logged non performing loans
LCR is the logged current ratio
LTA is the logged total assets
LTE is the logged total equity
Εit is the Error term

41
CHAPTER FOUR
DATA ANALYSIS AND PRESENTATION
This chapter will focus on the analysis and presentation of data obtained from the annual bank
reports of all listed banks in Nigeria. This empirical study is focused on a sample of 15 banks
with a period of 4 years from 2010-2013.The presentation of this chapter will be divided into
three parts. First, this chapter will be presenting a descriptive analysis as regards the relationship
between credit management, liquidity position and bank performance. Secondly, it presents the
correlation matrix analysis used in testing the hypothesis formulated. Thirdly it presents the
regression analysis used in testing the hypothesis formulated.
4.1 DATA PRESENTATION AND ANALYSIS
The presentation of data involved tables and figures which were used in the analysis of the
descriptive statistics, correlation analysis and regression analysis.
4.2 DATA ANALYSIS - PRELIMINARY
4.2.1 DESCRIPTIVE STATISTICS
Table 4.1 Descriptive Statistics (Summary of four years means and standard deviation
for the variables in testing all listed banks in Nigeria)
LNPL LCR LTA LTE LROA LROE Mean 23.81928 0.106237 27.04494 25.64064 -4.121170 -2.698624
Median 24.00222 0.106140 27.50804 25.64758 -4.166936 -2.312783
Maximum 25.43896 0.276115 28.80862 29.81932 -1.232029 0.090206
Minimum 21.41601 -0.320068 19.99265 18.72947 -7.824046 -9.210340
Std. Dev. 0.992423 0.089168 1.746731 1.599369 1.089081 1.721971
Skewness -0.642733 -1.938712 -2.403706 -0.935524 -0.347258 -2.395492

42
Kurtosis 2.798623 11.76209 9.552430 9.622725 5.350668 9.477867
Jarque-Bera 3.527028 191.2680 137.5949 98.66939 12.51665 135.2423
Probability 0.171441 0.000000 0.000000 0.000000 0.001914 0.000000
Sum 1190.964 5.311867 1352.247 1282.032 -206.0585 -134.9312
Sum Sq. Dev. 48.26032 0.389596 149.5025 125.3411 58.11876 145.2940
Observations 50 50 50 50 50 50
Source: E-views 5.0 descriptive output
Table 4.1 comprises of the descriptive statistics of both the dependent and independent variables
of the sample banks. It shows the mean, standard deviation, the minimum and maximum of the
variables used.
The results from the descriptive analysis were as follows:
1. The Mean is the average value of the series, gotten from an addition of the series and
dividing through by the number of observations in the series. From the Descriptive Analysis
table below, the mean for LNPL is 23.81928, LCR is 0.106237, LTA is 27.04494, LTE is
25.64064, LROA is -4.121170, and LROE is -2.698624.
2. The Median is the middle-value of the series arrived at when the values of the series are
prearranged in order from the minimum to the maximum values. The median determines the
centre of the distribution and it is less susceptible to outlier‟s effects than the mean. From the
table below, the median for LNPL is 24.00222, LCR is 0.106140, LTA is 27.50804, LTE is
25.64758, LROA is -4.166936, and LROE is -2.312783.
3. The Maximum and Minimum Statistics are the maximum and minimum values of the
series in the given sample. The maximum of LNPL is 25.43896,LCR is 0.276115 ,LTA is
28.80862,LTE is 29.81932,LROA is -1.2320209,LROE is 0.090206 while the minimums are
LNPL is 21.41601,LCR is -0.320068,LTA is 19.99265,LTE is 18.72947,LROA is -
7.824046,LROE is -9.210340.

43
4. The Standard Deviation is a measure of dispersion or spread in the series.
The Standard Deviation of the series from the table below for LNPL is 0.992423,LCR is
0.89168,LTA is 1.746731,LTE is 1.599369,LROA is 1.089081,LROE is 1.721971.
5. The Skewness is a measure of unevenness of the distribution of the series around its
mean. The skewness of a symmetric distribution, such as the normal distribution, is meant to be
zero. Positive skewness means that the distribution possesses a long right tail while a negative
skewness implies that the distribution possesses a long left tail. From the table above, it can be
seen that all the variable distributions are negative which then implies that they have long left
tails representing the negative Skewness of their distributions.
6. Kurtosis measures the Flatness or Peakedness of the distribution of the data. If the
kurtosis exceeds 3, the distribution is Leptokurtic (or peaked); if the kurtosis is less than 3, the
distribution is Platykurtic (or flat) relative to the normal. From the table, kurtosis exceeds three
in five of the variables which are LCR,LTA,LTE,LROA,LROE making them peaked but the
remaining one which is LNPL is less than three so it is relatively flat.
7. The Jarque-Bera is a test statistic for finding out whether the series is normally
distributed or not. The test statistic measures the difference of the skewness and kurtosis of the
series with those from the normal distribution.
The number of observations for the descriptive statistics is 50.
4.3 DATA ANALYSIS - ADVANCED
4.4 Data Diagnosis
Before correlation and regression can be carried out effectively certain assumptions must be put
in place such as normality, linearity and homoscedasticity, which must not be violated. These all

44
refer to various aspects of the distribution of scores and the nature of the underlying relationship
between the variables. These assumptions can be checked from the residuals scatter plots which
are generated as part of the multiple regression procedure. Residuals are the differences between
the obtained and the predicted dependent variable (OI) scores. The residuals scatter plots allow
you to check:
• Normality: the residuals should be normally distributed about the predicted OI scores;
• Linearity: the residuals should have a straight-line relationship with predicted OI scores;
• Homoscedasticity: the variance of the residuals about predicted OI scores should be the
same for all predicted scores.
One of the ways that these assumptions can be checked is by inspecting the residuals scatter plot
and the Normal Probability Plots of regression standardized residuals. The decision criteria is to
reject violation of the above assumptions which suggests no major deviations from normality if
in the Normal Probability Plot, points lie in a reasonably straight diagonal line from bottom left
to top right and in the Scatter plot of the standardized residuals, if the residuals are roughly
rectangularly distributed, with most of the scores concentrated in the centre (along the 0 point).
The presence of outliers can also be detected from the Scatter plot. Tabachnick and Fidell (2001)
define outliers as cases that have a standardised residual of more than 3.3 or less than –3.3. With
large samples, it is not uncommon to find a number of outlying residuals (Pallant, 2001).
4.4.1 Test for Normality
Normality is used to describe a symmetrical, bell-shaped curve, which has the greatest frequency
of scores in the middle, with smaller frequencies towards the extremes (Gravetter & Wallnau,
2000, cited in Pallant, 200, 1 p. 48).

45
Figure 4.1
Source: SPSS 15.0 Output (2015)
Figure 4.1 shows the frequency distribution of the series in the histogram. The histogram divides
the series range (the distance between the maximum and minimum values) into a number of
equal length intervals or bins and displays a count of the number of observations that fall into
Regression Standardized Residual
3210-1-2-3
Fre
qu
en
cy
20
15
10
5
0
Histogram
Dependent Variable: ROA
Mean =8.88E-16Std. Dev. =0.974
N =59

46
each bin. Normality is proved when the scores are reasonably normally distributed, that is, when
most scores are occurring in the center, tapering out towards the extremes.
4.4.2 Test for Linearity
The relationship between the two variables should be linear. This means that when you look at a
scatterplot of scores you should see a straight line (roughly0, not a curve (Pallant, 2001).
Observed Cum Prob
1.00.80.60.40.20.0
Exp
ecte
d C
um
Pro
b
1.0
0.8
0.6
0.4
0.2
0.0
Normal P-P Plot of Regression Standardized Residual
Dependent Variable: ROA

47
From above, there is no major deviation from normality, linearity and homoscedasticity as most
of the scores are located at the centre, that is, at zero point.
4.5 Correlation Analysis
Table 4.2 Correlation Analysis
Correlations
ROE ROA CR NPL TA TE
ROE Pearson Correlation 1 .183 .212 -.039 .093 .363(**)
Sig. (2-tailed) .163 .104 .775 .480 .005
N 60 60 60 57 60 59
ROA Pearson Correlation .183 1 .148 -.035 -.453(**) .309(*)
Sig. (2-tailed) .163 .259 .797 .000 .017
N 60 60 60 57 60 59
CR Pearson Correlation .212 .148 1 .142 -.127 .188
Sig. (2-tailed) .104 .259 .291 .332 .154
N 60 60 60 57 60 59
NPL Pearson Correlation -.039 -.035 .142 1 -.068 -.047
Sig. (2-tailed) .775 .797 .291 .616 .732
N 57 57 57 57 57 56
TA Pearson Correlation .093 -.453(**) -.127 -.068 1 .442(**)
Sig. (2-tailed) .480 .000 .332 .616 .000
N 60 60 60 57 60 59
TE Pearson Correlation .363(**) .309(*) .188 -.047 .442(**) 1
Sig. (2-tailed) .005 .017 .154 .732 .000
N 59 59 59 56 59 59
** Correlation is significant at the 0.01 level (2-tailed).
* Correlation is significant at the 0.05 level (2-tailed).
Source: SPSS 15.0 Output (2015)
Table 4.2 shows the significance, direction and strength of relationship between the dependent
variable (roe and roa) and the independent variables (non-performing loans and current ratio).
Direction of relationship: The correlation coefficient between total equity and return on equity
is positive (0.363), indicating a positive correlation between total equity and return on equity.
The lower the total equity, the lower the return on equity.

48
Also, the correlation coefficient between total asset and return on asset is negative (-0.453),
indicating a negative correlation between total asset and return on assets. The lower the total
asset, the higher the return on asset.
The correlation coefficient between total asset and total equity is positive (0.442), indicating a
positive correlation between total asset and total equity. The lower the total asset, the lower the
total equity.
The correlation coefficient between total equity and return on equity is positive (0.363),
indicating a positive correlation between total asset and return on equity. The lower the total
equity, the lower the return on equity.
Significance Level: The relationship between ROE and TE is 1%, the same goes for relationship
between ROA and TA, TA and TE. Likewise the relationship between ROA and TE is 5%.
Strength of the relationship: The sign in front of the R-value whether negative or positive
refers to the direction not the strength. The results suggests that there is a medium correlation
between total equity and return on equity (at 0.363), signifying an average relationship between
total equity and return on equity. This same assertion was true for the relationship between total
asset and return on assets (at -0.453). Similarly, the results suggest that there is a medium
correlation between total asset and total equity (at -0.442). This same assertion was true for the
relationship between total equity and return on assets (at 0.309), signifying a medium
relationship between the variables.

49
4.6 Regression Analysis
Regression Analysis seeks to explore the relationship between one continuous dependent
variable and a number of independent variables or predictors (usually continuous).
Regression Analysis for Model One
Table 4.3 Model Summary
Model Summary
Model
R R Square Adjusted R
Square Std. Error of the Estimate Change Statistics Durbin-Watson
R Square Change F Change df1 df2 Sig. F Change
R Square Change F Change df1 df2 Sig. F Change
1 .758(a) .574 .551 .03100 .574 24.746 3 55 .000 1.771
a Predictors: (Constant), TE, CR, TA
b Dependent Variable: ROA
Source: SPSS 15.0 Output (2015)
Adjusted Coefficient of Determination: This gives an idea of how much of the variance in the
dependent variable (return on equity) is explained by the model (which includes total equity,
current ratio and total assets).
This indicates that our model explains 55.1% of the variance in cash conversion cycle. About
44.9% is left unaccounted for which is attributed to error term. From the stated, the model
explains 55.1% of any change in the dependent variable, thus making it significant.
Coefficient of Determination (R2): In this case, we have 59 observations which is large, thus the
adjusted R squared value is better off at 55.1% shared variance over the R square at 57.4%
shared variance.

50
The coefficient of determination between (TE, TA, and CR) and (ROA) is 0.574, indicating a
shared variance of 57.4% between the variables.
Table 4.4
ANOVA(b)
Model Sum of
Squares Df Mean Square F Sig.
1 Regression .071 3 .024 24.746 .000(a)
Residual .053 55 .001
Total .124 58
a Predictors: (Constant), TE, CR, TA
b Dependent Variable: ROA
Source: SPSS 15.0 Output (2015)
F- Statistic Test: this provides the test of the overall significance of the regression model. The
F- Static test seeks to find out whether variables have significant influence on the dependent
variable and the overall significance of the regression model. The critical F-value is 24.746 and
this is significant at 0.000 (P < 0.05).
Table 4.5
Coefficients(a)
Model
Unstandardized Coefficients
Standardized Coefficients T Sig.
B Std. Error Beta B Std. Error
1 (Constant) .182 .088 2.063 .044
CR -.039 .042 -.086 -.930 .356
TA -.022 .003 -.789 -7.806 .000
TE .019 .003 .674 6.607 .000
a Dependent Variable: ROA
Source: SPSS 15.0 Output (2015)

51
In Table 4.5, shows the regression coefficient relating TE to ROE is 0.019. The results offer a
positive relationship between the total equity and firm‟s capital. The positive regression
coefficient for ROA is significant (Sig. value = 0.000).
The coefficient of current ratio is negatively related to return on assets at -0.039, which is
statistically insignificant (with Sig. value = 0.356).
Regression Analysis for Model Two
Table 4.6
Model Summary(b)
Model
R R Square Adjusted R
Square Std. Error of the Estimate Change Statistics Durbin-Watson
R Square Change F Change df1 df2 Sig. F Change
R Square Change F Change df1 df2 Sig. F Change
1 .397(a) .158 .112 .53744 .158 3.431 3 55 .023 1.798
a Predictors: (Constant), TE, CR, TA
b Dependent Variable: ROE
Source: SPSS 15.0 Output (2015)
Adjusted Coefficient of Determination: This gives an idea of how much of the variance in the
dependent variable (return on equity) is explained by the model (which includes total equity,
current ratio and total assets).
This indicates that our model explains 11.2% of the variance in return on equity. About 88.8% is
left unaccounted for which is attributed to error term. From the stated, the model explains 11.2%
of any change in the dependent variable, thus making it significant.

52
Coefficient of Determination (R2): In this case, we have 59 observations, thus the adjusted R
squared value is better off at 11.2% shared variance over the R square at 15.8% shared variance.
The coefficient of determination between (TE, TA, and CR) and (ROE) is 0.112, indicating a
shared variance of 11.2% between the variables.
Table 4.7 ANOVA(b)
Model Sum of
Squares Df Mean Square F Sig.
1 Regression 2.973 3 .991 3.431 .023(a)
Residual 15.886 55 .289
Total 18.859 58
a Predictors: (Constant), TE, CR, TA
b Dependent Variable: ROE
Source: SPSS 15.0 Output (2015)
F- Statistic Test: this provides the test of the overall significance of the regression model. The
F- Static test seeks to find out whether variables have significant influence on the dependent
variable and the overall significance of the regression model. The critical F-value is 3.431 and
this is significant at 0.023 (P < 0.05).
Table 4.8 Coefficients(a)
Model
Unstandardized Coefficients
Standardized Coefficients T Sig.
B Std. Error Beta B Std. Error
1 (Constant) -3.712 1.533 -2.421 .019
CR .869 .725 .155 1.197 .236
TA -.010 .049 -.030 -.211 .834
TE .120 .050 .347 2.416 .019
a Dependent Variable: ROE
Source: SPSS 15.0 Output (2015)
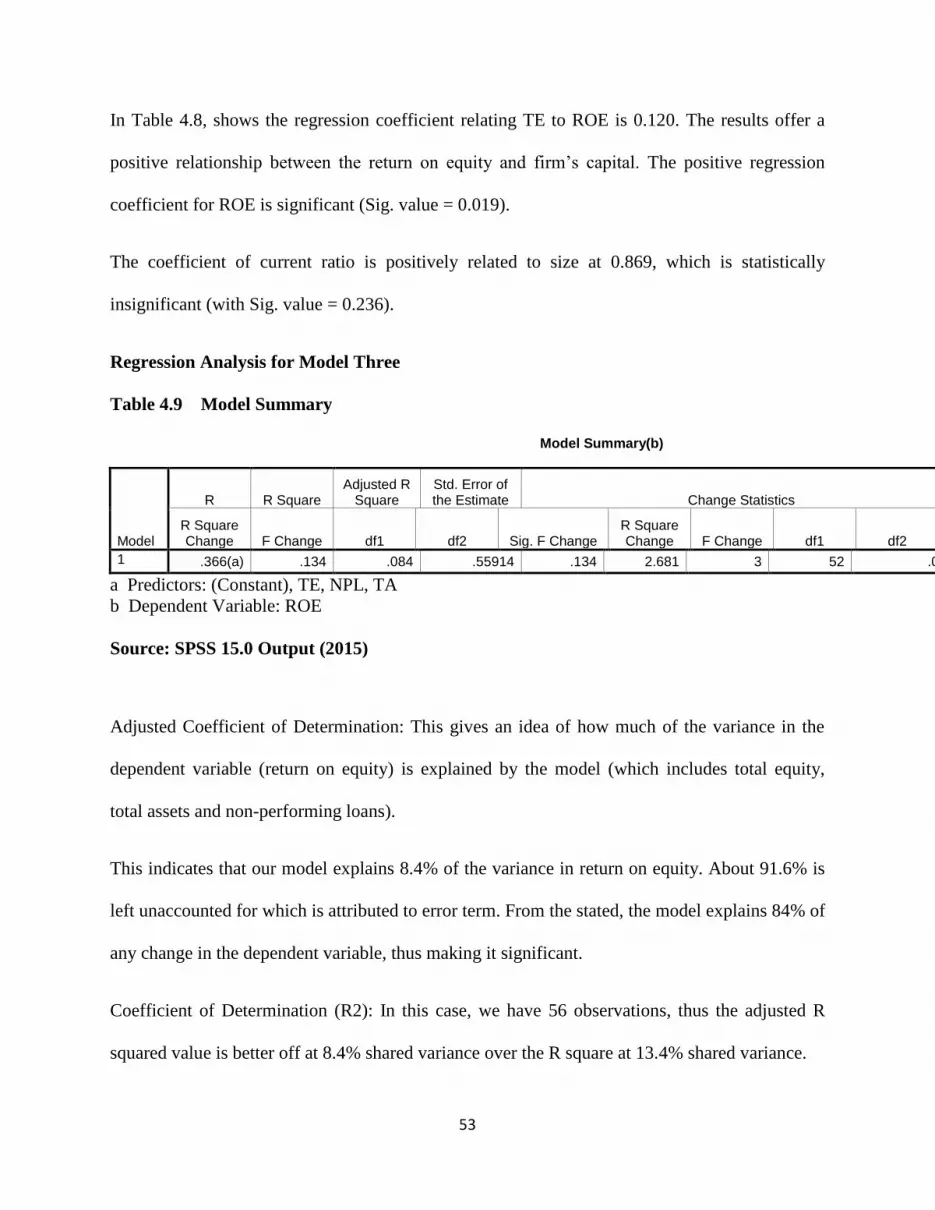
53
In Table 4.8, shows the regression coefficient relating TE to ROE is 0.120. The results offer a
positive relationship between the return on equity and firm‟s capital. The positive regression
coefficient for ROE is significant (Sig. value = 0.019).
The coefficient of current ratio is positively related to size at 0.869, which is statistically
insignificant (with Sig. value = 0.236).
Regression Analysis for Model Three
Table 4.9 Model Summary
Model Summary(b)
Model
R R Square Adjusted R
Square Std. Error of the Estimate Change Statistics Durbin-Watson
R Square Change F Change df1 df2 Sig. F Change
R Square Change F Change df1 df2 Sig. F Change
1 .366(a) .134 .084 .55914 .134 2.681 3 52 .056 1.851
a Predictors: (Constant), TE, NPL, TA
b Dependent Variable: ROE
Source: SPSS 15.0 Output (2015)
Adjusted Coefficient of Determination: This gives an idea of how much of the variance in the
dependent variable (return on equity) is explained by the model (which includes total equity,
total assets and non-performing loans).
This indicates that our model explains 8.4% of the variance in return on equity. About 91.6% is
left unaccounted for which is attributed to error term. From the stated, the model explains 84% of
any change in the dependent variable, thus making it significant.
Coefficient of Determination (R2): In this case, we have 56 observations, thus the adjusted R
squared value is better off at 8.4% shared variance over the R square at 13.4% shared variance.

54
The coefficient of determination between (TE, TA, and CR) and (AR) is 0.084, indicating a
shared variance of 8.4% between the variables.
Table 4.10
ANOVA(b)
Model Sum of
Squares Df Mean Square F Sig.
1 Regression 2.514 3 .838 2.681 .056(a)
Residual 16.257 52 .313
Total 18.771 55
a Predictors: (Constant), TE, NPL, TA
b Dependent Variable: ROE
Source: SPSS 15.0 Output (2015)
F- Statistic Test: this provides the test of the overall significance of the regression model. The
F- Static test seeks to find out whether variables have significant influence on the dependent
variable and the overall significance of the regression model. The critical F-value is 2.681 and
this is insignificant at 0.056 (P < 0.05).
Table 4.11
Coefficients(a)
Model
Unstandardized Coefficients
Standardized Coefficients T Sig.
B Std. Error Beta B Std. Error
1 (Constant) -3.015 2.399 -1.257 .214
NPL .011 .078 .018 .139 .890
TA -.025 .050 -.073 -.504 .616
TE .135 .050 .392 2.731 .009
a Dependent Variable: ROE
Source: SPSS 15.0 Output (2015)

55
In Table 4.11, shows the regression coefficient relating TE to ROE is 0.135. The results offer a
positive relationship between the return on equity and firm‟s capital. The positive regression
coefficient for ROE is significant (Sig. value = 0.009).
The coefficient of non-performing loans is positively related to return on equity, which is
statistically insignificant (with Sig. value = 0.890).
Regression Analysis for Model Four
Table 4.12 Model Summary
Model Summary(b)
Model
R R Square Adjusted R
Square Std. Error of the Estimate Change Statistics Durbin-Watson
R Square Change F Change df1 df2 Sig. F Change
R Square Change F Change df1 df2 Sig. F Change
1 .769(a) .591 .567 .03113 .591 25.006 3 52 .000 1.826
a Predictors: (Constant), TE, NPL, TA
b Dependent Variable: ROA
Source: SPSS 15.0 Output (2015)
Adjusted Coefficient of Determination: This gives an idea of how much of the variance in the
dependent variable (return on asset) is explained by the model (which includes the total equity,
total asset and non-performing loans).
This indicates that our model explains 56.7% of the variance in account receivable. About 43.3%
is left unaccounted for which is attributed to error term.
Coefficient of Determination (R2): In this case, we have 56 observations which is large, thus the
adjusted R squared value is better off at 56.7% shared variance over the R square at 59.1%
shared variance.

56
The coefficient of determination between (TE, TA, and NPL) and (ROA) is 0.567, indicating a
shared variance of 56.7% between the variables.
Table 4.13
ANOVA(b)
Model Sum of
Squares Df Mean Square F Sig.
1 Regression .073 3 .024 25.006 .000(a)
Residual .050 52 .001
Total .123 55
a Predictors: (Constant), TE, NPL, TA
b Dependent Variable: ROA
Source: SPSS 15.0 Output (2015)
F- Statistic Test: this provides the test of the overall significance of the regression model. The
F- Static test seeks to find out whether variables have significant influence on the dependent
variable and the overall significance of the regression model. The critical F-value is 25.006 and
this is significant at 0.000 (P < 0.05).
Table 4.14
Coefficients(a)
Model
Unstandardized Coefficients
Standardized Coefficients T Sig.
B Std. Error Beta B Std. Error
1 (Constant) .305 .134 2.285 .026
NPL -.006 .004 -.129 -1.449 .153
TA -.022 .003 -.780 -7.884 .000
TE .018 .003 .643 6.512 .000
a Dependent Variable: ROA
Source: SPSS 15.0 Output (2015)

57
In Table 4.27, shows the regression coefficient relating TE to ROA is 0.018. The results offer a
positive relationship between the return on assets and firm‟s capital. The positive regression
coefficient for ROA is significant (Sig. value = 0.000).
The coefficient of non – performing loans is negatively related to size at -0.006, which is
statistically insignificant (with Sig. value = 0.153).
4.7 Hypothesis Testing
4.7.1 Testing of Hypothesis One
Objective 1: To find out if effective credit management system allows for effective bank
performance.
Research Problem 1: Does effective credit management allow for effective bank performance?
Null Hypothesis: Effective credit management does not affect the performance of banks in
Nigeria.
Alternative Hypothesis: Effective credit management affects the performance of banks in
Nigeria.
In the first hypothesis, it was assumed that effective credit management allows for effective bank
performance of banks in Nigeria. Based on the results from the correlation analysis (Table 4.2)
the non – performing loans has no significant relationship with return on equity. . The correlation
analysis indicated a positive but insignificant relationship at R=-0.039 and P-value of 0.775.
This was also confirmed by the regression analysis (Table 4.11) which showed that the
coefficient of receivables period is negative and insignificant at B = -0.011 and a P-value of
0.890. On the basis of this result, we retain the null hypothesis and conclude that effective
credit management does not allow for effective performance of banks in Nigeria.

58
4.7.2 Testing of Hypothesis Two
Objective 2: To find out if there is a significant relationship between the liquidity and
performance of banks in Nigeria.
Research Problem 2: Is there a relationship between liquidity and performance?
Null Hypothesis: There is no relationship between liquidity and bank performance.
Alternative Hypothesis: There is a relationship between liquidity and bank performance.
In the second hypothesis, it was assumed that there is a significant relationship between liquidity
and performance of listed banks in Nigeria. Based on the results from the correlation analysis
(Table 4.2) the current ratio has no significant relationship with return on assets. The correlation
analysis indicated a positive but insignificant relationship at R=0.148 and P-value of 0.259. This
was also confirmed by the regression analysis (Table 4.5) which showed that the coefficient of
receivables period is negative and insignificant at B = -0.039 and a P-value of 0.356. On the
basis of this result, we retain the null hypothesis and conclude that liquidity has no
significant relationship with performance of banks in Nigeria.

59
CHAPTER FIVE
SUMMARY, CONCLUSION AND RECOMMENDATIONS
5.1 Introduction
This chapter gives summary details on the findings of this project. As a result of the findings on
the project, conclusions are drawn on the project, and further recommendations are subsequently
made in order to enable further research to be conducted on the topic or other related topics.
5.2 Summary of Work Done
The objective of this study has been to investigate the relationship between liquidity, credit
management and performance; analysis of all listed banks.
In chapter one, the introduction to the research work was established, background of the study,
statement of research problem, objectives of the study, research questions, research hypothesis,
significance of the study, scope and limitation of the study, research methodology, sources of
data and definition of key terms.
In the second chapter, the numerous and diverse views on the subject of credit management was
extensively explored. It included concept of liquidity and liquidity management, credit policy,
types of credit for performance, credit policies, credit evaluation of individual buyers, and
theories of the study were explored.
The third chapter dealt seriously with the Research methodology adopted. It examined the nature
of the research work, research design employed, the population with which the research was
concerned, the size of the sample drawn from the population as well as the technique employed
in carrying out the sampling. The validity tests were established. Instruments for data collection,

60
sources of data, and description of the actual field work were stated. Method for data analysis
and presentation were also specified.
Chapter four centred on testing the two hypothesis of the research work mentioned in chapter
one of the research study. Pearson‟s correlation and Regression analysis were employed in
testing hypothesis one and two where the correlation and regression data was analysed using the
Statistical Package for Social Sciences (SPSS). Data for correlation and regression for testing
the two hypotheses was gotten from Annual Financial Statements of Fifteen Listed Banks in
Nigeria for a period of four years (2010-2013). This has given a balanced panel data set of 60
bank-year observations. The null hypotheses for the two hypotheses were accepted.
5.3 Summary of Findings
This encompasses the analysis of data gotten in the course of this work. The summary consists of
both theoretical findings and empirical findings. The theoretical findings refer to the findings
drawn from literature and the views of authors in previous studies and diverse publications. The
empirical findings refer to the details and findings from the secondary data analysed. Below is a
review of both theoretical and empirical findings.
5.3.1 Theoretical Findings
1. Banks should have credit management policies that are strict. In the minimum they
should cover formulation of the overall credit strategy, credit origination, measures of control.
(Obajemu, 2007)
2. The findings revealed that companies should ensure the monitoring and regular review of
their credit policy and the allowance of cash discounts should be minimized as much as possible.

61
3. A good credit management system must possess the following attributes: credit
identification, credit monitoring, credit analysis, credit control, credit assessment (Berg 2010)
4. It is of crucial importance that for banks to maintain an adequate level of liquidity for
daily operations in order to perform better and safeguard their assets (Hamisu 2011)
5.3.2 Empirical Findings
Secondary data relating to fifteen listed banks from 2010 to 2013 was considered for analysis.
Pearson‟s correlation analysis and regression were used for the data analysis.
From the result of both our descriptive and empirical analyses, the study therefore, arrived at the
following findings which were consistent with (W.Wongthatsanekorn, 2010) and (Manoori and
Muhammad, 2012).
1. The research ascertained that credit management does not affect performance of banks in
Nigeria; the result showed that effective credit management does not contribute to the overall
performance of listed banks in Nigeria.
2. The research found that there is a relationship between non-performing loans and return
on equity but not a significant relationship in the banks sampled for testing in the course of the
project. It showed no significant relationship between non-performing loans(credit management)
and bank performance(return on equity).This is consistent with Kolapo et al(2012) and
Hamisu(2011),this suggests that credit managers should concern themselves on the reduction of
non-performing loans in order to pave way for better performance of banks in Nigeria.

62
3. The research showed that there is no significant relationship between liquidity position
(current ratio) and bank performance(return on assets) in the banks sampled in the course of the
project.
5.4 Conclusion
Our preoccupation in this study was to empirically establish the nexus between credit
management (non-performing loans), liquidity (current ratio) and performance of listed banks on
the Nigerian Stock Exchange. This study is based on secondary data, obtained from fifteen
selected banks listed on the Nigerian Stock Exchange for the period of four years from 2010-
2013 was used to carry out data analysis.
Credit Management can be viewed as written guidelines that set the terms and conditions
for supplying goods on credit, customer qualification criteria, procedure for making
collections, and steps to be taken in case of customer delinquency.
After a theoretical and empirical investigation the study shows that a weak positive insignificant
relationship exists between current ratio and return on total asset. Also the study showed a weak,
negative insignificant relationship between current ratio and return on total equity. However, the
study shows that a weak negative insignificant relationship exists between non –performing
loans and return on total asset and also shows that a weak negative insignificant relationship
exists between non –performing loans and return on total equity. This is due to the large nature
of the error term i.e. the multitude of other variables that also affect return on total assets and
total equity. The negative relationship between non – performing loans and return on total asset
indicates less profitable firms tend to delay payment of creditors thus leading to a high range of

63
non – performing loans and bad debts. On the contrary, current ratio showed a positive
relationship indicating that an increase in current ratio will increase the return on total assets.
5.5 Recommendations
1. Credit managers should pay attention to the management of each component of loans and
advances (especially, non-performing loans) as the adverse effect of one could have a positive
effect of another component. This will enhance profitability and create value for their banks.
2. Managers should ensure a non – performing loan, that is amount owed by debtors after 90
days, should be collected more quickly. The firms should speed up the collection process as
debts should be collected in line with the agreed credit term, improving personal contact and
enhanced customer evaluation, offering high discounts to customers who pay faster, and
charging higher interest on accounts that are overdue.
3. Banks should employ personnel with proper understanding of credit management to help
in giving out less credit as regards management of credit. Banks in this age employ just educated
people irrespective of their field of study. Personnel should be qualified to work and should
specialize in departments where they are well grounded of what they are required to do on a
daily basis.
4. While credit extensions are strategically used to boost sales and gain competitive
advantage, organisations should analyse the credit worthiness of customers by using 5 Cs of
credit namely, Character, Capacity, Capital, Condition and Collateral. This will not only reduce
the debtor‟s period but also reduce the risk of default, thereby enhancing profit significantly.

64
5.6 Contribution to Knowledge
The study contributed to the body of existing literature on the effects of credit management,
liquidity on performance. The study majored on narrowing down by picking individual aspects
or components of loans and assets; thereby measuring the relationship between credit
management, liquidity and performance. Unlike other researches that have been made using just
two to four variable. This research is in-depth and made use of six variables (roe,roa,npl,cr,te,ta)
and it was able to cut across all aspects of the research
5.7 Suggestions for Further Studies
1. The number of dependent variables should be increased. Other measures of performance
could be considered e.g. ROCE, Operating Income and Profit after Tax
2. This analysis has been constrained by the sample size and the nature of the data, which
could have well affected the results. Further studies should aim at increasing the sample size to
other sectors of the economy such as liquidity in oil companies, credit management in other
financial institutions.
3. Further studies in this field should introduce more control variables in order to reduce the
effect of the error term.

65
BIBLIOGRAPHY
BOOKS
Asika, N. (1991). Research Methodology in Behavioral Sciences, Lagos, Longman Nig plc.
Anyanwu,J.C.(1993).Monetary Economics:Theory,Policy and Institutions.Benin City.Hybrid
Professional Publishers Ltd
Blaikie, N. (2009). Designing Social Research. Polity.
Creswell, J. W. (2014). Research Design: Quantitative, Qualitative And Mixed Method
Approaches. London: Sage Publications Inc.
Izedonmi, P. (2005). A manual for academic and professional research. [Lagos]: [Bamadek].
Julie Pallant (2001). SPSS Survival Manual, Berkshire, United Kingdom: Open University Press
Ngwu, T.C. (2006). Bank Management. Owerri: Bob Publishers.
Nwaezeaku,N.C (2008) Theories and Practice of Financial Management.Owerri.Ever Standard
Publishing.
Nwankwo G.O. (1991) Bank Management Principles and Practices. Lagos: Malthouse Press
Nzotta, S.M (2004) Money,Banking and Finance:Theory and Practice.Owerri.
Ojo, O. (2003).Fundamentals of research methods. Lagos: Standard Publications.
Osuagwu, L. (2006).Research Methods: principles and practice. Lagos: Grey
Pandey, I.M. (2004): Financial Management, 9th Ed. New-Delhi India; Vikas Publishing House
Pvt Ltd.
Pandy, I.M. (2002). Financial Credit Management: Vicar Publishing House, New Delhi.
W.Wongthatsanekorn. (2010, October 20-22). Study Of Cash-To-Cash Cycle Management On
Profitability Of Private Hospital In Thailand By Regular And Panel Data Regression
Analyses. World Congress On Engineering And Computer Science, 2.

66
JOURNAL ARTICLES
Adeyemi, B. Corporate Governance and Agency: The Nigerian Banking Sector Experience.
SSRN Journal. doi:10.2139/ssrn.1537632
Bank of Uganda (2002).Quaterly economic report:Commercial Banking Activities.
Central Bank of Nigeria: Statistical Bulletin (Various Editions). Abuja.Central Bank of Nigeria:
Annual Reports. (Various Editions). Abuja
Dodds, J. Colin, (1982) "The Term Structure of Interest Rates: a Survey of the Theories and
Empirical Evidence", Managerial Finance, Vol. 8 Iss: 2, pp.22 - 31 (1982)
Owojori A.A, Akintoye I.R, & Adidu F.A (2011).The challenge of risk management in Nigerian
banks in the post consolidation era. Journal of Accounting and Taxation, 3(2), 23-31
Shin, H.H., and Soenen, L. (1998). Efficiency of Working Capital Management and Corporate
Profitability. Financial Practice and Education, 8(2), 37-45.
Spindt, P., & Tarhan, V. (1980). Liquidity Structure Adjustment Behavior of Large Money
Center Banks. Journal Of Money, Credit And Banking, 12(2), 198. doi:10.2307/1991772
Egbide B.C, Oluwabukola U, & Uwalomwa U (2013).Liquidity management and Profitability of
Manufacturing Companies in Nigeria.Journal of Business and Management,Vol 9 Iss
1,pp 13-21
NEWSPAPER ARTICLE
Obajemu, J.(2007 October 6).CBN develops new risk management guidelines for banks. The
Sunday Tribune
WEB MATERIALS
Investopedia.com,. (2015). Nonperforming Loan. Retrieved 17 March 2015, from
Http://Www.Investopedia.Com/Nonperforming Loan (Npl) Definition _
Investopedia.Htm
Investorwords.com,. (2015). What is Debt? definition and meaning. Retrieved 10 April 2015,
from Http://Www.Investorwords.Com/1313/Debt.Html
listed banks. (2015). Retrieved 29 March 2015, from http://Www.Nse.Com.Ng.
Vet, G. (2015). Principles of Credit Management. Retrieved 10 March 2015, from
Http://Sizzlersgopi.Blogspot.Com/Principles-Of-Credit-Management-3r.Html

67
APPENDIX I
LIST OF SAMPLED BANKS
1. ACCESS BANK PLC
2. DIAMOND BANK NIGERIA PLC
3. ECOBANK NIGERIA PLC
4. FIRST BANK NIGERIA PLC
5. GUARANTY TRUST BANK PLC
6. UNION BANK OF NIGERIA PLC
7. FIRST CITY MONUMENT BANK NIGERIA PLC
8. STANBIC IBTC BANK PLC
9. SKYE BANK PLC
10. STERLING BANK PLC
11. WEMA BANK PLC
12. ZENITH BANK PLC
13. UNITY BANK PLC
14. UNION BANK PLC
15. FIDELITY BANK PLC.

68
APPENDIX II
BANKS YEARS ROE ROA CR LNPL LTA LTE
ZENITH BANK 2010 0.0951 0.0186 1.2004 24.5136 28.21293 26.58238
ZENITH BANK 2011 0.1144 0.0190 1.1660 24.27035 28.40532 26.61178
ZENITH BANK 2012 0.2187 0.0393 1.1852 24.18681 28.52174 26.80549
ZENITH BANK 2013 0.1765 0.0290 1.1677 24.33818 28.68836 26.88156
ACCESS BANK 2010 0.0709 0.0178 1.2971 24.35221 27.31214 25.93004
ACCESS BANK 2011 0.0735 0.0144 1.2206 24.80393 27.57547 25.94813
ACCESS BANK 2012 0.1507 0.0236 1.1215 25.137 28.04693 26.19396
ACCESS BANK 2013 0.1069 0.0154 0.7261 23.84073 28.16405 26.22527
WEMA BANK 2010 1.0944 0.0799 1.0118 24.66787 26.03718 23.42041
WEMA BANK 2011 -0.6292 -0.0190 0.9579 25.15106 26.12702 22.62851
WEMA BANK 2012 -3.9432 -0.0205 0.9479 23.28304 26.2274 20.96881
WEMA BANK 2013 0.0386 0.0048 1.0947 22.12861 26.525 24.44643
UBA BANK 2010 0.0115 0.0015 1.1049 24.80813 27.99617 25.95827
UBA BANK 2011 -0.0468 -0.0048 1.0514 23.99882 28.14148 25.85941
UBA BANK 2012 0.2486 0.0283 1.0710 21.53907 28.29013 26.11833
UBA BANK 2013 0.1796 0.0210 1.0827 21.41601 28.42736 26.28217
UNION BANK 2010 -0.8729 0.1179 1.1377 25.49514 27.63171 NA
UNION BANK 2011 0.0001 0.2917 1.2007 24.04466 20.77655 29.27948
UNION BANK 2012 0.0001 0.0004 1.1763 24.22852 27.51051 29.32902
UNION BANK 2013 0.0011 0.0115 1.2014 23.40477 27.50557 29.81932
STANBIC IBTC BANK 2010 0.1007 0.0210 1.1586 23.37651 26.6438 25.0743
STANBIC IBTC BANK 2011 0.0545 0.0075 1.0941 23.64293 27.01903 25.03131
STANBIC IBTC BANK 2012 0.0973 0.1149 1.0947 23.38632 25.00696 25.17355
STANBIC IBTC BANK 2013 0.0120 0.0140 1.0976 23.31852 25.04609 25.19696
SKYE BANK 2010 0.0870 0.0138 1.1305 24.62985 27.23659 25.39551
SKYE BANK 2011 0.0669 0.0074 1.0878 24.21409 27.51769 25.32123
SKYE BANK 2012 0.1175 0.0119 1.0793 23.57177 27.6999 25.40621
SKYE BANK 2013 0.1405 0.1392 1.0901 23.61375 25.45954 25.44999
GTB 2010 0.1798 0.0339 1.1490 24.48355 27.78636 26.11805
GTB 2011 0.2211 0.0340 1.0662 21.76421 28.04975 26.17862
GTB 2012 0.2976 0.0526 1.0523 NA 28.11364 26.38114
GTB 2013 0.2595 0.0449 1.0471 22.00858 28.27517 26.52129
FIRST BANK 2010 0.0929 0.0139 1.1896 25.26975 28.46621 26.56948
FIRST BANK 2011 0.1270 0.0166 1.1516 24.23779 28.6819 26.64638
FIRST BANK 2012 0.2617 0.0255 1.1223 24.44655 28.65011 26.32129
FIRST BANK 2013 0.1927 0.0183 1.0946 24.70668 28.80862 26.45369
DIAMOND BANK 2010 0.0558 0.0110 1.1910 24.65747 27.11148 25.48442

69
DIAMOND BANK 2011 -0.2718 -0.0285 1.0840 24.3968 27.4125 25.15571
DIAMOND BANK 2012 0.2150 0.0218 1.0769 24.07957 27.68848 25.39905
DIAMOND BANK 2013 0.2151 0.0220 1.0892 23.95977 27.93477 25.65271
ECO BANK 2010 0.0218 0.0036 1.1440 24.8928 26.84189 25.03165
ECO BANK 2011 0.0142 0.0121 1.0068 24.85442 23.56596 23.40424
ECO BANK 2012 0.0498 0.0059 1.0346 25.13242 27.91267 25.77714
ECO BANK 2013 0.0759 0.0080 1.0259 25.43896 28.01001 25.7578
FIDELITY BANK 2010 0.0448 0.0127 1.3180 24.96671 19.99265 18.72947
FIDELITY BANK 2011 0.0177 0.0035 1.1816 23.4212 27.32707 25.70737
FIDELITY BANK 2012 0.1127 0.0199 1.0460 NA 27.54149 25.80749
FIDELITY BANK 2013 0.0472 0.0071 1.3966 NA 27.70911 25.8198
FCMB 2010 0.0589 0.0147 1.2918 23.68328 27.01222 25.62684
FCMB 2011 -0.0986 -0.0019 1.0721 22.98343 29.41151 25.48862
FCMB 2012 0.0917 0.0955 1.1305 22.97885 25.60214 25.64245
FCMB 2013 0.0459 0.0068 1.1191 23.61154 27.51484 25.60091
STERLING BANK 2010 0.1917 0.0194 1.2030 23.2796 26.28233 23.99361
STERLING BANK 2011 0.1683 0.0137 1.1332 22.78377 26.94594 24.43824
STERLING BANK 2012 0.1491 0.0120 1.0594 22.88866 27.08668 24.56578
STERLING BANK 2013 0.1304 0.0117 1.0642 22.63379 27.28542 24.87364
UNITY BANK PLC 2010 0.2874 0.0408 1.0110 23.70006 26.44044 24.48915
UNITY BANK PLC 2011 0.0615 0.0072 1.0120 22.68015 26.64465 24.50339
UNITY BANK PLC 2012 0.1201 0.0156 1.0367 22.9695 26.70397 24.66403
UNITY BANK PLC 2013 -0.8004 -0.0559 0.9160 24.65037 26.72376 24.06304

70
APPENDIX III
BANKS YEARS PAT CURRENT_ASSETS CURRENT_LIABILITIES
ZENITH BANK 2010 33,335,000,000 1,718,905 1,431,900
ZENITH BANK 2011 41,301,000,000 2,095,421 1,797,056
ZENITH BANK 2012 95,803,000,000 2,369,060 1,998,883
ZENITH BANK 2013 83,414,000,000 2,809,626 2,406,071
ACCESS BANK 2010 12,931,441,000 706,238,024 544,455,766
ACCESS BANK 2011 13,660,448,000 927,826,358 760,130,148
ACCESS BANK 2012 35,815,611,000 1,433,396,443 1,278,130,252
ACCESS BANK 2013 26,211,844,000 1,059,381,361 1,458,912,015
WEMA BANK 2010 16,238,533,000 190,530,345 188,307,351
WEMA BANK 2011 -4,228,926,000 205,846,106 214,888,911
WEMA BANK 2012 -5,040,629,000 231,680,935 244,426,282
WEMA BANK 2013 1,596,531,000 316,889,368 289,477,324
UBA BANK 2010 2,167,000,000 1,373,285 1,242,916
UBA BANK 2011 -7,966,000,000 1,561,000 1,484,742
UBA BANK 2012 54,766,000,000 1,834,409 1,712,748
UBA BANK 2013 46,601,000,000 2,119,712 1,957,879
UNION BANK 2010 118,016,000,000 723,615 636,031
UNION BANK 2011 307,693,283 778,357 648,253
UNION BANK 2012 313,644,120 840,809 714,797
UNION BANK 2013 10,104,000,000 834,131 694,313
STANBIC IBTC BANK 2010 7,811,000,000 341,855,000,000 295,053,000,000
STANBIC IBTC BANK 2011 4,048,000,000 512,006,000,000 467,977,000,000
STANBIC IBTC BANK 2012 8,332,000,000 647,149,000,000 591,168,000,000
STANBIC IBTC BANK 2013 1,053,000,000 730,342,000,000 665,412,000,000
SKYE BANK 2010 9,308,000,000 640,233,000,000 566,310,000,000
SKYE BANK 2011 6,646,000,000 845,450,000,000 777,245,000,000
SKYE BANK 2012 12,697,000,000 1,039,653,000,000 963,223,000,000
SKYE BANK 2013 15,865,000,000 1,081,961,000,000 992,558,000,000
GTB 2010 39,604,024,000 1,089,048,140 947,798,681
GTB 2011 51,741,620,000 1,459,161,192 1,368,524,508
GTB 2012 85,263,826,000 1,403,497,393 1,333,777,772
GTB 2013 85,545,510,000 1,648,820,494 1,574,719,114
FIRST BANK 2010 32,123,000,000 1,904,642 1,601,101
FIRST BANK 2011 47,462,000,000 2,398,580 2,082,749
FIRST BANK 2012 70,631,000,000 2,691,945 2,398,498
FIRST BANK 2013 59,365,000,000 3,169,788 2,895,868
DIAMOND BANK 2010 6,522,455,000 513,960,343 431,521,401
DIAMOND BANK 2011 -22,868,254,000 683,429,296 630,443,953

71
DIAMOND BANK 2012 23,073,427,000 1,004,151,331 932,453,085
DIAMOND BANK 2013 29,754,522,000 1,302,436,124 1,195,746,681
ECO BANK 2010 1,619,000,000 434,644 379,919
ECO BANK 2011 206,840,000 15,808,859 15,702,576
ECO BANK 2012 7,805,000,000 18,389,282 17,773,863
ECO BANK 2013 11,658,000,000 20,872,765 20,345,336
FIDELITY BANK 2010 6,105,000 452,827,000,000 343,574,000,000
FIDELITY BANK 2011 2,585,000,000 712,682,000,000 603,158,000,000
FIDELITY BANK 2012 18,200,000,000 878,532,000,000 839,868,000,000
FIDELITY BANK 2013 7,721,000,000 1,043,747,000,000 747,333,000,000
FCMB 2010 7,934,971,000 510,113,464 394,873,994
FCMB 2011 -11,567,744,000 510,438,317 476,095,598
FCMB 2012 12,559,592,000 858,564,232 759,422,893
FCMB 2013 6,027,752,000 967,541,340 864,538,159
STERLING BANK 2010 5,044,542,000 250,403,309 208,149,864
STERLING BANK 2011 6,908,598,000 489,121,098 431,636,016
STERLING BANK 2012 6,953,539,000 565,258,014 533,583,546
STERLING BANK 2013 8,274,864,000 685,737,277 644,339,285
UNITY BANK PLC 2010 12,415,472,000 263,704,584 260,842,956
UNITY BANK PLC 2011 2,693,859,000 333,043,755 329,105,065
UNITY BANK PLC 2012 6,180,061,000 356,908,317 344,262,498
UNITY BANK PLC 2013 -22,582,339,000 343,898,685 375,416,650