IGCSE Combined Science 0653/51 Paper 5 Practical Test
12
This document consists of 12 printed pages. DC (RW/CB) 168925/3 © UCLES 2019 [Turn over *7744626030* COMBINED SCIENCE 0653/51 Paper 5 Practical Test May/June 2019 1 hour 15 minutes Candidates answer on the Question Paper. Additional Materials: As listed in the Confidential Instructions. READ THESE INSTRUCTIONS FIRST Write your centre number, candidate number and name on all the work you hand in. Write in dark blue or black pen. You may use an HB pencil for any diagrams or graphs. Do not use staples, paper clips, glue or correction fluid. DO NOT WRITE IN ANY BARCODES. Answer all questions. Electronic calculators may be used. You may lose marks if you do not show your working or if you do not use appropriate units. Notes for Use in Qualitative Analysis for this paper are printed on page 12. At the end of the examination, fasten all your work securely together. The number of marks is given in brackets [ ] at the end of each question or part question. Cambridge Assessment International Education Cambridge International General Certificate of Secondary Education For Examiner’s Use 1 2 3 4 Total
-
Upload
khangminh22 -
Category
Documents
-
view
0 -
download
0
Transcript of IGCSE Combined Science 0653/51 Paper 5 Practical Test

This document consists of 12 printed pages.
DC (RW/CB) 168925/3© UCLES 2019 [Turn over
*7744626030*
COMBINED SCIENCE 0653/51Paper 5 Practical Test May/June 2019 1 hour 15 minutesCandidates answer on the Question Paper.Additional Materials: As listed in the Confidential Instructions.
READ THESE INSTRUCTIONS FIRST
Write your centre number, candidate number and name on all the work you hand in.Write in dark blue or black pen.You may use an HB pencil for any diagrams or graphs.Do not use staples, paper clips, glue or correction fluid.DO NOT WRITE IN ANY BARCODES.
Answer all questions.Electronic calculators may be used.You may lose marks if you do not show your working or if you do not use appropriate units.Notes for Use in Qualitative Analysis for this paper are printed on page 12.
At the end of the examination, fasten all your work securely together.The number of marks is given in brackets [ ] at the end of each question or part question.
Cambridge Assessment International EducationCambridge International General Certificate of Secondary Education
For Examiner’s Use
1
2
3
4
Total

2
0653/51/M/J/19© UCLES 2019
1 You are going to investigate the nutrient content of an apple.
(a) You are provided with half of an apple, A.
(i) Remove the plastic film from the apple.
In the box, make a large detailed drawing of the cut surface of the apple.
[2]
(ii) Use a ruler to measure your drawing, in millimetres, at its widest point and record this value.
width of apple in drawing = ............................................... mm
Measure the same distance on the half apple, A, and record this value.
width of apple A = ............................................... mm [1]
(iii) Calculate the magnification of your drawing.
Show your working.
magnification of drawing = ................................................ [1]
3
0653/51/M/J/19© UCLES 2019 [Turn over
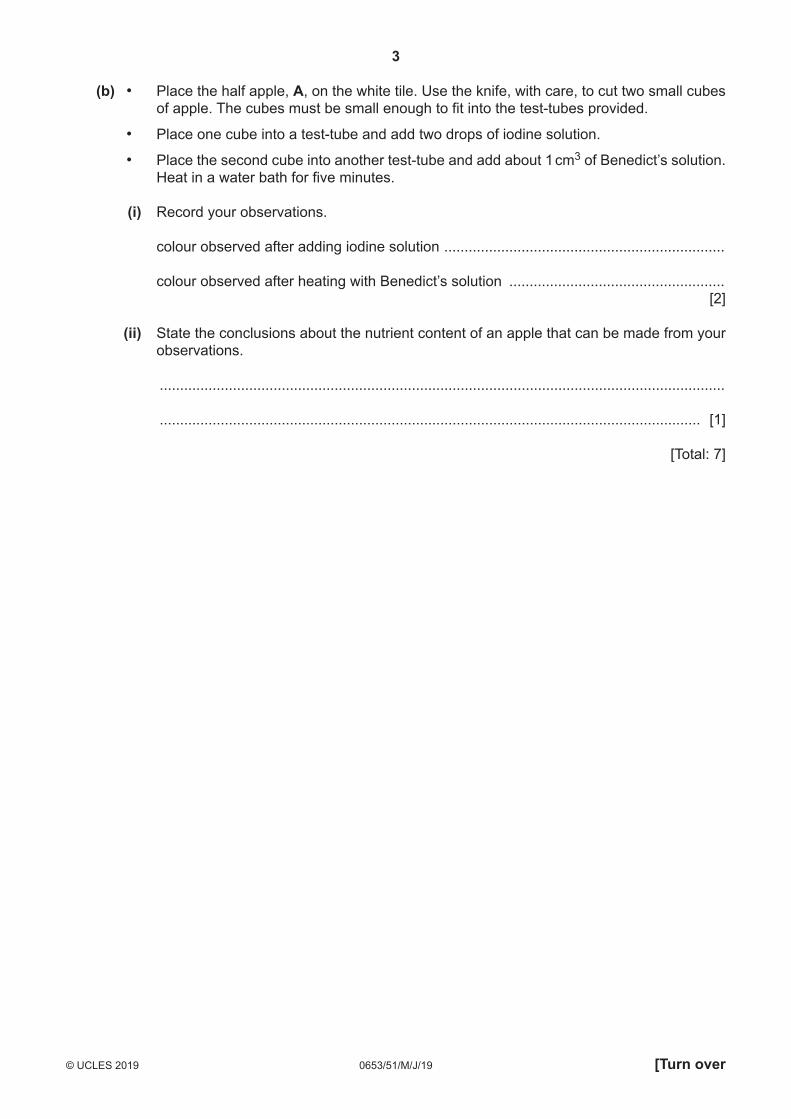
(b) • Place the half apple, A, on the white tile. Use the knife, with care, to cut two small cubes of apple. The cubes must be small enough to fit into the test‑tubes provided.
• Place one cube into a test‑tube and add two drops of iodine solution.
• Place the second cube into another test‑tube and add about 1 cm3 of Benedict’s solution. Heat in a water bath for five minutes.
(i) Record your observations.
colour observed after adding iodine solution .....................................................................
colour observed after heating with Benedict’s solution ..................................................... [2]
(ii) State the conclusions about the nutrient content of an apple that can be made from your observations.
...........................................................................................................................................
..................................................................................................................................... [1]
[Total: 7]

4
0653/51/M/J/19© UCLES 2019
2 Fig. 2.1 shows a cut stem of the water plant Elodea placed in a beaker of water. When light shines on the Elodea it photosynthesises, and bubbles of gas are produced.
water
Elodea
Fig. 2.1
Plan an investigation to find out how the rate of photosynthesis of Elodea is affected by the brightness of the light.
You are not required to carry out this investigation.
In your answer, include:
• the apparatus needed, including a labelled diagram if you wish
• a brief description of the method, including how you will treat variables and any safety precautions
• the measurements you will make
• how you will process your results
• how you will use your results to draw a conclusion.
..........................................................................................................................................................
..........................................................................................................................................................

5
0653/51/M/J/19© UCLES 2019 [Turn over
..........................................................................................................................................................
..........................................................................................................................................................
..........................................................................................................................................................
..........................................................................................................................................................
..........................................................................................................................................................
..........................................................................................................................................................
..........................................................................................................................................................
..........................................................................................................................................................
..........................................................................................................................................................
..........................................................................................................................................................
..........................................................................................................................................................
..........................................................................................................................................................
..........................................................................................................................................................
..........................................................................................................................................................
.................................................................................................................................................... [7]
6
0653/51/M/J/19© UCLES 2019
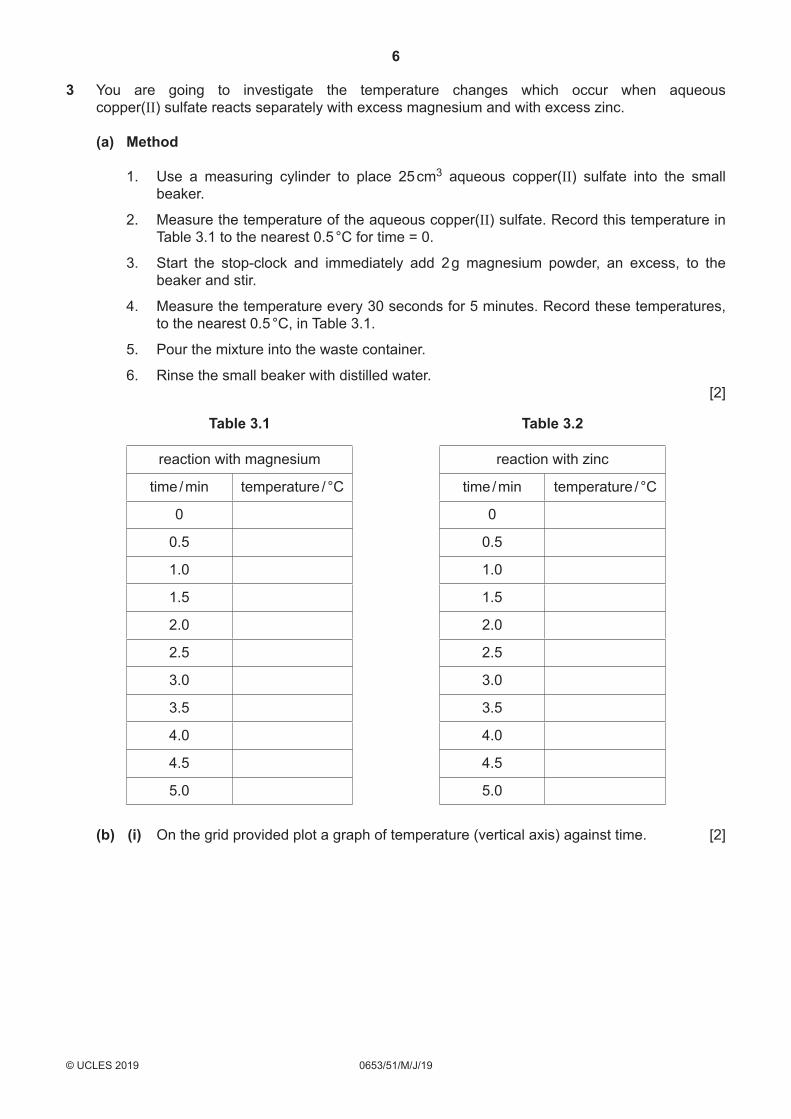
3 You are going to investigate the temperature changes which occur when aqueous copper(II) sulfate reacts separately with excess magnesium and with excess zinc.
(a) Method
1. Use a measuring cylinder to place 25 cm3 aqueous copper(II) sulfate into the small beaker.
2. Measure the temperature of the aqueous copper(II) sulfate. Record this temperature in Table 3.1 to the nearest 0.5 °C for time = 0.
3. Start the stop‑clock and immediately add 2 g magnesium powder, an excess, to the beaker and stir.
4. Measure the temperature every 30 seconds for 5 minutes. Record these temperatures, to the nearest 0.5 °C, in Table 3.1.
5. Pour the mixture into the waste container.
6. Rinse the small beaker with distilled water. [2]
Table 3.1
reaction with magnesium
time / min temperature / °C
0
0.5
1.0
1.5
2.0
2.5
3.0
3.5
4.0
4.5
5.0
Table 3.2
reaction with zinc
time / min temperature / °C
0
0.5
1.0
1.5
2.0
2.5
3.0
3.5
4.0
4.5
5.0
(b) (i) On the grid provided plot a graph of temperature (vertical axis) against time. [2]

7
0653/51/M/J/19© UCLES 2019 [Turn over
0 0.5 1.0 1.5 2.0 2.5time / min
3.0 3.5 4.0 4.5 5.0
(ii) Draw a best‑fit straight line for the increasing temperatures only. Extend the line further than the highest point. Label the line magnesium.
Draw a best‑fit line through the decreasing temperatures only. Extend the line back past the highest point. [1]
(iii) The maximum temperature reached by the reaction is where the two lines cross.
State the maximum temperature reached by the reaction.
maximum temperature = ........................................... °C [1]
(c) Suggest a value for the maximum temperature reached if 5 g magnesium powder is reacted with 25 cm3 of the same copper(II) sulfate solution.
maximum temperature = ........................................... °C [1]
(d) (i) Repeat steps 1 to 6 in (a) using 2 g zinc, an excess, instead of magnesium.
Record the temperatures in Table 3.2. [2]
(ii) Repeat (b) for the results for zinc. Draw the graph on the same grid as that used for magnesium. Label this graph zinc.
State the maximum temperature reached by this reaction.
maximum temperature = ................................................. °C [2]

8
0653/51/M/J/19© UCLES 2019
(e) Suggest why the maximum temperature for magnesium is different from the maximum temperature for zinc.
...................................................................................................................................................
............................................................................................................................................. [1]
(f) Suggest and explain one improvement to the apparatus which would increase the accuracy of the maximum temperature.
improvement .............................................................................................................................
...................................................................................................................................................
explanation ...............................................................................................................................
............................................................................................................................................. [1]
[Total: 13]

9
0653/51/M/J/19© UCLES 2019 [Turn over
4 You are going to calculate the density of a liquid using two different methods.
You are provided with a balance, a measuring cylinder, a beaker containing liquid L and a test‑tube.
Method 1
(a) (i) Measure and record the mass mc of the measuring cylinder to the nearest 0.01 g.
mc = ............................................. g [1]
(ii) Add approximately 75 cm3 of liquid L to the measuring cylinder.
Record the exact volume VL of liquid L to the nearest 0.5 cm3. Keep the liquid in the measuring cylinder for (b).
VL = ......................................... cm3 [1]
(iii) Measure and record the total mass of the measuring cylinder and liquid L.
total mass = ............................................. g [1]
(iv) Determine the mass mL of liquid L. Use your answers to (a)(i) and (a)(iii) and the equation shown:
mL = total mass – mc
mL = ............................................. g [1]
(v) Calculate the density ρL of liquid L. Use your answers to (a)(ii) and (a)(iv) and the equation shown:
ρL = mLVL
ρL = ..................................... g / cm3 [1]
Method 2
(b) (i) Measure and record the mass mt of the test‑tube to the nearest 0.01 g.
mt = ............................................. g [1]
(ii) Measure the length l t of the test‑tube and the internal diameter dt of the test‑tube each to the nearest 0.1 cm.
l t = ................................................ cm
dt = .......................................... cm [1]
(iii) Calculate the approximate volume Vt of the test‑tube. Use your answers to (b)(ii) and the equation shown:
Vt = 0.79 × dt2 × l t
Vt = ......................................... cm3 [1]

10
0653/51/M/J/19© UCLES 2019
(iv) Calculate the density ρt of the test‑tube. Use your answers to (b)(i) and (b)(iii) and the equation shown:
ρt = mtVt
ρt = ..................................... g / cm3 [1]
(v) Carefully lower the test‑tube into the measuring cylinder of liquid L from (a) until the test‑tube is floating as shown in Fig. 4.1.
Liquid L
Fig. 4.1
Measure the length of the test‑tube lw that is below the surface of the liquid. You will need to support the test‑tube very gently in an upright position to take this
measurement.
lw = .......................................... cm [1]
(vi) Calculate the density ρL of liquid L. Use your answers to (b)(ii), (b)(iv) and (b)(v) and the equation shown:
ρL = ρt × l t
lw
ρL = ..................................... g / cm3 [1]

11
0653/51/M/J/19© UCLES 2019
(c) Compare your values of ρL in (a)(v) and (b)(vi).
Suggest whether your two values of ρL agree within the limits of experimental error. Explain your answer.
...................................................................................................................................................
...................................................................................................................................................
............................................................................................................................................. [1]
(d) Suggest one practical difficulty in method 2 that makes it difficult to get an accurate answer for the density of the liquid.
...................................................................................................................................................
...................................................................................................................................................
............................................................................................................................................. [1]
[Total: 13]

12
0653/51/M/J/19© UCLES 2019
Permission to reproduce items where third‑party owned material protected by copyright is included has been sought and cleared where possible. Every reasonable effort has been made by the publisher (UCLES) to trace copyright holders, but if any items requiring clearance have unwittingly been included, the publisher will be pleased to make amends at the earliest possible opportunity.
To avoid the issue of disclosure of answer‑related information to candidates, all copyright acknowledgements are reproduced online in the Cambridge Assessment International Education Copyright Acknowledgements Booklet. This is produced for each series of examinations and is freely available to download at www.cambridgeinternational.org after the live examination series.
Cambridge Assessment International Education is part of the Cambridge Assessment Group. Cambridge Assessment is the brand name of the University of Cambridge Local Examinations Syndicate (UCLES), which itself is a department of the University of Cambridge.
NOTES FOR USE IN QUALITATIVE ANALYSIS
Tests for anions
anion test test result
carbonate (CO32–) add dilute acid effervescence, carbon dioxide
produced
chloride (Cl –)[in solution]
acidify with dilute nitric acid, then add aqueous silver nitrate
white ppt.
nitrate (NO3–)
[in solution]add aqueous sodium hydroxide then aluminium foil; warm carefully
ammonia produced
sulfate (SO42–)
[in solution]acidify, then add aqueous barium nitrate
white ppt.
Tests for aqueous cations
cation effect of aqueous sodium hydroxide effect of aqueous ammonia
ammonium (NH4+) ammonia produced on warming –
calcium (Ca2+) white ppt., insoluble in excess no ppt., or very slight white ppt.
copper (Cu2+) light blue ppt., insoluble in excess light blue ppt., soluble in excess, giving a dark blue solution
iron(II) (Fe2+) green ppt., insoluble in excess green ppt., insoluble in excess
iron(III) (Fe3+) red‑brown ppt., insoluble in excess red‑brown ppt., insoluble in excess
zinc (Zn2+) white ppt., soluble in excess giving a colourless solution
white ppt., soluble in excess, giving a colourless solution
Tests for gases Flame tests for metal ions
gas test and test results
ammonia (NH3) turns damp, red litmus paper blue
carbon dioxide (CO2) turns limewater milky
chlorine (Cl 2) bleaches damp litmus paper
hydrogen (H2) ‘pops’ with a lighted splint
oxygen (O2) relights a glowing splint
metal ion flame colour
lithium (Li+) red
sodium (Na+) yellow
potassium (K+) lilac
copper(II) (Cu2+) blue‑green